Embed Size (px)
Citation preview

Future of Chemicals Part VIIHow China Can Leapfrog the Industry Development Cycle
Edward TseJayant GotpagarAnna ManssonMatthias Hendrichs
Perspective

Booz & Company
Contact Information
BeijingSteven [email protected]
BerlinMatthias Bä[email protected]
DallasAndrew [email protected]
Scott [email protected]
DCPeter BertoneSenior [email protected]
DubaiAndrew [email protected]
DüsseldorfJoachim RoteringSenior [email protected]
Sven Uwe [email protected]
FrankfurtMarcus [email protected]
Hong Kong/ShanghaiEdward TseSenior [email protected]
HoustonJayant [email protected]
LondonRichard [email protected]
São PauloArthur [email protected]

1Booz & Company
EXECUTIVE SUMMARY
The global chemical industry is in the midst of an upheaval, driven by the convergence of political, demographic, and environmental forces. As established companies struggle to adapt within the existing industry structure, an opportunity has arisen for new competitors. Key among them are the fast-growing chemical companies in Asia and the Middle East; China, in particular, has emerged as a leader among developing economies. Chinese chemical companies have traditionally focused on the rapidly growing and diversifying demand at home, gradually moving down the value chain into higher-margin products. But today, some leading Chinese players are looking beyond their domestic market. As they do, Chinese companies will confront hurdles that could impede further expansion. Western companies have also faced obstacles to growth over the years and, in response, have made a series of improvements in areas such as supply chain management, manufacturing, research and development, and customer engage-ment. For example, they introduced the “natural supply chain” to leverage and scale common supply chain elements across the enter-prise when market requirements permit, they implemented lean pro-cesses to optimize manufacturing costs, they realigned their R&D efforts to enable them to respond more swiftly to market changes and short-term opportunities, and they segmented their customer base to improve interactions and better meet customers’ needs. These and other productivity improvements can serve as a launch-pad for Chinese companies seeking to increase their competitive edge. By leveraging some of the best practices established in the West, Chinese chemical companies have an opportunity not only to surmount obstacles in the current turbulent market landscape, but potentially to leapfrog more established competitors.

2 Booz & Company
Today’s global chemical industry looks markedly different from the industry of years past. Not long ago, trends in global trade policy,
demographics, and the geographic dispersion of resources all seemed to favor companies in developed nations. Today, however, they are combining to create opportunities for companies in Asia and the Middle East, and for Chinese companies in particular.
The 2008 global financial crisis led to a resurgence of nationalism in many countries, and a temptation to bolster domestic industry by pursuing short-term protectionist policies. Such policies hinder international trade and growth opportunities; the
chemical industry, with its typically moderate growth rate, has been particularly vulnerable.
Several trends are influencing how chemical companies operate. A key development is the rise of emerging economies (see Exhibit 1). Many Western chemical firms have responded to China’s and India’s rapid growth by designing Asia-specific strategies—from which countries such as Indonesia, the Philippines, Thailand, and Vietnam will also benefit. A second important trend is the aging
THE NEW GLOBAL CHEMICAL INDUSTRY
Source: Booz & Company analysis
Exhibit 1 The Rise of Emerging Economies
11.0 million = Subheads or highlighted text in Subheads
Guidelines:
aölkdfölka = Plain text / Body copy in Content Bullet points as dashes with tab position
32.8% = numbers in Data (Black)
A4 format: - width for 3 columns: 169 mm = 6.654 in- width for 2 columns: 111 mm = 4.37 in
Letter format:- width for 3 columns: 167,64 mm = 6.6 in- width for 2 columns: 110,35 mm = 4.343 in
Lines: 0,5 ptLines for legend: 0,5 pt dotted, black
Note:Please always delete all unused colors, after creating the exhibit,otherwise InDesign will import the spot colors of this Illustrator file.These colors can’t be deleted in InDesign. Thanks.
Approved Colors, Tints and Patterns:
Line Weights:
0,5 pt
0,75 pt
1 pt
Arrows:
Line Textures:
solid
dashed
dotted
- Automation of data integration and transformations via ETL technologies- Manual adjustments to the transformed data via a PEA workbench- Transformation of adjusted data into an analysis-friendly format (usually BI cubes)
Data Factory Analysis Factory Business Leaders
Raw Data Input
Actions
High-Quality PEA Data &
MetricsInsights
- Library of fit-for-purpose reports that facilitate identification of key insights …- … and ongoing PEA processes - Easy access to cleansed PEA data for ad hoc analysis
- Use of key insights by all levels to drive better customer dialogues and more effective promotion investments
- Sell-in- Sell-through- Sell-out- Trade spend- Planned promotions
- Merchandising causals
- Financials- Hierarchies
Ind
ustr
y G
DP
Co
ntri
but
ion/
Cap
ita
GDP/Capita
US$10,000
9,000
8,000
7,000
6,000
5,000
4,000
3,000
2,000
1,000
0US$45,00040,00035,00030,00015,0005,0000
Bubble size represents population size
20,000 25,00010,0005,000
MalaysiaThailand
New Zealand
France
Australia
U.K.
U.S.
Germany
Japan
Republic of Korea
ChinaIndia
VietnamPhilippinesIndonesia
Advancing Economies
Smaller EmergingEconomies
Emerging Giants
AdvancedEconomies
Agriculture
Construction
Manufacturing
Mining
Utilities
Services
Other Industies
(2010$)
China
India
Emerging Giants
Malaysia
Thailand
Advancing Economies
Vietnam
Philippines
Indonesia
Smaller Emerging Economies Advanced Economies
New ZealandFrance Australia
U.K. U.S.Germany Japan
Republic of Korea
3Booz & Company
population in both developed and emerging nations. This older generation is driving demand for higher-value chemicals in several areas, such as personal care (antiaging cosmetics), foods (higher nutrition value), and materials (silicones in medical devices).
The mismatch between resource availability and demand is also placing pressure on the chemical industry. Middle East and North African producers have traditionally had privileged access to feedstock. Today, some leading players are responding by concentrating on higher-value products further down the value chain. Others are focusing on the search for alternative feedstocks. Thailand’s PTT Global Chemical (PTTGC), for example, has made the development of bio-pathways a part of its core strategy. In China, where coal makes up approximately 90 percent of energy reserves, prospects to develop a coal-based chemical industry have brightened. Stimulated by national policies and favorable market conditions, many coal-to-olefins (CTO), coal-to-urea, and coal-to-aromatics projects are ramping up, while coal-based PVC plants
have already been operating for years. For example, as of 2011, 29 CTO projects had been set up or were moving through the planning pipeline in China, with an annual olefin capacity of more than 20 million metric tons and total investment of over 630 billion renminbi (about US$100 billion). Such projects consume large amounts of raw materials, energy, and water, and the logistics and overall economics are still uncertain, as supply from the Middle East creates cost pressure for domestic CTO players. But if even half of the targeted CTO projects and all of the cracker projects are realized, China would become self-sufficient in ethylene by the end of 2014.
The latter is just one example of the competitive moves that Chinese companies are now making. Attracted by the high growth rate in local demand, many Western chemical companies entered China in the last decade. Chinese chemical companies have traditionally competed with them only in the Chinese market, where there has been rapidly growing and diversifying demand. Gradually, they have begun to acquire more
advanced technologies to enable migration down the value chain into higher-margin products. Now that strategy has brought them to another threshold. Some leading Chinese players in the chemical industry are venturing into foreign markets, both through exports to some of their regional neighbors and by taking positions in overseas assets. As a result, we are seeing a new group of chemical companies in China—global players drawing on Chinese R&D experience and practices, and building business in frontier and emerging markets.
Even as they demonstrate strength and skill, there are areas in which Chinese chemical companies can introduce new systems and processes that would enhance their competitive edge. This is where the experience of Western companies can serve as a helpful tool. By leveraging some of the best practices established in the West, Chinese chemical companies have an opportunity to overcome hurdles, to avoid the pitfalls that earlier industry leaders have faced, and, in some cases, to leapfrog competitors.
A new group of chemical companies in China are drawing on Chinese R&D experience and practices to build business in frontier and emerging markets.

4 Booz & Company
Before taking a closer look at some of the key areas where Chinese com-panies can implement changes, it is helpful to think about China’s rise as a key player in the global chemical landscape as part of a larger trend occurring throughout the Middle
East and Asia. As we’ve mentioned, today’s chemical industry is much changed. For Western companies, the first major shift came in the 1990s, when intensifying competition led to horizontal integration—enabling companies to seek economies of scale and efficiency improvements as they targeted particular product groups and technologies. The global chemi-cal market quickly became far more complex and fragmented. Today, established multinationals face new challenges from emerging or some-times even emerged competitors in the Middle East and Asia (see Exhibit 2).
In the Middle East, SABIC, which has long been a leading regional player, has now become a global force—embarking on a transformation from local petrochemical supplier to inter-nationally diversified player. The com-pany’s product portfolio reveals that it is moving further downstream, and its aggressive expansion through acquisi-tions, as practiced in recent years, is likely to continue. For Middle East players, the biggest challenge to future growth is that most of their attractive downstream opportunities are located outside their region. Investments and joint ventures therefore become
THE RISE OF EMERGING ECONOMIES
Source: Booz & Company analysis
Exhibit 2 Chemical Industry Developments in Asia and the Middle East
11.0 million = Subheads or highlighted text in Subheads
Guidelines:
aölkdfölka = Plain text / Body copy in Content Bullet points as dashes with tab position
32.8% = numbers in Data (Black)Key Attributes
CURRENT STATE ANALYSES TARGET STATE DESIGN IMPLEMENTATION
A4 format: - width for 3 columns: 169 mm = 6.654 in- width for 2 columns: 111 mm = 4.37 in
Letter format:- width for 3 columns: 167,64 mm = 6.6 in- width for 2 columns: 110,35 mm = 4.343 in
Lines: 0,5 ptLines for legend: 0,5 pt dotted, black
Note:Please always delete all unused colors, after creating the exhibit,otherwise InDesign will import the spot colors of this Illustrator file.These colors can’t be deleted in InDesign. Thanks.
Approved Colors, Tints and Patterns:
Line Weights:
0,5 pt
0,75 pt
1 pt
Arrows:
Line Textures:
solid
dashed
dotted
- Program-driven
- Legacy DoD suppliers
- Low-rate production
- Very complex systems
Exquisite Systems Providers
- With inherent buy-in from top management, the focus is on overall operating model transformation
- Strategic assessment identifies key areas of lean opportunity across the enterprise
- Automation of data integration and transformations via ETL technologies- Manual adjustments to the transformed data via a PEA workbench- Transformation of adjusted data into an analysis-friendly format (usually BI cubes)
Operating Model Design
- Process architecture- Automation- Technology- Organization- Footprint- Metrics
Implementation Road Map
- Quantify benefits- Prioritize projects- Develop individual and integrated implementation plans- Create program management structure and governance
Execution
- Implement integrated plan- Ensure ongoing communications- Maintain business buy-in- Track and enforce benefit realization- Institutionalize culture of continuous improvement- Drive Lean adoption and mastery
Quick Win Implementation
- Initial pilots validate opportunity and overcome resistance to transformation within the organization
- Enterprise-wide strategic assessment results feed into phased lean deployment
Scale-DrivenStandard Suppliers
- Product-line-focused
- DoD is a minor customer
- Leverage global scale
- Exploit commercial scope
Agile SmartCustomizers
NONTRADITIONAL WAYS TO PLAY
- Problem-centric
- “Silicon Valley” culture
- Small and nimble
- Risk-taking/innovative
DisruptiveSpecialists
B
C
1 2 3
Strategic Assessment/
Operating Model Design
PilotSelection
PilotSelection
Pilot Execution/ Evaluation
Pilot Execution/Evaluation
Strategic Assessment/ Operating Model Design
Pilot Execution/ Evaluation
Lean Deployment
Lean Deployment
Phased Lean Deployment/Refinement
Strategic Assessment/ Operating Model Design
- People involvement- Batch reduction- Cellular teams- Equipment reliability- Leveling- Reduce setup time
Workload Profiling
Risk Assessment
Spans and Layers Analysis
Workload Balancing
Risk Analytics and Solution
Identifying Waste
Time and Motion Study
Value Stream Mapping
Voice of the Customer AnalysisLean Design Principles
- Standardized work- Quality at source- Workplace organization- Visual controls- Pull systems
Data Factory Analysis Factory Business Leaders
Raw Data Input
Actions
High-Quality PEA Data &
MetricsInsights
- Library of fit-for-purpose reports that facilitate identification of key insights …- … and ongoing PEA processes - Easy access to cleansed PEA data for ad hoc analysis
- Use of key insights by all levels to drive better customer dialogues and more effective promotion investments
- Sell-in- Sell-through- Sell-out- Trade spend- Planned promotions- Merchandising causals- Financials- Hierarchies
CHINA PRODUCER PRICE INDEX (PPI)1990–2010
0
20
40
60
80
100
120
140
160
180
200
220
240
260
- Complexity management, not just reduction- Reconfiguration of supply chain management footprint to match growth ambitions in Asia- Natural supply chains
- Internal operation optimization as a response to increased cost pressure and competition
- Changing nature of innovations- New “customer-back” focus instead of “product-push”- Focus to improve innovation productivity
- Focus on gaining greater customer understanding and intimacy
- Implementing supply chain functions with systems- driven process to improve service, reduce inventory, and decrease cost
- Applying programs such as lean and Six Sigma and de-bottlenecking to reduce cost and increase efficiency
- Technology acquisitions from Western companies- Leapfrogging on new technologies and alternative pathways- Adapting best practices in innovation across the business (idea generation portfolio optimization)
- Developing needs-based segmentations to improve customer service- Increased connection between technology and commercial
20001990 19981992 19961994 2002 2004 2006 2008
Beginning from 100, as of 1990
Continuously increased PPI brings substantial cost
pressure to chemical companies
Country/Region
Opportunities for Chinese Companies
Supply Chain Management
Manufacturing
Research & Development
Customer Engagement
CNOOCPetroChinaSinochemSinopecChemChina
Oil IndiaIndianOilHPCLReliance
PertaminaPetronasPTTGC
SABIC
Oil & Gas
Value Chain
China
India
Southeast Asia
Middle East
Petro-chemicals
Basic Chemicals/ Polymers
Specialty Chemicals
Fine Chemicals

5Booz & Company
crucial options to leverage their attractive feedstock cost position. Such strategic moves will allow them to compete with other international and local majors that lack their strong advantage of backward integration. It is worth noting, however, that costs in the Middle East have increased signifi-cantly over the last two years, and this region is likely to be further affected by widespread political instability.
The Indian chemical landscape is dominated by local players such as Reliance and HPCL, which are cur-rently building huge refineries and petrochemical plants. With crude oil supply from the Middle East and, more important, by applying frugal engineering concepts, these large-scale complexes will be highly cost-efficient. Although their capacities could extend beyond domestic demand require-ments, the Indian chemical compa-nies’ current focus seems to be on developing their domestic business by enhancing their infrastructure and supply chain.
In Southeast Asia, Thailand’s PTTGC is transforming itself into a globally dominant specialty chemical supplier. Although Indonesia is not yet a major player, the country has enormous potential thanks to its significant
resource base and large population. State-owned Pertamina is already the world’s largest producer and exporter of liquefied natural gas (LNG) and is well positioned to lead rapid growth of Indonesia’s chemical industry over the next decade.
What does all of this mean for Chinese chemical companies? In China, local producers already domi-nate basic chemicals and are quickly moving into segments involving more complex products. Overseas play-ers still control the high-end fine and specialty chemical market segments. The involvement of Chinese produc-ers in these areas does not extend beyond the custom manufacturing of a number of fine agrochemical and pharmaceutical ingredients, where they often act as toll manufacturers for their Western partners. Chinese producers are, however, progres-sively moving down the value chain to displace foreign imports, leveraging their labor-cost advantages to increase margins. Technology acquisition becomes a high priority because, in many cases, sourcing specialty know-how can be more expedient than in-house development, especially at a time when many overseas chemical companies show strong interest in establishing their R&D footprint in
China. ChemChina has set out on a targeted strategy of technology acqui-sition, including buyouts of weakened players such as Israeli agrochemical company MAI. Securing feedstock supplies through overseas partnerships and acquisitions is also an important trend that is likely to continue. In 2007, for example, Sinopec brought in Saudi Aramco as a partner to build a new refinery and cracker complex in Fujian province on condition of a Saudi crude oil supply guarantee.
The emergence of strong new regional players represents increasing competi-tion for China’s producers but also provides new collaborative oppor-tunities. PTTGC is keen to enter the Chinese market, and may be will-ing to offer joint venture projects in Thailand in exchange. The company’s closer collaboration with China is heralded by its recent opening of a Beijing office. Pertamina is looking to lead development of Indonesia’s nascent chemical industry, and would welcome both technology transfer and capital investment from China. HPCL, too, is seeking technology and investment partners for its large-scale developments in India. Collaborations of this scope can help China grow a substantial chemical export market among its regional neighbors.

6 Booz & Company
It is clear that China is fast becoming a regional leader. But it can also strengthen its position as a global competitor. We have identified four key areas where Chinese companies can implement changes that can take them to the next level. In recent decades, Western players have introduced several innovative management practices and business models. These firms have markedly changed their approach to supply chain management, manufacturing, R&D, and customer engagement. Adopting these best practices can pave the way for Chinese companies to improve productivity (see Exhibit 3).
1. Supply Chain ManagementSupply chain management has become an intricate science that
delivers major improvements and benefits in cost-to-serve and inventory management, all of which contribute to an enhanced customer experience.
Most Western chemical companies have adopted functional supply chain organizations, installed enterprise resource planning systems to manage their supply chain, and they run a set of defined supply chain processes. The supply chain manager takes responsibility for inventory, customer service levels, and cost goals, and optimizes the supply chain performance across commercial and manufacturing value levers.
In reaction to discontinuities in the marketplace such as a structural shift in demand, mismatch in
KEY BEST PRACTICES
Source: Booz & Company analysis
Exhibit 3 Key Best Practices and Opportunities
11.0 million = Subheads or highlighted text in Subheads
Guidelines:
aölkdfölka = Plain text / Body copy in Content Bullet points as dashes with tab position
32.8% = numbers in Data (Black)Key Attributes
CURRENT STATE ANALYSES TARGET STATE DESIGN IMPLEMENTATION
A4 format: - width for 3 columns: 169 mm = 6.654 in- width for 2 columns: 111 mm = 4.37 in
Letter format:- width for 3 columns: 167,64 mm = 6.6 in- width for 2 columns: 110,35 mm = 4.343 in
Lines: 0,5 ptLines for legend: 0,5 pt dotted, black
Note:Please always delete all unused colors, after creating the exhibit,otherwise InDesign will import the spot colors of this Illustrator file.These colors can’t be deleted in InDesign. Thanks.
Approved Colors, Tints and Patterns:
Line Weights:
0,5 pt
0,75 pt
1 pt
Arrows:
Line Textures:
solid
dashed
dotted
- Program-driven
- Legacy DoD suppliers
- Low-rate production
- Very complex systems
Exquisite Systems Providers
- With inherent buy-in from top management, the focus is on overall operating model transformation
- Strategic assessment identifies key areas of lean opportunity across the enterprise
- Automation of data integration and transformations via ETL technologies- Manual adjustments to the transformed data via a PEA workbench- Transformation of adjusted data into an analysis-friendly format (usually BI cubes)
Operating Model Design
- Process architecture- Automation- Technology- Organization- Footprint- Metrics
Implementation Road Map
- Quantify benefits- Prioritize projects- Develop individual and integrated implementation plans- Create program management structure and governance
Execution
- Implement integrated plan- Ensure ongoing communications- Maintain business buy-in- Track and enforce benefit realization- Institutionalize culture of continuous improvement- Drive Lean adoption and mastery
Quick Win Implementation
- Initial pilots validate opportunity and overcome resistance to transformation within the organization
- Enterprise-wide strategic assessment results feed into phased lean deployment
Scale-DrivenStandard Suppliers
- Product-line-focused
- DoD is a minor customer
- Leverage global scale
- Exploit commercial scope
Agile SmartCustomizers
NONTRADITIONAL WAYS TO PLAY
- Problem-centric
- “Silicon Valley” culture
- Small and nimble
- Risk-taking/innovative
DisruptiveSpecialists
B
C
1 2 3
Strategic Assessment/
Operating Model Design
PilotSelection
PilotSelection
Pilot Execution/ Evaluation
Pilot Execution/Evaluation
Strategic Assessment/ Operating Model Design
Pilot Execution/ Evaluation
Lean Deployment
Lean Deployment
Phased Lean Deployment/Refinement
Strategic Assessment/ Operating Model Design
- People involvement- Batch reduction- Cellular teams- Equipment reliability- Leveling- Reduce setup time
Workload Profiling
Risk Assessment
Spans and Layers Analysis
Workload Balancing
Risk Analytics and Solution
Identifying Waste
Time and Motion Study
Value Stream Mapping
Voice of the Customer AnalysisLean Design Principles
- Standardized work- Quality at source- Workplace organization- Visual controls- Pull systems
Data Factory Analysis Factory Business Leaders
Raw Data Input
Actions
High-Quality PEA Data &
MetricsInsights
- Library of fit-for-purpose reports that facilitate identification of key insights …- … and ongoing PEA processes - Easy access to cleansed PEA data for ad hoc analysis
- Use of key insights by all levels to drive better customer dialogues and more effective promotion investments
- Sell-in- Sell-through- Sell-out- Trade spend- Planned promotions- Merchandising causals- Financials- Hierarchies
CHINA PRODUCER PRICE INDEX (PPI)1990–2010
0
20
40
60
80
100
120
140
160
180
200
220
240
260
- Complexity management, not just reduction- Reconfiguration of supply chain management footprint to match growth ambitions in Asia- Natural supply chains
- Internal operation optimization as a response to increased cost pressure and competition
- Changing nature of innovations- New “customer-back” focus instead of “product-push”- Focus to improve innovation productivity
- Focus on gaining greater customer understanding and intimacy
- Implementing supply chain functions with systems- driven process to improve service, reduce inventory, and decrease cost
- Applying programs such as lean and Six Sigma and de-bottlenecking to reduce cost and increase efficiency
- Technology acquisitions from Western companies- Leapfrogging on new technologies and alternative pathways- Adapting best practices in innovation across the business (idea generation portfolio optimization)
- Developing needs-based segmentations to improve customer service- Increased connection between technology and commercial functions
20001990 19981992 19961994 2002 2004 2006 2008
Beginning from 100, as of 1990
Continuously increased PPI brings substantial cost
pressure to chemical companies
Western Best Practices Opportunities for Chinese Companies
Supply Chain Management
Manufacturing
Research & Development
Customer Engagement

7Booz & Company
supply and demand, longer supply chains, and volatile feedstock prices, Western firms are now adopting end-to-end management of their supply chain. In so doing, they are unlocking the next level of productivity gains from supply chain design and operation. Under this approach, which we call the “natural supply chain,” chemical companies segment their product and customer base into organic categories—specialties, commodities, and petrochemicals, and even more specific categories in terms of their value to the company—and then design their supply chains to best suit each of these individual buckets (see Exhibit 4).
The goal is to leverage and scale common supply chain elements
across the enterprise when market requirements permit, such as in areas where there are long lead times, standard designs, and supply volumes. Special supply chain services can be applied to products with unique requirements such as shorter lead times, variability, smaller volume, order flexibility, and numerous other potential configurations shaped by customer needs. If designed and implemented properly, a natural supply chain approach can achieve a trifecta of improvements—distribution costs can be lowered by 10 to 15 percent and inventory can often be cut by as much as 25 to 40 percent, while service levels can be increased by 10 to 20 percent.
Before Chinese chemical companies can reap these gains, they must
overcome several internal and external challenges. In the past, Chinese companies often defined supply chain management as merely tending to transportation and warehouses. Its link to commercial planning—a prerequisite for successful, integrated sales and operations planning—was often missing, as was a robust IT network to support the planning process.
In many Chinese firms, inventory management remains driven by cash-flow considerations rather than being part of an integrated supply–demand planning process. Externally, Chinese companies are beset by import/export restrictions on their overseas sales, while infrastructure and transportation issues hamper their domestic business. China’s ports have been
Source: Booz & Company analysis
Exhibit 4 The Natural Supply Chain
11.0 million = Subheads or highlighted text in Subheads
Guidelines:
aölkdfölka = Plain text / Body copy in Content Bullet points as dashes with tab position
32.8% = numbers in Data (Black)
CURRENT STATE ANALYSES TARGET STATE DESIGN IMPLEMENTATION
A4 format: - width for 3 columns: 169 mm = 6.654 in- width for 2 columns: 111 mm = 4.37 in
Letter format:- width for 3 columns: 167,64 mm = 6.6 in- width for 2 columns: 110,35 mm = 4.343 in
Lines: 0,5 ptLines for legend: 0,5 pt dotted, black
Note:Please always delete all unused colors, after creating the exhibit,otherwise InDesign will import the spot colors of this Illustrator file.These colors can’t be deleted in InDesign. Thanks.
Approved Colors, Tints and Patterns:
Line Weights:
0,5 pt
0,75 pt
1 pt
Arrows:
Line Textures:
solid
dashed
dotted
- Program-driven
- Legacy DoD suppliers
- Low-rate production
- Very complex systems
Exquisite Systems Providers
- With inherent buy-in from top management, the focus is on overall operating model transformation
- Strategic assessment identifies key areas of lean opportunity across the enterprise
- Automation of data integration and transformations via ETL technologies- Manual adjustments to the transformed data via a PEA workbench- Transformation of adjusted data into an analysis-friendly format (usually BI cubes)
Operating Model Design
- Process architecture- Automation- Technology- Organization- Footprint- Metrics
Implementation Road Map
- Quantify benefits- Prioritize projects- Develop individual and integrated implementation plans- Create program management structure and governance
Execution
- Implement integrated plan- Ensure ongoing communications- Maintain business buy-in- Track and enforce benefit realization- Institutionalize culture of continuous improvement- Drive Lean adoption and mastery
Quick Win Implementation
- Initial pilots validate opportunity and overcome resistance to transformation within the organization
- Enterprise-wide strategic assessment results feed into phased lean deployment
Scale-DrivenStandard Suppliers
- Product-line-focused
- DoD is a minor customer
- Leverage global scale
- Exploit commercial scope
Agile SmartCustomizers
NONTRADITIONAL WAYS TO PLAY
DisruptiveSpecialists
B
C
1 2 3
Strategic Assessment/
Operating Model Design
PilotSelection
PilotSelection
Pilot Execution/ Evaluation
Pilot Execution/Evaluation
Strategic Assessment/ Operating Model Design
Pilot Execution/ Evaluation
Lean Deployment
Lean Deployment
Phased Lean Deployment/Refinement
Strategic Assessment/ Operating Model Design
- People involvement- Batch reduction- Cellular teams- Equipment reliability- Leveling- Reduce setup time
Workload Profiling
Risk Assessment
Spans and Layers Analysis
Workload Balancing
Risk Analytics and Solution
Identifying Waste
Time and Motion Study
Value Stream Mapping
Voice of the Customer AnalysisLean Design Principles
- Standardized work- Quality at source- Workplace organization- Visual controls- Pull systems
Data Factory Analysis Factory Business Leaders
Raw Data Input
Actions
High-Quality PEA Data &
MetricsInsights
- Library of fit-for-purpose reports that facilitate identification of key insights …- … and ongoing PEA processes - Easy access to cleansed PEA data for ad hoc analysis
- Use of key insights by all levels to drive better customer dialogues and more effective promotion investments
- Sell-in- Sell-through- Sell-out- Trade spend- Planned promotions- Merchandising causals- Financials- Hierarchies
CHINA PRODUCER PRICE INDEX (PPI)1990–2010
0
20
40
60
80
100
120
140
160
180
200
220
240
260
- Complexity management, not just reduction- Reconfiguration of supply chain management footprint to match growth ambitions in Asia- Natural supply chains
- Internal operation optimization as a response to increased cost pressure and competition
- Changing nature of innovations- New “customer-back” focus instead of “product-push”- Focus to improve innovation productivity
- Focus on gaining greater customer understanding and intimacy
- Implementing supply chain functions with systems- driven process to improve service, reduce inventory, and decrease cost
- Applying programs such as lean and Six Sigma and de-bottlenecking to reduce cost and increase efficiency
- Technology acquisitions from Western companies- Leapfrogging on new technologies and alternative pathways- Adapting best practices in innovation across the business (idea generation portfolio optimization)
- Developing needs-based segmentations to improve customer service- Increased connection between technology and commercial
20001990 19981992 19961994 2002 2004
2006
Beginning from 100, as of 1990
Continuously increased PPI brings substantial cost
pressure to chemical companies
Western Best Practices Opportunities for Chinese Companies
Supply Chain Management
Manufacturing
Research & Development
Customer Engagement
CustomerSegmentation
Asset and Product Segmentation
Segment-AA
Segment-CA Segment-CB Segment-CC Segment-CD
Segment-AC
Segment-AD
Segment-AB
Inte
rnal
(P
rod
uct/
Ass
et)
Cap
abili
ties
Market/Customer Supply Chain Requirements
DESIGN FOR AGILITYDESIGN FOR EXCELLENCE
Natural Supply Chain Offering #1 Natural Supply Chain Offering #3
Natural Supply Chain Offering #4Natural Supply Chain Offering #2
- Longer lead times (manufactured to meet lead time requirement)- Customized products (if manufactured for premium customers) with variable demand, standard service- Strict order and logistics requirements, forecast at lead time- Optimized operations and logistics
- Longer lead times (manufactured to meet lead time requirement)- Standard products with stable, predictable demand, standard service- Strict order and logistics requirements, forecast at lead time- Optimized operations and logistics
- Shorter lead times (from inventory)- Customized products with variable demand, tailored service- Flexible order and logistics requirements - Operations optimized for cost and service; additional cost recovered
- Shorter lead times (from inventory or manufacturing)- Standard products with stable, predictable demand, tailored service- Flexible order and logistics requirements- Operations optimized for cost and service; additional cost recovered
NS
C D
esig
n In
put

8 Booz & Company
raised to world-class levels, but the road system—especially in rural areas—still needs significant upgrades. However, the Chinese government is addressing this issue: Over the next 30 years, China is dedicating 2 trillion renminbi (about US$315 billion) to expand its highways.
As Western chemical companies struggle to capture growth, given their legacy assets and the longer supply chains that result, Chinese players have a unique opportunity to leapfrog supply chain productivity improvement—if they can put a natural supply chain approach in place.
2. ManufacturingIn today’s market, ensuring that manufacturing processes are as efficient and cost-effective as possible is a competitive necessity for global chemical companies.
Western chemical companies have continuously focused on improving productivity to combat rising costs and shrinking margins. Lean and Six Sigma management philosophies, vehicles for change through an organizational approach to performance excellence covering both transformational change and transactional change, have been universally adopted. Such programs have systematically eliminated waste and highlighted the concepts of customer pull and continuous flow. Expert de-bottlenecking initiatives have led to asset optimization, which can reduce costs by as much as 25 percent.
Toll manufacturers and the outsourcing of noncore activities have led to further improvements in efficiency. Many European and U.S. companies, especially in more downstream market segments such as fine and specialty chemicals,
now operate through a network of their own plants as well as contract arrangements with toll processing manufacturers. This workflow lends increased flexibility to manufacturing while optimizing cost.
In the past, Chinese producers have generally performed well in terms of cost management and productivity. But this record has come under threat over the last few years by increasing inflation rates in raw materials and rising wages. The Producer Price Index in China more than doubled between 1990 and 2010, with a particularly sharp rise in the last five years (see Exhibit 5). In this environment, drawing lessons from best practices in manufacturing becomes increasingly important. In particular, a focus on plant effectiveness and reliability, along with improvement of asset utilization, stands to deliver substantial savings in China
Source: Booz & Company analysis
Exhibit 5 Rising Costs in China
11.0 million = Subheads or highlighted text in Subheads
Guidelines:
aölkdfölka = Plain text / Body copy in Content Bullet points as dashes with tab position
32.8% = numbers in Data (Black)Key Attributes
CURRENT STATE ANALYSES TARGET STATE DESIGN IMPLEMENTATION
A4 format: - width for 3 columns: 169 mm = 6.654 in- width for 2 columns: 111 mm = 4.37 in
Letter format:- width for 3 columns: 167,64 mm = 6.6 in- width for 2 columns: 110,35 mm = 4.343 in
Lines: 0,5 ptLines for legend: 0,5 pt dotted, black
Note:Please always delete all unused colors, after creating the exhibit,otherwise InDesign will import the spot colors of this Illustrator file.These colors can’t be deleted in InDesign. Thanks.
Approved Colors, Tints and Patterns:
Line Weights:
0,5 pt
0,75 pt
1 pt
Arrows:
Line Textures:
solid
dashed
dotted
- Program-driven
- Legacy DoD suppliers
- Low-rate production
- Very complex systems
Exquisite Systems Providers
- With inherent buy-in from top management, the focus is on overall operating model transformation
- Strategic assessment identifies key areas of lean opportunity across the enterprise
- Automation of data integration and transformations via ETL technologies- Manual adjustments to the transformed data via a PEA workbench- Transformation of adjusted data into an analysis-friendly format (usually BI cubes)
Operating Model Design
- Process architecture- Automation- Technology- Organization- Footprint- Metrics
Implementation Road Map
- Quantify benefits- Prioritize projects- Develop individual and integrated implementation plans- Create program management structure and governance
Execution
- Implement integrated plan- Ensure ongoing communications- Maintain business buy-in- Track and enforce benefit realization- Institutionalize culture of continuous improvement- Drive Lean adoption and mastery
Quick Win Implementation
- Initial pilots validate opportunity and overcome resistance to transformation within the organization
- Enterprise-wide strategic assessment results feed into phased lean deployment
Scale-DrivenStandard Suppliers
- Product-line-focused
- DoD is a minor customer
- Leverage global scale
- Exploit commercial scope
Agile SmartCustomizers
NONTRADITIONAL WAYS TO PLAY
- Problem-centric
- “Silicon Valley” culture
- Small and nimble
- Risk-taking/innovative
DisruptiveSpecialists
B
C
1 2 3
Strategic Assessment/
Operating Model Design
PilotSelection
PilotSelection
Pilot Execution/ Evaluation
Pilot Execution/Evaluation
Strategic Assessment/ Operating Model Design
Pilot Execution/ Evaluation
Lean Deployment
Lean Deployment
Phased Lean Deployment/Refinement
Strategic Assessment/ Operating Model Design
- People involvement- Batch reduction- Cellular teams- Equipment reliability- Leveling- Reduce setup time
Workload Profiling
Risk Assessment
Spans and Layers Analysis
Workload Balancing
Risk Analytics and Solution
Identifying Waste
Time and Motion Study
Value Stream Mapping
Voice of the Customer AnalysisLean Design Principles
- Standardized work- Quality at source- Workplace organization- Visual controls- Pull systems
Data Factory Analysis Factory Business Leaders
Raw Data Input
Actions
High-Quality PEA Data &
MetricsInsights
- Library of fit-for-purpose reports that facilitate identification of key insights …- … and ongoing PEA processes - Easy access to cleansed PEA data for ad hoc analysis
- Use of key insights by all levels to drive better customer dialogues and more effective promotion investments
- Sell-in- Sell-through- Sell-out- Trade spend- Planned promotions- Merchandising causals- Financials- Hierarchies
CHINA PRODUCER PRICE INDEX (PPI)1990–2010
0
20
40
60
80
100
120
140
160
180
200
220
240
260
201020001990 19981992 19961994 2002 2004 2006 2008 2012
Beginning from 100, as of 1990
Continuously increased PPI brings substantial cost
pressure to chemical companies
PPI
9Booz & Company
and enhance the international competitiveness of the country’s chemical producers.
3. Research and DevelopmentR&D has become a critical differentiator and a valued tool to thwart competition from price-driven producers. An intensified R&D focus on product and application development allows producers to more closely attend to customer needs and to tighten both technical and commercial links.
In Western companies, R&D efforts have diversified. They now range from basic research programs, which are typically long-term, fundamental ventures with uncertain results, to product development, applications development, and process technology that aim to produce not entirely new products but
rather modifications of existing products or processes to better meet end-consumer requirements. This R&D realignment helps companies respond more swiftly to market changes and short-term opportunities. Certain key elements of research projects with a long-term focus are increasingly managed in collaboration with external partners, allowing producers to concentrate on their core skills—understanding customers and reacting to their needs with new products. Indeed, several global chemical companies have shifted their central research labs closer to the business units and opted for a decentralized approach to R&D, which unfolds in close cooperation with the customer.
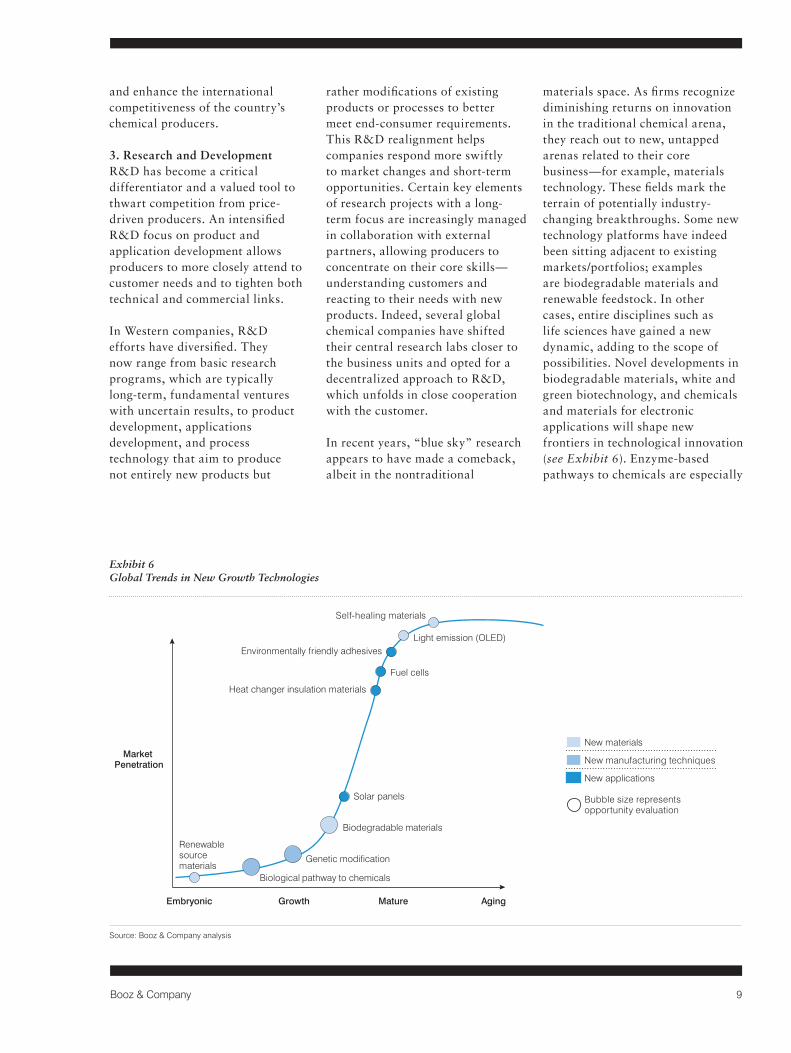
In recent years, “blue sky” research appears to have made a comeback, albeit in the nontraditional
materials space. As firms recognize diminishing returns on innovation in the traditional chemical arena, they reach out to new, untapped arenas related to their core business—for example, materials technology. These fields mark the terrain of potentially industry-changing breakthroughs. Some new technology platforms have indeed been sitting adjacent to existing markets/portfolios; examples are biodegradable materials and renewable feedstock. In other cases, entire disciplines such as life sciences have gained a new dynamic, adding to the scope of possibilities. Novel developments in biodegradable materials, white and green biotechnology, and chemicals and materials for electronic applications will shape new frontiers in technological innovation (see Exhibit 6). Enzyme-based pathways to chemicals are especially
Source: Booz & Company analysis
Exhibit 6 Global Trends in New Growth Technologies
11.0 million = Subheads or highlighted text in Subheads
Guidelines:
aölkdfölka = Plain text / Body copy in Content Bullet points as dashes with tab position
32.8% = numbers in Data (Black)Key Attributes
CURRENT STATE ANALYSES TARGET STATE DESIGN IMPLEMENTATION
A4 format: - width for 3 columns: 169 mm = 6.654 in- width for 2 columns: 111 mm = 4.37 in
Letter format:- width for 3 columns: 167,64 mm = 6.6 in- width for 2 columns: 110,35 mm = 4.343 in
Lines: 0,5 ptLines for legend: 0,5 pt dotted, black
Note:Please always delete all unused colors, after creating the exhibit,otherwise InDesign will import the spot colors of this Illustrator file.These colors can’t be deleted in InDesign. Thanks.
Approved Colors, Tints and Patterns:
Line Weights:
0,5 pt
0,75 pt
1 pt
Arrows:
Line Textures:
solid
dashed
dotted
- Program-driven
- Legacy DoD suppliers
- Low-rate production
- Very complex systems
Exquisite Systems Providers
- With inherent buy-in from top management, the focus is on overall operating model transformation
- Strategic assessment identifies key areas of lean opportunity across the enterprise
- Automation of data integration and transformations via ETL technologies- Manual adjustments to the transformed data via a PEA workbench- Transformation of adjusted data into an analysis-friendly format (usually BI cubes)
Operating Model Design
- Process architecture- Automation- Technology- Organization- Footprint- Metrics
Implementation Road Map
- Quantify benefits- Prioritize projects- Develop individual and integrated implementation plans- Create program management structure and governance
Execution
- Implement integrated plan- Ensure ongoing communications- Maintain business buy-in- Track and enforce benefit realization- Institutionalize culture of continuous improvement- Drive Lean adoption and mastery
Quick Win Implementation
- Initial pilots validate opportunity and overcome resistance to transformation within the organization
- Enterprise-wide strategic assessment results feed into phased lean deployment
Scale-DrivenStandard Suppliers
- Product-line-focused
- DoD is a minor customer
- Leverage global scale
- Exploit commercial scope
Agile SmartCustomizers
NONTRADITIONAL WAYS TO PLAY
- Problem-centric
- “Silicon Valley” culture
- Small and nimble
- Risk-taking/innovative
DisruptiveSpecialists
B
C
1 2 3
Strategic Assessment/
Operating Model Design
PilotSelection
PilotSelection
Pilot Execution/ Evaluation
Pilot Execution/Evaluation
Strategic Assessment/ Operating Model Design
Pilot Execution/ Evaluation
Lean Deployment
Lean Deployment
Phased Lean Deployment/Refinement
Strategic Assessment/ Operating Model Design
- People involvement- Batch reduction- Cellular teams- Equipment reliability- Leveling- Reduce setup time
Workload Profiling
Risk Assessment
Spans and Layers Analysis
Workload Balancing
Risk Analytics and Solution
Identifying Waste
Time and Motion Study
Value Stream Mapping
Voice of the Customer AnalysisLean Design Principles
- Standardized work- Quality at source- Workplace organization- Visual controls- Pull systems
Data Factory Analysis Factory Business Leaders
Raw Data Input
Actions
High-Quality PEA Data &
MetricsInsights
- Library of fit-for-purpose reports that facilitate identification of key insights …- … and ongoing PEA processes - Easy access to cleansed PEA data for ad hoc analysis
- Use of key insights by all levels to drive better customer dialogues and more effective promotion investments
- Sell-in- Sell-through- Sell-out- Trade spend- Planned promotions- Merchandising causals- Financials- Hierarchies
CHINA PRODUCER PRICE INDEX (PPI)1990–2010
0
20
40
60
80
100
120
140
160
180
200
220
240
260
201020001990 19981992 19961994 2002 2004 2006 2008 2012
Beginning from 100, as of 1990
Continuously increased PPI brings substantial cost
pressure to chemical companies
PPI
New materials
New manufacturing techniques
New applications
Light emission (OLED)
Genetic modification
Biodegradable materials
Heat changer insulation materials
Solar panels
Fuel cells
Self-healing materials
Environmentally friendly adhesives
Embryonic Growth Mature Aging
Market Penetration
Bubble size represents opportunity evaluation
Biological pathway to chemicals
Renewable source materials

10 Booz & Company
promising: The Organisation for Economic Co-operation and Development recently predicted that by the year 2030, 35 percent of the world’s chemicals and industrial products could be produced through biological pathways.
We also know that although there is a minimum threshold, it is not the highest R&D spend that guarantees the best performance. The more decisive determinants of success are an effective alignment between innovation strategy and the overall corporate strategy and a streamlined R&D pipeline that delivers a regular supply of appropriate innovations, accompanied by business models for effective portfolio management and speedy commercialization of R&D results.
R&D is an area with room for significant improvement in China. R&D spending in China is still relatively low, and is still distinctly lower than that of Western companies. (The R&D intensity—R&D expense as percent of sales—is just over 1 percent of sales for many Chinese companies, compared with 2 to 4 percent at
Western chemical companies, averaged across product categories.) Furthermore, Chinese companies’ R&D spend tends to be skewed toward relatively long-term research and process technology. China has the potential to transition from its role as a basic chemical supplier to an innovation-driven solution provider capable of marketing its products both domestically and globally. The aerospace industry, where China is investing significant resources to become a major player, is one area where this commitment is already visible; the automotive industry is another example.
The Chinese drive and momentum to enter new areas and to become the dominating player in these segments is already impressive—chemicals for solar applications and vitamins are examples. To further enhance its own capabilities across the entire innovation value chain, China can leverage best practices in innovation management developed by leading Western players. In particular, China stands to reap the benefits of improved product development by establishing greater customer intimacy, increasing
localization of customer and consumer product features, and exploring an open innovation approach that will yield the highest level of R&D effectiveness. Given China’s natural resource constraints, an emphasis on frugal engineering processes offers additional advantages.
In addition, enhanced innovation capacity will enable China to leapfrog ahead of Western players in some new key technologies. Although Chinese companies have already begun developing strong positions in coal-to-chemicals pathways, the power generation sector’s heavy demand for coal currently limits growth opportunities in this area. Going forward, the development of alternative energy resources, notably shale gas, may unlock more of China’s substantial coal reserves for chemical use. Although at an early stage, China possesses resources of shale gas, mainly located in the Sichuan and Tarim basins, that could increase capacity of ethylene by 25 percent by 2025. (There are still high levels of uncertainty due to lack of drilling experience.)
China has the potential to transition from a basic chemical supplier to an innovation-driven solution provider capable of marketing products both domestically and globally.

11Booz & Company
Bio-pathways to chemicals as well as chemicals and materials for renewable energy generation and electronics applications are also extremely attractive research avenues worth pursuing.
4. Customer EngagementAccording to a recent Booz & Company study, companies that engage directly with their customers reach operating income growth that is threefold higher than that of companies with an indirect insight approach.
In the West, newly developed customer service models seek competitive advantage through increased customer satisfaction. Thorough needs-based analysis enables companies to segment their customer base. Optimizing the level of service for each identified customer segment minimizes cost and maximizes revenue potential. Such tailored interaction not only enables companies to better meet customer needs but can also lead to improvements in supply chain efficiency and to a closer connection between the technology and commercial organizations.
Most recently, companies have sought to enhance customer intimacy through other offerings. They are promoting value creation beyond chemical products, such as through new ventures that offer chemical delivery along with application support, performance-
based pricing, and other services. For example, producers of automotive coatings have taken over the operations of the paint shop of several car manufacturers and are paid for each painted car instead of for the volume of coatings they supply. For such performance-based pricing, it is crucial that the supplier has control over the production process used to determine the pricing. Some companies are developing high-value products that meet specific customer needs and typically extend beyond the classical chemical value chain. For example, Teijin, a Japanese producer of commodity polyester fibers as well as high-strength performance fibers, is moving beyond the traditional materials provider position and forward -integrating into downstream applications to influence and control demand. Through this strategy, companies like Teijin are also able to better fight the commoditization of upstream molecules by providing integrated solutions, leveraging the breadth of portfolio they offer to customers.
To increase value creation, companies have moved toward direct collaboration with customers. Placing a priority on customer intimacy has implications for an enterprise’s entire operating model, organizational structure, and business model. In specialty chemicals, for example, it has led to fewer product-based business
units and an increase in market-facing units.
The current situation in China does not yet reflect these industry trends. Many Chinese companies still have traditional marketing and sales organizations, mostly with inconsistent customer segmentation. This structure risks blurring the company’s overall focus, and resource deployment can dip to suboptimal levels. As a frequent result, customers that demand more will attain priority services, but they may not necessarily be the most profitable customers or the clients that truly need these services.
In China, another element is at play: relationship building, also called guanxi. More than in any other part of the world, this informal way of doing business with trusted partners adds a layer of complexity to developing and maintaining customer relationships. But the importance of guanxi diminishes as an organization matures from a small or medium-size enterprise to a larger market player.
The window of opportunity for Chinese companies in the commercial area is wide open. However, among the four categories we have examined in this Perspective, the customer engagement option requires the most culturally adapted solution.

12 Booz & Company
We have described a number of changes and challenges that are reshaping the global chemical industry, opening the door for China to become an industry leader. To speed up their own development, Chinese chemical companies can leverage the best practices of Western companies—adopting some, and adapting others to their local needs. This is particularly important
today, as the Chinese industry seeks to meet market demands for new chemicals while, at the same time, managing cost pressures from soaring wages and commodity price inflation. Opportunities abound, and Chinese companies are well positioned to capture them by accelerating their development cycle and preparing for tougher competition with Western players.
CONCLUSION

13Booz & Company
About the Authors
Edward Tse is a senior partner with Booz & Company and the firm’s chairman for Greater China, specializing in definition and implementation of busi-ness strategies, organizational effectiveness, and corporate transformation. He has assisted several hundred companies—headquartered both within and outside China—on all aspects of business related to China and its integration with the rest of the world.
Jayant Gotpagar is a principal with Booz & Company based in Houston, and co-leads firm’s North America chemicals prac-tice. He focuses on business unit growth strategies, operat-ing model design, innovation management, and operational improvement programs in the chemical and downstream oil and gas sectors.
Anna Mansson is a principal with Booz & Company based in Shanghai. Her expertise covers operations optimization and innovation in the consumer, automotive, industrial, and chemicals sectors.
Matthias Hendrichs is a principal with Booz & Company based in Hong Kong and a member of the firm’s Asian chemicals leadership team. His expertise covers corpo-rate strategy, M&A, sales and marketing, and supply chain management.

Booz & Company is a leading global management consulting firm focused on serving and shaping the senior agenda of the world’s leading institutions. Our founder, Edwin Booz, launched the profession when he established the first management consulting firm in Chicago in 1914. Today, we operate globally with more than 3,000 people in 58 offices around the world.
We believe passionately that essential advantage lies within and that a few differentiating capabilities drive any organization’s identity and success. We work with our clients to discover and build those capabilities that give them the right to win their chosen markets.
We are a firm of practical strategists known for our functional expertise, industry foresight, and “sleeves rolled up” approach to working with our clients. To learn more about Booz & Company or to access its thought leadership, visit booz.com. Our award-winning management magazine, strategy+business, is available at strategy-business.com.
The most recentlist of our officesand affiliates, withaddresses andtelephone numbers,can be found onour website,booz.com.
Worldwide Offices
AsiaBeijingDelhiHong KongMumbaiSeoulShanghaiTaipeiTokyo
Australia,New Zealand & Southeast AsiaBangkokBrisbane
CanberraJakartaKuala LumpurMelbourneSydney
EuropeAmsterdamBerlinCopenhagenDüsseldorfFrankfurtHelsinkiIstanbul
LondonMadridMilanMoscowMunichParisRomeStockholmStuttgartViennaWarsawZurich
Middle EastAbu DhabiBeirutCairoDohaDubaiRiyadh
North AmericaAtlantaBostonChicagoClevelandDallasDC
DetroitFlorham ParkHoustonLos AngelesMexico CityNew York CityParsippanySan Francisco
South AmericaBuenos AiresRio de JaneiroSantiagoSão Paulo
©2012 Booz & Company Inc.