Embed Size (px)
Citation preview

FUTURE OF TRI-STATE FERTILIZER RECOMMENDATIONS
December 14, 2016
Steve CulmanSchool of Environment and Natural ResourcesThe Ohio State University, [email protected], 330-822-3787

Tri-State Recommendations• Originally Published in 1995
• Unified N, P, K recommendations for corn, soybean, wheat and alfalfa across Ohio, Michigan and Indiana
• Served as a cornerstone of fertilizer management in this region

Tri-State Recommendations• Nitrogen recommendations based on
yield goals• Replaced by MRTN
• Phosphorus and Potassium based on build up and maintenance philosophy
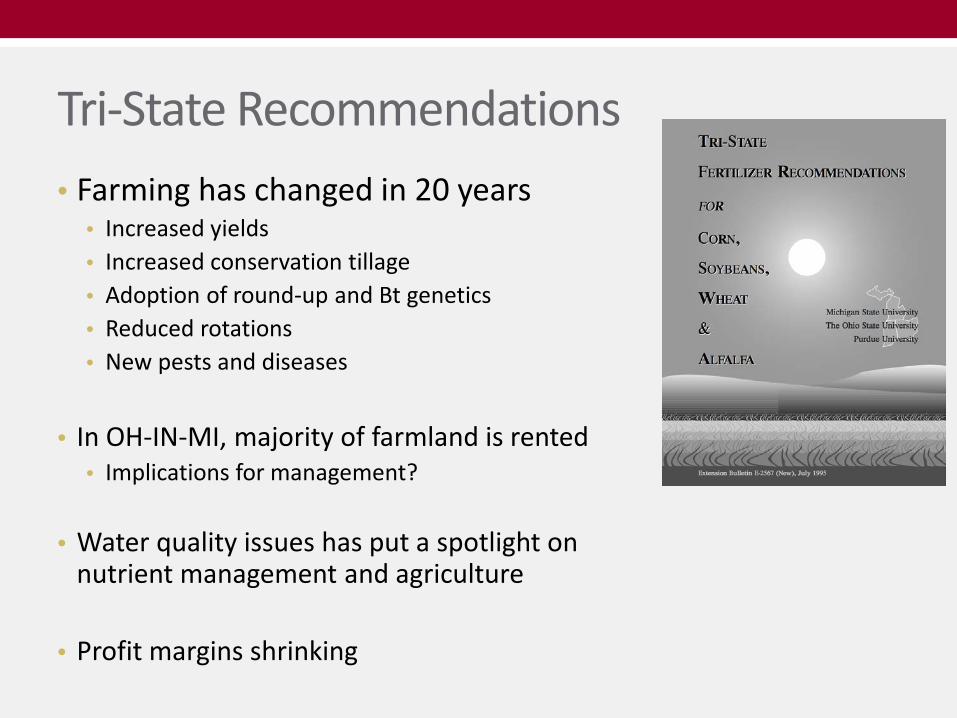
Tri-State Recommendations• Farming has changed in 20 years
• Increased yields• Increased conservation tillage • Adoption of round-up and Bt genetics• Reduced rotations• New pests and diseases
• In OH-IN-MI, majority of farmland is rented• Implications for management?
• Water quality issues has put a spotlight on nutrient management and agriculture
• Profit margins shrinking

Tri-State Recommendations• Call to revise fertilizer recommendations
• Do Tri-State recs still apply to my highly productive fields?
• I’m renting and don’t know how long I will farm this ground. What’s the minimum amount of fertilizer I can apply to get a good yield?
• I am concerned about water quality and want to show that I’m doing an even better job managing nutrients on my farm.
• We’ve moved to variable rate technology and want to dial in multiple rates within a field.

Before we know where we are going, we should probably know where we have been…

Jay Johnson – OSU Fertility SpecialistAnnual Soil Fertility Reports: 1976 – 1999• 68 P trials (site-years) conducted• 92 K trials conducted
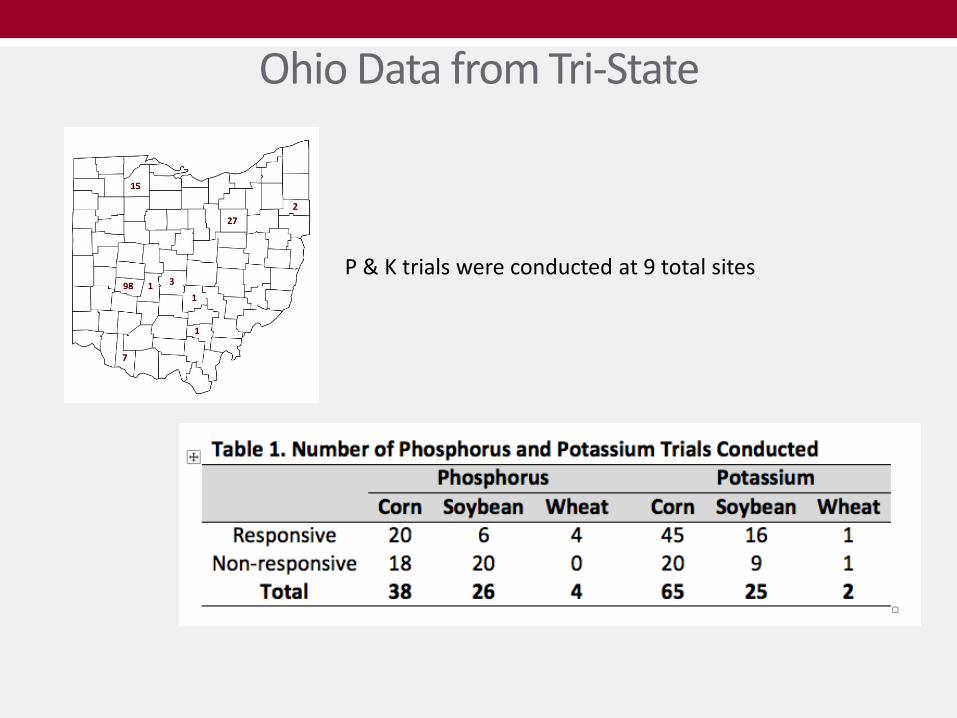
Ohio Data from Tri-State
P & K trials were conducted at 9 total sites

At what soil test level should fertilizer be applied to see a yield response?
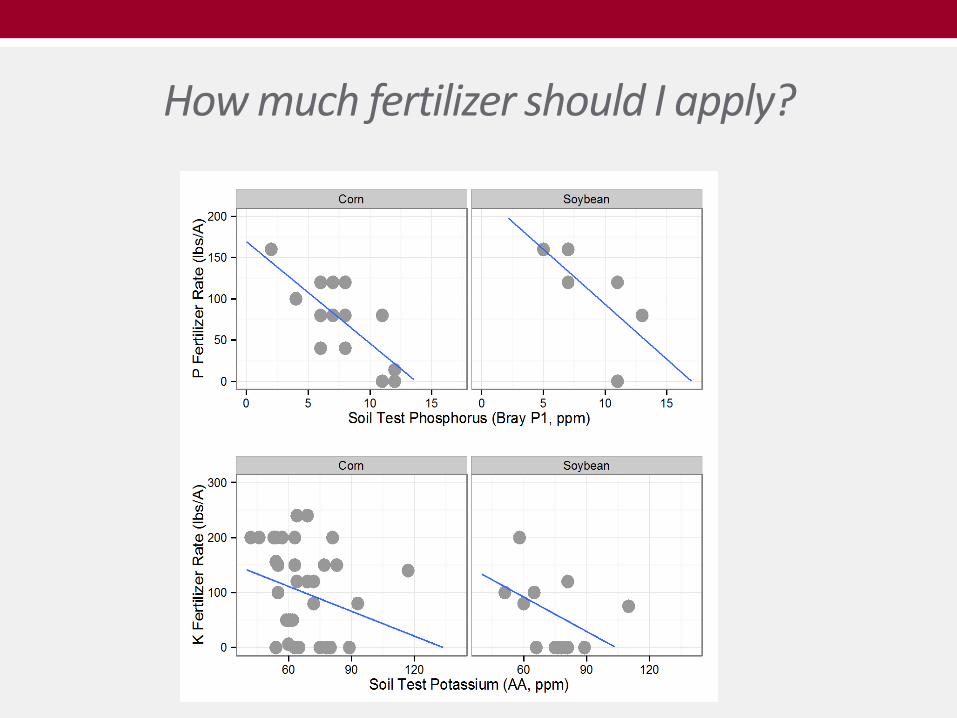
How much fertilizer should I apply?
• 25 years of fertility studies conducted over 9 sites showed:
• Very low probability of yield responses • Above 15 ppm Bray P1• Above 100 ppm AA for corn and soybean
• Applying higher fertilizer rates at very low testing soils is a justified approach
Original Ohio Tri-State Data Summary

That’s great and all…but what about data from this century??

Long-term P & K Plots• Clark County• Wayne County• Wood County
• 2006 – 2014(9 years)
Corn-soybean &Corn-corn-soybean
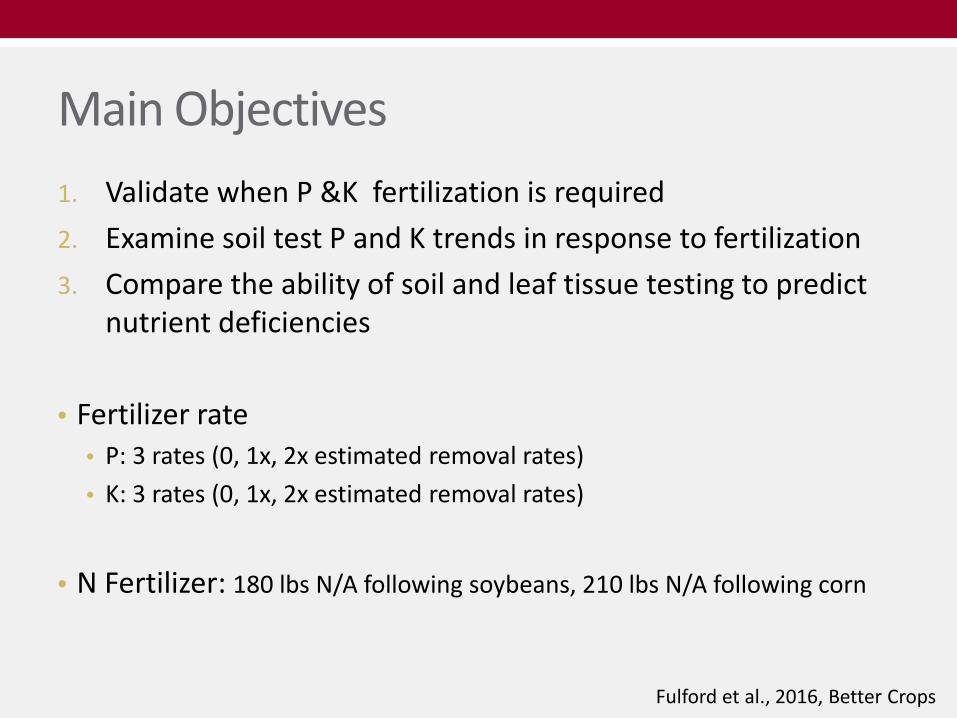
Main Objectives1. Validate when P &K fertilization is required2. Examine soil test P and K trends in response to fertilization3. Compare the ability of soil and leaf tissue testing to predict
nutrient deficiencies
• Fertilizer rate• P: 3 rates (0, 1x, 2x estimated removal rates)• K: 3 rates (0, 1x, 2x estimated removal rates)
• N Fertilizer: 180 lbs N/A following soybeans, 210 lbs N/A following corn
Fulford et al., 2016, Better Crops

Baseline Soil DataSoil Property Clark Wayne WoodpH 6.8 5.9 6.1CEC (meq/100g) 13 11 22OM (%) 1.7 1.5 2.9Bray P (ppm) 29 28 22K (ppm) 113 113 198
Tri-State Rec Corn and Soybean Maintenance Range• Phosphorous: 15-30 ppm Bray P• Potassium: 100-155 ppm AA

Grain Yields (2006-2014)
42 total comparisons of fertilized vs. unfertilized
How many comparisons responded to fertilization?

Grain Yields (2006-2014)• 10 out of 42 responded to fertilization
• Corn positive responses to fertilization (24 site-years)• P: 4 site-years• K: 1 site-year
• Soybean positive responses to fertilization (18 site-years)• P: 2 site-years• K: 3 site-years
• 2 sites negatively responded to P
Fulford et al., 2016, Better Crops
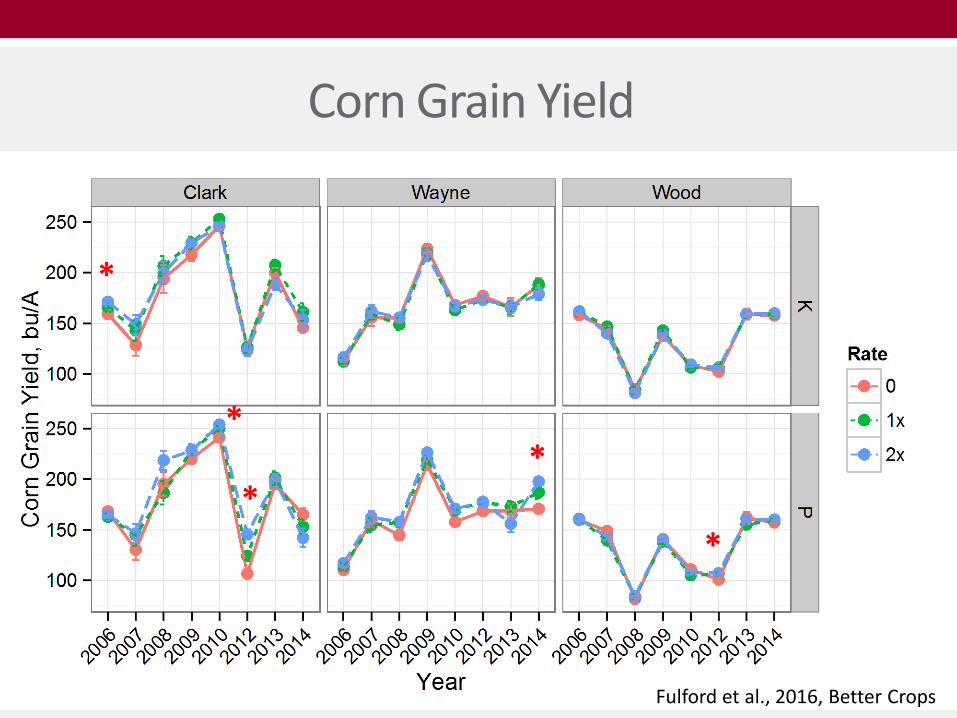
Corn Grain Yield
*
*
**
*
Fulford et al., 2016, Better Crops

Soybean Grain Yield
** *
**
Fulford et al., 2016, Better Crops
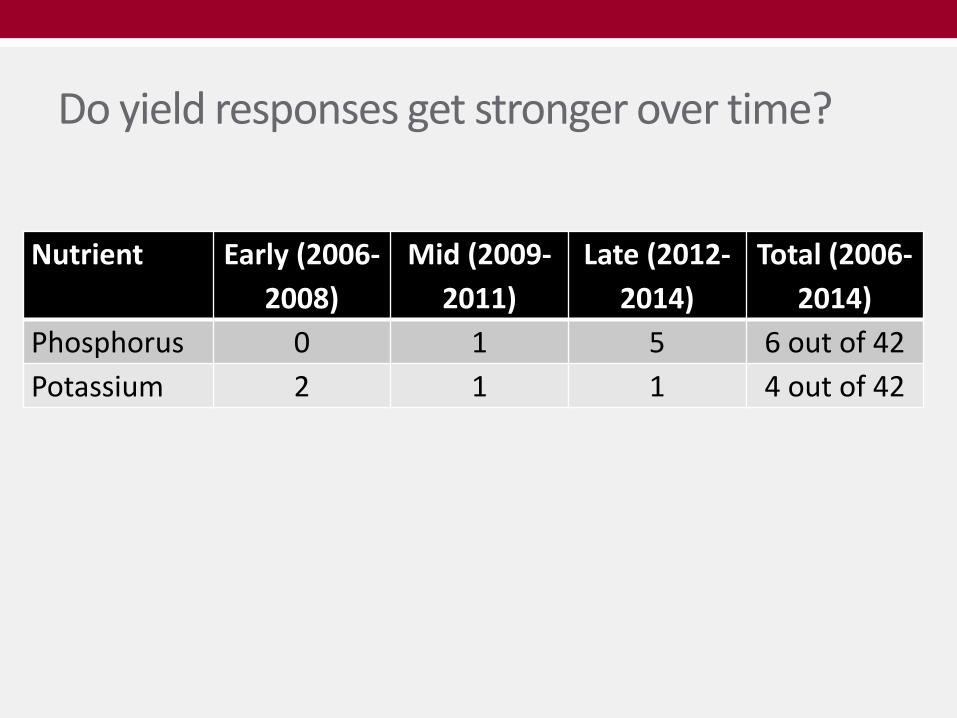
Do yield responses get stronger over time?
Nutrient Early (2006-2008)
Mid (2009-2011)
Late (2012-2014)
Total (2006-2014)
Phosphorus 0 1 5 6 out of 42Potassium 2 1 1 4 out of 42

Soil Test P & K Trends

Tissue Test P & K Trends
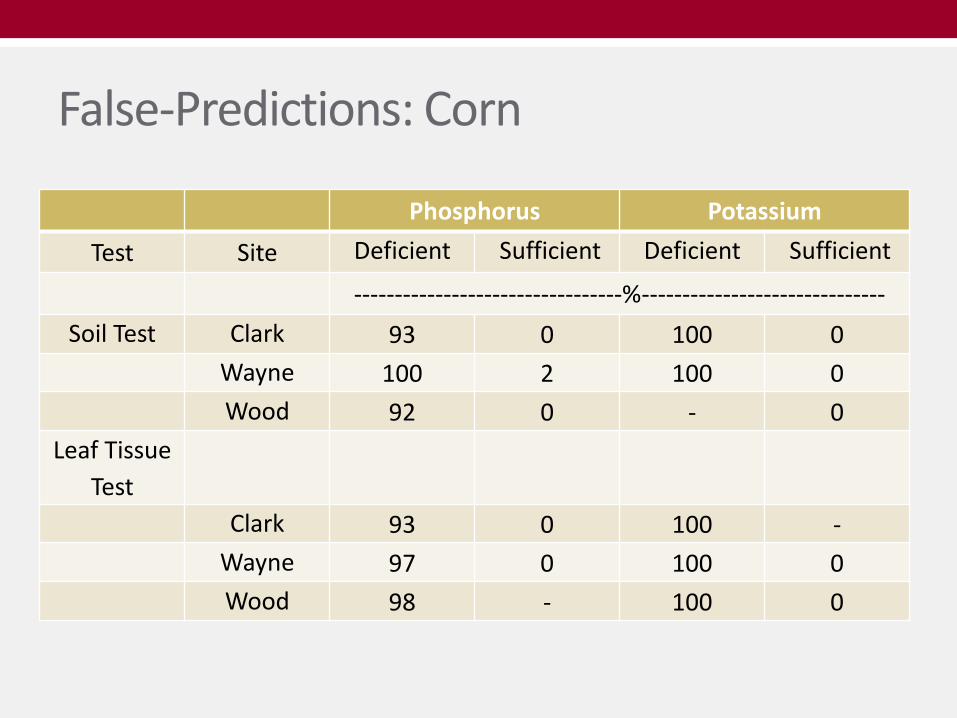
False-Predictions: Corn
Phosphorus PotassiumTest Site Deficient Sufficient Deficient Sufficient
---------------------------------%------------------------------Soil Test Clark 93 0 100 0
Wayne 100 2 100 0Wood 92 0 - 0
Leaf Tissue Test
Clark 93 0 100 -Wayne 97 0 100 0Wood 98 - 100 0
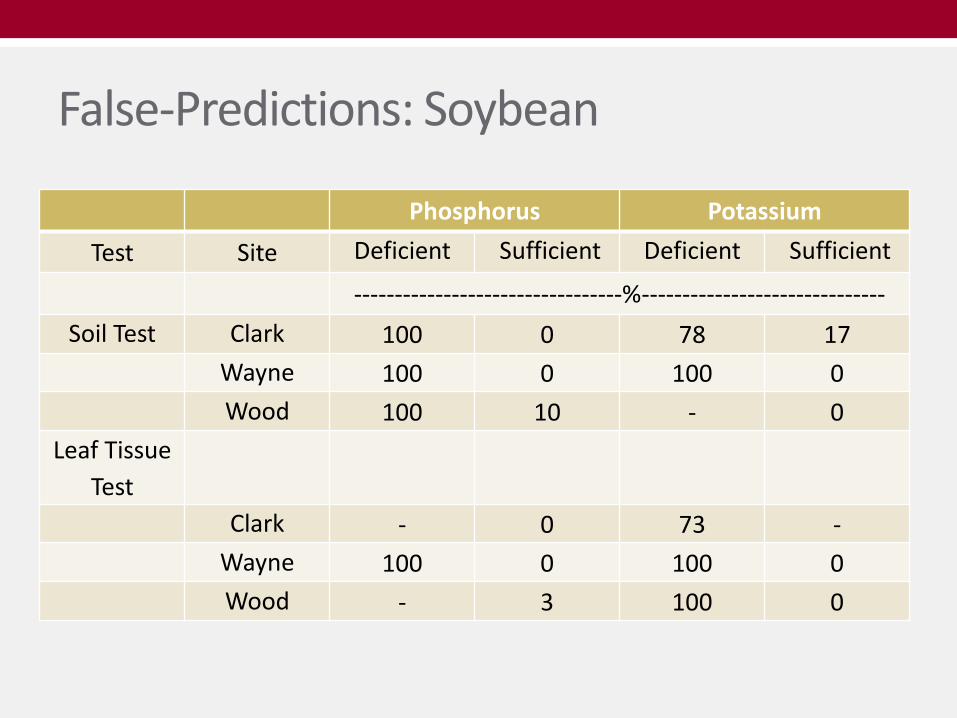
False-Predictions: Soybean
Phosphorus PotassiumTest Site Deficient Sufficient Deficient Sufficient
---------------------------------%------------------------------Soil Test Clark 100 0 78 17
Wayne 100 0 100 0Wood 100 10 - 0
Leaf Tissue Test
Clark - 0 73 -Wayne 100 0 100 0Wood - 3 100 0

P & K Trial Conclusions• Fertilization over 9 years increased grain yields in 10 out of 42
comparisons• No indication that recommendations are too low
• High false prediction rates suggest:• Overall conservative nature of recommendations• Soil and tissue diagnostics may need revision to be more meaningful
• General trend in declining soil test P and K does not agree with estimated removal rates of P and K in grain
• Soil vs. Tissue Testing• Soil test P = better at reflecting P fertilization in both corn and soybean• Tissue test K = better at reflect K fertilization in soybean

What about current on-farm work?
• Funding from Ohio Corn and Small Grain Marketing Programs, Ohio Soybean Council & USDA
• Majority of research in Ohio are on-farm trials, some OSU-farms
• Most robust information will come from many sites over diversity of soil types and regions in Ohio
• Working directly with growers, but also working with or ‘sub-contract’ crop consultants, ag coops, agronomists to help facilitate on-farm strip trials
• Working with variable rate trials as well
Our Approach – An Ohio Perspective

• All trials require:• Pre-fertilization soil sampling• Early reproductive (R1) tissue test• Grain yields of plots/ strips/ grid areas
• We measure:• Standard soil test and other simple soil measurements• Nutrient concentration in leaf tissue• Nutrient concentration in grain
Our Approach

Phosphorus and Potassium• Treatments with:
• Strips/ planter passes with no P or K applied• Strips/ planter passes with P and K applied as recommended or normally
managed
Not fert.
+P2O5
or
+K2ONot fert.
+P2O5
or
+K2O
Not fert.
+P2O5
or
+K2O

• Re-establish critical ranges for soil test P and K levels• Not just build up and maintenance, but also sufficiency• Move STP from Bray P to Mehlich P
• Re-establish leaf critical levels for P, K and all nutrients
• Re-establish typical P and K removal rates per bushel grain
Phosphorus and Potassium
• Multiple N rates (0 – 250 lbs N/ acre)
• Determine agronomic and economic optimal N rate and fit curve
• Collect as much site-specific information as possible• Soil test: PSNT, active organic matter fractions (ex, CO2
burst)• Weather data• Stalk Nitrate• NDVI and other crop sensing technologies
Nitrogen

• All data will feed into current maximum return to nitrogen model (MRTN) for corn• Economic model based on maximizing profitability, not
productivity
• Create an MRTN model for wheat in Ohio
• Re-establish leaf critical levels for N and all nutrients
• Re-establish typical N removal rates per bushel grain
Nitrogen

Where are we now?

2014 – 2016 Field Seasons – 151 total trials
Nitrogen Phosphorus Potassium Total Sites
Soybean 14 15 17
Nitrogen Phosphorus Potassium TotalSites
Corn 19 12 9 29
Soybean 13 13 13
2014
2015
Nitrogen Phosphorus Potassium Sulfur TotalSites
Corn 38 22 16 3 65
Soybean
22 22 22
Wheat 2 5 5 2 5
2016
2017…?

Where are we headed?
• IN-MI-OH State Specialists met in Fort Wayne and discussed issues with revising Tri-State Recommendations
• Intention to continue to maintain as 3-state document
• Hope to have more dynamic, living document, than a static work revisited every 20 years
• More questions than answers at this point
• Hopefully first chapters will emerge in 2018

Thank You
Steve CulmanSoil Fertility
Ohio State UniversityWooster, Ohio