Embed Size (px)
Citation preview
Future Year Modelling Report St Leonards and Crows Nest Station Precinct Traffic and Transport Study
13 July 2020 Cardno i
Future Year Modelling Report
St Leonards and Crows Nest Station Precinct Traffic and Transport Study
80018096
Prepared for
Department of Planning, Industry and Environment
13 July 2020

Future Year Modelling Report St Leonards and Crows Nest Station Precinct Traffic and Transport Study
© Cardno. Copyright in the whole and every part of this document belongs to Cardno and may not be used, sold, transferred, copied or reproduced in whole or in part in any manner or form or in or on any media to any person other than by agreement with Cardno.
This document is produced by Cardno solely for the benefit and use by the client in accordance with the terms of the engagement. Cardno does not and shall not assume any responsibility or liability whatsoever to any third party arising out of any use or reliance by any third party on the content of this document.
Our report is based on information made available by the client. The validity and comprehensiveness of supplied information has not been independently verified and, for the purposes of this report, it is assumed that the information provided to Cardno is both complete and accurate. Whilst, to the best of our knowledge, the information contained in this report is accurate at the date of issue, changes may occur to the site conditions, the site context or the applicable planning framework. This report should not be used after any such changes without consulting the provider of the report or a suitably qualified person.
80018096 | 13 July 2020 | Commercial in Confidence ii
Contact Information Document Information
Cardno (NSW/ACT) Pty Ltd
ABN 95 001 145 035
Level 9 - The Forum
203 Pacific Highway
St Leonards NSW 2065
Australia
www.cardno.com
Phone +61 2 9496 7700
Fax +61 2 9439 5170
Prepared for Department of Planning,
Industry and Environment
Project Name St Leonards and Crows Nest
Station Precinct Traffic and
Transport Study
File Reference 80018096-001 St Leonards
Future Year Report FINAL.docx
Job Reference 80018096
Date 13 July 2020
Version Number 2
Document History
Version Effective Date Description of Revision Prepared by Reviewed by
1 08/07/2020 Draft Jackie Liang Chris Slenders
Ivo Pais
2 13/07/2020 Final Jackie Liang Chris Slenders
Ivo Pais

Future Year Modelling Report St Leonards and Crows Nest Station Precinct Traffic and Transport Study
80018096 | 13 July 2020 | Commercial in Confidence iii
Table of Contents
1 Introduction 6
1.1 Background 6
1.2 Report Outline 7
1.3 Scope of Work 7
1.4 Study Area 8
1.5 Modelling Objectives 11
1.6 Reference Material 11
1.7 Stakeholders 11
2 Future Year Demand Development 12
2.1 Future Policies 12
2.2 Future years and scenarios 13
2.3 Land Use Assumptions 13
2.4 Strategic Models (EMME) Road Network Future Assumptions 17
2.5 Demand Development Methodology 17
3 Future Network Assumptions 19
3.1 Future Modelling Years and Scenarios 19
3.2 Modelled Time Periods 19
3.3 Infrastructure Upgrades 19
4 Base Model Operational Results 22
4.1 Data Inputs 22
4.2 Model Specifications and Assumptions 22
4.3 Existing Conditions Performance 23
5 Future Year Operational Results 27
5.1 Inputs and Assumptions 27
5.2 2026 Performance 51
5.3 2036 Performance 54
6 Results Comparison 57
6.1 Network Performance Comparison 57
6.2 Travel Time Comparison 58
6.3 Density Comparison 59
7 Key Findings and Recommendations 61
8 Conclusion 62

Future Year Modelling Report St Leonards and Crows Nest Station Precinct Traffic and Transport Study
80018096 | 13 July 2020 | Commercial in Confidence iv
Tables
Table 1-1 Key Roads 9
Table 2-1 Comparison between SGS Land Use and TfNSW LU16 (TZP16) Forecasts 13
Table 2-2 SGS Land Use and TfNSW LU16 (TZP16) Population and Employment Summary 14
Table 2-3 SGS Land Use Population Growth Rates per Annum 15
Table 2-4 SGS Land Use Employment Growth Rates per Annum 16
Table 2-5 2026 and 2036 Future Major Projects and Infrastructure Assumed in STM and PTPM TfNSW strategic models 17
Table 2-6 STFM OD Matrix Totals (2 Hours) 18
Table 2-7 STFM OD Matrix Growth Rates 18
Table 3-1 Summary of Assessment Scenarios 19
Table 3-2 Modelled Time Periods 19
Table 3-3 List of Proposed Upgrades in the Model Network 20
Table 4-1 Base Model Network Performance 23
Table 4-2 Travel Time and Speeds – AM Peak (2016 Base) 25
Table 4-3 Travel Time and Speeds – PM Peak (2016 Base) 25
Table 5-1 Future Year Model Infrastructure List (from the draft 2036 Plan) 28
Table 5-2 Upgrade #1 – Herbert Street 32
Table 5-3 Upgrade #2 – Canberra Avenue / River Road 33
Table 5-4 Upgrade #3 – Willoughby Road / Atchison Street 34
Table 5-5 Upgrade #4 – Willoughby Rd (south of Holtermann St) 35
Table 5-6 Upgrade #5 – Sergeants Lane and Christie Street Intersection 36
Table 5-7 Upgrade #6 – Oxley Street / Pacific Highway 37
Table 5-8 Upgrade #7 – Oxley Street / Nicholson Street 38
Table 5-9 Upgrade #12 – Chandos Street / Willoughby Street 39
Table 5-10 Upgrade #13 – Pacific Highway near Portview Rd 40
Table 5-11 Upgrade #22 – Oxley Street / Clarke Street 41
Table 5-12 Upgrade #23 – Oxley Street / Atchison Street 42
Table 5-13 Upgrade #24 – Oxley Street / Albany Street 43
Table 5-14 2036 Additional Upgrades 44
Table 5-15 Upgrade #25 – Chandos Street / Oxley Street 46
Table 5-16 Upgrade #28 – Oxley Street / Albany Street 47
Table 5-17 Upgrade #29 – Herbert Street / Westbourne Street 48
Table 5-18 Upgrade #31 – Greenwich Road 49
Table 5-19 Upgrade #35 – Pacific Highway Clearway 50
Table 5-20 Network Performance Results (2026) 51
Table 5-21 Travel Time and Speeds – AM Peak (2026) 52
Table 5-22 Travel Time and Speeds – PM Peak (2026) 52
Table 5-23 Network Performance Results (2036) 54
Table 5-24 Travel Time and Speeds – AM Peak (2036) 55

Future Year Modelling Report St Leonards and Crows Nest Station Precinct Traffic and Transport Study
80018096 | 13 July 2020 | Commercial in Confidence v
Table 5-25 Travel Time and Speeds – PM Peak (2036) 55
Table 6-1 Network Performance Comparison 57
Table 6-2 Travel Time Comparison (1st Hour) 58
Table 6-3 Travel Time Comparison (2nd Hour) 59
Table 6-4 Density Comparison 60
Table 7-1 Draft 2036 Plan Upgrades Recommended to be Removed 61
Figures
Figure 1-1 St Leonards and Crows Nest Planning Study Area 6
Figure 1-2 St Leonards, Crows Nest and Artarmon Study Area 8
Figure 2-1 SGS Land Use (Population) 15
Figure 2-2 SGS Land Use (Employment) 16
Figure 2-3 Future Traffic Demand Matrices Estimation Methodology 18
Figure 3-1 Future Year Road Network Upgrades Location 21
Figure 4-1 Travel Time Routes (2016 Base) 24
Figure 4-2 Density Plot – AM Peak (2016) 26
Figure 4-3 Density Plot – PM Peak (2016) 26
Figure 5-1 Traffic Demands 27
Figure 5-2 Future Model Infrastructure Upgrade Locations 31
Figure 5-3 2036 Additional Upgrade Locations 45
Figure 5-4 Density Plot – AM Peak (2026) 53
Figure 5-5 Density Plot – PM Peak (2026) 53
Figure 5-6 Density Plot – AM Peak (2036) 56
Figure 5-7 Density Plot – PM Peak (2036) 56

Future Year Modelling Report St Leonards and Crows Nest Station Precinct Traffic and Transport Study
80018096 | 13 July 2020 | Commercial in Confidence
6
1 Introduction
1.1 Background
St Leonards and Crows Nest are neighbouring suburbs approximately five kilometres north of Sydney CBD. The precinct is a major hub on the Sydney’s north shore with a mix of low, medium and high density residential dwellings, commercial centres, high density office space, educational and recreational spaces, and health services.
The precinct is well-connected to the rest of Sydney by roads including the Pacific Highway and Warringah Freeway. Public transport services include the T1 North Shore and T9 Northern Line train services and local buses to Sydney, Chatswood and the Northern Beaches among other destinations. Sydney Metro City and Southwest project, due for completion in 2024, includes a new metro station at Crows Nest that will provide direct connections to and from major destinations including the CBD, Hill District and Bankstown.
The Department of Planning Industry and Environment (DPIE) 1 has been working in consultation with local councils including North Sydney, Lane Cove and Willoughby, Transport for New South Wales and NSW Health Infrastructure to finalise the St Leonards and Crows Nest 2036 Plan. The Plan outlines new jobs, open space, infrastructure and homes for St Leonards and Crows Nest. The future performance of the precinct is contingent on the level of planned development, maximisation of active and public transport and the implementation of constrained parking provision and policies for future development.
Cardno was engaged by DPIE to develop a detailed traffic and transport analysis to assist in the planning investigations for the St Leonards and Crows Nest Station Precinct. The scope of works for this project includes the development of a purpose-built microsimulation traffic model using the Aimsun software package. The model was used to identify existing traffic issues and propose ways of managing future traffic demands in the area, while considering Movement and Place principles and interventions outlined in the draft St Leonards and Crows Nest 2036 Plan (draft 2036 Plan). Cardno has developed, calibrated and validated a Base Model for the project which was submitted to DPIE and Transport for NSW along with a report documenting the development procedure2. This model replicates the existing (2016) traffic conditions and provides a basis for the assessment of future year scenarios discussed in this report. Figure 1-1 shows the extent of
the precinct area for the traffic study.
The future year scenarios developed by Cardno will assist DPIE in understanding the impact of proposed interventions on the traffic network performance. This understanding will inform decisions about the future traffic network capacity and additional infrastructure required to support these interventions.
Figure 1-1 St Leonards and Crows Nest Planning Study Area
1 The New South Wales Department of Planning and Environment (DP&E) until 2019. 2 Base Model Development Report (Cardno, 18 May 2020).

Future Year Modelling Report St Leonards and Crows Nest Station Precinct Traffic and Transport Study
80018096 | 13 July 2020 | Commercial in Confidence
7
1.2 Report Outline
The structure of this report is:
> Section 1 – Introduction: outlines the background, project objective, scope of works and study area
> Section 2 – Future demand development: outlines the methodology and policies regarding the development of the
demand used in the future modelling
> Section 3 – Future network assumptions: outlines the assumptions and infrastructure changes within the future
models
> Section 4 – Base operational results: provides the network performance, travel time results and density plots of the
base model
> Section 5 – Future operational results: provides the network performance, travel time results and density plots of
the future models
> Section 5 – Results comparisons: compares the base operational results with the future operational results
> Section 6 – Conclusions: summarises the findings of the study
1.3 Scope of Work
To assist DPIE in achieving the modelling objectives for this study, Cardno provided the following works:
> Utilise previously conducted traffic surveys from 2016 and 2018 to model traffic behaviour in the precinct during typical AM and PM conditions
> Review strategic model land use assumptions and travel patterns for existing and future years
> Establish traffic growth and mode shift trends for future year scenarios
> Review untested transport infrastructure works identified in the Draft 2036 Plan;
> Develop a microsimulation traffic model using Aimsun of the precinct to:
- Assess existing conditions and provide a platform for future year assessment
- Assess future year conditions based on background traffic growth, development growth and proposed infrastructure upgrades from the Draft 2036 Plan.
This scope of work represents a 'stress test' of initiatives proposed in the St Leonards Crows Nest Plan. Further modelling will be required as part of rezoning proposals, including the assessment of 'do nothing' or 'do minimum' cases for future year conditions.

Future Year Modelling Report St Leonards and Crows Nest Station Precinct Traffic and Transport Study
80018096 | 13 July 2020 | Commercial in Confidence
8
1.4 Study Area
The study area presented in Figure 1-2 includes the suburbs of Artarmon, St Leonards, Naremburn, Crows Nest,
Wollstonecraft. The study area is bound by the Gore Hill Freeway in the north, Pacific Highway in the east, River Road in the south and West street in the east. These areas are overseen by the Councils of North Sydney, Lane Cove and Willoughby.
Figure 1-2 St Leonards, Crows Nest and Artarmon Study Area

Future Year Modelling Report St Leonards and Crows Nest Station Precinct Traffic and Transport Study
80018096 | 13 July 2020 | Commercial in Confidence
9
1.4.2 Key Roads
The major roads within the study network are shown in Table 1-1.
Table 1-1 Key Roads
Road Description Posted speed limit (km/h)
Key place uses Key movement uses
Pacific Highway
The portion of Pacific Highway in the study area was substituted by Warringah Freeway and Gore Hill Freeway as the national highway. This portion of Pacific Highway is a state road that travels from the north-western end of the study area to south-east and connects to or provides connectivity to all other major roads in the study area. Outside of the study area, Pacific Highway connects the Sydney CBD to the northern border of New South Wales. The road within the study area has 11 signalised intersections between Alexander Street to Hotham Parade.
60 Residential, Bulk retail, Medical, Education, Transport Interchange, small retail, restaurants.
Significant regional north-south corridor for several bus routes and private vehicles. More freight uses in Artarmon, less so south of Falcon Street.
River Road River Road runs parallel to Pacific Highway on the southern boundary of the study area. The modelled area includes the section of River Road bound by Greenwich Road and Shirley
50 Residential, recreational. Regional east west link.
261 bus route.
Moderate difficulty cycleway.
Greenwich Road
Greenwich Road provides connectivity between Pacific Highway and River Road within the study area. The road serves as the main connectivity in and out of the suburb of Greenwich.
50 Residential Pacific Highway to River Road connector.
Moderate difficulty cycleway.
Residential access.
Herbert Street
Herbert Street runs north-south and intersects with the Pacific Highway in the centre of the study area. The road separates the St Leonards Train station and the Hospital Precinct. High volumes of pedestrians cross Herbert street to access the public transport facilities, hospital precinct and commercial sections.
50 Health, Residential, Commercial, Industry, St Leonards interchange.
Local connector between Artarmon and St Leonards.
Moderate difficulty cycleway.
Night bus route/ rail replacement route.
Community buses.
Chandos Street
Chandos Street runs along the northern border of the study area and provides connectivity from the St Leonards Train Station to the Warringah Freeway via Brook Street. The road intersects with many other major roads such as Oxley Street, Christie and Willoughby Road.
50 Commercial/ Office, Restaurants/ Café, Residential.
Warringah Freeway to Pacific Highway connector.

Future Year Modelling Report St Leonards and Crows Nest Station Precinct Traffic and Transport Study
80018096 | 13 July 2020 | Commercial in Confidence
10
Road Description Posted speed limit (km/h)
Key place uses Key movement uses
Christie Street
Christie Street runs north-south and provides connectivity between Pacific Highway and Chandos Street. The street also provides access to drop off and pick-up areas on the eastern side of the St Leonards Train Station.
50 Commercial. Chandos Street to Pacific Highway connector.
Moderate to hard cycleway.
Albany Street
Albany Street runs east-west and provides connectivity between Pacific Highway to Willoughby Road and Alexander Street.
50 Retail (High Street function near Pacific Highway), Commercial, Residential.
Local access road to Crows Nest. Can be used as an east-west link.
Willoughby Road
The road experiences high volumes of pedestrian movement due to the presence of shops and restaurants. Willoughby Road has several wombat crossing treatments and bus stop blisters.
50
40 in Crows Nest village.
Significant place function. Crows Nest Village high street shopping and dining.
Commercial and residential.
Several north-south bus routes.
Local access.
Alexander Street
Alexander Street is a north-south route and provides access from Pacific Highway to the Warringah Freeway via Chandos / Brook Street. The road also intersects with other major roads such as Falcon Street, Albany Street and also provides access to Willoughby Road.
50 Crows Nest Village high street shopping.
Residential.
North-south local connector.
Falcon Street
Falcon Street is a major east-west route and provides access from Pacific Highway to Miller Street, Warringah Freeway and Military Road. Falcon Street also intersects with Alexander Street and experiences a high volume of pedestrian movements due to the shopping district and public transport stops near Pacific Highway.
60 South end of Crows Nest village.
Residential, education, recreation. Retail pockets at some intersections.
Regional east-west connector.
Freight route.
Several bus routes.
Shirley Road
Shirley Street provides connectivity between Pacific Highway and River Road. 50 Residential Regional east-west connector.
261 bus route.
Hume Street
Hume Street intersects with Pacific Highway and provides access to Willoughby Road via Clarke Street. The road runs along the south-east border of the future Sydney Metro Crows Nest Station site. The road is currently closed due to Sydney Metro Construction activities.
50 Retail, future Crows Nest Metro station access.
Local access.
Oxley Street
Oxley Street intersects with Pacific Highway, Albany Street and Chandos Street. The road runs along the north-west border of the future Sydney Metro Crows Nest Station site.
50 Commercial, retail residential.
Local access.

Future Year Modelling Report St Leonards and Crows Nest Station Precinct Traffic and Transport Study
80018096 | 13 July 2020 | Commercial in Confidence
11
1.5 Modelling Objectives
The purpose of the traffic and transport study is to ensure that transport planning and supporting infrastructure accommodates land use plans across the precinct. For the traffic assessment, Cardno developed a microsimulation model using Aimsun to evaluate the traffic impacts, while examining options to improve pedestrian permeability on the precinct’s transport network. The models allowed a detailed assessment of the interventions proposed in the Draft 2036 Plan and identify opportunities to improve accessibility and reduced congestion.
The main modelling objectives of the study are:
> Evaluation of existing traffic and transport conditions across the precinct to provide insight into the existing performance and highlight current deficiencies
> High level consideration of movement and place objectives as they vary across the road network and precinct;
> Quantify and assess the impact of proposed development on the surrounding transport network
> Investigate the impacts of improved pedestrian crossing opportunities throughout the precinct
> Investigate planned initiatives to support increased pedestrian movement to the planned Crows Nest Metro station,
> Identify infrastructure opportunities to support growth across the precinct
> Identify opportunities to encourage mode shift to active and public transport by implementing parking provision policies and public transport infrastructure improvements
> Provide guidance to DPIE and other state and local agencies regarding the traffic and transport implications for the surrounding area
1.6 Reference Material
1.6.1 Reference documents
The following documents have been referenced throughout the study and in the preparation of this report:
> North District Plan (Greater Sydney Commission, March 2018)
> St Leonards and Crows Nest Economic Feasibility Review (DPIE, March 2018)
> Road Network Plan Report Pacific Highway: Warringah Freeway to Pennant Hills Road (Roads and Maritime Services, May 2018)
> St Leonards and Crows Nest Station Precinct Strategic Transport Study (Cardno, September 2018)
> Draft St Leonards and Crows Nest 2036 Plan (DPIE, October 2018).
1.6.2 Strategic models
Cardno received strategic models from Transport Performance Analytics (TPA):
> St Leonards Sydney Transport Model (STM) Cordon Map (TPA, 23 May 2018)
> Public Transport Project Model (PPTM) (TPA) for:
- 2016 TZP16: TfNSW land use projections (23 May 2018)
- 2026 DPIE project case land use (16 August 2018)
- 2036 DPIE project case land use (16 August 2018).
1.7 Stakeholders
The stakeholders relevant to this study include:
> The Department of Planning, Industry and Environment
> Transport for New South Wales
> NSW Health Infrastructure
> Lane Cove Council
> North Sydney Council
> Willoughby Council.

Future Year Modelling Report St Leonards and Crows Nest Station Precinct Traffic and Transport Study
80018096 | 13 July 2020 | Commercial in Confidence
12
2 Future Year Demand Development
This section outlines the demand development procedure used to estimate the traffic demands for the future horizon years.
2.1 Future Policies
This section provides an overview of the context and rationale behind future policies that will affect the traffic demands in the precinct.
2.1.1 Public transport
Sydney has experienced a surge in population over the past decades. The Greater Sydney Regional Plan – A Metropolis of Three Cities (Greater Sydney Commission, 2018) proposes three major focus centres for Sydney’s future growth and
employment – the Eastern Harbour City, the Central River City (Parramatta) and the Western Parkland City (Campbelltown, Liverpool and Penrith). The Plan envisages that most residents will live within 30 minutes of their jobs, education and health facilities, and other services.
The St Leonards and Crows Nest Precinct is well-serviced by public transport infrastructure. The Draft 2036 Plan aims to make use of the best future transport planning practices to align St Leonards and Crows Nest with the Greater Sydney Commission future strategy for a 30-minute city. The new Crows Nest Metro Station, due for completion in 2024, will leverage the increase in employment opportunities and residential capacity. Growth in the precinct will realise its potential as a major centre in the Eastern Harbour City. Changes to existing land uses in the precinct will increase trips and change travel behaviour. Future demand forecasts are based on a focussed approach to influence commuters towards active and public transport.
The strategic models used for the demand forecasting mechanism (EMME) are maintained by Transport Performance Analytics (TPA). The Sydney Strategic Travel Model (STM) is a planning tool used for generating travel demands and trip distribution. The Public Transport Project Model (PTPM) is a refined mode-choice model used for assessing public transport projects and simplified mode share. The STM projects traffic growth and the PTPM projects public transport mode share and mode shift.
The Crows Nest Metro Station is expected to be the key factor in influencing mode shares within the precinct. The PTPM model outputs suggest that an average increase of four to six per cent for rail mode share is expected following opening.
2.1.2 Active transport
Active transport including walking and cycling are healthy and sustainable modes of travel. They contribute to better social cohesion, reduced traffic congestion, lower road transport costs and improved liveability. The need to encourage pedestrian and active transport within the precinct is paramount to maximising the benefits of Sydney Metro and the Draft 2036 Plan interventions.
The Sydney Coordinated Adaptive Traffic System (SCATS) prioritises road traffic over pedestrians. Adaptive signals are designed to maximise the throughput for cars which usually increases the wait time for pedestrians. This impacts pedestrian level of service and the attractiveness of active transport. Shorter wait times have been shown to encourage more walking, reduce the risk of jaywalking and decrease pedestrian casualties with studies in America, Canada, New Zealand and Europe indicating that the number of illegal crossings by pedestrians increases with average wait times exceeding one minute3. The Draft 2036 Plan includes interventions to maximise all-direction crossing opportunities and green times at signals for active transport users in the precinct.
As part of the base model calibration and validation process, pedestrian crossings points at signalised intersections or zebra crossings were accounted for based on the data available. For signalised intersections, this was quantified by reviewing SCATS historical data to determine the signal phasing adopted and the frequency the pedestrian phases were activated. For zebra crossings, the number of pedestrians (if known) was added to the model and the consequent impact to traffic automatically reproduced by the simulation. For locations where pedestrian flows were not available, the traffic speed was manually reduced in the road segments adjacent to the crossings to account for the overall impact to traffic operation across the two hours. Other types of crossings (such as refuge islands) do not feature pedestrian priority and as such these have no impact to the traffic network.
As part of the development of future year traffic models, it was assumed that pedestrian demands would increase throughout the precinct, especially in the vicinity of the future Sydney Metro station. To account for this, it was conservatively assumed that pedestrian phases at signalised intersections would be called on all traffic signal cycles.
3 Reducing Pedestrian Delay at Half Signals in the City of Portland, OR (City of Portland Bureau of Transportation, n.d.) Reducing Pedestrian Delay at Traffic Signals (NZ Transport Agency, April 2011) Walking Action Plan (Transport for London, July 2018).

Future Year Modelling Report St Leonards and Crows Nest Station Precinct Traffic and Transport Study
80018096 | 13 July 2020 | Commercial in Confidence
13
2.1.3 Parking provision
Limiting parking and/or charging for parking can be a tool to influence private vehicle travel demand, reduce congestion and reinforce sustainable travel goals by facilitating mode shift towards active and public transport modes. This relies on the capacity of the active and public transport network to absorb additional trips, and a willingness by residents, employees and visitors to consider travel modes other than private vehicles.
Projections for development in the precinct show significant growth in employees and residents over the next 20 years. An increase in public and private parking provision proportional to the growth forecasted would place significant strain on the road network. It is expected that policies will need to be implemented to constrain parking provision within new developments to help encourage mode shift.
2.2 Future years and scenarios
Future modelling was undertaken for two horizon years (2026 and 2036) for the AM and PM peak as agreed with DPIE.
2.3 Land Use Assumptions
The initial strategic modelling assessment consisted of comparing TZP16 land use projections and DPIE project case land use assumptions, which have different projections for the planning horizons of 2026 and 2036. The next sections summarise land use information assumed for the traffic and transport study.
2.3.1 SGS Modelling
Modelling completed by SGS for the St Leonards and Crows Nest Economic Feasibility Review (SGS Report March 2018) provides an estimate for the changes to land use demands. SGS have refined the TfNSW 2016 Land Use (TfNSW LU16) model to reflect proposed land use changes in the St Leonards and Crows Nest study precinct in accordance with the ‘high’ jobs target by 2036 as defined in the Great Sydney Commission Draft North District Plan. The SGS project case land use reflects the impacts due to the Sydney Metro project, employment shift and housing distribution.
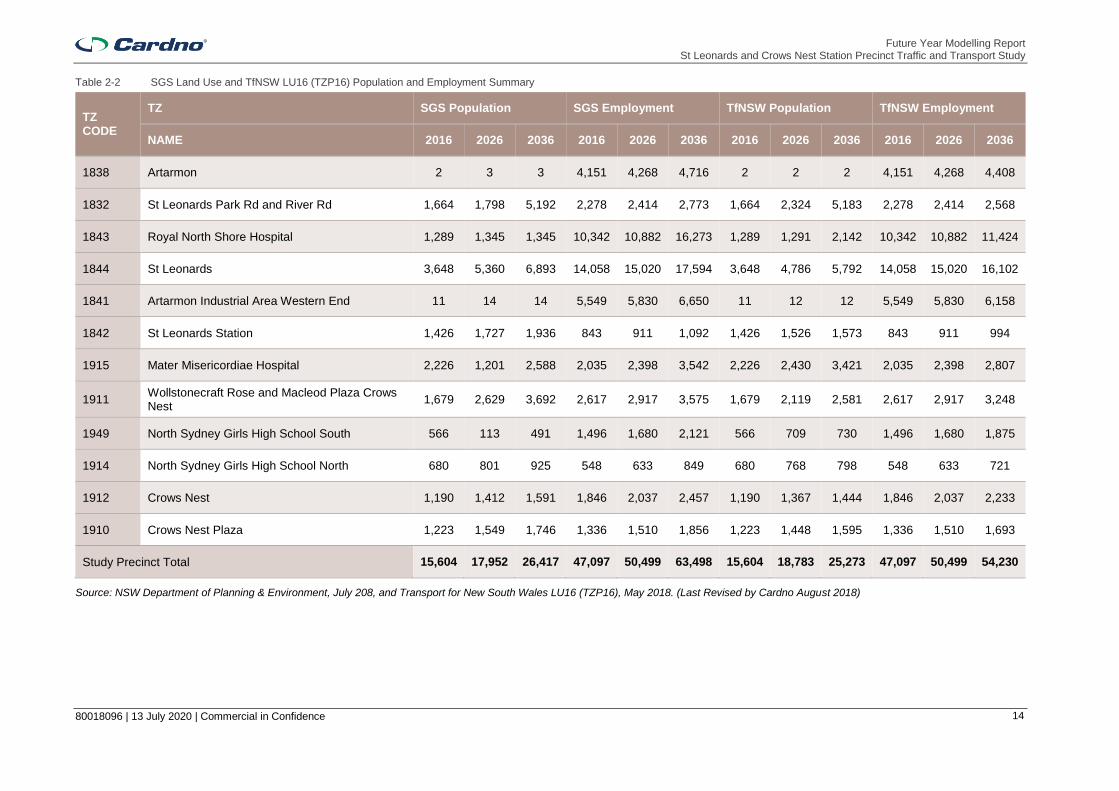
A total of 6,800 new dwellings and approximately 10,000 additional employment opportunities are included in the land use assumptions. A summary comparison (between the SGS forecast and TfNSW LU16) for the study precinct is shown below in Table 2-1. The detailed population and employment breakdown by zone is provided in Table 2-2.
Table 2-1 Comparison between SGS Land Use and TfNSW LU16 (TZP16) Forecasts
Study Precinct Total
2016 2026 2036
SGS TfNSW
LU16 Diff SGS
TfNSW
LU16 Diff SGS
TfNSW
LU16 Diff
Population 15,604 15,604 0 17,952 18,783 -831 26,417 25,273 +1,144
Employment 47,097 47,097 0 50,499 50,499 0 63,498 54,230 +9,268
Compared to the TfNSW LU16 model, the SGS model indicates slower population growth from 2016 to 2026 in the study precinct. A higher growth is expected from 2026 to 2036 with the precinct ultimately containing 1,144 additional residents compared to the TfNSW LU16 forecasted population.
SGS modelling shows no difference in employment volumes and growth compared to TfNSW before 2026. However, beyond 2026, SGS forecast show increased employment across all travel zones in the study precinct with the largest growth occurring at the Royal North Shore Hospital.
The overall comparison of the population and employment demographic by travel zone shows Mater Misericordiae Hospital and North Sydney Girls Highway School population halving by 2026 under the SGS land use assumptions.
Table 2-3 and Table 2-4 show growth per travel zone at the 2026 and 2036 design years as modelled by SGS, and graphically represented in Figure 2-1 and Figure 2-2
Future Year Modelling Report St Leonards and Crows Nest Station Precinct Traffic and Transport Study
80018096 | 13 July 2020 | Commercial in Confidence
14
Table 2-2 SGS Land Use and TfNSW LU16 (TZP16) Population and Employment Summary
TZ CODE
TZ SGS Population SGS Employment TfNSW Population TfNSW Employment
NAME 2016 2026 2036 2016 2026 2036 2016 2026 2036 2016 2026 2036
1838 Artarmon 2 3 3 4,151 4,268 4,716 2 2 2 4,151 4,268 4,408
1832 St Leonards Park Rd and River Rd 1,664 1,798 5,192 2,278 2,414 2,773 1,664 2,324 5,183 2,278 2,414 2,568
1843 Royal North Shore Hospital 1,289 1,345 1,345 10,342 10,882 16,273 1,289 1,291 2,142 10,342 10,882 11,424
1844 St Leonards 3,648 5,360 6,893 14,058 15,020 17,594 3,648 4,786 5,792 14,058 15,020 16,102
1841 Artarmon Industrial Area Western End 11 14 14 5,549 5,830 6,650 11 12 12 5,549 5,830 6,158
1842 St Leonards Station 1,426 1,727 1,936 843 911 1,092 1,426 1,526 1,573 843 911 994
1915 Mater Misericordiae Hospital 2,226 1,201 2,588 2,035 2,398 3,542 2,226 2,430 3,421 2,035 2,398 2,807
1911 Wollstonecraft Rose and Macleod Plaza Crows Nest
1,679 2,629 3,692 2,617 2,917 3,575 1,679 2,119 2,581 2,617 2,917 3,248
1949 North Sydney Girls High School South 566 113 491 1,496 1,680 2,121 566 709 730 1,496 1,680 1,875
1914 North Sydney Girls High School North 680 801 925 548 633 849 680 768 798 548 633 721
1912 Crows Nest 1,190 1,412 1,591 1,846 2,037 2,457 1,190 1,367 1,444 1,846 2,037 2,233
1910 Crows Nest Plaza 1,223 1,549 1,746 1,336 1,510 1,856 1,223 1,448 1,595 1,336 1,510 1,693
Study Precinct Total 15,604 17,952 26,417 47,097 50,499 63,498 15,604 18,783 25,273 47,097 50,499 54,230
Source: NSW Department of Planning & Environment, July 208, and Transport for New South Wales LU16 (TZP16), May 2018. (Last Revised by Cardno August 2018)

Future Year Modelling Report St Leonards and Crows Nest Station Precinct Traffic and Transport Study
80018096 | 13 July 2020 | Commercial in Confidence
15
Figure 2-1 SGS Land Use (Population)
Table 2-3 SGS Land Use Population Growth Rates per Annum
TZ CODE
TZ NAME
Population Growth
2016 - 2026
2016 - 2036
1838 Artarmon 2.5% 1.2%
1832 St Leonards Park Rd and River Rd
0.8% 5.9%
1843 Royal North Shore Hospital
0.4% 0.2%
1844 St Leonards 3.9% 3.2%
1841 Artarmon Industrial Area Western End
2.5% 1.2%
1842 St Leonards Station 1.9% 1.5%
1915 Mater Misericordiae Hospital
-6.0% 0.8%
1911 Wollstonecraft Rose and Macleod Plaza Crows Nest
4.6% 4.0%
1949 North Sydney Girls High School South
-14.9% -0.7%
1914 North Sydney Girls High School North
1.6% 1.5%
1912 Crows Nest 1.7% 1.5%
1910 Crows Nest Plaza 2.4% 1.8%
Study Precinct Total 1.4% 2.7%

Future Year Modelling Report St Leonards and Crows Nest Station Precinct Traffic and Transport Study
80018096 | 13 July 2020 | Commercial in Confidence
16
Figure 2-2 SGS Land Use (Employment)
Table 2-4 SGS Land Use Employment Growth Rates per Annum
TZ CODE
TZ NAME
Employment Growth
2016 - 2026
2016 - 2036
1838 Artarmon 0.3% 0.5%
1832 St Leonards Park Rd and River Rd
0.6% 0.7%
1843 Royal North Shore Hospital
0.5% 2.0%
1844 St Leonards 0.7% 0.8%
1841 Artarmon Industrial Area Western End
0.5% 0.7%
1842 St Leonards Station
0.8% 0.9%
1915 Mater Misericordiae Hospital
1.7% 2.0%
1911 Wollstonecraft Rose and Macleod Plaza Crows Nest
1.1% 1.0%
1949 North Sydney Girls High School South
1.2% 1.2%
1914 North Sydney Girls High School North
1.4% 1.5%
1912 Crows Nest 1.0% 0.9%
1910 Crows Nest Plaza 1.2% 1.0%
Study Precinct Total 1.4% 0.7%
80018096 13 July 2020 | Commercial in Confidence Page 17
2.4 Strategic Models (EMME) Road Network Future Assumptions
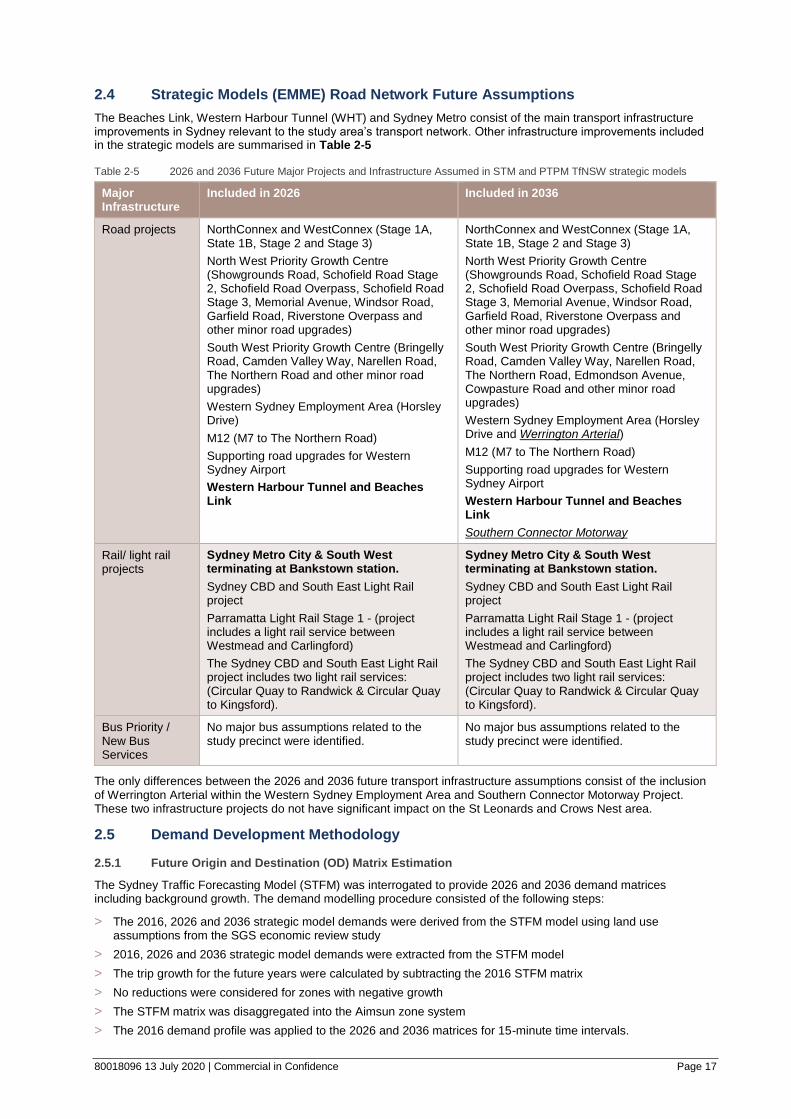
The Beaches Link, Western Harbour Tunnel (WHT) and Sydney Metro consist of the main transport infrastructure improvements in Sydney relevant to the study area’s transport network. Other infrastructure improvements included in the strategic models are summarised in Table 2-5
Table 2-5 2026 and 2036 Future Major Projects and Infrastructure Assumed in STM and PTPM TfNSW strategic models
Major Infrastructure
Included in 2026 Included in 2036
Road projects NorthConnex and WestConnex (Stage 1A, State 1B, Stage 2 and Stage 3)
North West Priority Growth Centre (Showgrounds Road, Schofield Road Stage 2, Schofield Road Overpass, Schofield Road Stage 3, Memorial Avenue, Windsor Road, Garfield Road, Riverstone Overpass and other minor road upgrades)
South West Priority Growth Centre (Bringelly Road, Camden Valley Way, Narellen Road, The Northern Road and other minor road upgrades)
Western Sydney Employment Area (Horsley Drive)
M12 (M7 to The Northern Road)
Supporting road upgrades for Western Sydney Airport
Western Harbour Tunnel and Beaches Link
NorthConnex and WestConnex (Stage 1A, State 1B, Stage 2 and Stage 3)
North West Priority Growth Centre (Showgrounds Road, Schofield Road Stage 2, Schofield Road Overpass, Schofield Road Stage 3, Memorial Avenue, Windsor Road, Garfield Road, Riverstone Overpass and other minor road upgrades)
South West Priority Growth Centre (Bringelly Road, Camden Valley Way, Narellen Road, The Northern Road, Edmondson Avenue, Cowpasture Road and other minor road upgrades)
Western Sydney Employment Area (Horsley Drive and Werrington Arterial)
M12 (M7 to The Northern Road)
Supporting road upgrades for Western Sydney Airport
Western Harbour Tunnel and Beaches Link
Southern Connector Motorway
Rail/ light rail projects
Sydney Metro City & South West terminating at Bankstown station.
Sydney CBD and South East Light Rail project
Parramatta Light Rail Stage 1 - (project includes a light rail service between Westmead and Carlingford)
The Sydney CBD and South East Light Rail project includes two light rail services: (Circular Quay to Randwick & Circular Quay to Kingsford).
Bus Priority / New Bus Services
No major bus assumptions related to the study precinct were identified.
No major bus assumptions related to the study precinct were identified.
The only differences between the 2026 and 2036 future transport infrastructure assumptions consist of the inclusion of Werrington Arterial within the Western Sydney Employment Area and Southern Connector Motorway Project. These two infrastructure projects do not have significant impact on the St Leonards and Crows Nest area.
2.5 Demand Development Methodology
2.5.1 Future Origin and Destination (OD) Matrix Estimation
The Sydney Traffic Forecasting Model (STFM) was interrogated to provide 2026 and 2036 demand matrices including background growth. The demand modelling procedure consisted of the following steps:
> The 2016, 2026 and 2036 strategic model demands were derived from the STFM model using land use assumptions from the SGS economic review study
> 2016, 2026 and 2036 strategic model demands were extracted from the STFM model
> The trip growth for the future years were calculated by subtracting the 2016 STFM matrix
> No reductions were considered for zones with negative growth
> The STFM matrix was disaggregated into the Aimsun zone system
> The 2016 demand profile was applied to the 2026 and 2036 matrices for 15-minute time intervals.

Future Year Modelling Report St Leonards and Crows Nest Station Precinct Traffic and Transport Study
80018096 | 13 July 2020 | Commercial in Confidence
18
The same procedure was completed for both peaks (AM and PM) for light vehicles, rigid trucks and articulated trucks. The procedure is summarised in Figure 2-3.
Figure 2-3 Future Traffic Demand Matrices Estimation Methodology
The STFM OD matrix totals are summarised in Table 2-6.
Table 2-6 STFM OD Matrix Totals (2 Hours)
Demand (vehicles) AM PM
2016 2026 2036 2016 2026 2036
Light Vehicles 29,827 33,637 38,554 32,146 35,180 40,181
Rigid Trucks 1,323 1,703 1,960 943 1,196 1,373
Articulated Trucks 272 342 395 179 220 245
Total 31,421 35,681 40,909 33,268 36,597 41,799
The annual linear growth rates per annum (p.a.) are summarised in Table 2-7.
Table 2-7 STFM OD Matrix Growth Rates
Growth Rate (per annum)
AM PM
2016-2026 (10yr)
2026-2036 (10yr)
2016-2036 (20yr)
2016-2026 (10yr)
2026-2036 (10yr)
2016-2036 (20yr)
Light Vehicles 1.28% 1.46% 1.46% 0.94% 1.42% 1.25%
Rigid Trucks 2.87% 1.51% 2.41% 2.69% 1.48% 2.28%
Articulated Trucks 2.58% 1.56% 2.28% 2.31% 1.11% 1.84%
Total 1.36% 1.47% 1.51% 1.00% 1.42% 1.28%
Future Year Modelling Report St Leonards and Crows Nest Station Precinct Traffic and Transport Study
80018096 | 13 July 2020 | Commercial in Confidence
19
3 Future Network Assumptions
3.1 Future Modelling Years and Scenarios
Cardno proceeded with future modelling investigations following a review of the base model by TfNSW. Two future year scenarios (2026 and 2036) were modelled. The traffic demand for each design year was developed as per the methodology outlined in Section 2. The future years are also in line with the STFM strategic model being utilised
within NSW.
Future year scenarios were assessed with the pre-identified road upgrades under the draft 2036 Plan. Do-nothing and Do-minimum models were not prepared for comparison purposes.
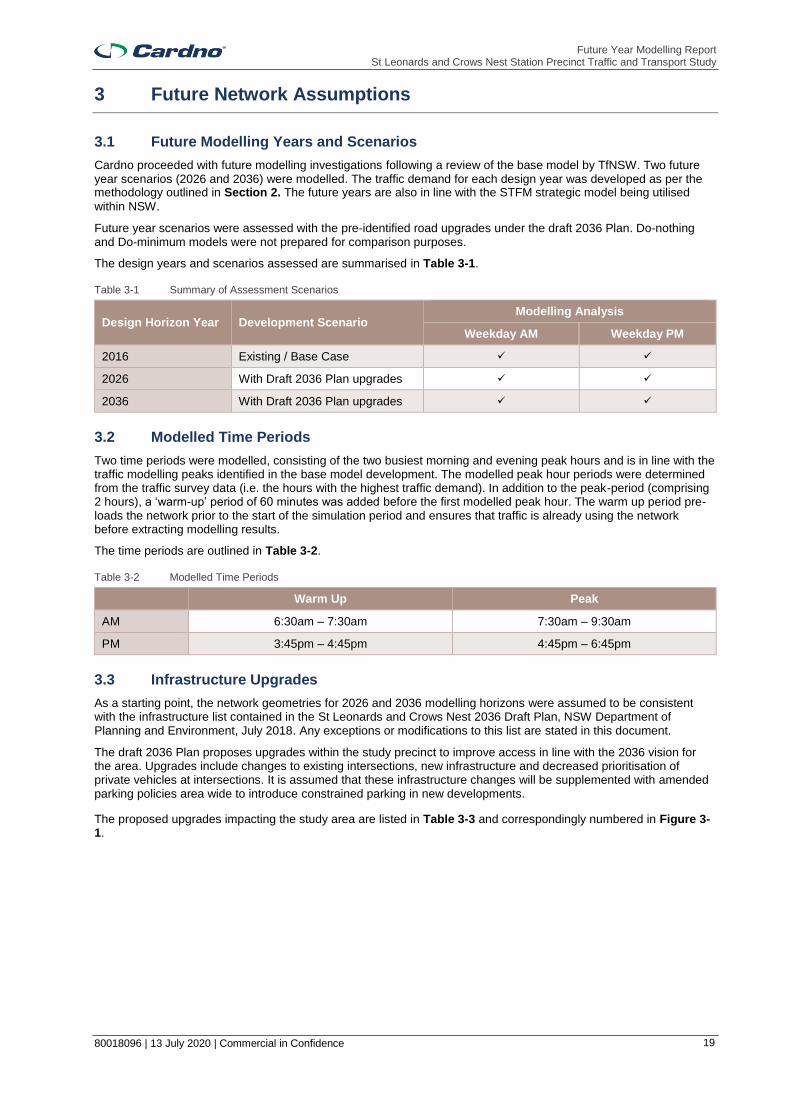
The design years and scenarios assessed are summarised in Table 3-1.
Table 3-1 Summary of Assessment Scenarios
Design Horizon Year Development Scenario Modelling Analysis
Weekday AM Weekday PM
2016 Existing / Base Case
2026 With Draft 2036 Plan upgrades
2036 With Draft 2036 Plan upgrades
3.2 Modelled Time Periods
Two time periods were modelled, consisting of the two busiest morning and evening peak hours and is in line with the traffic modelling peaks identified in the base model development. The modelled peak hour periods were determined from the traffic survey data (i.e. the hours with the highest traffic demand). In addition to the peak-period (comprising 2 hours), a ‘warm-up’ period of 60 minutes was added before the first modelled peak hour. The warm up period pre-loads the network prior to the start of the simulation period and ensures that traffic is already using the network before extracting modelling results.
The time periods are outlined in Table 3-2.
Table 3-2 Modelled Time Periods
Warm Up Peak
AM 6:30am – 7:30am 7:30am – 9:30am
PM 3:45pm – 4:45pm 4:45pm – 6:45pm
3.3 Infrastructure Upgrades
As a starting point, the network geometries for 2026 and 2036 modelling horizons were assumed to be consistent with the infrastructure list contained in the St Leonards and Crows Nest 2036 Draft Plan, NSW Department of Planning and Environment, July 2018. Any exceptions or modifications to this list are stated in this document.
The draft 2036 Plan proposes upgrades within the study precinct to improve access in line with the 2036 vision for the area. Upgrades include changes to existing intersections, new infrastructure and decreased prioritisation of private vehicles at intersections. It is assumed that these infrastructure changes will be supplemented with amended parking policies area wide to introduce constrained parking in new developments.
The proposed upgrades impacting the study area are listed in Table 3-3 and correspondingly numbered in Figure 3-1.

Future Year Modelling Report St Leonards and Crows Nest Station Precinct Traffic and Transport Study
80018096 | 13 July 2020 | Commercial in Confidence
20
Table 3-3 List of Proposed Upgrades in the Model Network
# Location Description
1 Intersection on Herbert Street near RNSH and Railway Bridge.
New Pedestrian Crossing treatment.
2 Intersection of Canberra Avenue and River Road. New signalised intersection and crossing.
3 Intersection of Willoughby Road and Atchison Street.
New pedestrian treatments to existing intersection.
4 Willoughby Road south of Holtermann Street. New pedestrian crossing.
5 Sergeants Lane and Christie Street Intersection. Kerb outstand.
6 Intersection of Oxley Street and Pacific Highway. Pedestrian crossing, north west leg. Introduce a right-turn for south bound vehicles.
7 Intersection of Oxley Street and Nicholson Street. Intersection upgrades for pedestrian and cyclists.
8 Intersection of Nicholson Street and Shirley Road. Provide intersection treatment for pedestrians or cyclists crossing Shirley Road (refuge/signals).
9 Intersection of Chandos Street and Christie Street. Pedestrian crossing treatments.
10 Intersection of Chandos Street and Atchison Street intersections with Mitchell Street.
Pedestrian crossing treatments.
11 Intersection of Chandos Street and Oxley Street. Pedestrian crossing treatments.
12 Intersection of Chandos Street and Willoughby Road.
Pedestrian crossing (signalised), north leg.
13 Pacific Highway near Portview Road. Signalised pedestrian crossing.
14 Intersection of Pacific Highway and Reserve Road. Signalised pedestrian improvement.
15 Intersection of Pacific Highway and Herbert Street. Signalised pedestrian improvement.
16 Intersection of Pacific Highway and Christie Street. Signalised pedestrian improvement.
17 Intersection of Pacific Highway and Albany Street. Signalised pedestrian improvement.
18 Intersection of Pacific Highway, Shirley Road, Willoughby Road and Falcon Street.
Signalised pedestrian improvement.
19 St Leonards Station. Improved pedestrian and cyclist facilities, kiss and ride areas, and taxi zones.
20 Bus stop between Oxley Street and Hume Street (east side).
Relocate bus stops near Sydney Metro Station.
21 Bus stops between Hume Street and Shirley Street (west side).
Consolidate two bus stops near Sydney Metro Station.
22 Intersection of Oxley Street and Clarke Street. New pedestrian crossing.
23 Intersection of Oxley Street and Atchison Street. New pedestrian treatment.
24 Intersection of Oxley Street and Albany Street. New pedestrian crossing legs.

Future Year Modelling Report St Leonards and Crows Nest Station Precinct Traffic and Transport Study
80018096 | 13 July 2020 | Commercial in Confidence
21
Figure 3-1 Future Year Road Network Upgrades Location

Future Year Modelling Report St Leonards and Crows Nest Station Precinct Traffic and Transport Study
80018096 | 13 July 2020 | Commercial in Confidence
22
4 Base Model Operational Results
This section details the modelling results of the base (2016) scenario. Development and calibration results from the base scenarios are documented in the ‘St Leonards Base Model Development Report, May 2020’. The results presented in
this section establishes the base reference case for comparative assessment with future scenarios.
4.1 Data Inputs
The 2016 base model was developed using the following inputs:
> Traffic signal operations (cycle times, phase times and offsets) based on SCATS History Files, SCATS Region LX file
> Peak hour volume data from intersection traffic survey counts from Thursday 17th November 2016 and supplemented with data from Tuesday 15th May 2018
> Travel time data obtained from TomTom Traffic Statistics
> Public transport operations obtained from the GTFS Feed.
4.2 Model Specifications and Assumptions
The traffic model was developed to replicate the road conditions observed at the time of the data collection. The settings and parameters of the 2016 base model are as follows:
> Aimsun version 8.4.0 Thu May 2019 (afba3b3059 x64 Python 2) was used to develop the St Leonards microsimulation model
> The vehicle experiment results were calculated from SRC using vehicle paths derived from the DUE assignment
> Signals were coded as actuated using timings derived from provided SCATS data
> The peak hours were identified using survey data and the peak hours are:
- AM 2-hour peak: 7:30am to 9:30am
- PM 2-hour peak: 4:45pm to 5:45pm

Future Year Modelling Report St Leonards and Crows Nest Station Precinct Traffic and Transport Study
80018096 | 13 July 2020 | Commercial in Confidence
23
4.3 Existing Conditions Performance
4.3.1 Network Statistics
The network statistics for the calibrated/validated 2016 base model are shown in Table 4-1. The network performance
indicates that the AM peak is currently the more critical peak with a higher volume of vehicles.
Table 4-1 Base Model Network Performance
Network Performance Measurements 2016 Base Model
AM Peak PM Peak
All vehicles
Total traffic demand (vehicles) 25,781 21,141
Total vehicle kilometres travelled in network (kilometres) 39,635 39,555
Total vehicle travel time (hours) 1,915 1,796
Total delay (hours) 1,165 1,043
Total vehicles arrived 24,991 20,499
Total number of stops 68,962 96,335
Average per vehicle in network
Average vehicle kilometres travelled in network (kilometres) 1.6 1.9
Average time travelled in network(minutes) 4.6 5.3
Average number of stops 2.8 4.7
Average speed (kilometres per hour) 24.9 26.6
Unreleased vehicles
Unreleased demand (vehicles) 7 4
Per cent of total traffic demand 0% 0%
Future Year Modelling Report St Leonards and Crows Nest Station Precinct Traffic and Transport Study
80018096 | 13 July 2020 | Commercial in Confidence
24
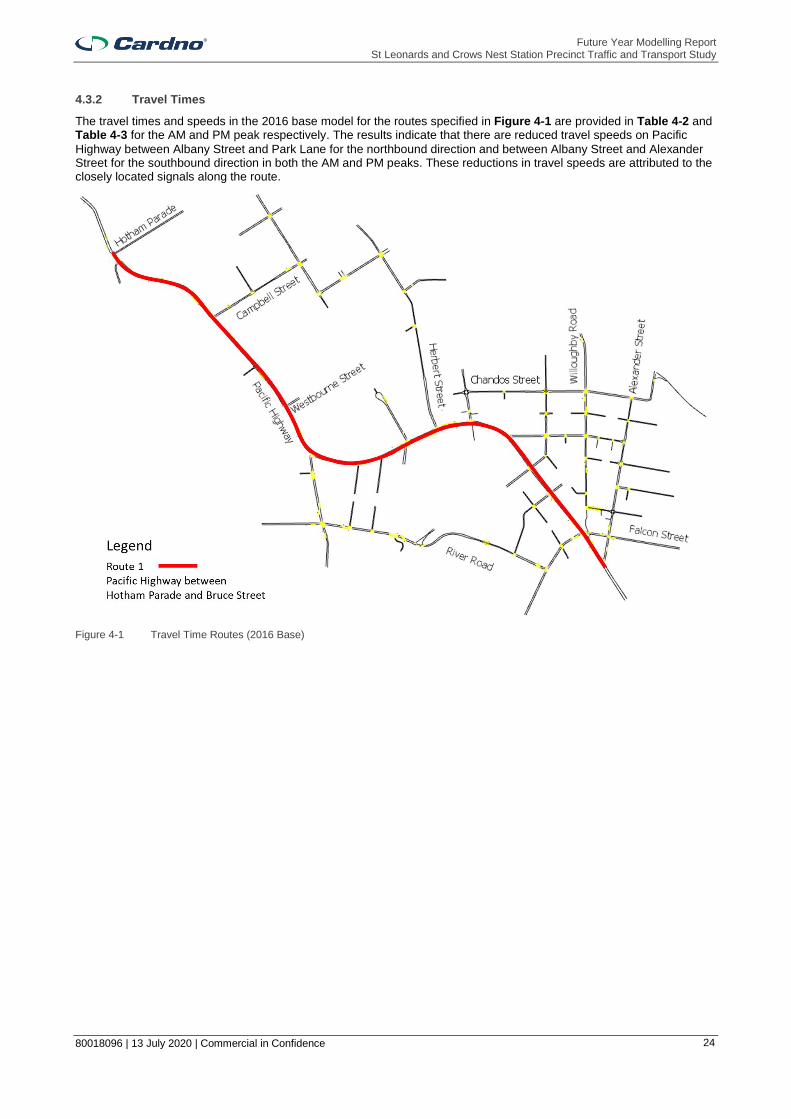
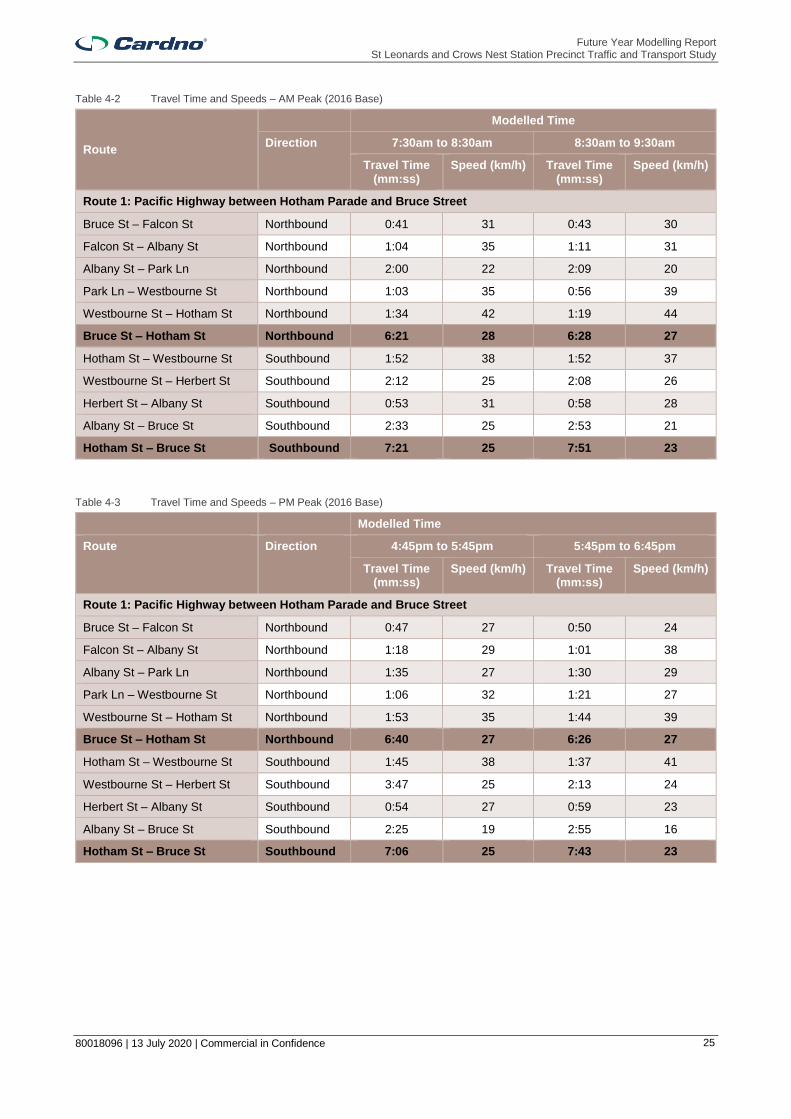
4.3.2 Travel Times
The travel times and speeds in the 2016 base model for the routes specified in Figure 4-1 are provided in Table 4-2 and Table 4-3 for the AM and PM peak respectively. The results indicate that there are reduced travel speeds on Pacific
Highway between Albany Street and Park Lane for the northbound direction and between Albany Street and Alexander Street for the southbound direction in both the AM and PM peaks. These reductions in travel speeds are attributed to the closely located signals along the route.
Figure 4-1 Travel Time Routes (2016 Base)
Future Year Modelling Report St Leonards and Crows Nest Station Precinct Traffic and Transport Study
80018096 | 13 July 2020 | Commercial in Confidence
25
Table 4-2 Travel Time and Speeds – AM Peak (2016 Base)
Route
Modelled Time
Direction 7:30am to 8:30am 8:30am to 9:30am
Travel Time (mm:ss)
Speed (km/h) Travel Time (mm:ss)
Speed (km/h)
Route 1: Pacific Highway between Hotham Parade and Bruce Street
Bruce St – Falcon St Northbound 0:41 31 0:43 30
Falcon St – Albany St Northbound 1:04 35 1:11 31
Albany St – Park Ln Northbound 2:00 22 2:09 20
Park Ln – Westbourne St Northbound 1:03 35 0:56 39
Westbourne St – Hotham St Northbound 1:34 42 1:19 44
Bruce St – Hotham St Northbound 6:21 28 6:28 27
Hotham St – Westbourne St Southbound 1:52 38 1:52 37
Westbourne St – Herbert St Southbound 2:12 25 2:08 26
Herbert St – Albany St Southbound 0:53 31 0:58 28
Albany St – Bruce St Southbound 2:33 25 2:53 21
Hotham St – Bruce St Southbound 7:21 25 7:51 23
Table 4-3 Travel Time and Speeds – PM Peak (2016 Base)
Modelled Time
Route Direction 4:45pm to 5:45pm 5:45pm to 6:45pm
Travel Time (mm:ss)
Speed (km/h) Travel Time (mm:ss)
Speed (km/h)
Route 1: Pacific Highway between Hotham Parade and Bruce Street
Bruce St – Falcon St Northbound 0:47 27 0:50 24
Falcon St – Albany St Northbound 1:18 29 1:01 38
Albany St – Park Ln Northbound 1:35 27 1:30 29
Park Ln – Westbourne St Northbound 1:06 32 1:21 27
Westbourne St – Hotham St Northbound 1:53 35 1:44 39
Bruce St – Hotham St Northbound 6:40 27 6:26 27
Hotham St – Westbourne St Southbound 1:45 38 1:37 41
Westbourne St – Herbert St Southbound 3:47 25 2:13 24
Herbert St – Albany St Southbound 0:54 27 0:59 23
Albany St – Bruce St Southbound 2:25 19 2:55 16
Hotham St – Bruce St Southbound 7:06 25 7:43 23

Future Year Modelling Report St Leonards and Crows Nest Station Precinct Traffic and Transport Study
80018096 | 13 July 2020 | Commercial in Confidence
26
4.3.3 Density
The density plots for the 2016 base model are shown in Figure 4-2 and Figure 4-3 for the AM and PM peak. The densities are calculated and represented based on “vehicles per kilometre’.
Figure 4-2 Density Plot – AM Peak (2016)
Figure 4-3 Density Plot – PM Peak (2016)

Future Year Modelling Report St Leonards and Crows Nest Station Precinct Traffic and Transport Study
80018096 | 13 July 2020 | Commercial in Confidence
27
5 Future Year Operational Results
5.1 Inputs and Assumptions
The 2026 and 2036 future year models were developed using the 2016 model as a base. Traffic demand was increased to reflect the forecasted land use changes within the precinct and background traffic growth.
5.1.1 Demand Input
The 2026 and 2036 future models contain traffic growth on top of the 2016 base model demands. The methodology used to estimate the traffic growth is detailed in Section 2. The total number of trips for each scenario (for the full 2 hours) is summarised in Figure 5-1.
Figure 5-1 Traffic Demands
5.1.2 Public Transport
It has been assumed that the bus services and frequencies in the future year scenarios remain unchanged from the 2016 base model.
5.1.3 Road Network
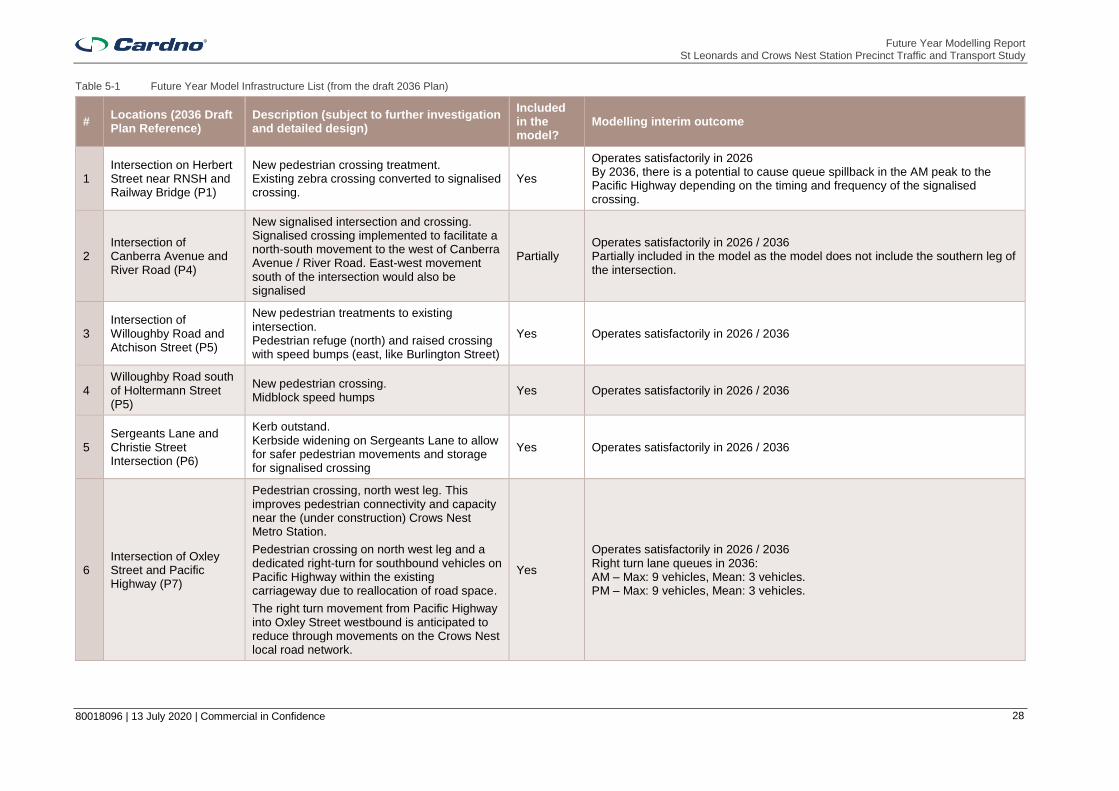
The 2026 and 2036 future model network were modified to include the 2036 Draft Plan infrastructure upgrades as outlined in Section 3.3. Some upgrades were not included in the model as there was no impact to the traffic network or insufficient detail was available. The list of upgrades and commentary for each intervention is summarised in Table 5-1 and the locations shown in Figure 5-2. Tables 5-2 to 5-13 illustrate each of the upgrades included in the 2026 model.
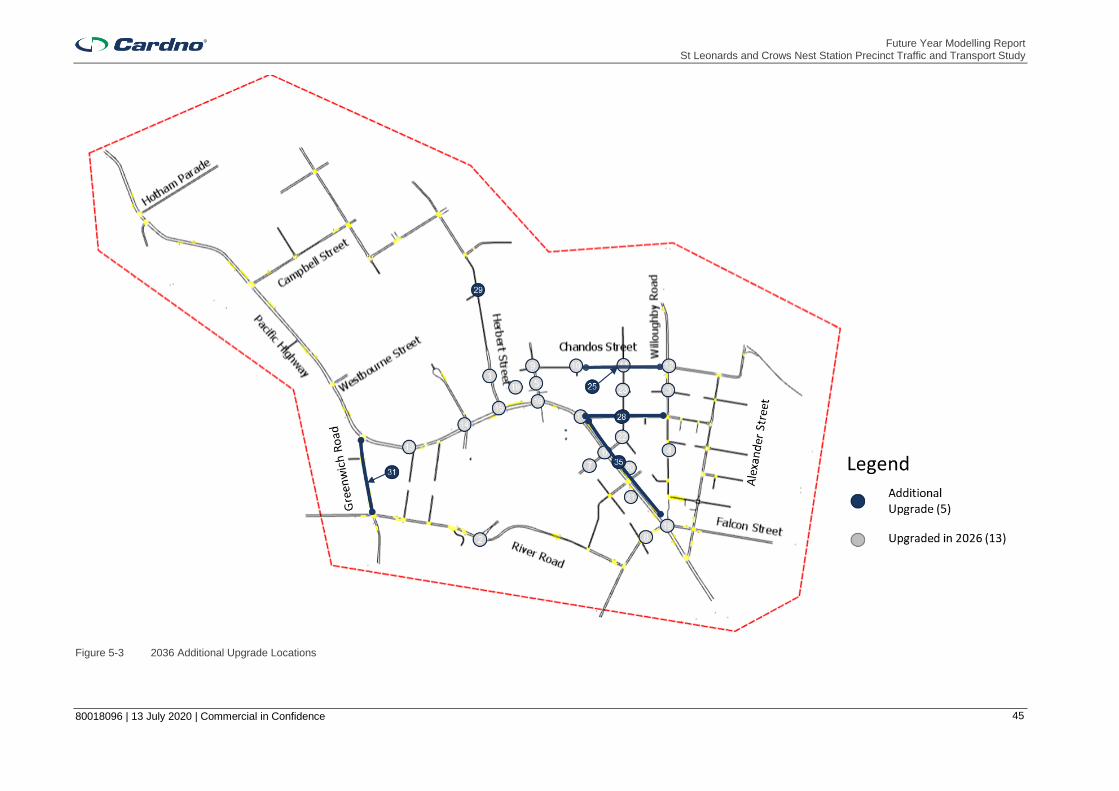
Further upgrades for the 2036 network were required, in addition to the 2036 Draft Plan, in order to accommodate the 2036 traffic demand. These upgrades are summarised in Table 5-14 and the locations shown in Figure 5-3. Table 5-15 to 5-19 illustrate each of the upgrades included in the 2036 model.
Future Year Modelling Report St Leonards and Crows Nest Station Precinct Traffic and Transport Study
80018096 | 13 July 2020 | Commercial in Confidence
28
Table 5-1 Future Year Model Infrastructure List (from the draft 2036 Plan)
# Locations (2036 Draft Plan Reference)
Description (subject to further investigation and detailed design)
Included in the model?
Modelling interim outcome
1 Intersection on Herbert Street near RNSH and Railway Bridge (P1)
New pedestrian crossing treatment. Existing zebra crossing converted to signalised crossing.
Yes
Operates satisfactorily in 2026 By 2036, there is a potential to cause queue spillback in the AM peak to the Pacific Highway depending on the timing and frequency of the signalised crossing.
2 Intersection of Canberra Avenue and River Road (P4)
New signalised intersection and crossing. Signalised crossing implemented to facilitate a north-south movement to the west of Canberra Avenue / River Road. East-west movement south of the intersection would also be signalised
Partially Operates satisfactorily in 2026 / 2036 Partially included in the model as the model does not include the southern leg of the intersection.
3 Intersection of Willoughby Road and Atchison Street (P5)
New pedestrian treatments to existing intersection. Pedestrian refuge (north) and raised crossing with speed bumps (east, like Burlington Street)
Yes Operates satisfactorily in 2026 / 2036
4 Willoughby Road south of Holtermann Street (P5)
New pedestrian crossing. Midblock speed humps
Yes Operates satisfactorily in 2026 / 2036
5 Sergeants Lane and Christie Street Intersection (P6)
Kerb outstand. Kerbside widening on Sergeants Lane to allow for safer pedestrian movements and storage for signalised crossing
Yes Operates satisfactorily in 2026 / 2036
6 Intersection of Oxley Street and Pacific Highway (P7)
Pedestrian crossing, north west leg. This improves pedestrian connectivity and capacity near the (under construction) Crows Nest Metro Station.
Pedestrian crossing on north west leg and a dedicated right-turn for southbound vehicles on Pacific Highway within the existing carriageway due to reallocation of road space.
The right turn movement from Pacific Highway into Oxley Street westbound is anticipated to reduce through movements on the Crows Nest local road network.
Yes
Operates satisfactorily in 2026 / 2036 Right turn lane queues in 2036: AM – Max: 9 vehicles, Mean: 3 vehicles. PM – Max: 9 vehicles, Mean: 3 vehicles.

Future Year Modelling Report St Leonards and Crows Nest Station Precinct Traffic and Transport Study
80018096 | 13 July 2020 | Commercial in Confidence
29
# Locations (2036 Draft Plan Reference)
Description (subject to further investigation and detailed design)
Included in the model?
Modelling interim outcome
7 Intersection of Oxley Street and Nicholson St (P7)
Intersection upgrades for pedestrians and cyclists. Midblock elevated speed bumps
Yes Operates satisfactorily in 2026 / 2036
8 Intersection of Nicholson Street and Shirley Road (P8)
Provide intersection treatment for pedestrians or cyclists crossing Shirley Road (refuge/signals). Elevated crossing and speed bumps on Shirley North Approach, after the keep clear area
No A zebra crossing on Shirley Road is not legally possible given its four lane cross section. A signalised crossing would be difficult to coordinate with the Pacific Highway / Falcon Street intersection, adjacent driveways and intersections.
9 Intersection of Chandos Street and Christie Street (P10)
Pedestrian crossing treatments. Upgrade roundabout to signals and allow pedestrian crossing
No
There is no net traffic improvement by implementing signals as the queues regularly extend from the Pacific Highway to this intersection and beyond. Signalising the intersection may require land acquisition for a small benefit to pedestrians and no benefit to the traffic network.
10
Chandos Street and Atchison St intersections with Mitchell Street (P10)
Pedestrian crossing treatments. The full extent of Mitchell Street is not included in the model due to the corridor function (local road typically accommodating low volumes).
No It is noted that the upgrade has been recently installed and is already operational. No traffic issues anticipated as forecast volumes on Mitchell are likely to cope with this infrastructure change
11 Intersection of Chandos Street and Oxley Street (P10)
Pedestrian crossing treatments. Refuge on north and south approaches can be considered subject to parking bans
No Refuge islands would maintain priority for vehicles over pedestrians and therefore there is no impact to the traffic network.
12 Intersection of Chandos Street and Willoughby Road (P10)
Pedestrian crossing (signalised), north leg. Yes
The intersection is already experiencing delays and failing to perform at acceptable LOS at present. The introduction of the additional pedestrian crossing constrains signal phasing time allocated to traffic. Some deterioration of existing performance is prevalent due to the additional pedestrian phase and increased volumes but the crossing can be accommodated without causing the intersection to fail.
13 Pacific Highway near Portview Road (R1)
Signalised pedestrian crossing. Yes Operates satisfactorily in 2026 / 2036
14 Intersection of Pacific Highway and Reserve Road (R2)
Signalised pedestrian improvement. Signalised pedestrian crossing on the west approach.
No
Not implemented as it is not feasible to add new crossing on eastern side given the congestion and traffic volumes using this intersection. New pedestrian crossing on eastern side would require changes to the signal phasing reducing green time on Pacific Highway and/or Reserve Road.
15 Intersection of Pacific Highway and Herbert Street (R3)
Signalised pedestrian improvement. Signalised pedestrian crossing on the east approach.
No Not implemented as the model indicates that the additional crossing on eastern side would not be feasible due to the traffic volumes. The crossing would require significant changes to the signal phasing and reduce time for traffic.

Future Year Modelling Report St Leonards and Crows Nest Station Precinct Traffic and Transport Study
80018096 | 13 July 2020 | Commercial in Confidence
30
# Locations (2036 Draft Plan Reference)
Description (subject to further investigation and detailed design)
Included in the model?
Modelling interim outcome
16 Intersection of Christie and Pacific Highway (R4)
Signalised pedestrian improvement. Pedestrian and cycleway crossing on the west approach
No Not implemented as an additional western crossing would not be feasible as it would impact signal timing, reducing time for traffic on Christie Street or Pacific Highway.
17 Intersection of Pacific Highway and Albany Street (R5)
Signalised pedestrian improvement. Kerb widening on Albany Street to shorten crossing distance
No
More information is required to model the suggested kerb extension (outstand). The intersection may support a small kerbside extension on the north side of Albany St by approximately 2m. Traffic turning into Albany Street already use this section as “wide single lane”. However, the feasibility of the kerb extension is subject to a swept path analysis to confirm that heavy vehicles would be able to safely turn into Albany Street. No impact to traffic flows.
18 Intersection of Pacific Highway, Shirley Road, and Falcon Street (R7)
Signalised pedestrian improvement. Alteration of five-way intersection to support vehicular traffic movement.
No
Layout for proposed geometry and treatments are required. This intersection is part of a complex coordination with two other intersections in close proximity to each other and is constrained and causing significant congestion on Falcon Street and Shirley Road. Consideration should be given to upgrading this intersection as it constitutes the main pinch point for traffic within the modelled network. However, it is not clear what a feasible upgrade would consist of.
19 St Leonards Station (6) Improved pedestrian and cyclist facilities, kiss and ride areas, and taxi zones.
No
No impacts to the traffic network are anticipated provided that these upgrades are delivered via changes to kerb side parking regulations (e.g. – taxi zones / kiss and ride zones) or improvements to pedestrian and cycling infrastructure next to the station (i.e. – no change to the road network).
20 Bus stop between Oxley Street and Hume Street (east side) (1)
Relocate bus stops near Sydney Metro Station.
No Small capacity improvements to traffic would be achieved in the model. It has not been included in the model conservatively to account for the potential increase in bus stoppage time from increased patrons due to Sydney Metro.
21
Bus stops between Hume Street and Shirley Street (west side) (2)
Consolidate two bus stops near Sydney Metro Station.
No As above
22 Intersection of Oxley Street and Clarke Street (8)
New pedestrian crossing. Raised pedestrian crossing with speed bumps all approaches
Yes Operates satisfactorily in 2026 / 2036
23 Intersection of Oxley Street and Atchison Street (9)
New pedestrian treatment. Raised pedestrian crossing with speed bumps all approaches
Yes Operates satisfactorily in 2026 / 2036
24 Intersection of Oxley Street and Albany Street (7)
New pedestrian crossing legs. Elevated pedestrian crossing with speed bumps all approaches
Yes Already existing. Operates satisfactorily in 2026

Future Year Modelling Report St Leonards and Crows Nest Station Precinct Traffic and Transport Study
80018096 | 13 July 2020 | Commercial in Confidence
31
Figure 5-2 Future Model Infrastructure Upgrade Locations

Future Year Modelling Report St Leonards and Crows Nest Station Precinct Traffic and Transport Study
80018096 | 13 July 2020 | Commercial in Confidence
32
Table 5-2 Upgrade #1 – Herbert Street

Future Year Modelling Report St Leonards and Crows Nest Station Precinct Traffic and Transport Study
80018096 | 13 July 2020 | Commercial in Confidence
33
Table 5-3 Upgrade #2 – Canberra Avenue / River Road

Future Year Modelling Report St Leonards and Crows Nest Station Precinct Traffic and Transport Study
80018096 | 13 July 2020 | Commercial in Confidence
34
Table 5-4 Upgrade #3 – Willoughby Road / Atchison Street

Future Year Modelling Report St Leonards and Crows Nest Station Precinct Traffic and Transport Study
80018096 | 13 July 2020 | Commercial in Confidence
35
Table 5-5 Upgrade #4 – Willoughby Rd (south of Holtermann St)

Future Year Modelling Report St Leonards and Crows Nest Station Precinct Traffic and Transport Study
80018096 | 13 July 2020 | Commercial in Confidence
36
Table 5-6 Upgrade #5 – Sergeants Lane and Christie Street Intersection

Future Year Modelling Report St Leonards and Crows Nest Station Precinct Traffic and Transport Study
80018096 | 13 July 2020 | Commercial in Confidence
37
Table 5-7 Upgrade #6 – Oxley Street / Pacific Highway

Future Year Modelling Report St Leonards and Crows Nest Station Precinct Traffic and Transport Study
80018096 | 13 July 2020 | Commercial in Confidence
38
Table 5-8 Upgrade #7 – Oxley Street / Nicholson Street

Future Year Modelling Report St Leonards and Crows Nest Station Precinct Traffic and Transport Study
80018096 | 13 July 2020 | Commercial in Confidence
39
Table 5-9 Upgrade #12 – Chandos Street / Willoughby Street

Future Year Modelling Report St Leonards and Crows Nest Station Precinct Traffic and Transport Study
80018096 | 13 July 2020 | Commercial in Confidence
40
Table 5-10 Upgrade #13 – Pacific Highway near Portview Rd

Future Year Modelling Report St Leonards and Crows Nest Station Precinct Traffic and Transport Study
80018096 | 13 July 2020 | Commercial in Confidence
41
Table 5-11 Upgrade #22 – Oxley Street / Clarke Street

Future Year Modelling Report St Leonards and Crows Nest Station Precinct Traffic and Transport Study
80018096 | 13 July 2020 | Commercial in Confidence
42
Table 5-12 Upgrade #23 – Oxley Street / Atchison Street

Future Year Modelling Report St Leonards and Crows Nest Station Precinct Traffic and Transport Study
80018096 | 13 July 2020 | Commercial in Confidence
43
Table 5-13 Upgrade #24 – Oxley Street / Albany Street

Future Year Modelling Report St Leonards and Crows Nest Station Precinct Traffic and Transport Study
80018096 | 13 July 2020 | Commercial in Confidence
44
Table 5-14 2036 Additional Upgrades
# Locations Description Upgrade Rationale
25 Chandos Street between Oxley and Willoughby Road
Dual westbound lanes along Chandos Street from Willoughby Road to Mitchell Street (including a dual circulating lane for the westbound direction of the roundabout). This will require the removal of parking in the AM peak (consideration could be given to retain parking in the PM)
There is a heavy westbound traffic in the AM peak along Chandos Street. Without the proposed upgrade, this results in a queue spill back extending as far as the Warringah Freeway interchange and surrounding local roads.
28 Intersection of Oxley Street and Albany Street
Upgrade of the intersection from roundabout to signals. Parking banned between Pacific Highway and Willoughby Road to enable two lanes in each direction. Modifications to the kerbside geometry will be required.
The pedestrian crossings and traffic volume at the roundabout would cause queue spillback into Pacific Highway on the Oxley Street and Albany Street approaches. This would result in significant delays along Pacific Highway. Signalising the intersection will also improve pedestrian access and safety to cater for 2036 traffic conditions. Appropriate green time can be allocated to all traffic movements and pedestrian phases and balanced accordingly (in contrast with an unregulated flow of pedestrians, increased to the proximity to the Metro station, with priority over vehicles)
29 Short lane for the right turn into RNSH on Herbert Street
Removal of 30m of parking in the AM peak to allow for southbound through vehicles to go around right turning vehicles. Parking can be retained in the PM peak.
Herbert Street serves as a critical north-south corridor in 2036. High volumes of northbound traffic cause difficulty for southbound right turning accessing RNSH. Without the dedicated right turn bay, southbound right turning vehicles are likely to block southbound traffic.
31
Greenwich Road midblock between River Road and Pacific Highway
Parking bans in the northbound direction on Greenwich Road in the PM peak. Subject to a road safety assessment on vertical alignment and speeds. There is considerable congestion on Pacific Highway in the AM peak, reducing the effectiveness of the parking bans if it was introduced in the AM peak as well.
Due to the long cycle times at the Greenwich Road / Pacific Highway, storage on Greenwich Road becomes a critical factor in preventing queues from spilling across Greenwich Road / River Road intersection. The removal of parking greatly increases storage capacity of the road in addition to improving queue recovery. Consideration can be given to retain parking in the AM peak.
35 Pacific Highway Clearway
Southbound Clearway along Pacific Highway between Albany Street and Falcon Street (PM peak)
The Clearway would facilitate increased throughput of the intersections along Pacific Highway and would allow for reallocation of green time at the traffic signals for a balance between pedestrian crossings/ side road movement and the highway.
Future Year Modelling Report St Leonards and Crows Nest Station Precinct Traffic and Transport Study
80018096 | 13 July 2020 | Commercial in Confidence
45
Figure 5-3 2036 Additional Upgrade Locations

Future Year Modelling Report St Leonards and Crows Nest Station Precinct Traffic and Transport Study
80018096 | 13 July 2020 | Commercial in Confidence
46
Table 5-15 Upgrade #25 – Chandos Street / Oxley Street

Future Year Modelling Report St Leonards and Crows Nest Station Precinct Traffic and Transport Study
80018096 | 13 July 2020 | Commercial in Confidence
47
Table 5-16 Upgrade #28 – Oxley Street / Albany Street

Future Year Modelling Report St Leonards and Crows Nest Station Precinct Traffic and Transport Study
80018096 | 13 July 2020 | Commercial in Confidence
48
Table 5-17 Upgrade #29 – Herbert Street / Westbourne Street

Future Year Modelling Report St Leonards and Crows Nest Station Precinct Traffic and Transport Study
80018096 | 13 July 2020 | Commercial in Confidence
49
Table 5-18 Upgrade #31 – Greenwich Road

Future Year Modelling Report St Leonards and Crows Nest Station Precinct Traffic and Transport Study
80018096 | 13 July 2020 | Commercial in Confidence
50
Table 5-19 Upgrade #35 – Pacific Highway Clearway

Future Year Modelling Report St Leonards and Crows Nest Station Precinct Traffic and Transport Study
80018096 | 13 July 2020 | Commercial in Confidence
51
5.2 2026 Performance
5.2.1 Network Statistics (2026)
The network statistics for the 2026 future model are summarised in Table 5-20.
Table 5-20 Network Performance Results (2026)
Network Performance Measurements 2026 Model
AM Peak PM Peak
All vehicles
Total traffic demand (vehicles) 28,993 22,635
Total vehicle kilometres travelled in network (kilometres) 42,695 42,438
Total vehicle travel time (hours) 2,634 2,406
Total delay (hours) 1,936 1,734
Total vehicles arrived 27,439 21,048
Total number of stops 108,778 97,555
Average per vehicle in network
Average vehicle kilometres travelled in network (kilometres)
1.6 2.0
Average time travelled in network(minutes) 5.8 6.9
Average number of stops 4.0 4.6
Average speed (kilometres per hour) 20.2 22.8
Unreleased vehicles
Unreleased demand (vehicle) 340 537
Per cent of total traffic demand 1.2% 2.4%

Future Year Modelling Report St Leonards and Crows Nest Station Precinct Traffic and Transport Study
80018096 | 13 July 2020 | Commercial in Confidence
52
5.2.2 Travel Times and Speed (2026)
The travel times and speeds for the 2026 model are provided in Table 5-21 and Table 5-22 for the AM and PM peak
respectively.
Table 5-21 Travel Time and Speeds – AM Peak (2026)
Modelled Time
Route Direction 7:30am to 8:30am 8:30am to 9:30am
Travel Time (mm:ss)
Speed (km/h) Travel Time (mm:ss)
Speed (km/h)
Route 1: Pacific Highway between Hotham Parade and Bruce Street
Bruce St – Falcon St Northbound 0:43 30 0:42 31
Falcon St – Albany St Northbound 1:08 33 1:08 38
Albany St – Park Ln Northbound 1:57 21 2:25 18
Park Ln – Westbourne St Northbound 1:27 26 1:06 34
Westbourne St – Hotham St Northbound 1:36 41 1:43 40
Bruce St – Hotham St Northbound 6:51 26 7:04 25
Hotham St – Westbourne St Southbound 1:51 37 1:54 36
Westbourne St – Herbert St Southbound 2:49 18 4:37 12
Herbert St – Albany St Southbound 0:54 30 1:03 27
Albany St – Bruce St Southbound 2:00 29 2:38 22
Hotham St – Bruce St Southbound 7:36 23 10:13 17
Table 5-22 Travel Time and Speeds – PM Peak (2026)
Modelled Time
Route Direction 4:45pm to 5:45pm 5:45pm to 6:45pm
Travel Time (mm:ss)
Speed (km/h) Travel Time (mm:ss)
Speed (km/h)
Route 1: Pacific Highway between Hotham Parade and Bruce Street
Bruce St – Falcon St Northbound 0:49 26 1:00 18
Falcon St – Albany St Northbound 1:27 25 1:37 27
Albany St – Park Ln Northbound 1:29 30 1:44 26
Park Ln – Westbourne St Northbound 1:26 25 1:18 28
Westbourne St – Hotham St Northbound 2:04 32 1:52 37
Bruce St – Hotham St Northbound 7:15 25 7:31 23
Hotham St – Westbourne St Southbound 1:45 38 1:39 40
Westbourne St – Herbert St Southbound 1:58 26 2:03 28
Herbert St – Albany St Southbound 0:55 26 1:04 21
Albany St – Bruce St Southbound 2:40 17 3:25 13
Hotham St – Bruce St Southbound 7:19 24 8:12 21

Future Year Modelling Report St Leonards and Crows Nest Station Precinct Traffic and Transport Study
80018096 | 13 July 2020 | Commercial in Confidence
53
5.2.3 Density (2026)
The density plots for the 2026 model are shown in Figure 5-4 and Figure 5-5 for the AM and PM Peak.
Figure 5-4 Density Plot – AM Peak (2026)
Figure 5-5 Density Plot – PM Peak (2026)

Future Year Modelling Report St Leonards and Crows Nest Station Precinct Traffic and Transport Study
80018096 | 13 July 2020 | Commercial in Confidence
54
5.3 2036 Performance
5.3.1 Network Statistics (2036)
The network statistics for the 2036 scenario are summarised in Table 5-23.
Table 5-23 Network Performance Results (2036)
Network Performance Measurements 2036 Model
AM Peak PM Peak
All vehicles
Total traffic demand (vehicles) 33,826 26,178
Total vehicle kilometres travelled in network (kilometres) 43,407 44,590
Total vehicle travel time (hours) 3,304 3,445
Total delay (hours) 2,761 2,923
Total vehicles arrived 28,149 21,493
Total number of stops 122,499 130,779
Average per vehicle in network
Average vehicle kilometres travelled in network (kilometres) 1.5 2.1
Average time travelled in network(minutes) 7.0 9.6
Average number of stops 4.4 6.1
Average speed (kilometres per hour) 18.7 19.11
Unreleased vehicles
Unreleased demand (vehicles) 3,853 2,709
Per cent of total traffic demand 11.4% 10.3%
Future Year Modelling Report St Leonards and Crows Nest Station Precinct Traffic and Transport Study
80018096 | 13 July 2020 | Commercial in Confidence
55
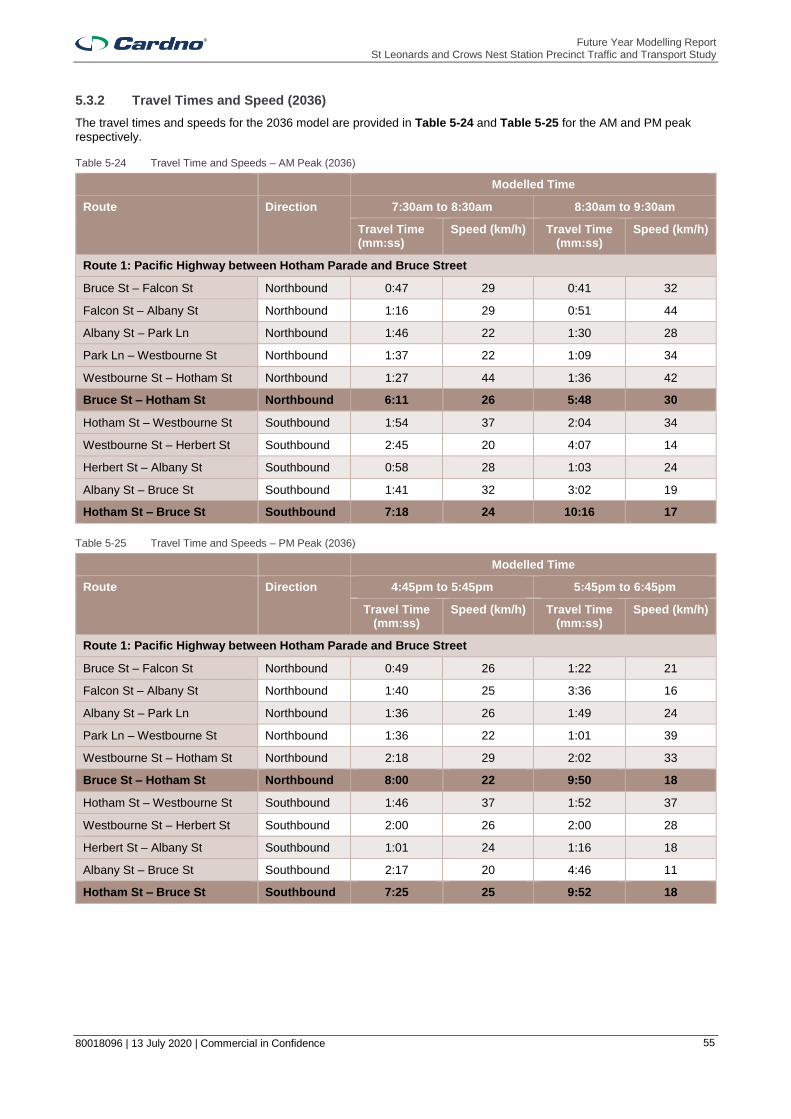
5.3.2 Travel Times and Speed (2036)
The travel times and speeds for the 2036 model are provided in Table 5-24 and Table 5-25 for the AM and PM peak
respectively.
Table 5-24 Travel Time and Speeds – AM Peak (2036)
Modelled Time
Route Direction 7:30am to 8:30am 8:30am to 9:30am
Travel Time (mm:ss)
Speed (km/h) Travel Time (mm:ss)
Speed (km/h)
Route 1: Pacific Highway between Hotham Parade and Bruce Street
Bruce St – Falcon St Northbound 0:47 29 0:41 32
Falcon St – Albany St Northbound 1:16 29 0:51 44
Albany St – Park Ln Northbound 1:46 22 1:30 28
Park Ln – Westbourne St Northbound 1:37 22 1:09 34
Westbourne St – Hotham St Northbound 1:27 44 1:36 42
Bruce St – Hotham St Northbound 6:11 26 5:48 30
Hotham St – Westbourne St Southbound 1:54 37 2:04 34
Westbourne St – Herbert St Southbound 2:45 20 4:07 14
Herbert St – Albany St Southbound 0:58 28 1:03 24
Albany St – Bruce St Southbound 1:41 32 3:02 19
Hotham St – Bruce St Southbound 7:18 24 10:16 17
Table 5-25 Travel Time and Speeds – PM Peak (2036)
Modelled Time
Route Direction 4:45pm to 5:45pm 5:45pm to 6:45pm
Travel Time (mm:ss)
Speed (km/h) Travel Time (mm:ss)
Speed (km/h)
Route 1: Pacific Highway between Hotham Parade and Bruce Street
Bruce St – Falcon St Northbound 0:49 26 1:22 21
Falcon St – Albany St Northbound 1:40 25 3:36 16
Albany St – Park Ln Northbound 1:36 26 1:49 24
Park Ln – Westbourne St Northbound 1:36 22 1:01 39
Westbourne St – Hotham St Northbound 2:18 29 2:02 33
Bruce St – Hotham St Northbound 8:00 22 9:50 18
Hotham St – Westbourne St Southbound 1:46 37 1:52 37
Westbourne St – Herbert St Southbound 2:00 26 2:00 28
Herbert St – Albany St Southbound 1:01 24 1:16 18
Albany St – Bruce St Southbound 2:17 20 4:46 11
Hotham St – Bruce St Southbound 7:25 25 9:52 18

Future Year Modelling Report St Leonards and Crows Nest Station Precinct Traffic and Transport Study
80018096 | 13 July 2020 | Commercial in Confidence
56
5.3.3 Density (2036)
The density plots for the 2036 model are shown in Figure 5-6 and Figure 5-7 for the AM and PM Peak.
Figure 5-6 Density Plot – AM Peak (2036)
Figure 5-7 Density Plot – PM Peak (2036)

Future Year Modelling Report St Leonards and Crows Nest Station Precinct Traffic and Transport Study
80018096 | 13 July 2020 | Commercial in Confidence
57
6 Results Comparison
This section describes the comparison of the results outlined in Section 4 and Section 5 between the three modelled years (2016, 2026 and 2036).
6.1 Network Performance Comparison
6.1.1 Overview
Table 6-1 summarises the 2016, 2026 and 2036 network performance results. The increased traffic growth over the future year scenarios result in a deterioration of the network operation for private vehicle operation. This is shown by the increased total delay, average time travelled in the network per vehicle, number of stops, unreleased demand and decrease in average speeds
Table 6-1 Network Performance Comparison
Network Performance Measurements
2016 Base Model 2026 Model 2036 Model
AM Peak
PM Peak
AM Peak
PM Peak
AM Peak
PM Peak
All vehicles
Total traffic demand (vehicles) 25,781 21,141 28,993 22,635 33,826 26,178
Total vehicle kilometres travelled in network (kilometres)
39,635 39,555 42,695 42,438 43,407 44,590
Total vehicle travel time (hours) 1,915 1,796 2,634 2,406 3,304 3,445
Total delay (hours) 1,165 1,043 1,936 1,734 2,761 2,923
Total vehicles arrived 24,991 20,499 27,439 21,048 28,149 21,493
Total number of stops 68,962 96,335 108,778 97,555 122,499 130,779
Average per vehicle in network
Average vehicle kilometres travelled in network (kilometres)
1.6 1.9 1.6 2.0 1.5 2.1
Average time travelled in network(minutes) 4.6 5.3 5.8 6.9 7.0 9.6
Average number of stops 2.8 4.7 4.0 4.6 4.4 6.1
Average speed (kilometres per hour) 24.9 26.6 20.2 22.8 18.7 19.11
Unreleased vehicles
Unreleased demand (vehicles) 7 4 340 537 3,853 2,709
Per cent of total traffic demand 0% 0% 1.2% 2.4% 11.4% 10.3%
6.1.2 Unreleased demand
Unreleased demand consists of the number of vehicles attempting to enter the network but unable to do so due to congestion within the modelled network. The model will continue to attempt to release these vehicles to the network using the pre-determined entry point.
In real life, this would result in a combination of re-routing (as alternative routes become more economically viable / quicker), mode shift (as the delays outweigh the convenience to use private vehicle) and peak spreading (with drivers deciding to complete their trips earlier / later to avoid peak congestion). That is, the actual queue lengths on the extremities of the modelled networks would not reach the hypothetical ranges forecasted by traffic models of this nature based on the number of “unreleased vehicles”. Nevertheless, the unreleased demand is a valuable indicator to help quantify at what point an urban road network becomes saturated and how many trips need to convert to other routes, other modes or other times.

Future Year Modelling Report St Leonards and Crows Nest Station Precinct Traffic and Transport Study
80018096 | 13 July 2020 | Commercial in Confidence
58
The outputs shown in Table 6-1 show a modest increase in the number of unreleased vehicles by 2026. A more significant number of unreleased vehicles is shown under 2036 conditions (circa 3,800 and 2,700 in the AM and PM peaks respectively). These are spread across the network and include a combination of trips only passing by the precinct (through trips) and trips generated (starting or finishing) within the precinct. No substantial unreleased demand was observed on either direction of the Pacific Highway. This indicates that no severe impacts to through trips along the Pacific Highway are expected, other than the gradual deterioration of travel times as a result of additional pedestrian crossing requirements / signal phasing changes, the considerable increase in transport demand in the precinct and some modifications to intersection configurations.
Measures to encourage mode shift support improved road network performance and the intended road movement function and place function throughout the precinct. These need to be supported by constrained parking policies to further discourage private vehicle use to travel to/from/within the precinct. It is expected that this type of travel demand measures will assist in absorbing a substantial proportion of the unreleased demand via mode shift. Any residual demand is expected to experience re-routing and peak spreading until the transport network achieves equilibrium.
6.2 Travel Time Comparison
Table 6-2 and Table 6-3 summarise the 2016, 2026 and 2036 travel time results for the first and second hour of the modelled peak period respectively. The results show that there is a general trend of increased travel times along Pacific Highway in the future years with 2036 having the worst travel times, despite the additional upgrades identified. On the second (worst) hour of the peak, these increase by 2 to 3 minutes (when compared to 2016) to travel the 3km along the Pacific Highway within the modelled network. It is important to note that this is based on a worst case scenario which excludes the additional mode shift that is likely to be achieved with travel demand strategies gradually introduced to the precinct, such as the proposed active transport infrastructure (pedestrian / cycling crossings and connections) and constrained parking policies.
Table 6-2 Travel Time Comparison (1st Hour)
AM PM
Route Direction 2016 (mm:ss)
2026 (mm:ss)
2036 (mm:ss)
2016 (mm:ss)
2026 (mm:ss)
2036 (mm:ss)
Route 1: Pacific Highway between Hotham Parade and Bruce Street
Bruce St – Falcon St Northbound 0:41 0:43 0:47 0:47 0:49 0:49
Falcon St – Albany St Northbound 1:04 1:08 1:16 1:18 1:27 1:40
Albany St – Park Ln Northbound 2:00 1:57 1:46 1:35 1:29 1:36
Park Ln – Westbourne St Northbound 1:03 1:27 1:37 1:06 1:26 1:36
Westbourne St – Hotham St Northbound 1:34 1:36 1:27 1:53 2:04 2:18
Bruce St – Hotham St Northbound 6:21 6:51 6:11 6:40 7:15 8:00
Hotham St – Westbourne St Southbound 1:52 1:51 1:54 1:45 1:45 1:46
Westbourne St – Herbert St Southbound 2:12 2:49 2:45 3:47 1:58 2:00
Herbert St – Albany St Southbound 0:53 0:54 0:58 0:54 0:55 1:01
Albany St – Bruce St Southbound 2:33 2:00 1:41 2:25 2:40 2:17
Hotham St – Bruce St Southbound 7:21 7:36 7:18 7:06 7:19 7:25
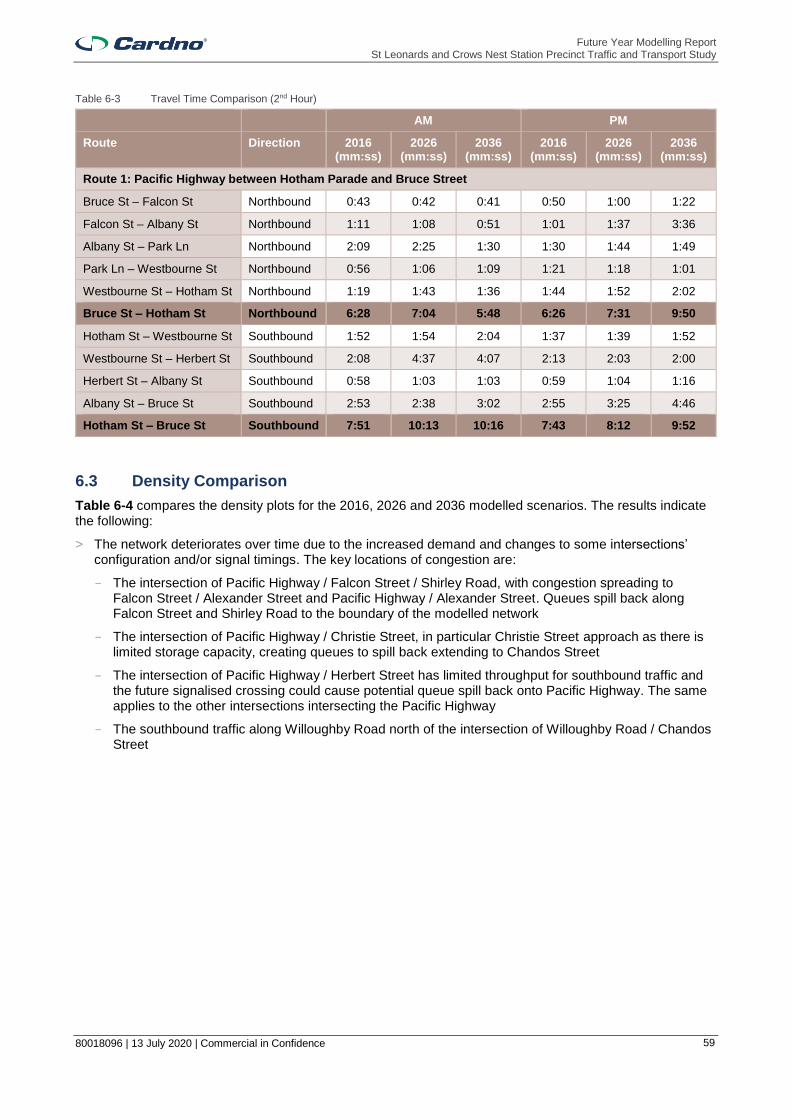
Future Year Modelling Report St Leonards and Crows Nest Station Precinct Traffic and Transport Study
80018096 | 13 July 2020 | Commercial in Confidence
59
Table 6-3 Travel Time Comparison (2nd Hour)
AM PM
Route Direction 2016 (mm:ss)
2026 (mm:ss)
2036 (mm:ss)
2016 (mm:ss)
2026 (mm:ss)
2036 (mm:ss)
Route 1: Pacific Highway between Hotham Parade and Bruce Street
Bruce St – Falcon St Northbound 0:43 0:42 0:41 0:50 1:00 1:22
Falcon St – Albany St Northbound 1:11 1:08 0:51 1:01 1:37 3:36
Albany St – Park Ln Northbound 2:09 2:25 1:30 1:30 1:44 1:49
Park Ln – Westbourne St Northbound 0:56 1:06 1:09 1:21 1:18 1:01
Westbourne St – Hotham St Northbound 1:19 1:43 1:36 1:44 1:52 2:02
Bruce St – Hotham St Northbound 6:28 7:04 5:48 6:26 7:31 9:50
Hotham St – Westbourne St Southbound 1:52 1:54 2:04 1:37 1:39 1:52
Westbourne St – Herbert St Southbound 2:08 4:37 4:07 2:13 2:03 2:00
Herbert St – Albany St Southbound 0:58 1:03 1:03 0:59 1:04 1:16
Albany St – Bruce St Southbound 2:53 2:38 3:02 2:55 3:25 4:46
Hotham St – Bruce St Southbound 7:51 10:13 10:16 7:43 8:12 9:52
6.3 Density Comparison
Table 6-4 compares the density plots for the 2016, 2026 and 2036 modelled scenarios. The results indicate the following:
> The network deteriorates over time due to the increased demand and changes to some intersections’ configuration and/or signal timings. The key locations of congestion are:
- The intersection of Pacific Highway / Falcon Street / Shirley Road, with congestion spreading to Falcon Street / Alexander Street and Pacific Highway / Alexander Street. Queues spill back along Falcon Street and Shirley Road to the boundary of the modelled network
- The intersection of Pacific Highway / Christie Street, in particular Christie Street approach as there is limited storage capacity, creating queues to spill back extending to Chandos Street
- The intersection of Pacific Highway / Herbert Street has limited throughput for southbound traffic and the future signalised crossing could cause potential queue spill back onto Pacific Highway. The same applies to the other intersections intersecting the Pacific Highway
- The southbound traffic along Willoughby Road north of the intersection of Willoughby Road / Chandos Street

Future Year Modelling Report St Leonards and Crows Nest Station Precinct Traffic and Transport Study
80018096 | 13 July 2020 | Commercial in Confidence
60
Table 6-4 Density Comparison
2016 2026 2036
AM
PM

Future Year Modelling Report St Leonards and Crows Nest Station Precinct Traffic and Transport Study
80018096 | 13 July 2020 | Commercial in Confidence
61
7 Key Findings and Recommendations
Based on road network performance analysis, thirteen of the measures in the Draft 2036 Plan were tested and demonstrated to operate satisfactorily. These provide improved pedestrian connectivity and retain a functional road network during peak demand periods.
Some interventions outlined in the Draft 2036 Plan were found to significantly deteriorate road network performance if implemented and were therefore removed from the models. The key items are listed in Table 7-1. Other initiatives could not be tested in the traffic model due to the nature of the proposed upgrades or lack of details to allow inclusion in the traffic models.
Table 7-1 Draft 2036 Plan Upgrades Recommended to be Removed
Location 2036 Draft Plan Reason
Intersection of Nicholson Street and Shirley Road.
Priority active transport crossing treatment.
Central to two intersections within a complex part of the road network with a four lane cross section and a keep clear zone.
Intersection of Chandos Street and Christie Street (P10)
Signalised intersection to provide time managed priorities for pedestrians and vehicles.
Signalising the intersection would likely require property acquisition and result in marginal improvements for pedestrians / no improvements for traffic
Intersection of Pacific Highway and Reserve Road (R2)
Signalised pedestrian crossing on the west approach.
Detrimental effect on performance of intersection given existing / future traffic demands. The intersection footprint / number of lanes would require a long signal phasing allocation to pedestrian sand cause severe impacts to the Pacific Highway and Reserve Road.
Intersection of Pacific Highway and Herbert Street (R3)
Signalised pedestrian crossing on the east approach.
Detrimental effect on performance of intersection given existing / future traffic demands. The intersection footprint / number of lanes would require a long signal phasing allocation to pedestrian sand cause severe impacts to the Pacific Highway and Herbert Street.
Intersection of Christie Street and Pacific Highway (R4)
Signalised pedestrian crossing on the west approach.
Detrimental effect on performance of intersection given existing / future traffic demands. The intersection footprint / number of lanes would require a long signal phasing allocation to pedestrian sand cause severe impacts to the Pacific Highway and Christie Street.
As part of the assessment, additional initiatives were identified to support road network functionality during weekday peak periods beyond 2026. These generally relate to road space management and parking removal in some key locations (in which case consideration can be given to peak period clearway restrictions instead of permanent removal).
A key recommendation is the signalisation of Oxley Street / Albany Street from its existing roundabout configuration by 2036. This would support safe pedestrian movements at this location and allow functional traffic operation (otherwise constrained by insufficient capacity and a high number of pedestrian flows using zebra crossings).
As a precinct wide consideration, limiting the availability of free, unrestricted parking (on-street or off-street) can be used as a tool to reduce private vehicle demands for trips to / from the precinct. Low off-street parking supply within new developments must be investigated and implemented as much as economically viable. This must be supported by feasible options for other modes such as the gradual improvement of the active transport road network proposed for the precinct.
The modelling results indicate a noticeable increase in the number of unreleased vehicles from 2026 to 2036 operational conditions. Mode shift initiatives will be required to encourage demand onto more space efficient modes of transport, including active and public transport modes. Interventions such as constrained parking provision in new developments, car share schemes and changes in transport technology and employment patterns may contribute to improved efficiency in the transport network.

Future Year Modelling Report St Leonards and Crows Nest Station Precinct Traffic and Transport Study
80018096 | 13 July 2020 | Commercial in Confidence
62
8 Conclusion
The changes to transport infrastructure documented in the 2036 Draft Plan were tested in the 2026 and 2036 future models to confirm if these can be supported in conjunction with the forecast increase in travel demand. The majority of these measures were found to be feasible in both the 2026 and 2036 horizons. Not all the proposed interventions will have an impact to the traffic network and as such, some of these were not included in the model.
Based on the iterative scenario testing results, it was found that five upgrades originally included in the 2036 Draft Plan are not recommended to be implemented due to the significant impact that this would cause to the traffic network or the complexities associated with the design / operation of these interventions. These are as follows:
> Intersection of Nicholson Street and Shirley Road (the implementation of a pedestrian crossing is not feasible)
> Intersection of Chandos Street and Christie Street (signalising the intersection would likely require property acquisition and result in marginal improvements for pedestrians / no improvements for traffic)
> Intersection of Pacific Highway and Reserve Road (high demands prevent the option to introduce additional pedestrian crossing points. This would constrain signal phasing time allocated to traffic and result in considerable delays along the Pacific Highway and Reserve Road)
> Intersection of Pacific Highway and Herbert Street (high demands prevent the option to introduce additional pedestrian crossing points. This would constrain signal phasing time allocated to traffic and result in considerable delays along the Pacific Highway and Herbert Street)
> Intersection of Pacific Highway and Christie Street (high demands prevent the option to introduce additional pedestrian crossing points. This would constrain signal phasing time allocated to traffic and result in considerable delays along the Pacific Highway and Christie Street)
Due to the increase in travel demand from 2026 to 2036, five additional improvements to the road network capacity were identified to be required by 2036. These are as follows:
> Dual westbound lanes along Chandos Street from Willoughby Road to Mitchell Street (including a dual circulating lane for the westbound direction of the roundabout). This will require the removal of parking in the AM peak (consideration could be given to retain parking in the PM)
> Upgrade of the Oxley Street / Albany Street intersection from roundabout to signals and ban parking on Albany Road between Pacific Highway and Willoughby Road to enable two lanes in each direction
> Short lane for the right turn into RNSH on Herbert Street achieved by removing 30m of parking (to allow for southbound through vehicles to go around right turning vehicles)
> Parking bans in the northbound direction on Greenwich Road between River Road and Pacific Highway in the PM peak. Consideration can be given to retain parking in the AM peak
> Clearways along Pacific Highway between Albany Street and Falcon Street
These recommendations are based on strategic investigations using long term land use and travel demand projections. These should be verified by further modelling once the impacts of Sydney Metro have been realised and travel behaviour evolves towards sustainable travel modes. Other external factors such as the Western Harbour Tunnel and Beaches Link are also expected to influence transport demand and patterns within the precinct. That is, the number of external trips passing through the precinct is expected to change gradually as regional road infrastructure upgrades are added to the network and the demands across the regional infrastructure network are rebalanced. The exact delivery timeframes and consequent impact to private vehicle demand must be considered and monitored given the high proportion of through trips using the precinct and how these interface with locally generated transport demand.
The comparison of the density plots reveal that the infrastructure upgrades implemented in the model can cater for the increase in local trips along the key road corridors and local roads. As the land use and infrastructure changes are implemented, the travel times along the Pacific Highway are forecast to experience small changes (under 1 minute) during the first hour of the peak period. By 2036, in the second hour of the peak, an additional 2minutes and 30seconds are anticipated to be required to travel the full extent of the Pacific Highway included in the model (Hotham Parade to Bruce Street, circa 3 kilometres).

Future Year Modelling Report St Leonards and Crows Nest Station Precinct Traffic and Transport Study
80018096 | 13 July 2020 | Commercial in Confidence
63
This is a result of the combined increase in local trips associated with the densification in the precinct and growth in through trips (passing the study area via the Pacific Highway).
Some increase in congestion levels is expected at local centres due to the increase in pedestrian demand. However, the additional traffic congestion may be acceptable due to the place value of these locations and need to provide improved active transport infrastructure to encourage mode shift. A perceived gradual reduction of travel speeds / increase in congestion is conducive to a gradual transition to a greater take up of other modes.
Unreleased demand quantifies the number of vehicles attempting to enter the network but unable to do so due to traffic congestion. The model will continue to attempt to release these vehicles to the network using the pre-determined entry point. In real life, this results in a combination of re-routing (as alternative routes become more economically viable / quicker), mode shift (as the delays outweigh the convenience to use private vehicle) and peak spreading (with drivers deciding to complete their trips earlier / later to avoid peak congestion). As such, the queue lengths experienced in real life on the extremities of the modelled networks do not typically reach the hypothetical ranges forecasted by traffic models. Nevertheless, the unreleased demand is a valuable indicator to help quantify at what point the network becomes saturated and how many trips need to convert to other routes, other modes or other time. The model outputs indicate that by 2036, this consists of approximately 3,800 vehicles in the morning peak and 2,700 vehicles in the PM peak.
As the precinct grows and the additional population and employment materialises, policy measures and infrastructure upgrades supporting active and public transport will be required to support a vibrant and economically viable precinct with a balanced transport demand across the various modes. This is also important due to the role of the Pacific Highway as a major north-south corridor in the lower north shore and the need to minimise delays along the corridor. An excessive supply of on-street / off-street parking or insufficient investment in sustainable travel modes would lead to an increased reliance of private vehicle usage by residents and visitors and contribute to a deterioration of the precinct, its viability and significantly impact trips passing by the study area.