Embed Size (px)
Citation preview

Applied Ocean Research 31 (2009) 179–185
Contents lists available at ScienceDirect
Applied Ocean Research
journal homepage: www.elsevier.com/locate/apor
Fuzzy inference system for the risk assessment of liquefied natural gas carriersduring loading/offloading at terminals
Tarek Elsayed ∗
Department of Marine Engineering, Arab Academy for Science & Technology & Maritime Transport, Alexandria, Egypt
a r t i c l e i n f o
Article history:Received 12 September 2008Received in revised form26 May 2009Accepted 14 August 2009Available online 8 September 2009
Keywords:Multiple attributeRisk assessmentFuzzy setsFuzzy inference systemLNG shipsLNG terminals
a b s t r a c t
A multiple attribute risk assessment approach using a fuzzy inference system is developed in this work.The approach is based on the use of fuzzy sets, a rule base and a fuzzy inference engine. Traditional inputprobabilities and consequences used in risk assessment are represented by fuzzy sets to take into accountuncertainties associated with the assignment of their values. The output risk values can be presented ascrisp values or fuzzy sets with associated degree of membership. The fuzzy inference system FIS is usedas an alternative approach to qualitative risk matrix techniques currently used in many industries and byship classification societies. Two approaches for fuzzy inference are adopted. These include the Mamdaniapproach in which output risk values are fuzzy sets and the Sugeno method of fuzzy inference, in whichoutput risk values are constant or linear.The use of a fuzzy set approach is particularly suited for handlingmultiple attribute risk problemswith
imprecise data. It improves upon existing qualitative methods and allows the ranking of risk alternativesbased on a unified fuzzy risk index measure. Results show that while the Mamdani method is intuitiveand well suited to human input, the Sugeno method is computationally more efficient and guaranteescontinuity of the final risk output surface. Results also show that computed risk values using a fuzzyrisk index measure are consistent with those obtained using a qualitative risk matrix approach. Theproposedmethodology is also applicable to other ship operatingmodes such as transit in open sea and/orentering/leaving port. A case study for a liquefied natural gas LNG ship loading/offloading at the terminalis presented to demonstrate the developed approach capability.
© 2009 Elsevier Ltd. All rights reserved.
1. Introduction
In many engineering situations there is pervasive fuzzy infor-mation, i.e. information that is vague/qualitative, linguistic and/orimprecise [1–6]. This is often the case when trying to assess acci-dent probabilities/consequences that are not known a priori and/ordifficult to quantify mathematically. The assignment of accidentprobabilities is usually based on reliability methods and/or his-torical failure data. Reliability methods require knowledge of therelevant physical process and the specification of a limit state func-tion [7]. In many cases, historical failure data can be lacking and/orunreliable. When historical failure data is available, it can be sup-plemented with expert judgment [8]. These approaches howeverare not sufficient to predict accident probabilities under all rel-evant circumstances. This is due to lack of knowledge of physi-cal conditions and processes, change of industry practice over theyears, and lack/unreliability of data. Hence, predictions of accident
∗ Tel.: +20 11 20 124873165; fax: +20 11 203 55622525.E-mail addresses: [email protected], [email protected].
0141-1187/$ – see front matter© 2009 Elsevier Ltd. All rights reserved.doi:10.1016/j.apor.2009.08.004
probabilities are often associated with significant uncertainties. Infact it is because of these uncertainties that many risk assessmenttools avoid absolute probability values all together and stick to rel-ative probabilities [9].LNG accident consequences [10–13] vary from personnel in-
juries to environmental pollution and loss of material assets. Theseconsequences are imprecise in nature, each with its ownmeasure-ment scale, and cannot be added mathematically. They may how-ever be defined linguistically or on a qualitative scale [10,14]. Fig. 1shows the different consequence classes for an LNG ship accidentwhile loading/offloading at the terminal. In this work, a new ap-proach for the risk assessment of LNG carriers using a fuzzy infer-ence system FIS is adopted. The main advantage of the use of thefuzzy inference system is its ability to handle imprecise data. Theapproach uses the concept of a pure fuzzy logic system. A fuzzyrule base is constructed to follow the logic used by the risk asses-sor when using the traditional qualitative risk matrix approach.The fuzzy inference engine uses these rules to determine a map-ping from probability and consequences, modeled as fuzzy sets, toa fuzzy output set of risk values. In doing so, it is implied that prob-abilities/consequences used in the risk assessment process have aninherent degree of uncertainty.

180 T. Elsayed / Applied Ocean Research 31 (2009) 179–185
Table 1Definition of likelihood levels.
Level Description Indicative frequency (Per vessel year) Definition
A Frequent >0.5 Will occur frequentlyB Probable 0.5–0.05 May occur several timesC Occasional 0.05–0.005 Likely to occur during lifetimeD Remote 0.005–0.0005 Unlikely to occur during lifetimeE Improbable <0.0005 So unlikely event, it may not be experienced
Table 2Definition of severity levels for accident consequences.
Consequence class 1 2 3 4
Minor Major Critical Catastrophic
Crew Minor injury Serious injury One fatality Several fatalities
3rd party personnel No injury Minor injury Serious injury Fatalities
Environmental Negligible pollution Pollution reported to regulatoryauthoritiesMinor release
Pollution reported to regulatoryauthoritiesMajor release
Pollution reported toregulatory authoritiesUncontrolled pollution
Ship damage Minor damage Moderate damage Major damage Loss of ship
Downtime Negligible One day One week More than one week
Reputation Negligible Affected locally Affected nationally Loss of reputation
3rd party assets No effect Minor damage Major damage Extensive damage
Fig. 1. Consequence classes for an LNG ship accident at terminal.
2. Qualitative risk assessment
A standard qualitative risk assessment approach involvesthe evaluation of likelihood or probability of different accidentscenarios [15–17]. Next an evaluation of the impact of the differentaccident scenarios with respect to the different consequenceattributes is carried out. A risk matrix is often used in thisapproach. A risk matrix combines the likelihood of an event withits consequence severity into a risk level.Table 1 shows a sample qualitative assessment of the probabili-
ties of occurrence of an LNG ship accident while loading/unloadingat the terminal. Probabilities are assigned letters such as A, B, C,D and E corresponding to a linguistic scale: ‘frequent’, ‘probable’,‘occasional’, ‘remote’ and ‘improbable’ likelihoods. An indicativequantitative frequency range is associated with each probabilitylevel. Table 2 shows a similar qualitative assessment of LNG ac-cident consequence categories. Consequences are assigned num-bers such as 1, 2, 3 and 4 corresponding to ‘minor’, ‘major’, ’critical’and ‘catastrophic’ severity level. An indicative descriptive linguis-tic range is associated with each consequence attribute and sever-ity level. Table 3 shows an example of the risk matrix used by shipclassification societies. The risk matrix combines likelihood andseverity into an output linguistic risk level for each scenario and
Table 3Example of qualitative risk matrix.
Severity1 2 3 4
Likelihood
A M H H HB M M H HC L M M H
D L L M M
E L L L L
consequence attribute. These linguistic risk values are then com-bined to give an overall linguistic risk value for each accident sce-nario being evaluated. Output risk level are denoted linguisticallyas ‘low’, ‘medium’ or ‘high’ [12].
3. Fuzzy risk assessment
Fuzzy inference is the process of mapping from a given inputset to an output set using fuzzy logic. Membership functions,fuzzy logic operators and if-then rules are used in this process.The fuzzy inference system FIS is known in the literature by anumber of names, such as fuzzy-rule-based system, fuzzy expertsystem or simply a fuzzy system [18,4–6]. The basic advantageof such system is its tolerability to linguistic/imprecise data. Inthis work, the Mamdani and the Sugeno fuzzy inference methodsare adopted [19]. In the Mamdani type of inference, the outputmembership functions are fuzzy sets. These are in turn defuzzifiedto obtain a crisp output risk value for each consequence alternative.In the Sugeno method of fuzzy inference, output membership
functions are either linear or constant. A typical rule in a Sugenofuzzy model has the form:
if Input 1 = x and Input 2 = y,then Output is z = ax+ by + c (1)
where a, b and c are the consequence parameters of the rule. Theoutput level zi of each rule is weighted by the firing strength wi ofthe rule. For example, for an AND rule with Input 1 = x and Input2 = y, the firing strength is
wi = And Method (F1(x)F2(y)) (2)
where F1,2(.) are the membership functions for inputs 1 and 2.

T. Elsayed / Applied Ocean Research 31 (2009) 179–185 181
Fig. 2. Fuzzy inference process—Sugeno’s method.
The final output of the system is theweighted average of all ruleoutputs, computed as
Final Output =
N∑i=1wizi
N∑i=1wi
(3)
whereN is the number of rules. Fig. 2 shows a Sugeno FIS includingtwo input variables x, y, and one output variable z.
4. Case study: Assessmentof LNG risksduring loading/offloadingat terminals
A case study is used to demonstrate the proposed approach foran LNG carrier loading at the terminal. Six hazardous scenariosare evaluated during LNG loading/offloading at the terminal [10,12]. These are summarized in Table 4. As seen from Table 4, eachconsequence is denoted by a letter followed by a number. Theletters (C, P, E, S, D, R, M) correspond to the consequence classfor e.g. (crew, 3rd party personnel, environment, ship, downtime,reputation and 3rd party material assets).The numbers (1, 2, 3, and 4) correspond to the degree of
severity of the consequence, for e.g. ‘minor’, ‘major’, ‘critical’ and‘catastrophic’ on a qualitative scale.
4.1. Determination of membership functions and reasoning matrix
In order to adopt this approach for risk assessment, probabil-ities of accident scenarios as well as accident consequences aremodeled as fuzzy sets. In doing so, it is implied that probabili-ties/consequences are by themselves uncertain or at least a degreeof uncertainty is associated with their values. Several approachesfor building and adapting membership functions exist [20]. In thiswork, a fixed center-based membership function approach usingthe symmetric Gaussian membership function was adopted. Onemembership function is assigned to each value of the fuzzy vari-able. The Gaussian membership function depends on two parame-ters and is given by:
f (x, σ , c) = e−(x−c)2
2σ2 (4)
where c is the mean value and σ is the standard deviation.Membership functions are centered, each at the mid-value of thenumeric interval associated with each fuzzy variable. For examplefor ‘remote’ probability the Gaussian membership functions iscentered on the average value of the interval (0.005–0.0005)whichcorresponds to a mean value c = 0.00275, as shown in Table 5.The standard deviation parameters σ for the Gaussian functionswere chosen such that membership function curves are completedwith theminimum andmaximum points of the interval associated
1
0.5
0
Deg
ree
of
mem
bers
hip
Deg
ree
of
mem
bers
hip
Remote Occasional Probable Frequent
0 0.1 0.2 0.3 0.4 0.5 0.6 0.7 0.8 0.9
Probability
1
0.5
0
1 1.5 2 2.5 3 3.5 4Consequences
Minor Major Critical Catastrophic
Fig. 3. Membership function for probability of occurrence and consequenceseverity levels.
with each of the fuzzy variables [20]. With these membershipfunctions each input value will belong to no more than two fuzzysets. Fig. 3 shows the membership functions for the probabilityof occurrence and consequences respectively modeled as fuzzysets. Probabilities of occurrence are represented by fuzzy setswhose ranges are chosen to coincide with the indicative frequencyranges shown in Table 1. Similarly, accident consequences arerepresented by fuzzy sets whose ranges are chosen to coincidewith the indicative severity levels shown in Table 2. Fig. 4 showsthe membership functions for the resulting risk value. A scale of1 to 10 was adopted to represent output risk values. As can beseen, the use of fuzzy sets allows a representation of linguisticterms, such as ‘frequent’, ‘probable’, ‘occasional’, ‘remote’ and‘improbable’ for likelihoods. Consequences are also representedlinguistically as ‘minor’, ’major’, ’critical’ and ‘catastrophic’. Finallyoutput risk values are denoted as ‘low’, ‘medium’ and ‘high’. Table 5summarizes the membership type and parameters adopted in thedeveloped fuzzy inference system FIS.The mapping between probability, consequences and final risk
value is accomplished by the use of fuzzy if-then rules. For a singleattribute risk problem, a total of twenty if-then rules can be usedin the fuzzy inference system FIS to provide the mapping betweenprobability, consequence and the computed risk value. The rulesare designed to follow the logic of the risk assessor when using thequalitative risk matrix approach outlined earlier. First twelve rulesof the developed system are listed below.
Rule 1 if (probability is frequent) and (consequence is minor)then risk is medium.
Rule 2 if (probability is frequent) and (consequence is major)then risk is high.
Rule 3 if (probability is frequent) and (consequence is critical)then risk is high.
Rule 4 if (probability is frequent) and (consequence is catas-trophic) then risk is high.
Rule 5 if (probability is probable) and (consequence is minor)then risk is medium.
Rule 6 if (probability is probable) and (consequence is major)then risk is medium.
Rule 7 if (probability is probable) and (consequence is critical)then risk is high.
Rule 8 if (probability is probable) and (consequence is catas-trophic) then risk is high.
Rule 9 if (probability is occasional) and (consequence is minor)then risk is low.
182 T. Elsayed / Applied Ocean Research 31 (2009) 179–185
Table 4Hazards considered during LNG loading/offloading at terminal.
Haz id Hazard description Likelihood Consequences
1 Leak on the cargo system unignited release continuous flow. This comprises allleak sizes that cannot easily be stopped by operational routines to a rupture in apipe. Potential consequence is brittle fracture of hull or secondary structure.Frost burns for personnel. No consequences to 3rd party anticipated.
Occasional (C) C2, P1, E1, S2, D3, R3, M1
2 Release of liquid nitrogen. Can give local effects to steel due to lowtemperature. Possible frost burn for personnel.
Occasional (C) C2, P1, E1, S2, D2, R1, M1
3 Release of bunker oil during loading operation. Very low risk of fire andpersonnel injuries. The oil may mess up nearby quays affecting 3rd party assets.
Occasional (C) C1, P1, E3, S1, D2, R3, M2
4 Fire in the engine room. Since always manned during this operational mode,the escalation potential is considered low. The event is considered not to affect3rd party. All fires will have to be reported to terminal, thus local reputation isaffected.
Remote (D) C3, P1, E1, S2, D3, R3, M1
5 Accommodation fires. The crew present in the accommodation will most likelyquickly extinguish these fires. It is considered to be less likely to occur than afire in the engine room, but still a remote probability. If developing to a large firemore crew members may be affected by the accident, than for an engine roomfire. 3 parties not likely to be affected.
Remote (D) C3, P1, E1, S2, D3, R3, M1
6 Fires on open deck. Ignited cargo release. The consequences depend on therelease size and the development of the event, including shut down. Earlyignition gives smaller consequences than late ignition. Most likely there is aflash fire which burns back to a smaller fire at the release location (jet ordiffusive, depending on pressure in the system and if the release hitsobstructions or not). Whether the fire may escalate to the LNG tanks depend onthe possibility to shut down fuel to the fire.
Remote (D) C4, P3, E1, S3, D4, R3, M2
Table 5Membership type and parameters in the fuzzy inference system.
Variable Value/range Membership type Membership parameters (σ , c)
Probability–‘frequent’ >0.5 Gauss (0.11, 0.75)Probability–‘probable’ 0.5–0.05 Gauss (0.19, 0.275)Probability–‘occasional’ 0.05–0.005 Gauss (0.09, 0.0275)Probability–‘remote’ 0.005–0.0005 Gauss (0.009, 0.00275)Probability–‘improbable’ <0.0005 Gauss (0.0009, 0.000275)Consequence–‘catastrophic’ 4 Gauss (0.4247, 4)Consequence–‘critical’ 3 Gauss (0.4247, 3)Consequence–‘major’ 2 Gauss (0.4247, 2)Consequence–‘minor’ 1 Gauss (0.4247, 1)Risk–‘high’ 10 Gauss (1.911, 10)Risk–‘medium’ 5.5 Gauss (1.911, 5.5)Risk–‘low’ 1 Gauss (1.911, 1)
1
0.8
0.6
0.4
0.2
0
Deg
ree
of m
embe
rshi
p
1 2 3 4 5 6 7 8 9 10Risk
Low Medium High
Fig. 4. Membership function for risk values.
Rule 10 if (probability is occasional) and (consequence is major)then risk is medium.
Rule 11 if (probability is occasional) and (consequence is critical)then risk is medium
Rule 12 if (probability is occasional) and (consequence is catas-trophic) then risk is high.
As can be seen, the first four rules represent the first row inthe qualitative risk matrix given in Table 3. The second row in the
Consequence
Probability FIS(Mamdani)
Risk value
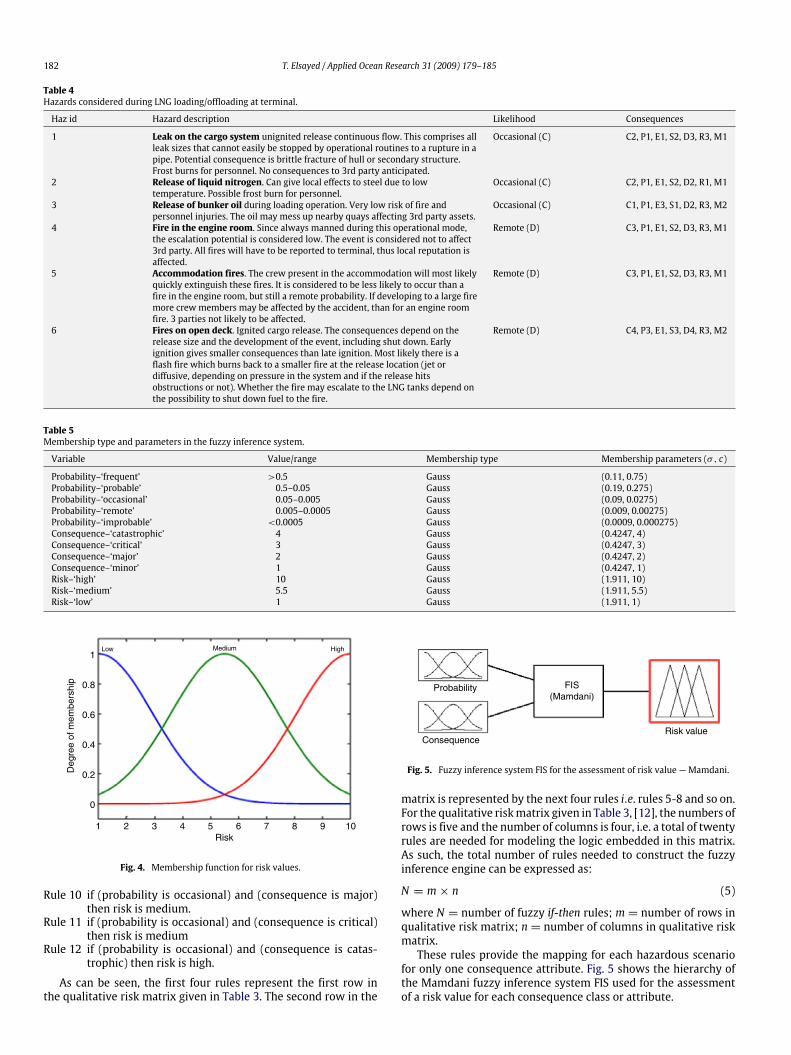
Fig. 5. Fuzzy inference system FIS for the assessment of risk value — Mamdani.
matrix is represented by the next four rules i.e. rules 5-8 and so on.For the qualitative riskmatrix given in Table 3, [12], the numbers ofrows is five and the number of columns is four, i.e. a total of twentyrules are needed for modeling the logic embedded in this matrix.As such, the total number of rules needed to construct the fuzzyinference engine can be expressed as:
N = m× n (5)
where N = number of fuzzy if-then rules; m = number of rows inqualitative risk matrix; n= number of columns in qualitative riskmatrix.These rules provide the mapping for each hazardous scenario
for only one consequence attribute. Fig. 5 shows the hierarchy ofthe Mamdani fuzzy inference system FIS used for the assessmentof a risk value for each consequence class or attribute.

T. Elsayed / Applied Ocean Research 31 (2009) 179–185 183
Table 6Summary of calculated qualitative/fuzzy risk values for six hazardous scenarios and seven consequence attributes. (Q = qualitative risk matrix,M = Mamdani method,S = Sugeno method) (L= low,M =medium).
Consequences Leak on the cargosystem
Release of liquidnitrogen
Release of bunkeroil
Fire in engineroom
Accommodationfires
Fires on opendeck
Q M S Q M S Q M S Q M S Q M S Q M S
C M 5.50 5.30 M 5.50 5.30 L 4.35 2.51 M 5.76 6.06 M 5.76 6.06 M 6.31 7.83P L 4.35 2.51 L 4.35 2.51 L 4.35 2.51 L 4.23 1.80 L 4.23 1.80 M 5.76 6.06E L 4.35 2.51 L 4.35 2.51 M 5.84 6.92 L 4.23 1.80 L 4.23 1.80 L 4.23 1.80S M 5.50 5.30 M 5.50 5.30 L 4.35 2.51 L 4.67 3.56 L 4.67 3.56 M 5.76 6.06D M 5.84 6.92 M 5.50 5.30 M 5.50 5.30 M 5.76 6.06 M 5.76 6.06 M 6.31 7.83R M 5.84 6.92 L 4.35 2.51 M 5.84 6.92 M 5.76 6.06 M 5.76 6.06 M 5.76 6.06M L 4.35 2.51 L 4.35 2.51 M 5.50 5.30 L 4.23 1.80 L 4.23 1.80 L 4.67 3.56
M 5.10 4.57 L 4.83 3.70 M 5.10 4.57 L 4.95 3.88 L 4.95 3.88 M 5.54 5.60
Table 7Summary of calculated Fuzzy Inference System (FIS) results for six hazardous scenarios.
id Hazard Qualitative risk value Mamdani fuzzy risk value Sugeno fuzzy risk value
1 Leak on the cargo system Medium 5.1073 4.57062 Release of liquid nitrogen Low 4.8437 3.70913 Release of bunker oil Medium 5.1073 4.57064 Fire in engine room Low 4.9524 3.88205 Accommodation fires Low 4.9524 3.88206 Fires on open deck Medium 5.5461 5.6054
FISnametypeand MethodorMethoddefuzzMethodimpMethodaggMethod
Inputnamerange
Outputnamerange
Rulesantecedentconsequent
Probabilitynametypeparameters
Consequencesnametypeparameters
Risknametypeparameters
Fig. 6. Fuzzy inference system FIS structural hierarchy.
4.2. Application to hazardous scenarios
Often LNG risk assessment problems involve multiple conse-quence attributes for each hazardous scenario, such as materialassets, human life and/or environmental pollution. These conse-quences are combined to provide an overall risk value for each acci-dent scenario. In thiswork, a fuzzy risk index FRI is used to combinethe various consequence attribute risks into a unified riskmeasure.The fuzzy risk index FRI value is an average aggregation operatorfor each accident scenario can be calculated by [21]
FRI =
(N∑i=1kiRiski/N
)N∑i=1ki
(6)
where N = number of consequences; ki = weight factor foreach consequence; Riski = calculated fuzzy risk value for eachconsequence attribute.The weighting factors ki reflects the attribute’s relative impor-
tance. Fig. 6 shows the structural hierarchy and information stor-age for the fuzzy inference system used. The FIS structure containsvarious substructures which in turn contain variable names, mem-bership function definitions and computation method.
87.5
76.5
65.5
54.5
Ris
k
0.80.6
0.40.2
0 1 1.52 2.5 3 3.5 4
ProbabilityConsequences
Fig. 7. Output risk surface envelope (Mamdani) for two fuzzy inputs: probabilityand consequence.
Ris
k
0.80.6
0.40.2
0 1 1.52 2.5 3 3.5 4
ProbabilityConsequences
89
765432
Fig. 8. Output risk surface envelope (Sugeno) for two fuzzy inputs: probability andconsequence.
4.3. Discussion and evaluation of the results
Figs. 7 and 8 show the resulting output surface envelopesfor both the Mamdani/Sugeno methods for two fuzzy inputs,probability and consequence as well as the fuzzy output risk. Azero-order Sugenomodelwas adopted for computation of final riskvalues.

184 T. Elsayed / Applied Ocean Research 31 (2009) 179–185
Table 8Comparison between fuzzy risk results and qualitative risk values for crew.
Hazard Qualitative risk values Mamdani fuzzy risk value Sugeno fuzzy risk ueval
Release of bunker oil Low 4.35 2.51Leak on the cargo system Medium 5.50 5.30Release of liquid nitrogen Medium 5.50 5.30Fire in engine room Medium 5.76 6.06Accommodation fires Medium 5.76 6.06Fires on open deck Medium 6.31 7.83
876543210
FRI
Company Property/Ship
Downtime
Reputation
3rd Part Material Assets
Fig. 9. Sugeno fuzzy risk values for material assets.
876543210
FRI
Crew
3rd PartyPersonnel
Fig. 10. Sugeno fuzzy risk values for personnel.
Table 6 provides a summary of the calculated qualitative/fuzzyrisk values for the six scenarios and seven consequence attributes.Both the Mamdani/Sugeno methods of inference were used in thecalculation of final risk output values. Table 7 shows a comparisonbetween qualitative and fuzzy risk assessment results for the sixscenarios considered. Figs. 9 and 10 show the Sugeno fuzzy riskvalues for material assets and crew respectively. Figs. 11 and 12show the Mamdani fuzzy risk values for material assets and crewrespectively. Overall scenario results are also plotted in Fig. 13.As can be seen from Table 7, most severe scenario is ‘fires onopen deck’, followed by ‘leak on the cargo system’ and ‘release ofbunker oil’. The least severe scenario is ‘release of liquid nitrogen’corresponding to a fuzzy risk index value of (4.84/3.70). Thisranking would have not been obtained if only a qualitative riskassessment was carried out.As can be seen in Table 4, scenarios 1 and 3 are expected to
have equal risk values. Both scenarios have a probability level of‘occasional’ and the same combined overall consequence level of (3‘minor’, 2 ‘major’ and 2 ‘critical’). As can be seen in Table 7, the com-puted fuzzy risk values for these two scenarios are indeed equal.Same situation applies to scenarios 4 and 5. Their correspondingcomputed fuzzy risk values provided in Table 7 are also equal.
Table 8 provides a comparison between risk results for crewobtained using a qualitative risk matrix approach [12] and thoseusing a fuzzy risk index measure. Scenarios are ranked from leastsevere to most severe with respect to risks to crew members. Ascan be seen, the same ranking is obtained using both methods forthe six hazardous scenarios under consideration. Fuzzy risk resultsfor crew are also shown graphically in Figs. 10 and 12 respectively.
5. Summary and conclusions
An approach for the assessment of multiple attribute risk us-ing fuzzy set theory was developed in this work. The developedmethodology is an alternative to qualitative risk assessment ma-trices currently used in many industries and by ship classificationsocieties. A three dimensional risk envelope or surface is generatedand used for the computation of risk values as replacement to thetraditional risk matrix.The use of fuzzy sets and a fuzzy inferenceengine is suited for handling imprecision often associated with ac-cident likelihood and consequence data.The total number of rules needed to construct the fuzzy infer-
ence engine is the product of the number of rows and the numberof columns for the corresponding qualitative risk matrix. The pro-posed approach improves upon existing qualitative methods andallows the ranking of risk alternatives based on a unified measure.A fuzzy risk index was adopted for aggregation of multiple con-sequences into a unified measure. Both the Mamdani and Sugenotype inferencemethodswere adopted. Results show that while theMamdani method is intuitive and well suited to human input, theSugeno method is computationally more efficient and guaranteescontinuity of the final risk output surface. It was also found thatcomputed risk results using a fuzzy risk index measure are consis-tent with those obtained using a qualitative risk matrix approach.The proposedmethodology is general in nature and provides moreoutput information than the traditional risk matrix approach usedfor modeling qualitative multiple attribute risk assessment prob-lems. It is also applicable to other ship operating modes such astransit in open sea and/or entering/leaving port.

T. Elsayed / Applied Ocean Research 31 (2009) 179–185 185
FRI
Company Property/Ship
Downtime
Reputation
3rd Part Material Assets
76543210
Fig. 11. Mamdani fuzzy risk values for material assets.
FRI
Crew 3rd Party Personnel
76543210
Fig. 12. Mamdani fuzzy risk values for personnel.
FRI
6543210
Mamdani Sugeno
Fig. 13. Fuzzy risk index values for six hazardous scenarios.
References
[1] Bellman RA, Zadeh LA. Decision making in a fuzzy environment. ManagementSciences Ser B 1970;17:141–64.
[2] Chen S, Hwang C. Fuzzy multiple attribute decision making methods andapplications. Lecture notes in economics and mathematical systems, NewYork: Spinger-Verlag; 1992.
[3] Zadeh LA. Fuzzy sets. In: Information and control, Vol. 8. 1965. p. 338–53.[4] Zadeh LA. The concept of a linguistic variable and its application to approxi-mate reasoning-I. Information Sciences 1975;8:199–249.
[5] Zimmerman HJ. Fuzzy sets, decision making and expert systems. KluwerAcademic Publishers; 1987.
[6] Zimmerman HJ. Description and optimization of fuzzy systems. InternationalJournal of General Systems 1976;2:209–15.
[7] Elsayed Tarek, Mansour AE. Reliability-based unfairness tolerance limits forstiffened plates. Journal of Ship Research 2003;(March).
[8] Cooke R, Jager E. Methods for assessing the failure frequency of undergroundgas pipelines with historical data and structured expert judgment. Report ofthe faculty of technical mathematics and informatics, 96–75. Delft Universityof Technology; 1996.
[9] American Gas Association. Methods for prioritizing pipeline maintenance andrehabilitation. Battelle Corporation; 1990.
[10] Elsayed Tarek, et al. Multi-attribute risk assessment of LNG carriers duringloading/offloading at terminals. Ships and Offshore Structures 2009;4(2).
[11] Gyles John. LNG terminal safety. In: Tenth international conference onliquefied natural gas. May 1992.
[12] Skramstad E, Musaeus S. Use of risk analysis for emergency planning of lngcarriers. In: Gas technology conference. 2000.
[13] Society of International Gas Tanker and Terminal Operators, SIGTTO. LNGshipping incident report. 1999.
[14] McGuire J, White B. Liquefied gas handling principles on ships & terminals.3Rev ed. Witherby & Co Ltd; 1999.
[15] American Bureau of Shipping. Guidance notes: Risk assessment for themarineand offshore oil and gas Industries, Houston, TX 77060, 2000.
[16] Elsayed Tarek, et al. Assessment of operational risks to personnel on boardfixed offshore structures. In: Proc. IMechE, Vol. 222, Part M. Journal ofEngineering for the Maritime Environment 2008;(December).
[17] HSE. Marine risk assessment. Offshore technology report 2001/063. 2002.[18] Kandel A, editor. Fuzzy expert systems. Boca Raton (FL): CRC Press; 1992.[19] Mathworks Inc. Fuzzy logic toolbox. User s Guide. Natick, MA. 2006.[20] Zhou Q, Purvis M, Kasabov N. A membership function selection method for
fuzzy neural networks. In: Proceedings of the international conference onneural information processing and intelligent systems. Singapore: Springer;1997. p. 785–8.
[21] Yager RR. Ordered weighted averaging aggregation operators in multi-criteriadecision making. IEEE Transactions on Systems, Man and Cybernetics 1988;18:183–90.