Embed Size (px)
Citation preview
FW364 Ecological Problem Solving
Lab 7: Loggerhead turtle conservation
Log onto computers please
Download files from saraparrsyswerda.weebly.com/fw364-
ecological-problem-solving.html
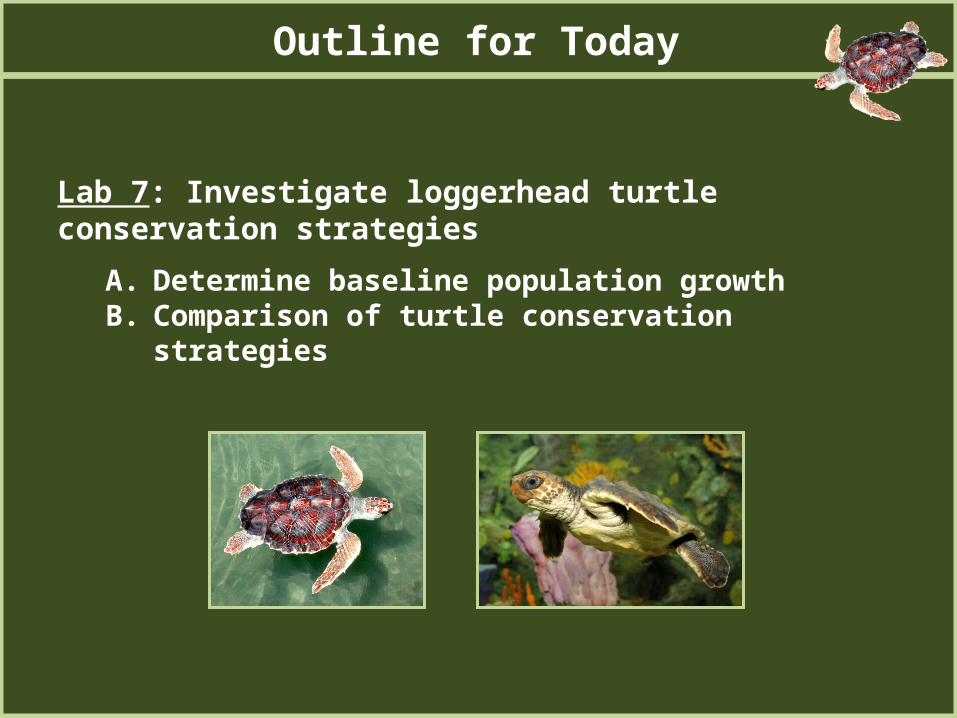
Outline for Today
Lab 7: Investigate loggerhead turtle conservation strategies
A. Determine baseline population growthB. Comparison of turtle conservation strategies
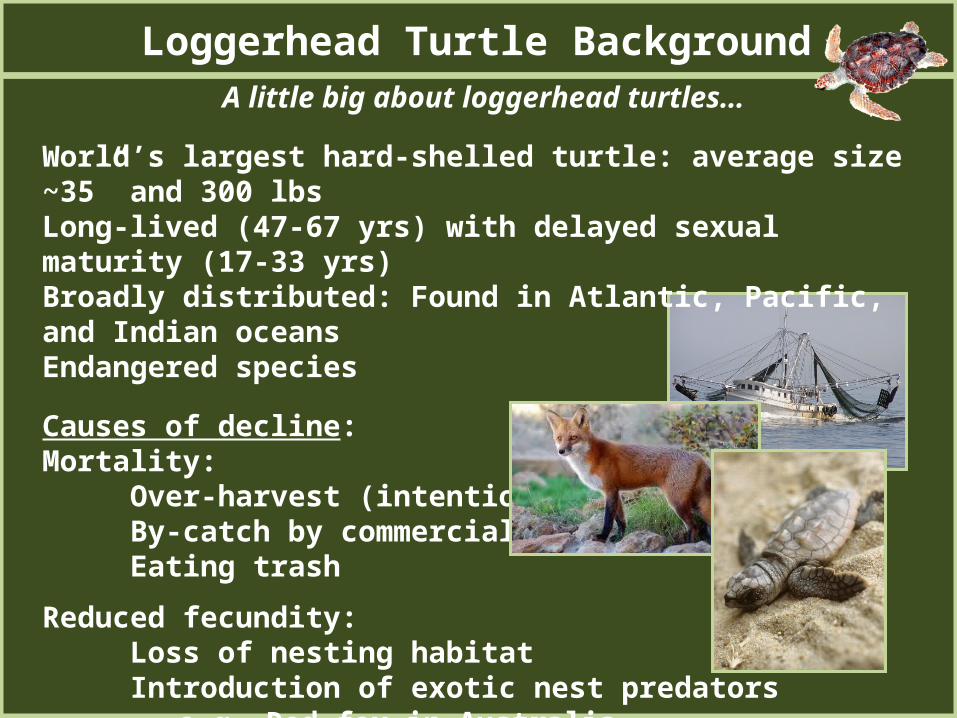
Loggerhead Turtle BackgroundA little big about loggerhead turtles…
World’s largest hard-shelled turtle: average size ~35” and 300 lbs Long-lived (47-67 yrs) with delayed sexual maturity (17-33 yrs)Broadly distributed: Found in Atlantic, Pacific, and Indian oceansEndangered species
Causes of decline:Mortality: Over-harvest (intentional harvest) By-catch by commercial fisheries Eating trash
Reduced fecundity: Loss of nesting habitat Introduction of exotic nest predators
e.g. Red fox in Australia
Subject of intense conservation efforts
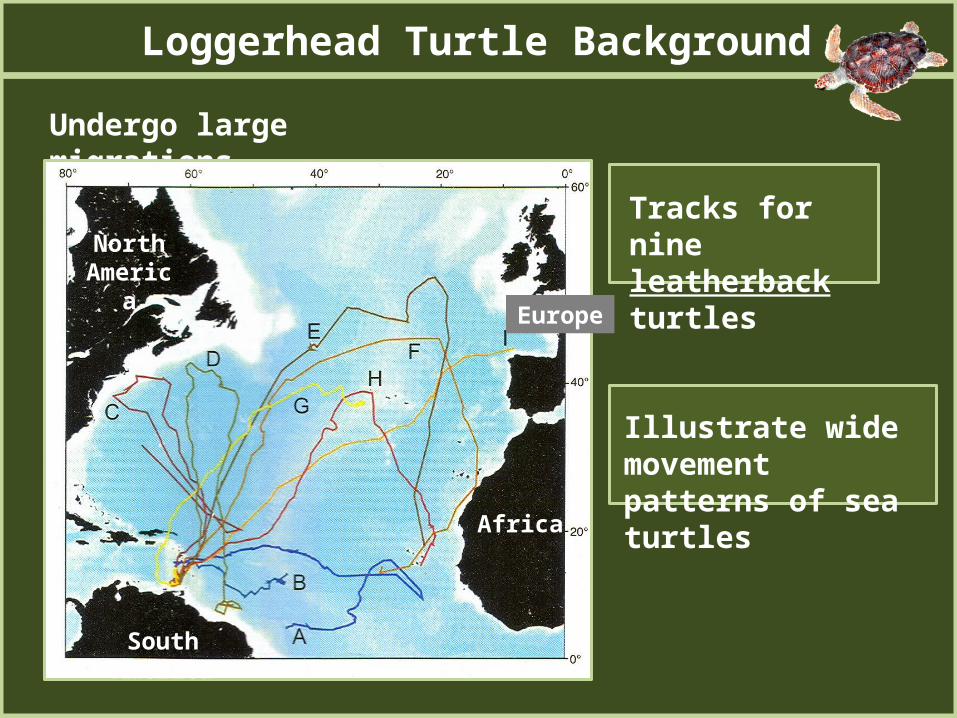
Tracks for nineleatherback turtles
Loggerhead Turtle Background
Undergo large migrations
Illustrate wide movement patterns of sea turtles
Africa
South America
NorthAmerica
Europe
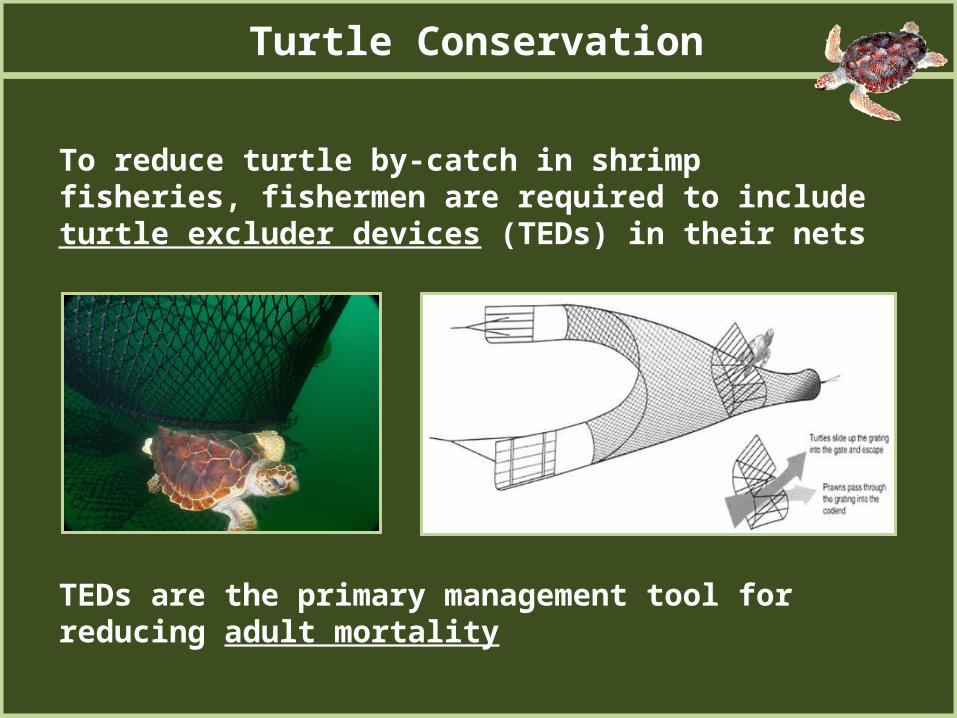
Turtle Conservation
To reduce turtle by-catch in shrimp fisheries, fishermen are required to include turtle excluder devices (TEDs) in their nets
TEDs are the primary management tool for reducing adult mortality
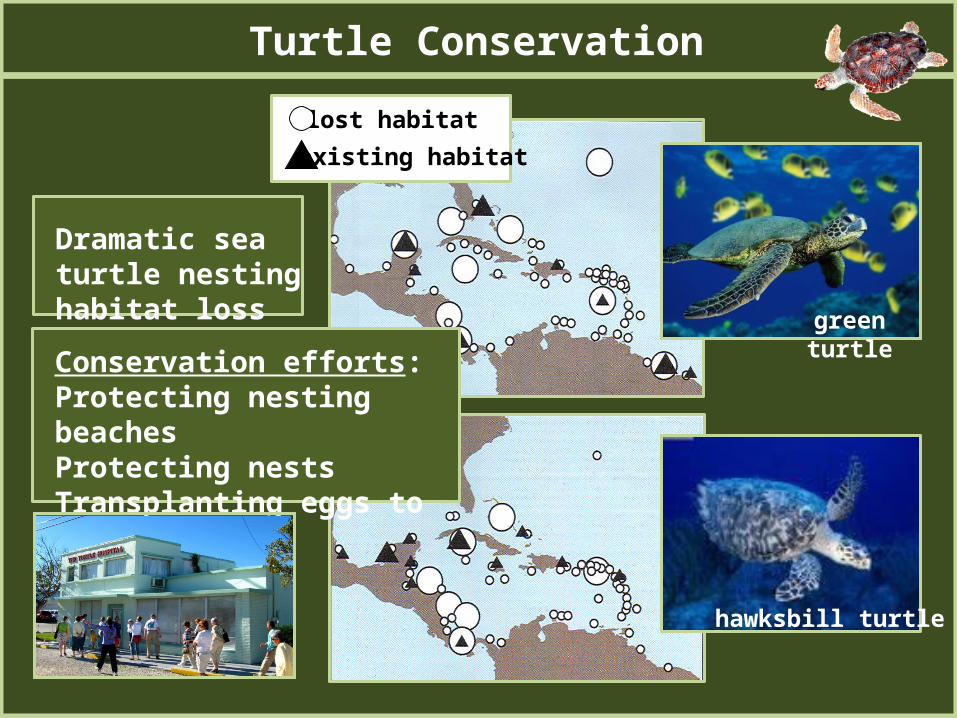
hawksbill turtle
Turtle Conservation
lost habitat
existing habitat
Dramatic sea turtle nesting habitat loss
green turtle
Conservation efforts:Protecting nesting beachesProtecting nestsTransplanting eggs to hatcheries
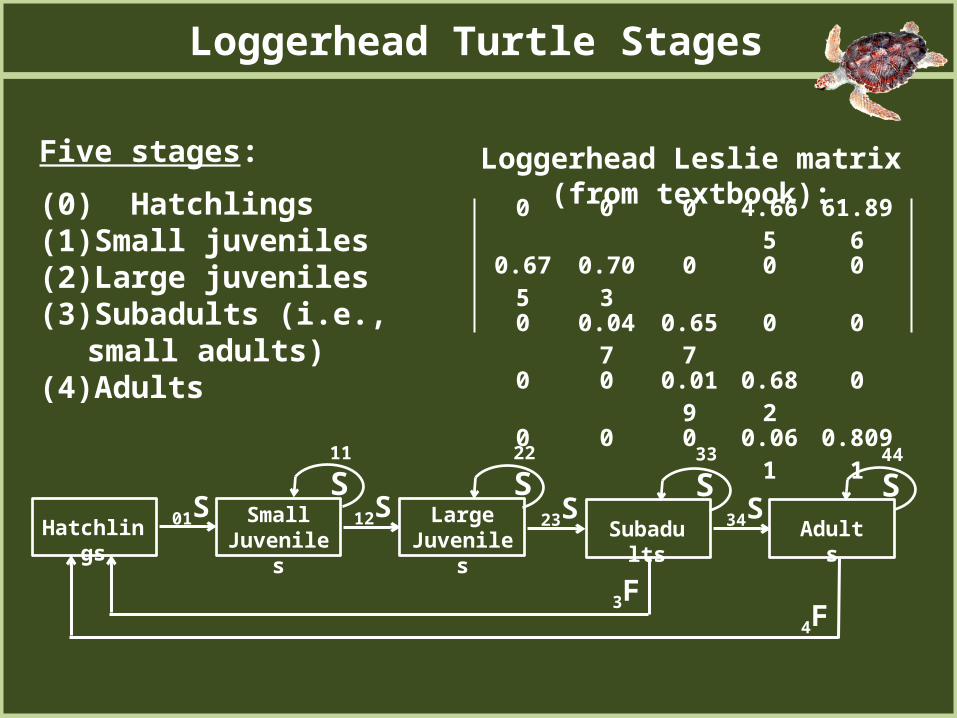
Loggerhead Turtle Stages
Five stages:
(0) Hatchlings(1) Small juveniles(2) Large juveniles(3) Subadults (i.e., small adults)(4) Adults
0 0 0 4.665 61.8960.675 0.703 0 0 0
0 0.047 0.657 0 00 0 0.019 0.682 00 0 0 0.061 0.8091
4F
HatchlingsSmall
Juveniles01S 12S 23S 34SSubadults Adults
3F
Large Juveniles
33S 44S22S11S
Loggerhead Leslie matrix (from textbook):
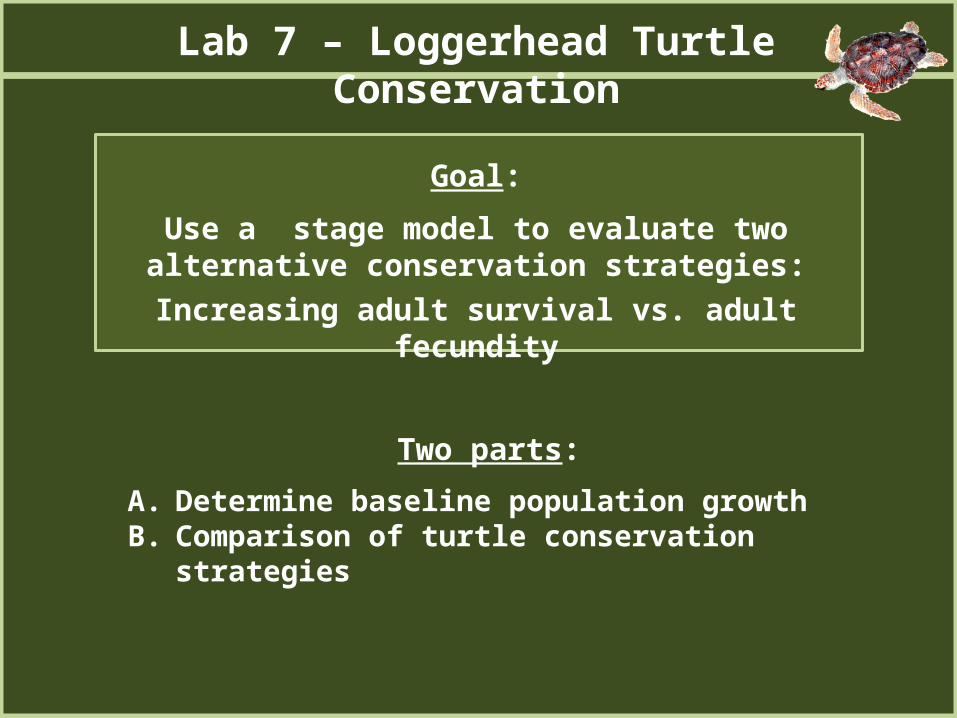
Lab 7 – Loggerhead Turtle Conservation
Goal:
Use a stage model to evaluate twoalternative conservation strategies:
Increasing adult survival vs. adult fecundity
Two parts:
A. Determine baseline population growthB. Comparison of turtle conservation strategies
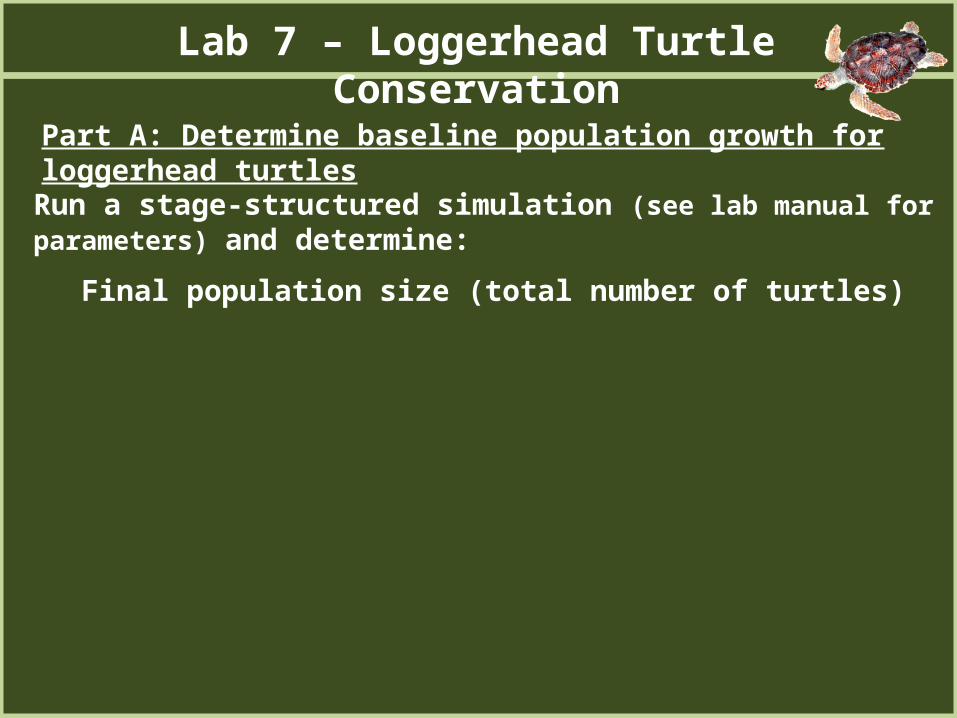
Part A: Determine baseline population growth for loggerhead turtles
Lab 7 – Loggerhead Turtle Conservation
Run a stage-structured simulation (see lab manual for parameters) and determine:
Final population size (total number of turtles)
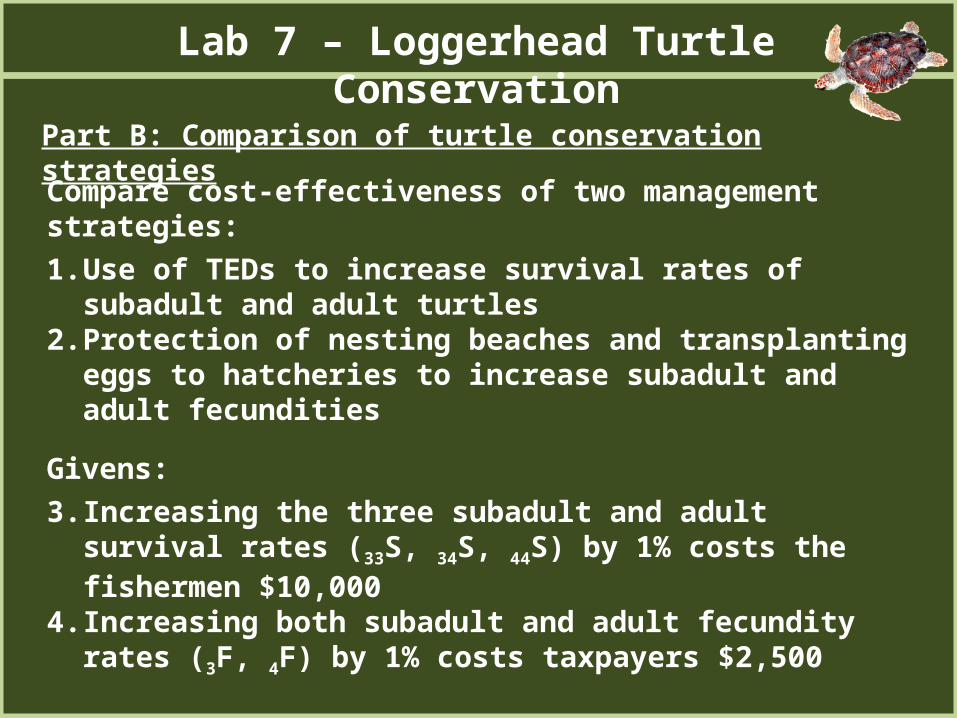
Part B: Comparison of turtle conservation strategies
Lab 7 – Loggerhead Turtle Conservation
Compare cost-effectiveness of two management strategies:
1. Use of TEDs to increase survival rates of subadult and adult turtles2. Protection of nesting beaches and transplanting eggs to hatcheries to
increase subadult and adult fecundities
Givens:
3. Increasing the three subadult and adult survival rates (33S, 34S, 44S) by 1% costs the fishermen $10,000
4. Increasing both subadult and adult fecundity rates (3F, 4F) by 1% costs taxpayers $2,500
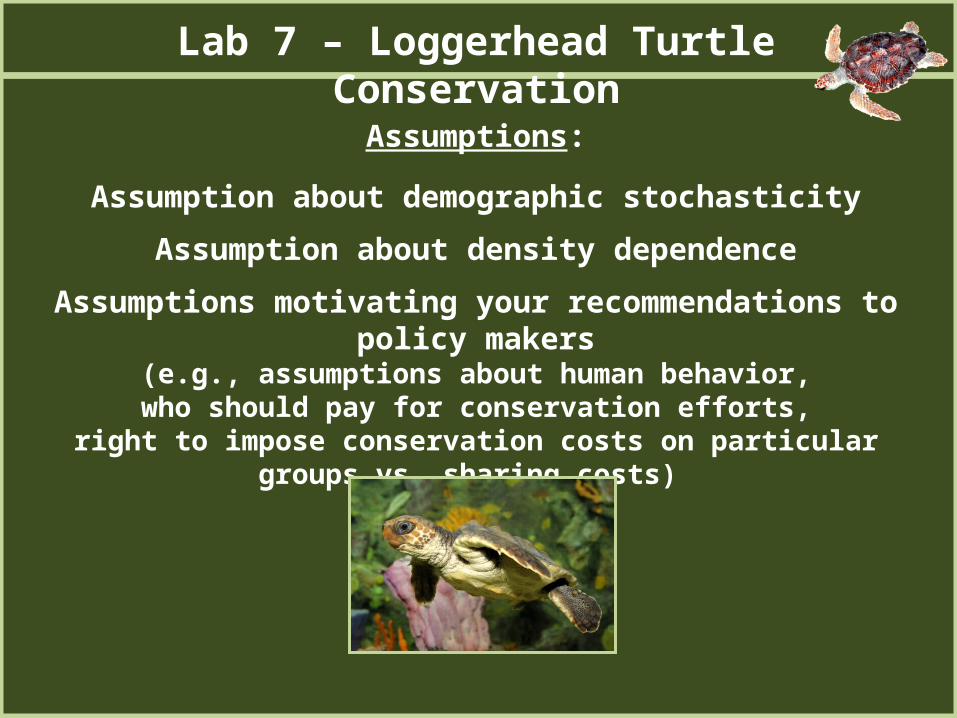
Assumptions:
Assumption about demographic stochasticity
Assumption about density dependence
Assumptions motivating your recommendations to policy makers(e.g., assumptions about human behavior,who should pay for conservation efforts,
right to impose conservation costs on particular groups vs. sharing costs)
Lab 7 – Loggerhead Turtle Conservation


![Loggerhead Sea Turtle Final[1]](https://img.pdfslide.net/doc/110x75/616b5b2ba9eefc2a5f618e00/loggerhead-sea-turtle-final1.jpg)