Embed Size (px)
Citation preview
Affirmative Action in Iowa
An Annual Review of Affirmative Action in the Executive Branch of State Government
September 2005
-1-
FY 2005 Affirmative Action Report
Affirmative Action in IowaAn Annual Review of Affirmative Action
in the Executive Branch of State Government
Iowa Department of Administrative ServicesHuman Resources Enterprise
September 30, 2005
Please direct all questions and comments to:
Joseph EllisIowa Department of Administrative Services
Human Resources EnterpriseGrimes State Office Building
400 East FourteenthDes Moines, IA 50319-0150
joe.ellis@ iowa.gov
FY 2005 Affirmative Action Report
Table of ContentsEXECUTIVE SUMMARY
Underutilization in the State’s Workforce...................................1FY 2005 Hiring Goals Achievement............................................2Changes in the State’s Workforce..............................................2
STATE AFFIRMATIVE ACTION PLAN.................................3FY 2005 GOAL ACHIEVEMENT............................................6FY 2006 UNDERUTILIZATION & GOALS............................. 9DAS-HRE FY 2005 ACTIVITIES
Partnerships to Employ Persons with Disabilities.....................11Older Worker Initiative Task Force...........................................12State Diversity Conference......................................................12State Coordinated Recruitment................................................13Minority Recruitment Task Force.............................................13AA/EEO/Diversity Training........................................................14Department Activities .............................................................15
FY 2006 RECOMMENDATIONS.........................................17DAS-HRE FY 2006 PLANS..........................................................18APPENDICES
A. Affirmative Action Analysis by Department.......................20B. Workforce Composition......................................................62C. Workforce Composition Over 10 Years...........................65D. Minority 5-Year Net Change by Department .....................68E. Glossary.............................................................................69

FY 2005 Affirmative Action Report
EXECUTIVE SUMMARY
The FY 2005 Affirmative Action Report describes the affirmative action efforts of Iowa executive branch departments during the period of June 18, 2004 through June 30, 2005. This report analyzes the progress that Iowa departments made to better represent females, minorities and persons with disabilities in the State’s workforce. The report highlights the qualitative efforts made to implement policies and practices that will bring more diversity into State employment.
This report also assesses the overall underutilization in the State’s workforce and the impact of the 2000 Census on these calculations. Departments’ quantitative efforts to remedy this underutilization ultimately reflect changes in the State’s workforce composition.
Underutilization in the State’s WorkforceFor the first time, the calculation of underutilization for females and minorities was based on the 2000 Census. This is the labor force standard used to measure the diversity of the State’s workforce. The 2000 Census shows that during the 1990’s, minority representation in the Iowa labor force increased from 3.4% to 6.03%. Key to this increase was the approximate 240% increase of Latinos alone. Female representation in the labor force increased during the 1990’s in several key areas: labor force overall—from 46.0% to 47.4%, Officials and Managers—from 28.4% to 34.7% and Professionals—from 54.4% to 58.2%. Notwithstanding the progress departments made in the past, the State’s representation of females, minorities and persons with disabilities did not kept pace with the growing labor force. Consequently, underutilization of females, minorities and persons with disabilities increased.
In fiscal year 2005, underutilization totaled 656 females, 210 minorities and 662 persons with disabilities. (See “FY ’05 Underutilization & Remedial Goals.”)
For fiscal year 2006, total underutilization of females and minorities and persons with disabilities increased to 847, 295 and 708, respectively. (See FY ’06 Underutilization & Remedial Goals.)
-2-
FY 2005 Affirmative Action Report
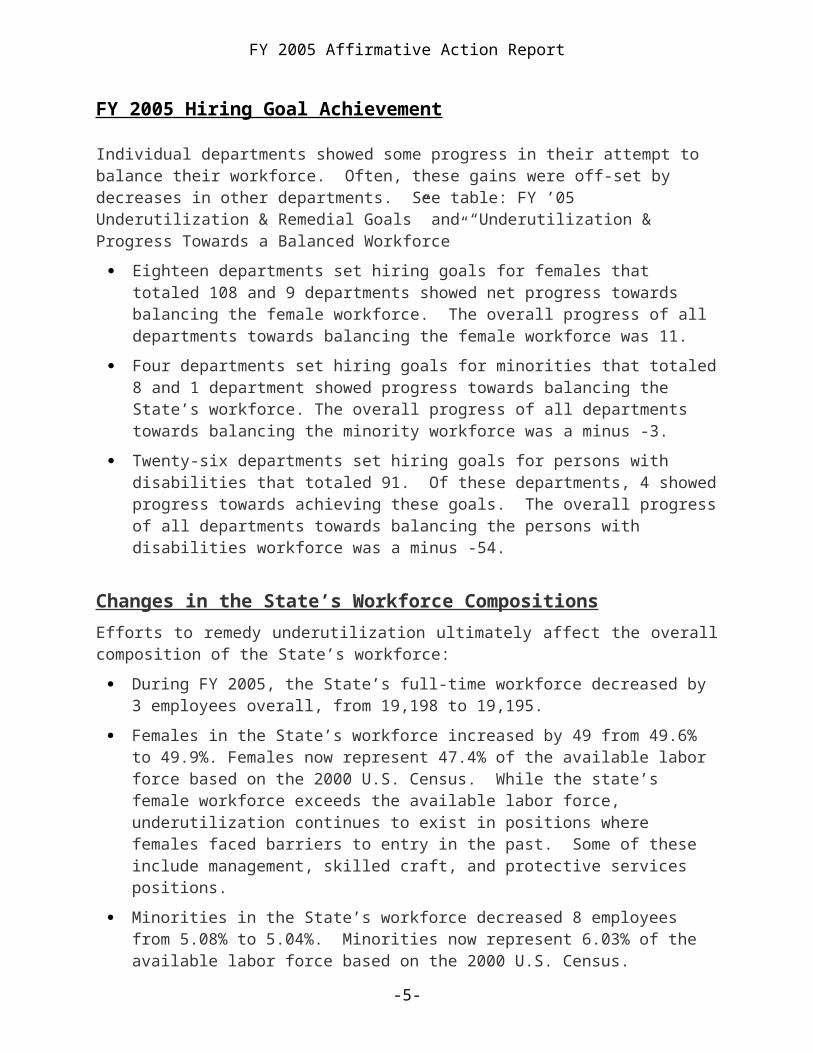
FY 2005 Hiring Goal Achievement
Individual departments showed some progress in their attempt to balance their workforce. Often, these gains were off-set by decreases in other departments. See table: FY ’05 Underutilization & Remedial Goals” and “Underutilization & Progress Towards a Balanced Workforce”
Eighteen departments set hiring goals for females that totaled 108 and 9 departments showed net progress towards balancing the female workforce. The overall progress of all departments towards balancing the female workforce was 11.
Four departments set hiring goals for minorities that totaled 8 and 1 department showed progress towards balancing the State’s workforce. The overall progress of all departments towards balancing the minority workforce was a minus -3.
Twenty-six departments set hiring goals for persons with disabilities that totaled 91. Of these departments, 4 showed progress towards achieving these goals. The overall progress of all departments towards balancing the persons with disabilities workforce was a minus -54.
Changes in the State’s Workforce CompositionsEfforts to remedy underutilization ultimately affect the overall composition of the State’s workforce:
During FY 2005, the State’s full-time workforce decreased by 3 employees overall, from 19,198 to 19,195.
Females in the State’s workforce increased by 49 from 49.6% to 49.9%. Females now represent 47.4% of the available labor force based on the 2000 U.S. Census. While the state’s female workforce exceeds the available labor force, underutilization continues to exist in positions where females faced barriers to entry in the past. Some of these include management, skilled craft, and protective services positions.
Minorities in the State’s workforce decreased 8 employees from 5.08% to 5.04%. Minorities now represent 6.03% of the available labor force based on the 2000 U.S. Census.
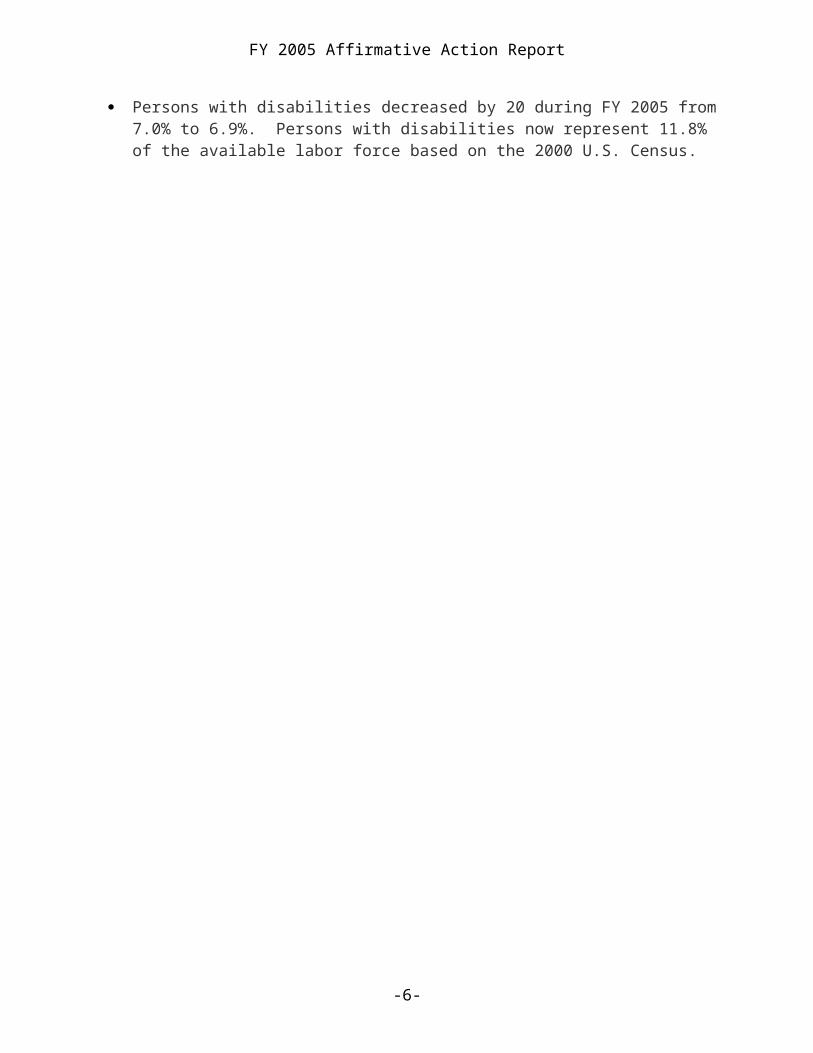
Persons with disabilities decreased by 20 during FY 2005 from 7.0% to 6.9%. Persons with disabilities now represent 11.8% of the available labor force based on the 2000 U.S. Census.
-3-

FY 2005 Affirmative Action Report
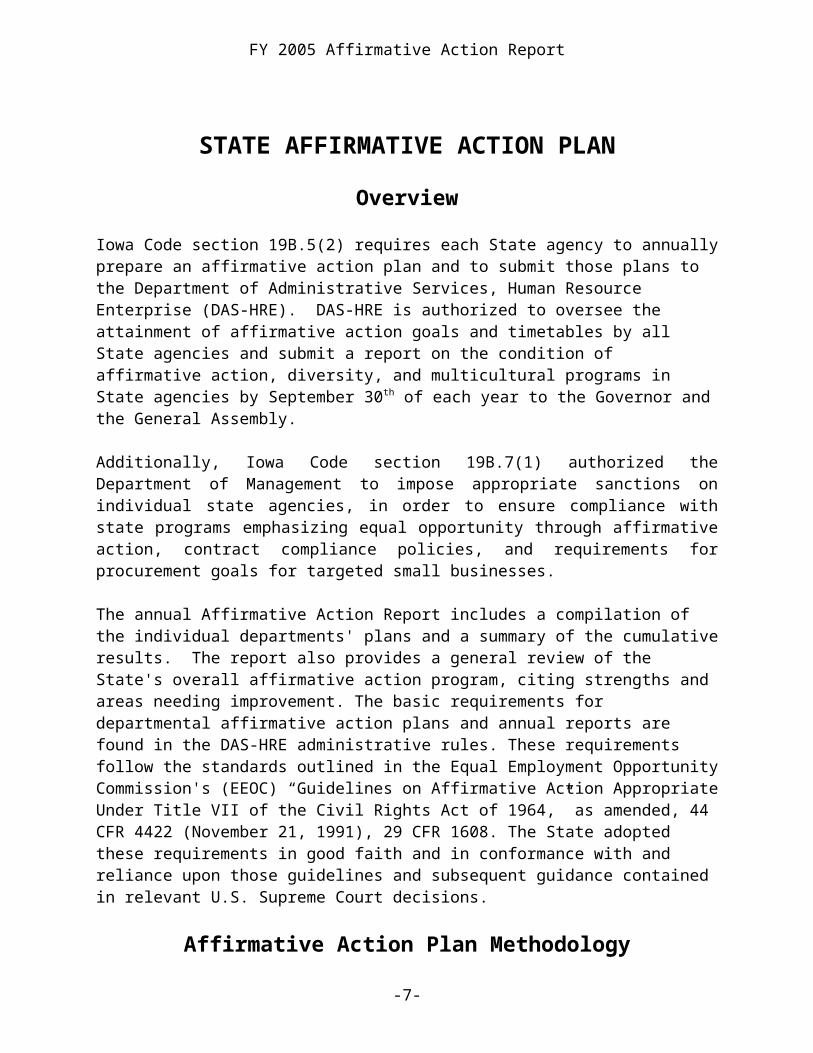
STATE AFFIRMATIVE ACTION PLANOverview
Iowa Code section 19B.5(2) requires each State agency to annually prepare an affirmative action plan and to submit those plans to the Department of Administrative Services, Human Resource Enterprise (DAS-HRE). DAS-HRE is authorized to oversee the attainment of affirmative action goals and timetables by all State agencies and submit a report on the condition of affirmative action, diversity, and multicultural programs in State agencies by September 30th of each year to the Governor and the General Assembly.
Additionally, Iowa Code section 19B.7(1) authorized the Department of Management to impose appropriate sanctions on individual state agencies, in order to ensure compliance with state programs emphasizing equal opportunity through affirmative action, contract compliance policies, and requirements for procurement goals for targeted small businesses.
The annual Affirmative Action Report includes a compilation of the individual departments' plans and a summary of the cumulative results. The report also provides a general review of the State's overall affirmative action program, citing strengths and areas needing improvement. The basic requirements for departmental affirmative action plans and annual reports are found in the DAS-HRE administrative rules. These requirements follow the standards outlined in the Equal Employment Opportunity Commission's (EEOC) “Guidelines on Affirmative Action Appropriate Under Title VII of the Civil Rights Act of 1964,” as amended, 44 CFR 4422 (November 21, 1991), 29 CFR 1608. The State adopted these requirements in good faith and in conformance with and reliance upon those guidelines and subsequent guidance contained in relevant U.S. Supreme Court decisions.
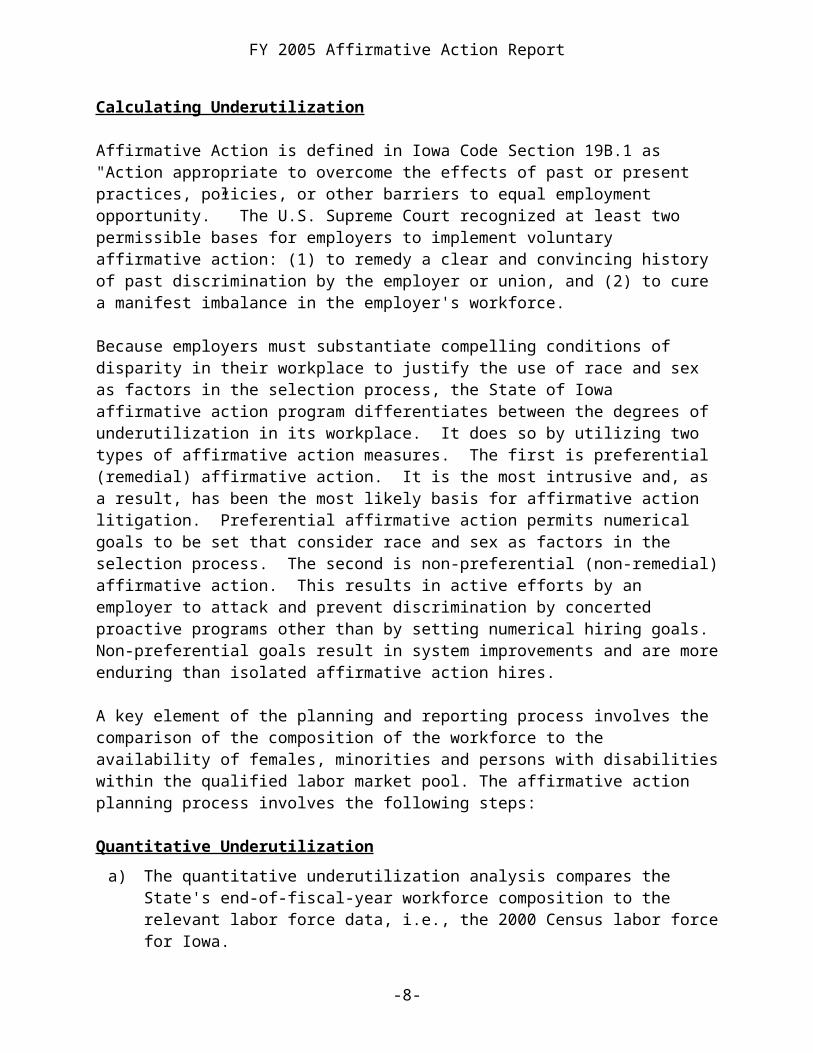
Affirmative Action Plan MethodologyCalculating Underutilization
Affirmative Action is defined in Iowa Code Section 19B.1 as "Action appropriate to overcome the effects of past or present practices, policies, or other barriers to equal employment opportunity.” The U.S. Supreme Court recognized at least two permissible bases for employers to implement voluntary affirmative action: (1) to remedy a clear and convincing history of past discrimination by the employer or union, and (2) to cure a manifest imbalance in the employer's workforce.
Because employers must substantiate compelling conditions of disparity in their workplace to justify the use of race and sex as factors in the selection
-4-
FY 2005 Affirmative Action Report
process, the State of Iowa affirmative action program differentiates between the degrees of underutilization in its workplace. It does so by utilizing two types of affirmative action measures. The first is preferential (remedial) affirmative action. It is the most intrusive and, as a result, has been the most likely basis for affirmative action litigation. Preferential affirmative action permits numerical goals to be set that consider race and sex as factors in the selection process. The second is non-preferential (non-remedial) affirmative action. This results in active efforts by an employer to attack and prevent discrimination by concerted proactive programs other than by setting numerical hiring goals. Non-preferential goals result in system improvements and are more enduring than isolated affirmative action hires.
A key element of the planning and reporting process involves the comparison of the composition of the workforce to the availability of females, minorities and persons with disabilities within the qualified labor market pool. The affirmative action planning process involves the following steps:
Quantitative Underutilizationa) The quantitative underutilization analysis compares the State's end-of-
fiscal-year workforce composition to the relevant labor force data, i.e., the 2000 Census labor force for Iowa.
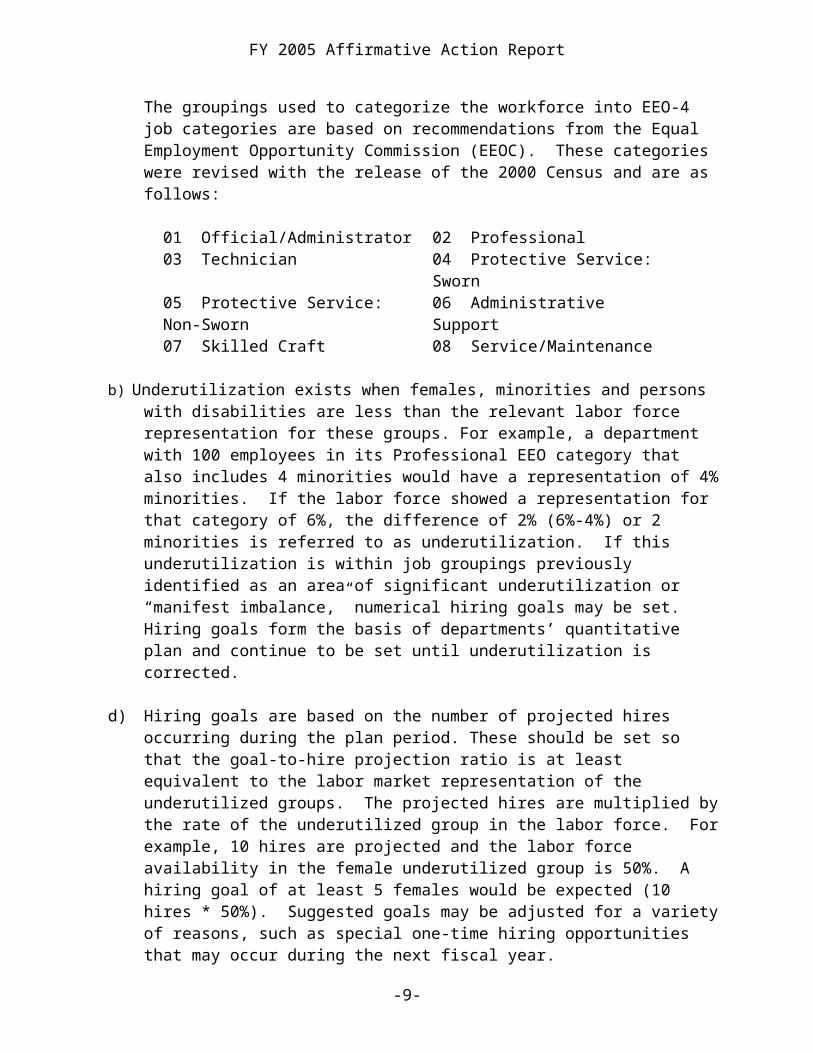
The groupings used to categorize the workforce into EEO-4 job categories are based on recommendations from the Equal Employment Opportunity Commission (EEOC). These categories were revised with the release of the 2000 Census and are as follows:
01 Official/Administrator 02 Professional03 Technician 04 Protective Service:
Sworn05 Protective Service: Non-Sworn
06 Administrative Support
07 Skilled Craft 08 Service/Maintenance
b) Underutilization exists when females, minorities and persons with disabilities are less than the relevant labor force representation for these groups. For example, a department with 100 employees in its Professional EEO category that also includes 4 minorities would have a representation of 4% minorities. If the labor force showed a representation for that category of 6%, the difference of 2% (6%-4%) or 2 minorities is referred to as underutilization. If this underutilization is within job groupings previously identified as an area of significant underutilization or “manifest imbalance,” numerical hiring goals may be set. Hiring goals form the basis of departments’ quantitative plan and continue to be set until underutilization is corrected.
-5-
FY 2005 Affirmative Action Report
d) Hiring goals are based on the number of projected hires occurring during the plan period. These should be set so that the goal-to-hire projection ratio is at least equivalent to the labor market representation of the underutilized groups. The projected hires are multiplied by the rate of the underutilized group in the labor force. For example, 10 hires are projected and the labor force availability in the female underutilized group is 50%. A hiring goal of at least 5 females would be expected (10 hires * 50%). Suggested goals may be adjusted for a variety of reasons, such as special one-time hiring opportunities that may occur during the next fiscal year.
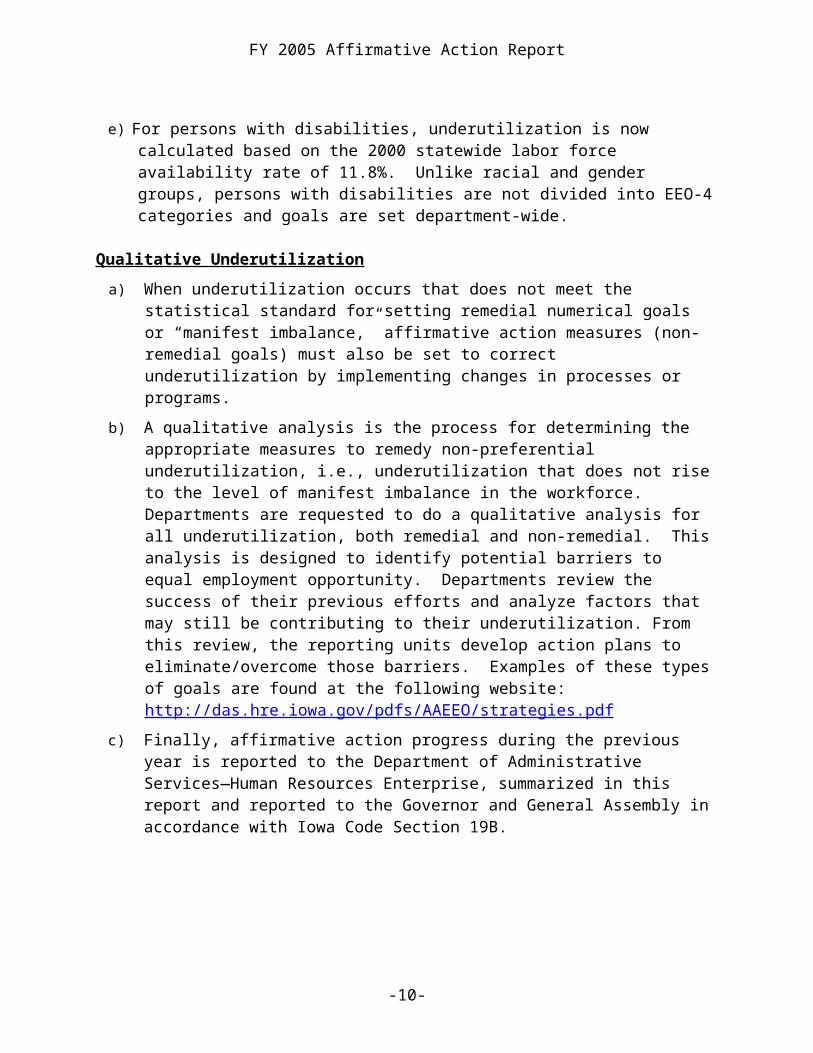
e) For persons with disabilities, underutilization is now calculated based on the 2000 statewide labor force availability rate of 11.8%. Unlike racial and gender groups, persons with disabilities are not divided into EEO-4 categories and goals are set department-wide.
Qualitative Underutilizationa) When underutilization occurs that does not meet the statistical
standard for setting remedial numerical goals or “manifest imbalance,” affirmative action measures (non-remedial goals) must also be set to correct underutilization by implementing changes in processes or programs.
b) A qualitative analysis is the process for determining the appropriate measures to remedy non-preferential underutilization, i.e., underutilization that does not rise to the level of manifest imbalance in the workforce. Departments are requested to do a qualitative analysis for all underutilization, both remedial and non-remedial. This analysis is designed to identify potential barriers to equal employment opportunity. Departments review the success of their previous efforts and analyze factors that may still be contributing to their underutilization. From this review, the reporting units develop action plans to eliminate/overcome those barriers. Examples of these types of goals are found at the following website: http://das.hre.iowa.gov/pdfs/AAEEO/strategies.pdf
c) Finally, affirmative action progress during the previous year is reported to the Department of Administrative Services—Human Resources Enterprise, summarized in this report and reported to the Governor and General Assembly in accordance with Iowa Code Section 19B.
-6-
FY 2005 Affirmative Action Report
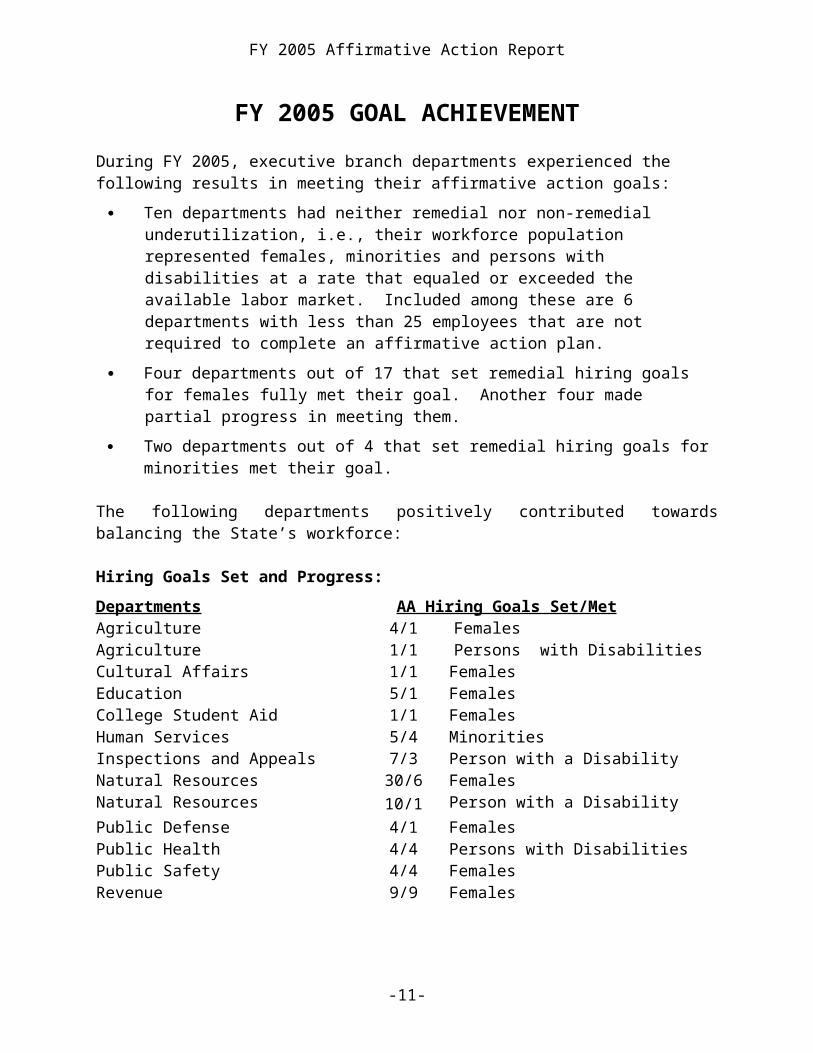
FY 2005 GOAL ACHIEVEMENTDuring FY 2005, executive branch departments experienced the following results in meeting their affirmative action goals:
Ten departments had neither remedial nor non-remedial underutilization, i.e., their workforce population represented females, minorities and persons with disabilities at a rate that equaled or exceeded the available labor market. Included among these are 6 departments with less than 25 employees that are not required to complete an affirmative action plan.
Four departments out of 17 that set remedial hiring goals for females fully met their goal. Another four made partial progress in meeting them.
Two departments out of 4 that set remedial hiring goals for minorities met their goal.
The following departments positively contributed towards balancing the State’s workforce:
Hiring Goals Set and Progress:Departments AA Hiring Goals Set/MetAgriculture 4/1 FemalesAgriculture 1/1 Persons with DisabilitiesCultural Affairs 1/1 FemalesEducation 5/1 FemalesCollege Student Aid 1/1 FemalesHuman Services 5/4 MinoritiesInspections and Appeals 7/3 Person with a DisabilityNatural Resources 30/6 FemalesNatural Resources 10/1 Person with a DisabilityPublic Defense 4/1 FemalesPublic Health 4/4 Persons with DisabilitiesPublic Safety 4/4 FemalesRevenue 9/9 Females
-7-
FY 2005 Affirmative Action Report
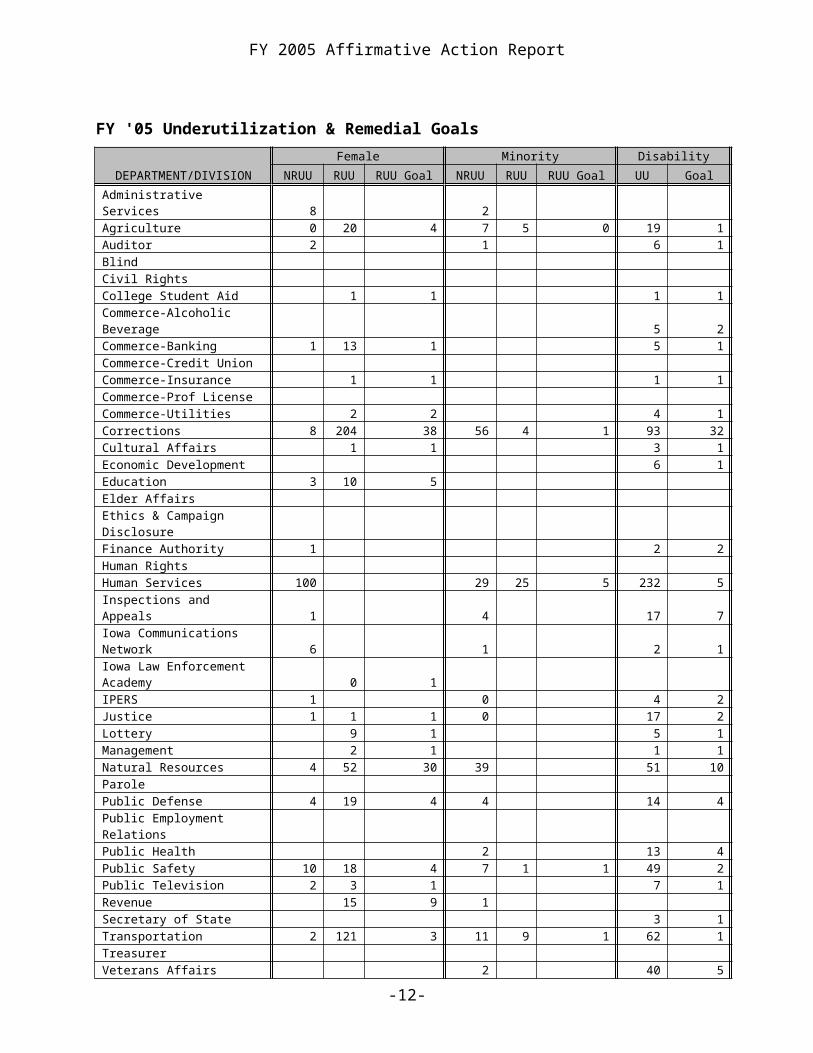
FY '05 Underutilization & Remedial Goals
DEPARTMENT/DIVISION
Female Minority Disability
NRUU RUU RUU Goal NRUURUU RUU Goal UU Goal
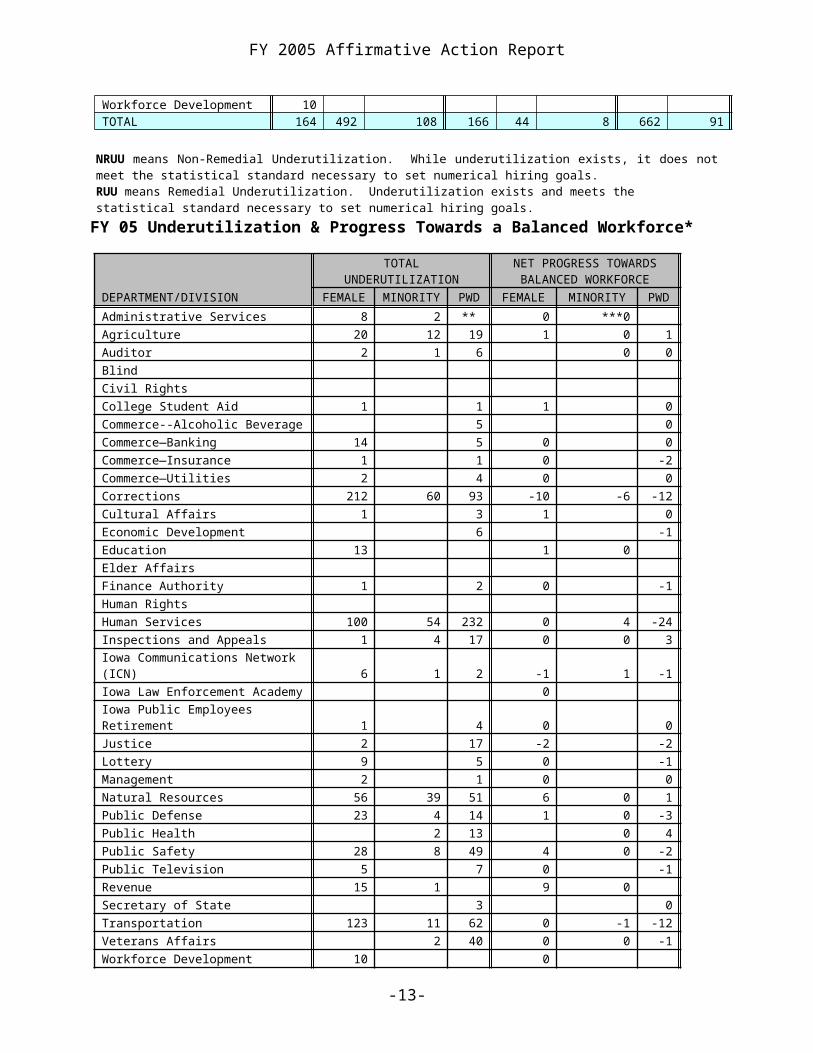
Administrative Services 8 2 Agriculture 0 20 4 7 5 0 19 1Auditor 2 1 6 1Blind Civil Rights College Student Aid 1 1 1 1Commerce-Alcoholic Beverage 5 2Commerce-Banking 1 13 1 5 1Commerce-Credit Union Commerce-Insurance 1 1 1 1Commerce-Prof License Commerce-Utilities 2 2 4 1Corrections 8 204 38 56 4 1 93 32Cultural Affairs 1 1 3 1Economic Development 6 1Education 3 10 5 Elder Affairs Ethics & Campaign Disclosure Finance Authority 1 2 2Human Rights Human Services 100 29 25 5 232 5Inspections and Appeals 1 4 17 7Iowa Communications Network 6 1 2 1Iowa Law Enforcement Academy 0 1 IPERS 1 0 4 2Justice 1 1 1 0 17 2Lottery 9 1 5 1Management 2 1 1 1Natural Resources 4 52 30 39 51 10Parole Public Defense 4 19 4 4 14 4Public Employment Relations Public Health 2 13 4Public Safety 10 18 4 7 1 1 49 2Public Television 2 3 1 7 1Revenue 15 9 1 Secretary of State 3 1Transportation 2 121 3 11 9 1 62 1Treasurer Veterans Affairs 2 40 5Workforce Development 10 TOTAL 164 492 108 166 44 8 662 91
NRUU means Non-Remedial Underutilization. While underutilization exists, it does not meet the statistical standard necessary to set numerical hiring goals.RUU means Remedial Underutilization. Underutilization exists and meets the statistical standard necessary to set numerical hiring goals.
FY 05 Underutilization & Progress Towards a Balanced Workforce*
-8-
FY 2005 Affirmative Action Report
TOTAL
UNDERUTILIZATIONNET PROGRESS TOWARDS BALANCED WORKFORCE
DEPARTMENT/DIVISION FEMALEMINORIT
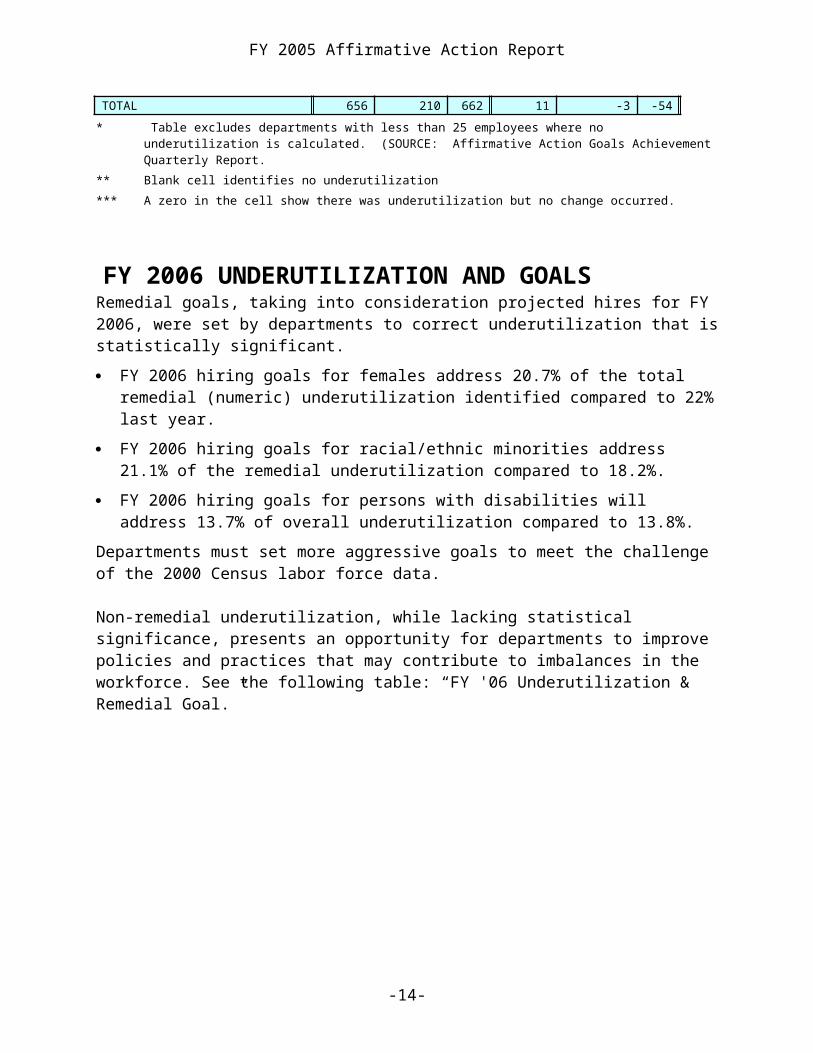
Y PWD FEMALE MINORITY PWDAdministrative Services 8 2 ** 0 ***0 Agriculture 20 12 19 1 0 1Auditor 2 1 6 0 0Blind Civil Rights College Student Aid 1 1 1 0Commerce--Alcoholic Beverage 5 0Commerce—Banking 14 5 0 0Commerce—Insurance 1 1 0 -2Commerce—Utilities 2 4 0 0Corrections 212 60 93 -10 -6 -12Cultural Affairs 1 3 1 0Economic Development 6 -1Education 13 1 0 Elder Affairs Finance Authority 1 2 0 -1Human Rights Human Services 100 54 232 0 4 -24Inspections and Appeals 1 4 17 0 0 3Iowa Communications Network (ICN) 6 1 2 -1 1 -1Iowa Law Enforcement Academy 0 Iowa Public Employees Retirement 1 4 0 0Justice 2 17 -2 -2Lottery 9 5 0 -1Management 2 1 0 0Natural Resources 56 39 51 6 0 1Public Defense 23 4 14 1 0 -3Public Health 2 13 0 4Public Safety 28 8 49 4 0 -2Public Television 5 7 0 -1Revenue 15 1 9 0 Secretary of State 3 0Transportation 123 11 62 0 -1 -12Veterans Affairs 2 40 0 0 -1Workforce Development 10 0 TOTAL 656 210 662 11 -3 -54
* Table excludes departments with less than 25 employees where no underutilization is calculated. (SOURCE: Affirmative Action Goals Achievement Quarterly Report.
** Blank cell identifies no underutilization*** A zero in the cell show there was underutilization but no change occurred.
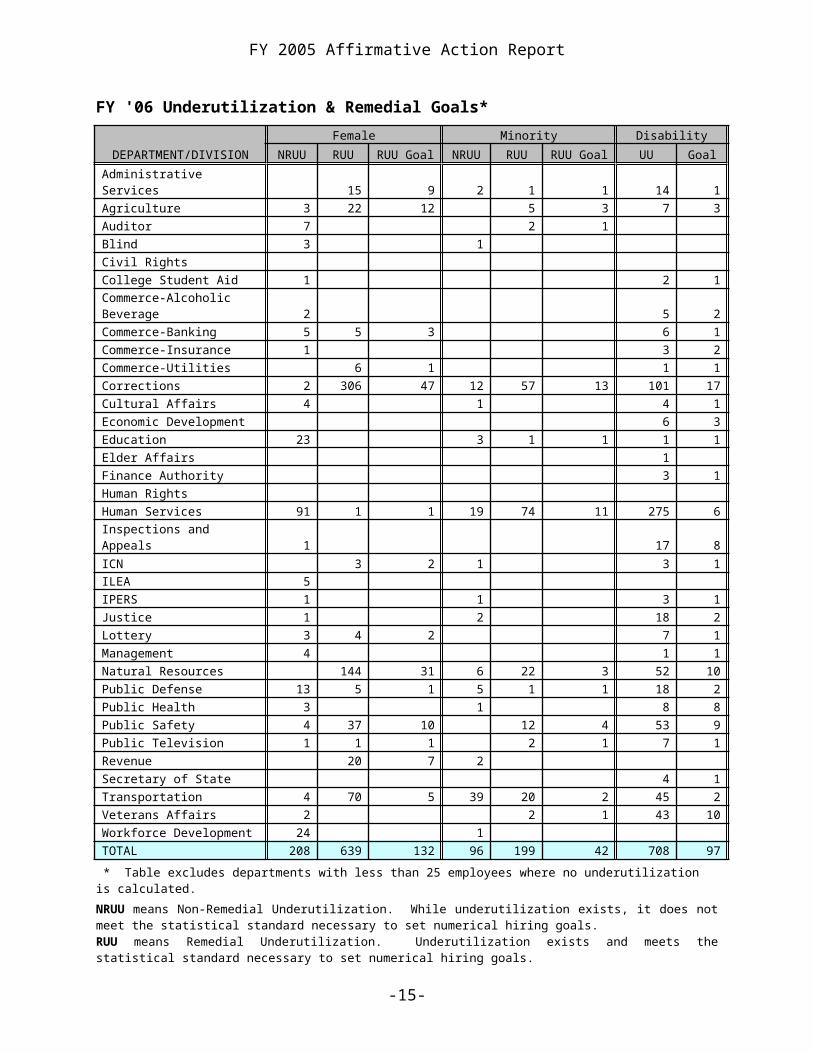
FY 2006 UNDERUTILIZATION AND GOALSRemedial goals, taking into consideration projected hires for FY 2006, were set by departments to correct underutilization that is statistically significant.
-9-
FY 2005 Affirmative Action Report
FY 2006 hiring goals for females address 20.7% of the total remedial (numeric) underutilization identified compared to 22% last year.
FY 2006 hiring goals for racial/ethnic minorities address 21.1% of the remedial underutilization compared to 18.2%.
FY 2006 hiring goals for persons with disabilities will address 13.7% of overall underutilization compared to 13.8%.
Departments must set more aggressive goals to meet the challenge of the 2000 Census labor force data.
Non-remedial underutilization, while lacking statistical significance, presents an opportunity for departments to improve policies and practices that may contribute to imbalances in the workforce. See the following table: “FY '06 Underutilization & Remedial Goal.”
-10-
FY 2005 Affirmative Action Report
FY '06 Underutilization & Remedial Goals*
DEPARTMENT/DIVISIONFemale Minority Disability
NRUU RUU RUU Goal NRUU RUU RUU Goal UU GoalAdministrative Services 15 9 2 1 1 14 1Agriculture 3 22 12 5 3 7 3Auditor 7 2 1 Blind 3 1 Civil Rights College Student Aid 1 2 1Commerce-Alcoholic Beverage 2 5 2Commerce-Banking 5 5 3 6 1Commerce-Insurance 1 3 2Commerce-Utilities 6 1 1 1Corrections 2 306 47 12 57 13 101 17Cultural Affairs 4 1 4 1Economic Development 6 3Education 23 3 1 1 1 1Elder Affairs 1 Finance Authority 3 1Human Rights Human Services 91 1 1 19 74 11 275 6Inspections and Appeals 1 17 8ICN 3 2 1 3 1ILEA 5 IPERS 1 1 3 1Justice 1 2 18 2Lottery 3 4 2 7 1Management 4 1 1Natural Resources 144 31 6 22 3 52 10Public Defense 13 5 1 5 1 1 18 2Public Health 3 1 8 8Public Safety 4 37 10 12 4 53 9Public Television 1 1 1 2 1 7 1Revenue 20 7 2 Secretary of State 4 1Transportation 4 70 5 39 20 2 45 2Veterans Affairs 2 2 1 43 10Workforce Development 24 1 TOTAL 208 639 132 96 199 42 708 97
* Table excludes departments with less than 25 employees where no underutilization is calculated.NRUU means Non-Remedial Underutilization. While underutilization exists, it does not meet the statistical standard necessary to set numerical hiring goals.RUU means Remedial Underutilization. Underutilization exists and meets the statistical standard necessary to set numerical hiring goals.
-11-
FY 2005 Affirmative Action Report
DAS-HRE FY 2005 ACTIVITIESPartnerships to Employ Persons with Disabilities
During FY 2005, DAS-HRE expanded its involvement in partnerships to employ more persons with disabilities in State government. This continues the efforts begun during FY 2004 when DAS-HRE partnered with the Department of Human Rights—Division of Persons with Disabilities (DHR) to address the underutilization of persons with disabilities in the State’s workforce. DHR recognized the importance of helping the State become a model employer and ensuring that, as an employer, the State was identifying and removing barriers to the employment of persons with disabilities. Partnerships were expanded in the following additional ways:
Central Iowa Employment and Training Consortium (CIETC)—Project Employment. Project Employment is a CIETC program that focuses on serving people with disabilities with less than a high school education who are seeking employment and job advancement. DAS-HRE now serves as a member of CIETC’s System Resource Team and through this participation it has done the following: Met regularly as a member of the CIETC Resource Team to discuss
coordination of services. Collaborated with CIETC—Project Employment Team to draft a
Memorandum of Understanding (MOU) for the purpose of improving and increasing coordination and collaboration between our agencies.
Shared information on employment opportunities within State government.
Requested assistance from Project Employment to refer its clients to the State of Iowa for employment.
Olmstead Plan : Governor’s Executive Order 27 specifically directed State agencies to undertake steps to identify and address barriers to community living for individuals with disabilities and long-term illness in Iowa. DAS-HRE and the DAS General Services Enterprise (GSE) were among several State agencies that participated in the initiative to identify employment and other barriers in State government for persons with disabilities. The Executive Order resulted from the U.S. Supreme Court decision, Olmstead v. L.C., 527 U.S. 581 (1999), that interpreted Title II of the Americans with Disabilities Act (ADA) to require “States to place qualified individuals with disabilities in community settings, rather than in institutions, whenever treatment professionals determine that such placement is appropriate, the affected persons do not oppose such
-12-
FY 2005 Affirmative Action Report
placement, and the State can reasonably accommodate the placement….”
Activities undertaken during FY 2005 continue the coordination begun with the merger of HRE and GSE implementation plans. This coordinated effort between these two divisions merged staffing and accessibility concerns and provided the base to address a broader range of barriers confronting persons with disabilities.
Presentations were also made to department leadership staff to assist them to better address disability issues in the workplace.
Additional Outreach : DAS-HRE met with the Mainstream Living Employment Preparation Class to discuss State employment and expectation in the workplace. These initiatives help program participants to become job ready. They also assist the State in its recruitment efforts for persons with disabilities.
Older Worker Initiative Task ForceDuring FY 2005, the “Iowa State Task Force on the Mature Worker” was created. Its purpose was to design and, thereafter, the oversight of the implementation of the Iowa State Mature Worker effort. Among its initiatives are to host regional and statewide conferences. The State of Iowa and numerous organizations partnered with AARP Foundation’s Workforce Initiative in this initiative to benefit Iowa’s mature workforce. State departments including DAS are serving on this task force and recognize it as a viable source for qualified workers.
State Diversity ConferenceDAS-HRE staff participated in the months of planning required to present the the Iowa’s Mosaic Diversity Conference. The conference is to held on October 17, 2005 at the Scheman Center at Iowa State University in Ames. The conference is aimed at employers, advocates for various protected class groups, youth and the general public. The theme for this year’s conference is “Families, Workers & Neighbors—Discovering our Hidden Assts. Additionally, an institute is planned to provide practitioners with a greater opportunity to learn more about diversity and gain the skills to pass that information on within their areas of discipline. The institute will be held on October 18, 2005.
-13-
FY 2005 Affirmative Action Report
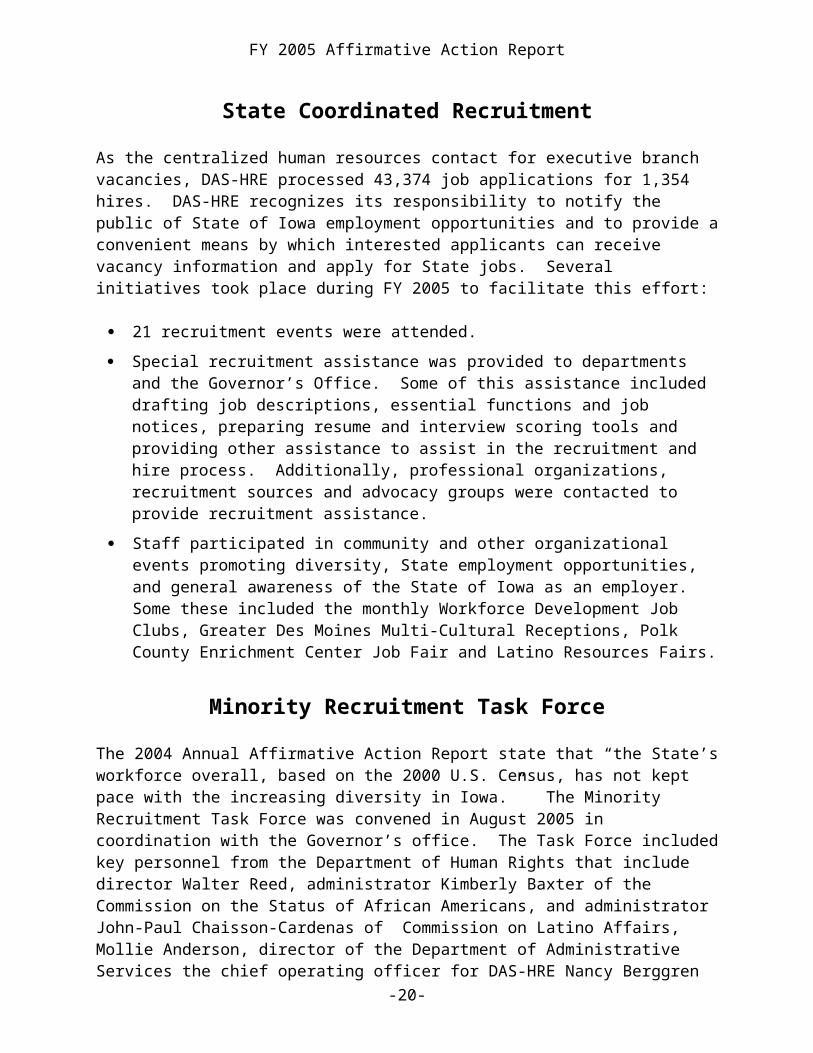
State Coordinated RecruitmentAs the centralized human resources contact for executive branch vacancies, DAS-HRE processed 43,374 job applications for 1,354 hires. DAS-HRE recognizes its responsibility to notify the public of State of Iowa employment opportunities and to provide a convenient means by which interested applicants can receive vacancy information and apply for State jobs. Several initiatives took place during FY 2005 to facilitate this effort:
21 recruitment events were attended. Special recruitment assistance was provided to departments and the
Governor’s Office. Some of this assistance included drafting job descriptions, essential functions and job notices, preparing resume and interview scoring tools and providing other assistance to assist in the recruitment and hire process. Additionally, professional organizations, recruitment sources and advocacy groups were contacted to provide recruitment assistance.
Staff participated in community and other organizational events promoting diversity, State employment opportunities, and general awareness of the State of Iowa as an employer. Some these included the monthly Workforce Development Job Clubs, Greater Des Moines Multi-Cultural Receptions, Polk County Enrichment Center Job Fair and Latino Resources Fairs.
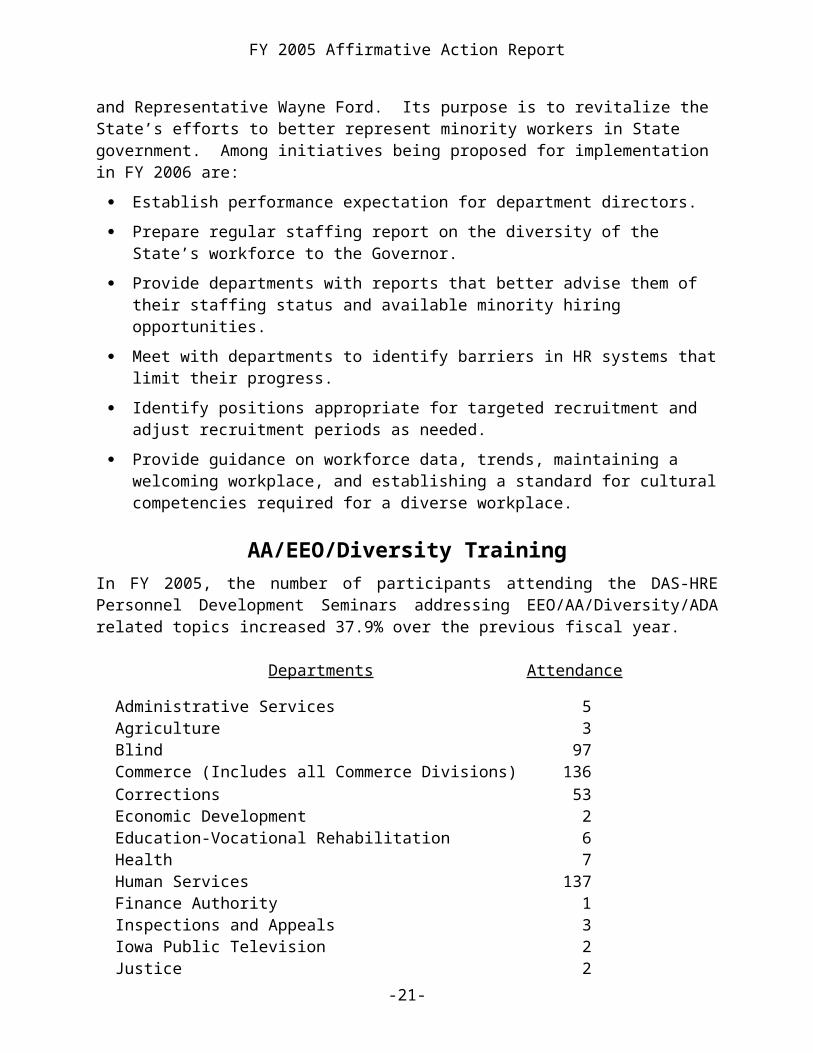
Minority Recruitment Task ForceThe 2004 Annual Affirmative Action Report state that “the State’s workforce overall, based on the 2000 U.S. Census, has not kept pace with the increasing diversity in Iowa.” The Minority Recruitment Task Force was convened in August 2005 in coordination with the Governor’s office. The Task Force included key personnel from the Department of Human Rights that include director Walter Reed, administrator Kimberly Baxter of the Commission on the Status of African Americans, and administrator John-Paul Chaisson-Cardenas of Commission on Latino Affairs, Mollie Anderson, director of the Department of Administrative Services the chief operating officer for DAS-HRE Nancy Berggren and Representative Wayne Ford. Its purpose is to revitalize the State’s efforts to better represent minority workers in State government. Among initiatives being proposed for implementation in FY 2006 are:
Establish performance expectation for department directors. Prepare regular staffing report on the diversity of the State’s workforce
to the Governor. Provide departments with reports that better advise them of their
staffing status and available minority hiring opportunities.-14-
FY 2005 Affirmative Action Report
Meet with departments to identify barriers in HR systems that limit their progress.
Identify positions appropriate for targeted recruitment and adjust recruitment periods as needed.
Provide guidance on workforce data, trends, maintaining a welcoming workplace, and establishing a standard for cultural competencies required for a diverse workplace.
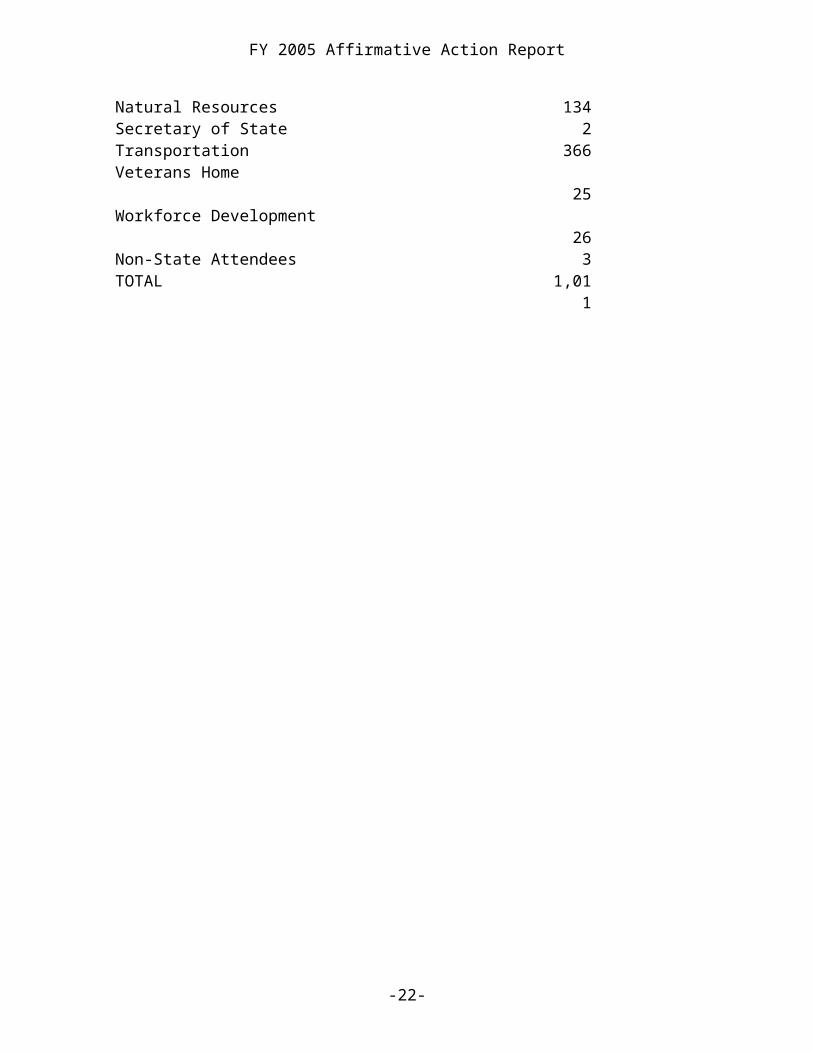
AA/EEO/Diversity TrainingIn FY 2005, the number of participants attending the DAS-HRE Personnel Development Seminars addressing EEO/AA/Diversity/ADA related topics increased 37.9% over the previous fiscal year.
Departments AttendanceAdministrative Services 5Agriculture 3Blind 97Commerce (Includes all Commerce Divisions) 136Corrections 53Economic Development 2Education-Vocational Rehabilitation 6Health 7Human Services 137Finance Authority 1Inspections and Appeals 3Iowa Public Television 2Justice 2Natural Resources 134Secretary of State 2Transportation 366Veterans Home 2
5Workforce Development 2
6Non-State Attendees 3TOTAL 1,01
1
-15-

FY 2005 Affirmative Action Report
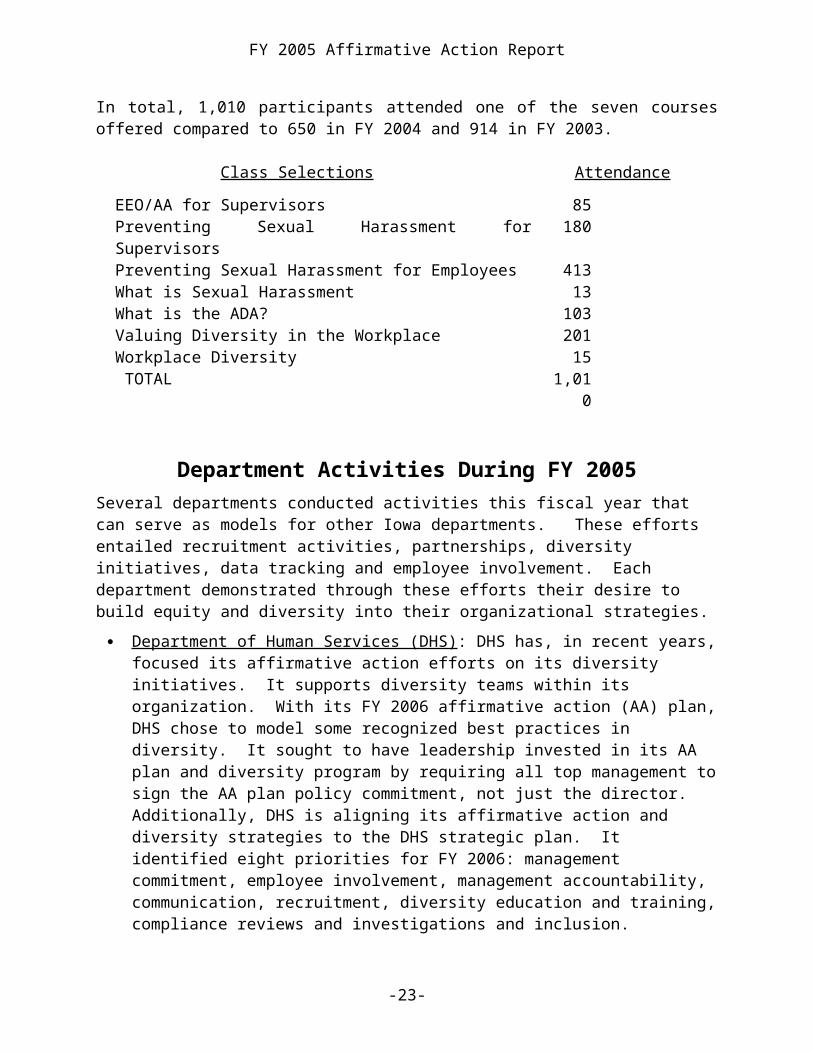
In total, 1,010 participants attended one of the seven courses offered compared to 650 in FY 2004 and 914 in FY 2003.
Class Selections AttendanceEEO/AA for Supervisors 85 Preventing Sexual Harassment for Supervisors 180Preventing Sexual Harassment for Employees 413What is Sexual Harassment 13What is the ADA? 103Valuing Diversity in the Workplace 201Workplace Diversity 15 TOTAL 1,01
0
Department Activities During FY 2005Several departments conducted activities this fiscal year that can serve as models for other Iowa departments. These efforts entailed recruitment activities, partnerships, diversity initiatives, data tracking and employee involvement. Each department demonstrated through these efforts their desire to build equity and diversity into their organizational strategies.
Department of Human Services (DHS) : DHS has, in recent years, focused its affirmative action efforts on its diversity initiatives. It supports diversity teams within its organization. With its FY 2006 affirmative action (AA) plan, DHS chose to model some recognized best practices in diversity. It sought to have leadership invested in its AA plan and diversity program by requiring all top management to sign the AA plan policy commitment, not just the director. Additionally, DHS is aligning its affirmative action and diversity strategies to the DHS strategic plan. It identified eight priorities for FY 2006: management commitment, employee involvement, management accountability, communication, recruitment, diversity education and training, compliance reviews and investigations and inclusion.
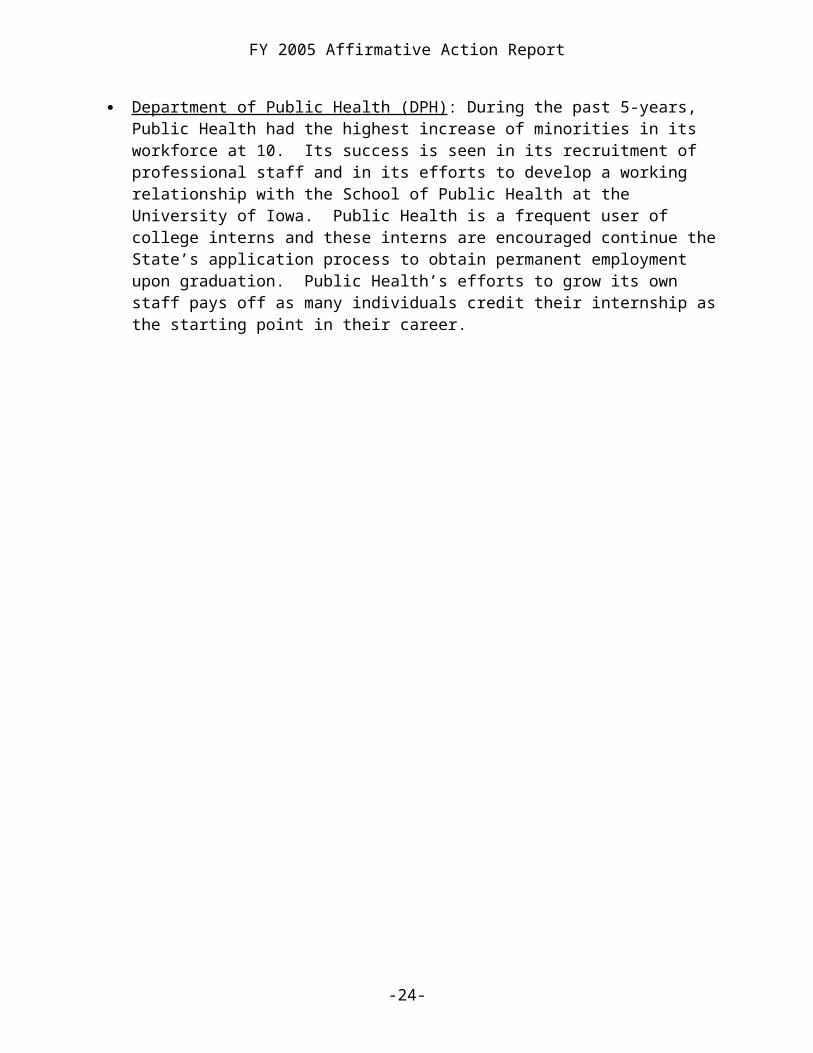
Department of Public Health (DPH) : During the past 5-years, Public Health had the highest increase of minorities in its workforce at 10. Its success is seen in its recruitment of professional staff and in its efforts to develop a working relationship with the School of Public Health at the University of Iowa. Public Health is a frequent user of college interns and these interns are encouraged continue the State’s application process to obtain permanent employment upon graduation. Public Health’s efforts to grow its own staff pays off as many individuals credit their internship as the starting point in their career.
-16-
FY 2005 Affirmative Action Report
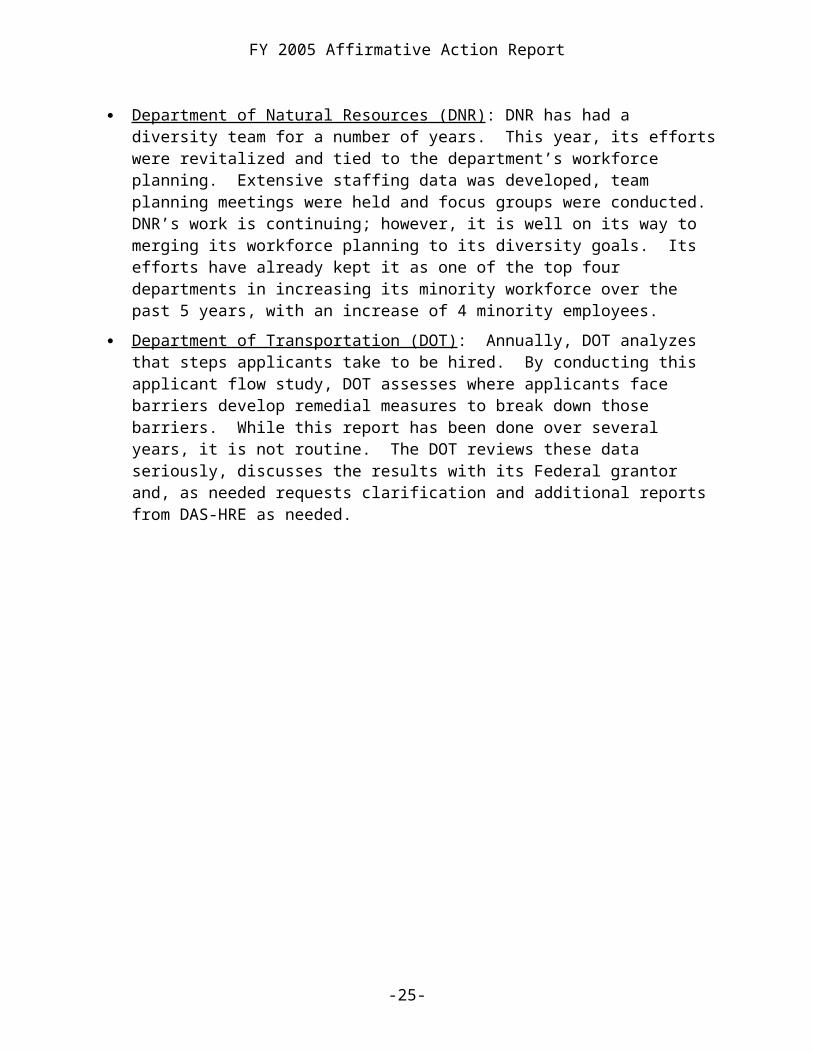
Department of Natural Resources (DNR) : DNR has had a diversity team for a number of years. This year, its efforts were revitalized and tied to the department’s workforce planning. Extensive staffing data was developed, team planning meetings were held and focus groups were conducted. DNR’s work is continuing; however, it is well on its way to merging its workforce planning to its diversity goals. Its efforts have already kept it as one of the top four departments in increasing its minority workforce over the past 5 years, with an increase of 4 minority employees.
Department of Transportation (DOT) : Annually, DOT analyzes that steps applicants take to be hired. By conducting this applicant flow study, DOT assesses where applicants face barriers develop remedial measures to break down those barriers. While this report has been done over several years, it is not routine. The DOT reviews these data seriously, discusses the results with its Federal grantor and, as needed requests clarification and additional reports from DAS-HRE as needed.
-17-
FY 2005 Affirmative Action Report
FY 2006 RECOMMENDATIONSThe following observations were considered when establishing the FY 2006 recommendations.
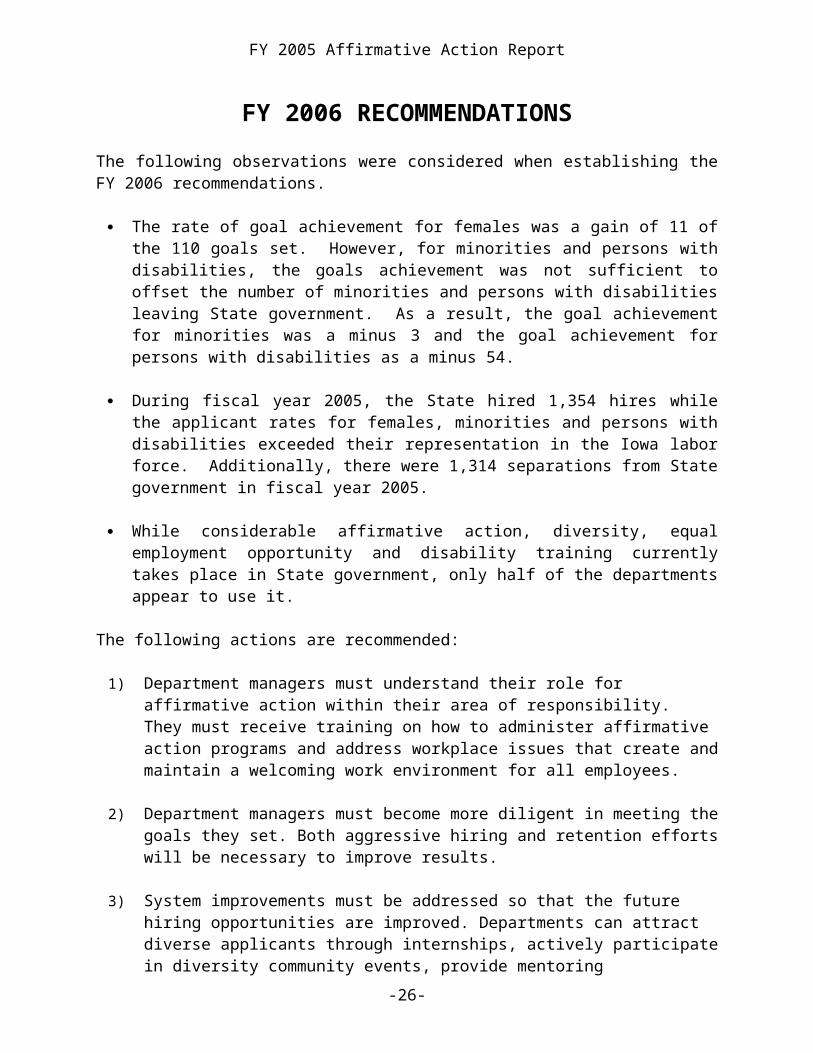
The rate of goal achievement for females was a gain of 11 of the 110 goals set. However, for minorities and persons with disabilities, the goals achievement was not sufficient to offset the number of minorities and persons with disabilities leaving State government. As a result, the goal achievement for minorities was a minus 3 and the goal achievement for persons with disabilities as a minus 54.
During fiscal year 2005, the State hired 1,354 hires while the applicant rates for females, minorities and persons with disabilities exceeded their representation in the Iowa labor force. Additionally, there were 1,314 separations from State government in fiscal year 2005.
While considerable affirmative action, diversity, equal employment opportunity and disability training currently takes place in State government, only half of the departments appear to use it.
The following actions are recommended:
1) Department managers must understand their role for affirmative action within their area of responsibility. They must receive training on how to administer affirmative action programs and address workplace issues that create and maintain a welcoming work environment for all employees.
2) Department managers must become more diligent in meeting the goals they set. Both aggressive hiring and retention efforts will be necessary to improve results.
3) System improvements must be addressed so that the future hiring opportunities are improved. Departments can attract diverse applicants through internships, actively participate in diversity community events, provide mentoring opportunities for underutilized groups in the workforce, and follow other such practices noted at the following website: http://das.hre.iowa.gov/pdfs/AAEEO/strategies.pdf.
4) Department managers must be held accountable for initiatives directed towards balancing their workforce.
-18-
FY 2005 Affirmative Action Report
DAS-HRE FY 2006 PLANS
DAS-HRE plays a leadership role in bringing about the commitment required to comply with 19B of the Code of Iowa. To that end, it plans the following initiatives for FY 2006:New Initiatives:
Implement the work plan developed by the Minority Recruitment Task Force.
Review AA reporting process and assess methods for improvement. Consideration needs to be given to ways in which the program can be simplified.
Develop procedures to measure the accomplishment of qualitative AA goals including expanding the quarterly report of affirmative action progress to include qualitative goals updates.
Review overall State recruitment and develop a State recruitment plan. Offer targeted recruitment and additional support to departments with
chronic difficulty in meeting their AA goals. Provide to all departments the models developed by the departments of
Natural Resources and Human Services to integrate their annual affirmative action and diversity programs into their workforce and strategic planning processes.
As a result of the 2000 Census, minority categories were revised. Upon receipt of further Guidance from the Equal Employment Opportunity Commission (EEOC), DAS-HRE will make appropriate revisions in data systems and applications for employment that track and record employee characteristics so that they match those required by EEOC.
Continuing Activities: Pursue efforts to strengthen hiring of persons with disabilities and to
maintain their representation in State government. Such efforts should include:
a. Identifying and expanding recruitment sources for persons with disabilities through contacts with State agencies and other organizations that work with and/or advocate for persons with disabilities. These resources will be made available to agencies that are underutilized for persons with disabilities.
b. Expanded networking with various advocacy and service groups working with persons with disabilities by attending the board/commission meetings of advocacy groups, personal visits to providers of services to persons with disabilities, and receipt of newsletters and other information from advocacy groups.
-19-
FY 2005 Affirmative Action Report
c. Continuing to make State agencies aware of their hiring opportunities for persons with disabilities as well as females and minorities.
d. Proceeding with the partnership with the Department of Human Rights and Department for the Blind and, this next year, involving the Department of Education Vocational Rehabilitation Services Division to attract and retain more persons with disabilities to State government.
DAS-HRE will continue to address the action plan to implement the Olmstead decision in State government.
DAS-HRE will continue to maintain its partnerships and will also build upon those with organizations that can assist it in its efforts for a diverse State workforce. These include: Department of Human Rights, Central Iowa Employment and Training Consortium, Easter Seals, Mainstream Living and other such organizations.
DAS-HRE will continue to serve as a member of the ADA Advisory Committee, as ex officio member of the Commission on persons with disabilities, as a Task Force member of the Older Worker Task Force and as a Member of the Minority Recruitment Task Force. It will continue to be involved in such organizations and efforts that help it is its role to support a diverse workforce in State government.
Evaluate the results of the annual and cumulative State Exit Survey report to further identify any potential problems that may be indicated for members of protected classes such as allegations of harassment or other bias or patterns of conduct that may sabotage diversity and affirmative action efforts.
-20-
FY 2005 Affirmative Action Report
APPENDICES
A. AFFIRMATIVE ACTION ANALYSIS BY DEPARTMENTNotes on Department Tables:FY 05 Workforce Changes:
This table shows fiscal year 2005 staffing changes. It details the composition of each department's workforce at the beginning and ending of the fiscal years and the number of hires/promotions and terminations that also occurred during this period. These totals are broken down by Minority, Female and Disability status and by EEO Code. The purpose of these data is to show how the departments’ staffing changes during the fiscal year affected its current staffing compositions.FY 05 Goal & Achievements
These tables summarize the progress departments made during FY 2005 in meeting the affirmative action goals they set by EEO category. The numbers for persons with disabilities are only displayed by department overall. (See AA Plan Methodology for details.)
Column LabelsT Total Full-time WorkforceF FemaleMn Racial/Ethnic MinoritiesD Persons with Disabilities
Threshold LabelsNU No underutilizationBA Balanced workforceNA Not applicableST Statewide measure of underutilization.PN Numeric (remedial) hiring goals to address underutilization are neededNP Non-remedial methods to address underutilization through means other than using racial/ethnic, gender or disability classification as factors in selection
FY 06 Affirmative Action Goals BOFY (Beginning of Fiscal Year)
This table details each department's underutilization--both remedial (manifest imbalance) and non-remedial. By projecting the hires anticipated during the fiscal year, departments can more realistically set attainable goals to correct their remedial underutilization. Numerical goals are not set for non-remedial underutilization; however, departments must address these through other means.
-21-
FY 2005 Affirmative Action Report
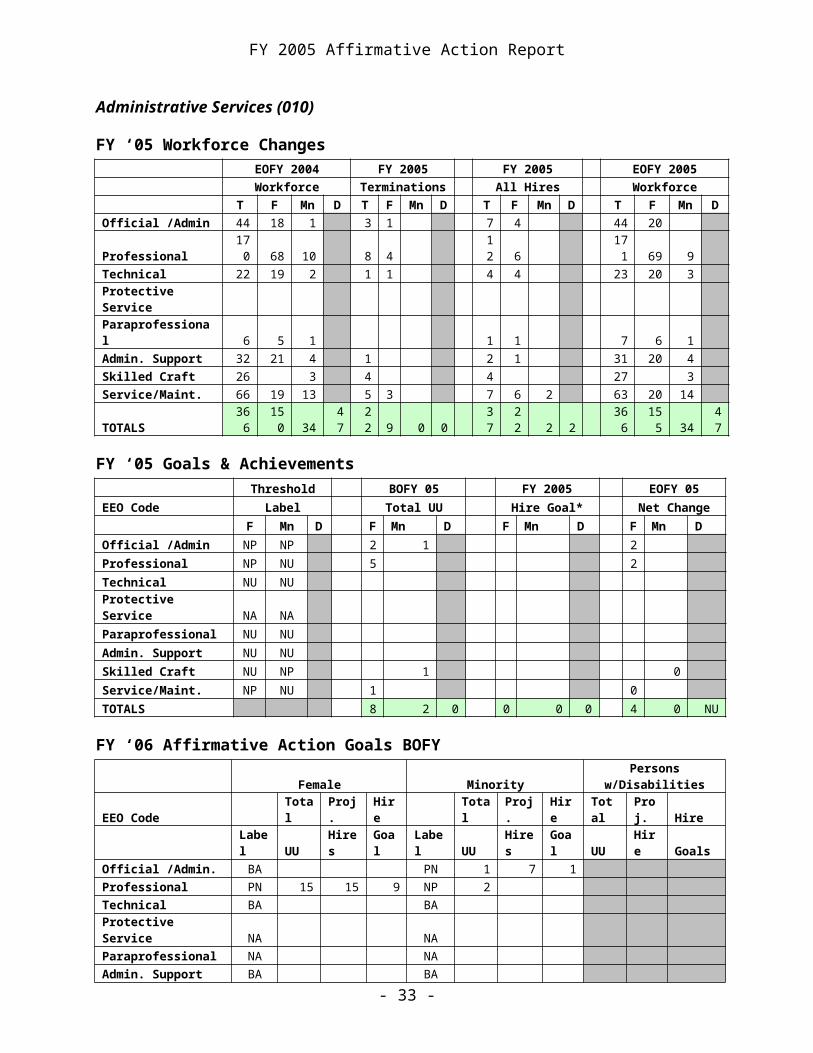
Administrative Services (010)
FY ‘05 Workforce Changes EOFY 2004 FY 2005 FY 2005 EOFY 2005 Workforce Terminations All Hires Workforce
T F Mn D T F Mn D T FMn D T F Mn D
Official /Admin 44 18 1 3 1 7 4 44 20
Professional 17
0 68 10 8 4 12 6 171 69 9 Technical 22 19 2 1 1 4 4 23 20 3 Protective Service Paraprofessional 6 5 1 1 1 7 6 1 Admin. Support 32 21 4 1 2 1 31 20 4 Skilled Craft 26 3 4 4 27 3 Service/Maint. 66 19 13 5 3 7 6 2 63 20 14
TOTALS36
6 150 34 4722 9 0 0 37 22 2 2 366 155 34 47
FY ‘05 Goals & Achievements Threshold BOFY 05 FY 2005 EOFY 05EEO Code Label Total UU Hire Goal* Net Change F Mn D F Mn D F Mn D F Mn DOfficial /Admin NP NP 2 1 2 Professional NP NU 5 2 Technical NU NU Protective Service NA NA Paraprofessional NU NU Admin. Support NU NU Skilled Craft NU NP 1 0 Service/Maint. NP NU 1 0 TOTALS 8 2 0 0 0 0 4 0 NU
FY ‘06 Affirmative Action Goals BOFY Female Minority Persons w/Disabilities
EEO Code Total Proj. Hire Total Proj. HireTotal
Proj. Hire
Label UU Hires
Goal Label UU Hires
Goal UU Hire Goals
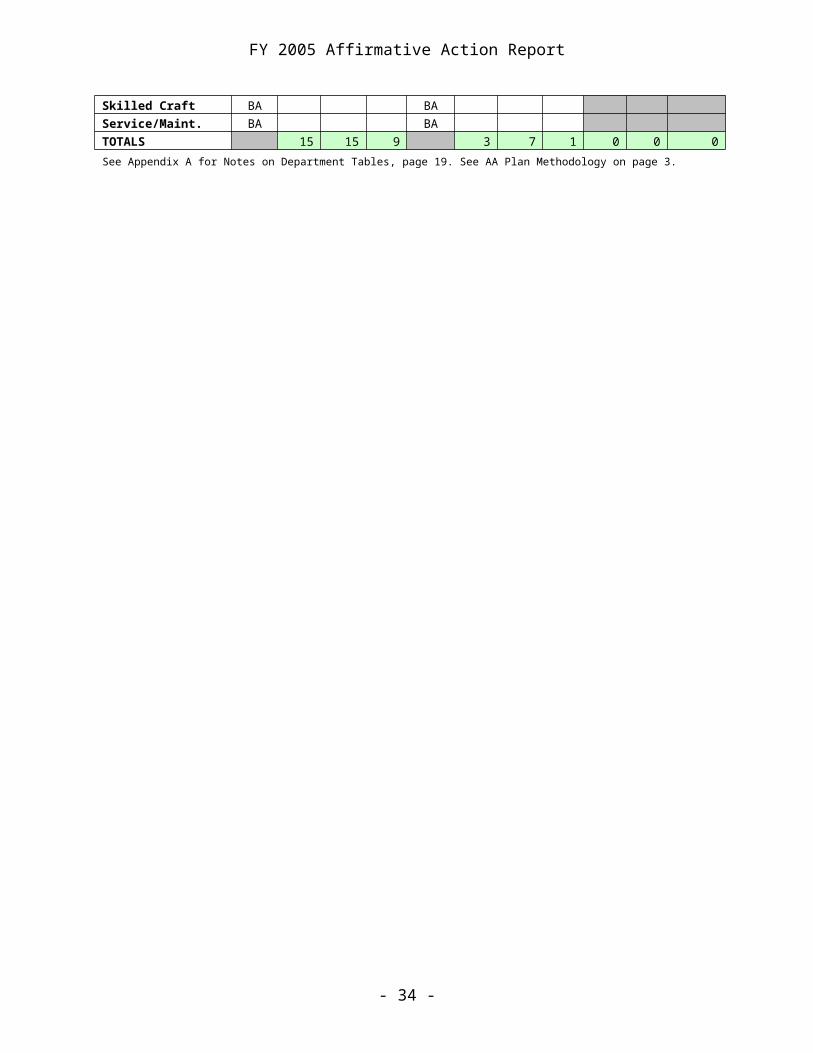
Official /Admin. BA PN 1 7 1 Professional PN 15 15 9 NP 2 Technical BA BA Protective Service NA NA Paraprofessional NA NA Admin. Support BA BA Skilled Craft BA BA Service/Maint. BA BA TOTALS 15 15 9 3 7 1 0 0 0
See Appendix A for Notes on Department Tables, page 19. See AA Plan Methodology on page 3.
- 22 -
FY 2005 Affirmative Action Report
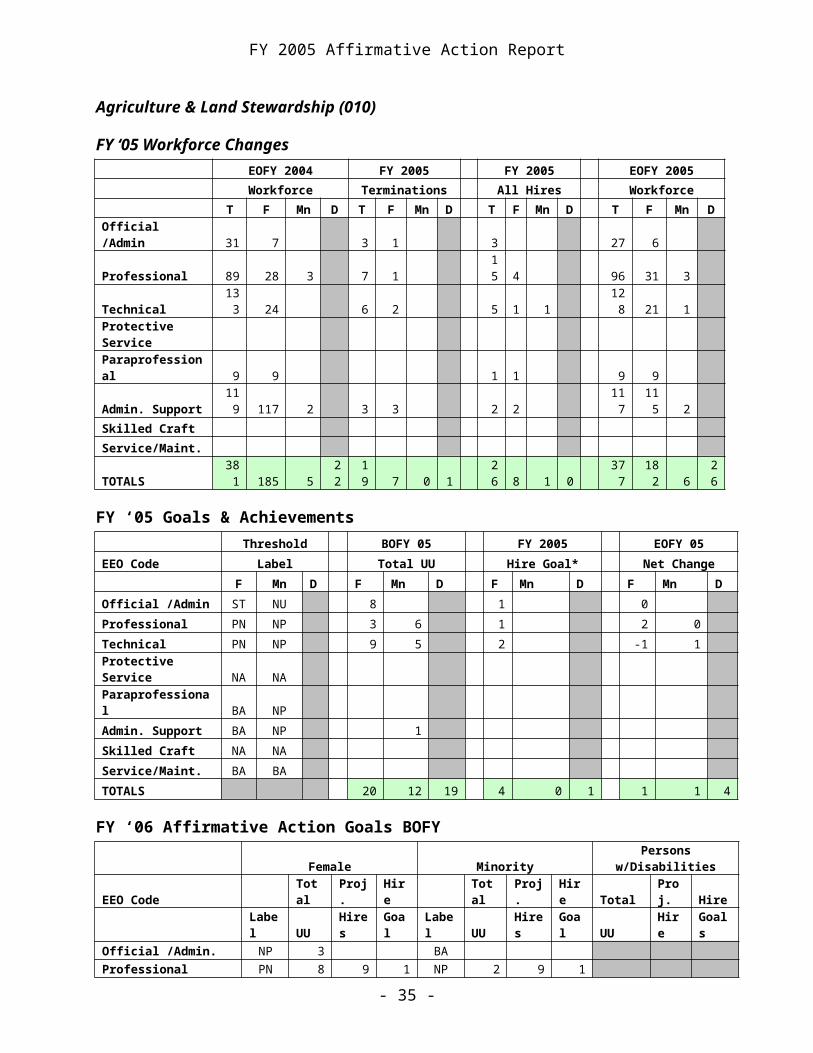
Agriculture & Land Stewardship (010)
FY ‘05 Workforce Changes EOFY 2004 FY 2005 FY 2005 EOFY 2005 Workforce Terminations All Hires Workforce
T F Mn D T FMn D T F
Mn D T F
Mn D
Official /Admin 31 7 3 1 3 27 6
Professional 89 28 3 7 1 15 4 96 31 3
Technical 13
3 24 6 2 5 1 1 12
8 21 1
Protective Service
Paraprofessional 9 9 1 1 9 9
Admin. Support 11
9 117 2 3 3 2 2 11
711
5 2
Skilled Craft
Service/Maint.
TOTALS38
1 185 522
19 7 0 1
26 8 1 0
377
182 6
26
FY ‘05 Goals & Achievements Threshold BOFY 05 FY 2005 EOFY 05EEO Code Label Total UU Hire Goal* Net Change F Mn D F Mn D F Mn D F Mn DOfficial /Admin ST NU 8 1 0
Professional PN NP 3 6 1 2 0
Technical PN NP 9 5 2 -1 1
Protective Service NA NA
Paraprofessional BA NP
Admin. Support BA NP 1
Skilled Craft NA NA
Service/Maint. BA BA
TOTALS 20 12 19 4 0 1 1 1 4
FY ‘06 Affirmative Action Goals BOFY Female Minority Persons w/Disabilities
EEO Code Total Proj. Hire
Total Proj. Hire Total Proj. Hire
Label UU Hires Goal Label UU Hires Goal UU Hire GoalsOfficial /Admin. NP 3 BA Professional PN 8 9 1 NP 2 9 1 Technical PN 14 3 1 PN 2 3 1 Protective Service NA NA Paraprofessional NA NA Admin. Support BA PN 1 4 1 Skilled Craft NA NA Service/Maint. BA BA TOTALS 25 12 2 5 16 3 14 20 1
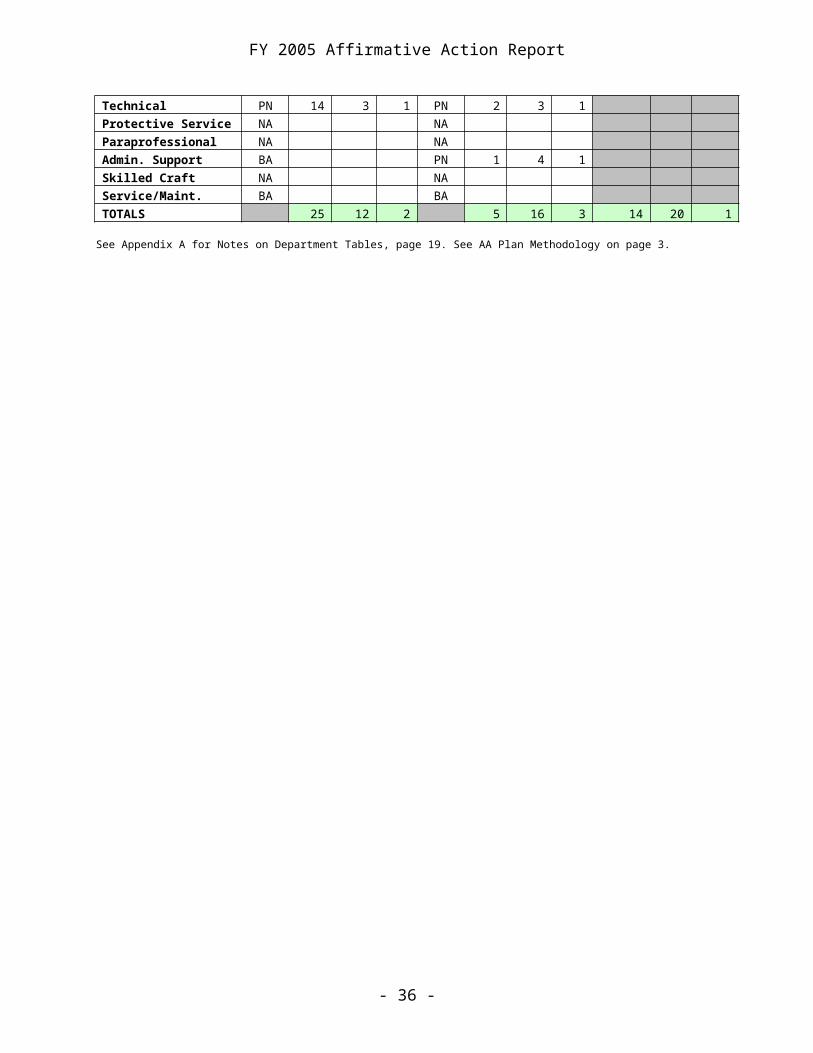
- 23 -
FY 2005 Affirmative Action Report
See Appendix A for Notes on Department Tables, page 19. See AA Plan Methodology on page 3.
- 24 -
FY 2005 Affirmative Action Report
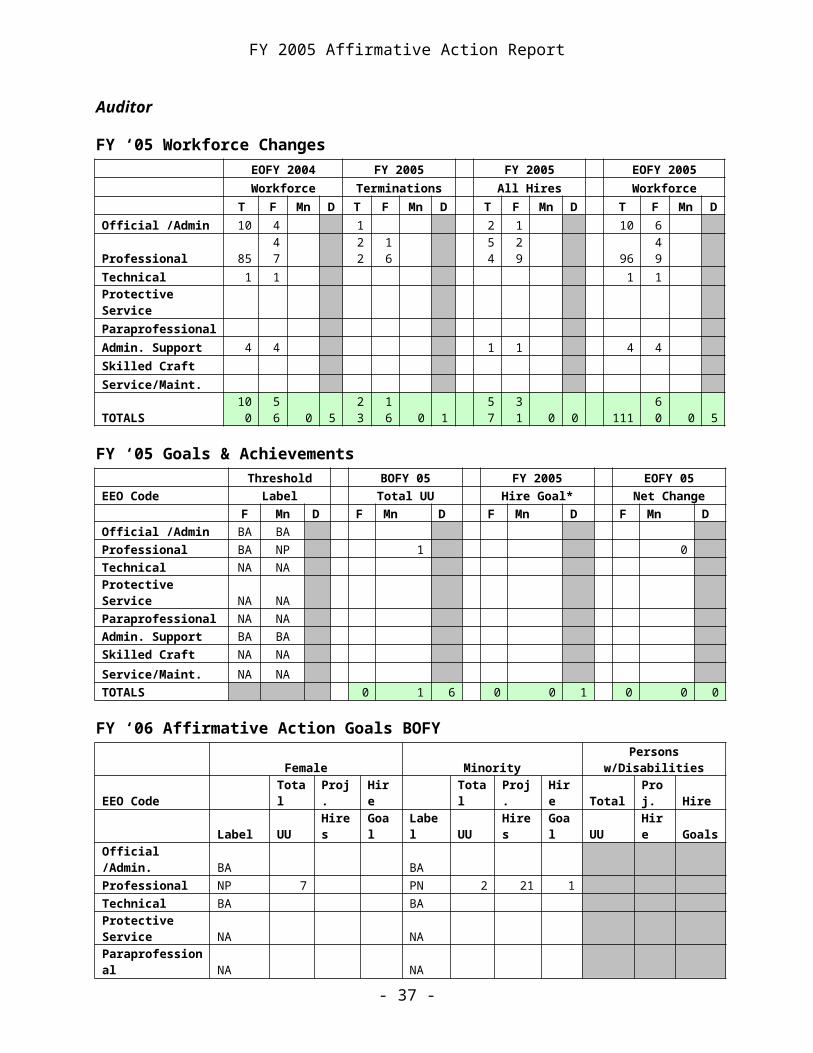
Auditor
FY ‘05 Workforce Changes EOFY 2004 FY 2005 FY 2005 EOFY 2005 Workforce Terminations All Hires Workforce
T F Mn D T F Mn D T F Mn D T F Mn DOfficial /Admin 10 4 1 2 1 10 6 Professional 85 47 22 16 54 29 96 49 Technical 1 1 1 1 Protective Service Paraprofessional Admin. Support 4 4 1 1 4 4 Skilled Craft Service/Maint. TOTALS 100 56 0 5 23 16 0 1 57 31 0 0 111 60 0 5
FY ‘05 Goals & Achievements Threshold BOFY 05 FY 2005 EOFY 05EEO Code Label Total UU Hire Goal* Net Change F Mn D F Mn D F Mn D F Mn DOfficial /Admin BA BA Professional BA NP 1 0 Technical NA NA Protective Service NA NA Paraprofessional NA NA Admin. Support BA BA Skilled Craft NA NA
Service/Maint. NA NA TOTALS 0 1 6 0 0 1 0 0 0
FY ‘06 Affirmative Action Goals BOFY Female Minority Persons w/DisabilitiesEEO Code Total Proj. Hire Total Proj. Hire Total Proj. Hire
Label UU Hires Goal Label UU HiresGoal UU Hire Goals
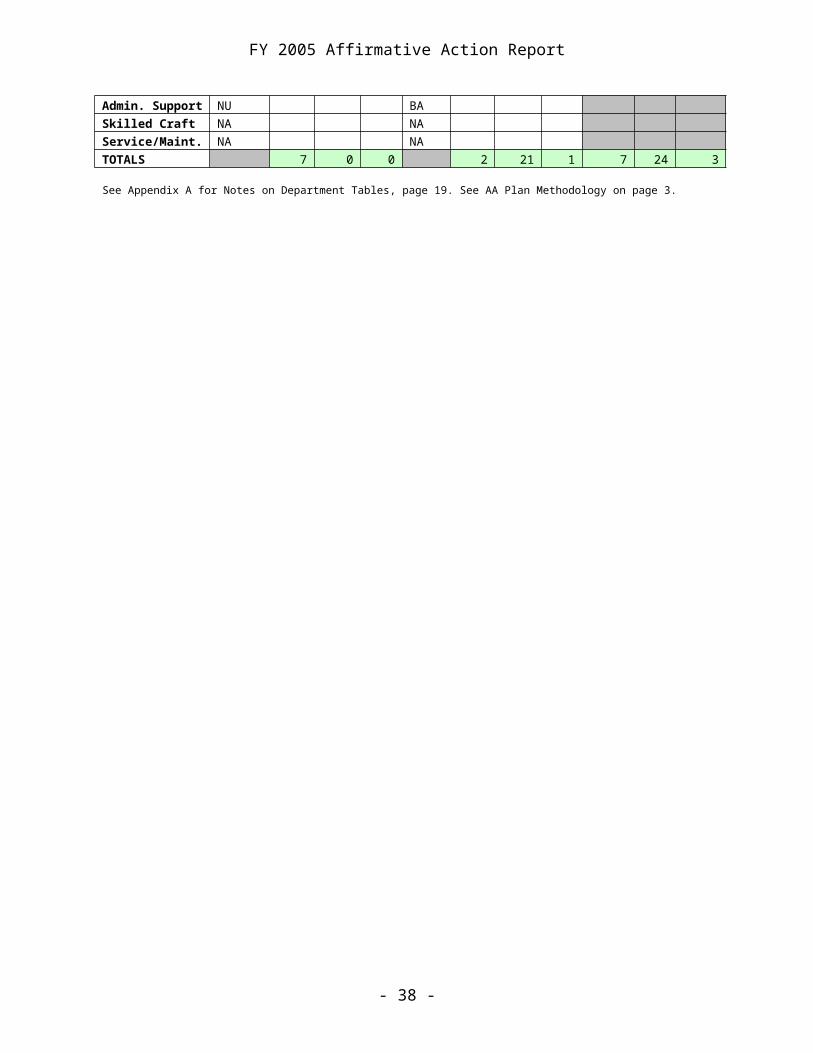
Official /Admin. BA BA Professional NP 7 PN 2 21 1 Technical BA BA Protective Service NA NA Paraprofessional NA NA Admin. Support NU BA Skilled Craft NA NA Service/Maint. NA NA TOTALS 7 0 0 2 21 1 7 24 3
See Appendix A for Notes on Department Tables, page 19. See AA Plan Methodology on page 3.
- 25 -
FY 2005 Affirmative Action Report
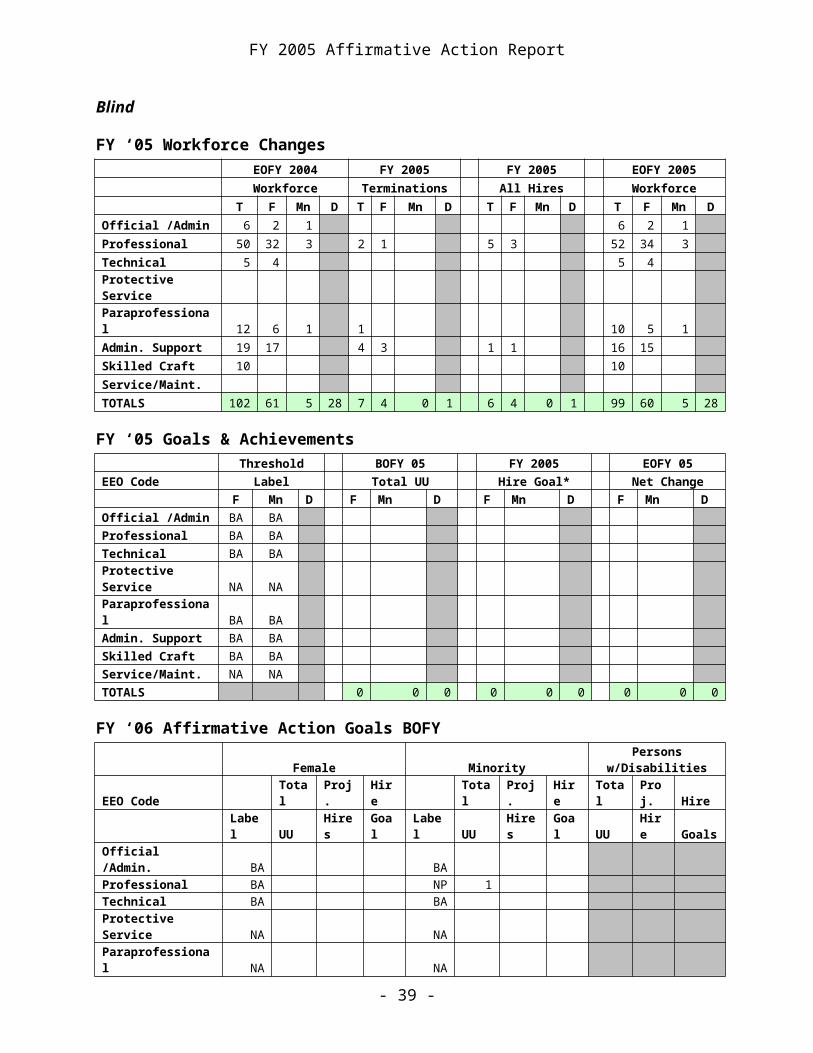
Blind
FY ‘05 Workforce Changes EOFY 2004 FY 2005 FY 2005 EOFY 2005 Workforce Terminations All Hires Workforce
T F Mn D T F Mn D T F Mn D T F Mn DOfficial /Admin 6 2 1 6 2 1 Professional 50 32 3 2 1 5 3 52 34 3 Technical 5 4 5 4 Protective Service Paraprofessional 12 6 1 1 10 5 1 Admin. Support 19 17 4 3 1 1 16 15 Skilled Craft 10 10 Service/Maint. TOTALS 102 61 5 28 7 4 0 1 6 4 0 1 99 60 5 28
FY ‘05 Goals & Achievements Threshold BOFY 05 FY 2005 EOFY 05EEO Code Label Total UU Hire Goal* Net Change F Mn D F Mn D F Mn D F Mn DOfficial /Admin BA BA Professional BA BA Technical BA BA
Protective Service NA NA
Paraprofessional BA BA
Admin. Support BA BA
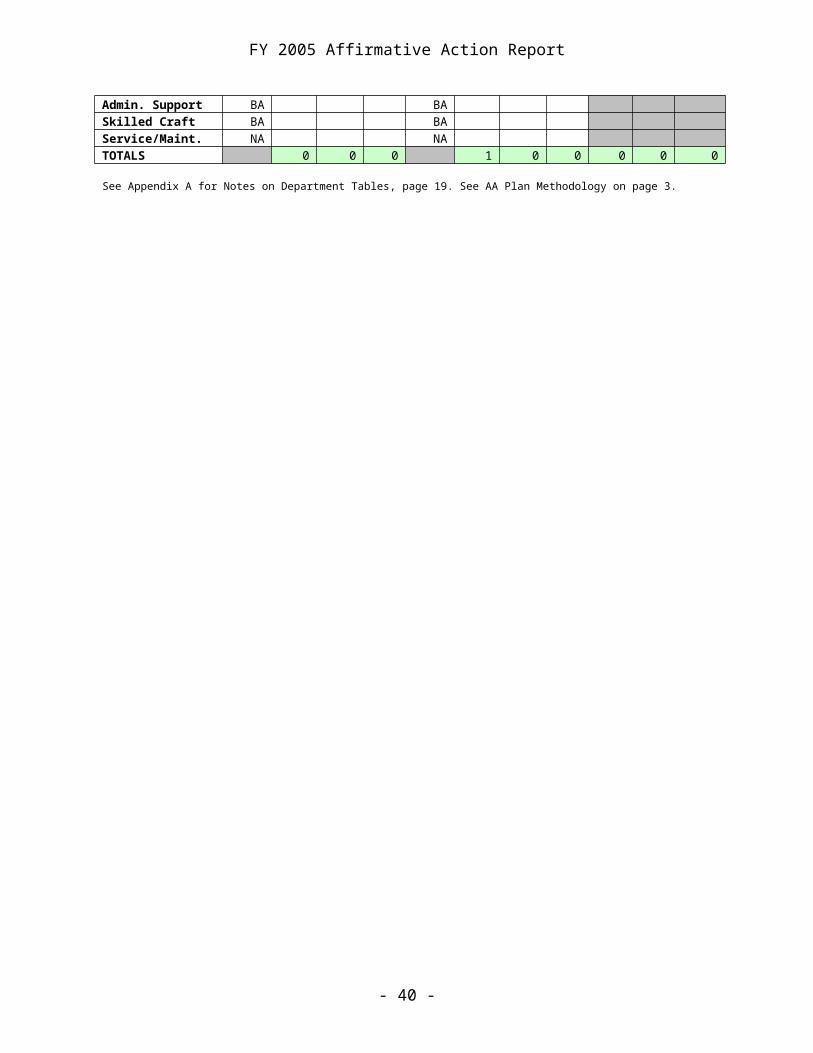
Skilled Craft BA BA
Service/Maint. NA NA TOTALS 0 0 0 0 0 0 0 0 0
FY ‘06 Affirmative Action Goals BOFY
Female MinorityPersons
w/DisabilitiesEEO Code Total Proj. Hire Total Proj. Hire Total Proj. Hire Label UU Hires Goal Label UU Hires Goal UU Hire GoalsOfficial /Admin. BA BA Professional BA NP 1 Technical BA BA Protective Service NA NA Paraprofessional NA NA Admin. Support BA BA Skilled Craft BA BA Service/Maint. NA NA TOTALS 0 0 0 1 0 0 0 0 0
See Appendix A for Notes on Department Tables, page 19. See AA Plan Methodology on page 3.
- 26 -
FY 2005 Affirmative Action Report
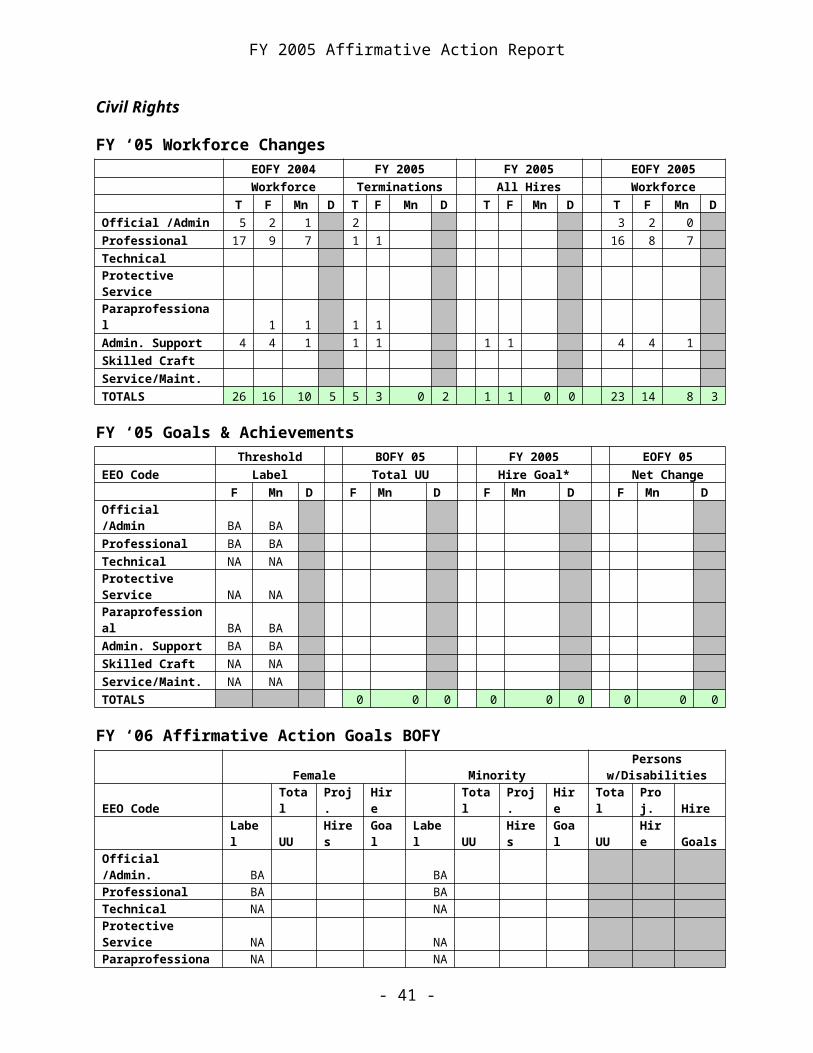
Civil Rights
FY ‘05 Workforce Changes EOFY 2004 FY 2005 FY 2005 EOFY 2005 Workforce Terminations All Hires Workforce
T F Mn D T F Mn D T F Mn D T F Mn DOfficial /Admin 5 2 1 2 3 2 0 Professional 17 9 7 1 1 16 8 7
Technical Protective Service
Paraprofessional 1 1 1 1 Admin. Support 4 4 1 1 1 1 1 4 4 1 Skilled Craft Service/Maint. TOTALS 26 16 10 5 5 3 0 2 1 1 0 0 23 14 8 3
FY ‘05 Goals & Achievements Threshold BOFY 05 FY 2005 EOFY 05EEO Code Label Total UU Hire Goal* Net Change F Mn D F Mn D F Mn D F Mn DOfficial /Admin BA BA Professional BA BA Technical NA NA
Protective Service NA NA
Paraprofessional BA BA
Admin. Support BA BA
Skilled Craft NA NA
Service/Maint. NA NA TOTALS 0 0 0 0 0 0 0 0 0
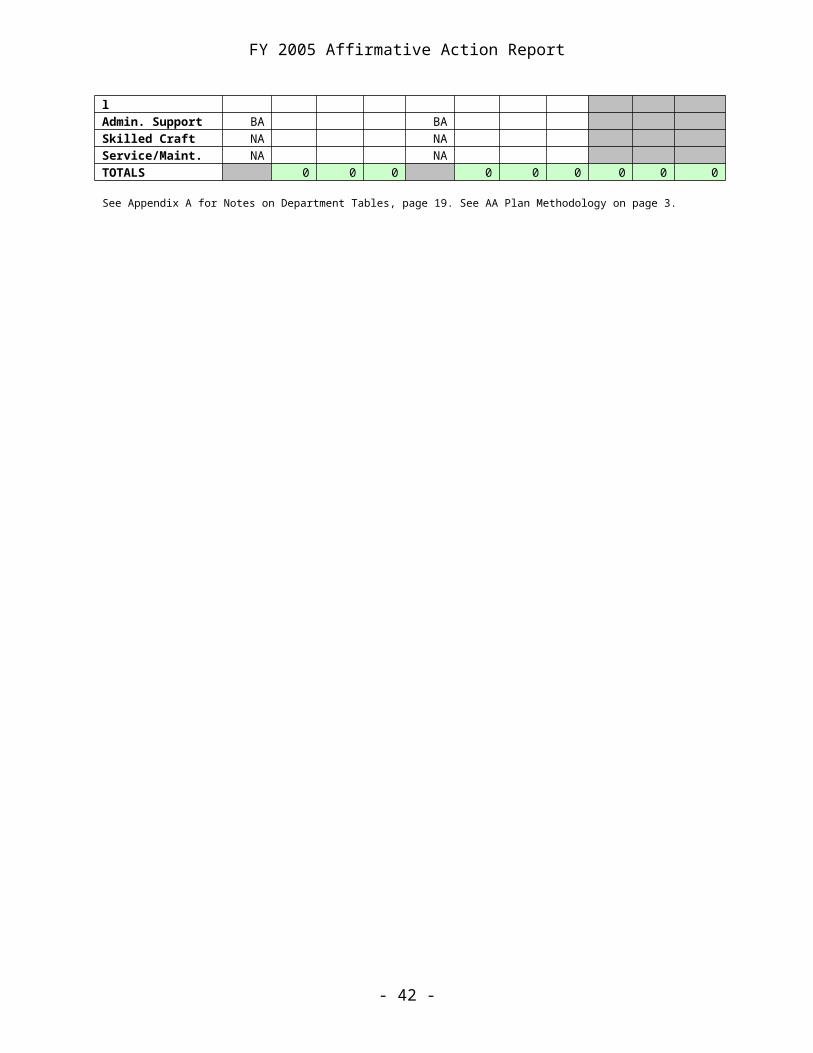
FY ‘06 Affirmative Action Goals BOFY
Female MinorityPersons
w/DisabilitiesEEO Code Total Proj. Hire Total Proj. Hire Total Proj. Hire Label UU Hires Goal Label UU Hires Goal UU Hire GoalsOfficial /Admin. BA BA Professional BA BA Technical NA NA Protective Service NA NA Paraprofessional NA NA Admin. Support BA BA Skilled Craft NA NA Service/Maint. NA NA TOTALS 0 0 0 0 0 0 0 0 0
See Appendix A for Notes on Department Tables, page 19. See AA Plan Methodology on page 3.
- 27 -
FY 2005 Affirmative Action Report
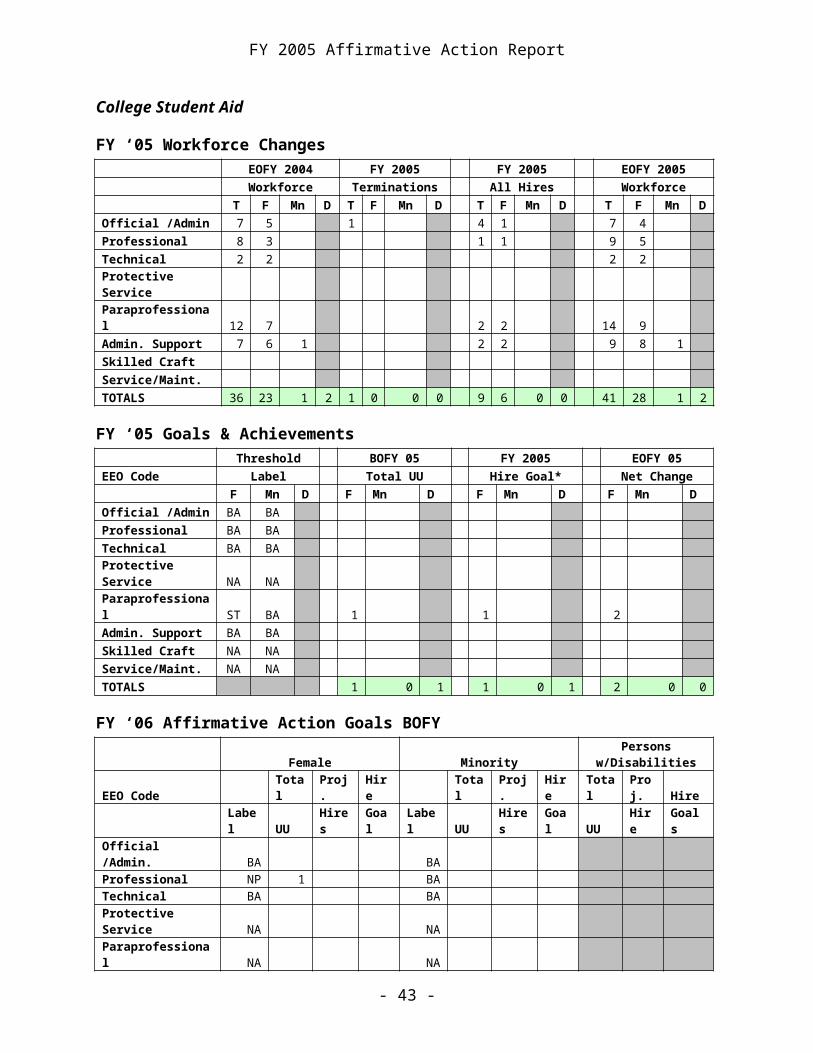
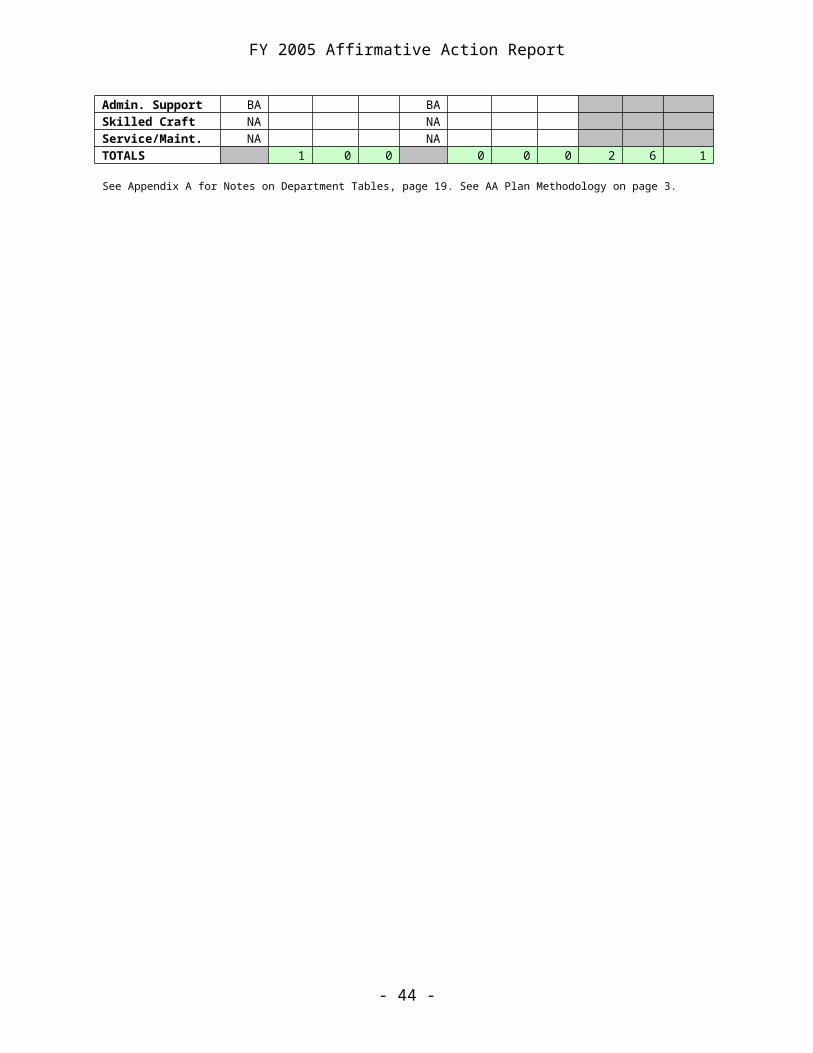
College Student Aid
FY ‘05 Workforce Changes EOFY 2004 FY 2005 FY 2005 EOFY 2005 Workforce Terminations All Hires Workforce
T F Mn D T F Mn D T F Mn D T F Mn DOfficial /Admin 7 5 1 4 1 7 4 Professional 8 3 1 1 9 5 Technical 2 2 2 2 Protective Service Paraprofessional 12 7 2 2 14 9 Admin. Support 7 6 1 2 2 9 8 1 Skilled Craft Service/Maint. TOTALS 36 23 1 2 1 0 0 0 9 6 0 0 41 28 1 2
FY ‘05 Goals & Achievements Threshold BOFY 05 FY 2005 EOFY 05EEO Code Label Total UU Hire Goal* Net Change F Mn D F Mn D F Mn D F Mn DOfficial /Admin BA BA Professional BA BA Technical BA BA
Protective Service NA NA Paraprofessional ST BA 1 1 2
Admin. Support BA BA
Skilled Craft NA NA
Service/Maint. NA NA TOTALS 1 0 1 1 0 1 2 0 0
FY ‘06 Affirmative Action Goals BOFY
Female MinorityPersons
w/DisabilitiesEEO Code Total Proj. Hire Total Proj. Hire Total Proj. Hire Label UU Hires Goal Label UU Hires Goal UU Hire GoalsOfficial /Admin. BA BA Professional NP 1 BA Technical BA BA Protective Service NA NA Paraprofessional NA NA Admin. Support BA BA Skilled Craft NA NA Service/Maint. NA NA TOTALS 1 0 0 0 0 0 2 6 1
See Appendix A for Notes on Department Tables, page 19. See AA Plan Methodology on page 3.
- 28 -
FY 2005 Affirmative Action Report
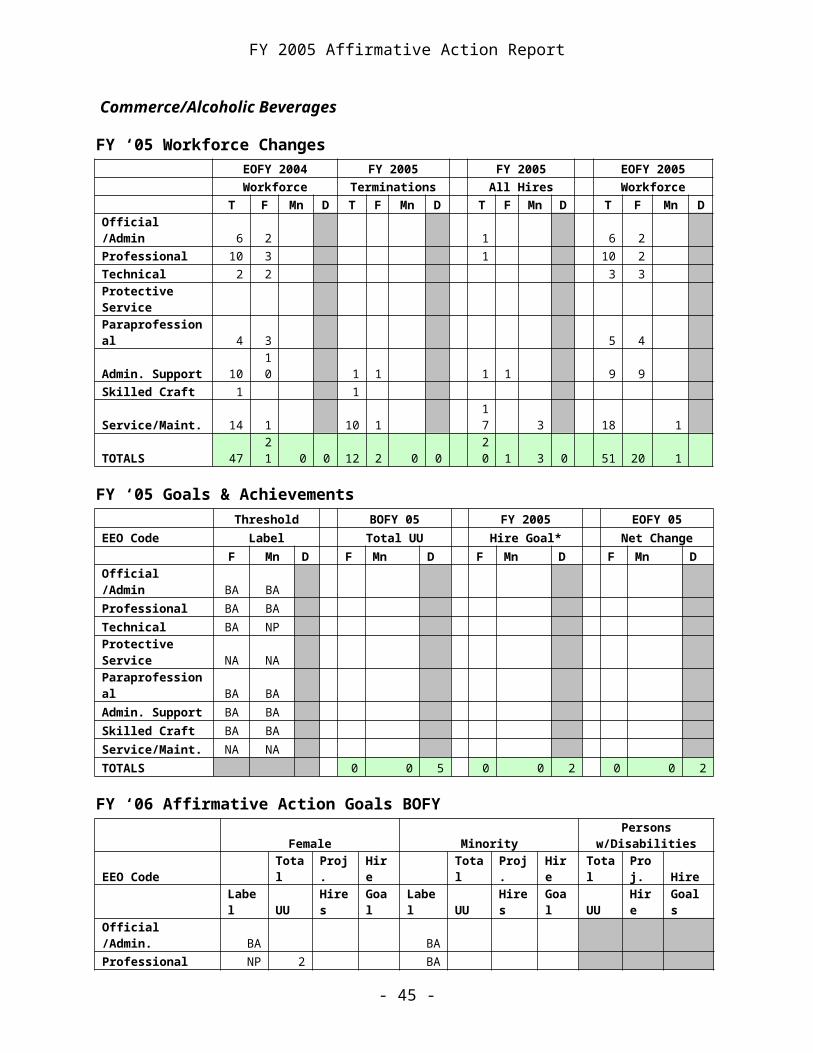
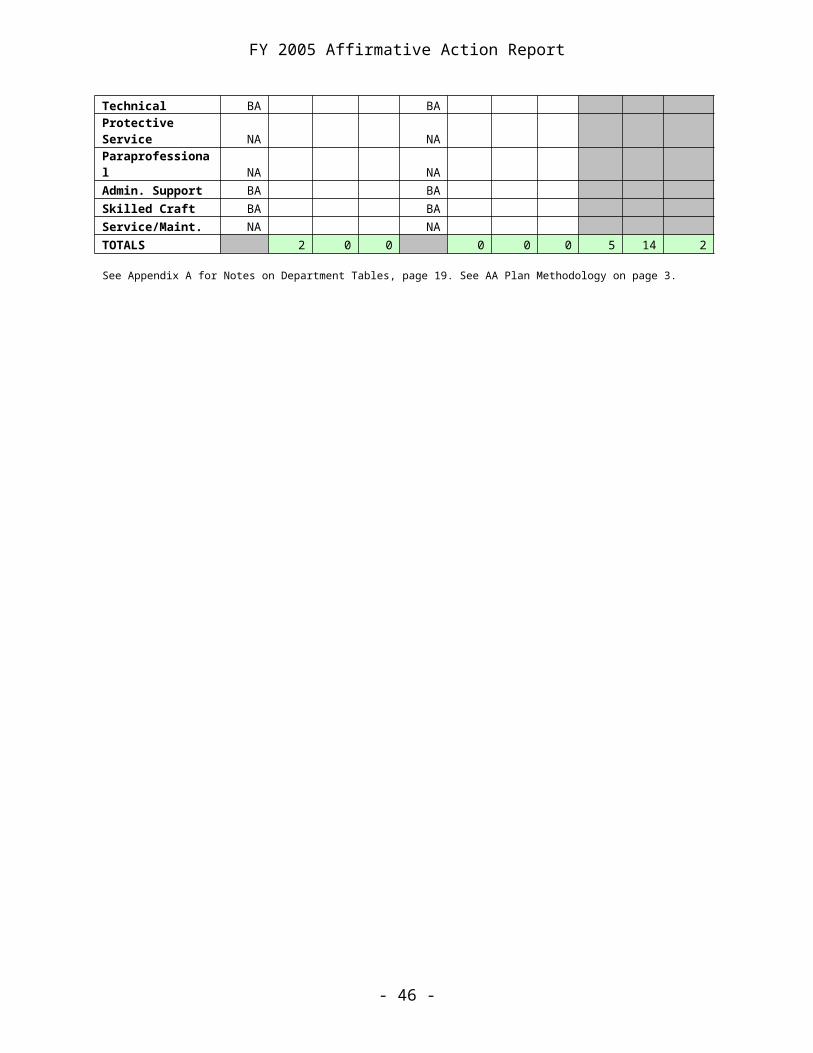
Commerce/Alcoholic Beverages
FY ‘05 Workforce Changes EOFY 2004 FY 2005 FY 2005 EOFY 2005 Workforce Terminations All Hires Workforce
T F Mn D T F Mn D T F Mn D T F Mn DOfficial /Admin 6 2 1 6 2 Professional 10 3 1 10 2 Technical 2 2 3 3 Protective Service Paraprofessional 4 3 5 4 Admin. Support 10 10 1 1 1 1 9 9 Skilled Craft 1 1 Service/Maint. 14 1 10 1 17 3 18 1 TOTALS 47 21 0 0 12 2 0 0 20 1 3 0 51 20 1
FY ‘05 Goals & Achievements Threshold BOFY 05 FY 2005 EOFY 05EEO Code Label Total UU Hire Goal* Net Change F Mn D F Mn D F Mn D F Mn DOfficial /Admin BA BA Professional BA BA Technical BA NP Protective Service NA NA Paraprofessional BA BA Admin. Support BA BA Skilled Craft BA BA Service/Maint. NA NA TOTALS 0 0 5 0 0 2 0 0 2
FY ‘06 Affirmative Action Goals BOFY
Female MinorityPersons
w/DisabilitiesEEO Code Total Proj. Hire Total Proj. Hire Total Proj. Hire Label UU Hires Goal Label UU Hires Goal UU Hire GoalsOfficial /Admin. BA BA Professional NP 2 BA Technical BA BA Protective Service NA NA Paraprofessional NA NA Admin. Support BA BA Skilled Craft BA BA Service/Maint. NA NA TOTALS 2 0 0 0 0 0 5 14 2
See Appendix A for Notes on Department Tables, page 19. See AA Plan Methodology on page 3.
- 29 -
FY 2005 Affirmative Action Report
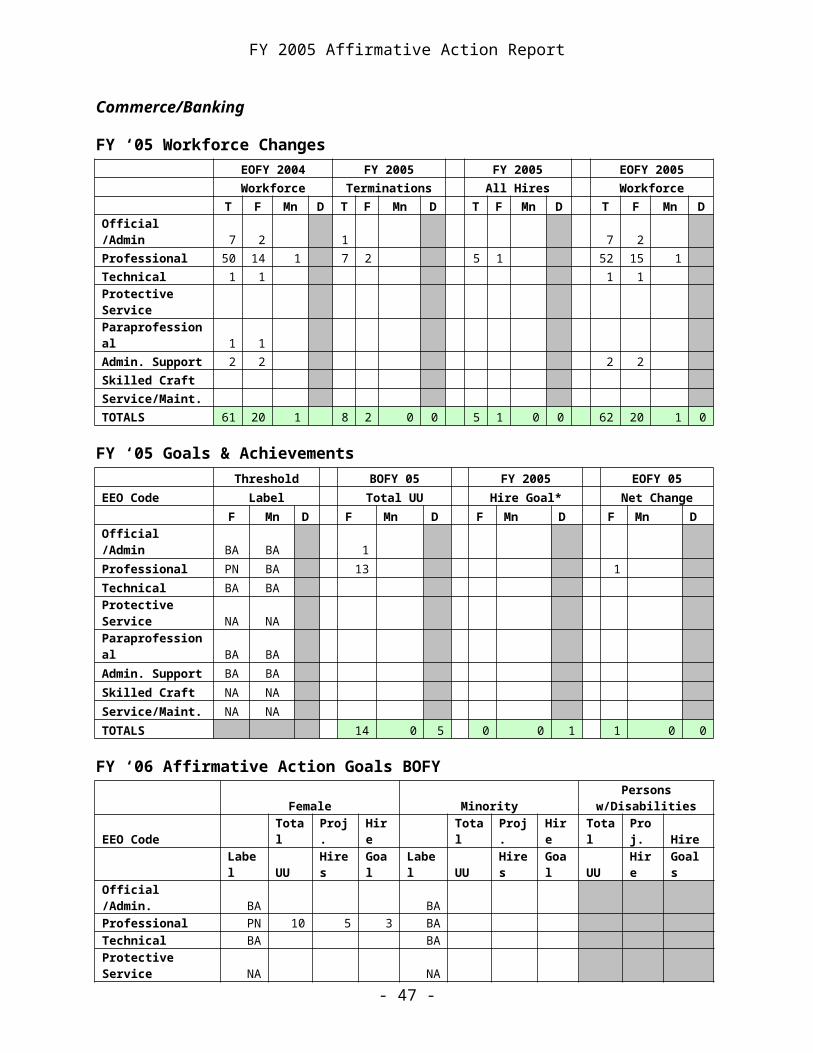
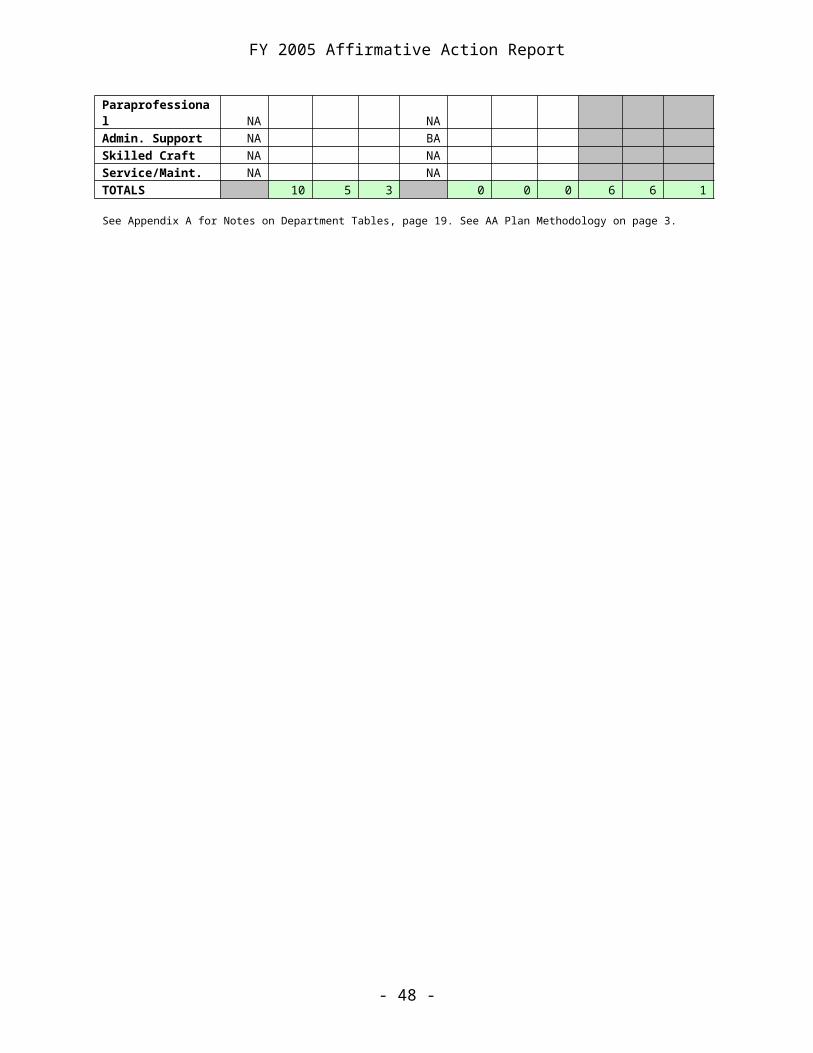
Commerce/Banking
FY ‘05 Workforce Changes EOFY 2004 FY 2005 FY 2005 EOFY 2005 Workforce Terminations All Hires Workforce
T F Mn D T F Mn D T F Mn D T F Mn DOfficial /Admin 7 2 1 7 2 Professional 50 14 1 7 2 5 1 52 15 1 Technical 1 1 1 1 Protective Service Paraprofessional 1 1 Admin. Support 2 2 2 2 Skilled Craft Service/Maint. TOTALS 61 20 1 8 2 0 0 5 1 0 0 62 20 1 0
FY ‘05 Goals & Achievements Threshold BOFY 05 FY 2005 EOFY 05EEO Code Label Total UU Hire Goal* Net Change F Mn D F Mn D F Mn D F Mn DOfficial /Admin BA BA 1 Professional PN BA 13 1 Technical BA BA Protective Service NA NA Paraprofessional BA BA Admin. Support BA BA Skilled Craft NA NA Service/Maint. NA NA TOTALS 14 0 5 0 0 1 1 0 0
FY ‘06 Affirmative Action Goals BOFY
Female MinorityPersons
w/DisabilitiesEEO Code Total Proj. Hire Total Proj. Hire Total Proj. Hire Label UU Hires Goal Label UU Hires Goal UU Hire GoalsOfficial /Admin. BA BA Professional PN 10 5 3 BA Technical BA BA Protective Service NA NA Paraprofessional NA NA Admin. Support NA BA Skilled Craft NA NA Service/Maint. NA NA TOTALS 10 5 3 0 0 0 6 6 1
See Appendix A for Notes on Department Tables, page 19. See AA Plan Methodology on page 3.
- 30 -
FY 2005 Affirmative Action Report
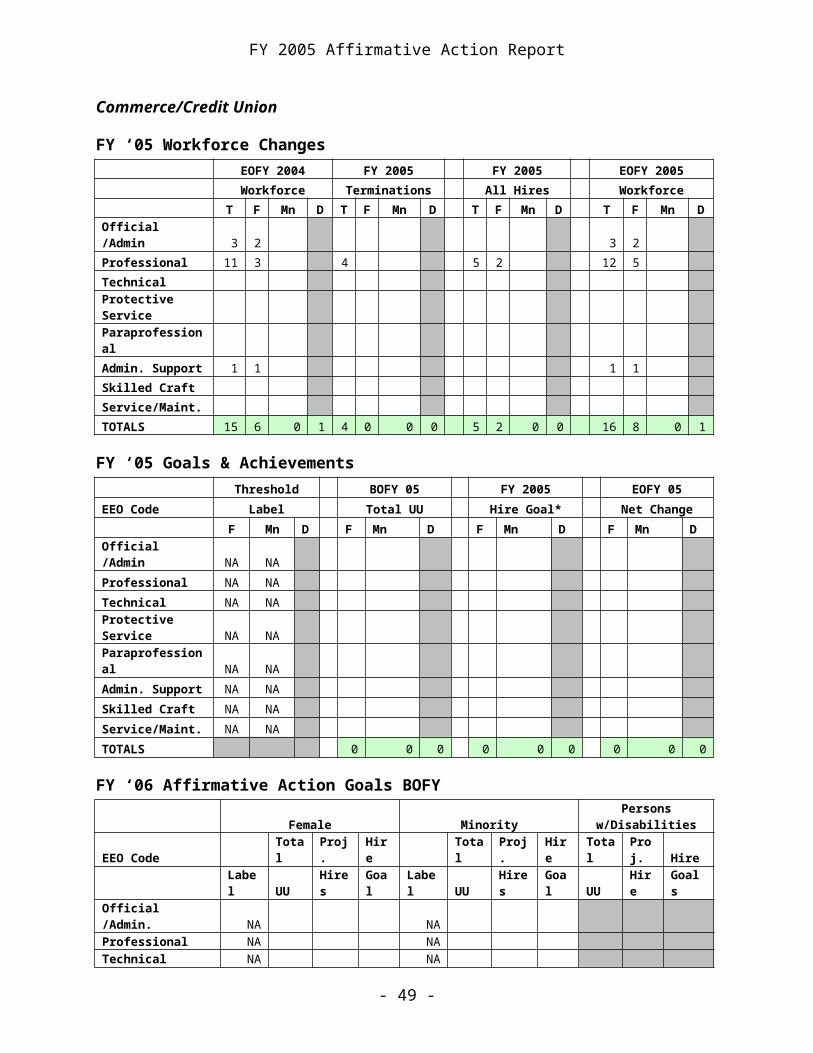
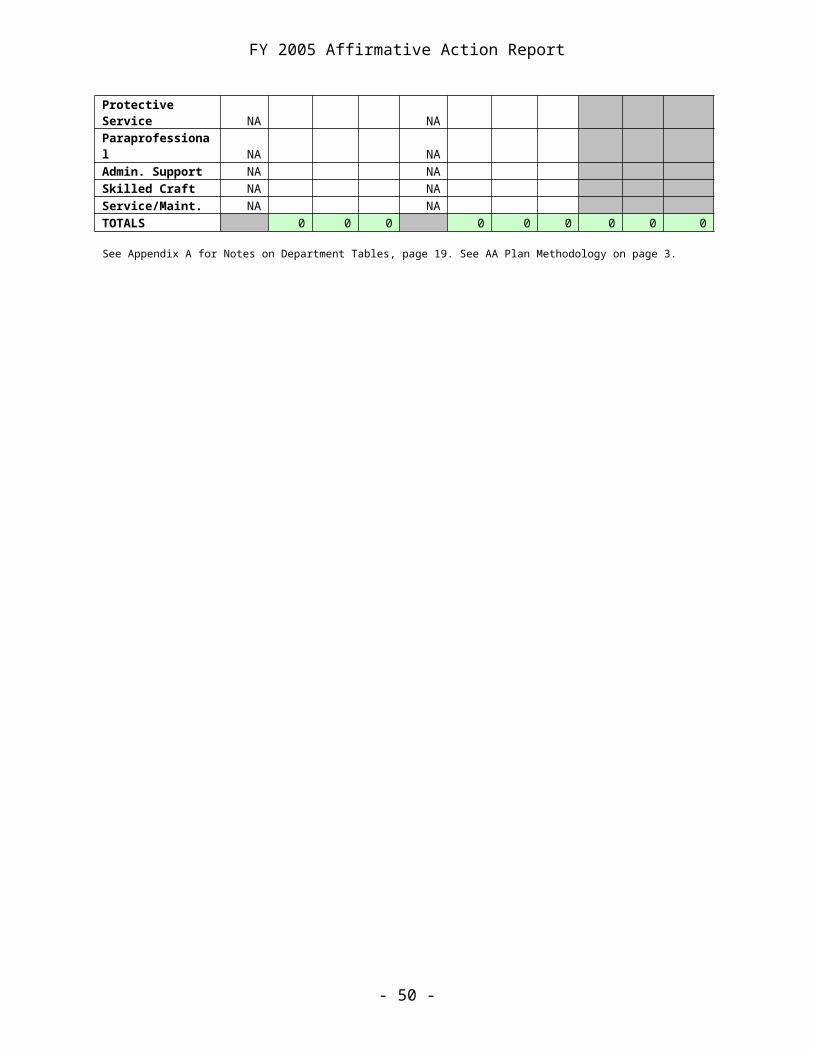
Commerce/Credit Union
FY ‘05 Workforce Changes EOFY 2004 FY 2005 FY 2005 EOFY 2005 Workforce Terminations All Hires Workforce
T F Mn D T F Mn D T F Mn D T F Mn DOfficial /Admin 3 2 3 2
Professional 11 3 4 5 2 12 5
Technical
Protective Service
Paraprofessional
Admin. Support 1 1 1 1
Skilled Craft
Service/Maint.
TOTALS 15 6 0 1 4 0 0 0 5 2 0 0 16 8 0 1
FY ‘05 Goals & Achievements Threshold BOFY 05 FY 2005 EOFY 05EEO Code Label Total UU Hire Goal* Net Change F Mn D F Mn D F Mn D F Mn DOfficial /Admin NA NA
Professional NA NA
Technical NA NA
Protective Service NA NA
Paraprofessional NA NA
Admin. Support NA NA
Skilled Craft NA NA
Service/Maint. NA NA
TOTALS 0 0 0 0 0 0 0 0 0
FY ‘06 Affirmative Action Goals BOFY
Female MinorityPersons
w/DisabilitiesEEO Code Total Proj. Hire Total Proj. Hire Total Proj. Hire Label UU Hires Goal Label UU Hires Goal UU Hire GoalsOfficial /Admin. NA NA Professional NA NA Technical NA NA Protective Service NA NA Paraprofessional NA NA Admin. Support NA NA Skilled Craft NA NA Service/Maint. NA NA TOTALS 0 0 0 0 0 0 0 0 0
See Appendix A for Notes on Department Tables, page 19. See AA Plan Methodology on page 3.
- 31 -
FY 2005 Affirmative Action Report
Commerce/Insurance
FY ‘05 Workforce Changes EOFY 2004 FY 2005 FY 2005 EOFY 2005 Workforce Terminations All Hires Workforce
T F Mn D T F Mn D T F Mn D T F Mn DOfficial /Admin 19 10 1 1 1 1 20 9 1 Professional 48 21 3 4 1 4 1 2 45 20 5 Technical 1 1 Protective Service Paraprofessional 8 8 8 8 Admin. Support 10 9 2 3 3 5 4 1 11 10 2 Skilled Craft Service/Maint. TOTALS 86 49 6 7 8 5 0 2 10 5 3 0 84 47 8 5
FY ‘05 Goals & Achievements Threshold BOFY 05 FY 2005 EOFY 05EEO Code Label Total UU Hire Goal* Net Change F Mn D F Mn D F Mn D F Mn DOfficial /Admin BA BA Professional PN BA 1 1 0 Technical BA BA Protective Service NA NA Paraprofessional BA BA Admin. Support BA BA Skilled Craft NA NA Service/Maint. NA NA TOTALS 1 0 1 1 0 1 0 0 -2
FY ‘06 Affirmative Action Goals BOFY
Female MinorityPersons
w/DisabilitiesEEO Code Total Proj. Hire Total Proj. Hire Total Proj. Hire Label UU Hires Goal Label UU Hires Goal UU Hire GoalsOfficial /Admin. NA BA Professional NP BA Technical BA BA Protective Service NA NA Paraprofessional NA NA Admin. Support BA BA Skilled Craft NA BA Service/Maint. BA NA TOTALS 0 0 0 0 0 0 3 11 2
See Appendix A for Notes on Department Tables, page 19. See AA Plan Methodology on page 3.
- 32 -
FY 2005 Affirmative Action Report
Commerce/Professional Licensing
FY ‘05 Workforce Changes EOFY 2004 FY 2005 FY 2005 EOFY 2005 Workforce Terminations All Hires Workforce
T F Mn D T F Mn D T F Mn D T F Mn DOfficial /Admin 5 3 5 3 Professional 1 1 Technical 1 1 1 1 Protective Service Paraprofessional 1 1 1 1 Admin. Support 2 2 2 2 Skilled Craft Service/Maint. TOTALS 10 7 0 0 0 0 0 0 0 0 0 0 10 7 0 0
FY ‘05 Goals & Achievements Threshold BOFY 05 FY 2005 EOFY 05EEO Code Label Total UU Hire Goal* Net Change F Mn D F Mn D F Mn D F Mn DOfficial /Admin NA NA Professional NA NA Technical NA NA Protective Service NA NA Paraprofessional NA NA Admin. Support NA NA Skilled Craft NA NA Service/Maint. NA NA TOTALS 0 0 0 0 0 0 0 0 0
FY ‘06 Affirmative Action Goals BOFY Female Minority Persons w/DisabilitiesEEO Code Total Proj. Hire Total Proj. Hire Total Proj. Hire
Label UU HiresGoal Label UU Hires
Goal UU Hire Goals
Official /Admin. NA NA Professional NA NA Technical NA NA Protective Service NA NA Paraprofessional NA NA Admin. Support NA NA Skilled Craft NA NA Service/Maint. NA NA TOTALS 0 0 0 0 0 0 0 0 0
See Appendix A for Notes on Department Tables, page 19. See AA Plan Methodology on page 3.
- 33 -
FY 2005 Affirmative Action Report
Commerce/Utilities
FY ‘05 Workforce Changes EOFY 2004 FY 2005 FY 2005 EOFY 2005 Workforce Terminations All Hires Workforce
T F Mn D T F Mn D T F Mn D T F Mn DOfficial /Admin 13 5 1 12 5 Professional 34 11 1 6 1 1 38 13 4 Technical 5 1 6 1 Protective Service Paraprofessional 4 4 4 4 Admin. Support 8 8 1 8 8 1 Skilled Craft Service/Maint. TOTALS 64 29 1 1 0 0 0 7 1 1 0 68 31 5 5
FY ‘05 Goals & Achievements Threshold BOFY 05 FY 2005 EOFY 05EEO Code Label Total UU Hire Goal* Net Change F Mn D F Mn D F Mn D F Mn DOfficial /Admin BA BA Professional PN BA 4 2 0 Technical BA BA Protective Service NA NA Paraprofessional BA BA Admin. Support BA BA Skilled Craft NA BA Service/Maint. NA NA TOTALS 4 0 1 2 0 1 0 0 0
FY ‘06 Affirmative Action Goals BOFY
Female MinorityPersons
w/DisabilitiesEEO Code Total Proj. Hire Total Proj. Hire Total Proj. Hire Label UU Hires Goal Label UU Hires Goal UU Hire GoalsOfficial /Admin. BA BA Professional PN 6 1 1 BA Technical BA BA Protective Service NA NA Paraprofessional NA NA Admin. Support BA BA Skilled Craft NA NA Service/Maint. NA NA TOTALS 6 1 1 0 0 0 1 1 1
See Appendix A for Notes on Department Tables, page 19. See AA Plan Methodology on page 3.
- 34 -
FY 2005 Affirmative Action Report
Corrections EOFY 2004 FY 2005 FY 2005 EOFY 2005 Workforce Terminations All Hires Workforce
T F Mn D T FMn D T F
Mn D T F Mn D
Official /Admin 87 31 5 4 2 8 2 88 31 5
Professional 48223
8 29 2212 37
24 5 475
242 29
Technical 37 24 1 3 3 2 2 36 23 2 Protective Service
1769
304 94
116
27
140
31 9
1731
294 87
Paraprofessional 34 34 1 2 2 35 34 1
Admin. Support 17916
0 8 10 9 1614 172
154 7
Skilled Craft 194 7 4 15 1 8 1 185 6 4 Service/Maint. 157 72 4 10 5 8 4 149 70 4
TOTALS293
987
014
618
218
261 0
16
219
78 14 8
2871
854
139
170
FY ‘05 Workforce Changes
FY ‘05 Goals & Achievements Threshold BOFY 05 FY 2005 EOFY 05EEO Code Label Total UU Hire Goal* Net Change F Mn D F Mn D F Mn D F Mn DOfficial /Admin PN BA 9 3 -1 Professional PN NP 93 2 15 -1 0 Technical NP NP 1 1 0 0 Protective Service PN NP 86 49 15 -5 -5 Paraprofessional BA BA Admin. Support BA NP 2 -1 Skilled Craft NP ST 7 4 1 -1 0 Service/Maint. ST BA 16 2 5 -2 TOTALS 212 60 93 38 1 32 -10 -6 -12
FY ‘06 Affirmative Action Goals BOFY Female Minority Persons w/DisabilitiesEEO Code Total Proj. Hire Total Proj. Hire Total Proj. Hire Label UU Hires Goal Label UU Hires Goal UU Hire GoalsOfficial /Admin. PN 19 8 2 BA Professional PN 78 47 15 NP Technical NP 1 3 1 NP 3 1 Protective Service PN 201 188 28 NP 188 9 Paraprofessional NA NA Admin. Support NP 2 NP Skilled Craft NP 7 12 1 PN 12 2 1 Service/Maint. BA NP 15 1 TOTALS 308 258 47 218 13 1 101 213 17
See Appendix A for Notes on Department Tables, page 19. See AA Plan Methodology on page 3.
- 35 -
FY 2005 Affirmative Action Report
Cultural Affairs
FY ‘05 Workforce Changes EOFY 2004 FY 2005 FY 2005 EOFY 2005 Workforce Terminations All Hires Workforce
T F Mn D T F Mn D T F Mn D T F Mn DOfficial /Admin 7 2 1 1 4 3 8 3 Professional 37 23 1 1 1 1 1 37 23 1 Technical 5 2 2 1 3 1 Protective Service Paraprofessional 5 5 6 5 Admin. Support 8 4 1 1 6 3 Skilled Craft 3 4 Service/Maint. 1 1 2 TOTALS 65 37 1 3 6 4 0 0 5 4 0 0 64 37 1 3
FY ‘05 Goals & Achievements Threshold BOFY 05 FY 2005 EOFY 05EEO Code Label Total UU Hire Goal* Net Change F Mn D F Mn D F Mn D F Mn DOfficial /Admin ST BA 1 1 1 Professional NP BA Technical BA BA Protective Service NA NA Paraprofessional BA BA Admin. Support NP BA Skilled Craft NA NA Service/Maint. BA BA TOTALS 1 0 3 1 0 1 1 0 0
FY ‘06 Affirmative Action Goals BOFY
Female MinorityPersons
w/DisabilitiesEEO Code Total Proj. Hire Total Proj. Hire Total Proj. Hire Label UU Hires Goal Label UU Hires Goal UU Hire GoalsOfficial /Admin. BA BA Professional NP 4 NP 1 Technical BA BA Protective Service NA NA Paraprofessional NA NA Admin. Support BA BA Skilled Craft NA NA Service/Maint. BA BA TOTALS 4 0 0 1 0 0 4 7 1
See Appendix A for Notes on Department Tables, page 19. See AA Plan Methodology on page 3.
- 36 -
FY 2005 Affirmative Action Report
Economic Development
FY ‘05 Workforce Changes EOFY 2004 FY 2005 FY 2005 EOFY 2005 Workforce Terminations All Hires Workforce
T F Mn D T F Mn D T FMn D T F Mn D
Official /Admin 2212 1 23
12
Professional 7944 4 4 1
12 5 81
44 4
Technical 5 5 5 5 Protective Service Paraprofessional 5 3 1 6 4 1
Admin. Support 1514 3 13
12 3
Skilled Craft Service/Maint. 6 6 1 3 3 3 3 1
TOTALS 13284 9 8 7 4 0 0
13 5 0 0 131
80 9 7
FY ‘05 Goals & Achievements Threshold BOFY 05 FY 2005 EOFY 05EEO Code Label Total UU Hire Goal* Net Change F Mn D F Mn D F Mn D F Mn DOfficial /Admin BA BA Professional BA BA Technical BA BA Protective Service NA NA Paraprofessional BA BA Admin. Support BA BA Skilled Craft NA NA Service/Maint. NA NA TOTALS 0 0 6 0 0 3 0 0 -1
FY ‘06 Affirmative Action Goals BOFY
Female MinorityPersons
w/DisabilitiesEEO Code Total Proj. Hire Total Proj. Hire Total Proj. Hire Label UU Hires Goal Label UU Hires Goal UU Hire GoalsOfficial /Admin. BA BA Professional BA BA Technical BA BA Protective Service NA NA Paraprofessional NA NA Admin. Support BA BA Skilled Craft NA NA Service/Maint. NA NA TOTALS 0 0 0 0 0 0 6 19 3
See Appendix A for Notes on Department Tables, page 19. See AA Plan Methodology on page 3
- 37 -
FY 2005 Affirmative Action Report
Education
FY ‘05 Workforce Changes EOFY 2004 FY 2005 FY 2005 EOFY 2005 Workforce Terminations All Hires Workforce
T FMn D T F
Mn D T F
Mn D T F
Mn D
Official /Admin 32 17 6 4 6 4 31 16
Professional 33
920
2 23 35
20
32
21 2
329
198 22
Technical 92 66 5 6 5 10
10 1 92 68 5
Protective Service
Paraprofessional 15 13 15 14
Admin. Support 12
311
6 9 8 7 7 4 11
711
0 8
Skilled Craft 5 1 5 1
Service/Maint. 3 1 3 1
TOTALS60
941
5 3867
55
36 0 6
55
39 3 3
592
407 36
63
FY ‘05 Goals & Achievements Threshold BOFY 05 FY 2005 EOFY 05EEO Code Label Total UU Hire Goal* Net Change F Mn D F Mn D F Mn D F Mn DOfficial /Admin BA NP Professional PN BA 10 1 5 1 1 Technical NP BA 2 -1 Protective Service NA NA Paraprofessional BA BA Admin. Support BA BA Skilled Craft BA BA Service/Maint. ST BA TOTALS 12 1 0 5 0 0 0 1 NU
FY ‘04 Affirmative Action Goals BOFY
Female MinorityPersons
w/DisabilitiesEEO Code Total Proj. Hire Total Proj. Hire Total Proj. Hire Label UU Hires Goal Label UU Hires Goal UU Hire GoalsOfficial /Admin. BA PN 1 4 1 Professional NP 21 NP 3 Technical NP 2 BA Protective Service BA NA Paraprofessional NA NA Admin. Support BA BA Skilled Craft BA BA Service/Maint. BA BA TOTALS 23 0 0 4 4 1 1 50 1
See Appendix A for Notes on Department Tables, page 19. See AA Plan Methodology on page 3.
- 38 -
FY 2005 Affirmative Action Report
Elder Affairs
FY ‘05 Workforce Changes EOFY 2004 FY 2005 FY 2005 EOFY 2005 Workforce Terminations All Hires Workforce
T F Mn D T F Mn D T F Mn D T F Mn DOfficial /Admin 8 4 2 2 9 5 Professional 8 5 1 1 1 3 3 11 8 1 Technical 3 2 1 1 3 2 Protective Service Paraprofessional 2 2 1 1 2 2 Admin. Support 3 3 3 3 Skilled Craft Service/Maint. TOTALS 24 16 1 2 1 1 0 0 7 7 0 0 28 20 1 2
FY ‘05 Goals & Achievements Threshold BOFY 05 FY 2005 EOFY 05EEO Code Label Total UU Hire Goal* Net Change F Mn D F Mn D F Mn D F Mn DOfficial /Admin BA BA Professional BA BA Technical BA BA Protective Service NA NA Paraprofessional BA BA Admin. Support BA BA Skilled Craft NA NA Service/Maint. NA NA TOTALS 0 0 0 0 0 0 0 0 0
FY ‘06 Affirmative Action Goals BOFY
Female MinorityPersons
w/DisabilitiesEEO Code Total Proj. Hire Total Proj. Hire Total Proj. Hire Label UU Hires Goal Label UU Hires Goal UU Hire GoalsOfficial /Admin. NA NA Professional NA NA Technical NA NA Protective Service NA NA Paraprofessional NA NA Admin. Support NA NA Skilled Craft NA NA Service/Maint. NA NA TOTALS 0 0 0 0 0 0 1 0 0
See Appendix A for Notes on Department Tables, page 19. See AA Plan Methodology on page 3.
- 39 -
FY 2005 Affirmative Action Report
Ethics & Campaign Disclosure
FY ‘05 Workforce Changes EOFY 2004 FY 2005 FY 2005 EOFY 2005 Workforce Terminations All Hires Workforce
T F Mn D T F Mn D T F Mn D T F Mn DOfficial /Admin 1 1 Professional 3 3 3 3 Technical 2 2 2 2 Protective Service Paraprofessional Admin. Support Skilled Craft Service/Maint. TOTALS 6 5 0 0 0 0 0 0 0 0 0 0 6 5 0 0
FY ‘05 Goals & Achievements Threshold BOFY 05 FY 2005 EOFY 05EEO Code Label Total UU Hire Goal* Net Change F Mn D F Mn D F Mn D F Mn DOfficial /Admin NA NA Professional NA NA Technical NA NA Protective Service NA NA Paraprofessional NA NA Admin. Support NA NA Skilled Craft NA NA Service/Maint. NA NA TOTALS 0 0 0 0 0 0 0 0 0
FY ‘06 Affirmative Action Goals BOFY
Female MinorityPersons
w/DisabilitiesEEO Code Total Proj. Hire Total Proj. Hire Total Proj. Hire Label UU Hires Goal Label UU Hires Goal UU Hire GoalsOfficial /Admin. NA NA Professional NA NA Technical NA NA Protective Service NA NA Paraprofessional NA NA Admin. Support NA NA Skilled Craft NA NA Service/Maint. NA NA TOTALS 0 0 0 0 0 0 0 0 0
See Appendix A for Notes on Department Tables, page 19. See AA Plan Methodology on page 3.
- 40 -
FY 2005 Affirmative Action Report
Finance Authority
FY ‘05 Workforce Changes EOFY 2004 FY 2005 FY 2005 EOFY 2005 Workforce Terminations All Hires Workforce
T F Mn D T F Mn D T F Mn D T F Mn DOfficial /Admin 21 8 1 2 1 24 11 1 Professional 38 19 1 3 2 4 3 36 18 1 Technical 1 1 1 1 Protective Service Paraprofessional 18 16 1 1 19 16 1 Admin. Support 6 6 2 1 1 6 5 Skilled Craft 2 1 Service/Maint. TOTALS 84 50 2 7 4 3 0 1 10 6 1 1 86 51 3 6
FY ‘05 Goals & Achievements Threshold BOFY 05 FY 2005 EOFY 05EEO Code Label Total UU Hire Goal* Net Change F Mn D F Mn D F Mn D F Mn DOfficial /Admin NP BA 1 3 Professional BA BA Technical BA BA Protective Service NA NA Paraprofessional BA BA Admin. Support BA BA Skilled Craft NA NA Service/Maint. NA NA TOTALS 1 0 2 0 0 1 3 0 -1
FY ‘06 Affirmative Action Goals BOFY
Female MinorityPersons
w/DisabilitiesEEO Code Total Proj. Hire Total Proj. Hire Total Proj. Hire Label UU Hires Goal Label UU Hires Goal UU Hire GoalsOfficial /Admin. BA BA Professional BA BA Technical BA BA Protective Service NA NA Paraprofessional NA NA Admin. Support BA BA Skilled Craft NA NA Service/Maint. NA NA TOTALS 0 0 0 0 0 0 3 2 1
See Appendix A for Notes on Department Tables, page 19. See AA Plan Methodology on page 3.
- 41 -
FY 2005 Affirmative Action Report
Human Rights
FY ‘05 Workforce Changes EOFY 2004 FY 2005 FY 2005 EOFY 2005 Workforce Terminations All Hires Workforce
T F Mn D T F Mn D T F Mn D T F Mn DOfficial /Admin 10 5 3 1 1 2 1 1 11 5 3 Professional 34 17 2 1 3 3 37 21 1 Technical 2 2 2 2 Protective Service Paraprofessional 3 3 3 3 Admin. Support 5 5 1 1 1 4 4 1 Skilled Craft Service/Maint. TOTALS 54 32 6 5 3 2 0 0 5 4 1 1 57 35 5 9
FY ‘05 Goals & Achievements Threshold BOFY 05 FY 2005 EOFY 05EEO Code Label Total UU Hire Goal* Net Change F Mn D F Mn D F Mn D F Mn DOfficial /Admin BA BA Professional BA BA Technical BA BA Protective Service NA NA Paraprofessional BA BA Admin. Support BA BA Skilled Craft NA NA Service/Maint. NA NA TOTALS 0 0 0 0 0 0 0 0 0
FY ‘06 Affirmative Action Goals BOFY
Female MinorityPersons
w/DisabilitiesEEO Code Total Proj. Hire Total Proj. Hire Total Proj. Hire Label UU Hires Goal Label UU Hires Goal UU Hire GoalsOfficial /Admin. NP 9 PN 6 16 1 Professional NP 26 NP 13 Technical NP 3 NP 5 Protective Service PN 1 193 1 PN 9 193 8 Paraprofessional NA NA Admin. Support BA NP 1 Skilled Craft NP 1 PN 3 6 1 Service/Maint. NP 52 PN 57 2 1 TOTALS 92 193 1 94 217 11 275 481 6
See Appendix A for Notes on Department Tables, page 19. See AA Plan Methodology on page 3
- 42 -
FY 2005 Affirmative Action Report
.Human Services
FY ‘05 Workforce Changes EOFY 2004 FY 2005 FY 2005 EOFY 2005 Workforce Terminations All Hires Workforce
T F Mn D T FMn D T F
Mn D T F Mn D
Official /Admin 139 67 6 12 2 23 14 154 78 6
Professional 177
0131
810
0 13
1 87 23
717
7 17 180
9135
7 98
Technical 870 751 35 48 43 98 86 11 894 773 42 Protective Service 216 63 9 24 12 16 8 210 58 7 Paraprofessional
1217 834 35
117 82
167
106 9
1246 844 36
Admin. Support 623 593 38 45 44 86 82 8 648 588 39
Skilled Craft 119 5 1 8 8 1 118 8 1
Service/Maint. 192 121 9 15 9 21 13 188 121 10
TOTALS514
6375
223
328
840
027
9 031
656
487 45
14
5267
3827
239
281
FY ‘05 Goals & Achievements Threshold BOFY 05 FY 2005 EOFY 05EEO Code Label Total UU Hire Goal* Net Change F Mn D F Mn D F Mn D F Mn DOfficial /Admin NP BA 3 6 Professional NP NP 34 15 -1 4 Technical BA NP 1 0 Protective Service NP NP 18 7 -1 -1 Paraprofessional NP PN 40 25 5 11 1 Admin. Support BA BA 1 0 Skilled Craft NP NP 3 2 2 0 Service/Maint. NP NP 2 3 1 0 TOTALS 100 54 232 0 5 5 18 4 -24
FY ‘06 Affirmative Action Goals BOFY Female Minority Persons w/DisabilitiesEEO Code Total Proj. Hire Total Proj. Hire Total Proj. Hire Label UU Hires Goal Label UU Hires Goal UU Hire GoalsOfficial /Admin. NP 9 PN 6 16 1 Professional NP 26 NP 13 Technical NP 3 NP 5 Protective Service PN 1 193 1 PN 9 193 8 Paraprofessional NA NA Admin. Support BA NP 1 Skilled Craft NP 1 PN 3 6 1 Service/Maint. NP 52 PN 57 2 1 TOTALS 92 193 1 94 217 11 275 481 6
See Appendix A for Notes on Department Tables, page 19. See AA Plan Methodology on page 3.
- 43 -
FY 2005 Affirmative Action Report
Inspections & Appeals
FY ‘05 Workforce Changes EOFY 2004 FY 2005 FY 2005 EOFY 2005 Workforce Terminations All Hires Workforce
T F Mn D T F Mn D T F Mn D T F Mn DOfficial /Admin 31 15 1 1 1 33 17 1 Professional 343 184 14 30 24 51 35 6 357 188 19 Technical 4 2 1 4 2 1 Protective Service Paraprofessional 15 15 1 1 5 5 17 17 Admin. Support 81 80 7 5 5 8 7 1 77 75 7 Skilled Craft Service/Maint. TOTALS 474 296 23 30 36 30 0 1 65 48 7 3 488 299 28 36
FY ‘05 Goals & Achievements Threshold BOFY 05 FY 2005 EOFY 05EEO Code Label Total UU Hire Goal* Net Change F Mn D F Mn D F Mn D F Mn DOfficial /Admin BA BA
Professional NP NP 1 4 0 0
Technical BA BA Protective Service NA NA
Paraprofessional BA BA
Admin. Support BA BA
Skilled Craft NA NA
Service/Maint. BA NA
TOTALS 1 4 17 0 0 7 0 0 3
FY ‘06 Affirmative Action Goals BOFY
Female MinorityPersons
w/DisabilitiesEEO Code Total Proj. Hire Total Proj. Hire Total Proj. Hire
Label UU Hires Goal Label UU Hires Goal UU HireGoals
Official /Admin. BA BA Professional NP 1 BA Technical BA BA Protective Service NA NA Paraprofessional NA NA Admin. Support BA BA Skilled Craft NA NA Service/Maint. NA NA TOTALS 1 0 0 0 0 0 17 64 8
See Appendix A for Notes on Department Tables, page 19. See AA Plan Methodology on page 3.
- 44 -
FY 2005 Affirmative Action Report
Iowa Communications Network
FY ‘05 Workforce Changes EOFY 2004 FY 2005 FY 2005 EOFY 2005 Workforce Terminations All Hires Workforce
T F Mn D T F Mn D T F Mn D T F Mn DOfficial /Admin 26 7 3 4 2 22 5 1 Professional 49 14 1 2 1 1 1 47 14 2 Technical 11 7 2 1 1 1 1 11 7 2 Protective Service Paraprofessional 5 5 6 6 Admin. Support 5 5 4 4 Skilled Craft Service/Maint. TOTALS 96 38 6 6 7 4 0 1 2 2 0 0 90 36 5 6
FY ‘05 Goals & Achievements Threshold BOFY 05 FY 2005 EOFY 05EEO Code Label Total UU Hire Goal* Net Change F Mn D F Mn D F Mn D F Mn DOfficial /Admin NP BA 4 -2 Professional BA NP 2 1 1 1 Technical BA BA Protective Service NA NA Paraprofessional BA BA Admin. Support BA BA Skilled Craft NA NA Service/Maint. NA NA TOTALS 6 1 2 0 0 2 -1 1 -1
FY ‘06 Affirmative Action Goals BOFY
Female MinorityPersons
w/DisabilitiesEEO Code Total Proj. Hire Total Proj. Hire Total Proj. Hire Label UU Hires Goal Label UU Hires Goal UU Hire GoalsOfficial /Admin. PN 2 2 1 BA Professional PN 1 2 1 NP 1 Technical BA BA Protective Service NA NA Paraprofessional NA NA Admin. Support BA BA Skilled Craft NA NA Service/Maint. NA NA TOTALS 3 4 2 1 0 0 3 2 1
See Appendix A for Notes on Department Tables, page 19. See AA Plan Methodology on page 3
- 45 -
FY 2005 Affirmative Action Report
Iowa Public Employees Retirement System (IPERS)
FY ‘05 Workforce Changes EOFY 2004 FY 2005 FY 2005 EOFY 2005 Workforce Terminations All Hires Workforce
T F Mn D T F Mn D T F Mn D T F Mn DOfficial /Admin 13 6 3 1 10 5 Professional 52 29 4 5 3 8 5 1 52 28 5 Technical 10 9 2 2 10 9 Protective Service Paraprofessional 4 4 1 1 2 2 4 4 Admin. Support 7 5 1 1 1 1 1 7 5 1 Skilled Craft Service/Maint. TOTALS 86 53 5 5 10 6 0 0 13 10 1 0 83 51 6 5
FY ‘05 Goals & Achievements Threshold BOFY 05 FY 2005 EOFY 05EEO Code Label Total UU Hire Goal* Net Change F Mn D F Mn D F Mn D F Mn DOfficial /Admin BA BA Professional NP BA 1 0 Technical BA BA Protective Service NA NA Paraprofessional BA BA Admin. Support BA BA Skilled Craft NA NA Service/Maint. NA NA TOTALS 1 0 4 0 0 2 0 0 0
FY ‘06 Affirmative Action Goals BOFY
Female MinorityPersons
w/DisabilitiesEEO Code Total Proj. Hire Total Proj. Hire Total Proj. Hire Label UU Hires Goal Label UU Hires Goal UU Hire GoalsOfficial /Admin. BA BA Professional NP 1 NP 1 Technical BA NP Protective Service NA NA Paraprofessional NA NA Admin. Support BA BA Skilled Craft NA NA Service/Maint. NA NA TOTALS 1 0 0 1 0 0 3 8 1
See Appendix A for Notes on Department Tables, page 19. See AA Plan Methodology on page 3.
- 46 -
FY 2005 Affirmative Action Report
Justice
FY ‘05 Workforce Changes EOFY 2004 FY 2005 FY 2005 EOFY 2005 Workforce Terminations All Hires Workforce
T FMn D T F
Mn D T F
Mn D T F
Mn D
Official /Admin 21 8 1 1 1 20 7
Professional 17
0 84 5 14 9
16 8 1 164 76 6
Technical Protective Service Paraprofessional 9 8 9 8
Admin. Support 30 30 1 6 6 12
12 1 31 31 2
Skilled Craft Service/Maint.
TOTALS23
0 130 6 721
16 0 1
29
20 2 1 224 122 8 5
FY ‘05 Goals & Achievements Threshold BOFY 05 FY 2005 EOFY 05EEO Code Label Total UU Hire Goal* Net Change F Mn D F Mn D F Mn D F Mn DOfficial /Admin NP BA 1 -1 Professional PN BA 1 1 -1 Technical NA NA Protective Service NA NA Paraprofessional BA BA Admin. Support BA BA Skilled Craft NA NA Service/Maint. NA NA TOTALS 2 0 17 1 0 2 -2 0 -2
FY ‘06 Affirmative Action Goals BOFY205 Justice
Female MinorityPersons
w/Disabilities
EEO Code Total Proj. Hire
Total Proj. Hire
Total
Proj. Hire
Label UU
Hires
Goal
Label UU
Hires
Goal UU Hire Goals
Official /Admin. BA NP 1 Professional NP 1 NP 1 Technical NA NA Protective Service NA NA Paraprofessional NA NA Admin. Support BA BA Skilled Craft NA NA Service/Maint. NA NA TOTALS 1 0 0 2 0 0 18 17 2
- 47 -
FY 2005 Affirmative Action Report
See Appendix A for Notes on Department Tables, page 19. See AA Plan Methodology on page 3.
- 48 -
FY 2005 Affirmative Action Report
Law Enforcement Academy
FY ‘05 Workforce Changes EOFY 2004 FY 2005 FY 2005 EOFY 2005 Workforce Terminations All Hires Workforce
T F Mn D T F Mn D T F Mn D T F Mn DOfficial /Admin 2 1 2 1 Professional 15 4 15 4 Technical Protective Service 1 1 Paraprofessional Admin. Support 7 7 7 7 Skilled Craft 2 2 Service/Maint. TOTALS 27 12 0 1 0 0 0 0 0 0 0 0 27 12 0 2
FY ‘05 Goals & Achievements Threshold BOFY 05 FY 2005 EOFY 05EEO Code Label Total UU Hire Goal* Net Change F Mn D F Mn D F Mn D F Mn DOfficial /Admin BA BA Professional ST BA 3 1 0 Technical NA NA Protective Service BA BA Paraprofessional NA NA Admin. Support BA BA Skilled Craft BA BA Service/Maint. NA NA TOTALS 3 0 0 1 0 0 0 0 0
FY ‘06 Affirmative Action Goals BOFY
Female MinorityPersons
w/DisabilitiesEEO Code Total Proj. Hire Total Proj. Hire Total Proj. Hire Label UU Hires Goal Label UU Hires Goal UU Hire GoalsOfficial /Admin. NP BA Professional NP 5 BA Technical NA NA Protective Service BA BA Paraprofessional NA NA Admin. Support BA BA Skilled Craft BA BA Service/Maint. NA NA TOTALS 5 0 0 0 0 0 0 0 0
\ See Appendix A for Notes on Department Tables, page 19. See AA Plan Methodology on page 3.
- 49 -
FY 2005 Affirmative Action Report
Lottery
FY ‘05 Workforce Changes EOFY 2004 FY 2005 FY 2005 EOFY 2005 Workforce N/A Terminations All Hires Workforce
T F Mn D T F Mn D T F Mn DOfficial /Admin 13 6 Professional 2 2 66 16 1 Technical 9 7 Protective Service Paraprofessional Admin. Support 18 13 3 Skilled Craft Service/Maint. 2 1 TOTALS 0 0 0 31 2 0 0 1 2 0 0 0 108 42 5 5
FY ‘05 Goals & Achievements Threshold BOFY 05 FY 2005 EOFY 05EEO Code Label Total UU Hire Goal* Net Change F Mn D F Mn D F Mn D F Mn DOfficial /Admin BA NP Professional PN BA 9 1 0 Technical BA BA Protective Service NA NA Paraprofessional BA BA Admin. Support BA BA Skilled Craft NA NA Service/Maint. BA BA TOTALS 9 0 4 1 0 1 0 0 -1
FY ‘06 Affirmative Action Goals BOFY
Female MinorityPersons
w/DisabilitiesEEO Code Total Proj. Hire Total Proj. Hire Total Proj. Hire Label UU Hires Goal Label UU Hires Goal UU Hire GoalsOfficial /Admin. BA BA Professional PN 9 1 1 BA Technical BA BA Protective Service NA NA Paraprofessional NA NA Admin. Support BA BA Skilled Craft NA NA Service/Maint. BA BA TOTALS 9 1 1 0 0 0 5 1 1
See Appendix A for Notes on Department Tables, page 19. See AA Plan Methodology on page 3.
- 50 -
FY 2005 Affirmative Action Report
Management
FY ‘05 Workforce Changes EOFY 2004 FY 2005 FY 2005 EOFY 2005 Workforce Terminations All Hires Workforce
T F Mn D T F Mn D T F Mn D T F Mn DOfficial /Admin 8 5 1 8 4 Professional 17 4 1 1 1 1 16 4 2 Technical Protective Service Paraprofessional 1 1 1 1 Admin. Support 2 2 1 1 2 2 Skilled Craft Service/Maint. TOTALS 28 12 1 2 1 0 0 0 3 1 1 0 27 11 2 1
FY ‘05 Goals & Achievements Threshold BOFY 05 FY 2005 EOFY 05EEO Code Label Total UU Hire Goal* Net Change F Mn D F Mn D F Mn D F Mn DOfficial /Admin BA BA Professional ST BA 2 1 0 Technical BA BA Protective Service NA NA Paraprofessional BA BA Admin. Support BA BA Skilled Craft NA NA Service/Maint. NA NA TOTALS 2 0 1 1 0 1 0 0 0
FY ‘06 Affirmative Action Goals BOFY
Female MinorityPersons
w/DisabilitiesEEO Code Total Proj. Hire Total Proj. Hire Total Proj. Hire Label UU Hires Goal Label UU Hires Goal UU Hire GoalsOfficial /Admin. BA BA Professional NP 4 BA Technical BA NA Protective Service NA NA Paraprofessional NA NA Admin. Support BA BA Skilled Craft NA NA Service/Maint. NA NA TOTALS 4 0 0 0 0 0 1 2 1
See Appendix A for Notes on Department Tables, page 19. See AA Plan Methodology on page 3.
- 51 -

FY 2005 Affirmative Action Report
Natural Resources
FY ‘05 Workforce Changes EOFY 2004 FY 2005 FY 2005 EOFY 2005 Workforce Terminations All Hires Workforce
T FMn D T F
Mn D T F
Mn D T F
Mn D
Official /Admin 81 22 26 4 10 3 1 85 24 1
Professional 44
811
2 1 18 4
34
11 2
457
118 26
Technical 11 6 1 1 1 1 11 7 1
Protective Service 11
2 11 8 2 11
116 11 8
Paraprofessional 28 25 4 2 1 2 2 26 24 3 Admin. Support 45 42 3 4 4 8 8 2 47 44 5 Skilled Craft 3 2
Service/Maint. 17
0 20 2 5 1 6 1 16
8 19 2
TOTALS89
823
8 4444
36
11 0 2
72
26 5 3
912
247 46
47
FY ‘05 Goals & Achievements Threshold BOFY 05 FY 2005 EOFY 05EEO Code Label Total UU Hire Goal* Net Change F Mn D F Mn D F Mn D F Mn DOfficial /Admin PN NP 16 2 3 2 1 Professional PN NP 32 34 26 4 2 Technical BA BA Protective Service PN BA 6 1 0 Paraprofessional BA BA Admin. Support BA BA Skilled Craft BA BA Service/Maint. NP NP 4 3 0 0 TOTALS 58 39 51 30 0 10 6 3 1
FY ‘06 Affirmative Action Goals BOFY
Female MinorityPersons
w/DisabilitiesEEO Code Total Proj. Hire Total Proj. Hire Total Proj. Hire Label UU Hires Goal Label UU Hires Goal UU Hire GoalsOfficial /Admin. PN 11 4 2 PN 2 4 1 Professional PN 39 48 27 NP 6 Technical PN 57 1 1 PN 8 1 1 Protective Service PN 37 7 1 PN 12 7 1 Paraprofessional NA NA Admin. Support BA BA Skilled Craft BA BA Service/Maint. NP NP TOTALS 144 60 31 28 12 3 10 83 10
See Appendix A for Notes on Department Tables, page 19. See AA Plan Methodology on page 3.
- 52 -
FY 2005 Affirmative Action Report
Parole
FY ’05 Workforce Changes EOFY 2004 FY 2005 FY 2005 EOFY 2005 Workforce Terminations All Hires Workforce
T F Mn D T F Mn D T F Mn D T F Mn DOfficial /Admin 4 2 2 1 1 3 2 2 Professional 4 2 4 2 Technical Protective Service Paraprofessional 1 1 1 1 Admin. Support 2 2 2 2 Skilled Craft Service/Maint.
TOTALS11 7 2 1 1 1 0 0 0 0 0 0 10 7 2 1
FY ‘05 Goals & Achievements Threshold BOFY 05 FY 2005 EOFY 05EEO Code Label Total UU Hire Goal* Net Change F Mn D F Mn D F Mn D F Mn DOfficial /Admin NA NA Professional NA NA Technical NA NA Protective Service NA NA Paraprofessional NA NA Admin. Support NA NA Skilled Craft NA NA Service/Maint. NA NA TOTALS 0 0 0 0 0 0 0 0 0
FY ‘06 Affirmative Action Goals BOFY
Female MinorityPersons
w/DisabilitiesEEO Code Total Proj. Hire Total Proj. Hire Total Proj. Hire Label UU Hires Goal Label UU Hires Goal UU Hire GoalsOfficial /Admin. NA NA Professional NA NA Technical NA NA Protective Service NA NA Paraprofessional NA NA Admin. Support NA NA Skilled Craft NA NA Service/Maint. NA NA TOTALS 0 0 0 0 0 0 0 0 0
See Appendix A for Notes on Department Tables, page 19. See AA Plan Methodology on page 3.
- 53 -
FY 2005 Affirmative Action Report
Public Defense
FY ‘05 Workforce Changes EOFY 2004 FY 2005 FY 2005 EOFY 2005 Workforce Terminations All Hires Workforce
T F Mn D T F Mn D T F Mn D T F Mn DOfficial /Admin 34 8 2 1 5 37 7
Professional 80 31 4 5 2 11 3 1 82 31 5
Technical 16 5 1 1 18 6 1
Protective Service 120 12 7 7 1 10 121 12 7
Paraprofessional 16 12 2 3 3 13 12 Admin. Support 13 12 1 11 10 Skilled Craft 51 3 2 1 5 57 3 2 Service/Maint. 36 4 3 2 4 1 34 5 2
TOTALS 366 87 1820 19 4 0 3
39 7 1 1 373 86 17 20
FY ‘05 Goals & Achievements Threshold BOFY 05 FY 2005 EOFY 05EEO Code Label Total UU Hire Goal* Net Change F Mn D F Mn D F Mn D F Mn DOfficial /Admin ST BA 7 1 0 Professional NP NP 3 2 -1 1 Technical NP BA 1 1 Protective Service ST BA 7 2 2 0 1 Paraprofessional NP BA 0 Admin. Support BA BA Skilled Craft BA NP 0 Service/Maint. ST BA 5 1 1 TOTALS 23 4 14 4 0 4 1 2 -3
FY ‘06 Affirmative Action Goals BOFY
Female MinorityPersons
w/Disabilities
EEO Code Total Proj. HireTotal Proj. Hire
Total Proj. Hire
Label UUHires Goal Label UU
Hires Goal UU Hire Goals
Official /Admin. PN 5 1 1 PN 1 1 1 Professional NP 8 NP 1 Technical NP BA Protective Service NP 4 NP 1 Paraprofessional NA NA Admin. Support BA BA Skilled Craft NP 1 NP 1 Service/Maint. BA NP 2 TOTALS 18 1 1 6 1 1 18 10 2
See Appendix A for Notes on Department Tables, page 19. See AA Plan Methodology on page 3.
- 54 -
FY 2005 Affirmative Action Report
Public Employment Relations
FY ‘05 Workforce Changes EOFY 2004 FY 2005 FY 2005 EOFY 2005 Workforce Terminations All Hires Workforce
T F Mn D T F Mn D T F Mn D T F Mn DOfficial /Admin 3 1 3 1 Professional 4 1 4 1 Technical Protective Service Paraprofessional Admin. Support 3 3 3 3 Skilled Craft Service/Maint. TOTALS 10 5 0 0 0 0 0 0 0 0 0 0 10 5 0 0
FY ‘05 Goals & Achievements Threshold BOFY 05 FY 2005 EOFY 05EEO Code Label Total UU Hire Goal* Net Change F Mn D F Mn D F Mn D F Mn DOfficial /Admin NA NA Professional NA NA Technical NA NA Protective Service NA NA Paraprofessional NA NA Admin. Support NA NA Skilled Craft NA NA Service/Maint. NA NA TOTALS 0 0 0 0 0 0 0 0 0
FY ‘06 Affirmative Action Goals BOFY
Female MinorityPersons
w/DisabilitiesEEO Code Total Proj. Hire Total Proj. Hire Total Proj. Hire Label UU Hires Goal Label UU Hires Goal UU Hire GoalsOfficial /Admin. NA NA Professional NA NA Technical NA NA Protective Service NA NA Paraprofessional NA NA Admin. Support NA NA Skilled Craft NA NA Service/Maint. NA NA TOTALS 0 0 0 0 0 0 0 0 0
See Appendix A for Notes on Department Tables, page 19. See AA Plan Methodology on page 3.
- 55 -
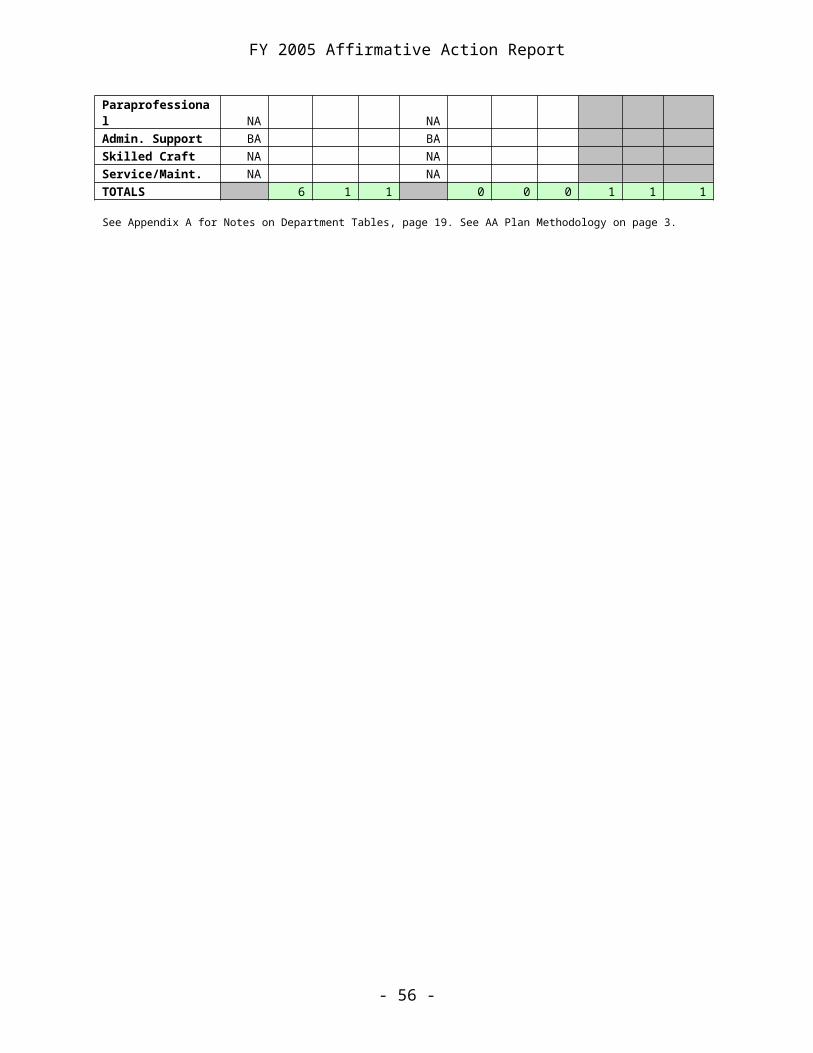
FY 2005 Affirmative Action Report
Public Health
FY ‘05 Workforce Changes EOFY 2004 FY 2005 FY 2005 EOFY 2005 Workforce Terminations All Hires Workforce
T FMn D T F
Mn D T F
Mn D T F
Mn D
Official /Admin 65 44 1 6 2 9 5 2 67 46 3
Professional 21
714
0 13 22
16
44
28 2
226 148 14
Technical 8 7 1 1 1 1 7 6 Protective Service Paraprofessional 38 36 3 2 2 1 1 33 30 4
Admin. Support 60 57 6 2 2 11
10 61 58 5
Skilled Craft Service/Maint.
TOTALS38
828
4 2430
33
23 0 3
66
44 4 6
394 288 26
35
FY ‘05 Goals & Achievements Threshold BOFY 05 FY 2005 EOFY 05EEO Code Label Total UU Hire Goal* Net Change F Mn D F Mn D F Mn D F Mn DOfficial /Admin BA BA Professional BA NP 2 1 Technical BA BA Protective Service NA NA Paraprofessional BA BA Admin. Support BA BA Skilled Craft NA NA Service/Maint. NA NA TOTALS 0 2 13 0 0 4 0 1 5
FY ‘06 Affirmative Action Goals BOFY
Female MinorityPersons
w/DisabilitiesEEO Code Total Proj. Hire Total Proj. Hire Total Proj. Hire
Label UU Hires Goal Label UU Hires Goal UU HireGoals
Official /Admin. ST BA BA Professional BA NP 2 Technical BA BA Protective Service NA NA Paraprofessional NA NA Admin. Support BA BA Skilled Craft NA NA Service/Maint. NA NA TOTALS 0 0 0 2 0 0 13 40 4
See Appendix A for Notes on Department Tables, page 19. See AA Plan Methodology on page 3.
- 56 -
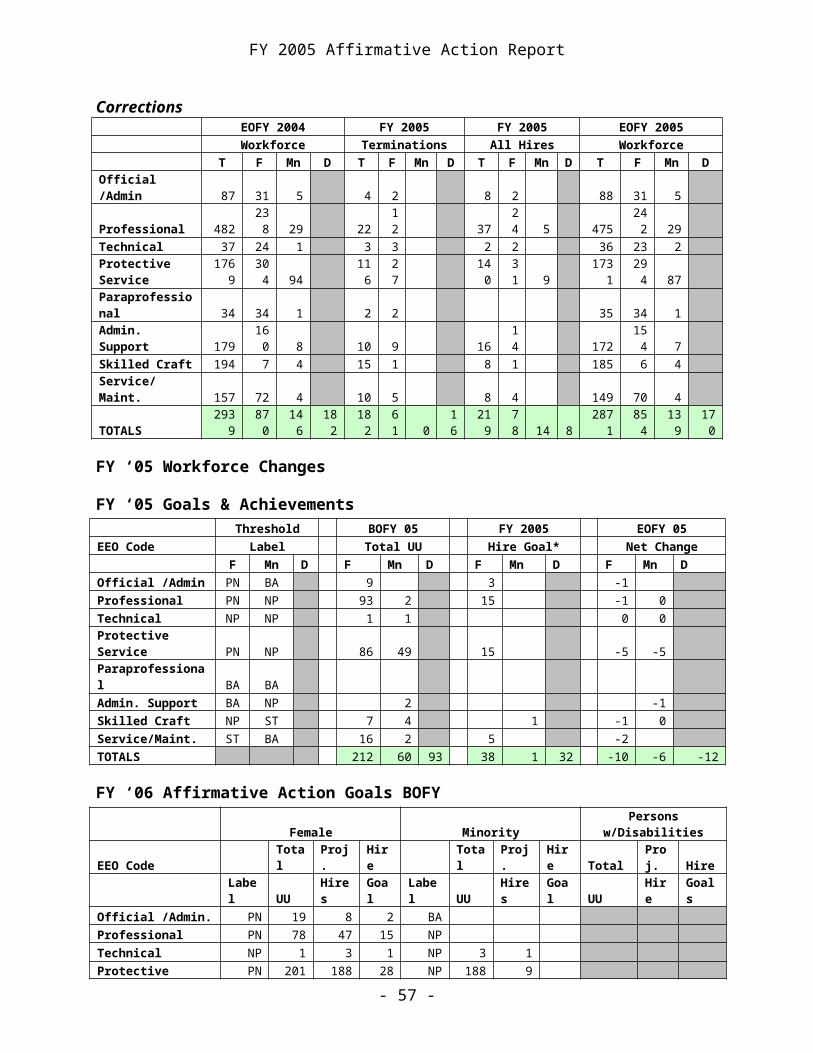
FY 2005 Affirmative Action Report
Public Safety
FY ‘05 Workforce Changes EOFY 2004 FY 2005 FY 2005 EOFY 2005 Workforce Terminations All Hires Workforce
T FMn D T F
Mn D T F
Mn D T F
Mn D
Official /Admin 22 3 2 1 5 2 28 4 1 Professional 93 40 7 3 5 2 92 42 8 Technical 27 10 3 2 2 29 13 3 Protective Service
559 33 15
27 2
129 8 2
571 34 13
Paraprofessional 17 15 1 12 10 Admin. Support
120 95 4 8 7 10 9
114 92 3
Skilled Craft 1 Service/Maint. 1
TOTALS83
819
6 2933
43
12 0 3
150
21 2 3
847
195 28
36
FY ‘05 Goals & Achievements Threshold BOFY 05 FY 2005 EOFY 05EEO Code Label Total UU Hire Goal* Net Change F Mn D F Mn D F Mn D F Mn DOfficial /Admin ST BA 3 1 1 Professional NP NP 3 4 1 1 Technical PN NP 1 1 0 0 Protective Service PN BA 12 1 3 1 2 -1 Paraprofessional BA BA Admin. Support BA NP 7 2 1 0 Skilled Craft NA NA Service/Maint. NA NA TOTALS 26 8 49 4 1 2 5 0 -2
FY ‘06 Affirmative Action Goals BOFY
Female MinorityPersons
w/DisabilitiesEEO Code Total Proj. Hire Total Proj. Hire Total Proj. Hire Label UU Hires Goal Label UU Hires Goal UU Hire GoalsOfficial /Admin. ST 5 2 1 BA Professional NP 3 NP 4 Technical PN 1 0 0 NP 1 Protective Service PN 12 30 3 PN 1 30 1 Paraprofessional NA NA Admin. Support NP 7 NP 2 Skilled Craft NA NA Service/Maint. NA NA TOTALS 28 32 4 8 30 1 49 32 2
See Appendix A for Notes on Department Tables, page 19. See AA Plan Methodology on page 3.
- 57 -
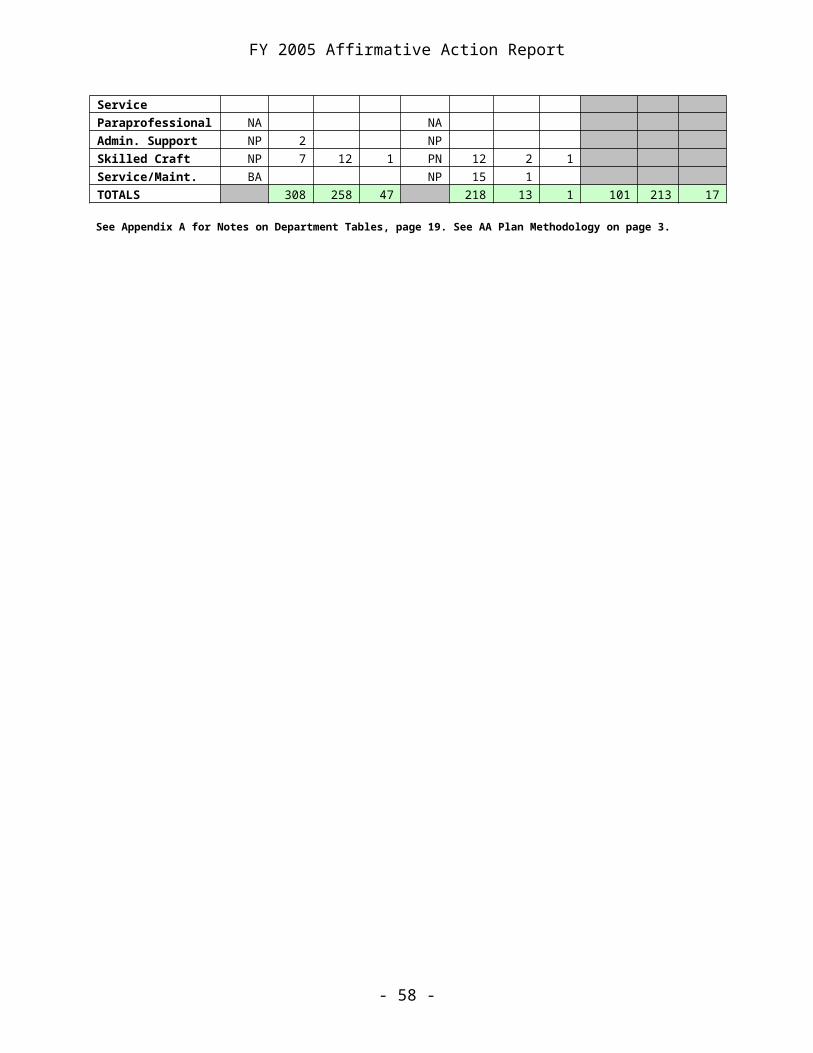
FY 2005 Affirmative Action Report
Public Television
FY ‘05 Workforce Changes EOFY 2004 FY 2005 FY 2005 EOFY 2005 Workforce Terminations All Hires Workforce
T F Mn D T F Mn D T F Mn D T F Mn DOfficial /Admin 16 12 1 16 12 Professional 49 16 1 6 2 4 44 13 1 Technical 35 6 35 6 Protective Service Paraprofessional 6 5 6 5 Admin. Support 10 8 1 1 1 9 7 1 Skilled Craft Service/Maint. TOTALS 116 47 2 5 7 3 0 1 5 0 0 0 110 43 2 4
FY ‘05 Goals & Achievements Threshold BOFY 05 FY 2005 EOFY 05EEO Code Label Total UU Hire Goal* Net Change F Mn D F Mn D F Mn D F Mn DOfficial /Admin BA BA Professional ST BA 3 1 0 Technical NP BA 2 0 Protective Service NA NA Paraprofessional BA BA Admin. Support BA BA Skilled Craft NA NA Service/Maint. NA NA TOTALS 5 0 7 1 0 1 0 0 -1
FY ‘06 Affirmative Action Goals BOFY
Female MinorityPersons
w/DisabilitiesEEO Code Total Proj. Hire Total Proj. Hire Total Proj. Hire Label UU Hires Goal Label UU Hires Goal UU Hire GoalsOfficial /Admin. BA BA Professional NP 1 BA Technical PN 1 1 1 PN 2 1 1 Protective Service NA NA Paraprofessional NA NA Admin. Support BA BA Skilled Craft NA NA Service/Maint. NA NA TOTALS 2 1 1 2 1 1 7 2 1
See Appendix A for Notes on Department Tables, page 19. See AA Plan Methodology on page 3.
- 58 -
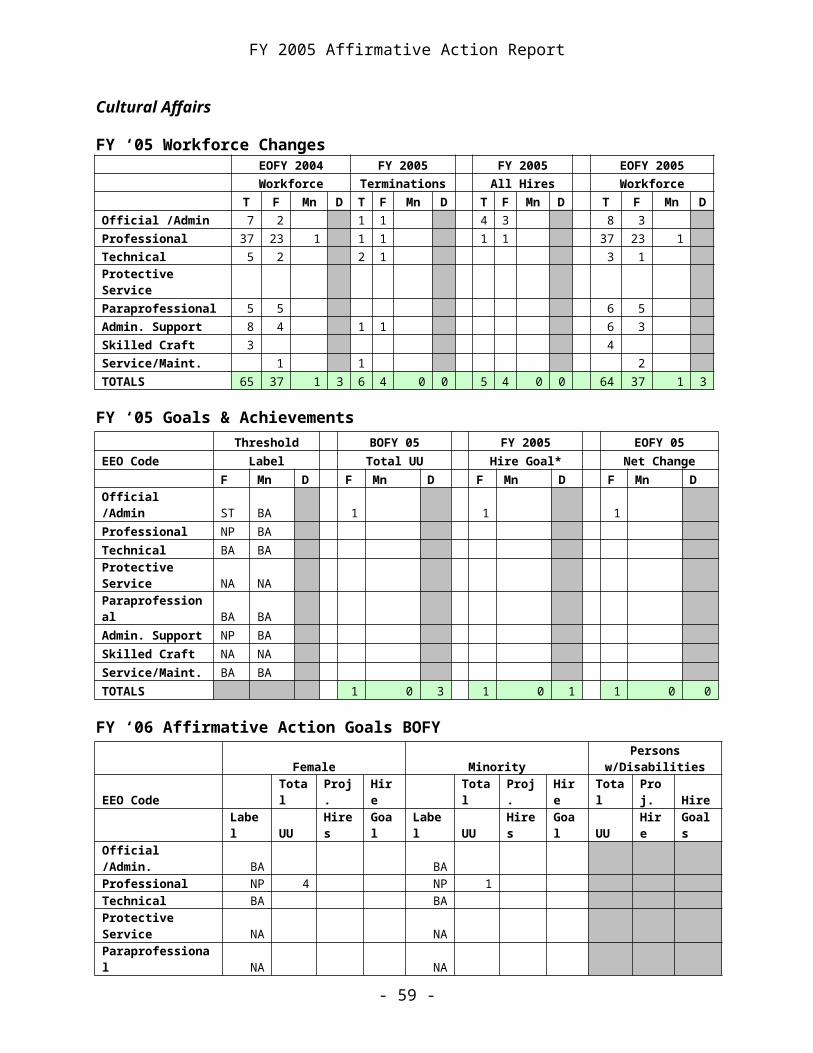
FY 2005 Affirmative Action Report
Revenue
FY ‘05 Workforce Changes EOFY 2004 FY 2005 FY 2005 EOFY 2005 Workforce Terminations All Hires Workforce
T FMn D T F
Mn D T F
Mn D T F
Mn D
Official /Admin 52 18 2 1 1 6 2 1 43 15 1
Professional 29
112
0 16 12 3 3
40
20 3
233
112 15
Technical 13 11 1 1 5 5 Protective Service Paraprofessional 3 3 1 6 5 7 6 1 Admin. Support
106 94 8 4
10 8 81 74 5
Skilled Craft Service/Maint. 2 1
TOTALS46
724
6 2648
18 4 4 3
63
36 4 5
369
212 22
42
FY ‘05 Goals & Achievements Threshold BOFY 05 FY 2005 EOFY 05EEO Code Label Total UU Hire Goal* Net Change F Mn D F Mn D F Mn D F Mn DOfficial /Admin PN NP 5 1 2 1 1 Professional PN BA 10 7 10 Technical BA BA Protective Service NA NA Paraprofessional BA BA Admin. Support BA BA Skilled Craft NA NA Service/Maint. BA BA TOTALS 15 1 0 9 0 0 11 1 0
FY ‘06 Affirmative Action Goals BOFY
Female MinorityPersons
w/DisabilitiesEEO Code Total Proj. Hire Total Proj. Hire Total Proj. Hire Label UU Hires Goal Label UU Hires Goal UU Hire GoalsOfficial /Admin. PN 5 4 2 NP 1 Professional PN 10 12 7 BA Technical BA BA Protective Service NA NA Paraprofessional NA NA Admin. Support BA BA Skilled Craft NA NA Service/Maint. BA BA TOTALS 15 16 9 1 0 0 0 0 0
See Appendix A for Notes on Department Tables, page 19. See AA Plan Methodology on page 3.
- 59 -
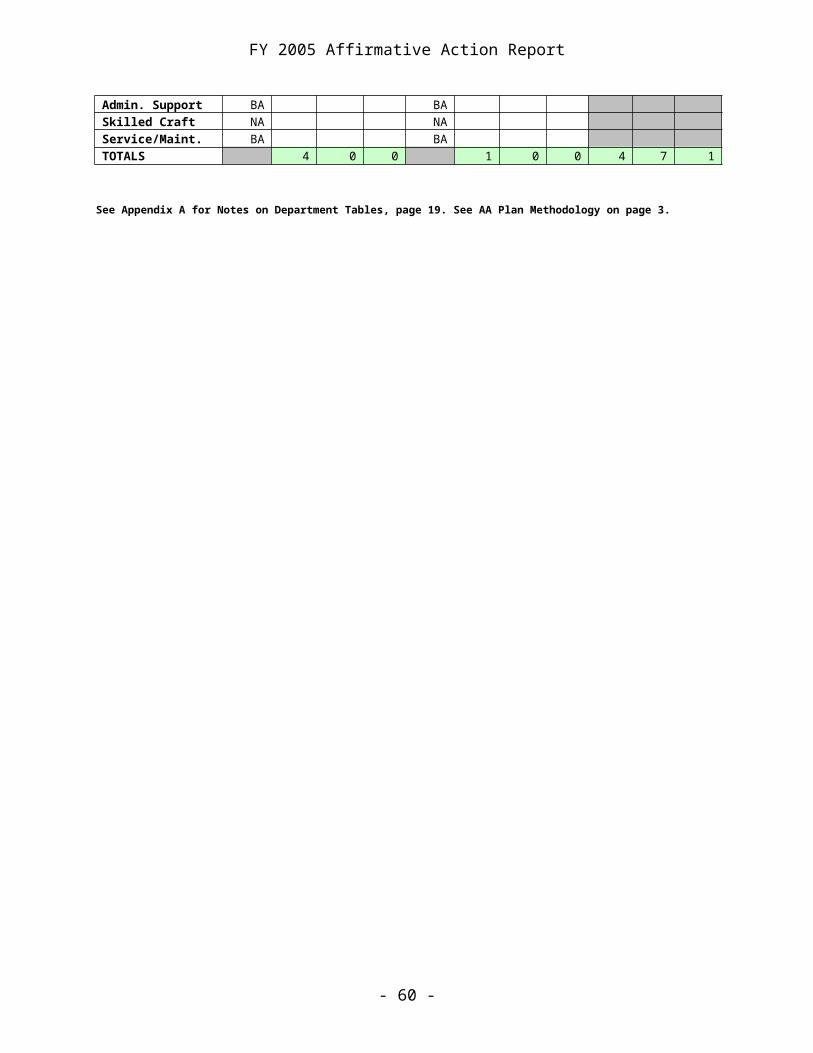
FY 2005 Affirmative Action Report
Secretary of State
FY ‘05 Workforce Changes EOFY 2004 FY 2005 FY 2005 EOFY 2005 Workforce Terminations All Hires Workforce
T F Mn D T F Mn D T F Mn D T F Mn DOfficial /Admin 10 5 1 1 3 1 9 4 1 Professional 6 4 2 1 10 7 Technical 1 1 Protective Service Paraprofessional 6 6 6 6 Admin. Support 12 11 2 1 1 12 12 2 Skilled Craft Service/Maint. TOTALS 35 27 3 0 1 0 0 0 6 3 0 0 37 29 3 0
FY ‘05 Goals & Achievements Threshold BOFY 05 FY 2005 EOFY 05EEO Code Label Total UU Hire Goal* Net Change F Mn D F Mn D F Mn D F Mn DOfficial /Admin BA BA Professional BA BA Technical BA BA Protective Service NA NA Paraprofessional BA BA Admin. Support BA BA Skilled Craft NA NA Service/Maint. BA NA TOTALS 0 0 3 0 0 1 0 0 0
FY ‘06 Affirmative Action Goals BOFY
Female MinorityPersons
w/DisabilitiesEEO Code Total Proj. Hire Total Proj. Hire Total Proj. Hire Label UU Hires Goal Label UU Hires Goal UU Hire GoalsOfficial /Admin. BA BA Professional BA BA Technical BA BA Protective Service NA NA Paraprofessional NA NA Admin. Support BA BA Skilled Craft NA NA Service/Maint. NA NA TOTALS 0 0 0 0 0 0 3 5 1
See Appendix A for Notes on Department Tables, page 19. See AA Plan Methodology on page 3.
- 60 -
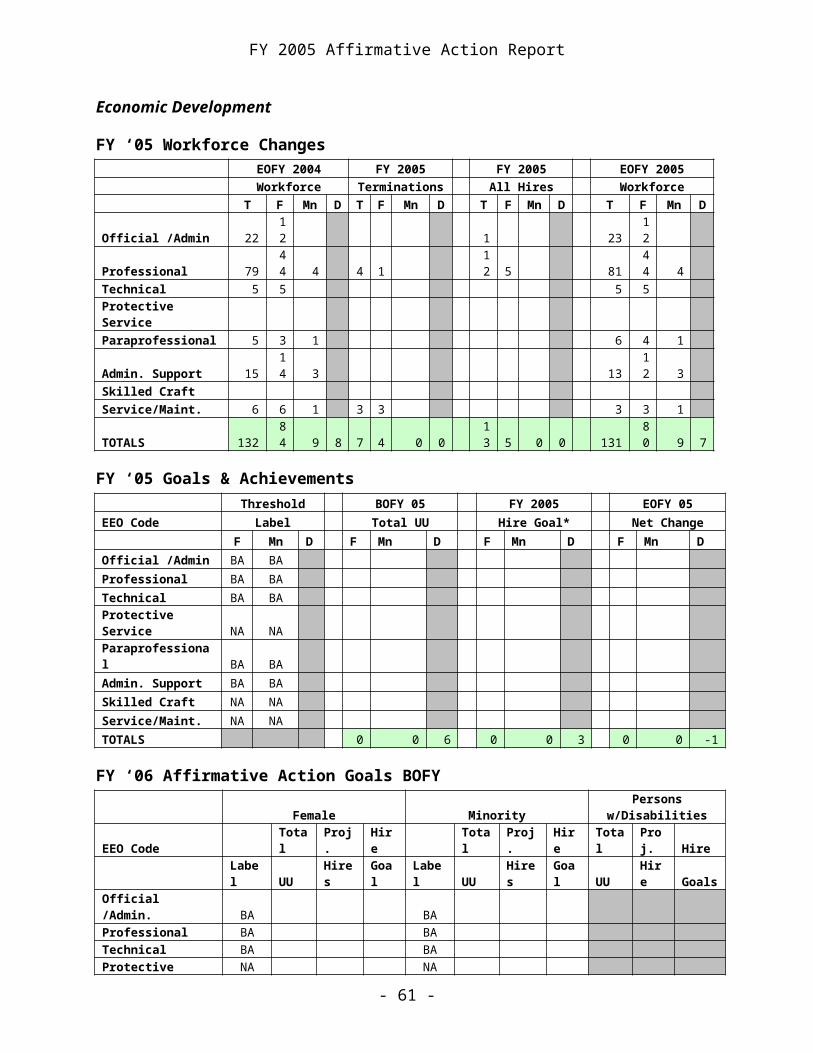
FY 2005 Affirmative Action Report
Transportation
FY ‘05 Workforce Changes EOFY 2004 FY 2005 FY 2005 EOFY 2005 Workforce Terminations All Hires Workforce
T F Mn D T FMn D T F
Mn D T F Mn D
Official /Admin 141 52 2 8 1 132 52 2
Professional 61318
8 31 22 7 19 5 60718
4 28
Technical 64714
4 24 33 2 7 1 63114
5 22 Protective Service 120 9 5 9 1 9 120 8 5 Paraprofessional 28 22 2 31 24 2
Admin. Support 34131
3 18 2524 35
30 1 338
307 17
Skilled Craft 122
6 41 60 52 2 46 2 1 121
5 41 59 Service/Maint. 40 13 3 2 2 5 1 37 12 2
TOTALS315
678
214
526
615
139 0
13
121
39 2
13
3111
773
137
257
FY ‘05 Goals & Achievements Threshold BOFY 05 FY 2005 EOFY 05EEO Code Label Total UU Hire Goal* Net Change F Mn D F Mn D F Mn D F Mn DOfficial /Admin BA BA Professional BA BA Technical BA BA Protective Service NA NA Paraprofessional BA BA Admin. Support BA BA Skilled Craft NA NA Service/Maint. BA NA TOTALS 0 0 3 0 0 1 0 0 0
FY ‘06 Affirmative Action Goals BOFY
Female MinorityPersons
w/DisabilitiesEEO Code Total Proj. Hire Total Proj. Hire Total Proj. Hire
Label UU Hires Goal Label UU Hires Goal UU HireGoals
Official /Admin. PN 15 6 NP 2 Professional PN 3 20 1 NP 7 Technical PN 87 38 1 PN 9 38 1 Protective Service ST 9 8 1 BA Paraprofessional NA NA Admin. Support BA 2 NP Skilled Craft PN 4 38 NP 1 Service/Maint. PN 3 6 3 NP 1 TOTALS 123 116 6 20 38 1 39 143 2
- 61 -
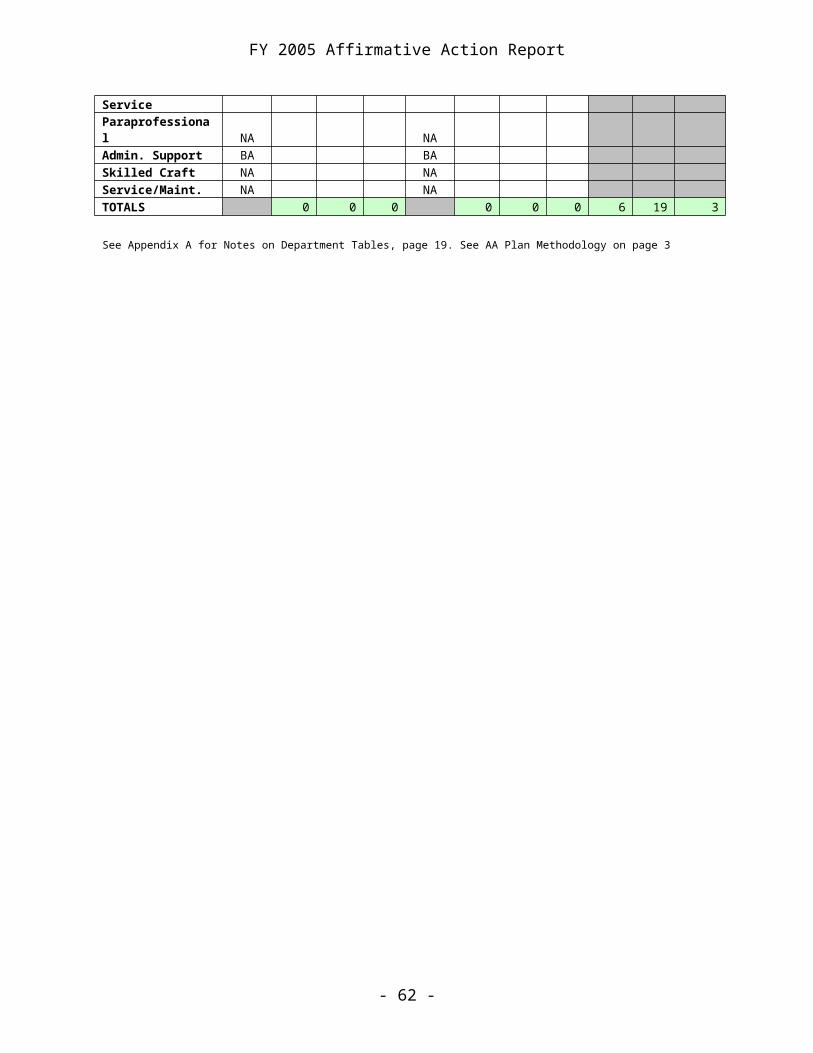
FY 2005 Affirmative Action Report
See Appendix A for Notes on Department Tables, page 19. See AA Plan Methodology on page 3.
- 62 -
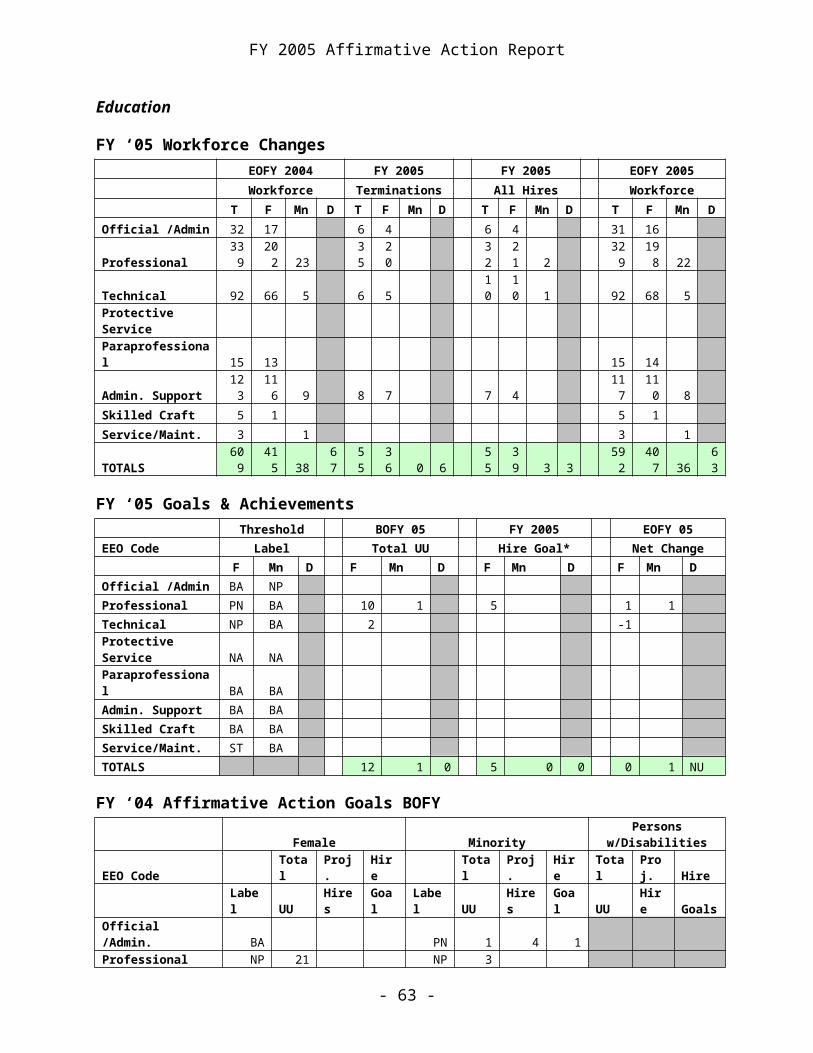
FY 2005 Affirmative Action Report
Treasurer
FY ‘05 Workforce Changes EOFY 2004 FY 2005 FY 2005 EOFY 2005 Workforce Terminations All Hires Workforce
T F Mn D T F Mn D T F Mn D T F Mn DOfficial /Admin 7 4 2 1 5 3
Professional 11 7 5 5 4 2 12 10
Technical 1 1 1 1 3 2 Protective Service Paraprofessional 2 2 1 1 2 2 Admin. Support 3 3 2 2 Skilled Craft Service/Maint.
TOTALS24 17 0 1 6 6 0 0 7 4 0 1 24 19 0 0
FY ‘05 Goals & Achievements Threshold BOFY 05 FY 2005 EOFY 05EEO Code Label Total UU Hire Goal* Net Change F Mn D F Mn D F Mn D F Mn DOfficial /Admin NA NA Professional NA NA Technical NA NA Protective Service NA NA Paraprofessional NA NA Admin. Support NA NA Skilled Craft NA NA Service/Maint. NA NA TOTALS 0 0 0 0 0 0 0 0 0
FY ‘06 Affirmative Action Goals BOFY
Female MinorityPersons
w/DisabilitiesEEO Code Total Proj. Hire Total Proj. Hire Total Proj. Hire
Label UU Hires Goal Label UU Hires Goal UU HireGoals
Official /Admin. NA NA Professional NA NA Technical NA NA Protective Service NA NA Paraprofessional NA NA Admin. Support NA NA Skilled Craft NA NA Service/Maint. NA NA TOTALS 0 0 0 0 0 0 0 0 0
See Appendix A for Notes on Department Tables, page 19. See AA Plan Methodology on page 3.
- 63 -
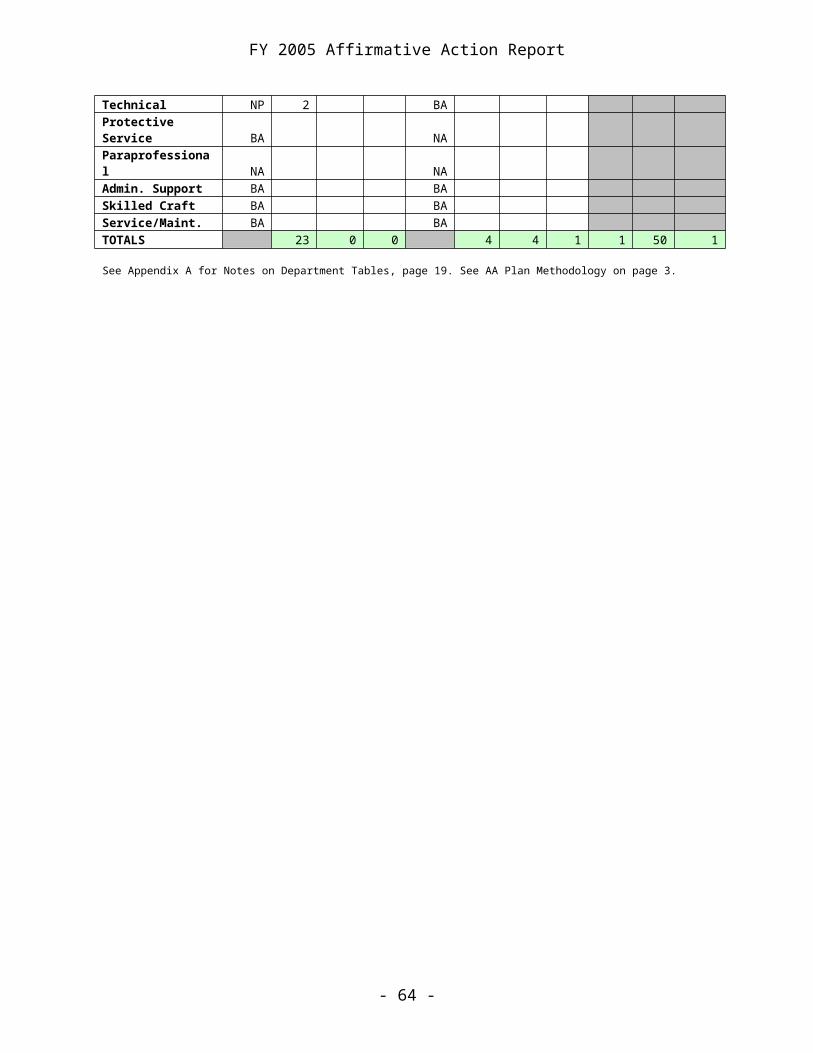
FY 2005 Affirmative Action Report
Veterans Affairs
FY ‘05 Workforce Changes EOFY 2004 FY 2005 FY 2005 EOFY 2005 Workforce Terminations All Hires Workforce
T F Mn D T F Mn D T F Mn D T F Mn DOfficial /Admin 20 8 2 1 6 3 23 10
Professional 17
8 145 5 13 9 33 28 189 154 4 Technical 93 86 2 15 14 14 13 2 84 77 2 Protective Service 5 1 5
Paraprofessional 27
4 249 15 35 34 50 47 2 284 257 12 Admin. Support 67 61 1 4 4 7 7 65 59 1 Skilled Craft 25 1 1 24 1
Service/Maint. 10
7 78 7 11 8 11 6 105 76 5
TOTALS76
9 628 30 37 81 70 0 6 122 104 4 5 779 634 24 43
FY ‘05 Goals & Achievements Threshold BOFY 05 FY 2005 EOFY 05EEO Code Label Total UU Hire Goal* Net Change F Mn D F Mn D F Mn D F Mn D
Official /Admin BA BA 1 1
Professional BA NP 1
Technical BA BA
Protective Service BA BA
Paraprofessional BA BA
Admin. Support BA NP
Skilled Craft BA BA
Service/Maint. BA BA
TOTALS 1 1 40 0 0 12 1 0 -1
FY ‘06 Affirmative Action Goals BOFY
Female MinorityPersons
w/DisabilitiesEEO Code Total Proj. Hire Total Proj. Hire Total Proj. Hire Label UU Hires Goal Label UU Hires Goal UU Hire GoalsOfficial /Admin. BA BA Professional BA NP 1 Technical BA NP Protective Service BA BA Paraprofessional NA NA Admin. Support BA NP 1 Skilled Craft BA BA Service/Maint. BA BA
- 64 -

FY 2005 Affirmative Action Report
TOTALS 0 0 0 2 0 0 40 95 12
See Appendix A for Notes on Department Tables, page 19. See AA Plan Methodology on page 3.
- 65 -

FY 2005 Affirmative Action Report
Workforce Development
FY ‘05 Workforce Changes EOFY 2004 FY 2005 FY 2005 EOFY 2005 Workforce Terminations All Hires Workforce
T F Mn D T F Mn D T F Mn D T F Mn DOfficial /Admin 47 30 3 9 3 2 7 2 45 29 5
Professional 55
6 319 71 26 13 3 3619
531 306 67
Technical 75 61 17 2 1 7 5 69 56 17 Protective Service Paraprofessional 15 14 1 3 3 2 2 16 16 Admin. Support 87 82 14 17 14 2 5 4 90 84 15 Skilled Craft Service/Maint. 3 2 2 1
TOTALS78
3 508 10657 57 34 7 1 57
32 0 13
753 492
104 117
FY ‘05 Goals & Achievements Threshold BOFY 05 FY 2005 EOFY 05EEO Code Label Total UU Hire Goal* Net Change F Mn D F Mn D F Mn D F Mn DOfficial /Admin BA BA Professional NP BA 9 0 Technical NP BA 1 0 Protective Service NA NA Paraprofessional BA BA Admin. Support BA BA Skilled Craft NA NA Service/Maint. NA BA TOTALS 10 0 0 0 0 0 0 0 0
FY ‘06 Affirmative Action Goals BOFY
Female MinorityPersons
w/DisabilitiesEEO Code Bal. Total Proj. Hire Bal. Total Proj. Hire Total Proj. Hire
Year UU Hires Goal Year UU Hires Goal UU HireGoals
Official /Admin. BA BA Professional NP 24 BA Technical BA BA Protective Service NA NA Paraprofessional NA NA Admin. Support BA NP 1 Skilled Craft NA NA Service/Maint. BA BA TOTALS 24 0 0 1 0 0 0 0 0
See Appendix A for Notes on Department Tables, page 19. See AA Plan Methodology on page 3.
- 66 -
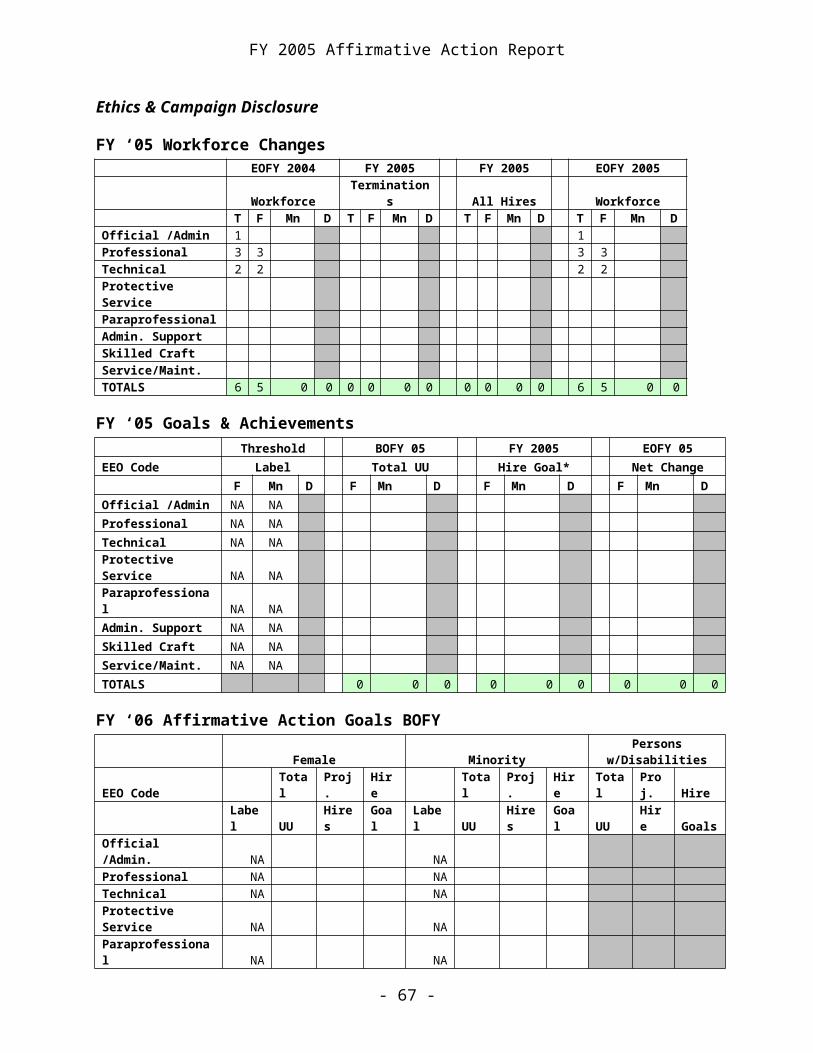
FY 2005 Affirmative Action Report
B. WORKFORCE COMPOSITION
TOTAL FULL-TIME WORKFORCE
June '05 June '04 Net Change
State GovernmentWorkforce %
2000 Census
Iowa Labor Force
AvailabilityJune '05 June '04
Male 9,620 9,672 -52 50.12% 50.38% 52.60%Female 9,575 9,526 49 49.88% 49.62% 47.40%Non-Minority 18,277 18,222 55 95.22% 94.92% 94.00%Minority 968 976 -8 5.04% 5.08% 6.03%W/Disability 1,328 1,348 -20 6.92% 7.02% 11.80%W/O Disability 15,533 15,490 43 80.92% 80.69% 88.20%Unk/Disability 2,334 2,360 -26 12.16% 12.29% UnkTOTALS 19,195 19,198 -3 1. OFFICIAL/ADMINISTRATOR
June '05 June '04 Net Change
State GovernmentWorkforce %
2000 Census
Iowa Labor Force
AvailabilityJune '05 June '04
Male 631 633 -2 56.39% 57.44% 65.30%Female 488 469 19 43.61% 42.56% 33.60%Non-Minority 1,084 1069 15 96.87% 97.01% 97.30%Minority 35 33 2 3.13% 2.99% 2.67%TOTALS 1,119 1102 17 2. PROFESSIONAL
June '05 June '04 Net Change
State GovernmentWorkforce %
2000 Census
Iowa Labor Force
AvailabilityJune '05 June '04Male 3,003 3,010 -7 45.31% 45.85% 41.80%Female 3,624 3,555 69 54.69% 54.15% 58.20%Non-Minority 6,236 6,175 61 94.10% 94.06% 94.70%Minority 391 390 1 5.90% 5.94% 5.27%TOTALS 6,627 6,565 62
- 67 -
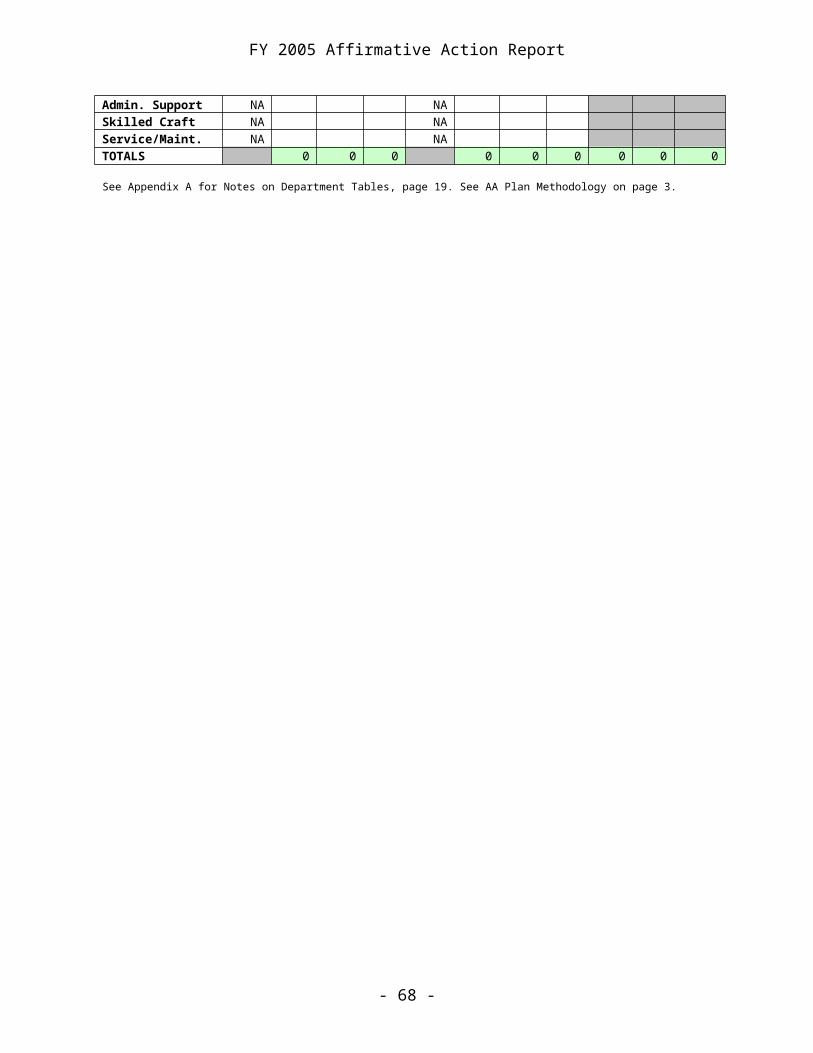
FY 2005 Affirmative Action Report
3. TECHNICIAN
June '05 June '04 Net Change
State GovernmentWorkforce %
2000 Census
Iowa Labor Force
AvailabilityJune '05 June '04Male 856 877 -21 40.13% 40.92% 36.30%Female 1,277 1,266 11 59.87% 59.08% 63.60%Non-Minority 2,031 2,047 -16 95.22% 95.52% 95.40%Minority 102 96 6 4.78% 4.48% 4.61%TOTALS 2,133 2,143 -10 4. PROTECTIVE SERVICE
June '05 June '04 Net Change
State GovernmentWorkforce %
2000 Census
Iowa Labor Force
AvailabilityJune '05 June '04Male 2,459 2,470 -11 85.50% 85.11% 83.00%Female 417 432 -15 14.50% 14.89% 16.90%Non-Minority 2,746 2,764 -18 95.48% 95.24% 93.90%Minority 130 138 -8 4.52% 4.76% 6.12%TOTALS 2,876 2,902 -26 5. PARAPROFESSIONAL
June '05 June '04 Net Change
State GovernmentWorkforce %
1990 Census
Data Only Available for
this CategoryJune '05 June '04
Male 470 488 -18 25.05% 26.57% 7.20%Female 1,406 1,389 17 74.95% 75.61% 92.80%Non-Minority 1,812 1,770 42 96.59% 96.35% 95.80%Minority 64 67 -3 3.41% 3.65% 4.20%TOTALS 1,876 1,837 39
6. ADMINISTRATIVE SUPPORT
June '05 June '04 Net Change
State GovernmentWorkforce %
2000 Census
Iowa Labor Force
AvailabilityJune '05 June '04Male 167 167 0 7.81% 7.64% 30.10%Female 1,972 2,018 -46 92.19% 92.36% 69.90%Non-Minority 2,003 2,048 -45 93.64% 93.73% 95.30%Minority 136 137 -1 6.36% 6.27% 4.73%TOTALS 2,139 2,185 -46
- 68 -
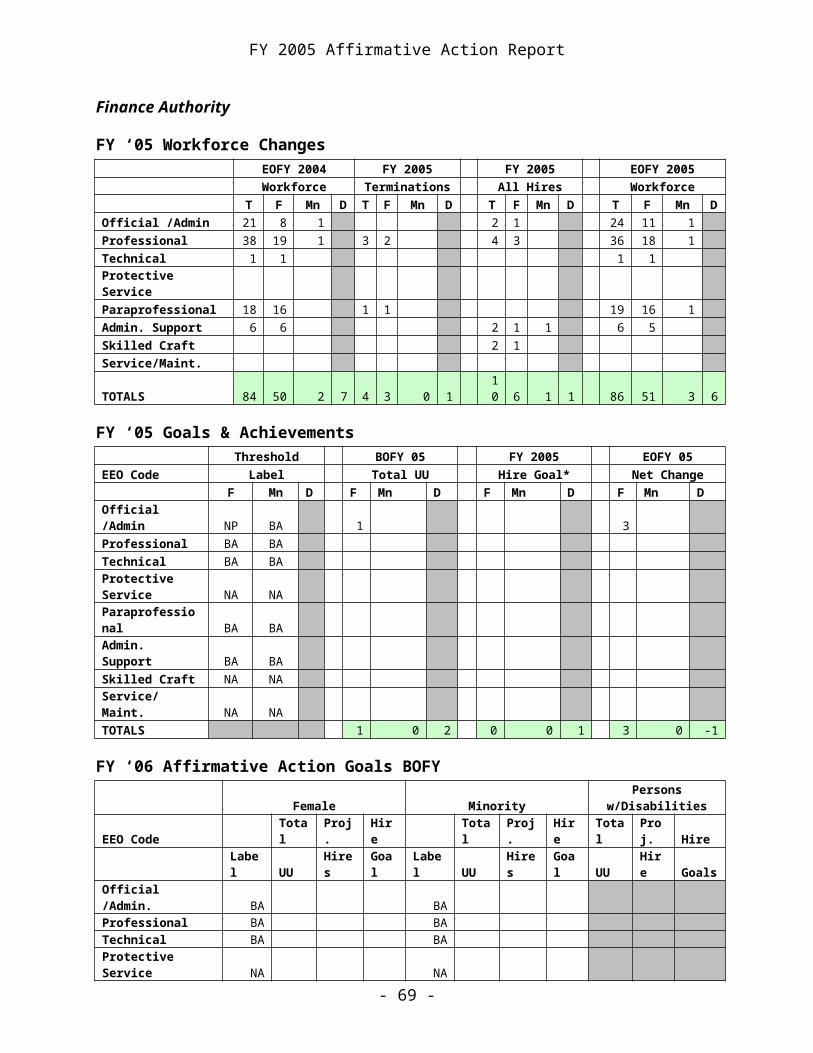
FY 2005 Affirmative Action Report
June '05 June '04 Net Change
State GovernmentWorkforce %
2000 Census
Iowa Labor Force
AvailabilityJune '05 June '04Male 1,586 1,604 -76 96.35% 96.51% 92.50%Female 60 58 2 3.65% 3.49% 7.50%Non-Minority 1,577 1,592 -15 95.81% 95.79% 95.90%Minority 69 70 -1 4.19% 4.21% 4.11%TOTALS 1,646 1,662 -16 8. SERVICE MAINTENANCE
June '05 June '04 Net Change
State GovernmentWorkforce %
2000 Census
Iowa Labor Force
AvailabilityJune '05 June '04Male 448 463 -354 57.51% 57.73% 57.00%Female 331 339 -8 42.49% 42.27% 43.00%Non-Minority 735 757 -22 94.35% 94.39% 90.60%Minority 44 45 -1 5.65% 5.61% 9.43%TOTALS 779 802 -23
a. Payroll Query, Executive Branch Full-time Workforce Composition (pay periods ending 6-17-04 and 6-30-2005). Does not include Fair Authority, Regents, Governor's Office, and Elected Officials, Alliance on Substance Abuse or Board Members and Commissioners.
b. State Government Workforce % identifies the percentage of each employee group compared to all groups within each EEO `. For example, of all employees in the Professional category in 2005, 5.9% were racial/ethnic minority.
c. Census 2000 EEO Tool, www.census.gov/eeo2000/ d. Census 2000 Summary File 3, employed person with disabilities age 16-64
- 69 -
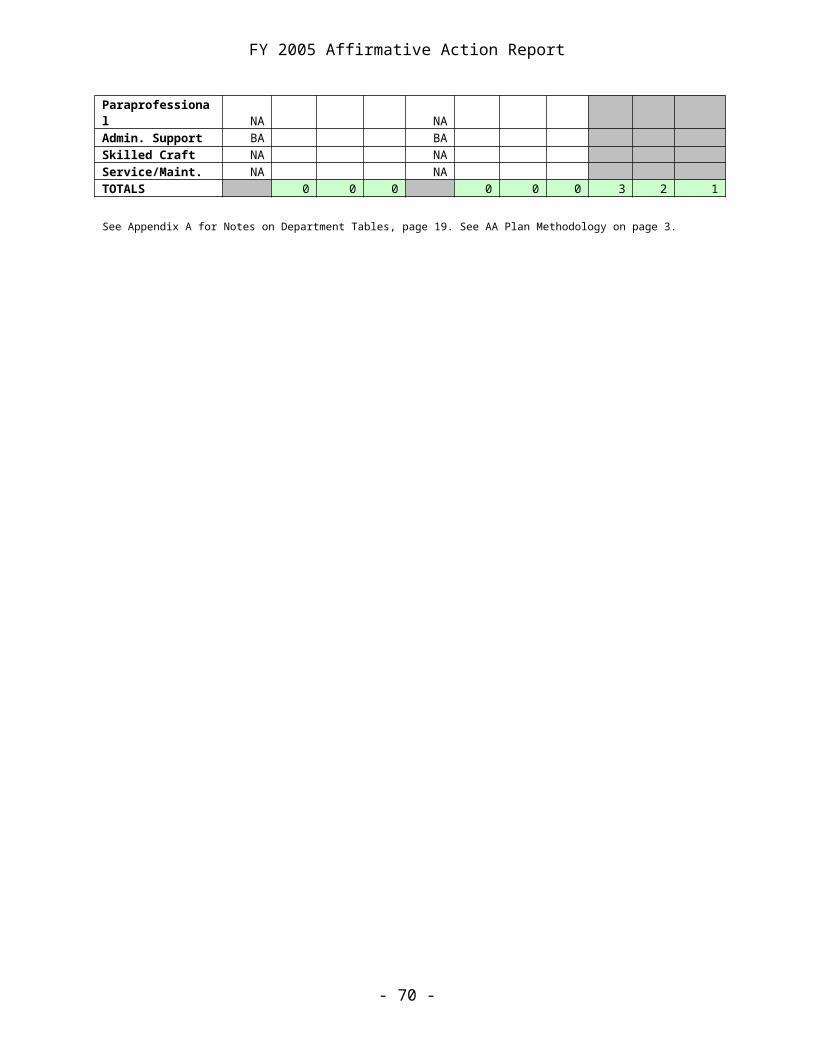
FY 2005 Affirmative Action Report
C. WORKFORCE COMPOSITION OVER 10 YEARS
TOTAL FULL-TIME WORKFORCE
June '05 June '9510 Year
Net Change
State Government
2000 Census
Iowa Labor Force
Availability Workforce % June '05 June '95Male 9,620 9,369 251 50.12% 50.91% 52.60%Female 9,575 9,035 540 49.88% 49.09% 47.40%Non-Minority 18,277 17,395 882 95.22% 94.52% 94.00%Minority 968 974 -6 5.04% 5.29% 6.03%W/Disability 1,328 980 348 6.92% 5.32% 11.80%W/O Disability 15,533 17,424 -1,891 80.92% 94.68% 88.20%Unk/Disability 2,334 2,334 12.16% 0.00% UnkTOTALS 19,195 18,404 791 1. OFFICIAL/ADMINISTRATOR
June '05 June '9510 Year
Net Change
State Government
2000 Census
Iowa Labor Force
Availability Workforce % June '05 June '95Male 631 548 83 56.39% 65.63% 65.30%Female 488 287 201 43.61% 34.37% 33.60%Non-Minority 1,084 815 269 96.87% 97.60% 97.30%Minority 35 20 15 3.13% 2.40% 2.67%TOTALS 1,119 835 284 2. PROFESSIONAL
June '05 June '9510 Year
Net Change
State Government
2000 Census
Iowa Labor Force
Availability Workforce % June '05 June '95Male 3,003 2,854 149 45.31% 49.87% 41.80%Female 3,624 2,864 760 54.69% 50.04% 58.20%Non-Minority 6,236 5,378 858 94.10% 93.97% 94.70%Minority 391 345 46 5.90% 6.03% 5.27%TOTALS 6,627 5,723 904
- 70 -
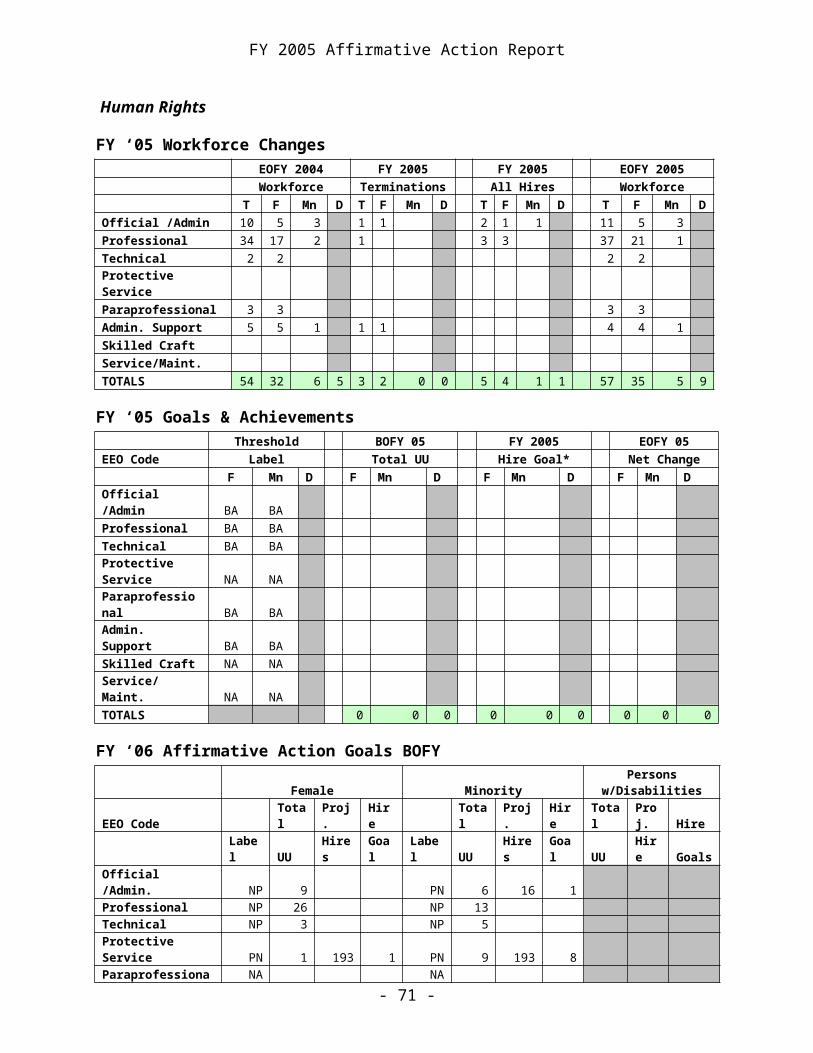
FY 2005 Affirmative Action Report
3. TECHNICIAN
June '05 June '95
10 YearNet Change
State GovernmentWorkforce %
2000 Census
Iowa Labor Force
AvailabilityJune '05 June '95Male 856 1,145 -289 40.13% 47.18% 36.30%Female 1,277 1,282 -5 59.87% 52.82% 63.60%Non-Minority 2,031 2,317 -286 95.22% 95.47% 95.40%Minority 102 110 -8 4.78% 4.53% 4.61%TOTALS 2,133 2,427 -294 4. PROTECTIVE SERVICE
June '05 June '95
10 YearNet Change
State GovernmentWorkforce %
2000 Census
Iowa Labor Force
AvailabilityJune '05 June '95Male 2,459 2,005 454 85.50% 87.17% 83.00%Female 417 295 122 14.50% 12.83% 16.90%Non-Minority 2,746 2,200 546 95.48% 95.65% 93.90%Minority 130 100 30 4.52% 4.35% 6.12%TOTALS 2,876 2,300 576 5. PARAPROFESSIONAL
June '05 June '95
10 YearNet Change
State GovernmentWorkforce %
1990 Census
Data Only Available for this
CategoryJune '05 June '95Male 470 508 -38 25.05% 26.82% 7.20%Female 1,406 1,386 20 74.95% 73.18% 92.80%Non-Minority 1,812 1,826 -14 96.59% 96.41% 95.80%Minority 64 68 -4 3.41% 3.59% 4.20%TOTALS 1,876 1,894 -18 6. ADMINISTRATIVE SUPPORT
June '05 June '95
10 YearNet Change
State GovernmentWorkforce %
2000 Census
Iowa Labor Force
AvailabilityJune '05 June '95Male 167 211 -44 7.81% 7.73% 30.10%Female 1,972 2,517 -545 92.19% 92.27% 69.90%Non-Minority 2,003 2,520 -517 93.64% 92.38% 95.30%Minority 136 208 -72 6.36% 7.62% 4.73%TOTALS 2,139 2,728 -589
- 71 -
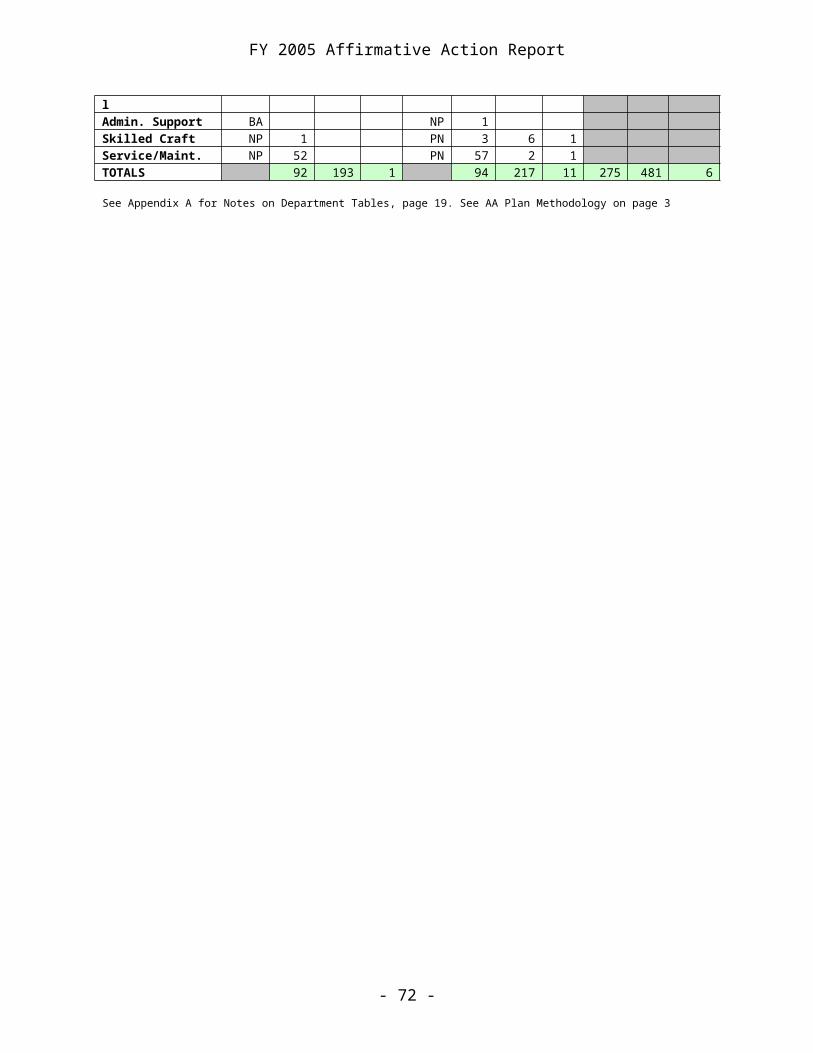
FY 2005 Affirmative Action Report
7. SKILLED CRAFT
June '05 June '95
10 YearNet Change
State GovernmentWorkforce %
2000 Census
Iowa Labor Force
AvailabilityJune '05 June '95Male 1,586 1,684 -178 96.35% 95.46% 92.50%Female 60 81 -21 3.65% 4.59% 7.50%Non-Minority 1,577 1,693 -116 95.81% 95.98% 95.90%Minority 69 72 -3 4.19% 4.08% 4.11%TOTALS 1,646 1,764 -118 8. SERVICE MAINTENANCE
June '05 June '95
10 YearNet Change
State GovernmentWorkforce %
2000 Census
Iowa Labor Force
AvailabilityJune '05 June '95Male 448 414 -284 57.51% 56.56% 57.00%Female 331 318 13 42.49% 43.44% 43.00%Non-Minority 735 681 54 94.35% 93.03% 90.60%Minority 44 51 -7 5.65% 6.97% 9.43%TOTALS 779 732 47
a. Payroll Query, Executive Branch Full-time Workforce Composition (pay period 6-30-05) and Affirmative Action in Iowa, Iowa Department of Personnel, September 1995. Does not include Fair Authority, Regents, Governor's Office, and Elected Officials, Alliance on Substance Abuse or Board Members and Commissioners.
b. State Government Workforce % identifies the percentage of each employee group compared to all groups within each EEO `. For example, of all employees in the Professional category in 2005, 5.9% were racial/ethnic minority.
c. Census 2000 EEO Tool, www.census.gov/eeo2000/ d. Census 2000 Summary File 3, employed person with disabilities age 16-64
- 72 -
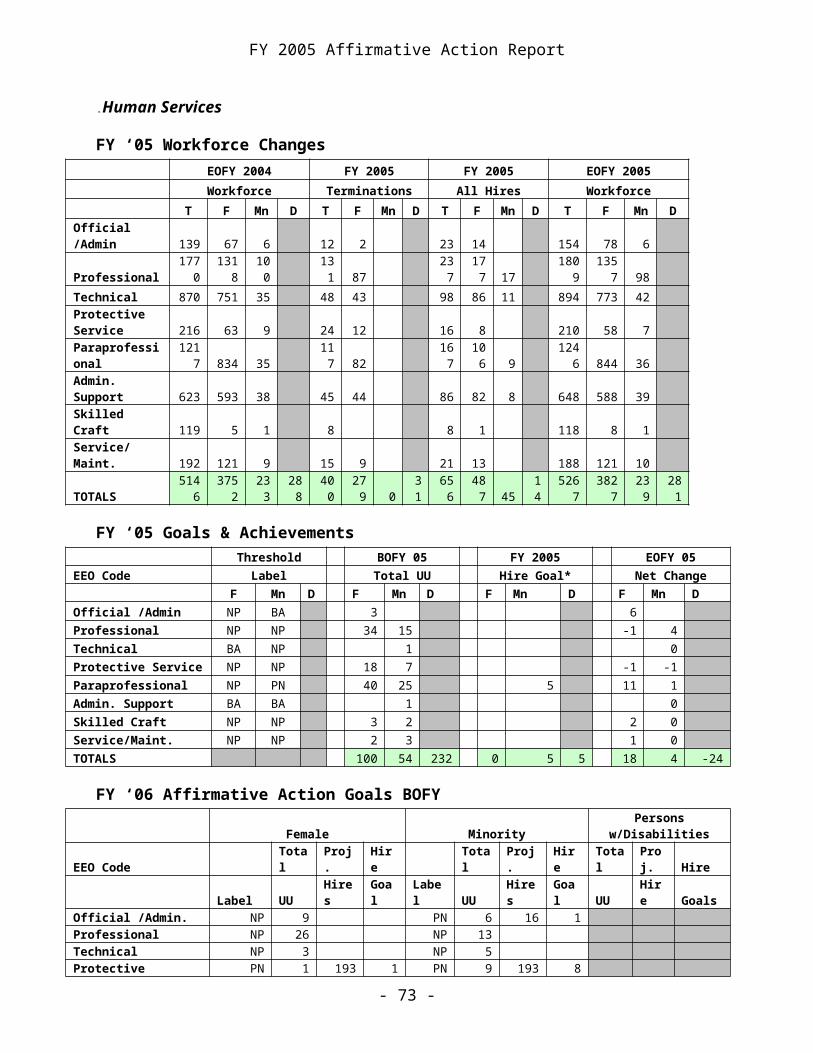
FY 2005 Affirmative Action Report
D. MINORITY 5-YEAR NET CHANGE BY DEPARTMENT
TITLEFY '00 TOTAL WHITE
AFRICAN/AM
ASIAN/PACIFIC
ISL
NATIVE AM/
ALASKAN NTV LATINO
TOTAL MIN
*NET 5-YR
CHANGEAdmin Services** 515 -140 -8 2 -2 -2 -10 -152Agriculture 436 -57 -1 -1 0 0 -2 -59Auditor 128 -16 0 0 0 0 0 -16Blind 99 1 -1 1 0 0 0 0Civil Rights 32 -5 -6 0 0 0 -6 -9Commerce-Alc Bev 24 26 0 0 0 1 1 27Commerce-Banking 78 -15 -1 0 0 0 -1 -16Commerce-CU 16 0 0 0 0 0 0 0Commerce-Insurance 81 0 1 1 0 1 3 3Commerce-Prof Lic 11 -1 0 0 0 0 0 -1Commerce-Utilities 63 2 0 1 0 1 2 5Commerce*** 16 -15 0 0 0 -1 -1 -16Corrections 3,069 -177 -12 5 1 -6 -12 -198Cultural Affairs 85 -16 -1 0 -1 0 -2 -21Transportation 3,569 -440 -6 -8 -3 -3 -20 -457Economic Dev 129 0 2 1 0 1 4 2Education 591 5 -7 1 -1 3 -4 1Elder Affairs 26 4 0 -1 0 0 -1 2Ethics & Cmpgn Disc 8 -2 0 0 0 0 0 -2Human Rights 48 9 1 0 0 -1 0 9Human Services 5,428 -208 -1 -3 -6 11 1 -191Iowa Comm Network 93 19 -1 -1 0 2 0 -3Finance Authority 56 31 -1 0 0 1 0 30Inspections & Appls 468 7 -2 0 2 0 0 20Public Television 135 -22 0 0 0 -1 -1 -25Justice 235 -10 1 -1 0 1 1 -10Law Enf Academy 29 -2 0 0 0 0 0 -2Lottery 108 1 -1 0 0 0 -1 0Management 31 -4 1 0 0 0 1 -4Natural Resources 836 72 -3 7 0 0 4 76Parole 12 -2 0 0 0 0 0 -2PERB 12 -2 0 0 0 0 0 -2Public Defense 276 93 4 3 0 0 7 97Public Health 346 41 1 4 3 2 10 48Public Safety 943 -94 -2 2 -1 -2 -3 -96Revenue 458 -85 -7 0 0 1 -6 -89Secretary of State 40 0 0 0 0 0 0 -1College Student Aid 35 6 0 0 0 0 0 6Treasurer 25 -1 0 0 0 0 0 0Workforce Dev 847 -94 -5 6 -2 3 2 -94TOTAL 20199 -1073 -56 14 -8 13 -37 -1123PERCENT 100.0% -5.3% -0.3% 0.1% 0.0% 0.1% -0.2% -5.6%
* This table does not include non-responses** Administrative Services represents adjusted figures bases on the FY 2000 counts within Personnel, Information Technology, IPERS, General Services.*** Commerce 2000 counts are indistinguishable from its divisions so it was included, even though the core
department no longer exists.
- 73 -

FY 2005 Affirmative Action Report
E. GLOSSARY
AccessibilityAccessibility for persons with disabilities requires a barrier-free environment in which the mobility of physically disabled persons is not inhibited by external barriers such as architectural design. This includes entrances into buildings, elevators, restrooms, water fountains, cafeterias, and conference rooms and office equipment.
Affirmative Action"Action appropriate to overcome the effects of past or present practices, policies, or other barriers to equal employment opportunity (Iowa Code Section 19B.1).
AvailabilityThe availability of minorities or females for a job group means the percentage of minorities or females among persons in the relevant labor area having the requisite qualifications to perform the positions included in the job group. The availability of persons with disabilities means the percentage of persons with disabilities among persons the statewide labor area. The term is broad enough to include any factor that is in fact relevant to determining the availability of individuals for the. Availability figures are used in determining whether underutilization exists, and, where a goal is established, in determining the level of the goal. (Adapted from the Glossary of Equal Opportunity/Affirmative Action Terms, Mary Jane Sinclair, and SPHR. SHRM White Paper.)
Balanced WorkforceA workforce that has women, racial/ethnic minorities and persons with disabilities represented in all job groups and salary ranges at approximately the same rate as their representation in the wider labor force, as reflected by availability.
DisabilityA Disability is a physical or mental impairment, which substantially limits one or more major life activity, a record of having such an impairment, or being perceived as having such impairment.
DiversityDiversity refers to any perceived difference among people. According to Roosevelt Thomas, Executive Director of the Institute for Managing, managing diversity is a complex process for developing an environment that works for all employees. Ann Morrison in New Leaders: Guidelines on Leadership Diversity in America has defined diversity on four levels:
- 74 -
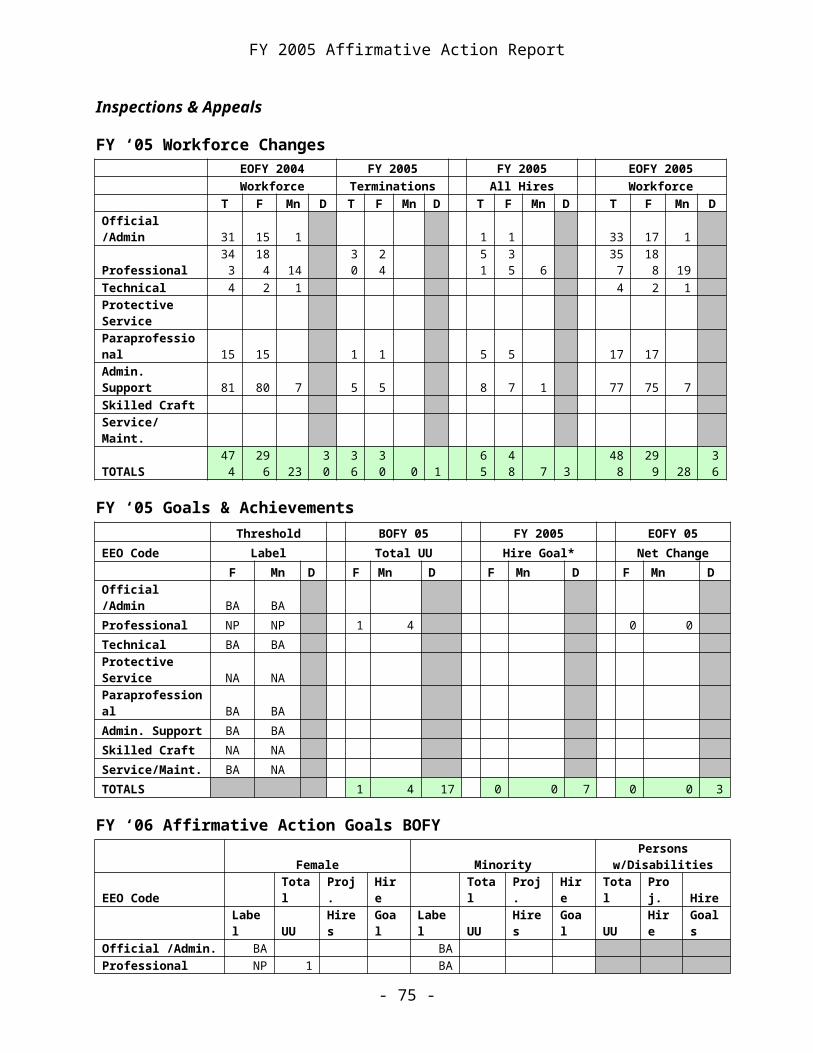
FY 2005 Affirmative Action Report
Diversity as racial/ethnic and gender balance Diversity as understanding of other cultures Diversity as culturally divergent values Diversity as broadly inclusive
The key to an organization initiating diversity as a managerial process is to clarify the organization’s diversity objectives and to incorporate the objectives into its strategic plan.
Equal Employment OpportunityA system of practices that guarantees, by law, the same employment opportunity to all individuals regardless of their gender, creed, race, color, religion, national origin, age or physical or mental disabilities.
GoalAn annual target for the placement of underutilized groups of protected class members in job groups where underutilization exists. Goals are not rigid and inflexible quotas. They must be targets reasonably attainable through good faith effort and must not cause any group of applicants to be excluded from the hiring process.
Manifest ImbalanceManifest imbalance occurs when the representation of protected groups in specific occupational groupings in the workforce is substantially below its representation in the relevant labor market. Numerical Goals can only be used as an affirmative action remedy for those job groupings that are identified as substantially underutilized. See Manifest Imbalance.
Olmstead PlanGovernor’s Executive Order 27 directs state agencies to undertake steps to identify and address barriers to community living for individuals with disabilities and long term illness in Iowa. DAS-HRE was one of the identified state agencies and is participating in the initiative to identify employment barriers in state government for persons with disabilities. The “Olmstead decision” resulted from the U.S. Supreme Court decision, Olmstead v. L.C., 527 U.S. 581 (1999), that interpreted Title II of the ADA to require “States to place qualified individuals with disabilities in community settings, rather than in institutions, whenever treatment professionals determine that such placement is appropriate, the affected persons do not oppose such placement, and the State can reasonably accommodate the placement….”
Preferential and Non-preferentialPreferential (remedial) affirmative action permits numerical hiring goals that consider race and gender as factors in the selection process. It is the most intrusive and, as a result, the most likely basis for affirmative action
- 75 -
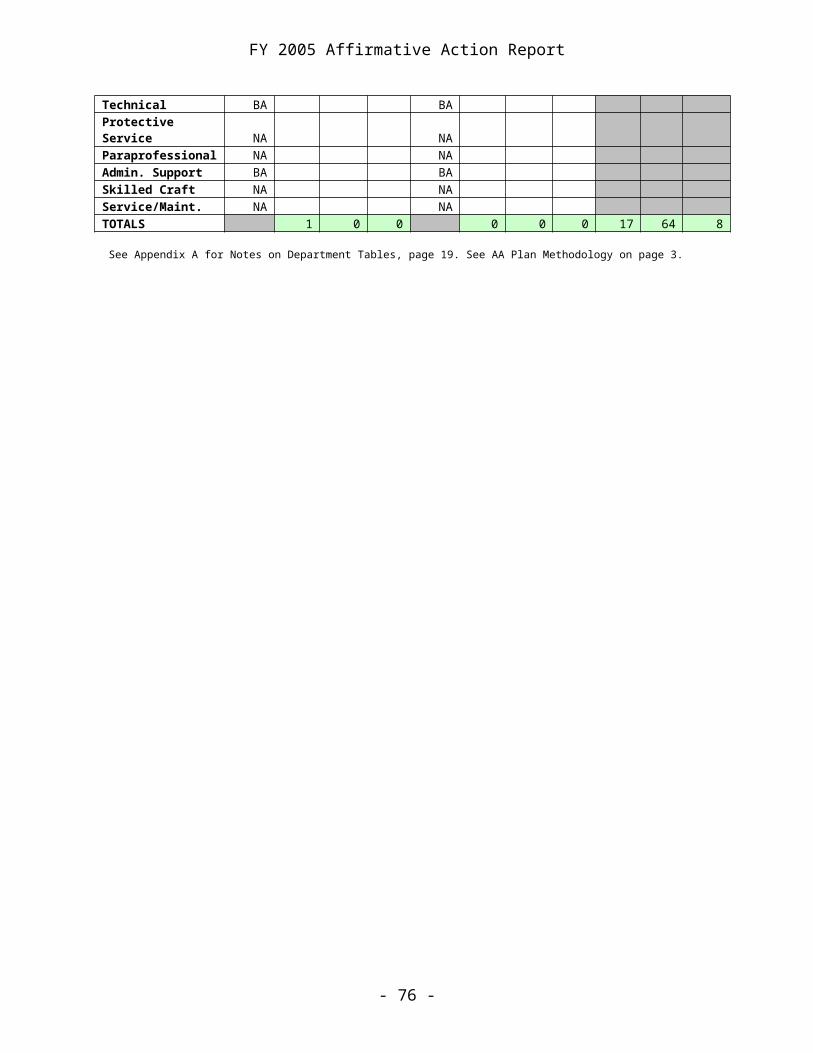
FY 2005 Affirmative Action Report
litigation. Non-preferential (non-remedial) affirmative action results in active efforts by an employer to attack and prevent discrimination by concerted proactive programs, but not by setting numerical goals. Non-preferential goals result in system improvements and are more enduring than isolated affirmative action hires
Protected GroupsAll employees regardless of racial/ethnic, gender, disability status or age groups are regarded as “protected groups” under equal employment opportunity laws. Those groups for which affirmative action remedies or EEO compliance are appropriate are those groups of employees, former employees or applicants who have experienced and/or continue to experience the loss of employment opportunities or benefits due to discriminatory practices or policies of the employer.
Racial/Ethnic CategoriesBlack, (not of Hispanic Origin): A person having origins in any of the Black racial groups of Africa.Hispanic: A person of Mexican, Puerto Rican, Cuban, Central or South American, or other Spanish culture or origin, regardless of race.Asian or Pacific Islander: A person having origins in any of the original people of the Far East, Southeast Asia, the Indian subcontinent, or the Pacific Islands.American Indian or Alaskan Native: A person having origins in any of the original people of North America who maintains cultural identification through tribal affiliation or community recognition.White, Not of Hispanic Origin: A person having origins in any of the original people of Europe, North Africa, or the Middle East. (Source: EEOC Form 164, State and Local Government Information, (EEO-4))
Reasonable AccommodationThe ADA does not define “reasonable accommodation.” Equal EmploymentOpportunity Commission (EEOC) regulations define “reasonable accommodations” as modifications or adjustments to the application process, work environment, or manner or circumstances under which the position held or desired is customarily performed, that enable a qualified individual with a disability to be considered for a desired position, perform the essential functions of a position, or enjoy equal benefits and privileges of employment to other similarly-situated employees without disabilities (29 C.F.R. § 1630.2(o)(1) (1999)). EEOC interpretive guidelines define “reasonable accommodation” as any change in the work environment or in the way things are usually done that results in equal employment opportunities for an individual with a disability (29 C.F.R. Pt. 1630, App. §1630.2(o) (1999)).
- 76 -
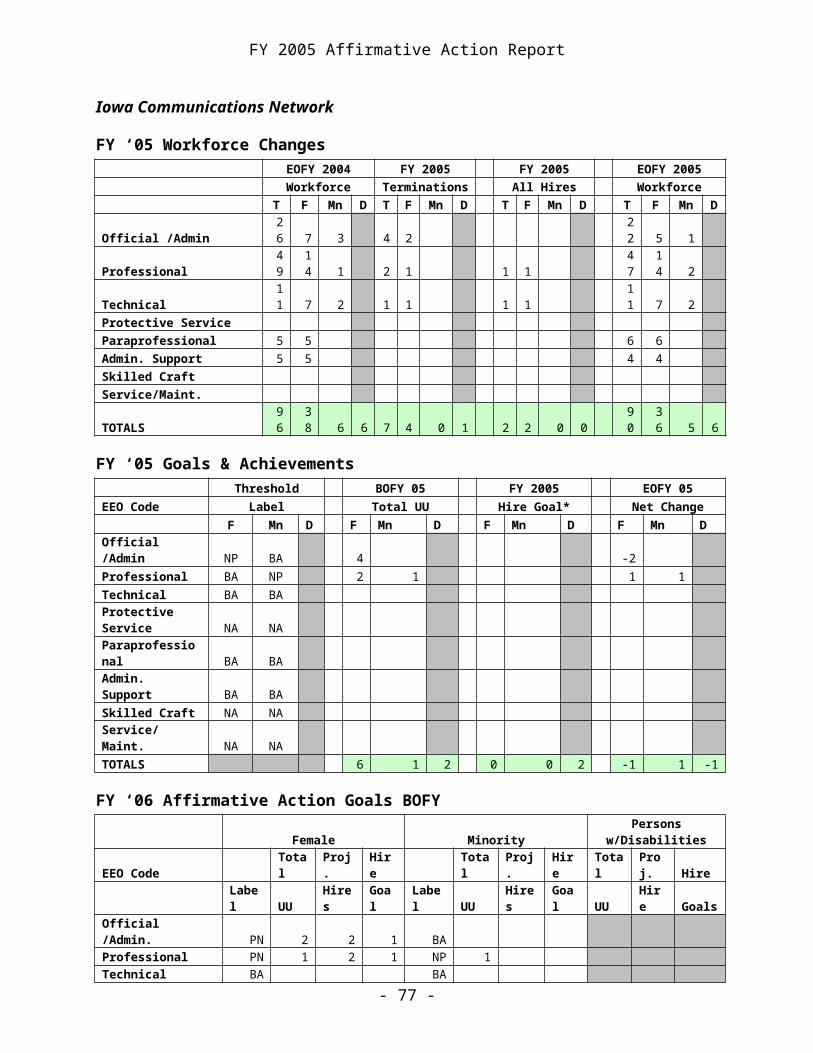
FY 2005 Affirmative Action Report
Relevant Labor Force or MarketThe relevant labor force or labor market is the geographic area from which an employer obtains a large portion of its workforce for a given occupational group.
Remedial and Non-remedial UnderutilizationExecutive branch departments are required to participate in the State's Affirmative Action Plan and address all areas of underutilization with appropriate goals. Areas of manifest imbalance require both remedial (numeric) goals for balancing the state's workforce within that department and non-remedial goals, i.e., any methods in addition to affirmative action hires designed to balance the department's workforce. Where underutilization is not statistically significant and for underutilization of persons with disabilities, non-remedial goals are required.
Qualitative AnalysisA qualitative utilization analysis shows whether and where an agency’s employment policies and practices do or tend to exclude, disadvantage, restrict or adversely affect employees based on their age, sex, disability, and racial/ethnic Minorities status. It should also show whether and where effects of prior illegal discrimination are left uncorrected. The analysis may include, but not be limited to, the following areas:
Recruitment efforts and methods. Applicant flow characteristics study. Interview, selection, appointment, and placement policies and
practices. Policies and practices affecting transfers, promotions, and
reallocations. Selection of employees for training. Policies and practices in demotion, discipline, termination, and
reduction in force. Laws, policies, and practices external to the agency that discourage
effective results in affirmative action.
Quantitative AnalysisA quantitative utilization analysis compares the employers workforce with relevant labor force in order to calculate the numerical and percentile of underrepresentation in the agency’s work force, if any, by racial /ethnic Minorities, gender and disability. (Adapted from IAC 581—20.1(19B))
A qualitative analysis determines the appropriate numerical hiring goals to set for preferential underutilization, i.e., underutilization that statistically significant and indicative of manifest imbalance in the workforce.
- 77 -
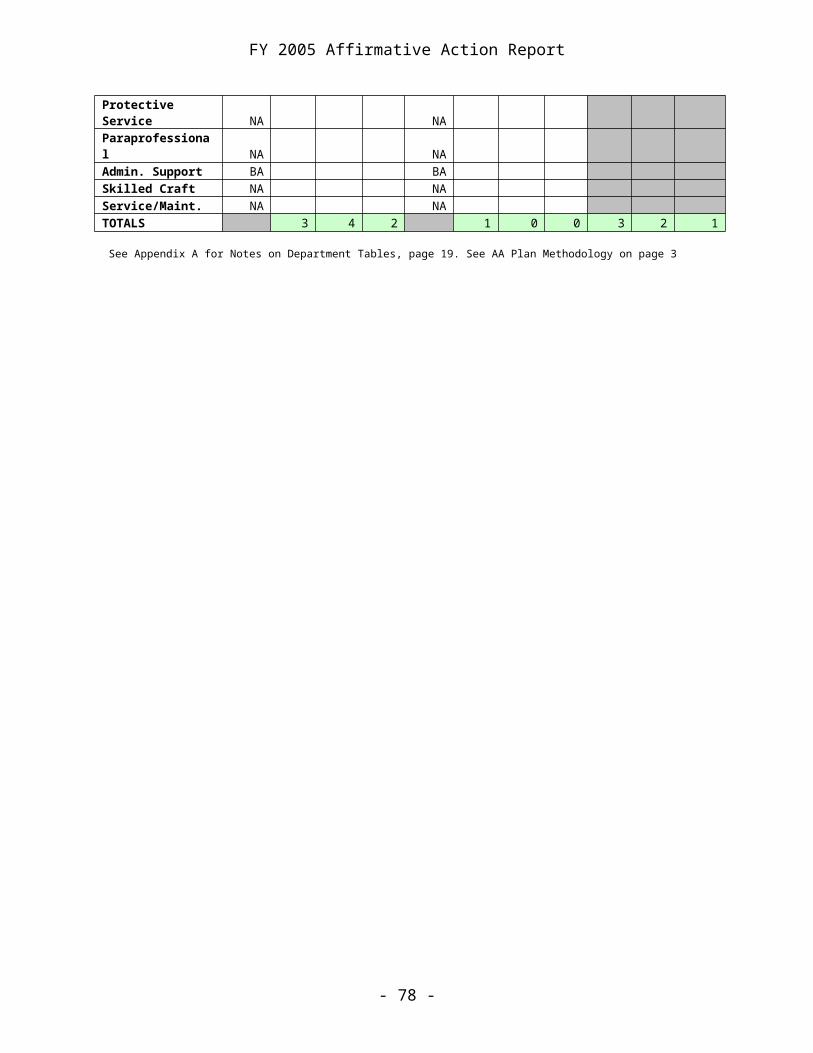
FY 2005 Affirmative Action Report
UnderutilizationCondition when there are fewer women, racial/ethnic minorities, or persons with disabilities with requisite skills in a particular job category/group than would reasonably be expected by their availability in the relevant labor market for which an organization recruits.
- 78 -


![Journal J. Am. Ceram. Soc., [11] 2853–63 (1998)cuneyttas.com/cao-alo.pdfJournal J. Am. Ceram. Soc., 81 [11] 2853–63 (1998) 2853. has been proposed for this phase.21 Structural](https://img.pdfslide.net/doc/110x75/606d48784ae660127326ea6c/journal-j-am-ceram-soc-11-2853a63-1998-journal-j-am-ceram-soc-81.jpg)