Embed Size (px)
Citation preview

FY 2008
PERFORMANCE BUDGET
EMPLOYMENT AND TRAINING ADMINISTRATION
Performance Chapter
EMPLOYMENT AND TRAINING ADMINISTRATION
Performance Chapter
PERFORMANCE BUDGET
Table of Contents Performance Summary...................................................................................................................1 Budget Authority by Strategic Goal ..............................................................................................8 Total Budgetary Resources ............................................................................................................9 Distribution of Other Appropriated Resources ............................................................................11 Summary of Performance and Resource Level ...........................................................................13 PART Assessment Summary.......................................................................................................34 Efficiency Measures.....................................................................................................................77

EMPLOYMENT AND TRAINING ADMINISTRATION
ETA-1
Performance Summary
Introduction ETA carries out a wide range of activities under three of the four Departmental Strategic goals, as described below: • Strategic Goal 1 - A Prepared Workforce Develop a prepared workforce by providing effective training and support services to new and incumbent workers and supplying high quality information on the economy and labor market. A strong national economy depends, in part, on preparing new and re-emerging entrants to the workforce to be qualified job candidates who possess the skills that are demanded by employers. Many industries and sectors of the economy will be adding new jobs in the coming years or transforming their business processes, requiring new and different worker skills. ETA contributes to this goal by offering programs such as YouthBuild, Apprenticeship and Prisoner Reentry that prepare workers with the skills needed to succeed. • Strategic Goal 2 - A Competitive Workforce Meet the competitive labor demands of the worldwide economy by enhancing the effectiveness and efficiency of the workforce development and regulatory systems that assist workers and employers in meeting the challenges of global competition. As the world becomes more interconnected and competitive, the nation’s future success will depend largely on our ability to meet the needs of employers for new and skilled workers. ETA has a critical role to play in supporting the Department’s Competitive Workforce strategic goal. In FY 2007 and again in FY 2008, ETA has proposed significant reforms to the Workforce Investment Act, including the creation of Career Advancement Accounts – self-directed accounts given to individuals in need of training and education. ETA will take the necessary steps to ensure that tools and information are available to help match workers with employers. Finally, every available worker, particularly those in special target populations, will need to participate fully in the labor market to ensure there are enough skilled workers to maintain the nation’s competitiveness. Other programs supporting this goal through targeted efforts are Community-Based Job Training Grants, electronic information tools, Community Service Employment for Older Americans, Trade Adjustment Assistance, Foreign Labor Certification, and pilot, demonstration, research and evaluation projects. • Strategic Goal 4 – Strengthened Economic Protections Protect and strengthen worker economic security through effective and efficient provision of unemployment insurance and workers’ compensation; ensuring union transparency; and securing pension and health benefits.
EMPLOYMENT AND TRAINING ADMINISTRATION
ETA-2
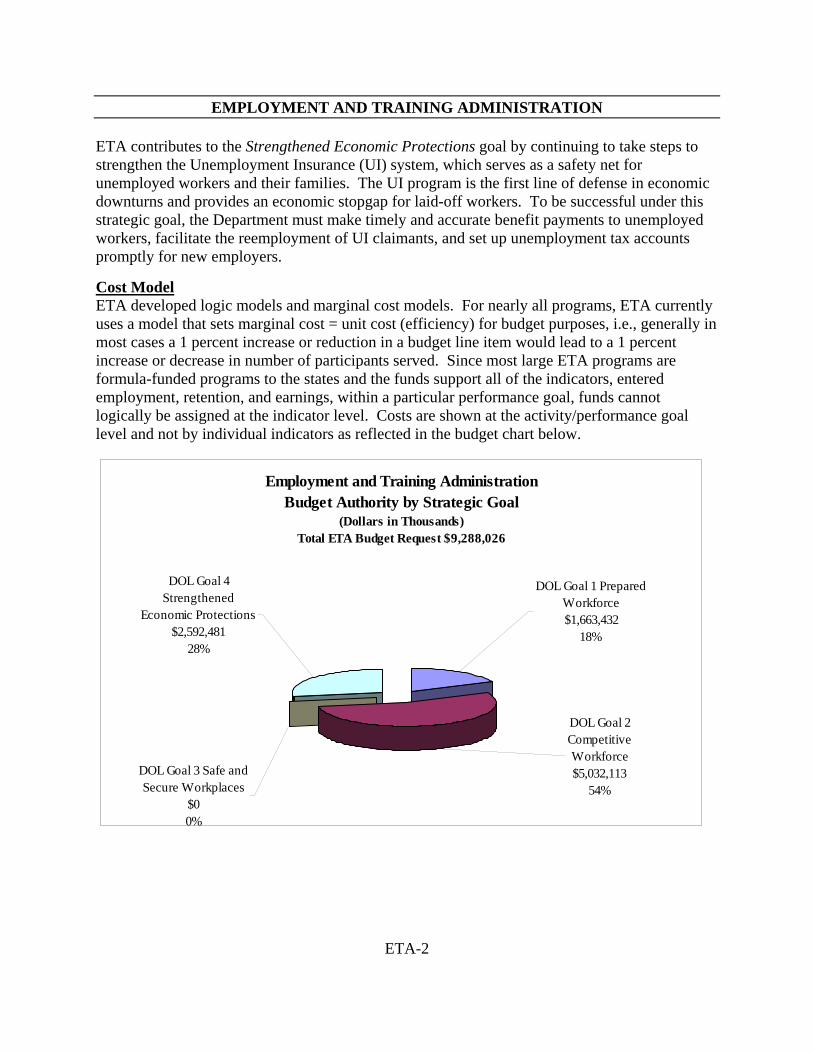
ETA contributes to the Strengthened Economic Protections goal by continuing to take steps to strengthen the Unemployment Insurance (UI) system, which serves as a safety net for unemployed workers and their families. The UI program is the first line of defense in economic downturns and provides an economic stopgap for laid-off workers. To be successful under this strategic goal, the Department must make timely and accurate benefit payments to unemployed workers, facilitate the reemployment of UI claimants, and set up unemployment tax accounts promptly for new employers. Cost Model ETA developed logic models and marginal cost models. For nearly all programs, ETA currently uses a model that sets marginal cost = unit cost (efficiency) for budget purposes, i.e., generally in most cases a 1 percent increase or reduction in a budget line item would lead to a 1 percent increase or decrease in number of participants served. Since most large ETA programs are formula-funded programs to the states and the funds support all of the indicators, entered employment, retention, and earnings, within a particular performance goal, funds cannot logically be assigned at the indicator level. Costs are shown at the activity/performance goal level and not by individual indicators as reflected in the budget chart below.
Employment and Training AdministrationBudget Authority by Strategic Goal
(Dollars in Thousands)Total ETA Budget Request $9,288,026
DOL Goal 3 Safe and Secure Workplaces
$00%
DOL Goal 4 Strengthened
Economic Protections $2,592,481
28%
DOL Goal 1 Prepared Workforce $1,663,432
18%
DOL Goal 2 Competitive Workforce$5,032,113
54%
EMPLOYMENT AND TRAINING ADMINISTRATION
ETA-3
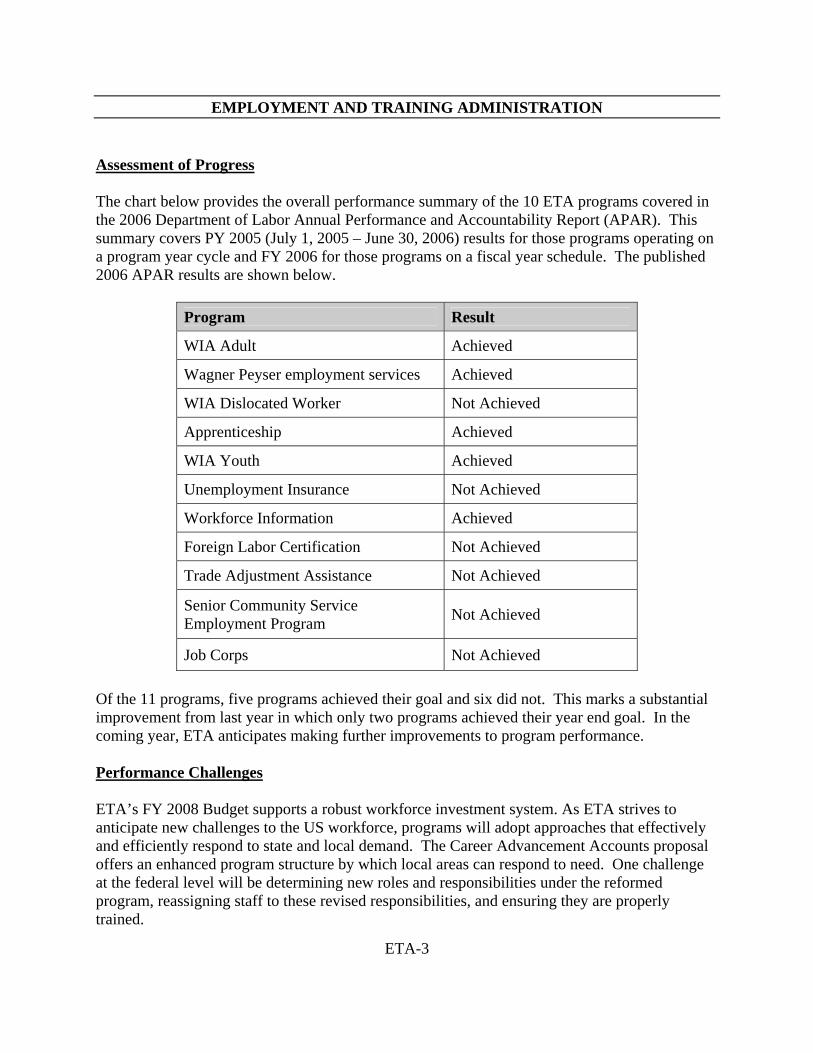
Assessment of Progress The chart below provides the overall performance summary of the 10 ETA programs covered in the 2006 Department of Labor Annual Performance and Accountability Report (APAR). This summary covers PY 2005 (July 1, 2005 – June 30, 2006) results for those programs operating on a program year cycle and FY 2006 for those programs on a fiscal year schedule. The published 2006 APAR results are shown below.
Program Result
WIA Adult Achieved
Wagner Peyser employment services Achieved
WIA Dislocated Worker Not Achieved
Apprenticeship Achieved
WIA Youth Achieved
Unemployment Insurance Not Achieved
Workforce Information Achieved
Foreign Labor Certification Not Achieved
Trade Adjustment Assistance Not Achieved
Senior Community Service Employment Program Not Achieved
Job Corps Not Achieved Of the 11 programs, five programs achieved their goal and six did not. This marks a substantial improvement from last year in which only two programs achieved their year end goal. In the coming year, ETA anticipates making further improvements to program performance. Performance Challenges ETA’s FY 2008 Budget supports a robust workforce investment system. As ETA strives to anticipate new challenges to the US workforce, programs will adopt approaches that effectively and efficiently respond to state and local demand. The Career Advancement Accounts proposal offers an enhanced program structure by which local areas can respond to need. One challenge at the federal level will be determining new roles and responsibilities under the reformed program, reassigning staff to these revised responsibilities, and ensuring they are properly trained.
EMPLOYMENT AND TRAINING ADMINISTRATION
ETA-4
The demand-driven approach is dependent on improved labor market information being available for workers and businesses, much of which is developed and analyzed outside of ETA. Another challenge will be to assure that accurate, appropriate and useful labor market information is developed and available through the workforce system. Finally, there are powerful forces at play, particularly the transformation of the economy, that present significant challenges to reaching our performance goals, because we expect achieving them will transform the workforce and the manner in which we work. Furthermore, the challenges in preparing and equipping the 21st century workforce can be exacerbated by unanticipated negative events, such as rapid flux in the economy resulting from large scale restructuring or natural and man-made disasters. In responding to these changes, it is crucial that performance measurement across programs be as consistent as possible and appropriate. ETA has placed great emphasis on implementing common performance measures for nearly all ETA programs. The common performance measures are an integral part of ETA’s performance accountability system. The value of implementing common measures is the ability to describe in a similar manner the core purposes and results of the workforce system: how many people found jobs, did they stay employed, and what their earnings were. Multiple sets of performance measures have burdened states and grantees, as they are required to report performance outcomes based on varying definitions and methodologies. By minimizing the different reporting and performance requirements, common performance measures can facilitate the integration of service delivery, reduce barriers to cooperation among programs, and enhance the ability to assess the effectiveness and impact of the workforce investment system. As workforce investment system is transformed into a demand-driven system with strategic investments in workforce solutions that result in more individuals being trained for highly skilled jobs in high growth, high demand industries, these measures will be aligned with the specific demand-driven strategies identified both at the state and local levels to ensure that the system is focused on connecting employers with skilled workers, and connecting workers with good jobs. DOL has been at the forefront in the implementation of common performance measures among Federal government programs that help individuals receive education, job training, and employment services. Within the next couple of years, all employment and training related programs at DOL will have implemented the measures. July 1, 2004, marked the beginning of data collection for two programs, Job Corps and Community Service Employment for Older Americans (Performance results from this first year are contained in tables that follow this section). On July 1, 2005, several other programs initiated data collection: WIA Adult, Dislocated Worker, and Youth; the Wagner-Peyser Employment Service; Trade Adjustment Assistance; and Migrant and Seasonal Farmworkers. By 2007, the last of DOL’s employment and training programs will have implemented the measures: Apprenticeship, Community-Based Job Training Grants, and the Prisoner Reentry Initiative.
EMPLOYMENT AND TRAINING ADMINISTRATION
ETA-5
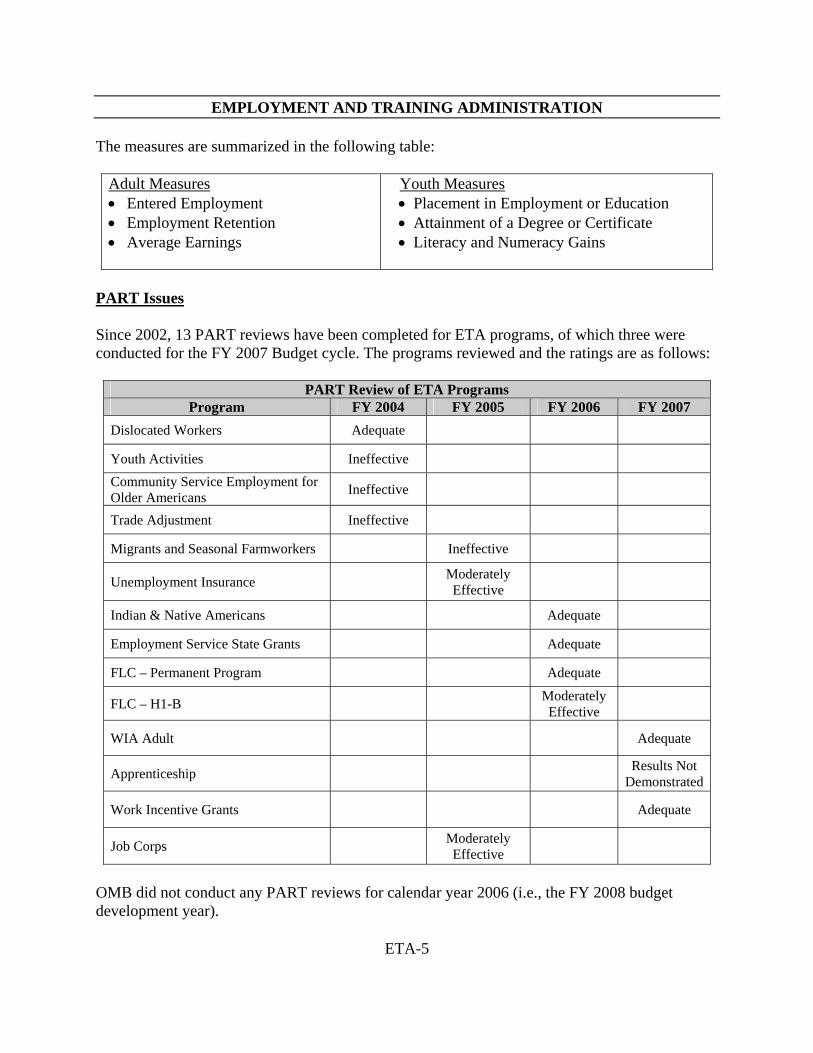
The measures are summarized in the following table:
Adult Measures • Entered Employment • Employment Retention • Average Earnings
Youth Measures • Placement in Employment or Education • Attainment of a Degree or Certificate • Literacy and Numeracy Gains
PART Issues Since 2002, 13 PART reviews have been completed for ETA programs, of which three were conducted for the FY 2007 Budget cycle. The programs reviewed and the ratings are as follows:
PART Review of ETA Programs Program FY 2004 FY 2005 FY 2006 FY 2007
Dislocated Workers Adequate
Youth Activities Ineffective Community Service Employment for Older Americans Ineffective
Trade Adjustment Ineffective
Migrants and Seasonal Farmworkers Ineffective
Unemployment Insurance Moderately Effective
Indian & Native Americans Adequate
Employment Service State Grants Adequate
FLC – Permanent Program Adequate
FLC – H1-B Moderately Effective
WIA Adult Adequate
Apprenticeship Results Not Demonstrated
Work Incentive Grants Adequate
Job Corps Moderately Effective
OMB did not conduct any PART reviews for calendar year 2006 (i.e., the FY 2008 budget development year).
EMPLOYMENT AND TRAINING ADMINISTRATION
ETA-6
ETA has taken significant steps to address recommendations from the PART reviews. For example, several PART reviews have emphasized the need to adopt the common performance measures for Federal job training and employment programs, an area in which ETA has been a leader among the participating Federal agencies. See the summary of performance measures provided in the previous section. Additionally, ETA has proposed innovative strategies and program alterations in order to maximize resources to reach more customers, train more customers, and improve quality of services. Chief among these initiatives is the Career Advancement Accounts proposal, which would provide states with one a single source of funding to provide self-directed accounts to individuals in need of employment assistance. This would eliminate a host of problems cited by PART evaluations such as rigidity of service delivery through silo funding, inefficiencies created by duplication of services, and the need to reduce administrative costs. Program Efficiency Measures Budget proposals, most notably the Career Advancement Accounts, strive to improve efficiency by eliminating redundant administrative costs while improving flexibility in how funds can be spent to maximize outcomes. ETA is committed to determining other areas to improve future efficiency. However, ETA expects unit cost to vary from year to year because of local and state economic conditions, different populations served, and a changing mix of service strategies. ETA will continue to track unit cost in budget justifications. Conclusion Our challenge at the Employment and Training Administration is to anticipate the opportunities presented by the transformation of the nation’s economy, and to link employers to job seekers in order to maximize the success of American workers and businesses. Connecting people to an ever-changing economy is our constant aim. In order to meet our objectives, ETA considers performance analysis, oversight, and improvement key program support function as reflected in our guiding principle to “support programs that are outcome-focused and results-oriented.” In our continuing efforts to strengthen agency management and improve program outcomes for those individuals and employers who are impacted by the workforce investment system, ETA pays special attention to GAO reports, OMB PART findings and recommendations, OIG audit reports, and quarterly, mid-year, and annual performance results. ETA can document several important performance initiatives that have been spurred by this type of internal and external performance related feedback. Here are five prime examples: • Adopted the common performance measures as a means of strengthening accountability for
performance outcomes. Program outcomes are now clearly focused on the extent to which people find jobs, stay employed, and earn higher wages.
EMPLOYMENT AND TRAINING ADMINISTRATION
ETA-7
• Implemented changes to the reporting structures to better align reporting across programs and proposed a single, streamlined reporting structure that will deliver performance information based on the aforementioned common performance measures.
• Improved financial management practices including the agency-wide use of Cost Analysis Manager (CAM).
• Developed the Career Advancement Accounts (CAA) proposal, which meets America’s increasing need to train more workers by 1) putting more training dollars in the hands of workers, and 2) streamlining the One-Stop service delivery system through the elimination of outdated and redundant processes. These accounts would also be ETA’s cornerstone program for increased integration, improved WIA flexibility, and reduced administrative costs, which are overarching recommendations contained in several ETA PART reviews.
• Reorganized program support under the Department’s new strategic goal structure. In order to meet the competitive labor demands of the worldwide economy, many of ETA’s programs are now strategically aligned under Goal 2: A Competitive Workforce. ETA also continues to support Goal 1: A Prepared Workforce and Goal 4: Strengthened Economic Protections.
In conclusion, ETA is proud to have utilized an integrated performance budget process in the development of the FY 2008 budget request. This request will support the many important initiatives that have been entrusted to our agency, and supports fully the President’s goal of helping more Americans gain the skills they need to find good jobs in our new economy.
EMPLOYMENT AND TRAINING ADMINISTRATION
ETA-8
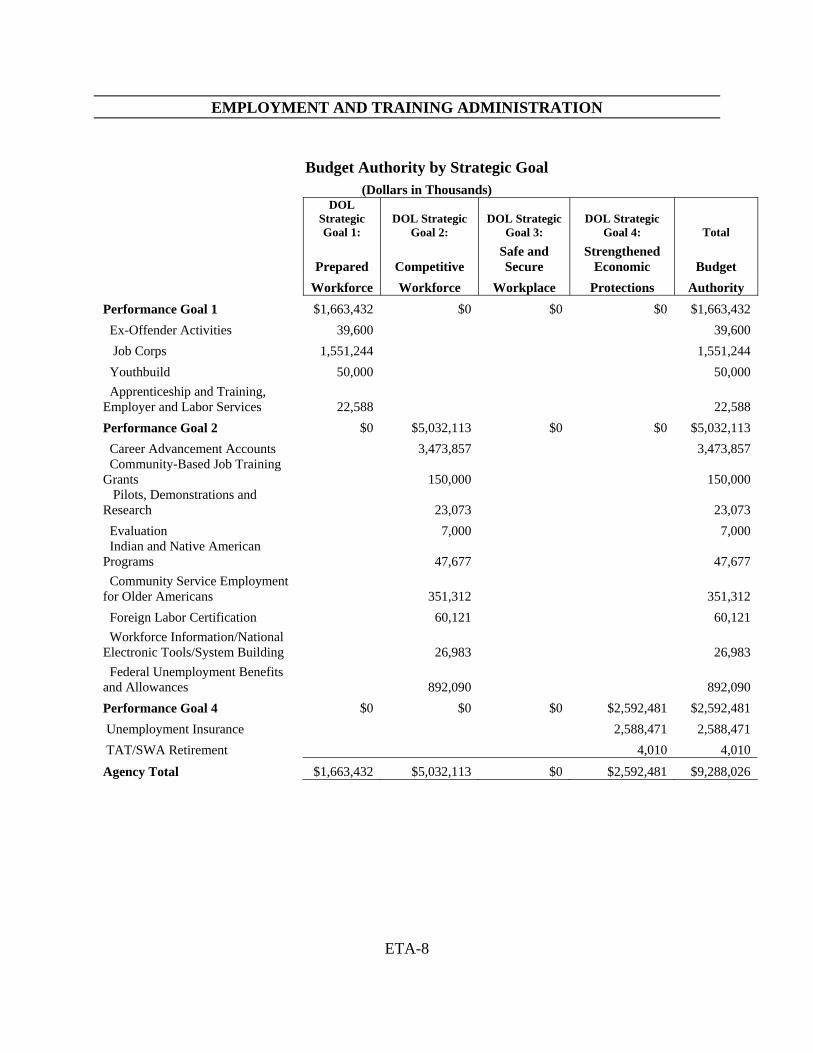
Budget Authority by Strategic Goal
(Dollars in Thousands)
DOL Strategic Goal 1:
DOL Strategic Goal 2:
DOL Strategic Goal 3:
DOL Strategic Goal 4: Total
Prepared Competitive Safe and Secure
Strengthened Economic Budget
Workforce Workforce Workplace Protections Authority Performance Goal 1 $1,663,432 $0 $0 $0 $1,663,432 Ex-Offender Activities 39,600 39,600 Job Corps 1,551,244 1,551,244 Youthbuild 50,000 50,000 Apprenticeship and Training, Employer and Labor Services 22,588 22,588 Performance Goal 2 $0 $5,032,113 $0 $0 $5,032,113 Career Advancement Accounts 3,473,857 3,473,857 Community-Based Job Training Grants 150,000 150,000 Pilots, Demonstrations and Research 23,073 23,073 Evaluation 7,000 7,000 Indian and Native American Programs 47,677 47,677 Community Service Employment for Older Americans 351,312 351,312 Foreign Labor Certification 60,121 60,121 Workforce Information/National Electronic Tools/System Building 26,983 26,983 Federal Unemployment Benefits and Allowances 892,090 892,090 Performance Goal 4 $0 $0 $0 $2,592,481 $2,592,481 Unemployment Insurance 2,588,471 2,588,471 TAT/SWA Retirement 4,010 4,010 Agency Total $1,663,432 $5,032,113 $0 $2,592,481 $9,288,026
EMPLOYMENT AND TRAINING ADMINISTRATION
ETA-9
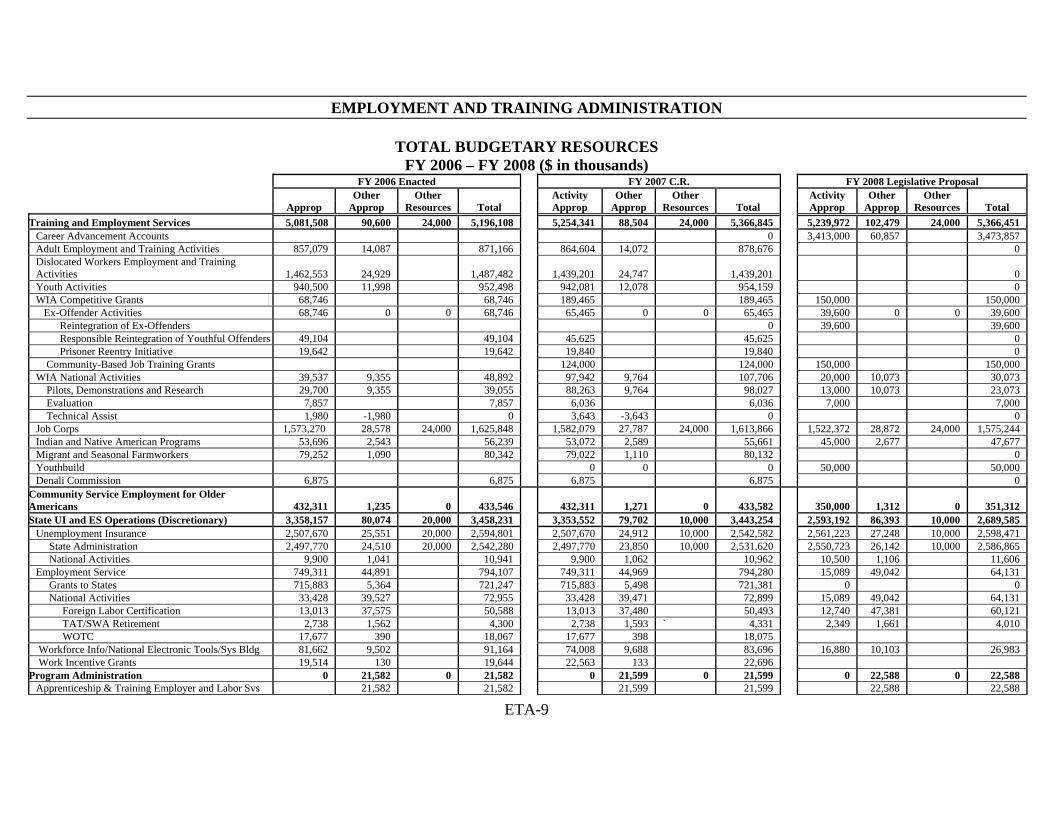
TOTAL BUDGETARY RESOURCES FY 2006 – FY 2008 ($ in thousands)
FY 2006 Enacted FY 2007 C.R. FY 2008 Legislative Proposal Other Other Activity Other Other Activity Other Other Approp Approp Resources Total Approp Approp Resources Total Approp Approp Resources Total
Training and Employment Services 5,081,508 90,600 24,000 5,196,108 5,254,341 88,504 24,000 5,366,845 5,239,972 102,479 24,000 5,366,451 Career Advancement Accounts 0 3,413,000 60,857 3,473,857 Adult Employment and Training Activities 857,079 14,087 871,166 864,604 14,072 878,676 0 Dislocated Workers Employment and Training Activities 1,462,553 24,929 1,487,482 1,439,201 24,747 1,439,201 0 Youth Activities 940,500 11,998 952,498 942,081 12,078 954,159 0 WIA Competitive Grants 68,746 68,746 189,465 189,465 150,000 150,000 Ex-Offender Activities 68,746 0 0 68,746 65,465 0 0 65,465 39,600 0 0 39,600 Reintegration of Ex-Offenders 0 39,600 39,600 Responsible Reintegration of Youthful Offenders 49,104 49,104 45,625 45,625 0 Prisoner Reentry Initiative 19,642 19,642 19,840 19,840 0 Community-Based Job Training Grants 124,000 124,000 150,000 150,000 WIA National Activities 39,537 9,355 48,892 97,942 9,764 107,706 20,000 10,073 30,073 Pilots, Demonstrations and Research 29,700 9,355 39,055 88,263 9,764 98,027 13,000 10,073 23,073 Evaluation 7,857 7,857 6,036 6,036 7,000 7,000 Technical Assist 1,980 -1,980 0 3,643 -3,643 0 0 Job Corps 1,573,270 28,578 24,000 1,625,848 1,582,079 27,787 24,000 1,613,866 1,522,372 28,872 24,000 1,575,244 Indian and Native American Programs 53,696 2,543 56,239 53,072 2,589 55,661 45,000 2,677 47,677 Migrant and Seasonal Farmworkers 79,252 1,090 80,342 79,022 1,110 80,132 0 Youthbuild 0 0 0 50,000 50,000 Denali Commission 6,875 6,875 6,875 6,875 0
Community Service Employment for Older Americans 432,311 1,235 0 433,546 432,311 1,271 0 433,582 350,000 1,312 0 351,312 State UI and ES Operations (Discretionary) 3,358,157 80,074 20,000 3,458,231 3,353,552 79,702 10,000 3,443,254 2,593,192 86,393 10,000 2,689,585
Unemployment Insurance 2,507,670 25,551 20,000 2,594,801 2,507,670 24,912 10,000 2,542,582 2,561,223 27,248 10,000 2,598,471 State Administration 2,497,770 24,510 20,000 2,542,280 2,497,770 23,850 10,000 2,531,620 2,550,723 26,142 10,000 2,586,865 National Activities 9,900 1,041 10,941 9,900 1,062 10,962 10,500 1,106 11,606 Employment Service 749,311 44,891 794,107 749,311 44,969 794,280 15,089 49,042 64,131 Grants to States 715,883 5,364 721,247 715,883 5,498 721,381 0 0 National Activities 33,428 39,527 72,955 33,428 39,471 72,899 15,089 49,042 64,131 Foreign Labor Certification 13,013 37,575 50,588 13,013 37,480 50,493 12,740 47,381 60,121 TAT/SWA Retirement 2,738 1,562 4,300 2,738 1,593 ` 4,331 2,349 1,661 4,010 WOTC 17,677 390 18,067 17,677 398 18,075 Workforce Info/National Electronic Tools/Sys Bldg 81,662 9,502 91,164 74,008 9,688 83,696 16,880 10,103 26,983 Work Incentive Grants 19,514 130 19,644 22,563 133 22,696
Program Administration 0 21,582 0 21,582 0 21,599 0 21,599 0 22,588 0 22,588 Apprenticeship & Training Employer and Labor Svs 21,582 21,582 21,599 21,599 22,588 22,588
EMPLOYMENT AND TRAINING ADMINISTRATION
ETA-10
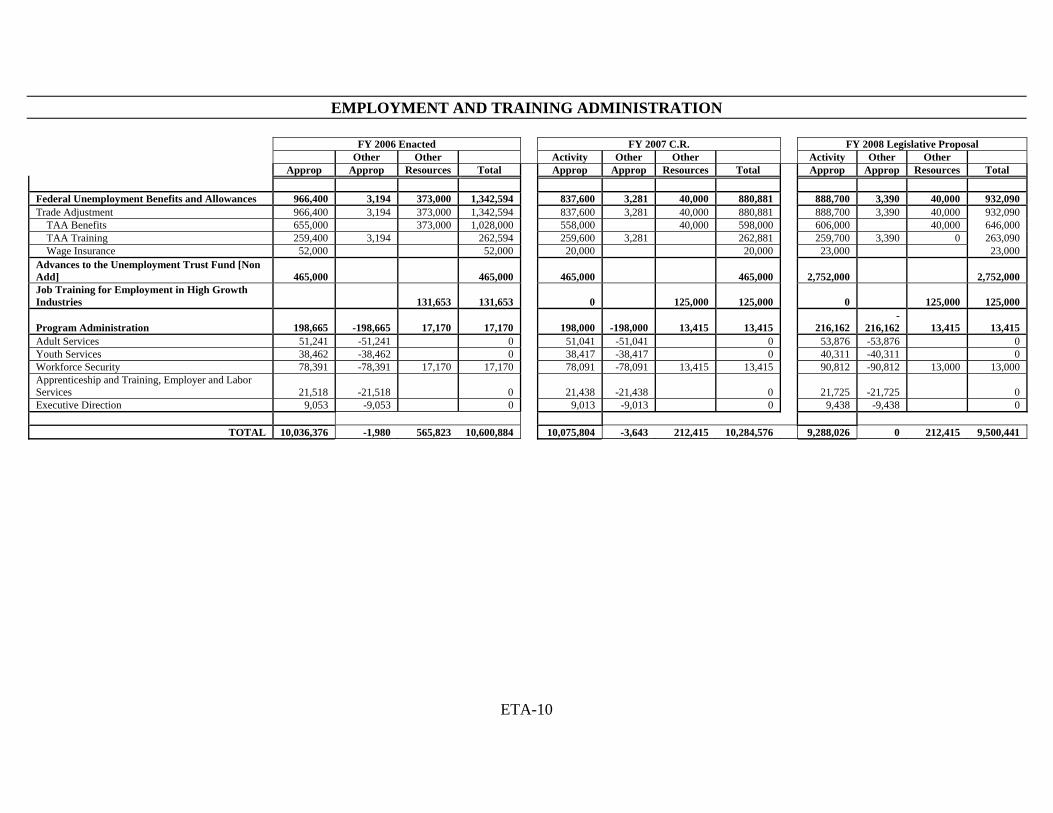
FY 2006 Enacted FY 2007 C.R. FY 2008 Legislative Proposal Other Other Activity Other Other Activity Other Other Approp Approp Resources Total Approp Approp Resources Total Approp Approp Resources Total Federal Unemployment Benefits and Allowances 966,400 3,194 373,000 1,342,594 837,600 3,281 40,000 880,881 888,700 3,390 40,000 932,090 Trade Adjustment 966,400 3,194 373,000 1,342,594 837,600 3,281 40,000 880,881 888,700 3,390 40,000 932,090 TAA Benefits 655,000 373,000 1,028,000 558,000 40,000 598,000 606,000 40,000 646,000 TAA Training 259,400 3,194 262,594 259,600 3,281 262,881 259,700 3,390 0 263,090 Wage Insurance 52,000 52,000 20,000 20,000 23,000 23,000 Advances to the Unemployment Trust Fund [Non Add] 465,000 465,000 465,000 465,000 2,752,000 2,752,000 Job Training for Employment in High Growth Industries 131,653 131,653 0 125,000 125,000 0 125,000 125,000
Program Administration 198,665 -198,665 17,170 17,170 198,000 -198,000 13,415 13,415 216,162 -
216,162 13,415 13,415 Adult Services 51,241 -51,241 0 51,041 -51,041 0 53,876 -53,876 0 Youth Services 38,462 -38,462 0 38,417 -38,417 0 40,311 -40,311 0 Workforce Security 78,391 -78,391 17,170 17,170 78,091 -78,091 13,415 13,415 90,812 -90,812 13,000 13,000 Apprenticeship and Training, Employer and Labor Services 21,518 -21,518 0 21,438 -21,438 0 21,725 -21,725 0 Executive Direction 9,053 -9,053 0 9,013 -9,013 0 9,438 -9,438 0
TOTAL 10,036,376 -1,980 565,823 10,600,884 10,075,804 -3,643 212,415 10,284,576 9,288,026 0 212,415 9,500,441
EMPLOYMENT AND TRAINING ADMINISTRATION
ETA-11
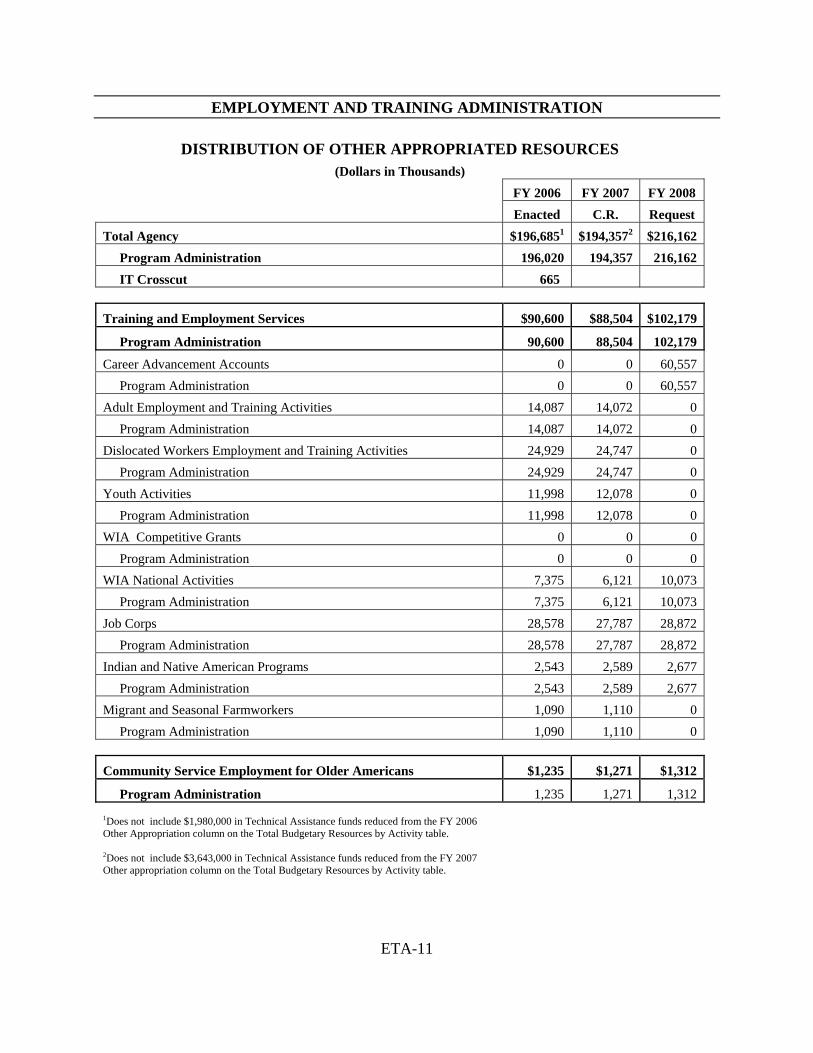
DISTRIBUTION OF OTHER APPROPRIATED RESOURCES (Dollars in Thousands)
FY 2006 FY 2007 FY 2008 Enacted C.R. Request Total Agency $196,6851 $194,3572 $216,162 Program Administration 196,020 194,357 216,162 IT Crosscut 665
Training and Employment Services $90,600 $88,504 $102,179
Program Administration 90,600 88,504 102,179
Career Advancement Accounts 0 0 60,557 Program Administration 0 0 60,557 Adult Employment and Training Activities 14,087 14,072 0 Program Administration 14,087 14,072 0 Dislocated Workers Employment and Training Activities 24,929 24,747 0 Program Administration 24,929 24,747 0 Youth Activities 11,998 12,078 0 Program Administration 11,998 12,078 0 WIA Competitive Grants 0 0 0 Program Administration 0 0 0 WIA National Activities 7,375 6,121 10,073 Program Administration 7,375 6,121 10,073 Job Corps 28,578 27,787 28,872 Program Administration 28,578 27,787 28,872 Indian and Native American Programs 2,543 2,589 2,677 Program Administration 2,543 2,589 2,677 Migrant and Seasonal Farmworkers 1,090 1,110 0 Program Administration 1,090 1,110 0
Community Service Employment for Older Americans $1,235 $1,271 $1,312
Program Administration 1,235 1,271 1,312
1Does not include $1,980,000 in Technical Assistance funds reduced from the FY 2006 Other Appropriation column on the Total Budgetary Resources by Activity table. 2Does not include $3,643,000 in Technical Assistance funds reduced from the FY 2007 Other appropriation column on the Total Budgetary Resources by Activity table.
EMPLOYMENT AND TRAINING ADMINISTRATION
ETA-12
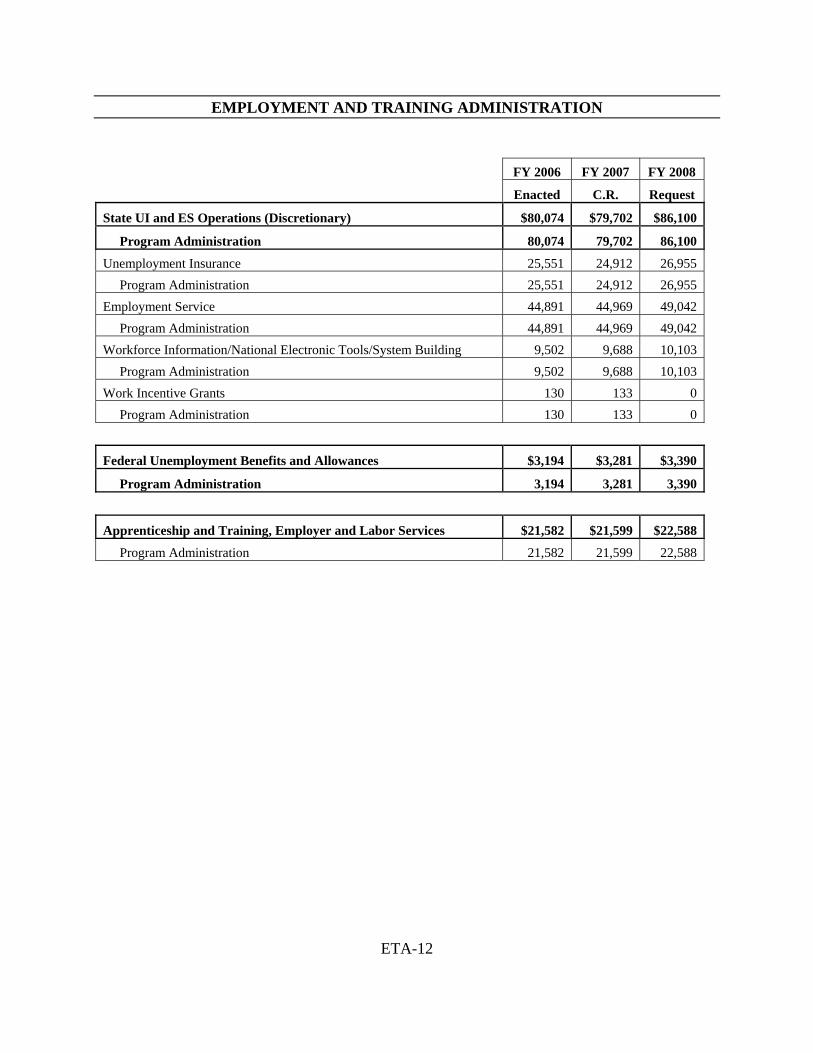
FY 2006 FY 2007 FY 2008
Enacted C.R. Request
State UI and ES Operations (Discretionary) $80,074 $79,702 $86,100
Program Administration 80,074 79,702 86,100
Unemployment Insurance 25,551 24,912 26,955 Program Administration 25,551 24,912 26,955 Employment Service 44,891 44,969 49,042 Program Administration 44,891 44,969 49,042 Workforce Information/National Electronic Tools/System Building 9,502 9,688 10,103 Program Administration 9,502 9,688 10,103 Work Incentive Grants 130 133 0 Program Administration 130 133 0
Federal Unemployment Benefits and Allowances $3,194 $3,281 $3,390
Program Administration 3,194 3,281 3,390
Apprenticeship and Training, Employer and Labor Services $21,582 $21,599 $22,588
Program Administration 21,582 21,599 22,588
EMPLOYMENT AND TRAINING ADMINISTRATION
ETA-13
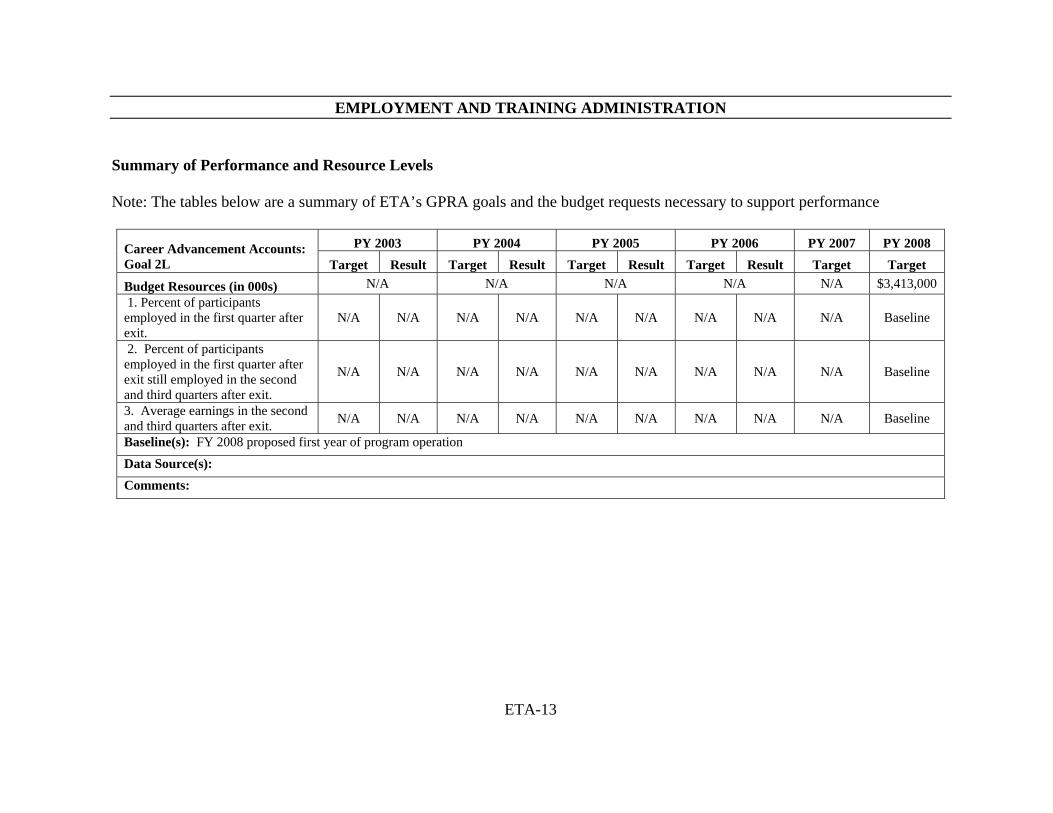
Summary of Performance and Resource Levels Note: The tables below are a summary of ETA’s GPRA goals and the budget requests necessary to support performance
PY 2003 PY 2004 PY 2005 PY 2006 PY 2007 PY 2008 Career Advancement Accounts: Goal 2L Target Result Target Result Target Result Target Result Target Target Budget Resources (in 000s) N/A N/A N/A N/A N/A $3,413,000 1. Percent of participants employed in the first quarter after exit.
N/A N/A N/A N/A N/A N/A N/A N/A N/A Baseline
2. Percent of participants employed in the first quarter after exit still employed in the second and third quarters after exit.
N/A N/A N/A N/A N/A N/A N/A N/A N/A Baseline
3. Average earnings in the second and third quarters after exit. N/A N/A N/A N/A N/A N/A N/A N/A N/A Baseline
Baseline(s): FY 2008 proposed first year of program operation Data Source(s): Comments:
EMPLOYMENT AND TRAINING ADMINISTRATION
ETA-14
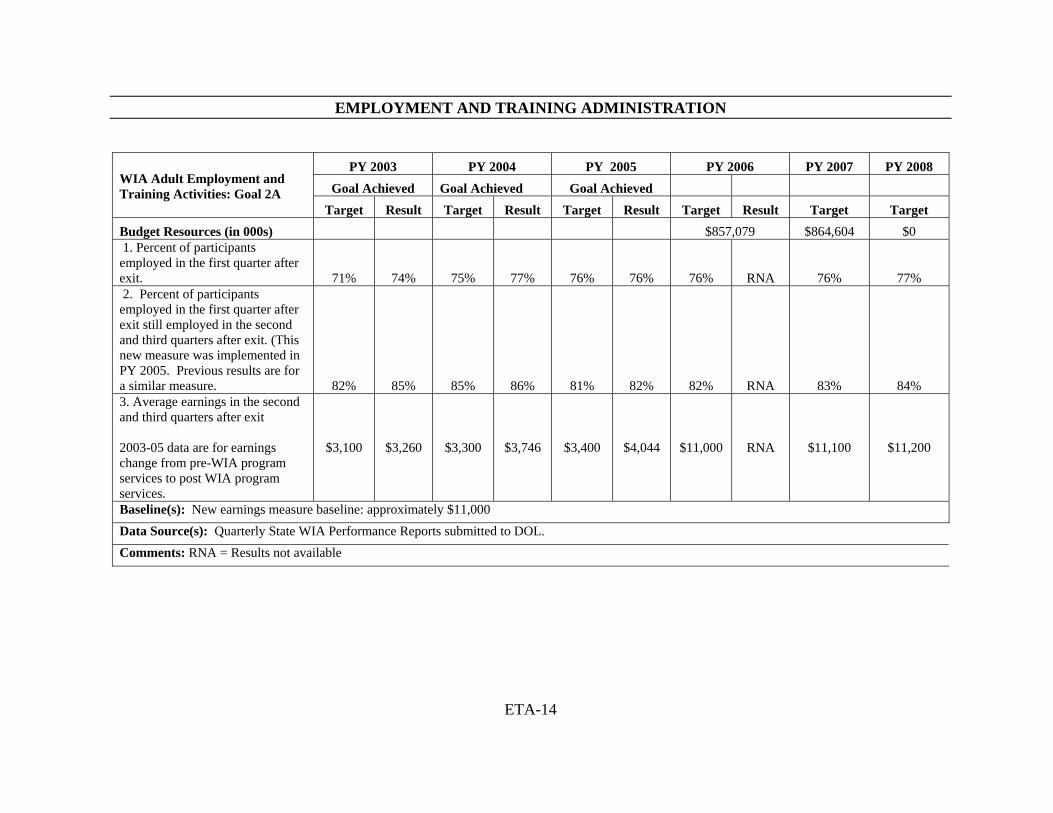
PY 2003 PY 2004 PY 2005 PY 2006 PY 2007 PY 2008
Goal Achieved Goal Achieved Goal Achieved WIA Adult Employment and Training Activities: Goal 2A Target Result Target Result Target Result Target Result Target Target Budget Resources (in 000s) $857,079 $864,604 $0 1. Percent of participants employed in the first quarter after exit. 71% 74% 75% 77% 76% 76% 76% RNA 76% 77% 2. Percent of participants employed in the first quarter after exit still employed in the second and third quarters after exit. (This new measure was implemented in PY 2005. Previous results are for a similar measure. 82% 85% 85% 86% 81% 82% 82% RNA 83% 84% 3. Average earnings in the second and third quarters after exit 2003-05 data are for earnings change from pre-WIA program services to post WIA program services.
$3,100 $3,260 $3,300 $3,746 $3,400 $4,044 $11,000 RNA $11,100 $11,200
Baseline(s): New earnings measure baseline: approximately $11,000 Data Source(s): Quarterly State WIA Performance Reports submitted to DOL. Comments: RNA = Results not available

EMPLOYMENT AND TRAINING ADMINISTRATION
ETA-15
PY 2003 PY 2004 Y 2005 PY 2006 PY 2007 PY 2008
Goal Achieved Goal Not Achieved
Goal Not Achieved
WIA Dislocated Worker Employment and Training Activities: Goal 2B Target Result Target Result Target Result Target Result Target Target Budget Resources (in 000s) $1,462,553 $1,439,201 $0 1. Percent of participants employed in the first quarter after exit 78% 82% 82% 84% 83% 83% 84% RNA 84% 84% 2. Percent of participants employed in the first quarter after program exit still employed in the second and third quarters after exit. (2003-05 data are for a similar measure.)
88% 90% 91% 91% 89% 88% 90% RNA 90% 90%
3. Average earnings in the second and third quarters after exit 2003-05 data are for earnings replacement and change from pre-layoff to post WIA program services.
93% 91% 91% 93% 92% $461 $13,800 RNA $13,900 $14,000
Baseline(s): New earnings measure baseline: approximately $14,000 Data Source(s): Quarterly State WIA Performance Reports Comments: RNA = Results not available.
EMPLOYMENT AND TRAINING ADMINISTRATION
ETA-16
PY 2003 PY 2004 PY 2005 PY 2006 PY 2007 PY 2008
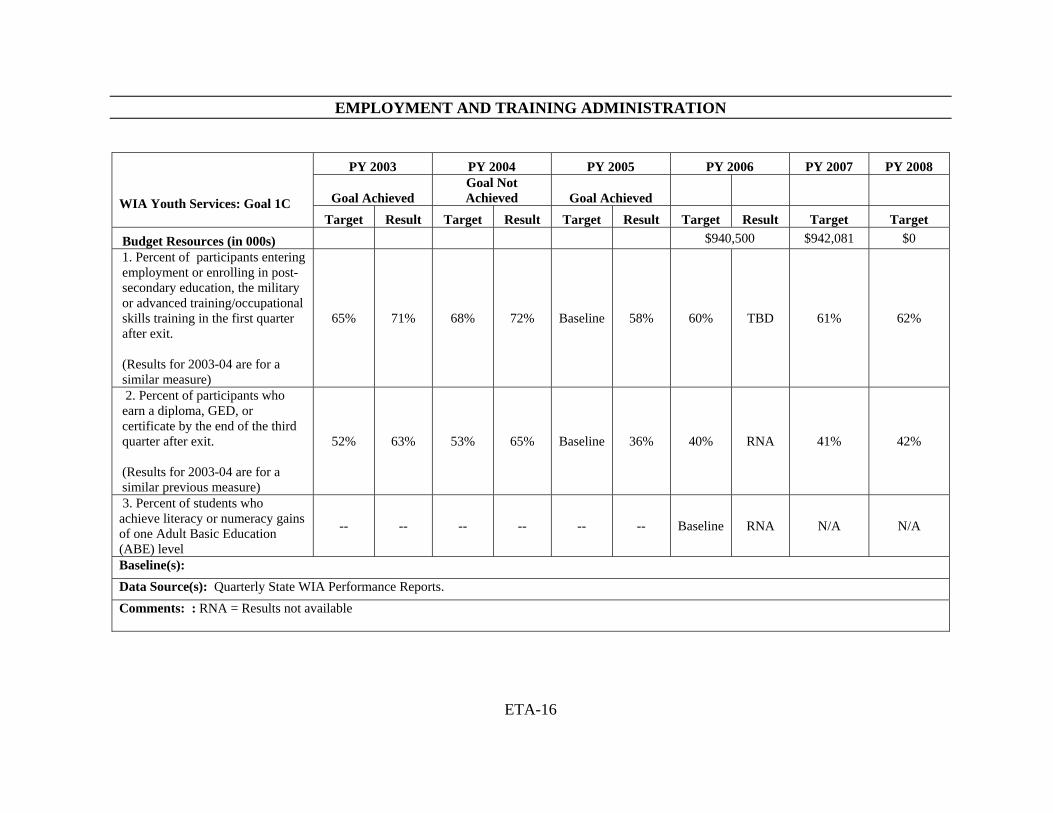
Goal Achieved Goal Not Achieved Goal Achieved WIA Youth Services: Goal 1C
Target Result Target Result Target Result Target Result Target Target Budget Resources (in 000s) $940,500 $942,081 $0 1. Percent of participants entering employment or enrolling in post-secondary education, the military or advanced training/occupational skills training in the first quarter after exit. (Results for 2003-04 are for a similar measure)
65% 71% 68% 72% Baseline 58% 60% TBD 61% 62%
2. Percent of participants who earn a diploma, GED, or certificate by the end of the third quarter after exit. (Results for 2003-04 are for a similar previous measure)
52% 63% 53% 65% Baseline 36% 40% RNA 41% 42%
3. Percent of students who achieve literacy or numeracy gains of one Adult Basic Education (ABE) level
-- -- -- -- -- -- Baseline RNA N/A N/A
Baseline(s): Data Source(s): Quarterly State WIA Performance Reports. Comments: : RNA = Results not available
EMPLOYMENT AND TRAINING ADMINISTRATION
ETA-17
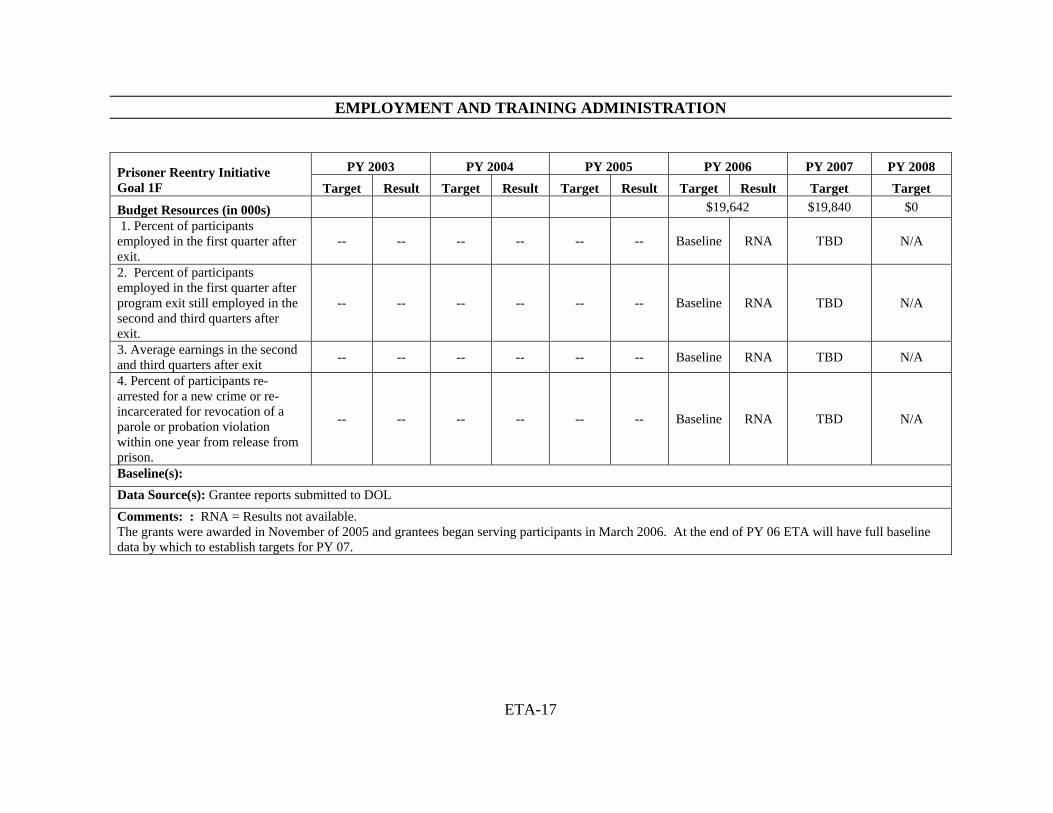
PY 2003 PY 2004 PY 2005 PY 2006 PY 2007 PY 2008 Prisoner Reentry Initiative
Goal 1F Target Result Target Result Target Result Target Result Target Target Budget Resources (in 000s) $19,642 $19,840 $0 1. Percent of participants employed in the first quarter after exit.
-- -- -- -- -- -- Baseline RNA TBD N/A
2. Percent of participants employed in the first quarter after program exit still employed in the second and third quarters after exit.
-- -- -- -- -- -- Baseline RNA TBD N/A
3. Average earnings in the second and third quarters after exit -- -- -- -- -- -- Baseline RNA TBD N/A
4. Percent of participants re-arrested for a new crime or re-incarcerated for revocation of a parole or probation violation within one year from release from prison.
-- -- -- -- -- -- Baseline RNA TBD N/A
Baseline(s): Data Source(s): Grantee reports submitted to DOL Comments: : RNA = Results not available. The grants were awarded in November of 2005 and grantees began serving participants in March 2006. At the end of PY 06 ETA will have full baseline data by which to establish targets for PY 07.
EMPLOYMENT AND TRAINING ADMINISTRATION
ETA-18
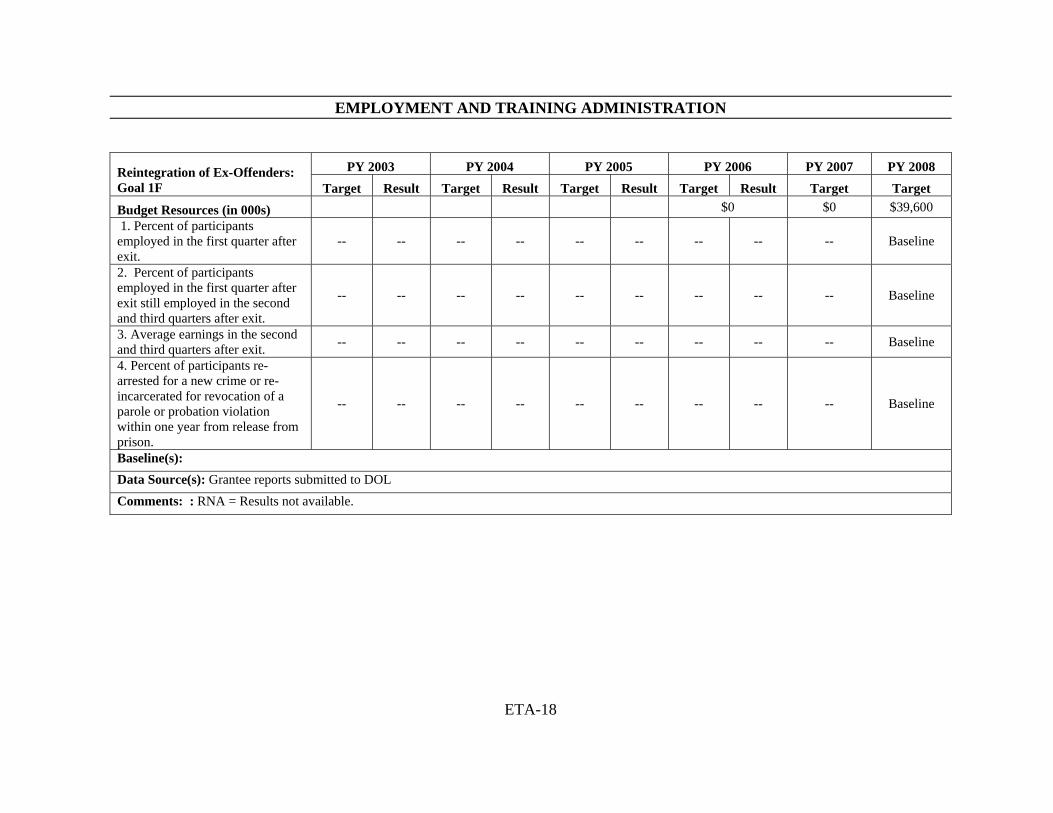
PY 2003 PY 2004 PY 2005 PY 2006 PY 2007 PY 2008 Reintegration of Ex-Offenders:
Goal 1F Target Result Target Result Target Result Target Result Target Target Budget Resources (in 000s) $0 $0 $39,600 1. Percent of participants employed in the first quarter after exit.
-- -- -- -- -- -- -- -- -- Baseline
2. Percent of participants employed in the first quarter after exit still employed in the second and third quarters after exit.
-- -- -- -- -- -- -- -- -- Baseline
3. Average earnings in the second and third quarters after exit. -- -- -- -- -- -- -- -- -- Baseline 4. Percent of participants re-arrested for a new crime or re-incarcerated for revocation of a parole or probation violation within one year from release from prison.
-- -- -- -- -- -- -- -- -- Baseline
Baseline(s): Data Source(s): Grantee reports submitted to DOL Comments: : RNA = Results not available.
EMPLOYMENT AND TRAINING ADMINISTRATION
ETA-19
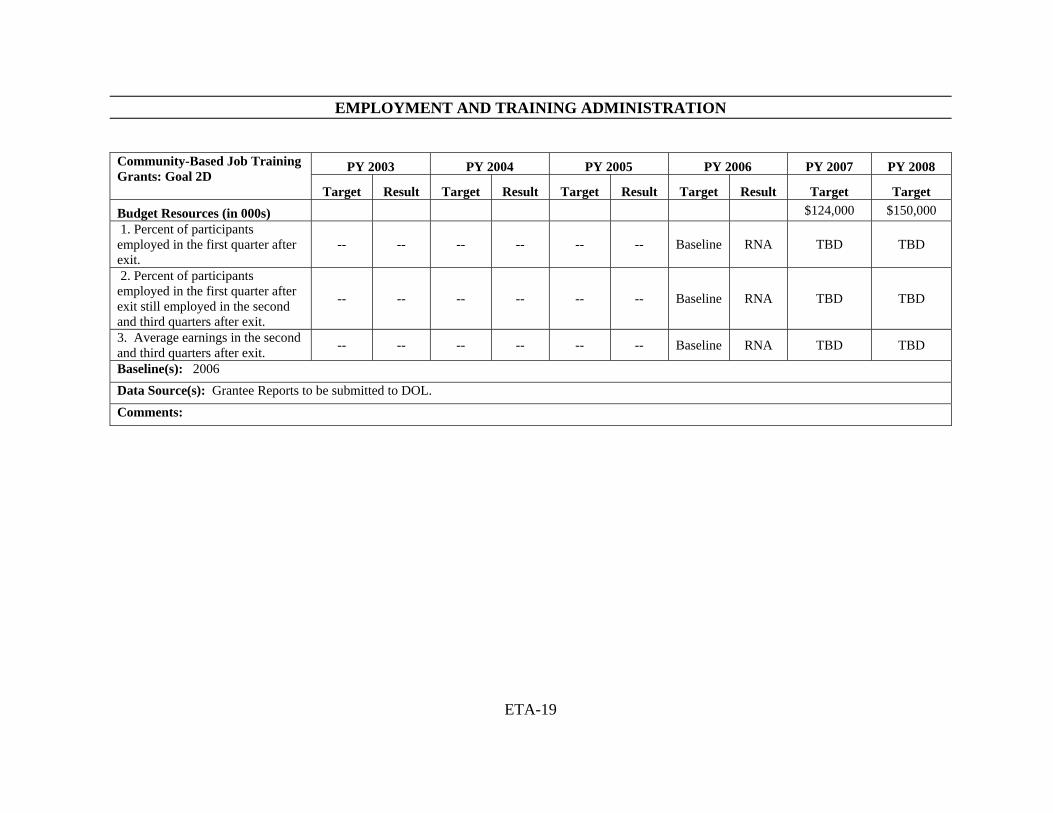
PY 2003 PY 2004 PY 2005 PY 2006 PY 2007 PY 2008 Community-Based Job Training
Grants: Goal 2D Target Result Target Result Target Result Target Result Target Target Budget Resources (in 000s) $124,000 $150,000 1. Percent of participants employed in the first quarter after exit.
-- -- -- -- -- -- Baseline RNA TBD TBD
2. Percent of participants employed in the first quarter after exit still employed in the second and third quarters after exit.
-- -- -- -- -- -- Baseline RNA TBD TBD
3. Average earnings in the second and third quarters after exit. -- -- -- -- -- -- Baseline RNA TBD TBD
Baseline(s): 2006 Data Source(s): Grantee Reports to be submitted to DOL. Comments:

EMPLOYMENT AND TRAINING ADMINISTRATION
ETA-20
PY 2003 PY 2004 PY 2005 PY 2006 PY 2007 PY 2008
Goal Achieved Goal Achieved Pilots, Demos, Evaluation and Research: Goal 2M Target Result Target Result Target Result Target Result Target Target Budget Resource (in 000s) $29,700 $88,263 $13,000 1. Percentage of all scheduled research, pilot, demonstration, and evaluation reports from current studies that are submitted within 3 months of completion for approval and public dissemination to the Office of the Assistant Secretary
-- -- 90% 90% 90% 90% 90% RNA 95% 95%
2. Upon approval, the percentage of research, pilot, demonstration, and evaluation reports that will be published within 3 months, with briefings and summaries of studies prepared for the Assistant Secretary to inform workforce investment planning and decisions.
-- -- 90% 90% 90% 90% 90% RNA 95% 95%
Baseline(s): Data Source(s): Five-year strategic research plan; research and evaluation schedules. Comments: RNA = Results not available.
EMPLOYMENT AND TRAINING ADMINISTRATION
ETA-21
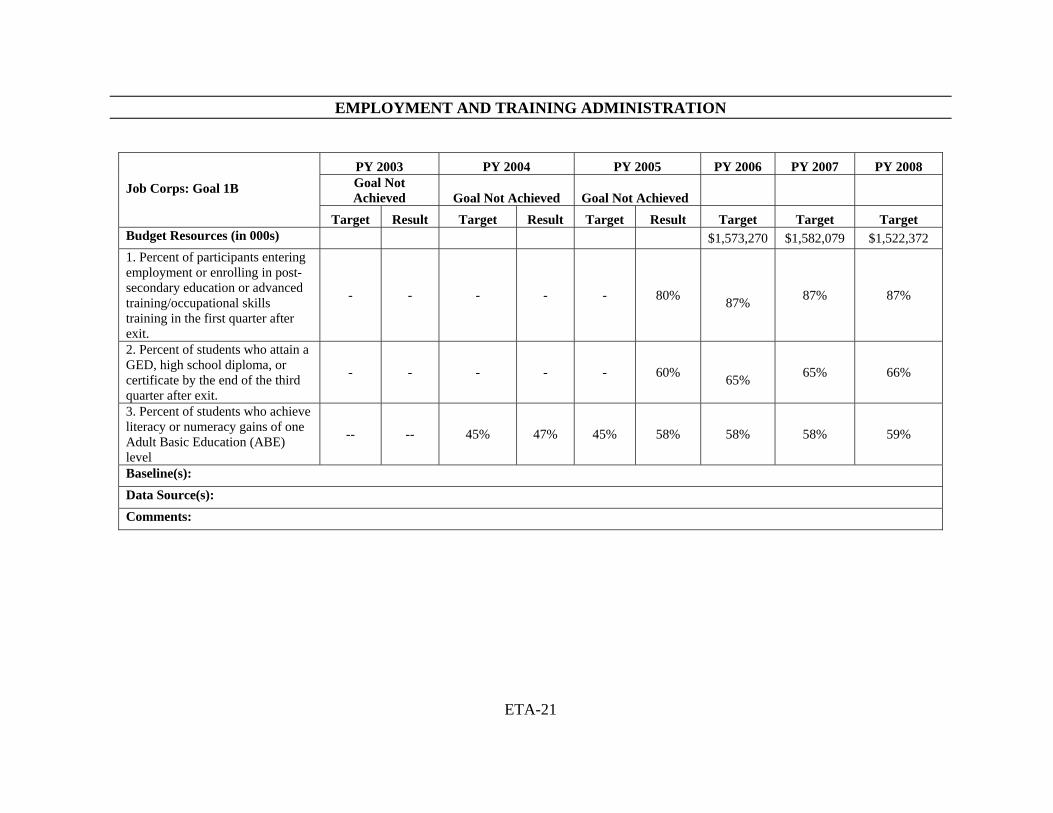
PY 2003 PY 2004 PY 2005 PY 2006 PY 2007 PY 2008 Goal Not Achieved Goal Not Achieved Goal Not Achieved
Job Corps: Goal 1B Target Result Target Result Target Result Target Target Target Budget Resources (in 000s) $1,573,270 $1,582,079 $1,522,372 1. Percent of participants entering employment or enrolling in post-secondary education or advanced training/occupational skills training in the first quarter after exit.
- - - - - 80% 87% 87% 87%
2. Percent of students who attain a GED, high school diploma, or certificate by the end of the third quarter after exit.
- - - - - 60% 65% 65% 66%
3. Percent of students who achieve literacy or numeracy gains of one Adult Basic Education (ABE) level
-- -- 45% 47% 45% 58% 58% 58% 59%
Baseline(s): Data Source(s): Comments:
EMPLOYMENT AND TRAINING ADMINISTRATION
ETA-22
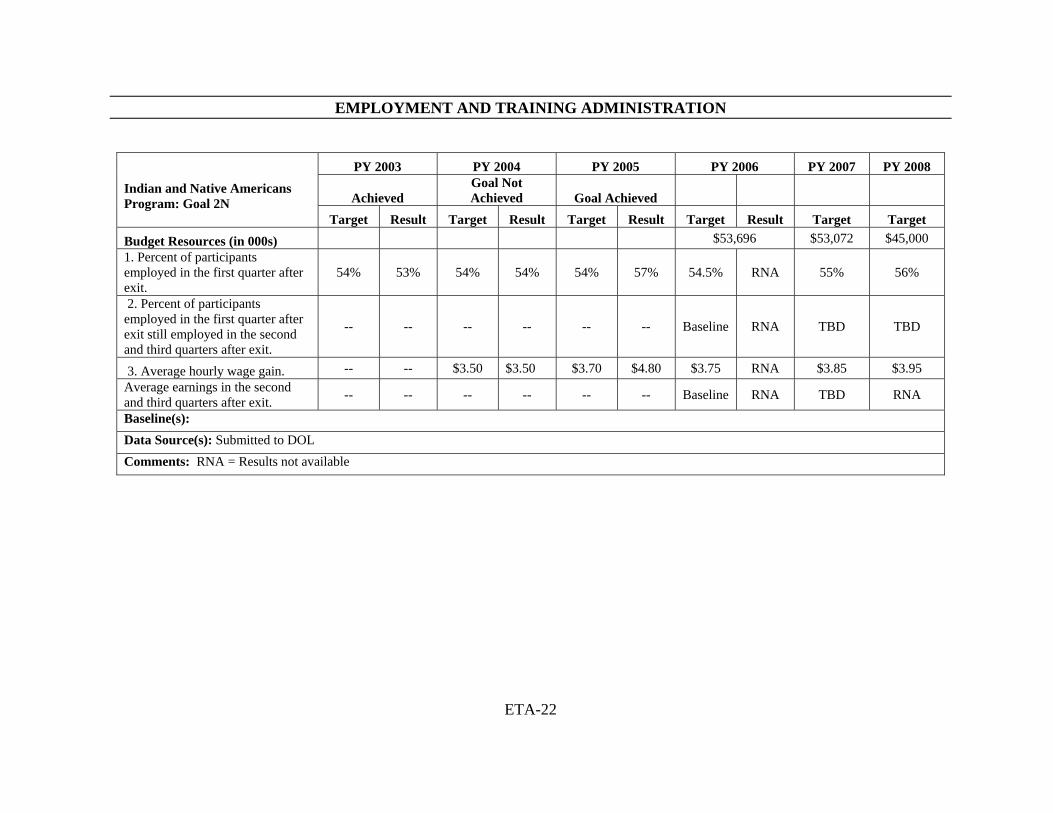
PY 2003 PY 2004 PY 2005 PY 2006 PY 2007 PY 2008
Achieved Goal Not Achieved Goal Achieved
Indian and Native Americans Program: Goal 2N Target Result Target Result Target Result Target Result Target Target Budget Resources (in 000s) $53,696 $53,072 $45,000 1. Percent of participants employed in the first quarter after exit.
54% 53% 54% 54% 54% 57% 54.5% RNA 55% 56%
2. Percent of participants employed in the first quarter after exit still employed in the second and third quarters after exit.
-- -- -- -- -- -- Baseline RNA TBD TBD
3. Average hourly wage gain. -- -- $3.50 $3.50 $3.70 $4.80 $3.75 RNA $3.85 $3.95 Average earnings in the second and third quarters after exit. -- -- -- -- -- -- Baseline RNA TBD RNA
Baseline(s): Data Source(s): Submitted to DOL Comments: RNA = Results not available

EMPLOYMENT AND TRAINING ADMINISTRATION
ETA-23
PY 2003 PY 2004 PY 2005 PY 2006 PY 2007 PY 2008
Achieved Achieved Goal Not Achieved
Migrant and Seasonal Farmworkers: Goal 2O Target Result Target Result Target Result Target Result Target Target Budget Resources (in 000s) $79,252 $79,022 $0 1. Percent of participants employed in the first quarter after program exit. 64% 84% 75% 88% 85% 65%* 85% RNA N/A N/A 2. Percent of participants employed in the first quarter after exit still employed in the second and third quarters after exit. 75% 80% 75% 79% 80% 80% 80% RNA N/A N/A
3. Average earnings in the second and third quarters after exit. (2003-05 results and targets are for an earnings gain measure)
$2,965 $4,147 $3,200 $4,630 $3,450 $7,709 Baseline RNA TBD TBD
Baseline(s): Data Source(s): Grantee reports submitted to DOL
EMPLOYMENT AND TRAINING ADMINISTRATION
ETA-24
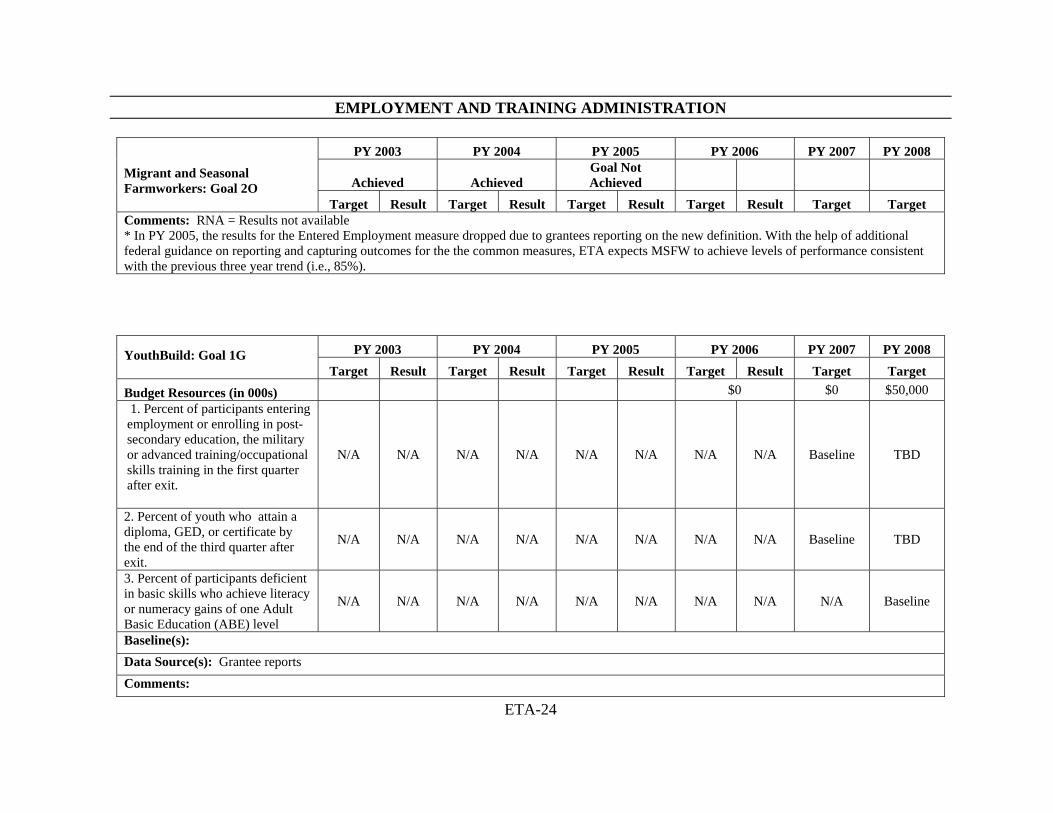
PY 2003 PY 2004 PY 2005 PY 2006 PY 2007 PY 2008
Achieved Achieved Goal Not Achieved
Migrant and Seasonal Farmworkers: Goal 2O Target Result Target Result Target Result Target Result Target Target Comments: RNA = Results not available * In PY 2005, the results for the Entered Employment measure dropped due to grantees reporting on the new definition. With the help of additional federal guidance on reporting and capturing outcomes for the the common measures, ETA expects MSFW to achieve levels of performance consistent with the previous three year trend (i.e., 85%).
PY 2003 PY 2004 PY 2005 PY 2006 PY 2007 PY 2008 YouthBuild: Goal 1G Target Result Target Result Target Result Target Result Target Target Budget Resources (in 000s) $0 $0 $50,000 1. Percent of participants entering employment or enrolling in post-secondary education, the military or advanced training/occupational skills training in the first quarter after exit.
N/A N/A N/A N/A N/A N/A N/A N/A Baseline TBD
2. Percent of youth who attain a diploma, GED, or certificate by the end of the third quarter after exit.
N/A N/A N/A N/A N/A N/A N/A N/A Baseline TBD
3. Percent of participants deficient in basic skills who achieve literacy or numeracy gains of one Adult Basic Education (ABE) level
N/A N/A N/A N/A N/A N/A N/A N/A N/A Baseline
Baseline(s): Data Source(s): Grantee reports Comments:
EMPLOYMENT AND TRAINING ADMINISTRATION
ETA-25
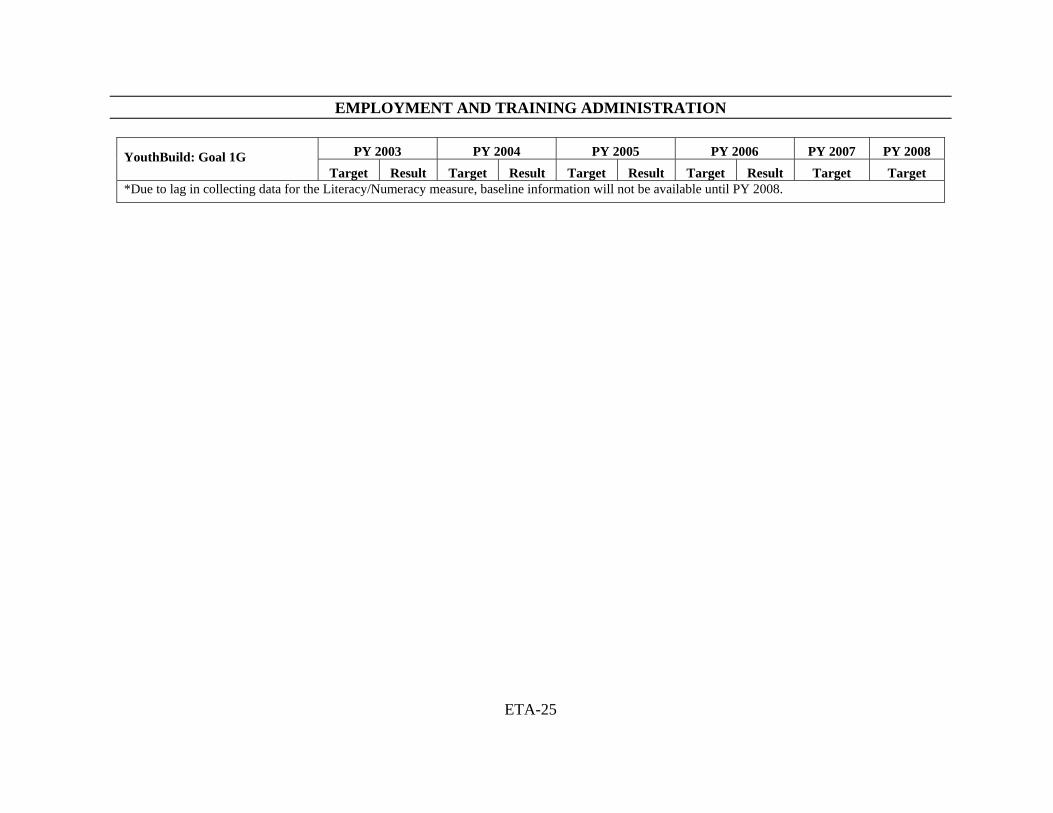
PY 2003 PY 2004 PY 2005 PY 2006 PY 2007 PY 2008 YouthBuild: Goal 1G Target Result Target Result Target Result Target Result Target Target *Due to lag in collecting data for the Literacy/Numeracy measure, baseline information will not be available until PY 2008.
EMPLOYMENT AND TRAINING ADMINISTRATION
ETA-26
PY 2003 PY 2004 PY 2005 PY 2006 PY 2007 PY 2008 Goal Not Achieved Goal Not Achieved
Goal Not Achieved
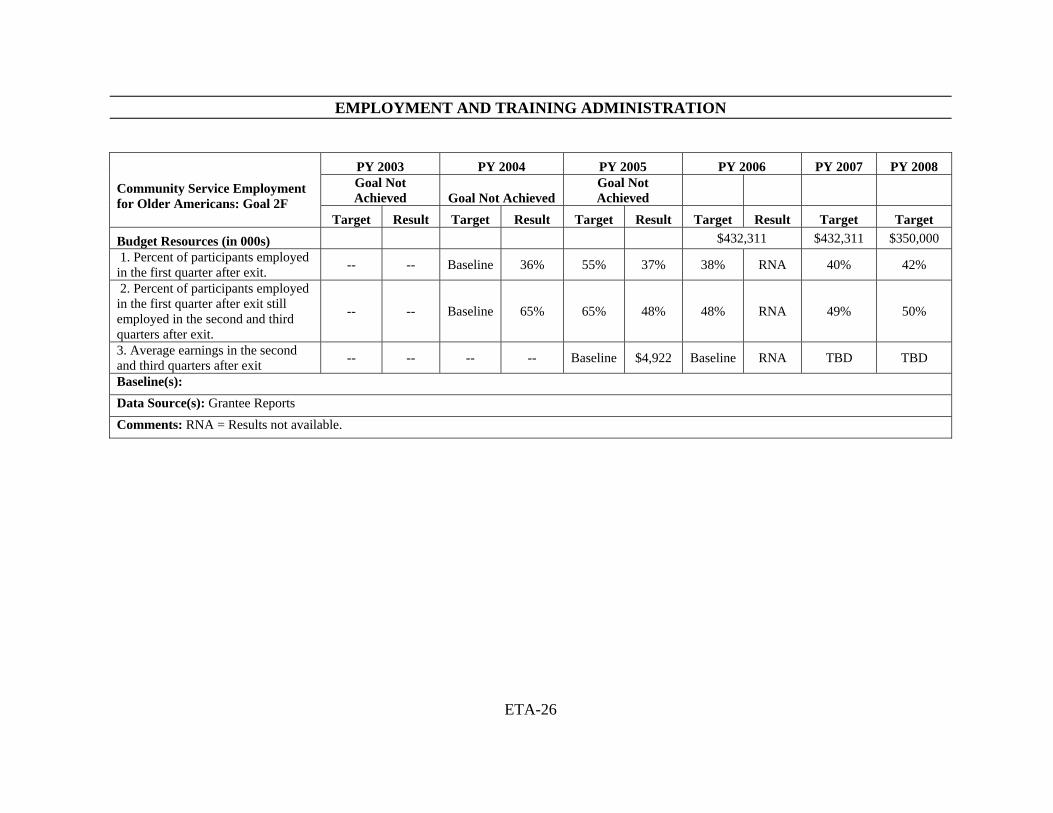
Community Service Employment for Older Americans: Goal 2F Target Result Target Result Target Result Target Result Target Target Budget Resources (in 000s) $432,311 $432,311 $350,000 1. Percent of participants employed in the first quarter after exit. -- -- Baseline 36% 55% 37% 38% RNA 40% 42%
2. Percent of participants employed in the first quarter after exit still employed in the second and third quarters after exit.
-- -- Baseline 65% 65% 48% 48% RNA 49% 50%
3. Average earnings in the second and third quarters after exit -- -- -- -- Baseline $4,922 Baseline RNA TBD TBD
Baseline(s): Data Source(s): Grantee Reports Comments: RNA = Results not available.
EMPLOYMENT AND TRAINING ADMINISTRATION
ETA-27
FY 2003 FY 2004 FY 2005 FY 2006 FY 2007 FY 2008
Goal Not Achieved Goal Not Achieved
Goal Substantially Achieved
Goal Not Achieved
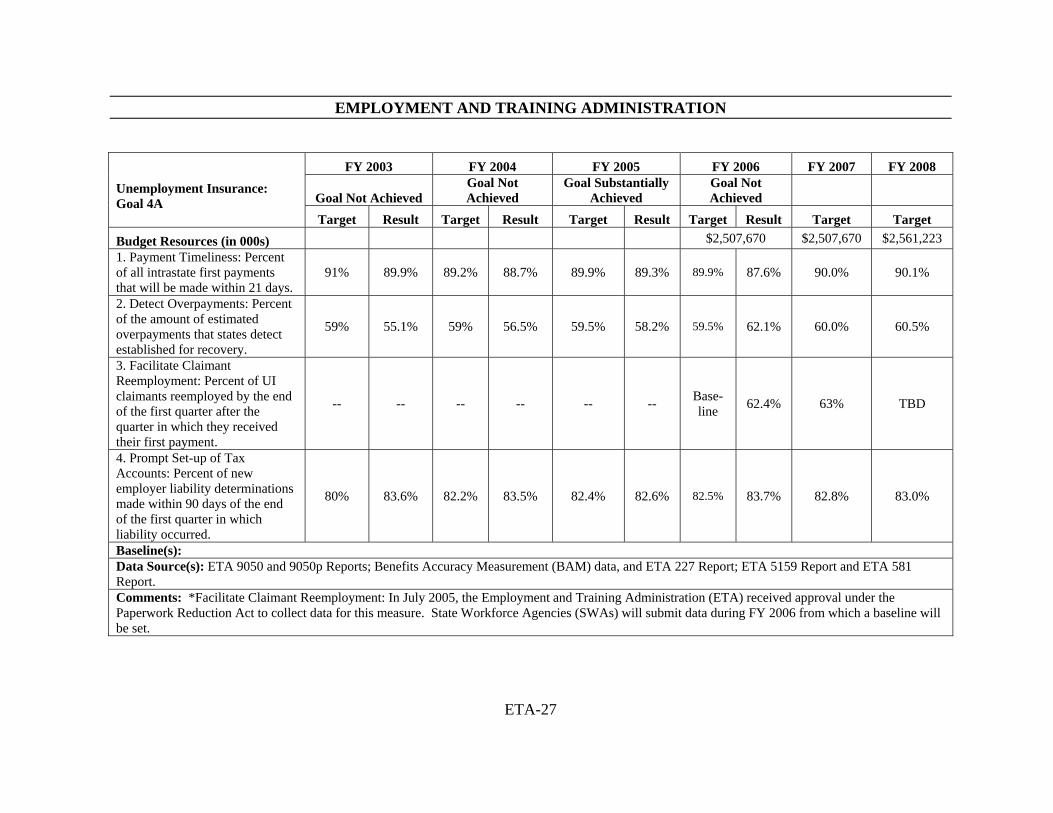
Unemployment Insurance: Goal 4A Target Result Target Result Target Result Target Result Target Target Budget Resources (in 000s) $2,507,670 $2,507,670 $2,561,223 1. Payment Timeliness: Percent of all intrastate first payments that will be made within 21 days.
91% 89.9% 89.2% 88.7% 89.9% 89.3% 89.9% 87.6% 90.0% 90.1%
2. Detect Overpayments: Percent of the amount of estimated overpayments that states detect established for recovery.
59% 55.1% 59% 56.5% 59.5% 58.2% 59.5% 62.1% 60.0% 60.5%
3. Facilitate Claimant Reemployment: Percent of UI claimants reemployed by the end of the first quarter after the quarter in which they received their first payment.
-- -- -- -- -- -- Base-line 62.4% 63% TBD
4. Prompt Set-up of Tax Accounts: Percent of new employer liability determinations made within 90 days of the end of the first quarter in which liability occurred.
80% 83.6% 82.2% 83.5% 82.4% 82.6% 82.5% 83.7% 82.8% 83.0%
Baseline(s): Data Source(s): ETA 9050 and 9050p Reports; Benefits Accuracy Measurement (BAM) data, and ETA 227 Report; ETA 5159 Report and ETA 581 Report. Comments: *Facilitate Claimant Reemployment: In July 2005, the Employment and Training Administration (ETA) received approval under the Paperwork Reduction Act to collect data for this measure. State Workforce Agencies (SWAs) will submit data during FY 2006 from which a baseline will be set.
EMPLOYMENT AND TRAINING ADMINISTRATION
ETA-28
PY 2003 PY 2004 PY 2005 PY 2006 PY 2007 PY 2008 Goal Achieved Goal Achieved Goal Achieved
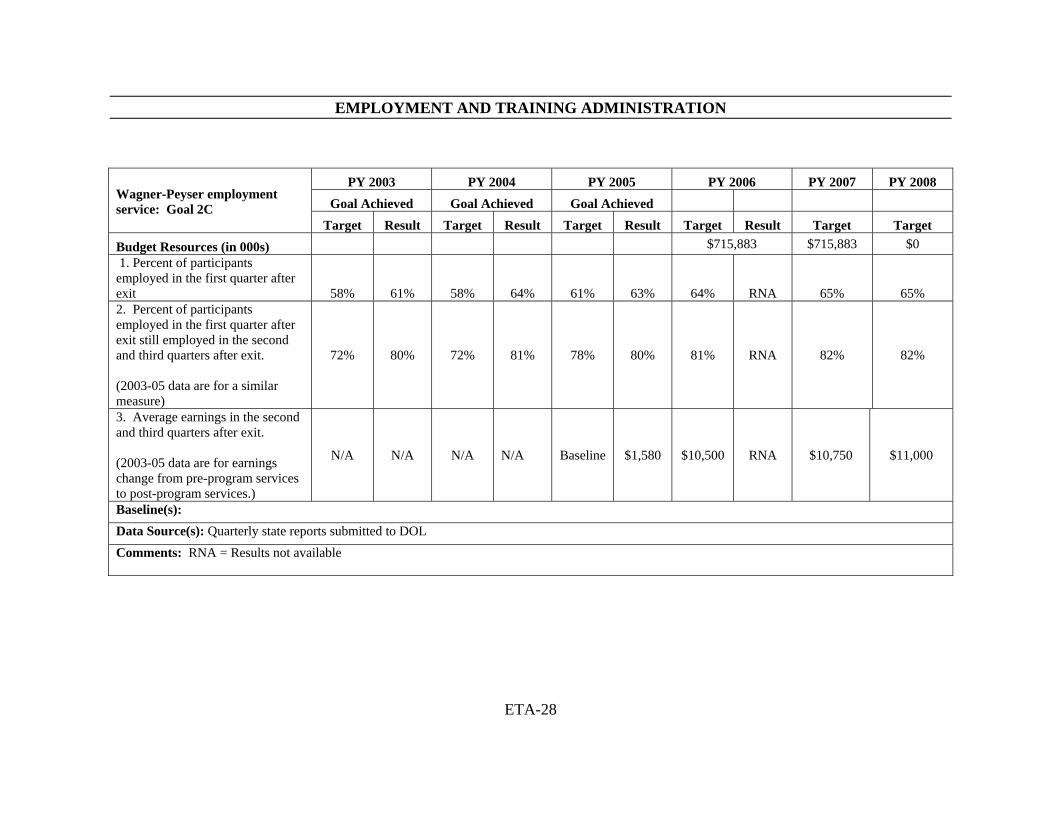
Wagner-Peyser employment service: Goal 2C Target Result Target Result Target Result Target Result Target Target Budget Resources (in 000s) $715,883 $715,883 $0 1. Percent of participants employed in the first quarter after exit 58% 61% 58% 64% 61% 63% 64% RNA 65% 65% 2. Percent of participants employed in the first quarter after exit still employed in the second and third quarters after exit. (2003-05 data are for a similar measure)
72% 80% 72% 81% 78% 80% 81% RNA 82% 82%
3. Average earnings in the second and third quarters after exit. (2003-05 data are for earnings change from pre-program services to post-program services.)
N/A N/A N/A N/A Baseline $1,580 $10,500 RNA $10,750 $11,000
Baseline(s): Data Source(s): Quarterly state reports submitted to DOL Comments: RNA = Results not available
EMPLOYMENT AND TRAINING ADMINISTRATION
ETA-29
FY 2003 FY 2004 FY 2005 FY 2006 FY 2007 FY 2008
N/A Goal Not Achieved
Goal Not Achieved Goal Not Achieved
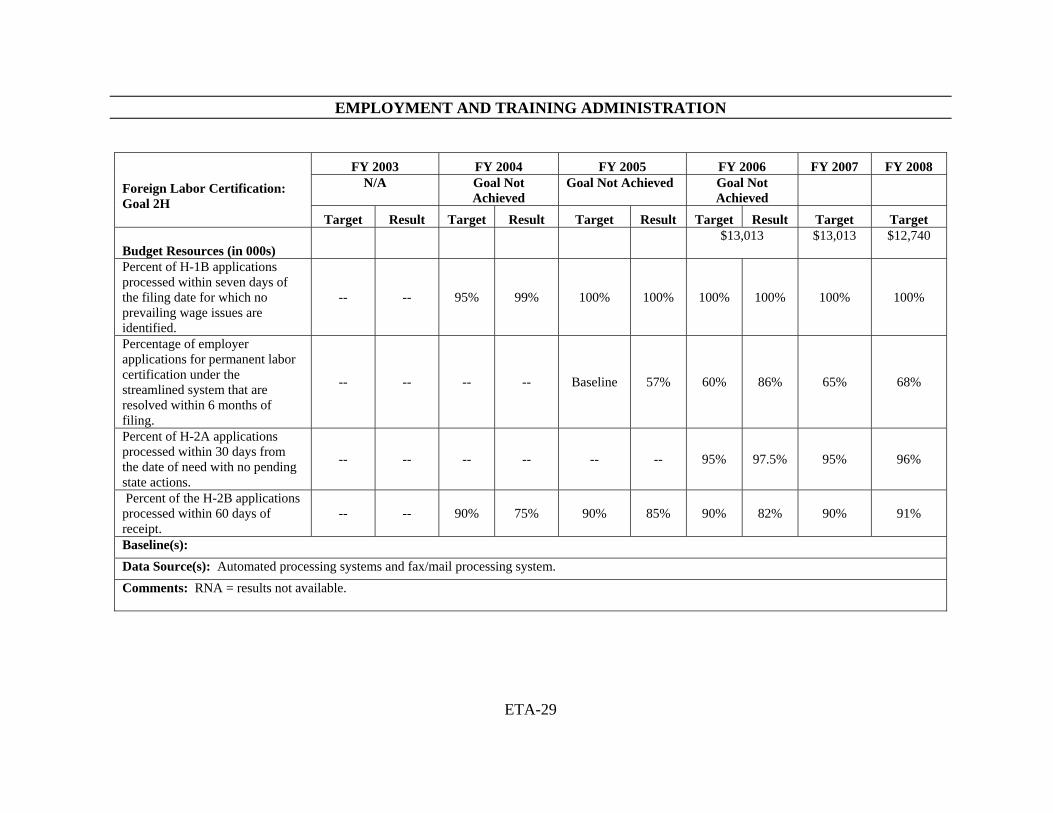
Foreign Labor Certification: Goal 2H Target Result Target Result Target Result Target Result Target Target
Budget Resources (in 000s) $13,013
$13,013
$12,740
Percent of H-1B applications processed within seven days of the filing date for which no prevailing wage issues are identified.
-- -- 95% 99% 100% 100% 100% 100% 100% 100%
Percentage of employer applications for permanent labor certification under the streamlined system that are resolved within 6 months of filing.
-- -- -- -- Baseline 57% 60% 86% 65% 68%
Percent of H-2A applications processed within 30 days from the date of need with no pending state actions.
-- -- -- -- -- -- 95% 97.5% 95% 96%
Percent of the H-2B applications processed within 60 days of receipt.
-- -- 90% 75% 90% 85% 90% 82% 90% 91%
Baseline(s): Data Source(s): Automated processing systems and fax/mail processing system. Comments: RNA = results not available.
EMPLOYMENT AND TRAINING ADMINISTRATION
ETA-30
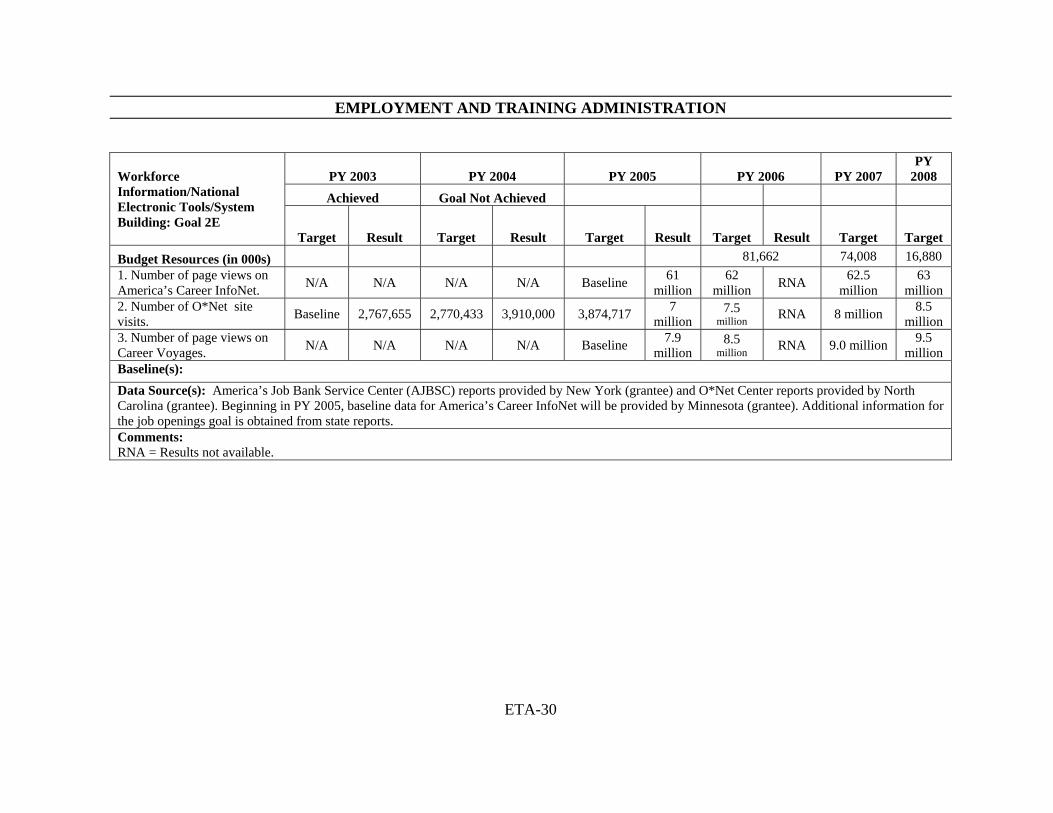
PY 2003 PY 2004 PY 2005 PY 2006 PY 2007 PY
2008 Achieved Goal Not Achieved
Workforce Information/National Electronic Tools/System Building: Goal 2E Target Result Target Result Target Result Target Result Target Target Budget Resources (in 000s) 81,662 74,008 16,880 1. Number of page views on America’s Career InfoNet. N/A N/A N/A N/A Baseline 61
million 62
million RNA 62.5 million
63 million
2. Number of O*Net site visits. Baseline 2,767,655 2,770,433 3,910,000 3,874,717 7
million 7.5
million RNA 8 million 8.5 million
3. Number of page views on Career Voyages. N/A N/A N/A N/A Baseline 7.9
million 8.5
million RNA 9.0 million 9.5 million
Baseline(s): Data Source(s): America’s Job Bank Service Center (AJBSC) reports provided by New York (grantee) and O*Net Center reports provided by North Carolina (grantee). Beginning in PY 2005, baseline data for America’s Career InfoNet will be provided by Minnesota (grantee). Additional information for the job openings goal is obtained from state reports. Comments: RNA = Results not available.
EMPLOYMENT AND TRAINING ADMINISTRATION
ETA-31
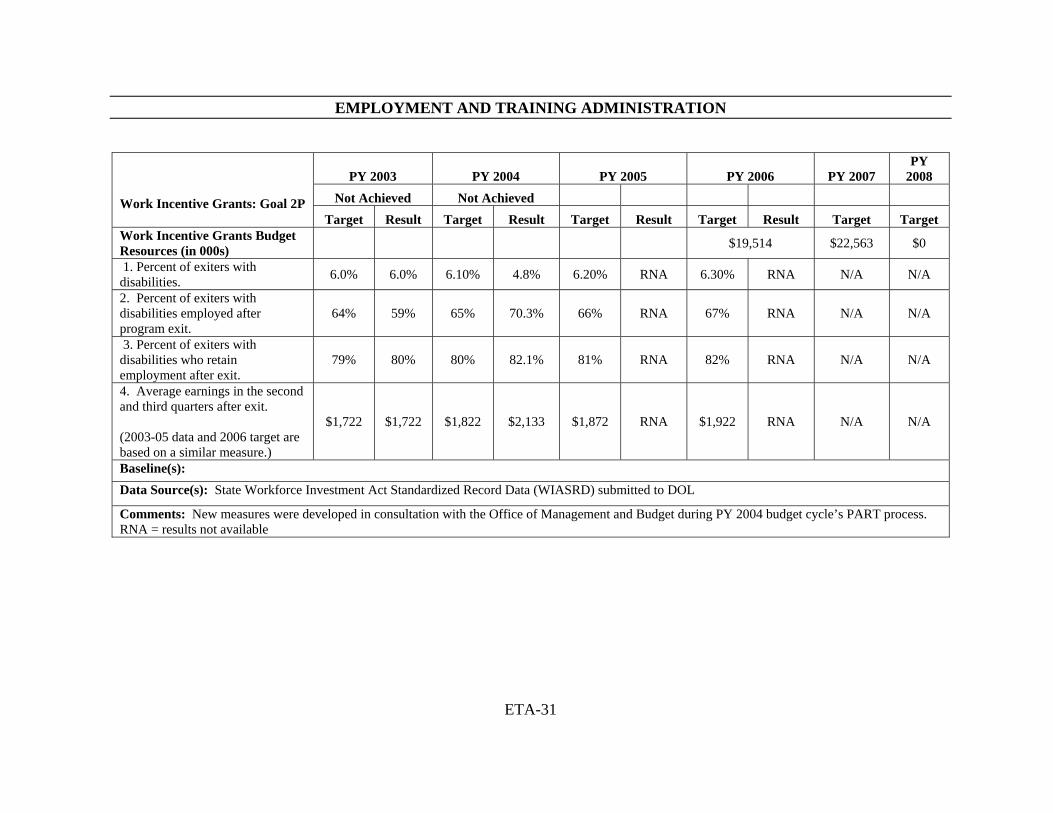
PY 2003 PY 2004 PY 2005 PY 2006 PY 2007 PY
2008 Not Achieved Not Achieved Work Incentive Grants: Goal 2P
Target Result Target Result Target Result Target Result Target Target Work Incentive Grants Budget Resources (in 000s) $19,514 $22,563 $0
1. Percent of exiters with disabilities. 6.0% 6.0% 6.10% 4.8% 6.20% RNA 6.30% RNA N/A N/A
2. Percent of exiters with disabilities employed after program exit.
64% 59% 65% 70.3% 66% RNA 67% RNA N/A N/A
3. Percent of exiters with disabilities who retain employment after exit.
79% 80% 80% 82.1% 81% RNA 82% RNA N/A N/A
4. Average earnings in the second and third quarters after exit. (2003-05 data and 2006 target are based on a similar measure.)
$1,722 $1,722 $1,822 $2,133 $1,872 RNA $1,922 RNA N/A N/A
Baseline(s): Data Source(s): State Workforce Investment Act Standardized Record Data (WIASRD) submitted to DOL
Comments: New measures were developed in consultation with the Office of Management and Budget during PY 2004 budget cycle’s PART process. RNA = results not available
EMPLOYMENT AND TRAINING ADMINISTRATION
ETA-32
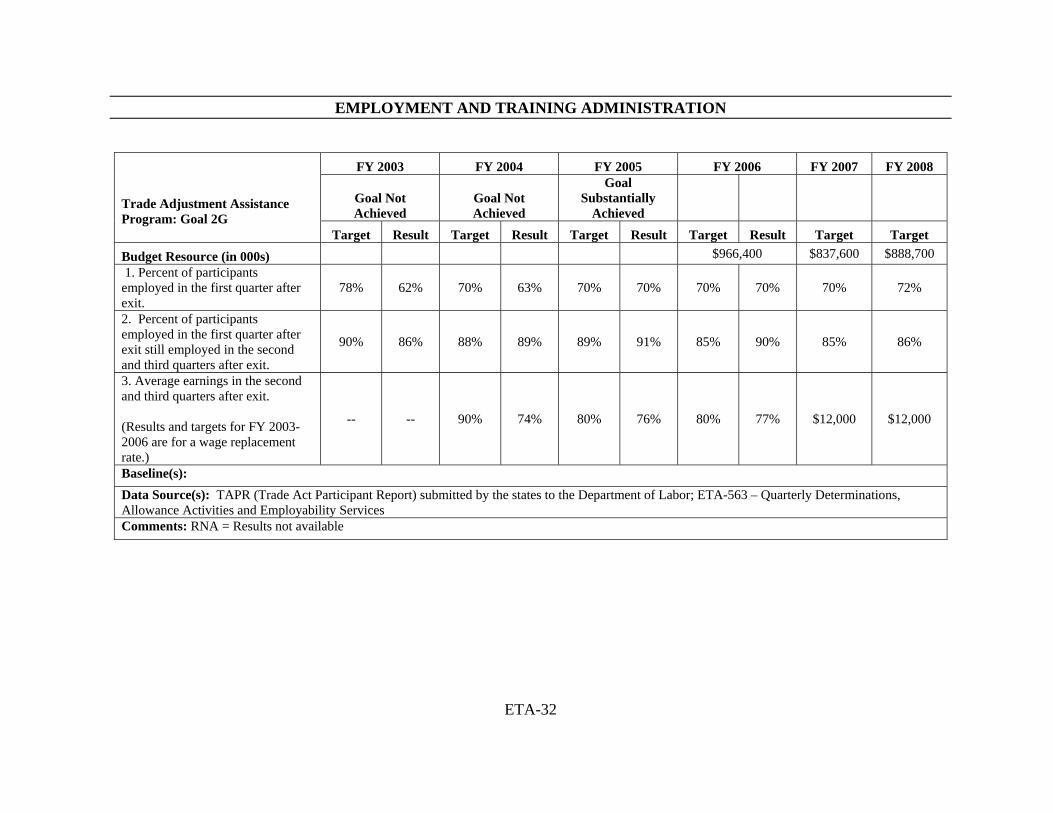
FY 2003 FY 2004 FY 2005 FY 2006 FY 2007 FY 2008
Goal Not Achieved
Goal Not Achieved
Goal Substantially
Achieved Trade Adjustment Assistance Program: Goal 2G Target Result Target Result Target Result Target Result Target Target Budget Resource (in 000s) $966,400 $837,600 $888,700 1. Percent of participants employed in the first quarter after exit.
78% 62% 70% 63% 70% 70% 70% 70% 70% 72%
2. Percent of participants employed in the first quarter after exit still employed in the second and third quarters after exit.
90% 86% 88% 89% 89% 91% 85% 90% 85% 86%
3. Average earnings in the second and third quarters after exit. (Results and targets for FY 2003-2006 are for a wage replacement rate.)
-- -- 90% 74% 80% 76% 80% 77% $12,000 $12,000
Baseline(s): Data Source(s): TAPR (Trade Act Participant Report) submitted by the states to the Department of Labor; ETA-563 – Quarterly Determinations, Allowance Activities and Employability Services Comments: RNA = Results not available
EMPLOYMENT AND TRAINING ADMINISTRATION
ETA-33
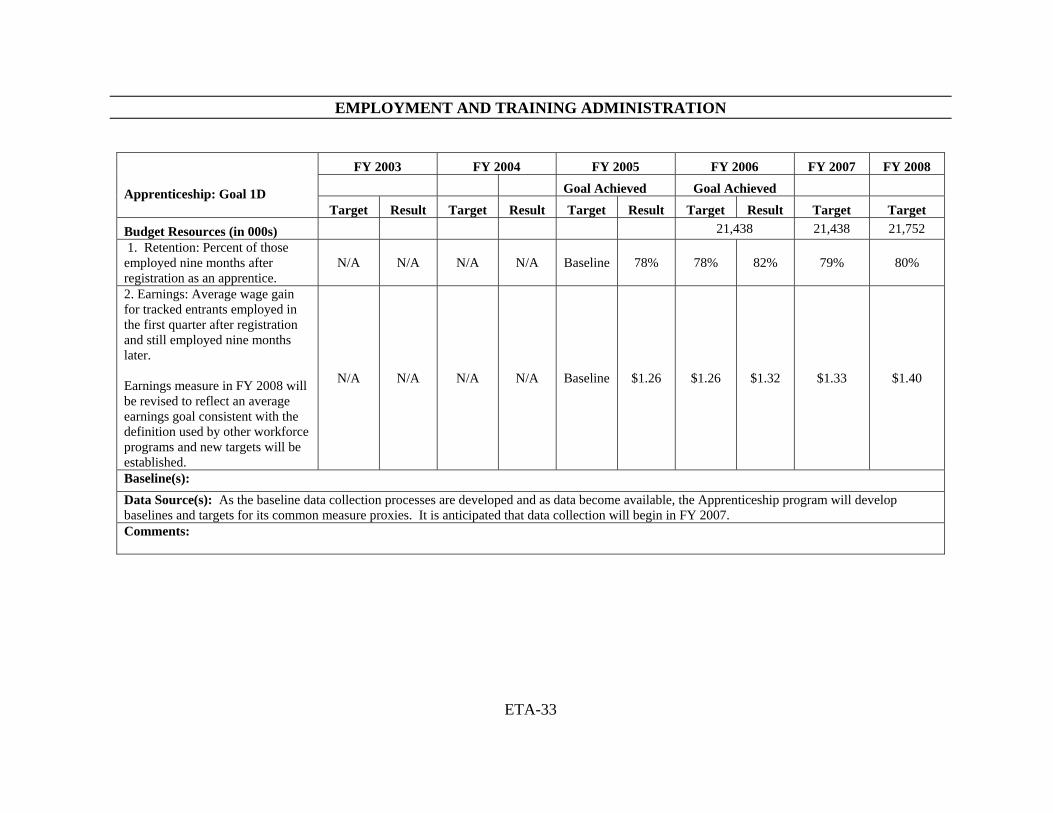
FY 2003 FY 2004 FY 2005 FY 2006 FY 2007 FY 2008
Goal Achieved Goal Achieved Apprenticeship: Goal 1D Target Result Target Result Target Result Target Result Target Target Budget Resources (in 000s) 21,438 21,438 21,752 1. Retention: Percent of those employed nine months after registration as an apprentice.
N/A N/A N/A N/A Baseline 78% 78% 82% 79% 80%
2. Earnings: Average wage gain for tracked entrants employed in the first quarter after registration and still employed nine months later. Earnings measure in FY 2008 will be revised to reflect an average earnings goal consistent with the definition used by other workforce programs and new targets will be established.
N/A N/A N/A N/A Baseline $1.26 $1.26 $1.32 $1.33 $1.40
Baseline(s): Data Source(s): As the baseline data collection processes are developed and as data become available, the Apprenticeship program will develop baselines and targets for its common measure proxies. It is anticipated that data collection will begin in FY 2007. Comments:
EMPLOYMENT AND TRAINING ADMINISTRATION
ETA-34
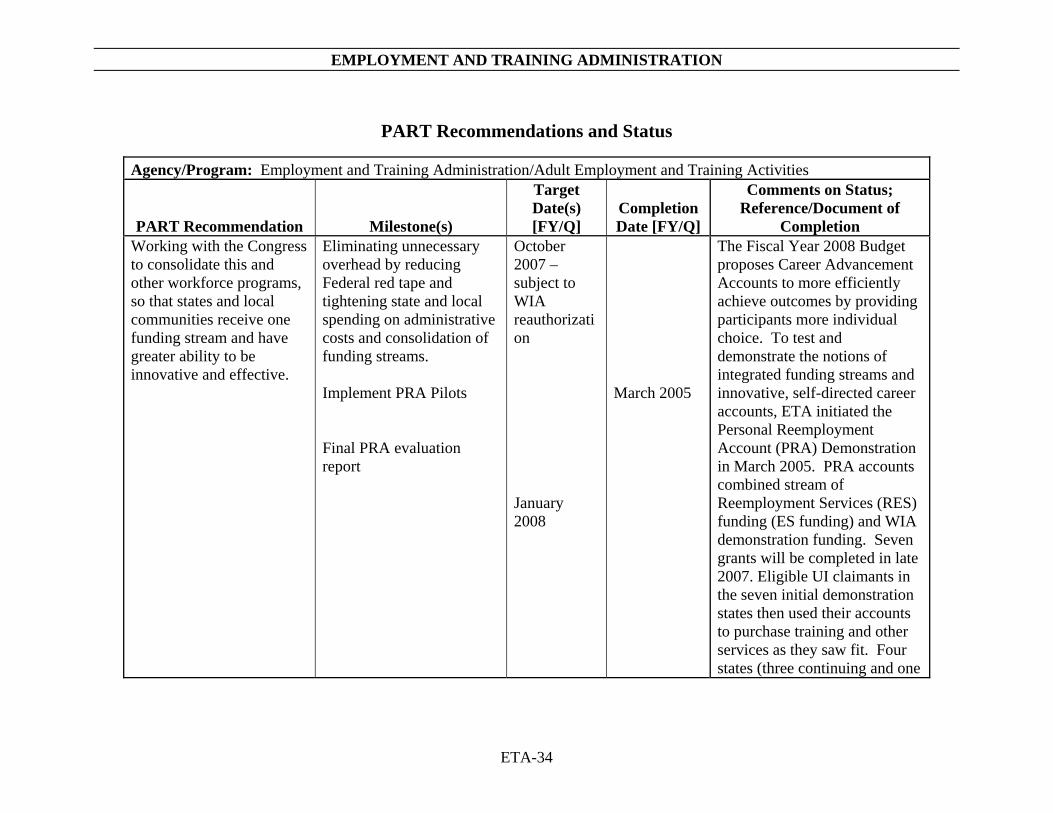
PART Recommendations and Status
Agency/Program: Employment and Training Administration/Adult Employment and Training Activities
PART Recommendation Milestone(s)
Target Date(s) [FY/Q]
Completion Date [FY/Q]
Comments on Status; Reference/Document of
Completion Working with the Congress to consolidate this and other workforce programs, so that states and local communities receive one funding stream and have greater ability to be innovative and effective.
Eliminating unnecessary overhead by reducing Federal red tape and tightening state and local spending on administrative costs and consolidation of funding streams. Implement PRA Pilots Final PRA evaluation report
October 2007 – subject to WIA reauthorization January 2008
March 2005
The Fiscal Year 2008 Budget proposes Career Advancement Accounts to more efficiently achieve outcomes by providing participants more individual choice. To test and demonstrate the notions of integrated funding streams and innovative, self-directed career accounts, ETA initiated the Personal Reemployment Account (PRA) Demonstration in March 2005. PRA accounts combined stream of Reemployment Services (RES) funding (ES funding) and WIA demonstration funding. Seven grants will be completed in late 2007. Eligible UI claimants in the seven initial demonstration states then used their accounts to purchase training and other services as they saw fit. Four states (three continuing and one

EMPLOYMENT AND TRAINING ADMINISTRATION
ETA-35
Agency/Program: Employment and Training Administration/Adult Employment and Training Activities
PART Recommendation Milestone(s)
Target Date(s) [FY/Q]
Completion Date [FY/Q]
Comments on Status; Reference/Document of
Completion new) will continue the PRA Demonstration with additional PY 2005 RES and WIA demonstration funding.
Eliminating unnecessary overhead by reducing Federal red tape and tightening state and local spending on administrative costs.
Strengthening performance measurement and the accountability of Federal managers and states to meet performance targets.
PY 2005 October 2007 – subject to WIA reauthorization
PY 2005
The Administration continues to support a stricter definition of what constitutes allowable administrative costs. This is supported in WIA reauthorization legislation. Additionally, the FY 2008 Budget proposed Career Advancement Accounts would reduce administrative overhead by directing more funds toward training. This proposal is contingent on legislative action.
Strengthening performance measurement and the accountability of Federal managers and states to meet performance targets.
Implement Common Measures WISPR federal register notice for public comment.
PY 2005 November 2006
ETA has received initial results on the Common Measures for the Adult program. In PY 2005, state reporting systems were restructured to accommodate Common Measures. ETA is in the process of
EMPLOYMENT AND TRAINING ADMINISTRATION
ETA-36
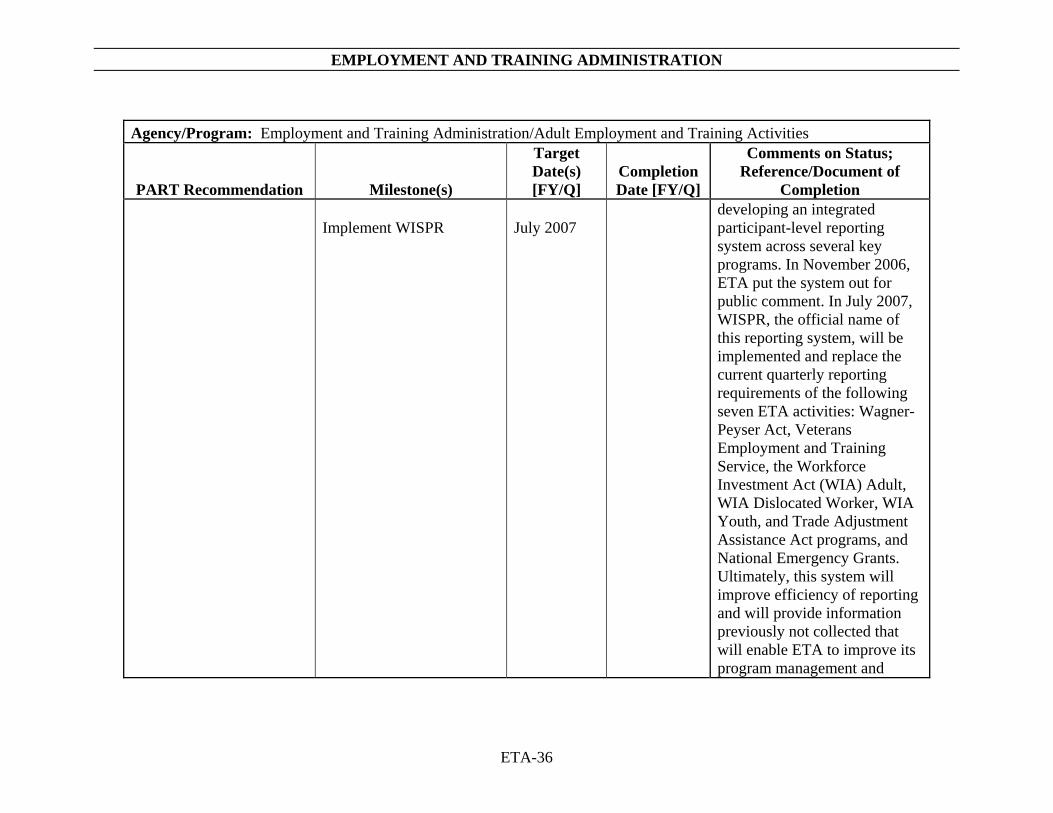
Agency/Program: Employment and Training Administration/Adult Employment and Training Activities
PART Recommendation Milestone(s)
Target Date(s) [FY/Q]
Completion Date [FY/Q]
Comments on Status; Reference/Document of
Completion Implement WISPR
July 2007
developing an integrated participant-level reporting system across several key programs. In November 2006, ETA put the system out for public comment. In July 2007, WISPR, the official name of this reporting system, will be implemented and replace the current quarterly reporting requirements of the following seven ETA activities: Wagner- Peyser Act, Veterans Employment and Training Service, the Workforce Investment Act (WIA) Adult, WIA Dislocated Worker, WIA Youth, and Trade Adjustment Assistance Act programs, and National Emergency Grants. Ultimately, this system will improve efficiency of reporting and will provide information previously not collected that will enable ETA to improve its program management and
EMPLOYMENT AND TRAINING ADMINISTRATION
ETA-37
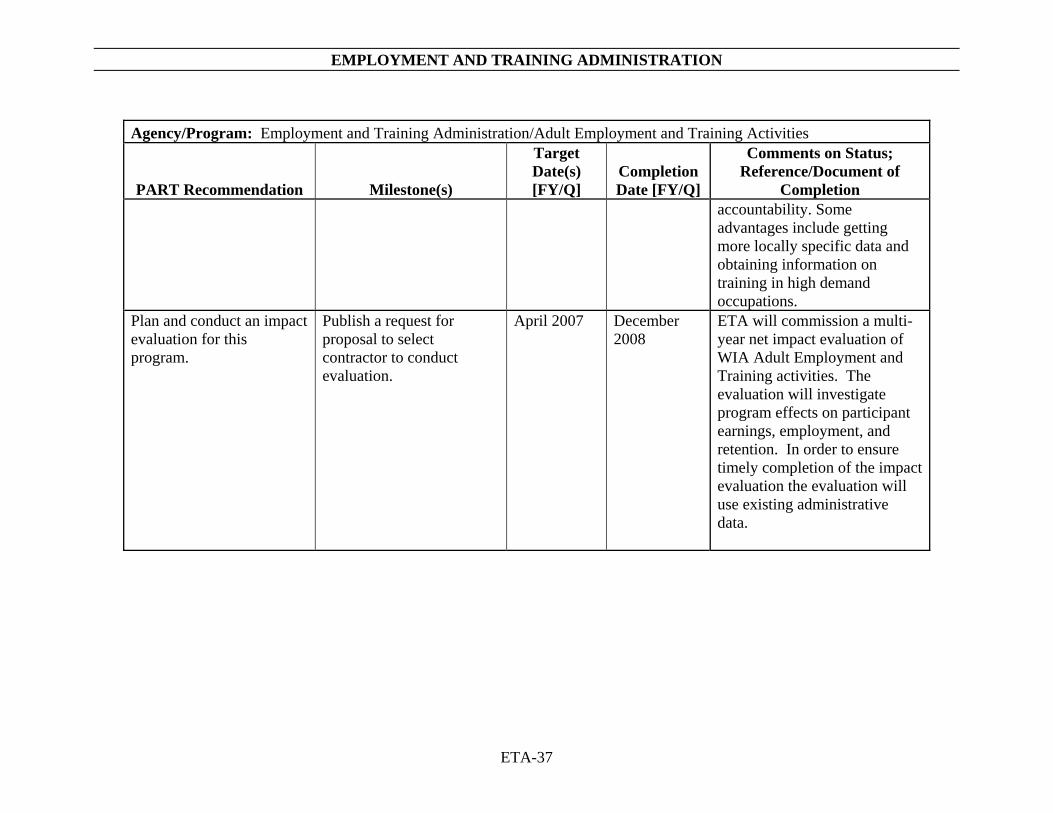
Agency/Program: Employment and Training Administration/Adult Employment and Training Activities
PART Recommendation Milestone(s)
Target Date(s) [FY/Q]
Completion Date [FY/Q]
Comments on Status; Reference/Document of
Completion accountability. Some advantages include getting more locally specific data and obtaining information on training in high demand occupations.
Plan and conduct an impact evaluation for this program.
Publish a request for proposal to select contractor to conduct evaluation.
April 2007 December 2008
ETA will commission a multi-year net impact evaluation of WIA Adult Employment and Training activities. The evaluation will investigate program effects on participant earnings, employment, and retention. In order to ensure timely completion of the impact evaluation the evaluation will use existing administrative data.
EMPLOYMENT AND TRAINING ADMINISTRATION
ETA-38
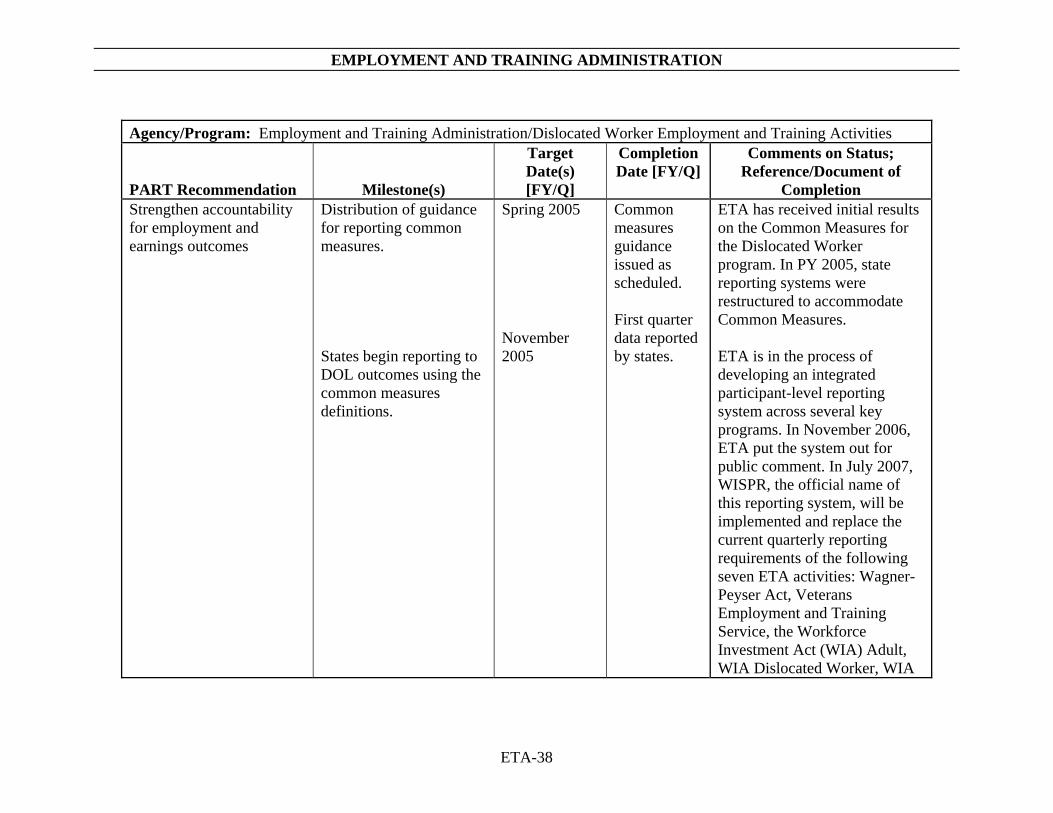
Agency/Program: Employment and Training Administration/Dislocated Worker Employment and Training Activities
PART Recommendation Milestone(s)
Target Date(s) [FY/Q]
Completion Date [FY/Q]
Comments on Status; Reference/Document of
Completion Strengthen accountability for employment and earnings outcomes
Distribution of guidance for reporting common measures. States begin reporting to DOL outcomes using the common measures definitions.
Spring 2005 November 2005
Common measures guidance issued as scheduled. First quarter data reported by states.
ETA has received initial results on the Common Measures for the Dislocated Worker program. In PY 2005, state reporting systems were restructured to accommodate Common Measures. ETA is in the process of developing an integrated participant-level reporting system across several key programs. In November 2006, ETA put the system out for public comment. In July 2007, WISPR, the official name of this reporting system, will be implemented and replace the current quarterly reporting requirements of the following seven ETA activities: Wagner-Peyser Act, Veterans Employment and Training Service, the Workforce Investment Act (WIA) Adult, WIA Dislocated Worker, WIA
EMPLOYMENT AND TRAINING ADMINISTRATION
ETA-39
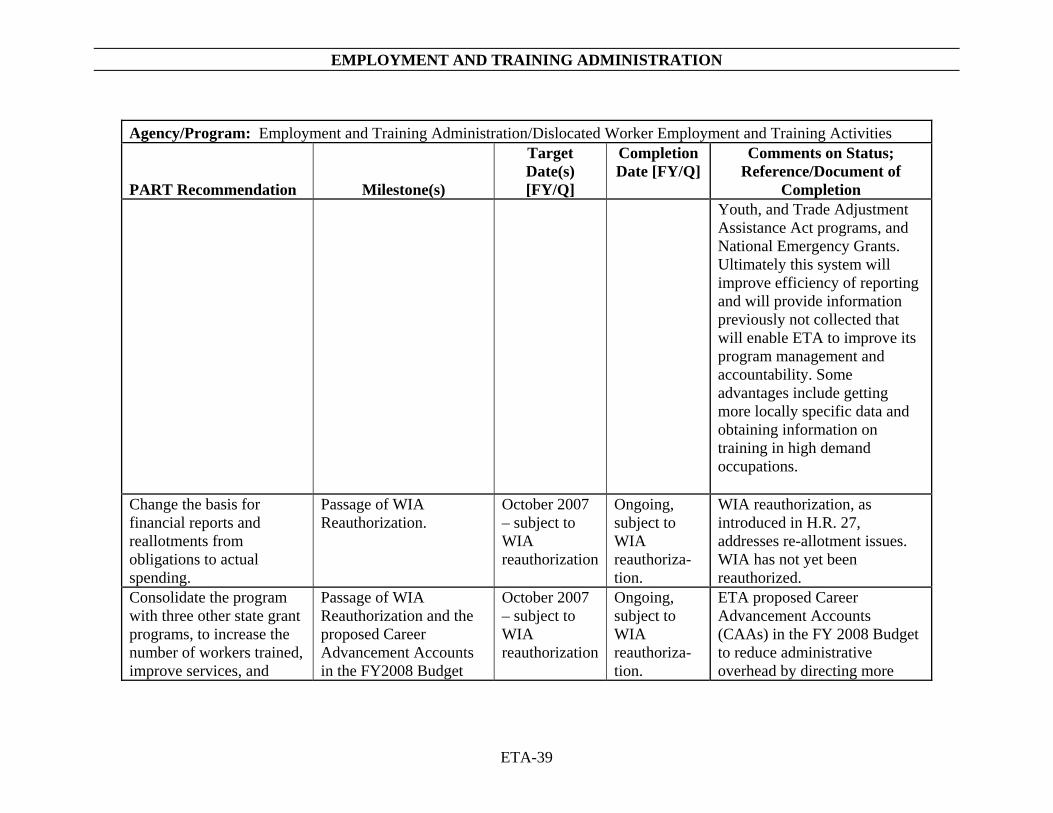
Agency/Program: Employment and Training Administration/Dislocated Worker Employment and Training Activities
PART Recommendation Milestone(s)
Target Date(s) [FY/Q]
Completion Date [FY/Q]
Comments on Status; Reference/Document of
Completion Youth, and Trade Adjustment Assistance Act programs, and National Emergency Grants. Ultimately this system will improve efficiency of reporting and will provide information previously not collected that will enable ETA to improve its program management and accountability. Some advantages include getting more locally specific data and obtaining information on training in high demand occupations.
Change the basis for financial reports and reallotments from obligations to actual spending.
Passage of WIA Reauthorization.
October 2007 – subject to WIA reauthorization
Ongoing, subject to WIA reauthoriza-tion.
WIA reauthorization, as introduced in H.R. 27, addresses re-allotment issues. WIA has not yet been reauthorized.
Consolidate the program with three other state grant programs, to increase the number of workers trained, improve services, and
Passage of WIA Reauthorization and the proposed Career Advancement Accounts in the FY2008 Budget
October 2007 – subject to WIA reauthorization
Ongoing, subject to WIA reauthoriza-tion.
ETA proposed Career Advancement Accounts (CAAs) in the FY 2008 Budget to reduce administrative overhead by directing more
EMPLOYMENT AND TRAINING ADMINISTRATION
ETA-40
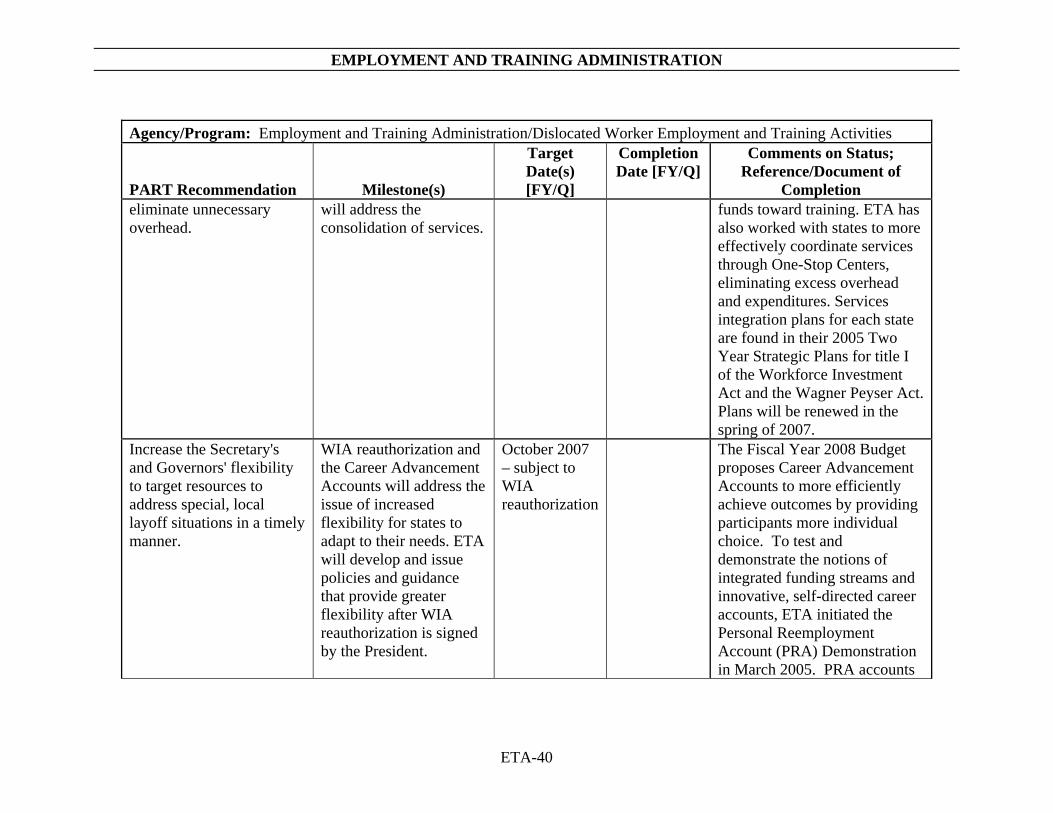
Agency/Program: Employment and Training Administration/Dislocated Worker Employment and Training Activities
PART Recommendation Milestone(s)
Target Date(s) [FY/Q]
Completion Date [FY/Q]
Comments on Status; Reference/Document of
Completion eliminate unnecessary overhead.
will address the consolidation of services.
funds toward training. ETA has also worked with states to more effectively coordinate services through One-Stop Centers, eliminating excess overhead and expenditures. Services integration plans for each state are found in their 2005 Two Year Strategic Plans for title I of the Workforce Investment Act and the Wagner Peyser Act. Plans will be renewed in the spring of 2007.
Increase the Secretary's and Governors' flexibility to target resources to address special, local layoff situations in a timely manner.
WIA reauthorization and the Career Advancement Accounts will address the issue of increased flexibility for states to adapt to their needs. ETA will develop and issue policies and guidance that provide greater flexibility after WIA reauthorization is signed by the President.
October 2007 – subject to WIA reauthorization
The Fiscal Year 2008 Budget proposes Career Advancement Accounts to more efficiently achieve outcomes by providing participants more individual choice. To test and demonstrate the notions of integrated funding streams and innovative, self-directed career accounts, ETA initiated the Personal Reemployment Account (PRA) Demonstration in March 2005. PRA accounts
EMPLOYMENT AND TRAINING ADMINISTRATION
ETA-41
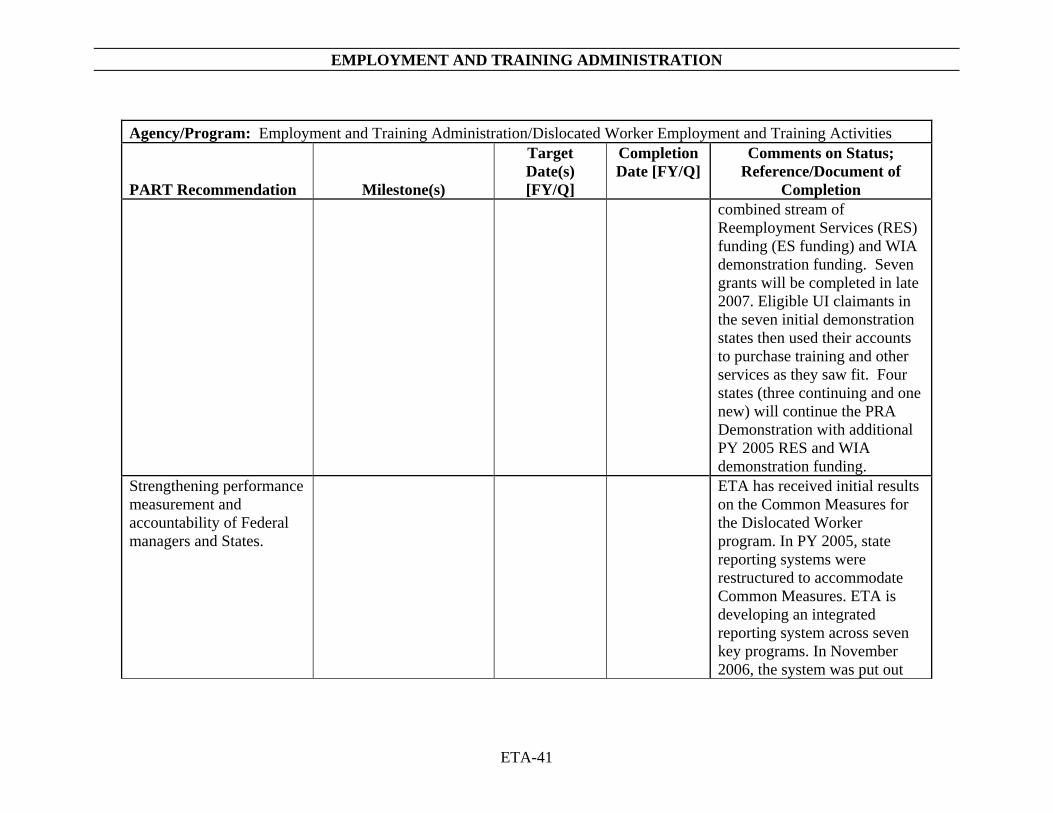
Agency/Program: Employment and Training Administration/Dislocated Worker Employment and Training Activities
PART Recommendation Milestone(s)
Target Date(s) [FY/Q]
Completion Date [FY/Q]
Comments on Status; Reference/Document of
Completion combined stream of Reemployment Services (RES) funding (ES funding) and WIA demonstration funding. Seven grants will be completed in late 2007. Eligible UI claimants in the seven initial demonstration states then used their accounts to purchase training and other services as they saw fit. Four states (three continuing and one new) will continue the PRA Demonstration with additional PY 2005 RES and WIA demonstration funding.
Strengthening performance measurement and accountability of Federal managers and States.
ETA has received initial results on the Common Measures for the Dislocated Worker program. In PY 2005, state reporting systems were restructured to accommodate Common Measures. ETA is developing an integrated reporting system across seven key programs. In November 2006, the system was put out
EMPLOYMENT AND TRAINING ADMINISTRATION
ETA-42
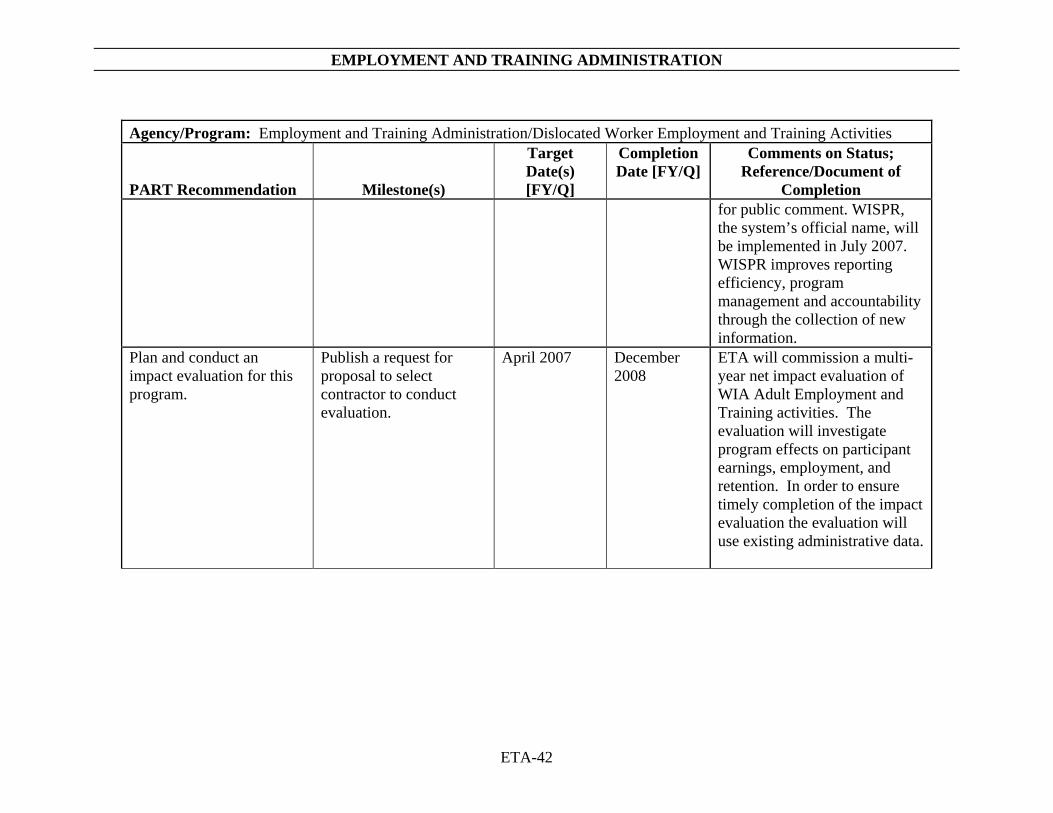
Agency/Program: Employment and Training Administration/Dislocated Worker Employment and Training Activities
PART Recommendation Milestone(s)
Target Date(s) [FY/Q]
Completion Date [FY/Q]
Comments on Status; Reference/Document of
Completion for public comment. WISPR, the system’s official name, will be implemented in July 2007. WISPR improves reporting efficiency, program management and accountability through the collection of new information.
Plan and conduct an impact evaluation for this program.
Publish a request for proposal to select contractor to conduct evaluation.
April 2007 December 2008
ETA will commission a multi-year net impact evaluation of WIA Adult Employment and Training activities. The evaluation will investigate program effects on participant earnings, employment, and retention. In order to ensure timely completion of the impact evaluation the evaluation will use existing administrative data.
EMPLOYMENT AND TRAINING ADMINISTRATION
ETA-43
Agency/Program: Employment and Training Administration/Youth Services
PART Recommendation Milestone(s)
Target Date(s) [FY/Q]
Completion Date [FY/Q]
Comments on Status; Reference/Document of
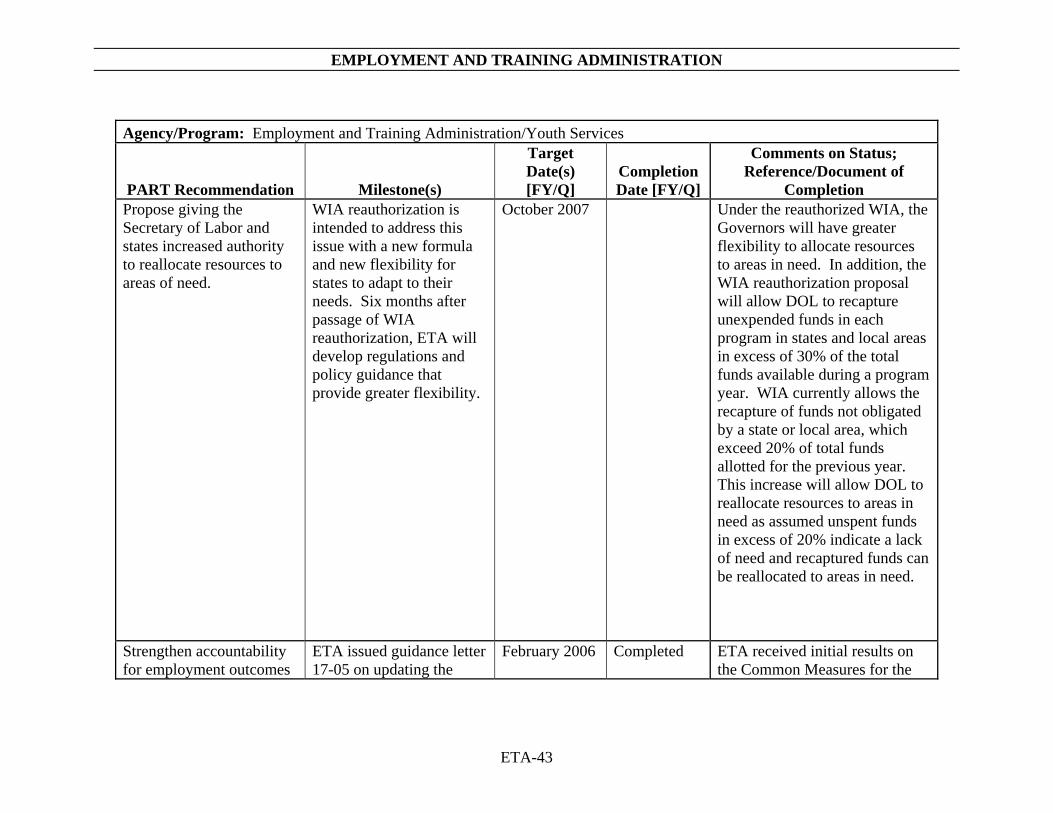
Completion Propose giving the Secretary of Labor and states increased authority to reallocate resources to areas of need.
WIA reauthorization is intended to address this issue with a new formula and new flexibility for states to adapt to their needs. Six months after passage of WIA reauthorization, ETA will develop regulations and policy guidance that provide greater flexibility.
October 2007 Under the reauthorized WIA, the Governors will have greater flexibility to allocate resources to areas in need. In addition, the WIA reauthorization proposal will allow DOL to recapture unexpended funds in each program in states and local areas in excess of 30% of the total funds available during a program year. WIA currently allows the recapture of funds not obligated by a state or local area, which exceed 20% of total funds allotted for the previous year. This increase will allow DOL to reallocate resources to areas in need as assumed unspent funds in excess of 20% indicate a lack of need and recaptured funds can be reallocated to areas in need.
Strengthen accountability for employment outcomes
ETA issued guidance letter 17-05 on updating the
February 2006
Completed
ETA received initial results on the Common Measures for the

EMPLOYMENT AND TRAINING ADMINISTRATION
ETA-44
Agency/Program: Employment and Training Administration/Youth Services
PART Recommendation Milestone(s)
Target Date(s) [FY/Q]
Completion Date [FY/Q]
Comments on Status; Reference/Document of
Completion and skill attainment by adopting common performance measures and targets to allow for comparisons with other federal job training programs.
policy for Common Measures. States begin reporting to DOL the outcomes of using the common measures. WISPR reporting system in federal register Implement WISPR
November 2005 November 2006 July 2007
Completed – and ongoing for future reports
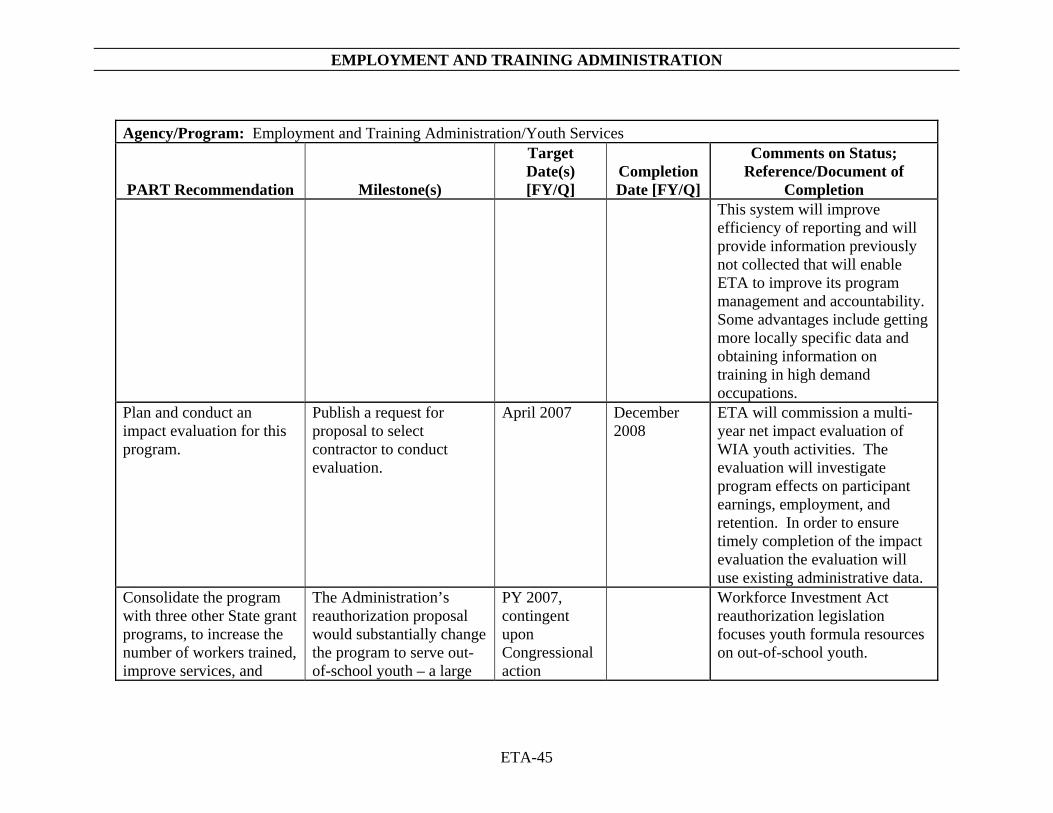
Youth program. The literacy/ numeracy common measure will be implemented this year (PY 2006). ETA is in the process of developing an integrated participant-level reporting system across several key programs. In November 2006, ETA put the system out for public comment. In July 2007, WISPR, the official name of this reporting system, will be implemented and replace the current quarterly reporting requirements of the following seven ETA activities: Wagner-Peyser Act, Veterans Employment and Training Service, the Workforce Investment Act (WIA) Adult, WIA Dislocated Worker, WIA Youth, and Trade Adjustment Assistance Act programs, and National Emergency Grants.
EMPLOYMENT AND TRAINING ADMINISTRATION
ETA-45
Agency/Program: Employment and Training Administration/Youth Services
PART Recommendation Milestone(s)
Target Date(s) [FY/Q]
Completion Date [FY/Q]
Comments on Status; Reference/Document of
Completion This system will improve efficiency of reporting and will provide information previously not collected that will enable ETA to improve its program management and accountability. Some advantages include getting more locally specific data and obtaining information on training in high demand occupations.
Plan and conduct an impact evaluation for this program.
Publish a request for proposal to select contractor to conduct evaluation.
April 2007 December 2008
ETA will commission a multi-year net impact evaluation of WIA youth activities. The evaluation will investigate program effects on participant earnings, employment, and retention. In order to ensure timely completion of the impact evaluation the evaluation will use existing administrative data.
Consolidate the program with three other State grant programs, to increase the number of workers trained, improve services, and
The Administration’s reauthorization proposal would substantially change the program to serve out-of-school youth – a large
PY 2007, contingent upon Congressional action
Workforce Investment Act reauthorization legislation focuses youth formula resources on out-of-school youth.
EMPLOYMENT AND TRAINING ADMINISTRATION
ETA-46
Agency/Program: Employment and Training Administration/Youth Services
PART Recommendation Milestone(s)
Target Date(s) [FY/Q]
Completion Date [FY/Q]
Comments on Status; Reference/Document of
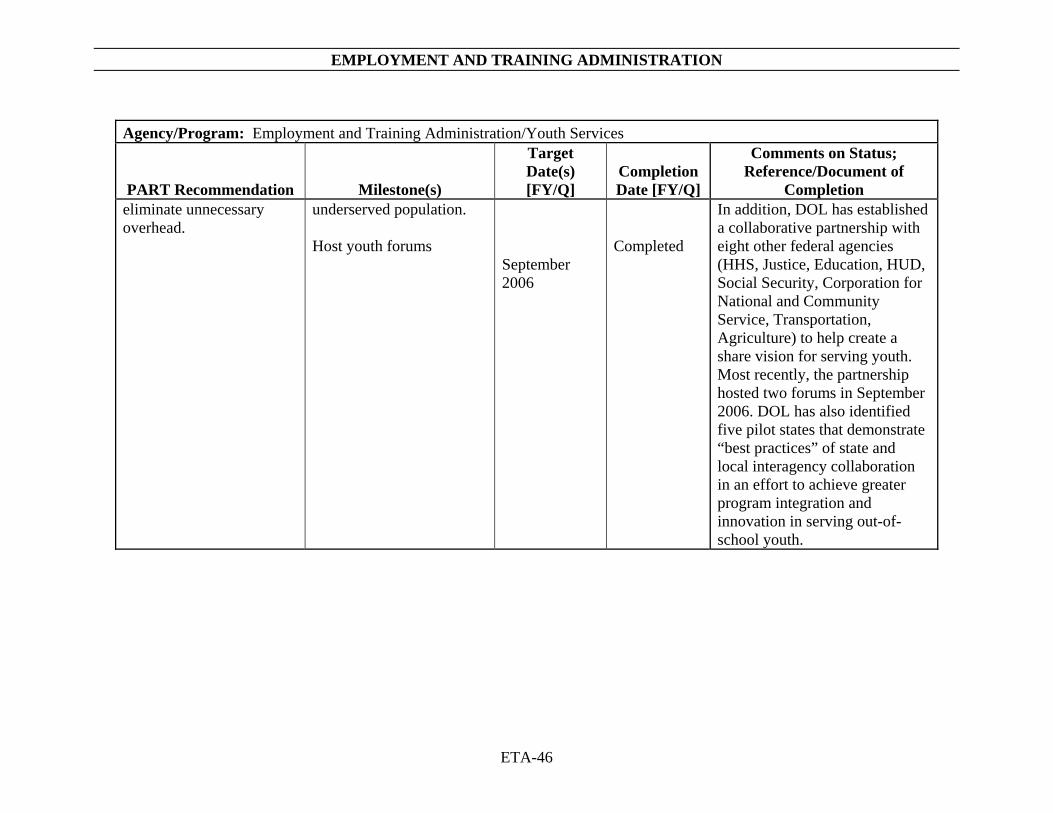
Completion eliminate unnecessary overhead.
underserved population. Host youth forums
September 2006
Completed
In addition, DOL has established a collaborative partnership with eight other federal agencies (HHS, Justice, Education, HUD, Social Security, Corporation for National and Community Service, Transportation, Agriculture) to help create a share vision for serving youth. Most recently, the partnership hosted two forums in September 2006. DOL has also identified five pilot states that demonstrate “best practices” of state and local interagency collaboration in an effort to achieve greater program integration and innovation in serving out-of-school youth.
EMPLOYMENT AND TRAINING ADMINISTRATION
ETA-47
Agency/Program: Job Corps
PART Recommendation Milestone(s)
Target Date(s) [FY/Q]
Completion Date [FY/Q]
Comments on Status; Reference/Document of
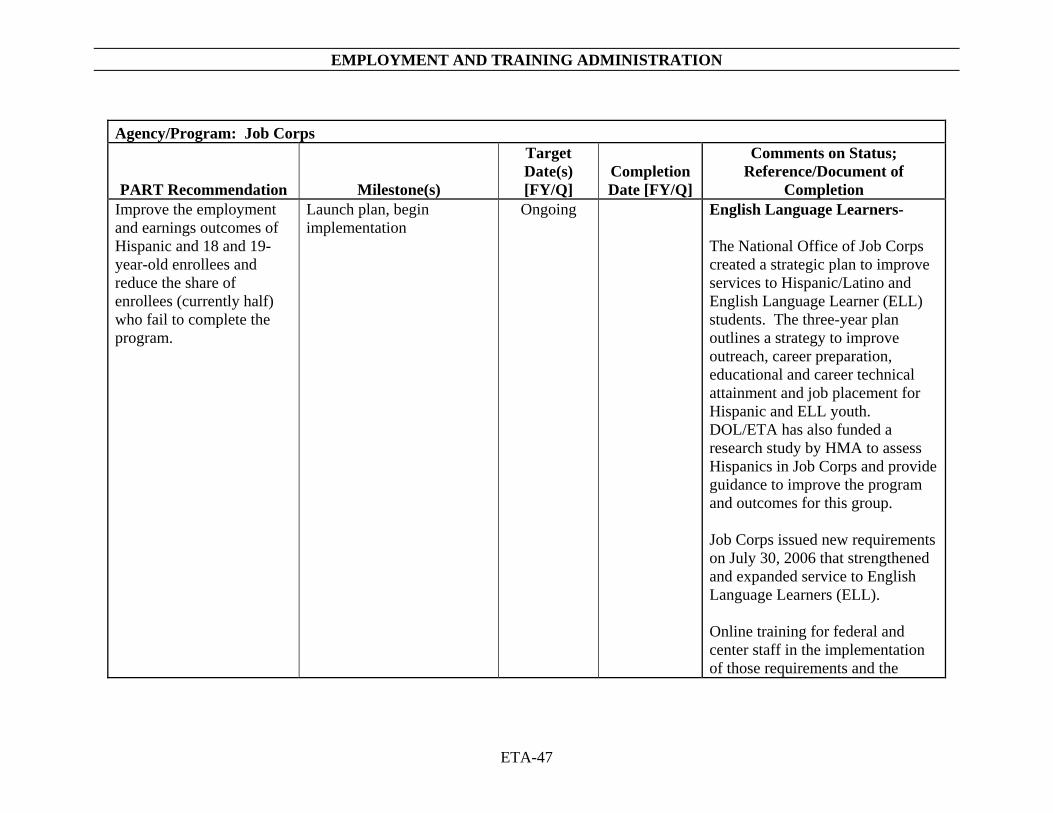
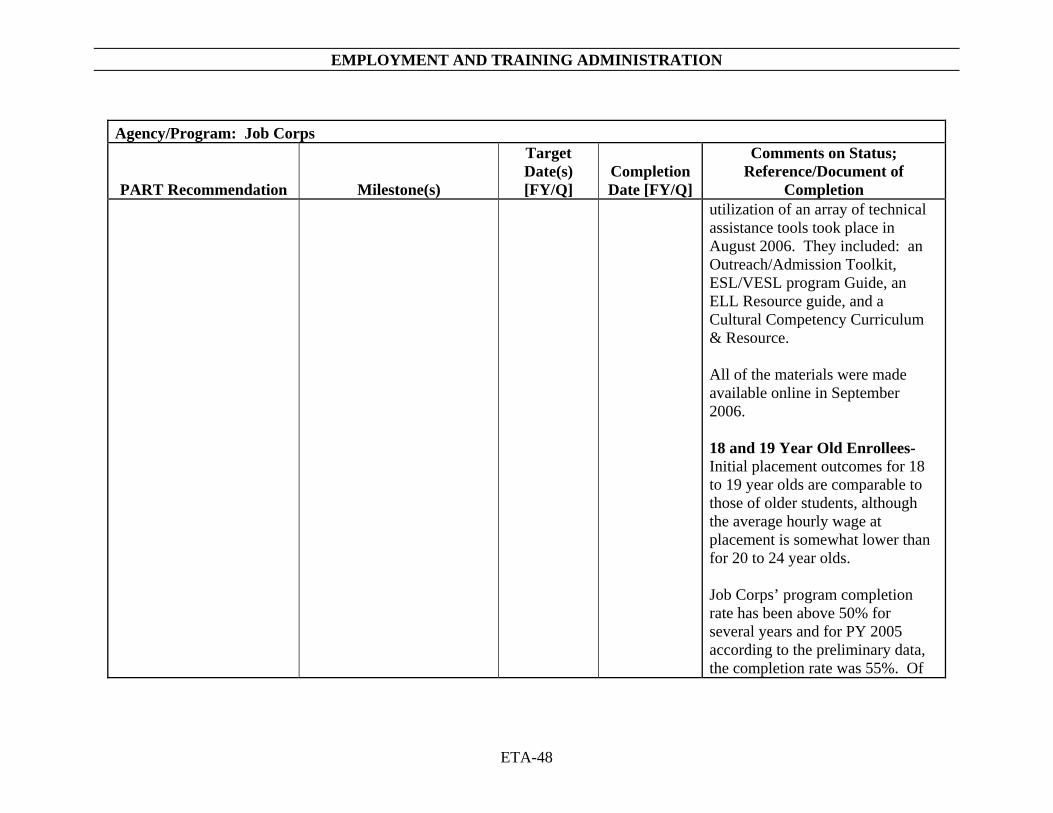
Completion Improve the employment and earnings outcomes of Hispanic and 18 and 19-year-old enrollees and reduce the share of enrollees (currently half) who fail to complete the program.
Launch plan, begin implementation
Ongoing English Language Learners- The National Office of Job Corps created a strategic plan to improve services to Hispanic/Latino and English Language Learner (ELL) students. The three-year plan outlines a strategy to improve outreach, career preparation, educational and career technical attainment and job placement for Hispanic and ELL youth. DOL/ETA has also funded a research study by HMA to assess Hispanics in Job Corps and provide guidance to improve the program and outcomes for this group. Job Corps issued new requirements on July 30, 2006 that strengthened and expanded service to English Language Learners (ELL). Online training for federal and center staff in the implementation of those requirements and the
EMPLOYMENT AND TRAINING ADMINISTRATION
ETA-48
Agency/Program: Job Corps
PART Recommendation Milestone(s)
Target Date(s) [FY/Q]
Completion Date [FY/Q]
Comments on Status; Reference/Document of
Completion utilization of an array of technical assistance tools took place in August 2006. They included: an Outreach/Admission Toolkit, ESL/VESL program Guide, an ELL Resource guide, and a Cultural Competency Curriculum & Resource. All of the materials were made available online in September 2006. 18 and 19 Year Old Enrollees- Initial placement outcomes for 18 to 19 year olds are comparable to those of older students, although the average hourly wage at placement is somewhat lower than for 20 to 24 year olds. Job Corps’ program completion rate has been above 50% for several years and for PY 2005 according to the preliminary data, the completion rate was 55%. Of
EMPLOYMENT AND TRAINING ADMINISTRATION
ETA-49
Agency/Program: Job Corps
PART Recommendation Milestone(s)
Target Date(s) [FY/Q]
Completion Date [FY/Q]
Comments on Status; Reference/Document of
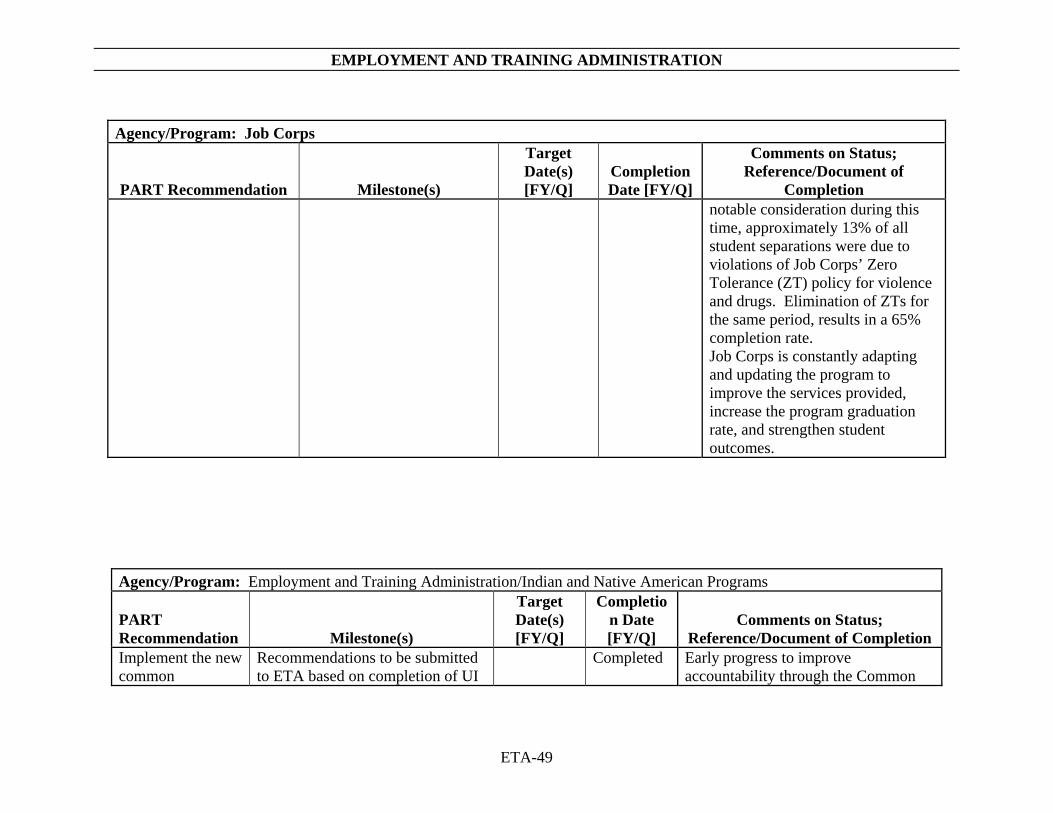
Completion notable consideration during this time, approximately 13% of all student separations were due to violations of Job Corps’ Zero Tolerance (ZT) policy for violence and drugs. Elimination of ZTs for the same period, results in a 65% completion rate. Job Corps is constantly adapting and updating the program to improve the services provided, increase the program graduation rate, and strengthen student outcomes.
Agency/Program: Employment and Training Administration/Indian and Native American Programs
PART Recommendation Milestone(s)
Target Date(s) [FY/Q]
Completion Date [FY/Q]
Comments on Status; Reference/Document of Completion
Implement the new common
Recommendations to be submitted to ETA based on completion of UI
Completed
Early progress to improve accountability through the Common

EMPLOYMENT AND TRAINING ADMINISTRATION
ETA-50
Agency/Program: Employment and Training Administration/Indian and Native American Programs
PART Recommendation Milestone(s)
Target Date(s) [FY/Q]
Completion Date [FY/Q]
Comments on Status; Reference/Document of Completion
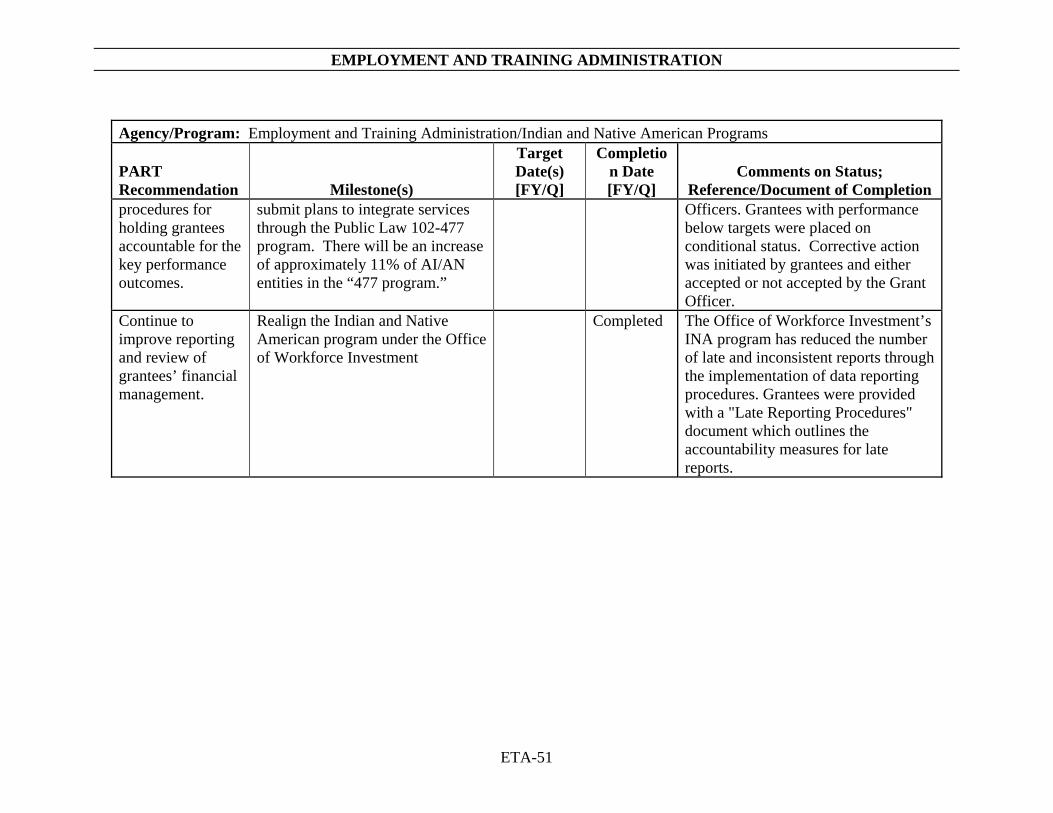
performance measures for job training programs, including this one.
Wage Study for common measures. Formally implementing corrective action procedures when grantees fail to meet performance outcomes.
Completed
Measures is promising. The entered employment rate improved four percentage points from two years ago. The results have climbed from 53% to 54% and most recently to 57%. Hourly earnings’ which is a newly tracked measure increased from $3.50 last year to $4.80 this year. These positive results are attributable to an increased focus on three strategic directives: 1) Ensure that programs are responsive to employers and other tribal businesses; 2) Due to the changing nature of the American economy, the program has placed an increased emphasis on longer-term training to meet skill needs of high growth industries; and 3) More effective collaboration between the One Stop Career Centers and Indian and Native American program (Section 166) grantees which have allowed grantees access to a greater array of services.
Strengthen performance reporting and
ETA will continue to provide training and technical assistance to eligible entities that desire to
PY 2005 The INA program has instituted stricter guidelines for the quarterly risk analysis conducted by Federal Project
EMPLOYMENT AND TRAINING ADMINISTRATION
ETA-51
Agency/Program: Employment and Training Administration/Indian and Native American Programs
PART Recommendation Milestone(s)
Target Date(s) [FY/Q]
Completion Date [FY/Q]
Comments on Status; Reference/Document of Completion
procedures for holding grantees accountable for the key performance outcomes.
submit plans to integrate services through the Public Law 102-477 program. There will be an increase of approximately 11% of AI/AN entities in the “477 program.”
Officers. Grantees with performance below targets were placed on conditional status. Corrective action was initiated by grantees and either accepted or not accepted by the Grant Officer.
Continue to improve reporting and review of grantees’ financial management.
Realign the Indian and Native American program under the Office of Workforce Investment
Completed The Office of Workforce Investment’s INA program has reduced the number of late and inconsistent reports through the implementation of data reporting procedures. Grantees were provided with a "Late Reporting Procedures" document which outlines the accountability measures for late reports.
EMPLOYMENT AND TRAINING ADMINISTRATION
ETA-52
Agency/Program: Employment and Training Administration/Migrant and Seasonal Farmworker Programs
PART Recommendation Milestone(s)
Target Date(s) [FY/Q]
Completion Date [FY/Q]
Comments on Status; Reference/Document of Completion
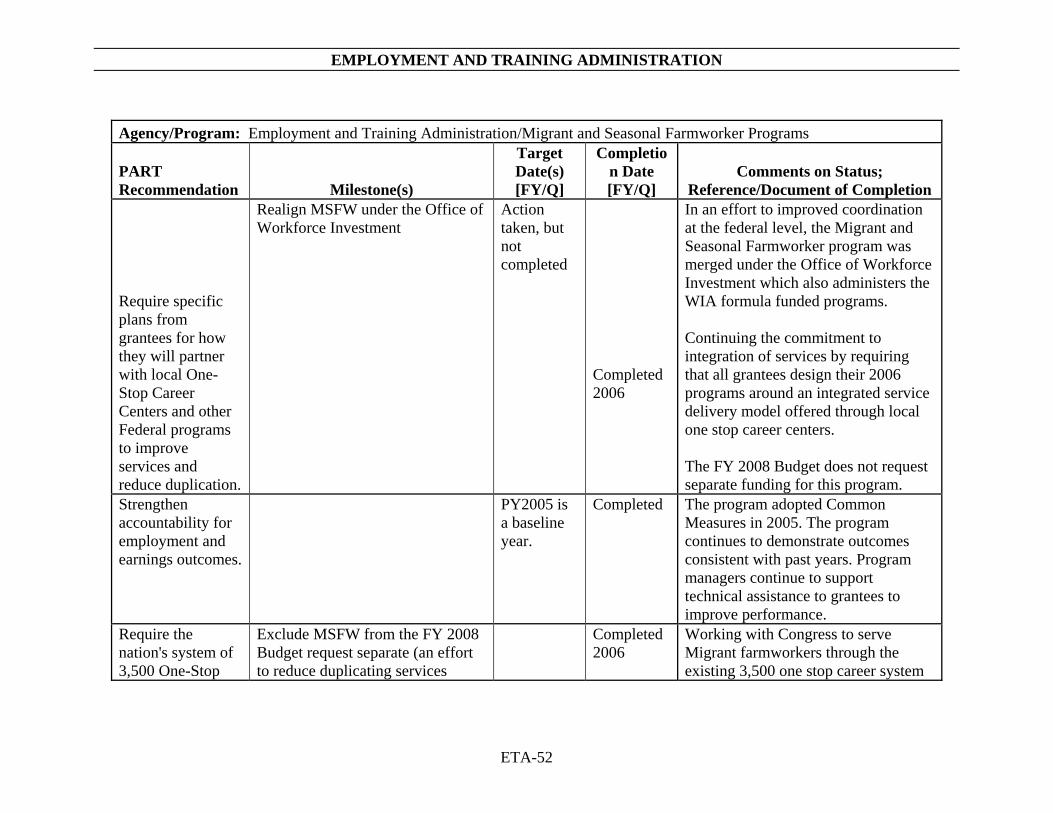
Require specific plans from grantees for how they will partner with local One-Stop Career Centers and other Federal programs to improve services and reduce duplication.
Realign MSFW under the Office of Workforce Investment
Action taken, but not completed
Completed 2006
In an effort to improved coordination at the federal level, the Migrant and Seasonal Farmworker program was merged under the Office of Workforce Investment which also administers the WIA formula funded programs. Continuing the commitment to integration of services by requiring that all grantees design their 2006 programs around an integrated service delivery model offered through local one stop career centers. The FY 2008 Budget does not request separate funding for this program.
Strengthen accountability for employment and earnings outcomes.
PY2005 is a baseline year.
Completed The program adopted Common Measures in 2005. The program continues to demonstrate outcomes consistent with past years. Program managers continue to support technical assistance to grantees to improve performance.
Require the nation's system of 3,500 One-Stop
Exclude MSFW from the FY 2008 Budget request separate (an effort to reduce duplicating services
Completed 2006
Working with Congress to serve Migrant farmworkers through the existing 3,500 one stop career system

EMPLOYMENT AND TRAINING ADMINISTRATION
ETA-53
Agency/Program: Employment and Training Administration/Migrant and Seasonal Farmworker Programs
PART Recommendation Milestone(s)
Target Date(s) [FY/Q]
Completion Date [FY/Q]
Comments on Status; Reference/Document of Completion
Career Centers to serve farmworkers instead.
already provided through the local one stop career system).
nationwide. Centers have received guidance from the federal level on reaching out to and serving these farmworkers.
Agency/Program: Employment and Training Administration/ Community Service Employment for Older Americans
PART Recommendation Milestone(s)
Target Date(s) [FY/Q]
Completion Date [FY/Q]
Comments on Status; Reference/Document of
Completion Continue to award national grants competitively to strengthen program design and service delivery.
Ongoing monitoring of grants. Competitive Grant Award
Ongoing Completed August 2006
Grants continue to be awarded competitively. A national competition is currently underway. Results were announced in August 2006. Congress signed into law October 17, 2006 the Older American Act which establishes the use of competitive procurement.
Continue to strengthen program accountability through common performance
ETA published Final Regulations for the 2000 amendments to the Older Americans Act (OAA) on April 9, 2004.
Completed April 2004 Completed
An efficiency measure of cost per participant was established in the FY 2005 Budget Request and targets have been included in subsequent budgets including the FY 2008
EMPLOYMENT AND TRAINING ADMINISTRATION
ETA-54
Agency/Program: Employment and Training Administration/ Community Service Employment for Older Americans
PART Recommendation Milestone(s)
Target Date(s) [FY/Q]
Completion Date [FY/Q]
Comments on Status; Reference/Document of
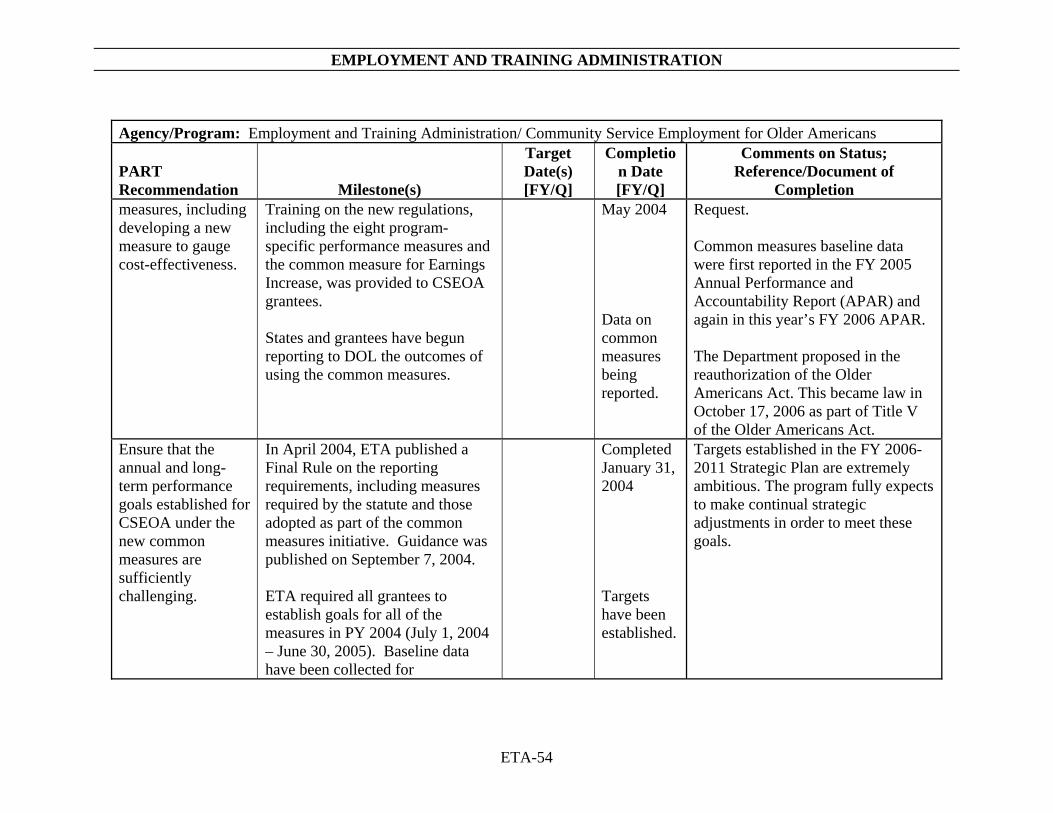
Completion measures, including developing a new measure to gauge cost-effectiveness.
Training on the new regulations, including the eight program-specific performance measures and the common measure for Earnings Increase, was provided to CSEOA grantees. States and grantees have begun reporting to DOL the outcomes of using the common measures.
May 2004 Data on common measures being reported.
Request. Common measures baseline data were first reported in the FY 2005 Annual Performance and Accountability Report (APAR) and again in this year’s FY 2006 APAR. The Department proposed in the reauthorization of the Older Americans Act. This became law in October 17, 2006 as part of Title V of the Older Americans Act.
Ensure that the annual and long-term performance goals established for CSEOA under the new common measures are sufficiently challenging.
In April 2004, ETA published a Final Rule on the reporting requirements, including measures required by the statute and those adopted as part of the common measures initiative. Guidance was published on September 7, 2004. ETA required all grantees to establish goals for all of the measures in PY 2004 (July 1, 2004 – June 30, 2005). Baseline data have been collected for
Completed January 31, 2004 Targets have been established.
Targets established in the FY 2006-2011 Strategic Plan are extremely ambitious. The program fully expects to make continual strategic adjustments in order to meet these goals.
EMPLOYMENT AND TRAINING ADMINISTRATION
ETA-55
Agency/Program: Employment and Training Administration/ Community Service Employment for Older Americans
PART Recommendation Milestone(s)
Target Date(s) [FY/Q]
Completion Date [FY/Q]
Comments on Status; Reference/Document of
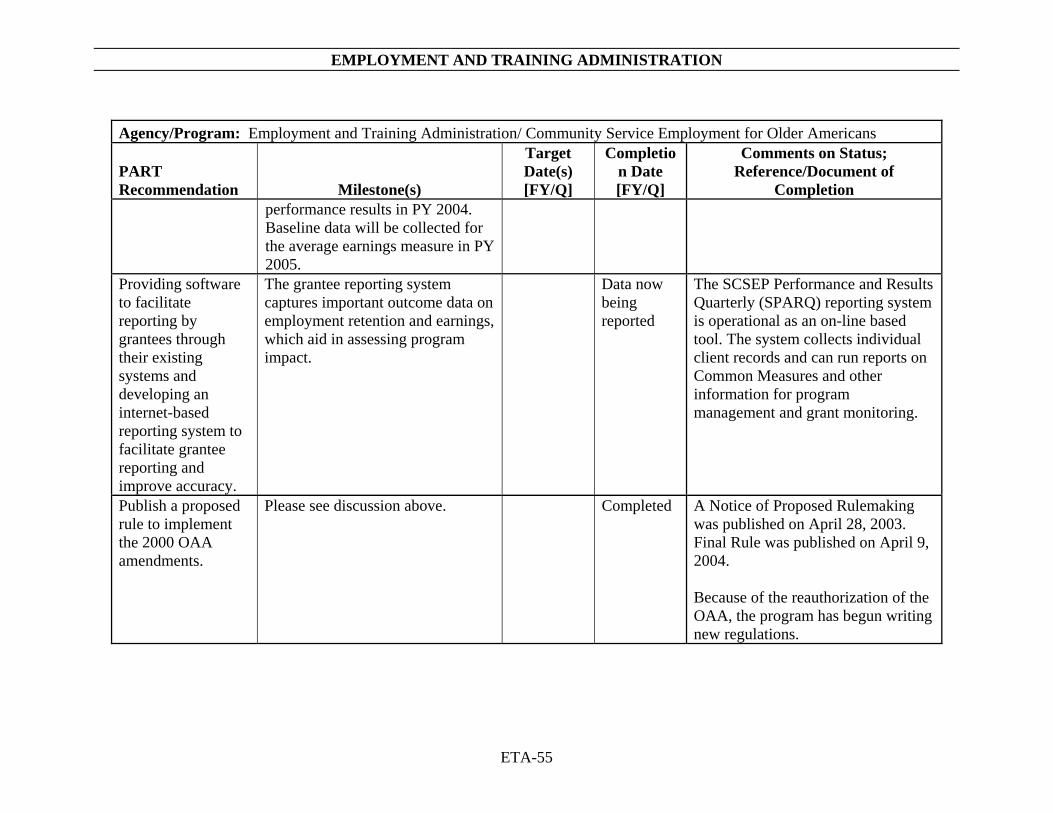
Completion performance results in PY 2004. Baseline data will be collected for the average earnings measure in PY 2005.
Providing software to facilitate reporting by grantees through their existing systems and developing an internet-based reporting system to facilitate grantee reporting and improve accuracy.
The grantee reporting system captures important outcome data on employment retention and earnings, which aid in assessing program impact.
Data now being reported
The SCSEP Performance and Results Quarterly (SPARQ) reporting system is operational as an on-line based tool. The system collects individual client records and can run reports on Common Measures and other information for program management and grant monitoring.
Publish a proposed rule to implement the 2000 OAA amendments.
Please see discussion above. Completed A Notice of Proposed Rulemaking was published on April 28, 2003. Final Rule was published on April 9, 2004. Because of the reauthorization of the OAA, the program has begun writing new regulations.
EMPLOYMENT AND TRAINING ADMINISTRATION
ETA-56
Agency/Program: Employment and Training Administration/Unemployment Insurance
PART Recommendation Milestone(s)
Target Date(s) [FY/Q]
Completion Date [FY/Q]
Comments on Status; Reference/Document of
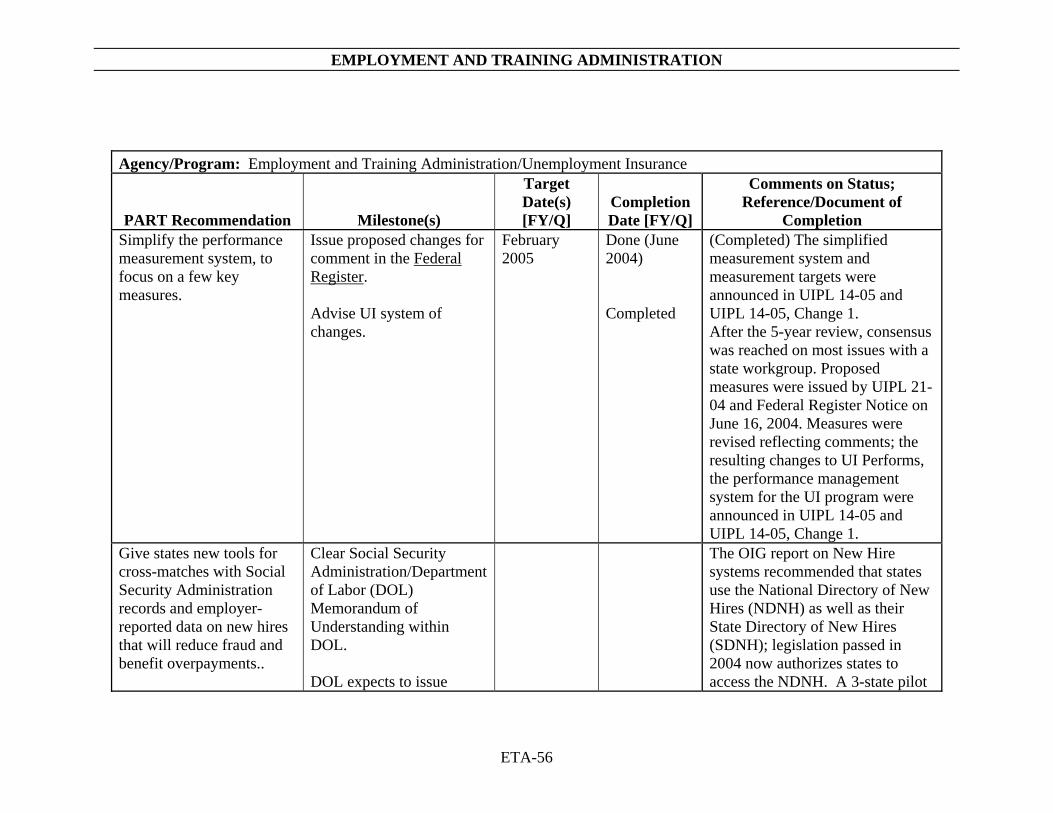
Completion Simplify the performance measurement system, to focus on a few key measures.
Issue proposed changes for comment in the Federal Register. Advise UI system of changes.
February 2005
Done (June 2004) Completed
(Completed) The simplified measurement system and measurement targets were announced in UIPL 14-05 and UIPL 14-05, Change 1. After the 5-year review, consensus was reached on most issues with a state workgroup. Proposed measures were issued by UIPL 21-04 and Federal Register Notice on June 16, 2004. Measures were revised reflecting comments; the resulting changes to UI Performs, the performance management system for the UI program were announced in UIPL 14-05 and UIPL 14-05, Change 1.
Give states new tools for cross-matches with Social Security Administration records and employer-reported data on new hires that will reduce fraud and benefit overpayments..
Clear Social Security Administration/Department of Labor (DOL) Memorandum of Understanding within DOL. DOL expects to issue
The OIG report on New Hire systems recommended that states use the National Directory of New Hires (NDNH) as well as their State Directory of New Hires (SDNH); legislation passed in 2004 now authorizes states to access the NDNH. A 3-state pilot

EMPLOYMENT AND TRAINING ADMINISTRATION
ETA-57
Agency/Program: Employment and Training Administration/Unemployment Insurance
PART Recommendation Milestone(s)
Target Date(s) [FY/Q]
Completion Date [FY/Q]
Comments on Status; Reference/Document of
Completion additional guidance on New Hire cross match after working with Health and Human Services to develop and test the system for states to use the NDNH. Obtaining additional tools and resources to help states prevent fraud and reduce benefit overpayments.
test proved that the NDNH is a valuable tool for detecting overpayments; DOL issued the results of the pilot in UIPL 22-06. DOL encouraged states to implement a cross-match with the NDNH and provided funding to 36 states in FY 2005. To date, 14 states have begun the cross-match and 13 others are in the process of completing requisite computer matching agreements in preparation to cross-match the data. In FY 2005, DOL provided funding that states could use to deploy a suite of safety checks that include automated address verifications, electronic screens to detect “at risk” claims, training staff to detect the warning signs that are indicative of fraud, increased investigative staffing, and enhanced employer outreach efforts. The FY 2007 budget

EMPLOYMENT AND TRAINING ADMINISTRATION
ETA-58
Agency/Program: Employment and Training Administration/Unemployment Insurance
PART Recommendation Milestone(s)
Target Date(s) [FY/Q]
Completion Date [FY/Q]
Comments on Status; Reference/Document of
Completion requested $10 million to support 160 positions at the state level nationwide to promptly examine and reconcile discrepancies in claimants’ personal identifiers before a first payment is made and to conduct the follow-up investigations of these potential instances of overpayments already made.
Target resources on reviews of continued eligibility to help claimants find suitable employment
Allocation of REA funds to states
February 2005
FY 2004
After the 5-year review, consensus was reached on most issues with a state workgroup. Proposed measures were issued by UIPL 21-04 and Federal Register Notice on June 16, 2004. Measures were revised reflecting comments; the resulting changes to UI Performs, the performance management system for the UI program were announced in UIPL 14-05 and UIPL 14-05, Change 1. In FY 2005 DOL funded a Reemployment and Eligibility Assessment (REA) initiative in 21
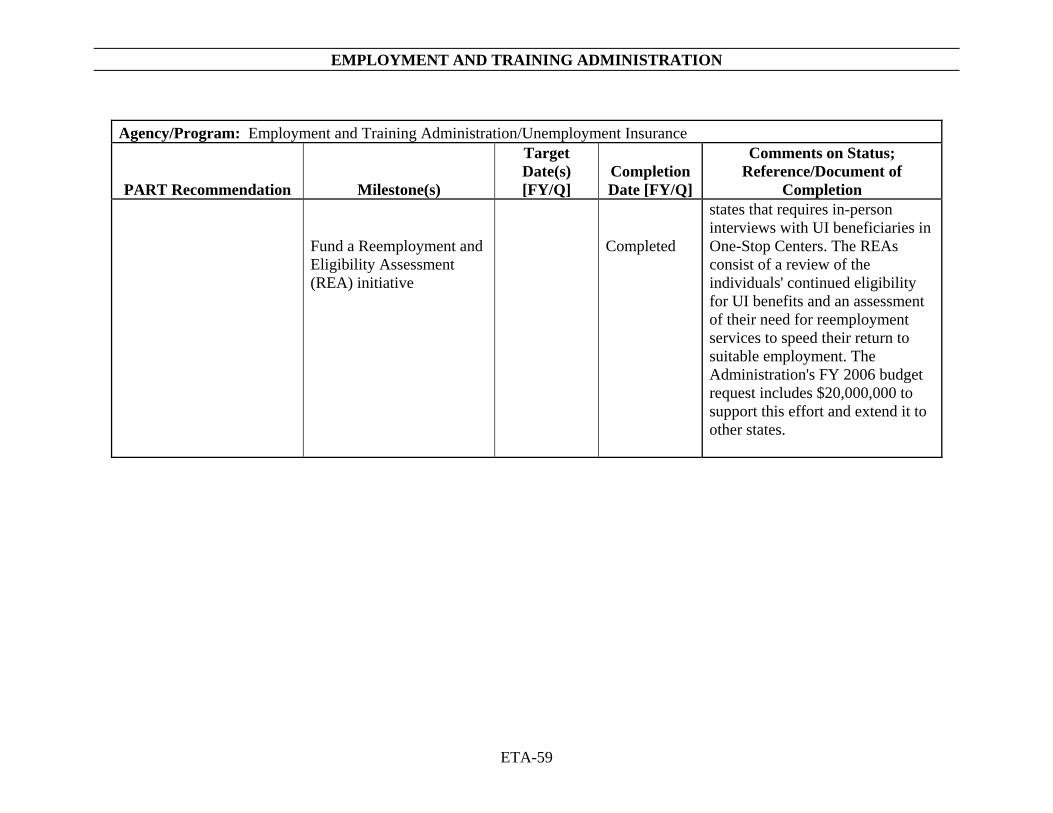
EMPLOYMENT AND TRAINING ADMINISTRATION
ETA-59
Agency/Program: Employment and Training Administration/Unemployment Insurance
PART Recommendation Milestone(s)
Target Date(s) [FY/Q]
Completion Date [FY/Q]
Comments on Status; Reference/Document of
Completion Fund a Reemployment and Eligibility Assessment (REA) initiative
Completed
states that requires in-person interviews with UI beneficiaries in One-Stop Centers. The REAs consist of a review of the individuals' continued eligibility for UI benefits and an assessment of their need for reemployment services to speed their return to suitable employment. The Administration's FY 2006 budget request includes $20,000,000 to support this effort and extend it to other states.
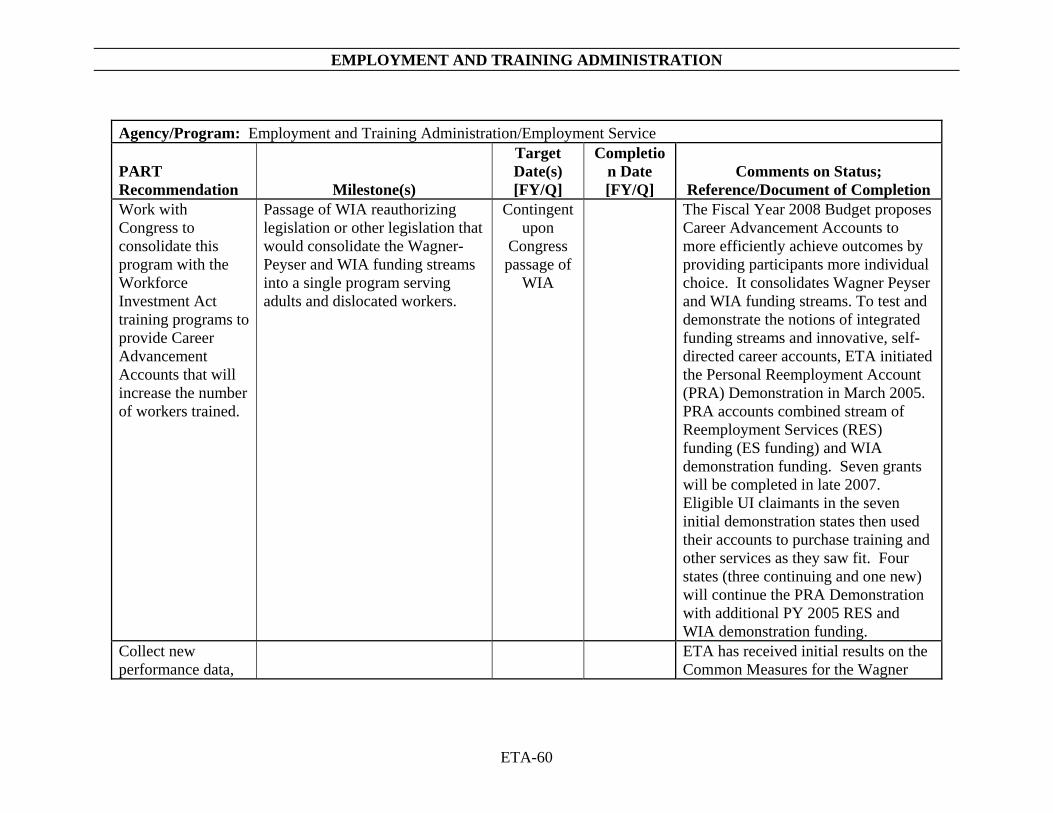
EMPLOYMENT AND TRAINING ADMINISTRATION
ETA-60
Agency/Program: Employment and Training Administration/Employment Service
PART Recommendation Milestone(s)
Target Date(s) [FY/Q]
Completion Date [FY/Q]
Comments on Status; Reference/Document of Completion
Work with Congress to consolidate this program with the Workforce Investment Act training programs to provide Career Advancement Accounts that will increase the number of workers trained.
Passage of WIA reauthorizing legislation or other legislation that would consolidate the Wagner-Peyser and WIA funding streams into a single program serving adults and dislocated workers.
Contingent upon
Congress passage of
WIA
The Fiscal Year 2008 Budget proposes Career Advancement Accounts to more efficiently achieve outcomes by providing participants more individual choice. It consolidates Wagner Peyser and WIA funding streams. To test and demonstrate the notions of integrated funding streams and innovative, self-directed career accounts, ETA initiated the Personal Reemployment Account (PRA) Demonstration in March 2005. PRA accounts combined stream of Reemployment Services (RES) funding (ES funding) and WIA demonstration funding. Seven grants will be completed in late 2007. Eligible UI claimants in the seven initial demonstration states then used their accounts to purchase training and other services as they saw fit. Four states (three continuing and one new) will continue the PRA Demonstration with additional PY 2005 RES and WIA demonstration funding.
Collect new performance data,
ETA has received initial results on the Common Measures for the Wagner

EMPLOYMENT AND TRAINING ADMINISTRATION
ETA-61
Agency/Program: Employment and Training Administration/Employment Service
PART Recommendation Milestone(s)
Target Date(s) [FY/Q]
Completion Date [FY/Q]
Comments on Status; Reference/Document of Completion
including earnings, outcomes by type of service, and new categories of information on veterans receiving employment services.
Peyser employment service program. In PY 2005, state reporting systems were restructured to accommodate Common Measures. ETA is in the process of developing an integrated participant-level reporting system across several key programs. In November 2006, ETA put the system out for public comment. In July 2007, WISPR, the official name of this reporting system, will be implemented and replace the current quarterly reporting requirements of the following seven ETA activities: Wagner-Peyser Act, Veterans Employment and Training Service, the Workforce Investment Act (WIA) Adult, WIA Dislocated Worker, WIA Youth, and Trade Adjustment Assistance Act programs, and National Emergency Grants. Ultimately this system will provide better data on type of services received and other key demographic information of participants.
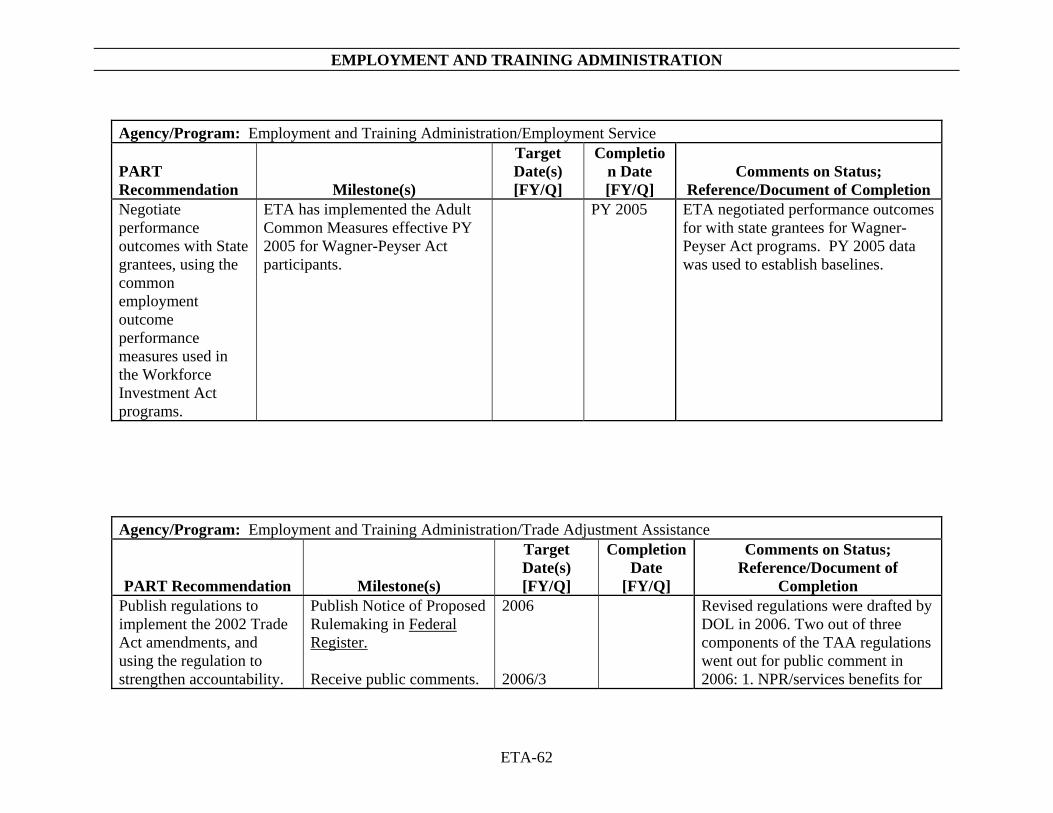
EMPLOYMENT AND TRAINING ADMINISTRATION
ETA-62
Agency/Program: Employment and Training Administration/Employment Service
PART Recommendation Milestone(s)
Target Date(s) [FY/Q]
Completion Date [FY/Q]
Comments on Status; Reference/Document of Completion
Negotiate performance outcomes with State grantees, using the common employment outcome performance measures used in the Workforce Investment Act programs.
ETA has implemented the Adult Common Measures effective PY 2005 for Wagner-Peyser Act participants.
PY 2005 ETA negotiated performance outcomes for with state grantees for Wagner-Peyser Act programs. PY 2005 data was used to establish baselines.
Agency/Program: Employment and Training Administration/Trade Adjustment Assistance
PART Recommendation Milestone(s)
Target Date(s) [FY/Q]
Completion Date
[FY/Q]
Comments on Status; Reference/Document of
Completion Publish regulations to implement the 2002 Trade Act amendments, and using the regulation to strengthen accountability.
Publish Notice of Proposed Rulemaking in Federal Register. Receive public comments.
2006 2006/3
Revised regulations were drafted by DOL in 2006. Two out of three components of the TAA regulations went out for public comment in 2006: 1. NPR/services benefits for

EMPLOYMENT AND TRAINING ADMINISTRATION
ETA-63
Agency/Program: Employment and Training Administration/Trade Adjustment Assistance
PART Recommendation Milestone(s)
Target Date(s) [FY/Q]
Completion Date
[FY/Q]
Comments on Status; Reference/Document of
Completion Review, analyze, and establish policy based on public comments. Prepare final rulemaking for clearance. Transmit final rulemaking to OMB for review and clearance. Publish final rulemaking in Federal Register.
2006/3 2006/4 2006/4 2006/4
administration component published August 25, 2006; 2. ATAA component published October 18, 2006; 3. Petition process component is still pending.
Improve the linkages between the program and the dislocated worker program to assure that workers eligible for the program receive the full range of reemployment services needed to return to work.
Emphasis on linkage will be incorporated into new TAA regulations. TAA will move to common measures and reporting definitions at the same time as all other Employment and Training Administration programs. ETA has begun a five year study of the TAA program,
2006/4 2009
Completed 2006/1
A State Trade Coordinator's meeting was held in conjunction with the Rapid Response Summit held in St. Louis, Missouri from May 22 through 25, 2006. This helped to further reinforce the role of linkages between programs for state practitioners.
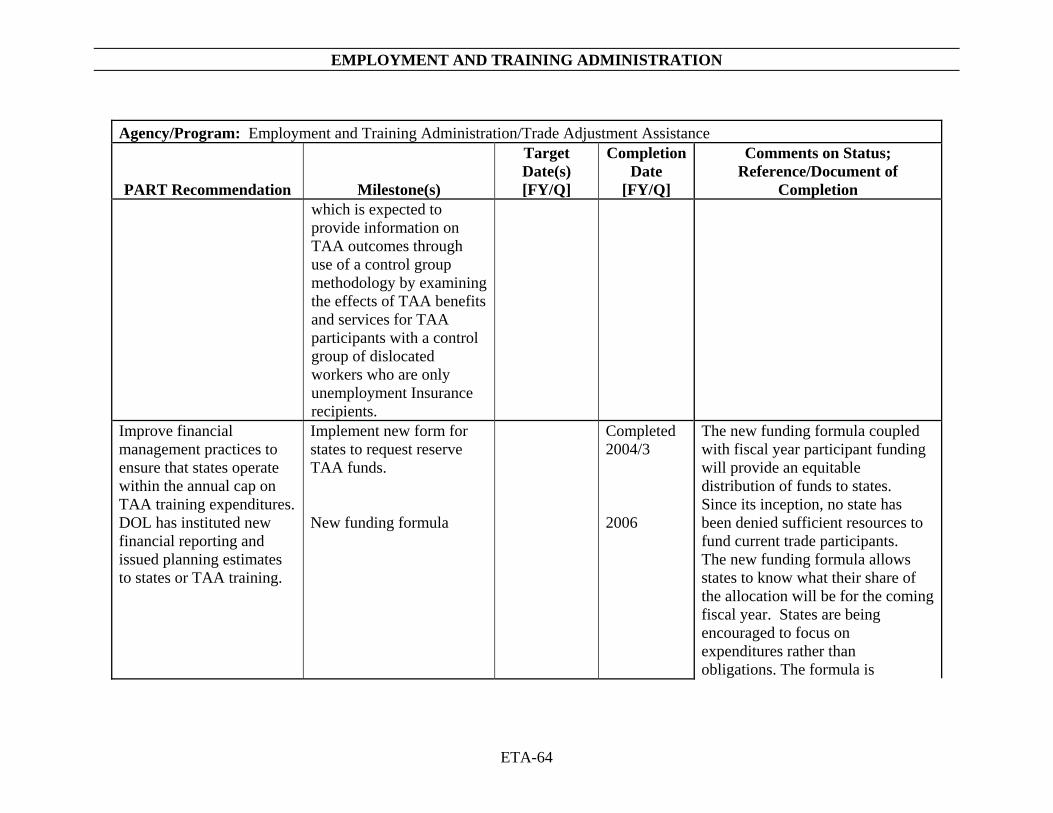
EMPLOYMENT AND TRAINING ADMINISTRATION
ETA-64
Agency/Program: Employment and Training Administration/Trade Adjustment Assistance
PART Recommendation Milestone(s)
Target Date(s) [FY/Q]
Completion Date
[FY/Q]
Comments on Status; Reference/Document of
Completion which is expected to provide information on TAA outcomes through use of a control group methodology by examining the effects of TAA benefits and services for TAA participants with a control group of dislocated workers who are only unemployment Insurance recipients.
Improve financial management practices to ensure that states operate within the annual cap on TAA training expenditures. DOL has instituted new financial reporting and issued planning estimates to states or TAA training.
Implement new form for states to request reserve TAA funds. New funding formula
Completed 2004/3 2006
The new funding formula coupled with fiscal year participant funding will provide an equitable distribution of funds to states. Since its inception, no state has been denied sufficient resources to fund current trade participants. The new funding formula allows states to know what their share of the allocation will be for the coming fiscal year. States are being encouraged to focus on expenditures rather than obligations. The formula is

EMPLOYMENT AND TRAINING ADMINISTRATION
ETA-65
Agency/Program: Employment and Training Administration/Trade Adjustment Assistance
PART Recommendation Milestone(s)
Target Date(s) [FY/Q]
Completion Date
[FY/Q]
Comments on Status; Reference/Document of
Completion designed to encourage current year funding to be spent on current year training, and states are being encouraged to adhere to this strategy in subsequent fiscal years. As a result of this process, no state has had insufficient funds to serve TAA certified workers from FY 2004 – FY 2006. The form for requesting reserve TAA funds has been approved by Office of Management and Budget (OMB). Future formula will consider incorporating performance goals as part of the process.
Agency/Program: Employment and Training Administration/Work Incentive Grants
PART Recommendation Milestone(s)
Target Date(s) [FY/Q]
Completion Date
[FY/Q]
Comments on Status; Reference/Document of
Completion Work with Congress to make policy and operational changes to
The Work Incentive Grants program has made substantial progress in expanding and enhancing the
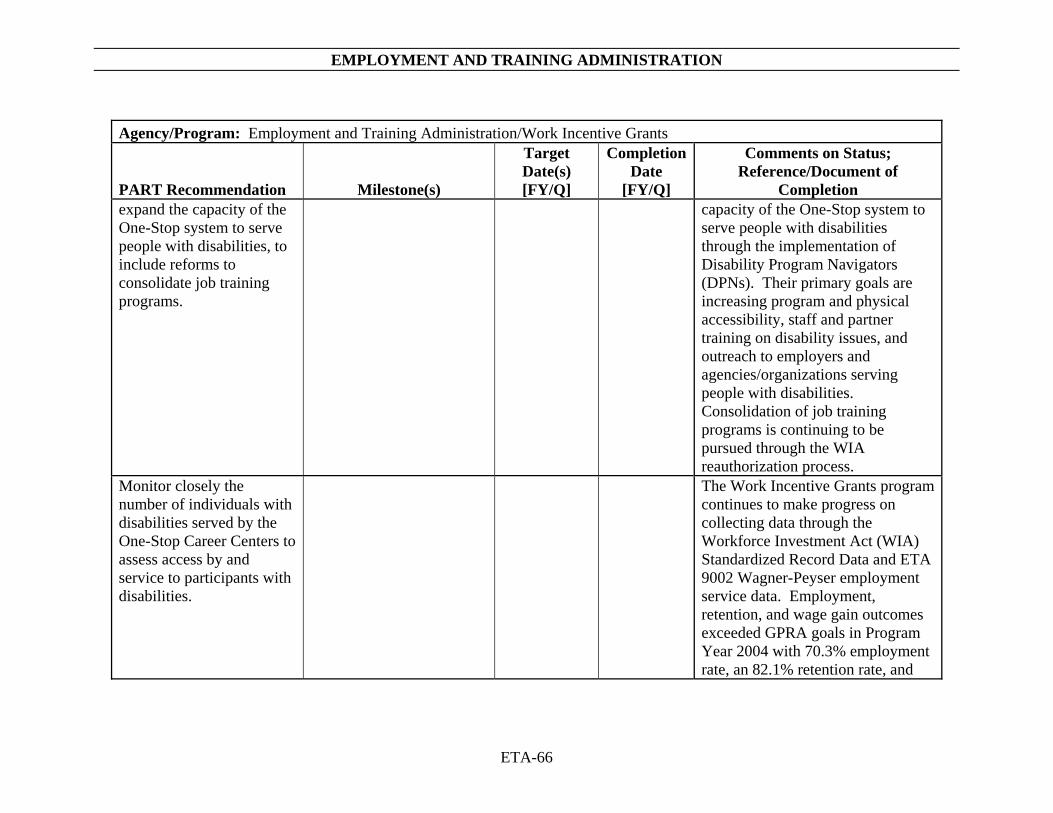
EMPLOYMENT AND TRAINING ADMINISTRATION
ETA-66
Agency/Program: Employment and Training Administration/Work Incentive Grants
PART Recommendation Milestone(s)
Target Date(s) [FY/Q]
Completion Date
[FY/Q]
Comments on Status; Reference/Document of
Completion expand the capacity of the One-Stop system to serve people with disabilities, to include reforms to consolidate job training programs.
capacity of the One-Stop system to serve people with disabilities through the implementation of Disability Program Navigators (DPNs). Their primary goals are increasing program and physical accessibility, staff and partner training on disability issues, and outreach to employers and agencies/organizations serving people with disabilities. Consolidation of job training programs is continuing to be pursued through the WIA reauthorization process.
Monitor closely the number of individuals with disabilities served by the One-Stop Career Centers to assess access by and service to participants with disabilities.
The Work Incentive Grants program continues to make progress on collecting data through the Workforce Investment Act (WIA) Standardized Record Data and ETA 9002 Wagner-Peyser employment service data. Employment, retention, and wage gain outcomes exceeded GPRA goals in Program Year 2004 with 70.3% employment rate, an 82.1% retention rate, and
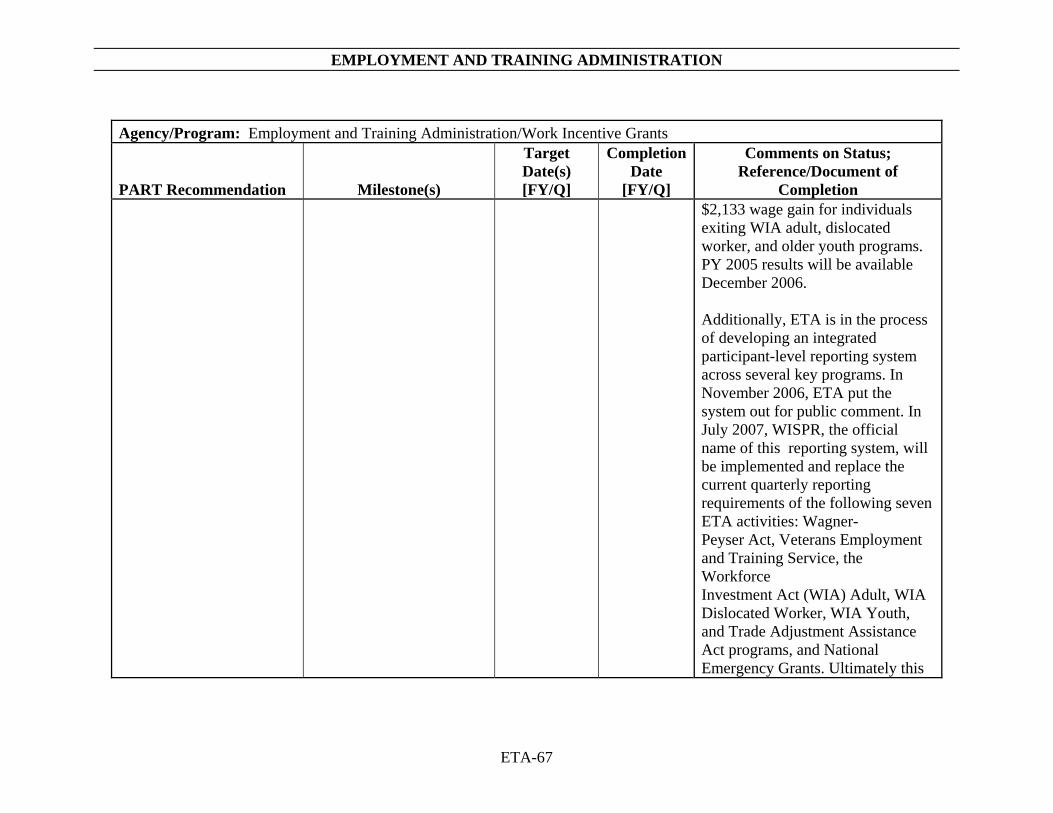
EMPLOYMENT AND TRAINING ADMINISTRATION
ETA-67
Agency/Program: Employment and Training Administration/Work Incentive Grants
PART Recommendation Milestone(s)
Target Date(s) [FY/Q]
Completion Date
[FY/Q]
Comments on Status; Reference/Document of
Completion $2,133 wage gain for individuals exiting WIA adult, dislocated worker, and older youth programs. PY 2005 results will be available December 2006. Additionally, ETA is in the process of developing an integrated participant-level reporting system across several key programs. In November 2006, ETA put the system out for public comment. In July 2007, WISPR, the official name of this reporting system, will be implemented and replace the current quarterly reporting requirements of the following seven ETA activities: Wagner- Peyser Act, Veterans Employment and Training Service, the Workforce Investment Act (WIA) Adult, WIA Dislocated Worker, WIA Youth, and Trade Adjustment Assistance Act programs, and National Emergency Grants. Ultimately this
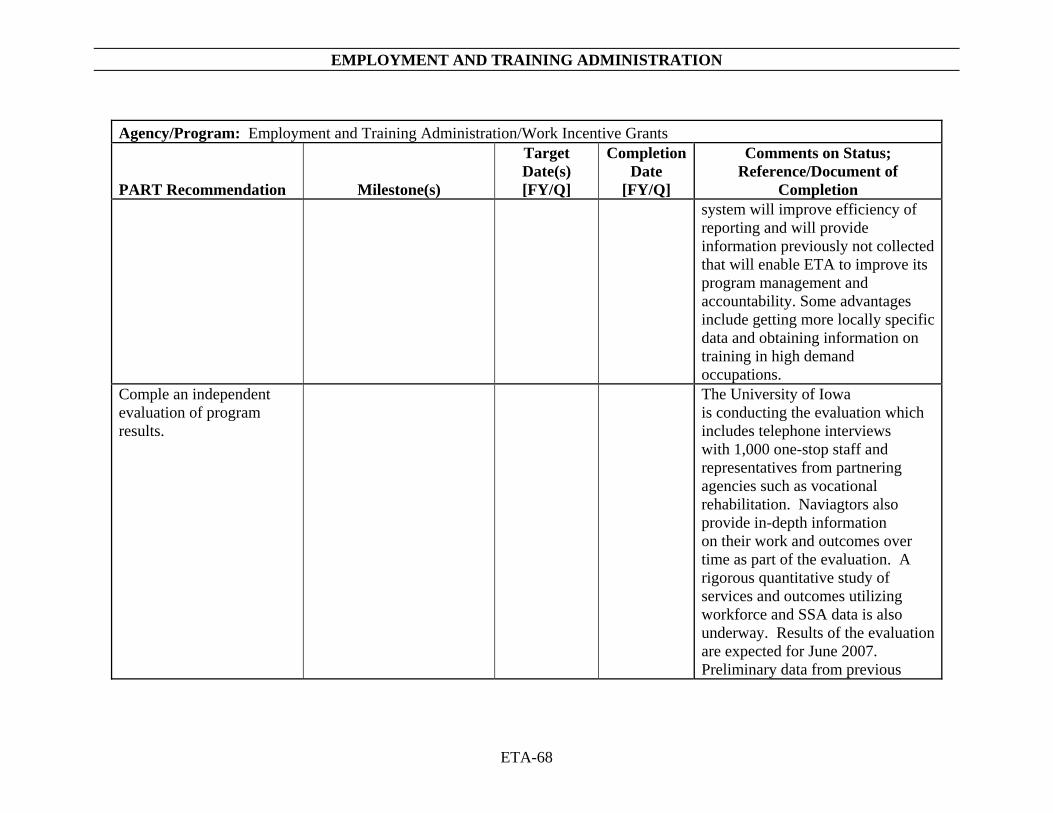
EMPLOYMENT AND TRAINING ADMINISTRATION
ETA-68
Agency/Program: Employment and Training Administration/Work Incentive Grants
PART Recommendation Milestone(s)
Target Date(s) [FY/Q]
Completion Date
[FY/Q]
Comments on Status; Reference/Document of
Completion system will improve efficiency of reporting and will provide information previously not collected that will enable ETA to improve its program management and accountability. Some advantages include getting more locally specific data and obtaining information on training in high demand occupations.
Comple an independent evaluation of program results.
The University of Iowa is conducting the evaluation which includes telephone interviews with 1,000 one-stop staff and representatives from partnering agencies such as vocational rehabilitation. Naviagtors also provide in-depth information on their work and outcomes over time as part of the evaluation. A rigorous quantitative study of services and outcomes utilizing workforce and SSA data is also underway. Results of the evaluation are expected for June 2007. Preliminary data from previous
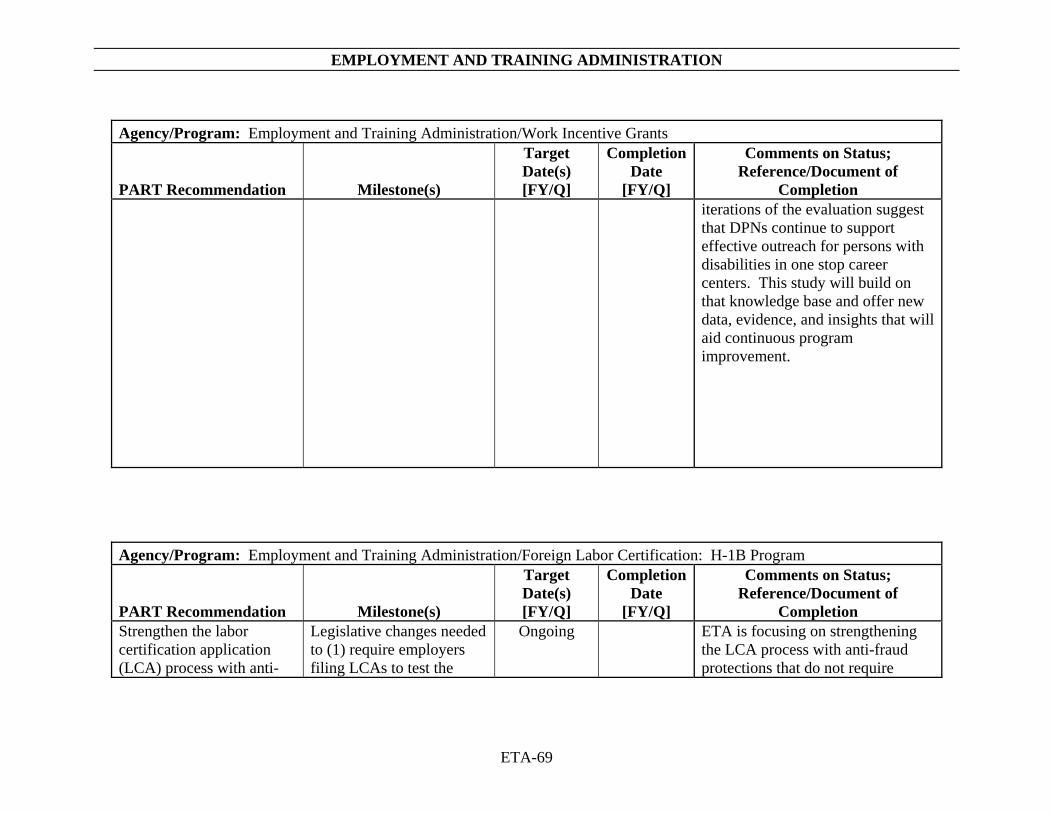
EMPLOYMENT AND TRAINING ADMINISTRATION
ETA-69
Agency/Program: Employment and Training Administration/Work Incentive Grants
PART Recommendation Milestone(s)
Target Date(s) [FY/Q]
Completion Date
[FY/Q]
Comments on Status; Reference/Document of
Completion iterations of the evaluation suggest that DPNs continue to support effective outreach for persons with disabilities in one stop career centers. This study will build on that knowledge base and offer new data, evidence, and insights that will aid continuous program improvement.
Agency/Program: Employment and Training Administration/Foreign Labor Certification: H-1B Program
PART Recommendation Milestone(s)
Target Date(s) [FY/Q]
Completion Date
[FY/Q]
Comments on Status; Reference/Document of
Completion Strengthen the labor certification application (LCA) process with anti-
Legislative changes needed to (1) require employers filing LCAs to test the
Ongoing
ETA is focusing on strengthening the LCA process with anti-fraud protections that do not require
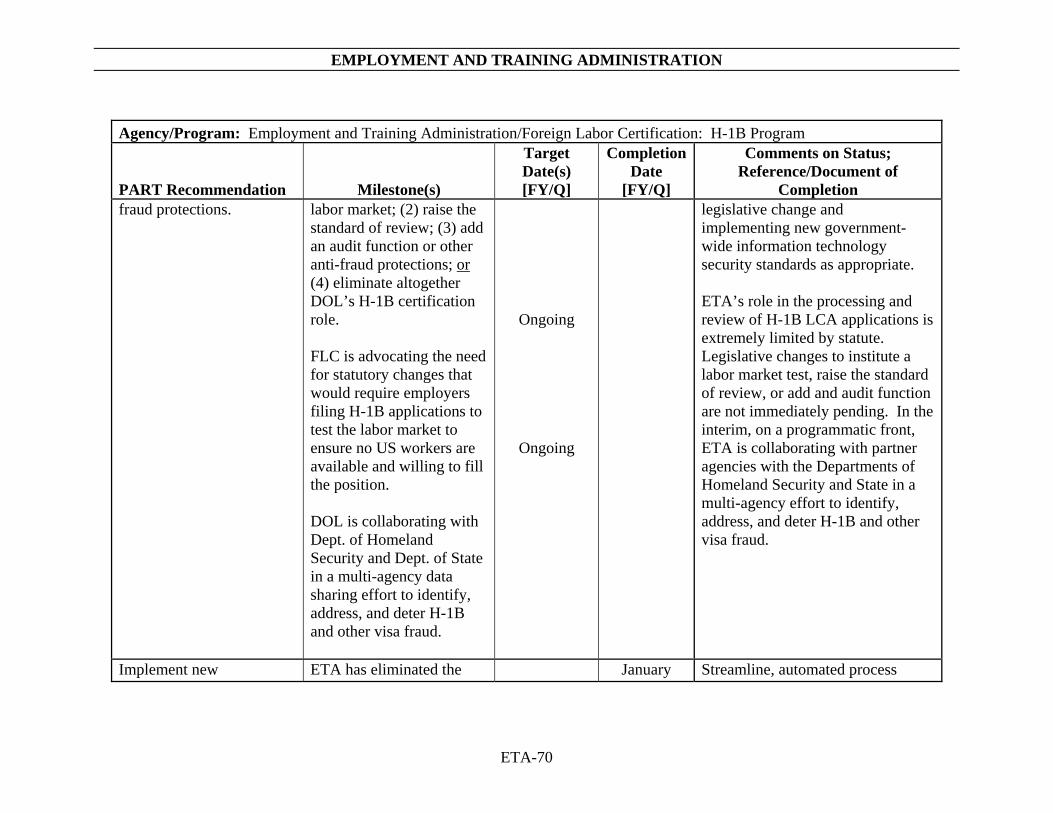
EMPLOYMENT AND TRAINING ADMINISTRATION
ETA-70
Agency/Program: Employment and Training Administration/Foreign Labor Certification: H-1B Program
PART Recommendation Milestone(s)
Target Date(s) [FY/Q]
Completion Date
[FY/Q]
Comments on Status; Reference/Document of
Completion fraud protections. labor market; (2) raise the
standard of review; (3) add an audit function or other anti-fraud protections; or (4) eliminate altogether DOL’s H-1B certification role. FLC is advocating the need for statutory changes that would require employers filing H-1B applications to test the labor market to ensure no US workers are available and willing to fill the position. DOL is collaborating with Dept. of Homeland Security and Dept. of State in a multi-agency data sharing effort to identify, address, and deter H-1B and other visa fraud.
Ongoing
Ongoing
legislative change and implementing new government-wide information technology security standards as appropriate. ETA’s role in the processing and review of H-1B LCA applications is extremely limited by statute. Legislative changes to institute a labor market test, raise the standard of review, or add and audit function are not immediately pending. In the interim, on a programmatic front, ETA is collaborating with partner agencies with the Departments of Homeland Security and State in a multi-agency effort to identify, address, and deter H-1B and other visa fraud.
Implement new ETA has eliminated the January Streamline, automated process
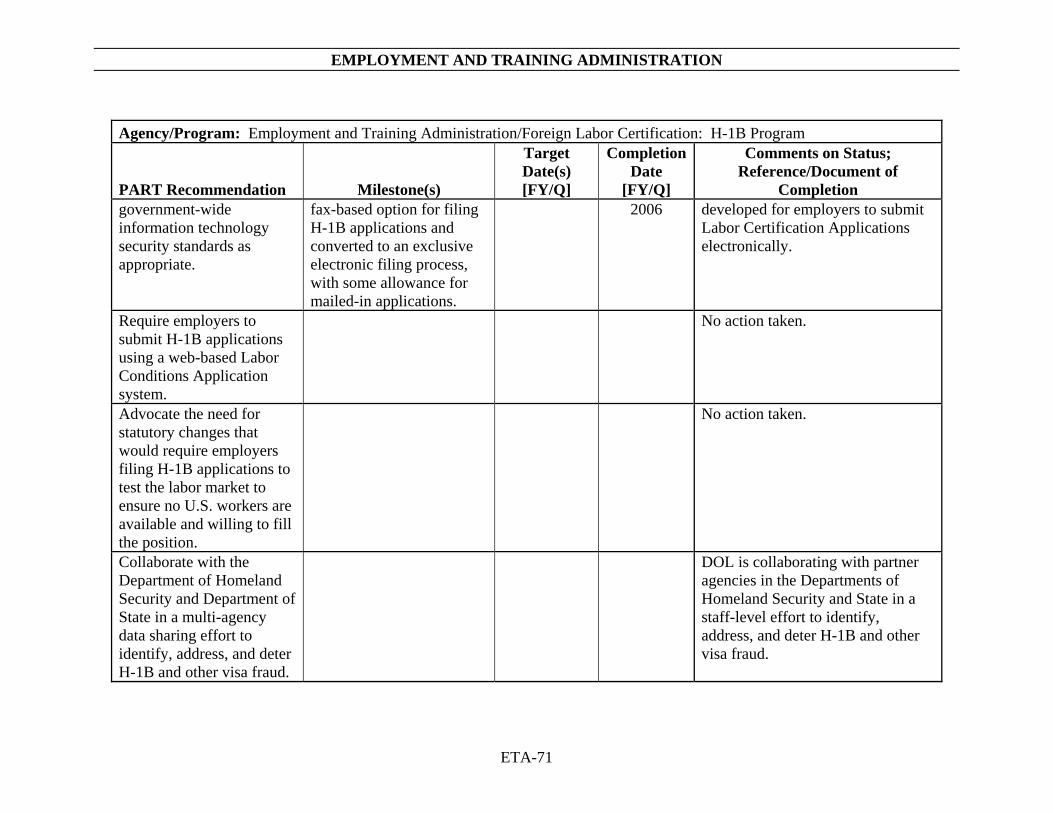
EMPLOYMENT AND TRAINING ADMINISTRATION
ETA-71
Agency/Program: Employment and Training Administration/Foreign Labor Certification: H-1B Program
PART Recommendation Milestone(s)
Target Date(s) [FY/Q]
Completion Date
[FY/Q]
Comments on Status; Reference/Document of
Completion government-wide information technology security standards as appropriate.
fax-based option for filing H-1B applications and converted to an exclusive electronic filing process, with some allowance for mailed-in applications.
2006
developed for employers to submit Labor Certification Applications electronically.
Require employers to submit H-1B applications using a web-based Labor Conditions Application system.
No action taken.
Advocate the need for statutory changes that would require employers filing H-1B applications to test the labor market to ensure no U.S. workers are available and willing to fill the position.
No action taken.
Collaborate with the Department of Homeland Security and Department of State in a multi-agency data sharing effort to identify, address, and deter H-1B and other visa fraud.
DOL is collaborating with partner agencies in the Departments of Homeland Security and State in a staff-level effort to identify, address, and deter H-1B and other visa fraud.
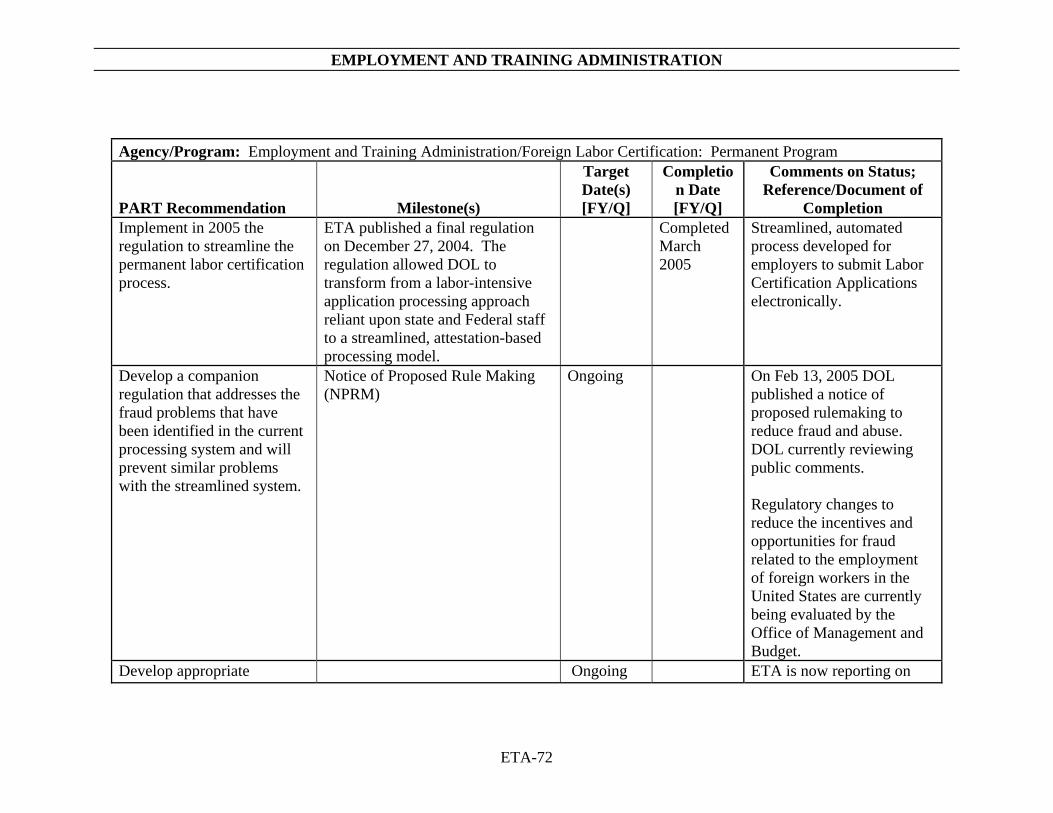
EMPLOYMENT AND TRAINING ADMINISTRATION
ETA-72
Agency/Program: Employment and Training Administration/Foreign Labor Certification: Permanent Program
PART Recommendation Milestone(s)
Target Date(s) [FY/Q]
Completion Date [FY/Q]
Comments on Status; Reference/Document of
Completion Implement in 2005 the regulation to streamline the permanent labor certification process.
ETA published a final regulation on December 27, 2004. The regulation allowed DOL to transform from a labor-intensive application processing approach reliant upon state and Federal staff to a streamlined, attestation-based processing model.
Completed March 2005
Streamlined, automated process developed for employers to submit Labor Certification Applications electronically.
Develop a companion regulation that addresses the fraud problems that have been identified in the current processing system and will prevent similar problems with the streamlined system.
Notice of Proposed Rule Making (NPRM)
Ongoing On Feb 13, 2005 DOL published a notice of proposed rulemaking to reduce fraud and abuse. DOL currently reviewing public comments. Regulatory changes to reduce the incentives and opportunities for fraud related to the employment of foreign workers in the United States are currently being evaluated by the Office of Management and Budget.
Develop appropriate Ongoing ETA is now reporting on
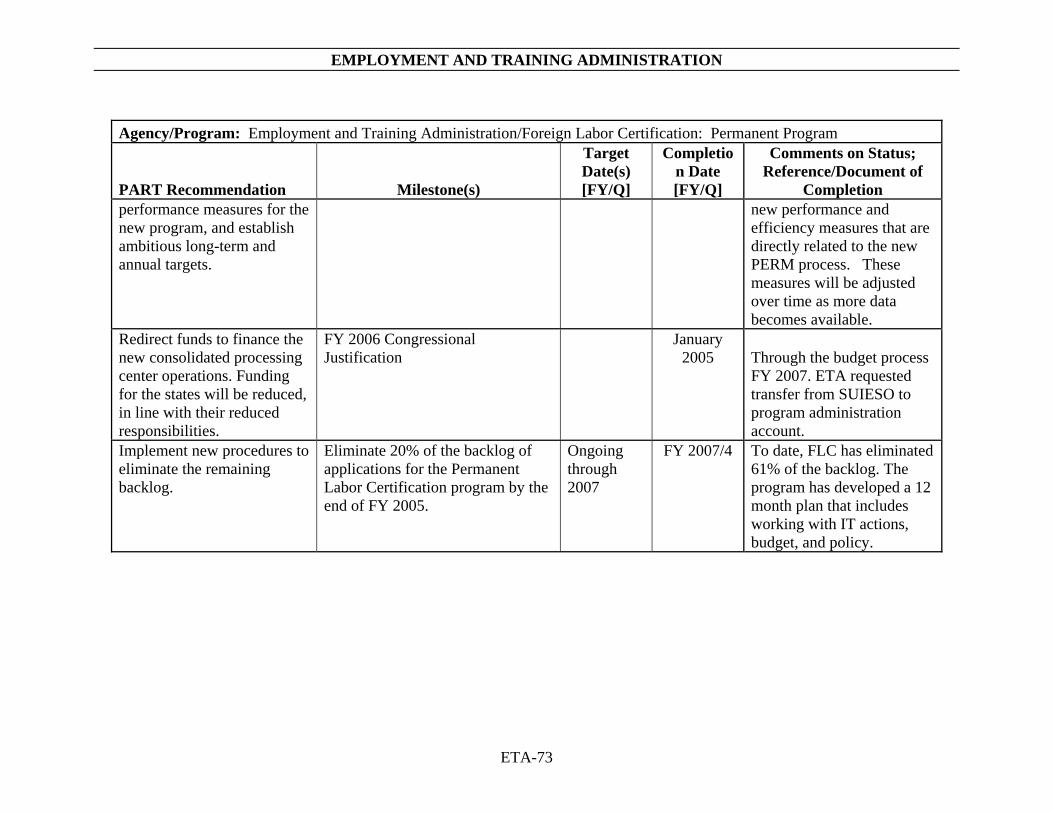
EMPLOYMENT AND TRAINING ADMINISTRATION
ETA-73
Agency/Program: Employment and Training Administration/Foreign Labor Certification: Permanent Program
PART Recommendation Milestone(s)
Target Date(s) [FY/Q]
Completion Date [FY/Q]
Comments on Status; Reference/Document of
Completion performance measures for the new program, and establish ambitious long-term and annual targets.
new performance and efficiency measures that are directly related to the new PERM process. These measures will be adjusted over time as more data becomes available.
Redirect funds to finance the new consolidated processing center operations. Funding for the states will be reduced, in line with their reduced responsibilities.
FY 2006 Congressional Justification
January 2005
Through the budget process FY 2007. ETA requested transfer from SUIESO to program administration account.
Implement new procedures to eliminate the remaining backlog.
Eliminate 20% of the backlog of applications for the Permanent Labor Certification program by the end of FY 2005.
Ongoing through 2007
FY 2007/4 To date, FLC has eliminated 61% of the backlog. The program has developed a 12 month plan that includes working with IT actions, budget, and policy.
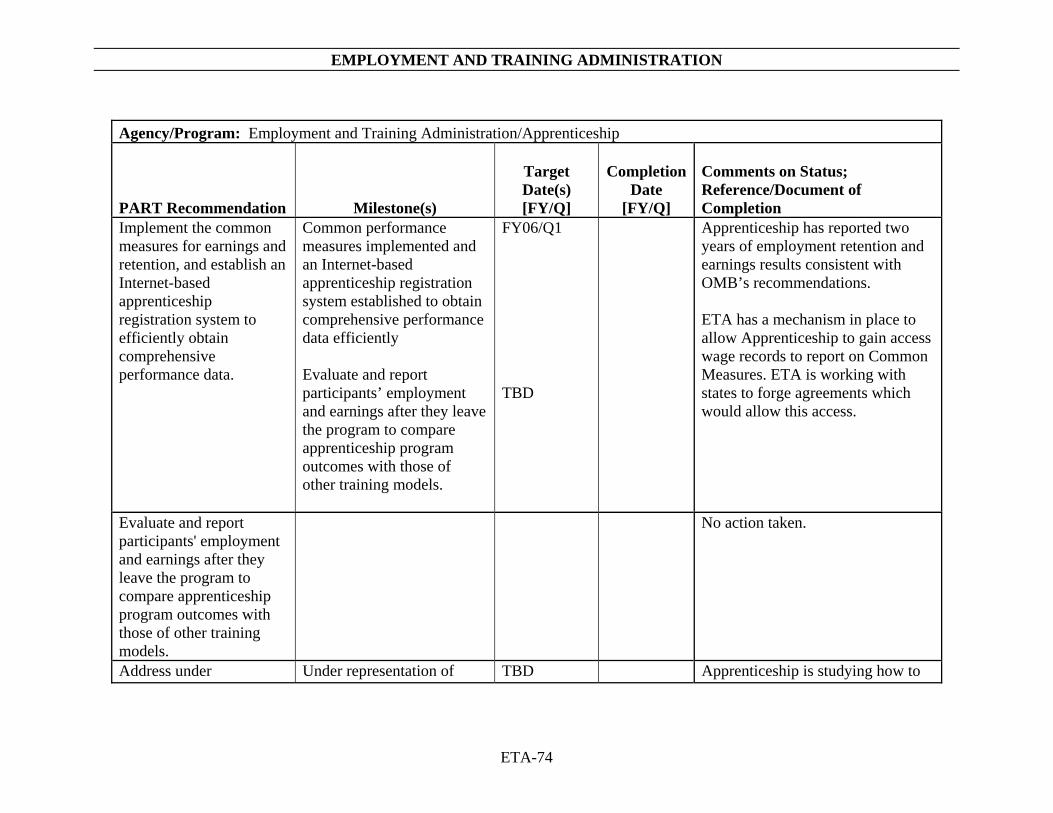
EMPLOYMENT AND TRAINING ADMINISTRATION
ETA-74
Agency/Program: Employment and Training Administration/Apprenticeship
PART Recommendation Milestone(s)
Target Date(s) [FY/Q]
Completion
Date [FY/Q]
Comments on Status; Reference/Document of Completion
Implement the common measures for earnings and retention, and establish an Internet-based apprenticeship registration system to efficiently obtain comprehensive performance data.
Common performance measures implemented and an Internet-based apprenticeship registration system established to obtain comprehensive performance data efficiently Evaluate and report participants’ employment and earnings after they leave the program to compare apprenticeship program outcomes with those of other training models.
FY06/Q1 TBD
Apprenticeship has reported two years of employment retention and earnings results consistent with OMB’s recommendations. ETA has a mechanism in place to allow Apprenticeship to gain access wage records to report on Common Measures. ETA is working with states to forge agreements which would allow this access.
Evaluate and report participants' employment and earnings after they leave the program to compare apprenticeship program outcomes with those of other training models.
No action taken.
Address under Under representation of TBD Apprenticeship is studying how to
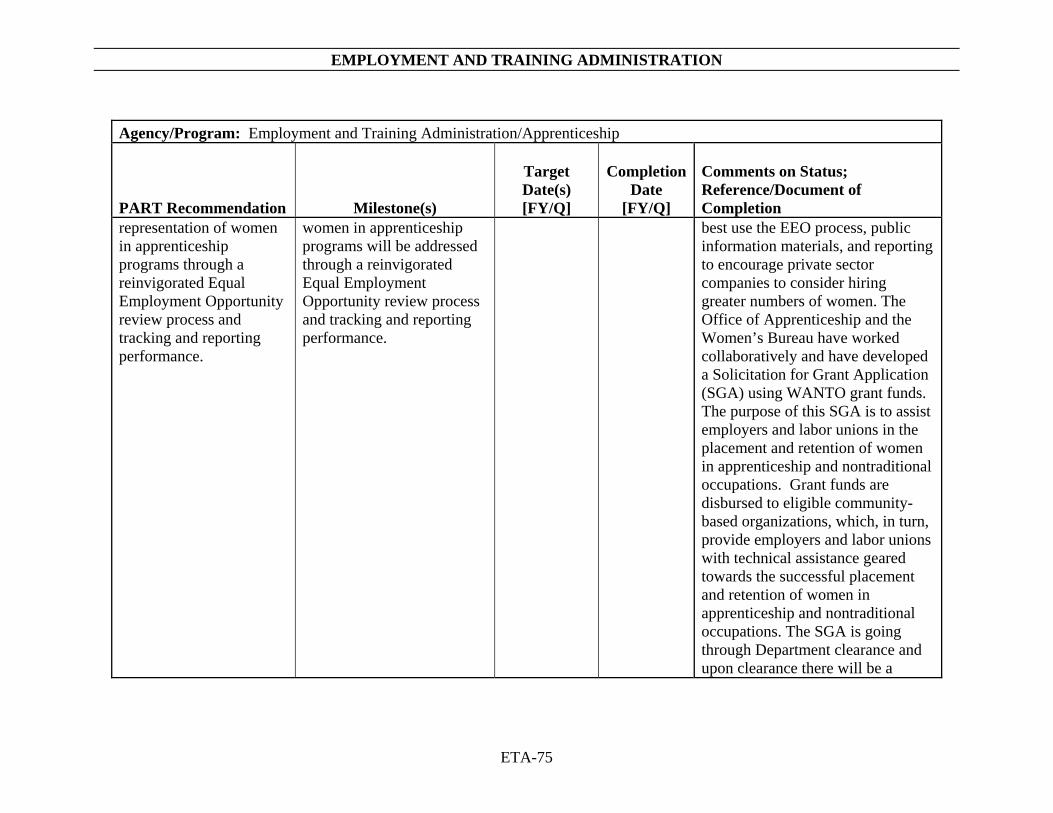
EMPLOYMENT AND TRAINING ADMINISTRATION
ETA-75
Agency/Program: Employment and Training Administration/Apprenticeship
PART Recommendation Milestone(s)
Target Date(s) [FY/Q]
Completion
Date [FY/Q]
Comments on Status; Reference/Document of Completion
representation of women in apprenticeship programs through a reinvigorated Equal Employment Opportunity review process and tracking and reporting performance.
women in apprenticeship programs will be addressed through a reinvigorated Equal Employment Opportunity review process and tracking and reporting performance.
best use the EEO process, public information materials, and reporting to encourage private sector companies to consider hiring greater numbers of women. The Office of Apprenticeship and the Women’s Bureau have worked collaboratively and have developed a Solicitation for Grant Application (SGA) using WANTO grant funds. The purpose of this SGA is to assist employers and labor unions in the placement and retention of women in apprenticeship and nontraditional occupations. Grant funds are disbursed to eligible community-based organizations, which, in turn, provide employers and labor unions with technical assistance geared towards the successful placement and retention of women in apprenticeship and nontraditional occupations. The SGA is going through Department clearance and upon clearance there will be a
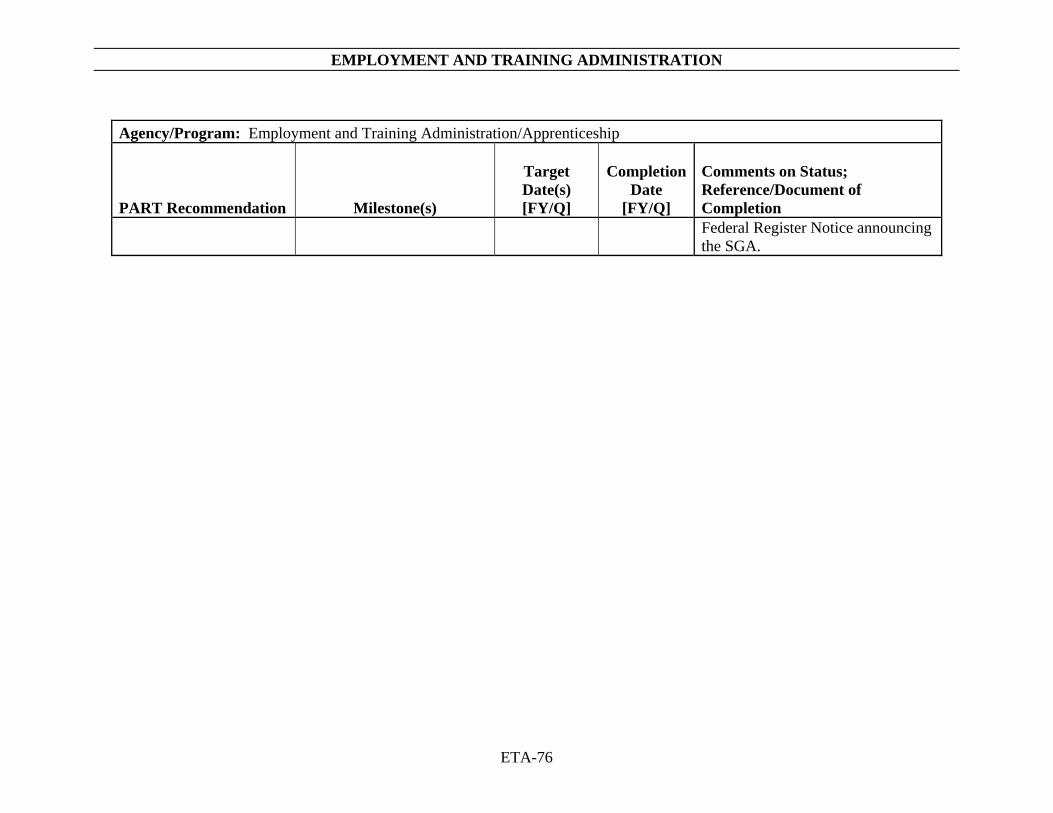
EMPLOYMENT AND TRAINING ADMINISTRATION
ETA-76
Agency/Program: Employment and Training Administration/Apprenticeship
PART Recommendation Milestone(s)
Target Date(s) [FY/Q]
Completion
Date [FY/Q]
Comments on Status; Reference/Document of Completion Federal Register Notice announcing the SGA.
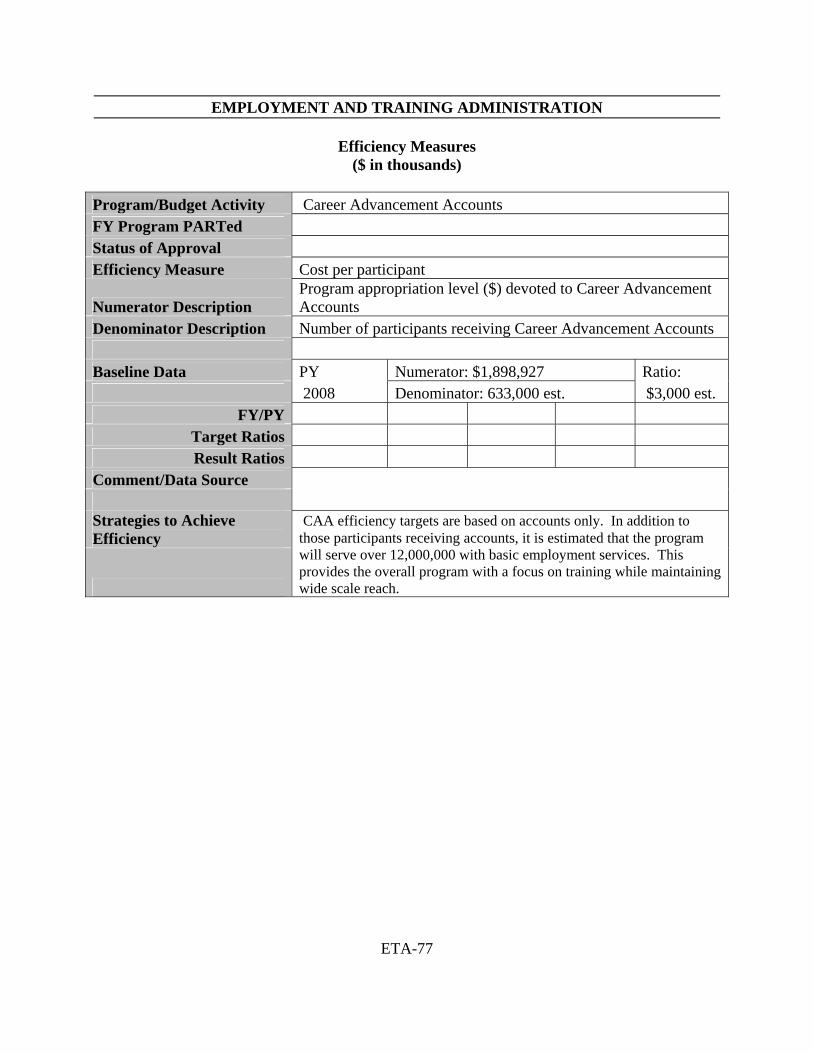
EMPLOYMENT AND TRAINING ADMINISTRATION
ETA-77
Efficiency Measures ($ in thousands)
Program/Budget Activity Career Advancement Accounts FY Program PARTed Status of Approval Efficiency Measure Cost per participant
Numerator Description Program appropriation level ($) devoted to Career Advancement Accounts
Denominator Description Number of participants receiving Career Advancement Accounts Baseline Data PY Numerator: $1,898,927 Ratio: 2008 Denominator: 633,000 est. $3,000 est.
FY/PY Target Ratios Result Ratios
Comment/Data Source
Strategies to Achieve Efficiency
CAA efficiency targets are based on accounts only. In addition to those participants receiving accounts, it is estimated that the program will serve over 12,000,000 with basic employment services. This provides the overall program with a focus on training while maintaining wide scale reach.
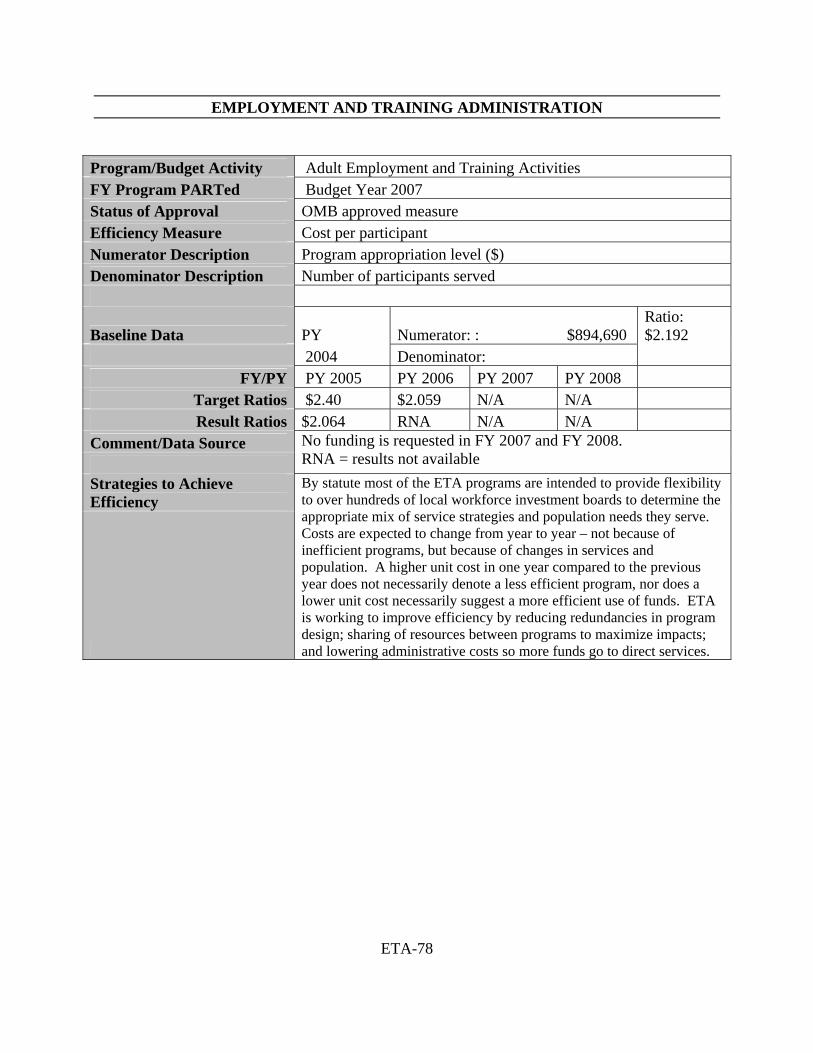
EMPLOYMENT AND TRAINING ADMINISTRATION
ETA-78
Program/Budget Activity Adult Employment and Training Activities FY Program PARTed Budget Year 2007 Status of Approval OMB approved measure Efficiency Measure Cost per participant Numerator Description Program appropriation level ($) Denominator Description Number of participants served
Baseline Data PY Numerator: : $894,690 Ratio: $2.192
2004 Denominator: FY/PY PY 2005 PY 2006 PY 2007 PY 2008
Target Ratios $2.40 $2.059 N/A N/A Result Ratios $2.064 RNA N/A N/A
Comment/Data Source
No funding is requested in FY 2007 and FY 2008. RNA = results not available
Strategies to Achieve Efficiency
By statute most of the ETA programs are intended to provide flexibility to over hundreds of local workforce investment boards to determine the appropriate mix of service strategies and population needs they serve. Costs are expected to change from year to year – not because of inefficient programs, but because of changes in services and population. A higher unit cost in one year compared to the previous year does not necessarily denote a less efficient program, nor does a lower unit cost necessarily suggest a more efficient use of funds. ETA is working to improve efficiency by reducing redundancies in program design; sharing of resources between programs to maximize impacts; and lowering administrative costs so more funds go to direct services.
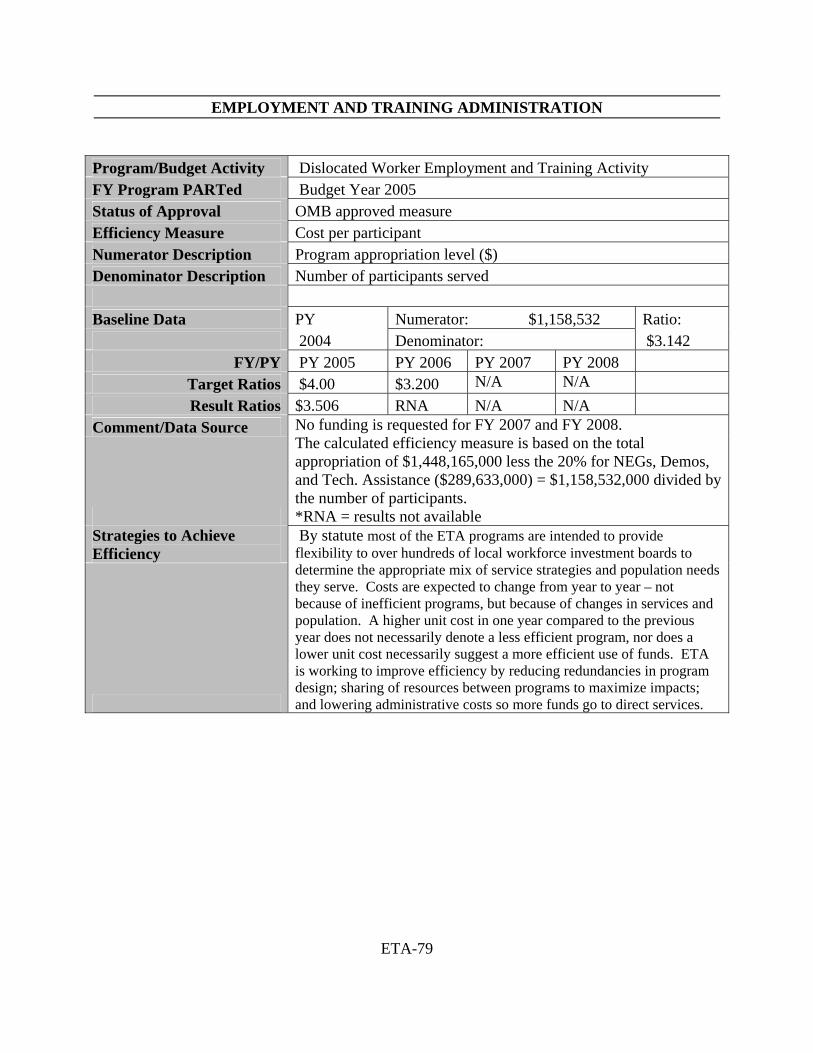
EMPLOYMENT AND TRAINING ADMINISTRATION
ETA-79
Program/Budget Activity Dislocated Worker Employment and Training Activity FY Program PARTed Budget Year 2005 Status of Approval OMB approved measure Efficiency Measure Cost per participant Numerator Description Program appropriation level ($) Denominator Description Number of participants served Baseline Data PY Numerator: $1,158,532 Ratio: 2004 Denominator: $3.142
FY/PY PY 2005 PY 2006 PY 2007 PY 2008 Target Ratios $4.00 $3.200 N/A N/A Result Ratios $3.506 RNA N/A N/A
Comment/Data Source
No funding is requested for FY 2007 and FY 2008. The calculated efficiency measure is based on the total appropriation of $1,448,165,000 less the 20% for NEGs, Demos, and Tech. Assistance ($289,633,000) = $1,158,532,000 divided by the number of participants. *RNA = results not available
Strategies to Achieve Efficiency
By statute most of the ETA programs are intended to provide flexibility to over hundreds of local workforce investment boards to determine the appropriate mix of service strategies and population needs they serve. Costs are expected to change from year to year – not because of inefficient programs, but because of changes in services and population. A higher unit cost in one year compared to the previous year does not necessarily denote a less efficient program, nor does a lower unit cost necessarily suggest a more efficient use of funds. ETA is working to improve efficiency by reducing redundancies in program design; sharing of resources between programs to maximize impacts; and lowering administrative costs so more funds go to direct services.
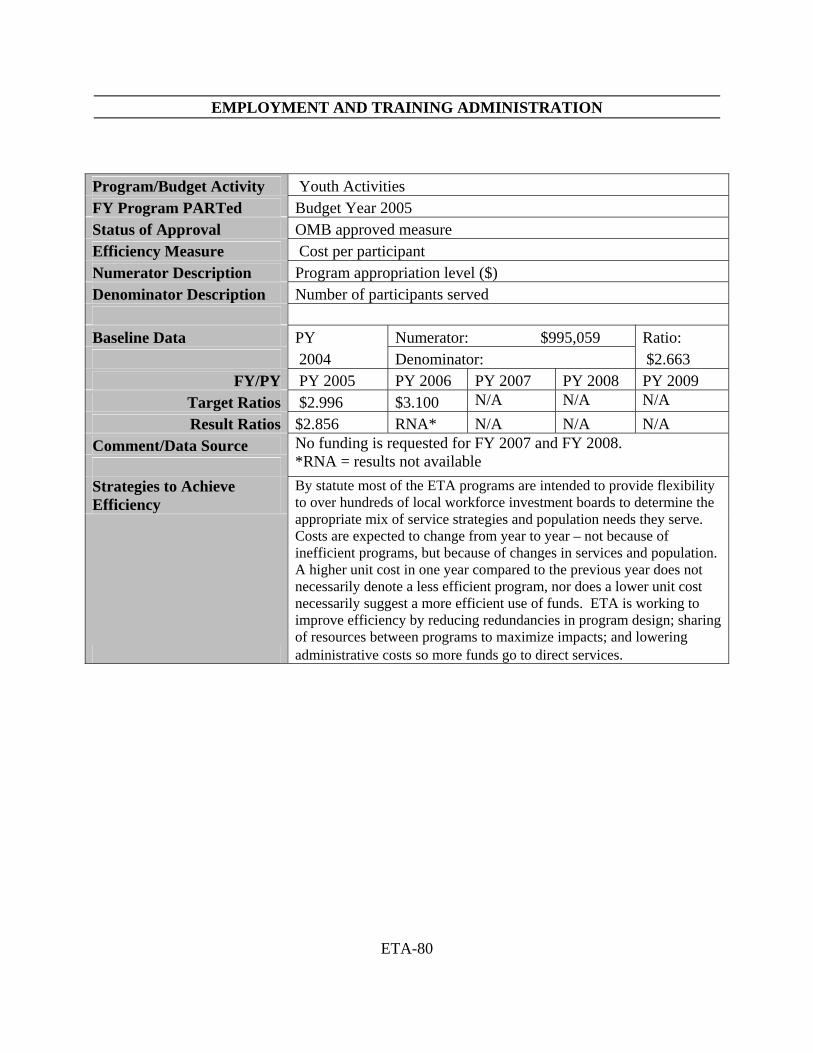
EMPLOYMENT AND TRAINING ADMINISTRATION
ETA-80
Program/Budget Activity Youth Activities FY Program PARTed Budget Year 2005 Status of Approval OMB approved measure Efficiency Measure Cost per participant Numerator Description Program appropriation level ($) Denominator Description Number of participants served Baseline Data PY Numerator: $995,059 Ratio: 2004 Denominator: $2.663
FY/PY PY 2005 PY 2006 PY 2007 PY 2008 PY 2009 Target Ratios $2.996 $3.100 N/A N/A N/A Result Ratios $2.856 RNA* N/A N/A N/A
Comment/Data Source
No funding is requested for FY 2007 and FY 2008. *RNA = results not available
Strategies to Achieve Efficiency
By statute most of the ETA programs are intended to provide flexibility to over hundreds of local workforce investment boards to determine the appropriate mix of service strategies and population needs they serve. Costs are expected to change from year to year – not because of inefficient programs, but because of changes in services and population. A higher unit cost in one year compared to the previous year does not necessarily denote a less efficient program, nor does a lower unit cost necessarily suggest a more efficient use of funds. ETA is working to improve efficiency by reducing redundancies in program design; sharing of resources between programs to maximize impacts; and lowering administrative costs so more funds go to direct services.
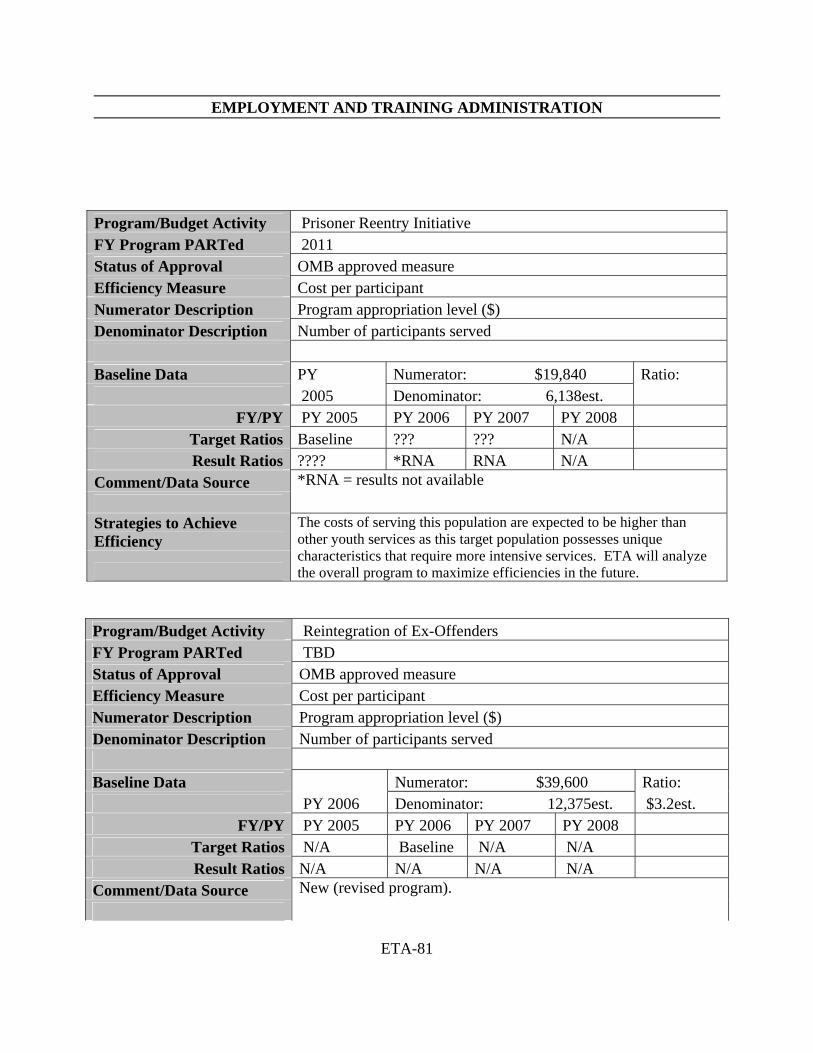
EMPLOYMENT AND TRAINING ADMINISTRATION
ETA-81
Program/Budget Activity Prisoner Reentry Initiative FY Program PARTed 2011 Status of Approval OMB approved measure Efficiency Measure Cost per participant Numerator Description Program appropriation level ($) Denominator Description Number of participants served Baseline Data PY Numerator: $19,840 Ratio: 2005 Denominator: 6,138est.
FY/PY PY 2005 PY 2006 PY 2007 PY 2008 Target Ratios Baseline ??? ??? N/A Result Ratios ???? *RNA RNA N/A
Comment/Data Source
*RNA = results not available
Strategies to Achieve Efficiency
The costs of serving this population are expected to be higher than other youth services as this target population possesses unique characteristics that require more intensive services. ETA will analyze the overall program to maximize efficiencies in the future.
Program/Budget Activity Reintegration of Ex-Offenders FY Program PARTed TBD Status of Approval OMB approved measure Efficiency Measure Cost per participant Numerator Description Program appropriation level ($) Denominator Description Number of participants served Baseline Data Numerator: $39,600 Ratio: PY 2006 Denominator: 12,375est. $3.2est.
FY/PY PY 2005 PY 2006 PY 2007 PY 2008 Target Ratios N/A Baseline N/A N/A Result Ratios N/A N/A N/A N/A
Comment/Data Source
New (revised program).
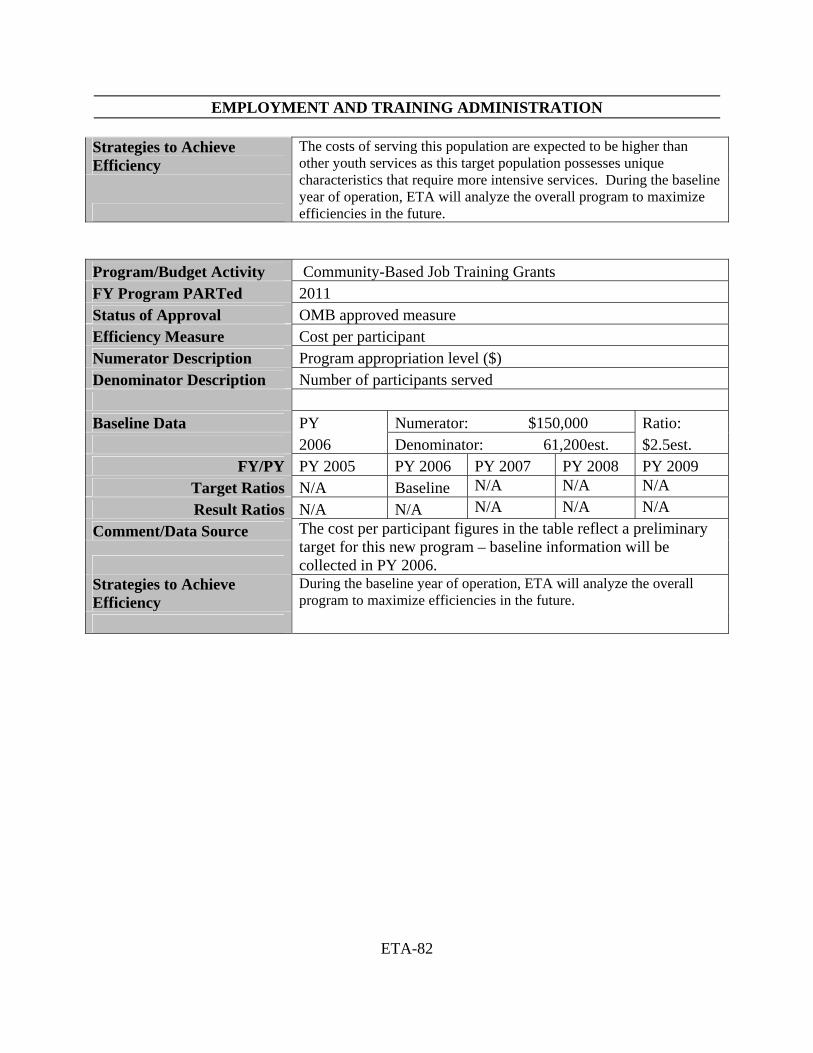
EMPLOYMENT AND TRAINING ADMINISTRATION
ETA-82
Strategies to Achieve Efficiency
The costs of serving this population are expected to be higher than other youth services as this target population possesses unique characteristics that require more intensive services. During the baseline year of operation, ETA will analyze the overall program to maximize efficiencies in the future.
Program/Budget Activity Community-Based Job Training Grants FY Program PARTed 2011 Status of Approval OMB approved measure Efficiency Measure Cost per participant Numerator Description Program appropriation level ($) Denominator Description Number of participants served Baseline Data PY Numerator: $150,000 Ratio: 2006 Denominator: 61,200est. $2.5est.
FY/PY PY 2005 PY 2006 PY 2007 PY 2008 PY 2009 Target Ratios N/A Baseline N/A N/A N/A Result Ratios N/A N/A N/A N/A N/A
Comment/Data Source
The cost per participant figures in the table reflect a preliminary target for this new program – baseline information will be collected in PY 2006.
Strategies to Achieve Efficiency
During the baseline year of operation, ETA will analyze the overall program to maximize efficiencies in the future.
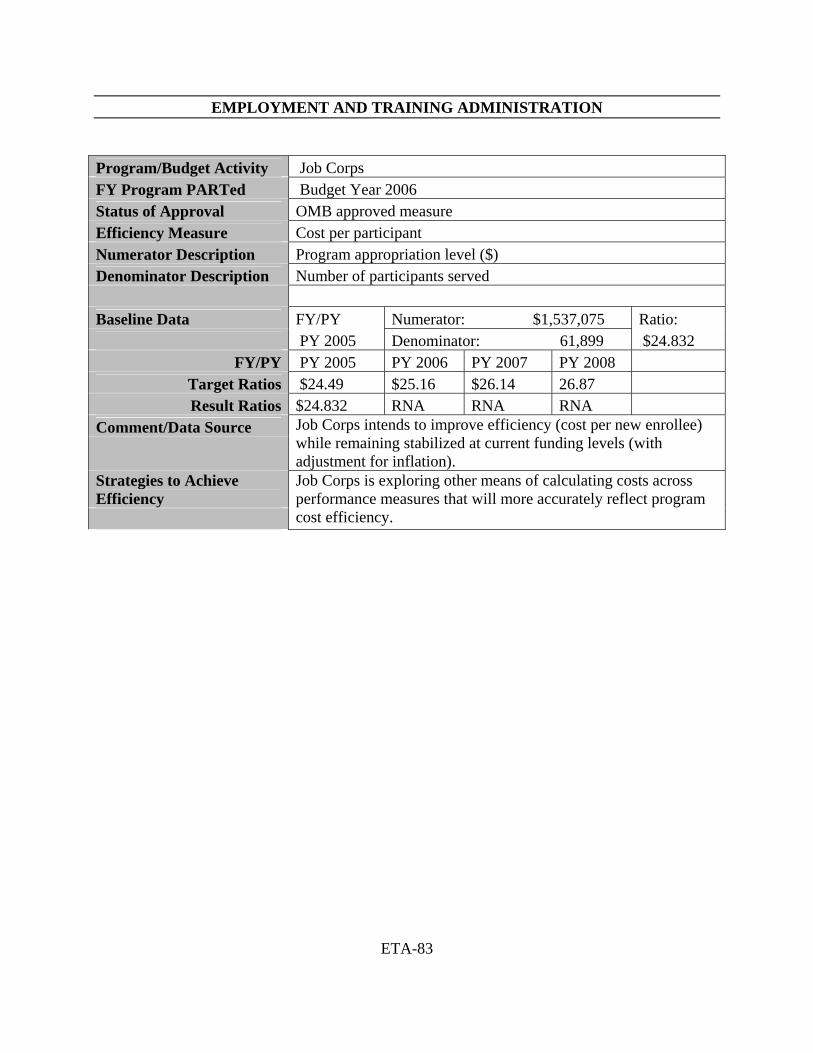
EMPLOYMENT AND TRAINING ADMINISTRATION
ETA-83
Program/Budget Activity Job Corps FY Program PARTed Budget Year 2006 Status of Approval OMB approved measure Efficiency Measure Cost per participant Numerator Description Program appropriation level ($) Denominator Description Number of participants served Baseline Data FY/PY Numerator: $1,537,075 Ratio: PY 2005 Denominator: 61,899 $24.832
FY/PY PY 2005 PY 2006 PY 2007 PY 2008 Target Ratios $24.49 $25.16 $26.14 26.87 Result Ratios $24.832 RNA RNA RNA
Comment/Data Source
Job Corps intends to improve efficiency (cost per new enrollee) while remaining stabilized at current funding levels (with adjustment for inflation).
Strategies to Achieve Efficiency
Job Corps is exploring other means of calculating costs across performance measures that will more accurately reflect program cost efficiency.
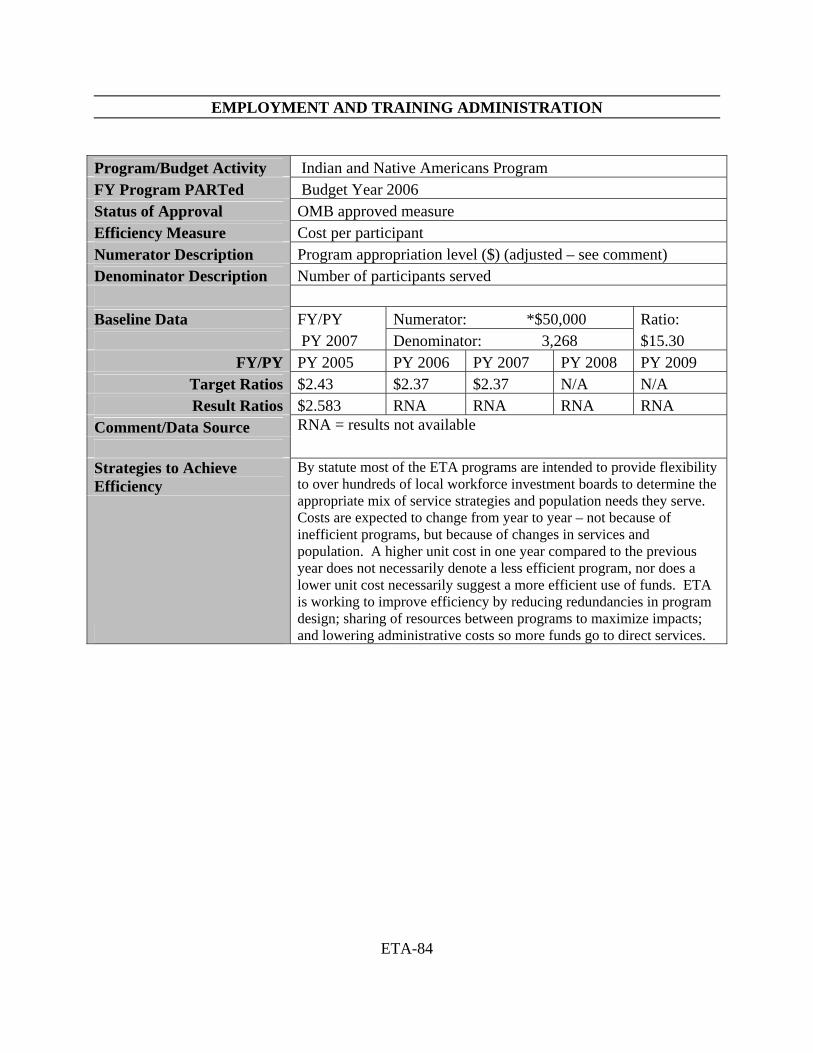
EMPLOYMENT AND TRAINING ADMINISTRATION
ETA-84
Program/Budget Activity Indian and Native Americans Program FY Program PARTed Budget Year 2006 Status of Approval OMB approved measure Efficiency Measure Cost per participant Numerator Description Program appropriation level ($) (adjusted – see comment) Denominator Description Number of participants served Baseline Data FY/PY Numerator: *$50,000 Ratio: PY 2007 Denominator: 3,268 $15.30
FY/PY PY 2005 PY 2006 PY 2007 PY 2008 PY 2009 Target Ratios $2.43 $2.37 $2.37 N/A N/A Result Ratios $2.583 RNA RNA RNA RNA
Comment/Data Source
RNA = results not available
Strategies to Achieve Efficiency
By statute most of the ETA programs are intended to provide flexibility to over hundreds of local workforce investment boards to determine the appropriate mix of service strategies and population needs they serve. Costs are expected to change from year to year – not because of inefficient programs, but because of changes in services and population. A higher unit cost in one year compared to the previous year does not necessarily denote a less efficient program, nor does a lower unit cost necessarily suggest a more efficient use of funds. ETA is working to improve efficiency by reducing redundancies in program design; sharing of resources between programs to maximize impacts; and lowering administrative costs so more funds go to direct services.
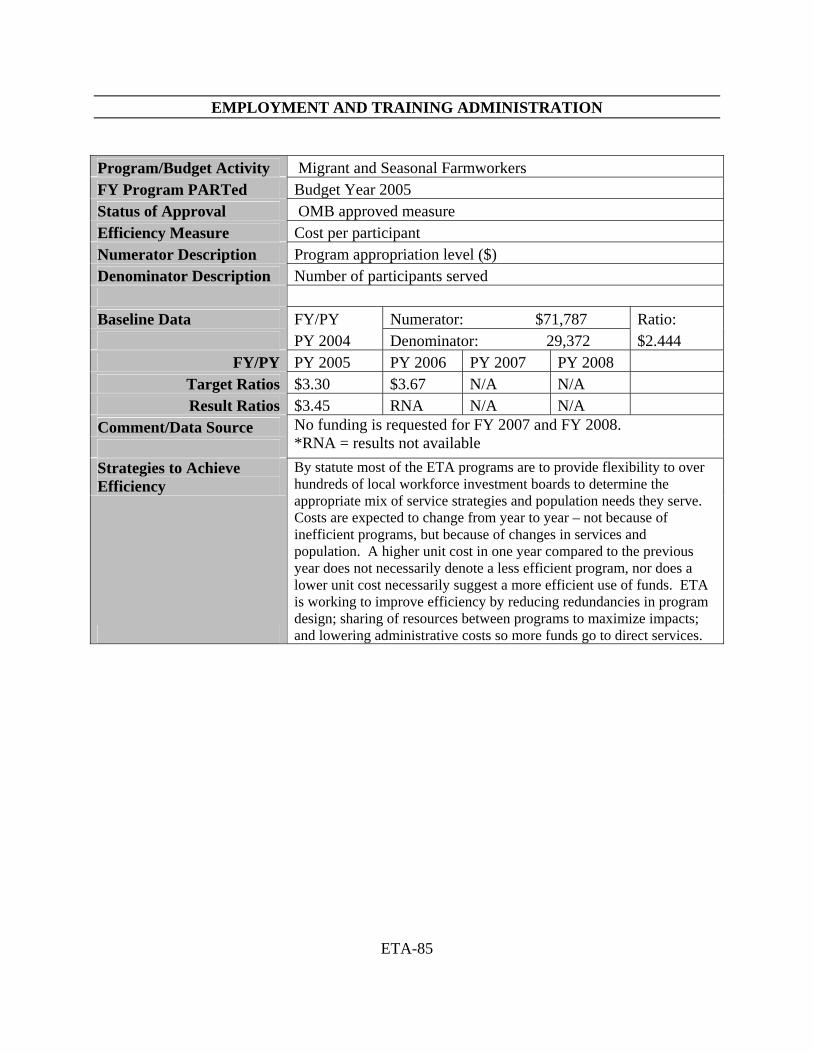
EMPLOYMENT AND TRAINING ADMINISTRATION
ETA-85
Program/Budget Activity Migrant and Seasonal Farmworkers FY Program PARTed Budget Year 2005 Status of Approval OMB approved measure Efficiency Measure Cost per participant Numerator Description Program appropriation level ($) Denominator Description Number of participants served Baseline Data FY/PY Numerator: $71,787 Ratio: PY 2004 Denominator: 29,372 $2.444
FY/PY PY 2005 PY 2006 PY 2007 PY 2008 Target Ratios $3.30 $3.67 N/A N/A Result Ratios $3.45 RNA N/A N/A
Comment/Data Source
No funding is requested for FY 2007 and FY 2008. *RNA = results not available
Strategies to Achieve Efficiency
By statute most of the ETA programs are to provide flexibility to over hundreds of local workforce investment boards to determine the appropriate mix of service strategies and population needs they serve. Costs are expected to change from year to year – not because of inefficient programs, but because of changes in services and population. A higher unit cost in one year compared to the previous year does not necessarily denote a less efficient program, nor does a lower unit cost necessarily suggest a more efficient use of funds. ETA is working to improve efficiency by reducing redundancies in program design; sharing of resources between programs to maximize impacts; and lowering administrative costs so more funds go to direct services.
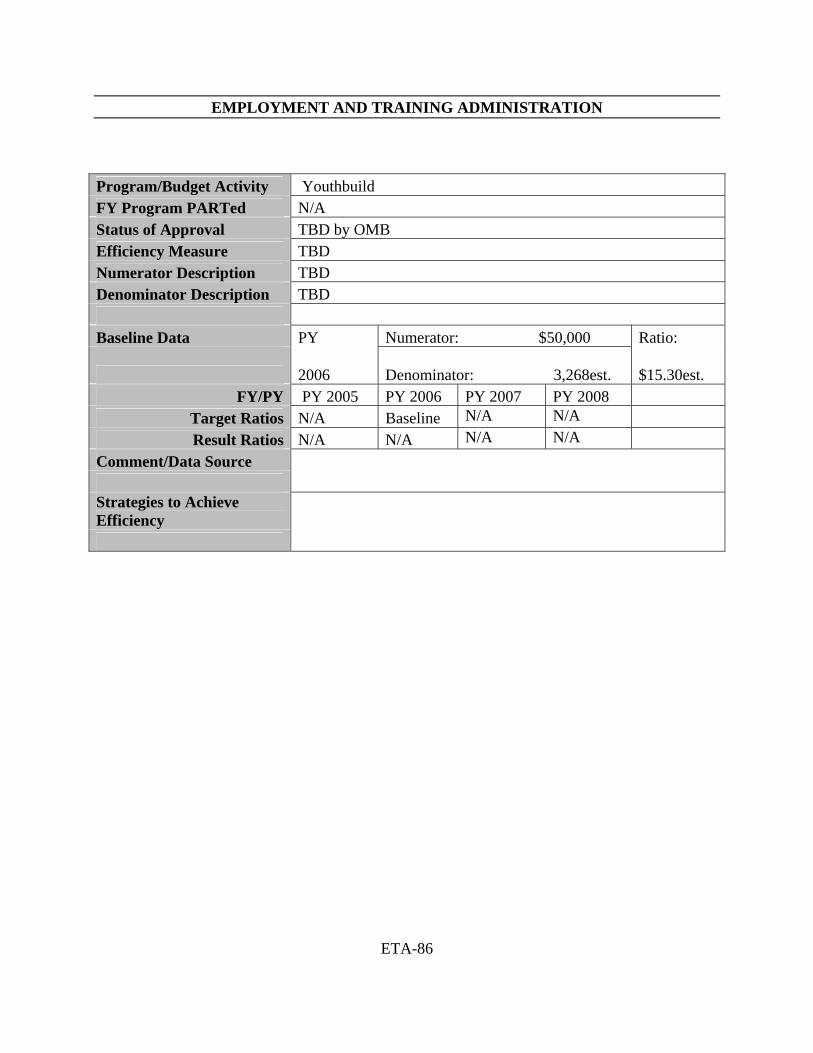
EMPLOYMENT AND TRAINING ADMINISTRATION
ETA-86
Program/Budget Activity Youthbuild FY Program PARTed N/A Status of Approval TBD by OMB Efficiency Measure TBD Numerator Description TBD Denominator Description TBD Baseline Data PY Numerator: $50,000 Ratio:
2006 Denominator: 3,268est. $15.30est.
FY/PY PY 2005 PY 2006 PY 2007 PY 2008 Target Ratios N/A Baseline N/A N/A Result Ratios N/A N/A N/A N/A
Comment/Data Source
Strategies to Achieve Efficiency
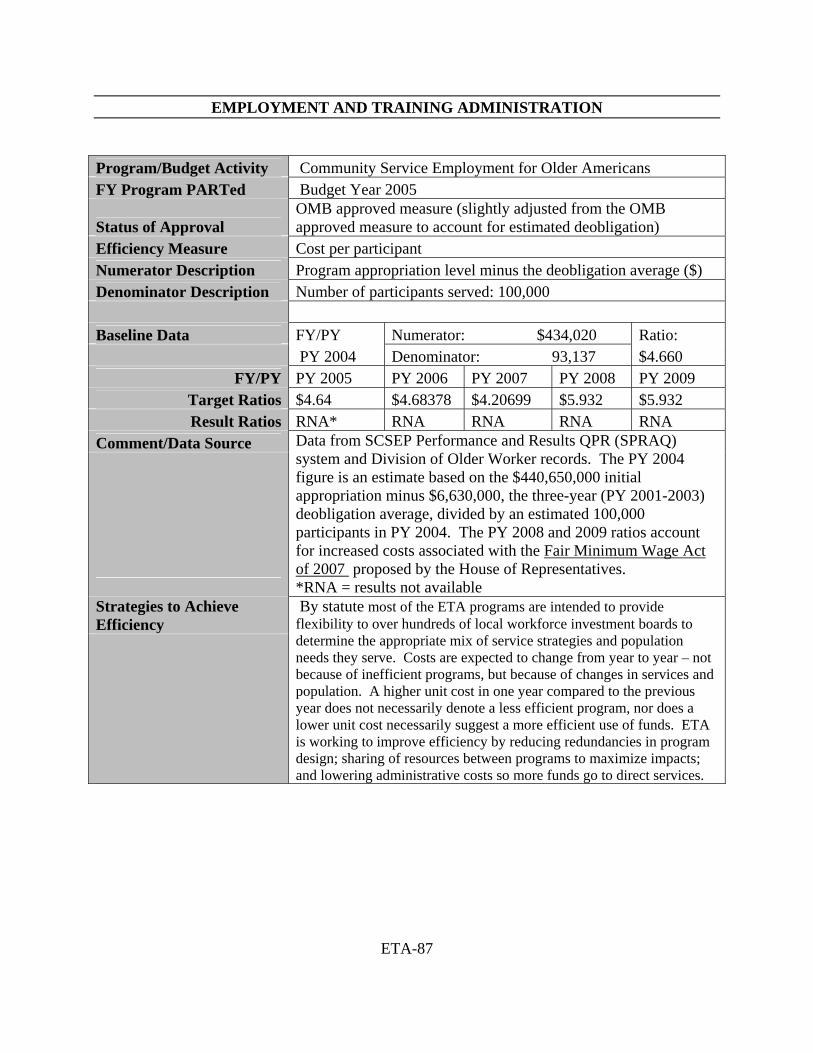
EMPLOYMENT AND TRAINING ADMINISTRATION
ETA-87
Program/Budget Activity Community Service Employment for Older Americans FY Program PARTed Budget Year 2005
Status of Approval OMB approved measure (slightly adjusted from the OMB approved measure to account for estimated deobligation)
Efficiency Measure Cost per participant Numerator Description Program appropriation level minus the deobligation average ($) Denominator Description Number of participants served: 100,000 Baseline Data FY/PY Numerator: $434,020 Ratio: PY 2004 Denominator: 93,137 $4.660
FY/PY PY 2005 PY 2006 PY 2007 PY 2008 PY 2009 Target Ratios $4.64 $4.68378 $4.20699 $5.932 $5.932 Result Ratios RNA* RNA RNA RNA RNA
Comment/Data Source
Data from SCSEP Performance and Results QPR (SPRAQ) system and Division of Older Worker records. The PY 2004 figure is an estimate based on the $440,650,000 initial appropriation minus $6,630,000, the three-year (PY 2001-2003) deobligation average, divided by an estimated 100,000 participants in PY 2004. The PY 2008 and 2009 ratios account for increased costs associated with the Fair Minimum Wage Act of 2007 proposed by the House of Representatives. *RNA = results not available
Strategies to Achieve Efficiency
By statute most of the ETA programs are intended to provide flexibility to over hundreds of local workforce investment boards to determine the appropriate mix of service strategies and population needs they serve. Costs are expected to change from year to year – not because of inefficient programs, but because of changes in services and population. A higher unit cost in one year compared to the previous year does not necessarily denote a less efficient program, nor does a lower unit cost necessarily suggest a more efficient use of funds. ETA is working to improve efficiency by reducing redundancies in program design; sharing of resources between programs to maximize impacts; and lowering administrative costs so more funds go to direct services.
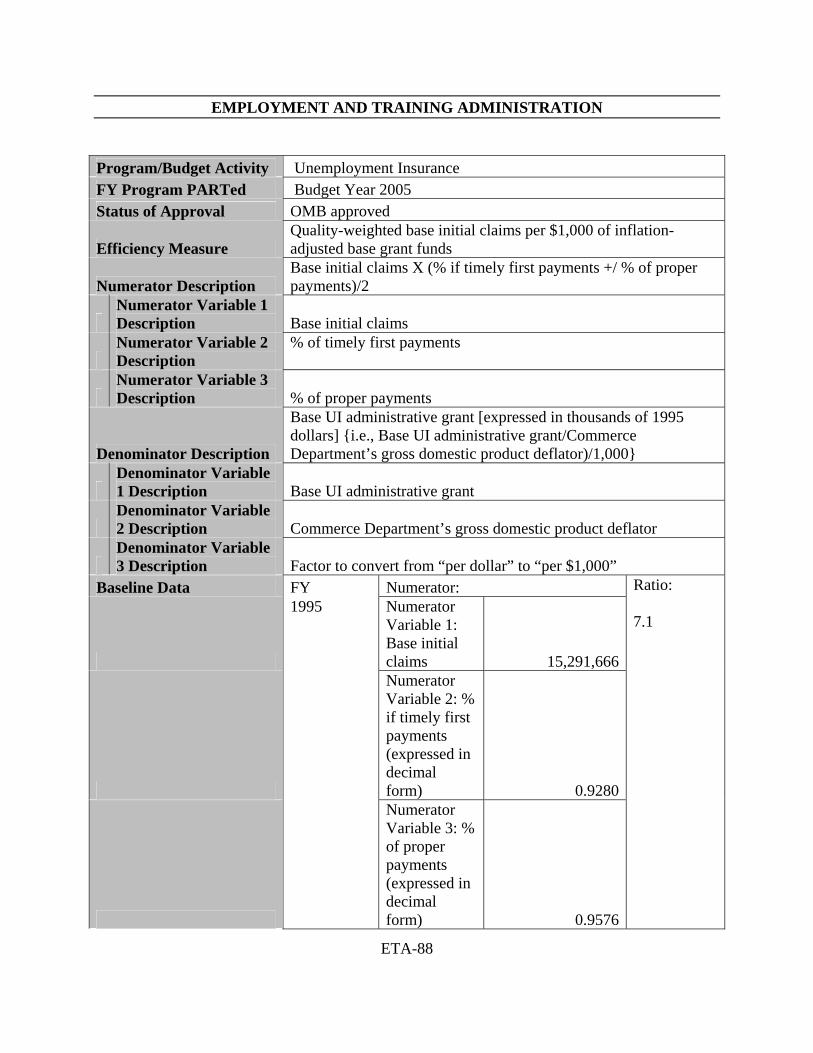
EMPLOYMENT AND TRAINING ADMINISTRATION
ETA-88
Program/Budget Activity Unemployment Insurance FY Program PARTed Budget Year 2005 Status of Approval OMB approved
Efficiency Measure Quality-weighted base initial claims per $1,000 of inflation-adjusted base grant funds
Numerator Description Base initial claims X (% if timely first payments +/ % of proper payments)/2
Numerator Variable 1 Description Base initial claims
Numerator Variable 2 Description
% of timely first payments
Numerator Variable 3 Description % of proper payments
Denominator Description
Base UI administrative grant [expressed in thousands of 1995 dollars] {i.e., Base UI administrative grant/Commerce Department’s gross domestic product deflator)/1,000}
Denominator Variable 1 Description Base UI administrative grant
Denominator Variable 2 Description Commerce Department’s gross domestic product deflator
Denominator Variable 3 Description Factor to convert from “per dollar” to “per $1,000”
Baseline Data FY Numerator:
Numerator Variable 1: Base initial claims 15,291,666
Numerator Variable 2: % if timely first payments (expressed in decimal form) 0.9280
1995
Numerator Variable 3: % of proper payments (expressed in decimal form) 0.9576
Ratio: 7.1
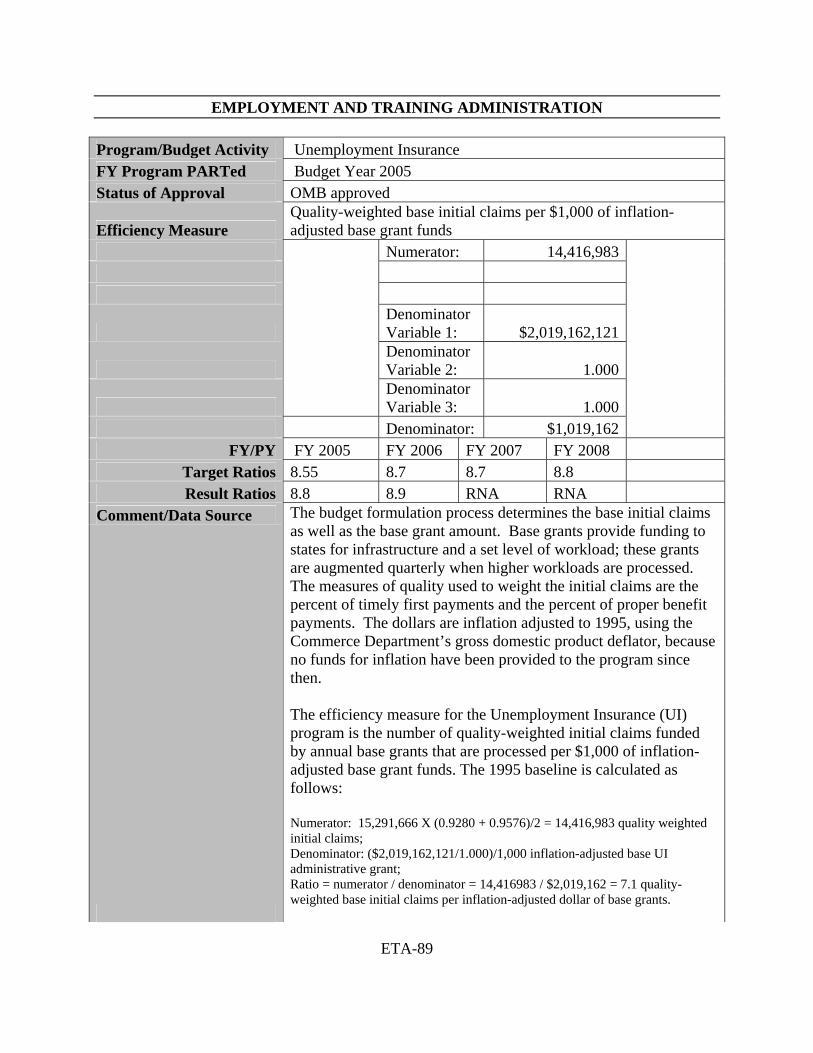
EMPLOYMENT AND TRAINING ADMINISTRATION
ETA-89
Program/Budget Activity Unemployment Insurance FY Program PARTed Budget Year 2005 Status of Approval OMB approved
Efficiency Measure Quality-weighted base initial claims per $1,000 of inflation-adjusted base grant funds
Numerator: 14,416,983
Denominator Variable 1: $2,019,162,121
Denominator Variable 2: 1.000
Denominator Variable 3: 1.000
Denominator: $1,019,162 FY/PY FY 2005 FY 2006 FY 2007 FY 2008
Target Ratios 8.55 8.7 8.7 8.8 Result Ratios 8.8 8.9 RNA RNA
Comment/Data Source
The budget formulation process determines the base initial claims as well as the base grant amount. Base grants provide funding to states for infrastructure and a set level of workload; these grants are augmented quarterly when higher workloads are processed. The measures of quality used to weight the initial claims are the percent of timely first payments and the percent of proper benefit payments. The dollars are inflation adjusted to 1995, using the Commerce Department’s gross domestic product deflator, because no funds for inflation have been provided to the program since then. The efficiency measure for the Unemployment Insurance (UI) program is the number of quality-weighted initial claims funded by annual base grants that are processed per $1,000 of inflation-adjusted base grant funds. The 1995 baseline is calculated as follows: Numerator: 15,291,666 X (0.9280 + 0.9576)/2 = 14,416,983 quality weighted initial claims; Denominator: ($2,019,162,121/1.000)/1,000 inflation-adjusted base UI administrative grant; Ratio = numerator / denominator = 14,416983 / $2,019,162 = 7.1 quality-weighted base initial claims per inflation-adjusted dollar of base grants.
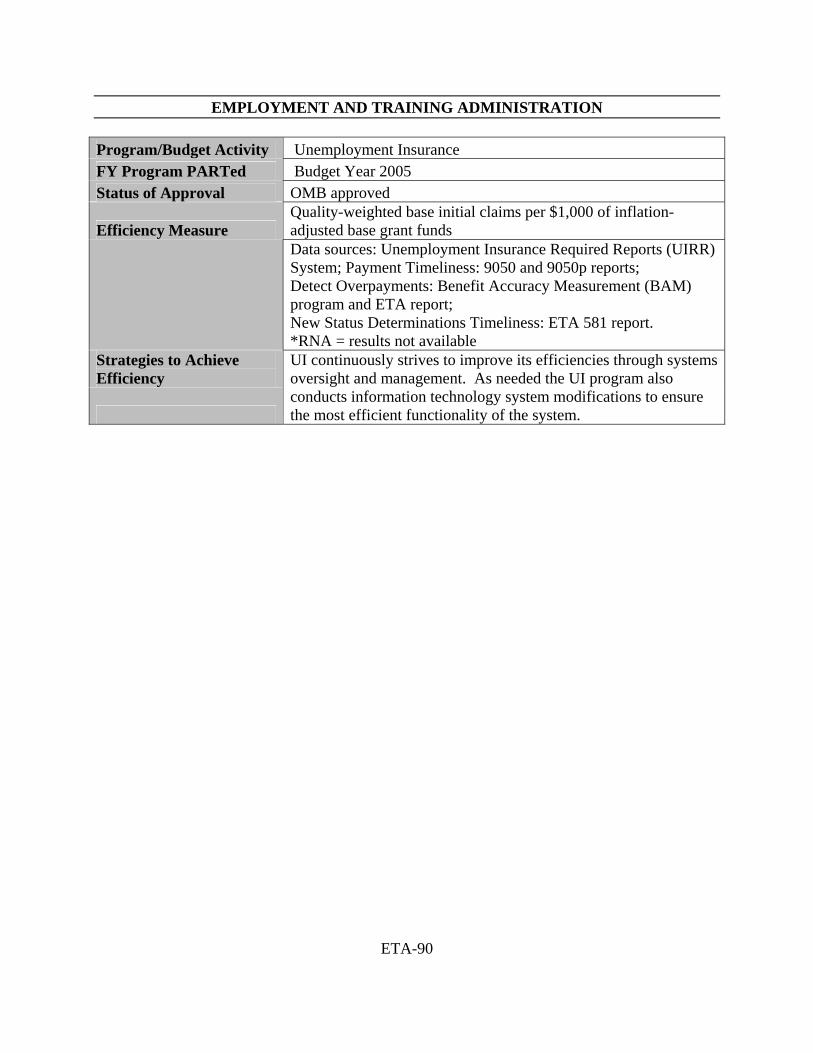
EMPLOYMENT AND TRAINING ADMINISTRATION
ETA-90
Program/Budget Activity Unemployment Insurance FY Program PARTed Budget Year 2005 Status of Approval OMB approved
Efficiency Measure Quality-weighted base initial claims per $1,000 of inflation-adjusted base grant funds Data sources: Unemployment Insurance Required Reports (UIRR) System; Payment Timeliness: 9050 and 9050p reports; Detect Overpayments: Benefit Accuracy Measurement (BAM) program and ETA report; New Status Determinations Timeliness: ETA 581 report. *RNA = results not available
Strategies to Achieve Efficiency
UI continuously strives to improve its efficiencies through systems oversight and management. As needed the UI program also conducts information technology system modifications to ensure the most efficient functionality of the system.
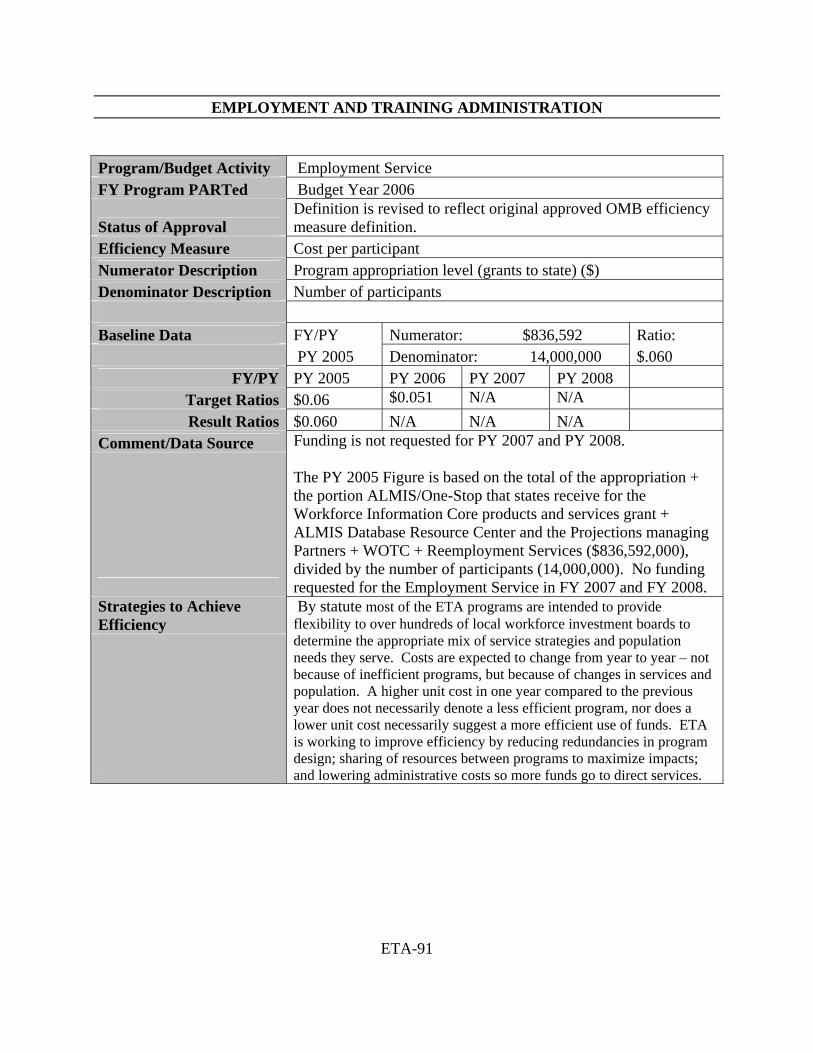
EMPLOYMENT AND TRAINING ADMINISTRATION
ETA-91
Program/Budget Activity Employment Service FY Program PARTed Budget Year 2006
Status of Approval Definition is revised to reflect original approved OMB efficiency measure definition.
Efficiency Measure Cost per participant Numerator Description Program appropriation level (grants to state) ($) Denominator Description Number of participants Baseline Data FY/PY Numerator: $836,592 Ratio: PY 2005 Denominator: 14,000,000 $.060
FY/PY PY 2005 PY 2006 PY 2007 PY 2008 Target Ratios $0.06 $0.051 N/A N/A Result Ratios $0.060 N/A N/A N/A
Comment/Data Source
Funding is not requested for PY 2007 and PY 2008. The PY 2005 Figure is based on the total of the appropriation + the portion ALMIS/One-Stop that states receive for the Workforce Information Core products and services grant + ALMIS Database Resource Center and the Projections managing Partners + WOTC + Reemployment Services ($836,592,000), divided by the number of participants (14,000,000). No funding requested for the Employment Service in FY 2007 and FY 2008.
Strategies to Achieve Efficiency
By statute most of the ETA programs are intended to provide flexibility to over hundreds of local workforce investment boards to determine the appropriate mix of service strategies and population needs they serve. Costs are expected to change from year to year – not because of inefficient programs, but because of changes in services and population. A higher unit cost in one year compared to the previous year does not necessarily denote a less efficient program, nor does a lower unit cost necessarily suggest a more efficient use of funds. ETA is working to improve efficiency by reducing redundancies in program design; sharing of resources between programs to maximize impacts; and lowering administrative costs so more funds go to direct services.
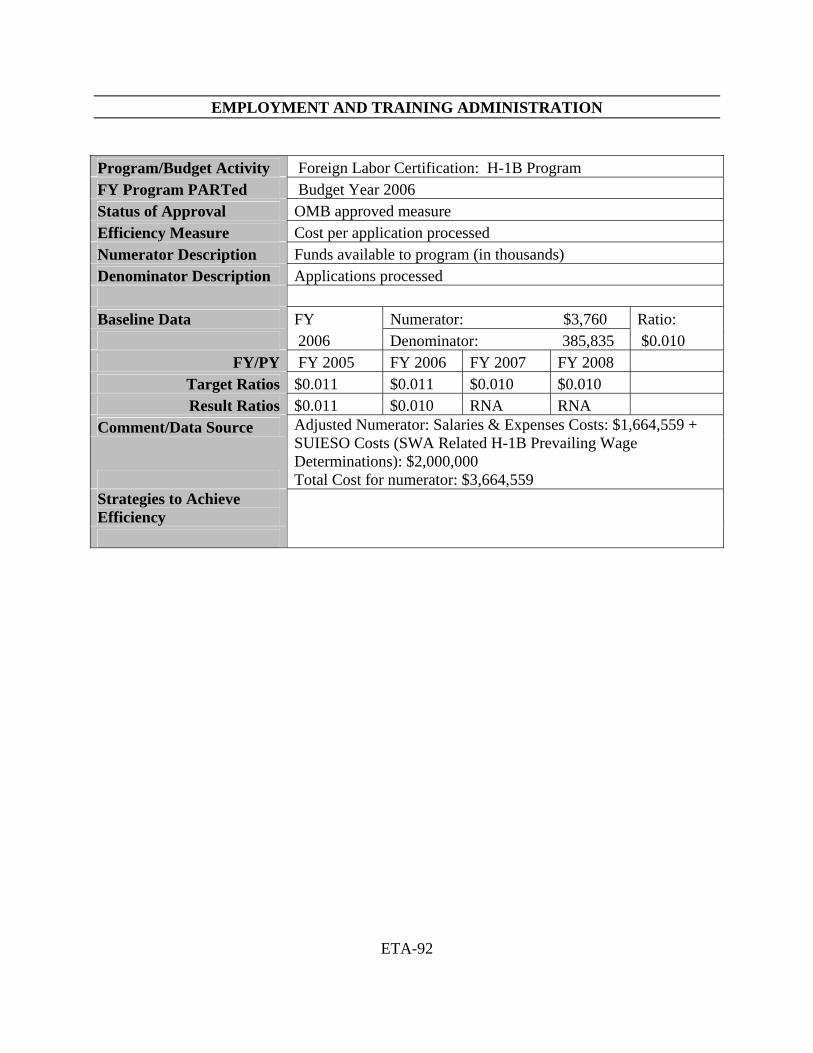
EMPLOYMENT AND TRAINING ADMINISTRATION
ETA-92
Program/Budget Activity Foreign Labor Certification: H-1B Program FY Program PARTed Budget Year 2006 Status of Approval OMB approved measure Efficiency Measure Cost per application processed Numerator Description Funds available to program (in thousands) Denominator Description Applications processed Baseline Data FY Numerator: $3,760 Ratio: 2006 Denominator: 385,835 $0.010
FY/PY FY 2005 FY 2006 FY 2007 FY 2008 Target Ratios $0.011 $0.011 $0.010 $0.010 Result Ratios $0.011 $0.010 RNA RNA
Comment/Data Source
Adjusted Numerator: Salaries & Expenses Costs: $1,664,559 + SUIESO Costs (SWA Related H-1B Prevailing Wage Determinations): $2,000,000 Total Cost for numerator: $3,664,559
Strategies to Achieve Efficiency
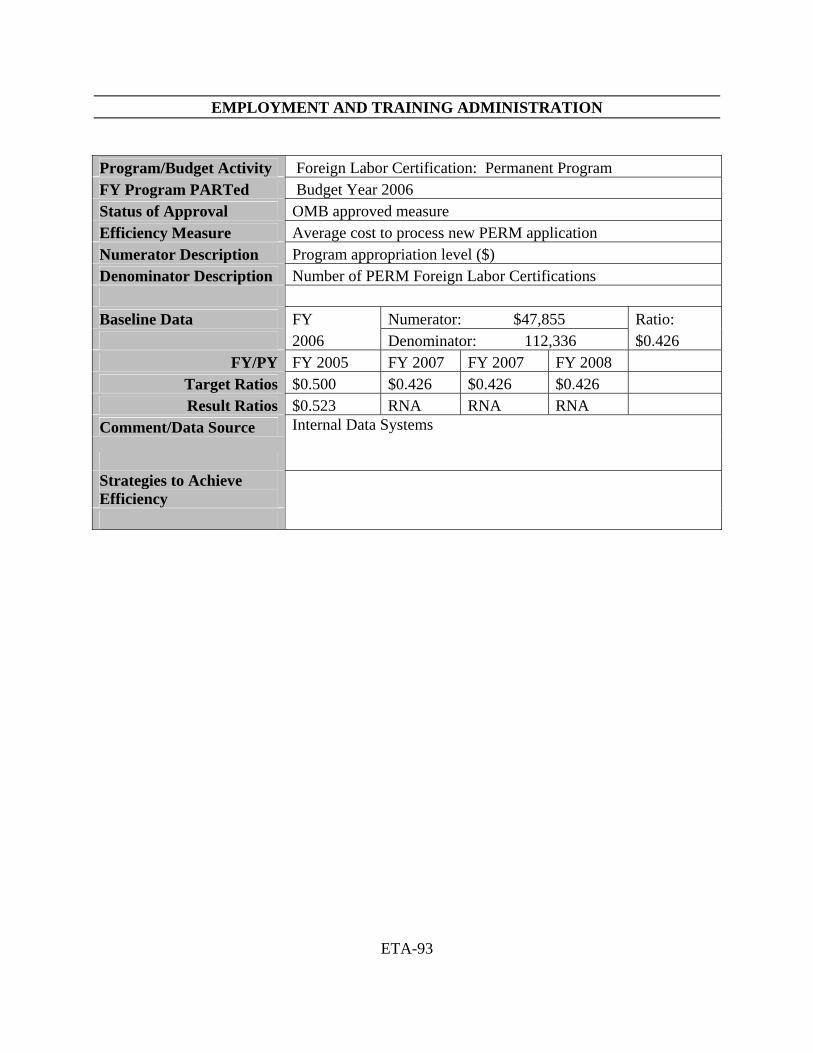
EMPLOYMENT AND TRAINING ADMINISTRATION
ETA-93
Program/Budget Activity Foreign Labor Certification: Permanent Program FY Program PARTed Budget Year 2006 Status of Approval OMB approved measure Efficiency Measure Average cost to process new PERM application Numerator Description Program appropriation level ($) Denominator Description Number of PERM Foreign Labor Certifications Baseline Data FY Numerator: $47,855 Ratio: 2006 Denominator: 112,336 $0.426
FY/PY FY 2005 FY 2007 FY 2007 FY 2008 Target Ratios $0.500 $0.426 $0.426 $0.426 Result Ratios $0.523 RNA RNA RNA
Comment/Data Source
Internal Data Systems
Strategies to Achieve Efficiency
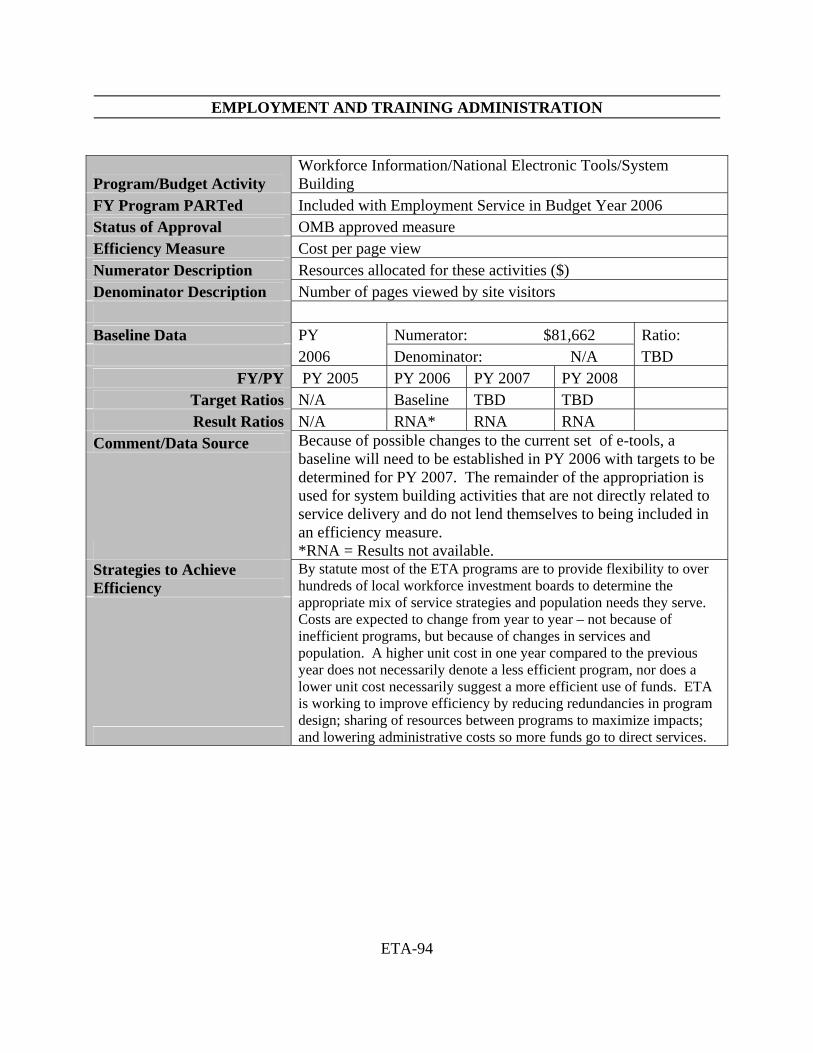
EMPLOYMENT AND TRAINING ADMINISTRATION
ETA-94
Program/Budget Activity Workforce Information/National Electronic Tools/System Building
FY Program PARTed Included with Employment Service in Budget Year 2006 Status of Approval OMB approved measure Efficiency Measure Cost per page view Numerator Description Resources allocated for these activities ($) Denominator Description Number of pages viewed by site visitors Baseline Data PY Numerator: $81,662 Ratio: 2006 Denominator: N/A TBD
FY/PY PY 2005 PY 2006 PY 2007 PY 2008 Target Ratios N/A Baseline TBD TBD Result Ratios N/A RNA* RNA RNA
Comment/Data Source
Because of possible changes to the current set of e-tools, a baseline will need to be established in PY 2006 with targets to be determined for PY 2007. The remainder of the appropriation is used for system building activities that are not directly related to service delivery and do not lend themselves to being included in an efficiency measure. *RNA = Results not available.
Strategies to Achieve Efficiency
By statute most of the ETA programs are to provide flexibility to over hundreds of local workforce investment boards to determine the appropriate mix of service strategies and population needs they serve. Costs are expected to change from year to year – not because of inefficient programs, but because of changes in services and population. A higher unit cost in one year compared to the previous year does not necessarily denote a less efficient program, nor does a lower unit cost necessarily suggest a more efficient use of funds. ETA is working to improve efficiency by reducing redundancies in program design; sharing of resources between programs to maximize impacts; and lowering administrative costs so more funds go to direct services.
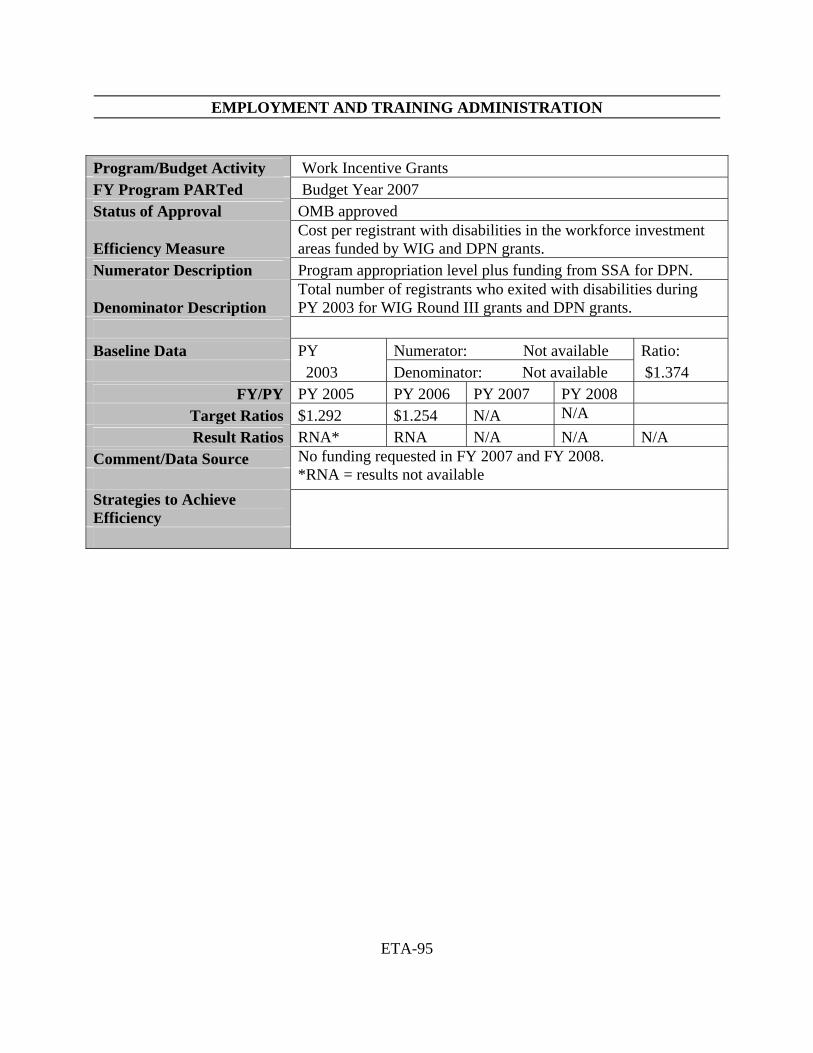
EMPLOYMENT AND TRAINING ADMINISTRATION
ETA-95
Program/Budget Activity Work Incentive Grants FY Program PARTed Budget Year 2007 Status of Approval OMB approved
Efficiency Measure Cost per registrant with disabilities in the workforce investment areas funded by WIG and DPN grants.
Numerator Description Program appropriation level plus funding from SSA for DPN.
Denominator Description Total number of registrants who exited with disabilities during PY 2003 for WIG Round III grants and DPN grants.
Baseline Data PY Numerator: Not available Ratio: 2003 Denominator: Not available $1.374
FY/PY PY 2005 PY 2006 PY 2007 PY 2008 Target Ratios $1.292 $1.254 N/A N/A Result Ratios RNA* RNA N/A N/A N/A
Comment/Data Source
No funding requested in FY 2007 and FY 2008. *RNA = results not available
Strategies to Achieve Efficiency
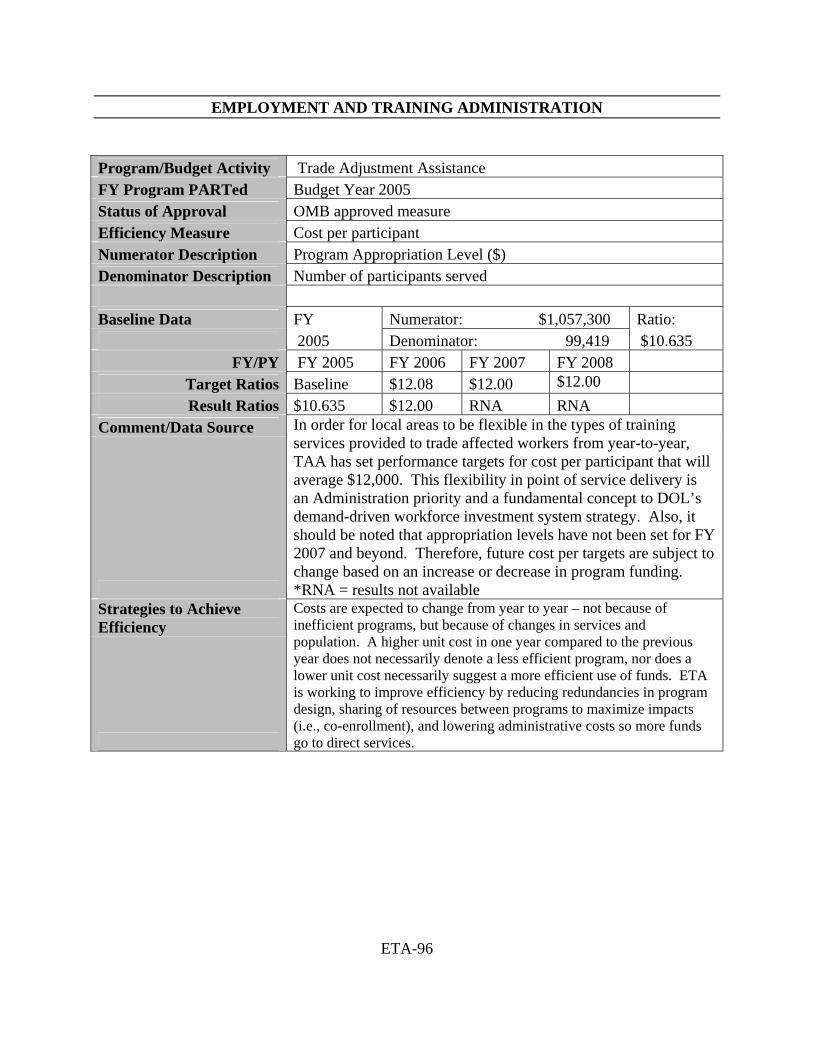
EMPLOYMENT AND TRAINING ADMINISTRATION
ETA-96
Program/Budget Activity Trade Adjustment Assistance FY Program PARTed Budget Year 2005 Status of Approval OMB approved measure Efficiency Measure Cost per participant Numerator Description Program Appropriation Level ($) Denominator Description Number of participants served Baseline Data FY Numerator: $1,057,300 Ratio: 2005 Denominator: 99,419 $10.635
FY/PY FY 2005 FY 2006 FY 2007 FY 2008 Target Ratios Baseline $12.08 $12.00 $12.00 Result Ratios $10.635 $12.00 RNA RNA
Comment/Data Source
In order for local areas to be flexible in the types of training services provided to trade affected workers from year-to-year, TAA has set performance targets for cost per participant that will average $12,000. This flexibility in point of service delivery is an Administration priority and a fundamental concept to DOL’s demand-driven workforce investment system strategy. Also, it should be noted that appropriation levels have not been set for FY 2007 and beyond. Therefore, future cost per targets are subject to change based on an increase or decrease in program funding. *RNA = results not available
Strategies to Achieve Efficiency
Costs are expected to change from year to year – not because of inefficient programs, but because of changes in services and population. A higher unit cost in one year compared to the previous year does not necessarily denote a less efficient program, nor does a lower unit cost necessarily suggest a more efficient use of funds. ETA is working to improve efficiency by reducing redundancies in program design, sharing of resources between programs to maximize impacts (i.e., co-enrollment), and lowering administrative costs so more funds go to direct services.
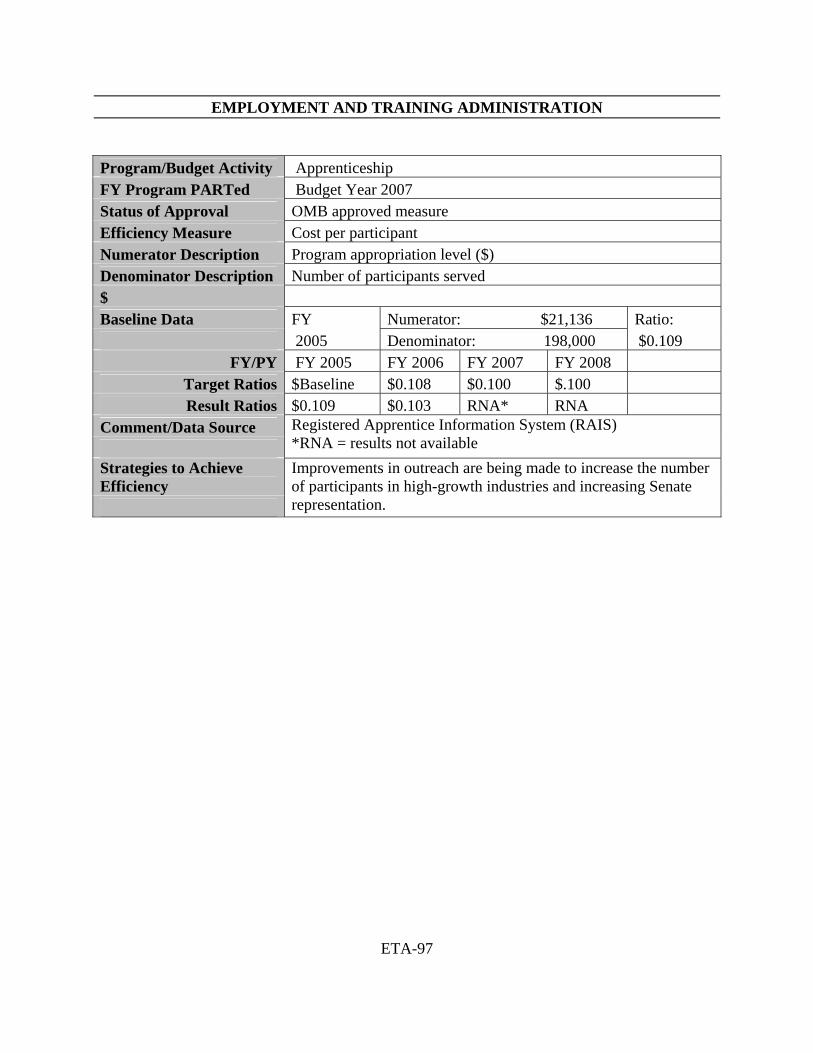
EMPLOYMENT AND TRAINING ADMINISTRATION
ETA-97
Program/Budget Activity Apprenticeship FY Program PARTed Budget Year 2007 Status of Approval OMB approved measure Efficiency Measure Cost per participant Numerator Description Program appropriation level ($) Denominator Description Number of participants served $ Baseline Data FY Numerator: $21,136 Ratio: 2005 Denominator: 198,000 $0.109
FY/PY FY 2005 FY 2006 FY 2007 FY 2008 Target Ratios $Baseline $0.108 $0.100 $.100 Result Ratios $0.109 $0.103 RNA* RNA
Comment/Data Source
Registered Apprentice Information System (RAIS) *RNA = results not available
Strategies to Achieve Efficiency
Improvements in outreach are being made to increase the number of participants in high-growth industries and increasing Senate representation.