Embed Size (px)
Citation preview

FY 2015HUD INCOME LIMITSBRIEFING MATERIAL
U.S. Department of Housing and Urban DevelopmentOffice of Policy Development & Research
March 10, 2015
FY 2015 INCOME LIMITS BRIEFING MATERIAL
Overview of HUD Section 8 Income Limits
FY 2015 Median Family Income Estimates
Overview
ACS Data and its Use in the Production of Median Family Incomes
Margin of Error
Trend Factor
Median Family Income Estimate Calculations
FY 2015 Income Limits
Overview
Very Low-Income Limits
Low-Income Limits
30 Percent of Area Median Family Income Limits
Family Size Adjustments
5 Percent Rule
Housing and Economic Recovery Act of 2008
Income Limit Applications
Department of Housing and Urban Development
Rural Housing and Community Development Service
Treasury Programs
Federal Deposit Insurance Corporation
Federal Home Loan Banks
Federal Housing Finance Agency
Other Federal Banking Regulatory Provisions
Uniform Relocation Act
Department of Veterans Affairs

2ATTACHMENTS
Attachment 1: U.S. Housing Act of 1937 Provisions Related to Income Limits
Attachment 2: HUD Methodology for Estimating FY 2015 Median Family Incomes
Attachment 3: Metropolitan FMR Areas with Adjusted FY 2015 Very Low-Income Limits
Attachment 4: Metropolitan FMR Areas with Adjusted FY 2015 Low-Income Limits
Attachment 5: FY 2015 Median Family Incomes for States, Metropolitan andNonmetropolitan Portions of States

1
Overview of HUD Section 8 Income Limits1
The Department of Housing and Urban Development (HUD) is required by law to setincome limits that determine the eligibility of applicants for HUD's assisted housing programs.The major active assisted housing programs are the Public Housing program, the Section 8Housing Choice Voucher program, Section 202 housing for the elderly program, and Section 811housing for persons with disabilities program.
HUD Section 8 Income Limits begin with the production of Median Family Incomeestimates. HUD uses the Section 8 program’s Fair Market Rent (FMR) area definitions indeveloping median family income estimates (MFIs), which means that income estimates aredeveloped for each metropolitan area, parts of some metropolitan areas, and eachnon-metropolitan county. The final FY 2015 FMR areas are based on Office of Managementand Budget (OMB) metropolitan area definitions as updated through December 1, 2009, andinclude HUD modifications that were first used in the determination of FY 2006 FMR areas.The February 28, 2013, OMB Area definition update has not been incorporated in the FMRprocess due to the timing of the release and the availability of ACS data. HUD will incorporatethese new area definitions into the Proposed FY 2016 FMR calculations. HUD Section 8 IncomeLimits are calculated for every FMR area with adjustments for family size and for areas that haveunusually high or low income-to-housing-cost relationships.
The statutory basis for HUD's income limit policies is Section 3 of the U.S. Housing Actof 1937, as amended.2 Attachment 1 provides the key excerpts relevant to income limits, whichmay be summarized as follows:
Low-income families are defined as families whose incomes do not exceed 80 percent of themedian family income for the area.
Very low-income families are defined as families whose incomes do not exceed 50 percent of themedian family income for the area.
The FY 2014 Continuing Appropriations Act defines Extremely Low-Income Families as verylow-income families whose income do not exceed the greater of 30 percent of the median familyincome for the area or the federal poverty guidelines as published by the Department of Healthand Human Services. The poverty guidelines are capped by the Very Low-Income Limit.
Income limits for non-metropolitan areas may not be less than limits based on the State non-metropolitan median family income level.
Income limits are adjusted for family size.
1 Also known as HUD Public Housing/Section 8 Income Limits2 42 U.S.C. 1437b

2
Income limits are adjusted for areas with unusually high or low family income or housing-cost-to-income relationships.
The Secretary of Agriculture is to be consulted prior to establishing income limits for rural areas,since these limits also apply to certain Rural Housing and Community Development Serviceprograms.

3
FY 2015 Median Family Income Estimates
Overview
For FY 2014, HUD updated the methodology to produce Median Family Income (MFI)estimates to take advantage of new data available from the Bureau of the Census’ AmericanCommunity Survey (ACS), the Puerto Rico Community Survey (PRCS). The PRCS wasreleased in June, 2012, providing data aggregated from 2007 through 20113 and was used in theFY 2014 MFI estimate in place of the updated 2000 Census data for Puerto Rico. The FY 2015MFI estimates use the 2008 -2012 5-year ACS and PRCS data, augmented by the 2012 1-yearACS and PRCS data. The 2012 data are inflated using a Consumer Price Index (CPI) forecastfrom the Congressional Budget Office (CBO) through the midpoint of FY 2015.
ACS Data and its Use in the Production of Median Family Incomes
The ACS, conducted annually, was designed to produce estimates similar to the long-formsample survey previously conducted with the Decennial Census after 5 years of data becameavailable to be aggregated together for a given area. Each year since full implementation of thesurvey in 2005, the Census Bureau collected an ACS sample sufficient to provide estimates ofmost survey items for areas with populations of 65,000 or more. After the 2007 ACS, theCensus Bureau released data aggregated from the ACS samples collected over the three years,2005, 2006, and 2007. This allowed the Census Bureau to release estimates for most items forareas with populations of 20,000 or more. FY 2010 MFIs reflected ACS survey data aggregatedover 2006, 2007 and 2008. Since the release of the 2009 ACS sample, the Census Bureau hassufficient data to release aggregated 5-year estimates. Five year estimates are designed toprovide estimates for areas of all sizes relevant to MFI and income limit production.
As mentioned above, the FY 2015 MFIs incorporate the 2008-2012 5-year ACS data into thecalculation process. Specifically, for each metropolitan area, subarea of a metropolitan area, andnon-metropolitan county, HUD uses 5-year ACS data as the new basis for calculating MFIestimates. In areas with a valid 1-year ACS survey median family income result, HUDincorporates this data as well to take advantage of more recent survey information. By usingboth the 5-year data and the 1-year data, where available, HUD establishes a new basis formedian family income estimates while also capturing the most recent information available.
3 The ACS covers the 50 United States, and a separate survey called the PRCS covers Puerto Rico. The 2012 ACSand the 2012 PRCS are used in the calculation of the FY 2015 median family incomes. The US Virgin Islands andthe Pacific Islands (American Samoa, Commonwealth of the Northern Mariana Islands, and Guam) are not coveredby the ACS or PRCS. Detailed demographic and socio-economic information covering these island areas have beencollected by a special Long Form survey conducted in conjunction with the 2010 Decennial Census. These data willbe incorporated into the FY 2016 median family incomes. For FY 2015 median family income calculations, HUDcontinues to use the change in the national median income between the 2000 Decennial Census and the latest ACSdata as the update factor for the US Virgin Islands and the Pacific Islands.

4Margin of Error
HUD begins by setting the base median family income equal to the 2008-2012 5-year ACSsurvey value. For areas with a valid 2012 1-year survey result, HUD uses the margin of error forthe 1-year data to ensure that the 1-year MFI are statistically reliable. Where the 1-year data arestatistically reliable (i.e., where the margin of error is lower than the estimate itself), HUD usesthe 1-year survey result as the base value for median family income. In the few cases where thestatistical confidence interval for the 5-year ACS estimate of median family income includeszero, HUD assigns the state nonmetropolitan median. For more information, please see sectionE – Median Family Income Estimate Calculations.
CPI Inflation and Trend Factor
In calculating the FY 2015 MFI estimates, HUD decided to replace the trend factor based on theannualized change in national median family income over the last five years because theDepartment determined this was no longer a reasonable expectation of upcoming income growth.Consequently, the Department incorporated a CPI forecast from CBO into the process in order toaccount for anticipated income growth over the next year. For FY 2015, MFI estimates based onthe 2012 ACS data (the middle of 2012) are inflated to the mid-point of FY 2015. The CBOprojection of CPI, published in August 2014 is used to inflate the 2012 data.
Median Family Income Estimate Calculations
Median family4 incomes start with the development of estimates of median familyincome for the metropolitan areas and non-metropolitan FMR/income limit areas (including U.S.territories). Attachment 2 provides a detailed explanation of how median family incomeestimates are calculated. The major steps are as follows:
HUD uses 2008-2012 5-year ACS estimates of median family income calculated as the basis forFY 2015 median family incomes for all areas designated as Fair Market Rent areas. In areaswhere there is also a valid 2015 1-year ACS estimate of median family income, HUD replacesthe 5-year data with the 1-year data. A valid 1-year 2012 ACS estimate is one where the marginof error of the estimate is less than the estimate itself.
All places:
All estimates (using either 5-year data or 5-year data augmented with 1-year data) are thentrended from 2012 to April 2015.
4 Family refers to the Census definition of a family, which is a householder with one or more other persons living in thesame household who are related to the householder by birth, marriage, or adoption. The definition of family excludesone-person households and multi-person households of unrelated individuals.
5For the non-Puerto Rico Insular Areas of the United States,5 which currently lack ACS (orPRCS) coverage, national ACS income changes are used as surrogates to update 2000 DecennialCensus data. HUD anticipates eventually receiving new income data for these areas from the2010 Decennial Census, which included a "long form" collection of detailed socio-economicinformation in these areas only.
FY 2015 Income Limits
Overview
HUD's Section 8 very low-income and low-income limits are calculated in accordancewith Section 3(b)(2) of the U.S. Housing Act of 1937, as amended. The very low-income limits(usually based on 50 percent of MFI) are the basis of all other income limits, as they are the best-defined income limits and have been the subject of specific, limited legislative adjustmentssubsequent to reviews of the HUD calculation methodology. In addition, a number of otherincome limit calculations are tied by legislation or regulation to their calculation.
There are currently several legislated income limit standards (e.g., 30%, 50%, 60%, 65%,80%, 95%, 100%, 115%, 125%) that were intended to have progressive relationships. To ensurethat this occurs, the very low-income limits have been used as the basis for deriving otherincome limits unless that relevant statutory language has no references or relationship to low-and very low-income limits as defined by the U.S. Housing Act of 1937. If this were not done,for instance, HUD low-income limits would be less than very low-income limits in areas wherevery low-income limits had been adjusted upward by more than 60 percent because of unusuallylow area median family incomes relative to the Section 8 Fair Market Rents (FMRs).
Very Low-Income Limits
Very low-income limits are calculated using a set of formulae as follows. The first stepis to calculate a four-person income limit equal to 50 percent of the estimated area median familyincome. Adjustments are then made if this estimate is outside formula constraints.
More specifically, the very low-income limit for a four-person family is calculated asfollows:
50 percent of the area median family income is calculated and set as the preliminary four-personfamily income limit;
(2) the four-person very low-income limit is increased if it would otherwise be lessthan the amount at which 35 percent of it equals 85 percent of the annualized two-bedroomSection 8 FMR (or 40th percentile rent in 50th percentile FMR areas). This adjusts income limitsupward for areas where rental housing costs are unusually high in relation to the median income;
5 The areas without ACS coverage are the U.S. Virgin Islands, Guam, American Samoa, and the Northern MarianasIslands. Puerto Rico is covered by the ACS-equivalent Puerto Rico Community Survey.

6
(3) the four-person very low-income limit is reduced to the greater of 80 percent ofthe U.S. median family income level, or the amount at which 30 percent of a four-personfamily’s income equals 100 percent of the two-bedroom FMR (or 40th percentile rent in 50th
percentile FMR areas). This adjusts income limits downward for areas of unusually high medianfamily incomes;
(4) the four person income limit is increased if it is less than the relevant State non-metropolitan median family income level,6 and;
(5) the four person income limit is increased if it is less than 95 percent of last year’s verylow income limit and reduced to the greater of 105 percent of last year’s very low income limitor twice the change in the national median family income estimate if that amount would be largerthan 5 percent. Between FY 2014 and FY 2015, the estimate of national median family incomeincreased; this means the upward change in income limits is capped at 105 percent of last year’svery low-income limit.
Beginning with the FY 2013 Income Limits, HUD uses 40th percentile rents instead ofFMRs that include 50th percentile areas, to calculate high housing cost areas. The purpose ofthis change is to prevent fluctuations in Low-Income Housing Tax Credit Difficult DevelopmentArea (DDA) determinations that result solely from high housing cost income limit fluctuations asareas go in and out of the 50th percentile FMR program.
6A Housing and Community Development Act of 1987 amendment directed that non-metropolitan area income
limits should never be set at less than if they were based on the State non-metropolitan median family income level.In implementing this provision, HUD used its discretion to apply this policy to metropolitan areas to avoid inequitiesthat would otherwise result. Doing so avoids the anomaly of assigning higher income limits to a non-metropolitancounty than are assigned to an adjacent metropolitan area where the median family income is less than the State non-metro level but above the level for the non-metro county.

7
Table 1 summarizes the rules governing very low-income limit determinations:
Table 1Summary of Income Limits Determinations for
FY 2015 Very Low-income Limits
Type Income Limit Calculation Non-metroCounties
MetropolitanAreas
1. Limits based on 50% of local medianfamily income
710 308
2. Limits based on State non-metropolitanmedian family income level
1033 80
3. Limits increased to the amount at which35% of 4-person family’s income equals85% of the 2-bedroom 40th percentile rent
6 27
4. Limits decreased to the greater of 80% ofthe U.S. median family income or theamount at which 30% of a 4-personfamily’s income equals 100% of the 2-bedroom 40th percentile rent
1 2
5. Limits increased if they were less than95% of last year’s limit
35 16
6. Limits decreased if they were otherwisemore than 105% (or double the increase inthe National Median, if greater)of lastyear’s limit
252 102
7. TOTALS 2037 535
Low-Income Limits
Most four-person low-income limits are the higher of: (a) 80 percent of the area medianfamily income, or (b) 80 percent of the State non-metropolitan median family income level.Because the very low-income limits are not always based on 50 percent of median, strictlycalculating low-income limits as 80 percent of median could produce anomalies inconsistentwith statutory intent (e.g., very low-income limits could be higher than low-income limits).The calculation normally used, therefore, is to set the four-person low-income limit at1.6 (i.e., 80%/50%) times the relevant four-person very low-income limit. The only exceptionsare that the resulting income limit may not exceed the U.S. median family income level($65,800 for FY 2015) except when justified by high housing costs; further, that income limit
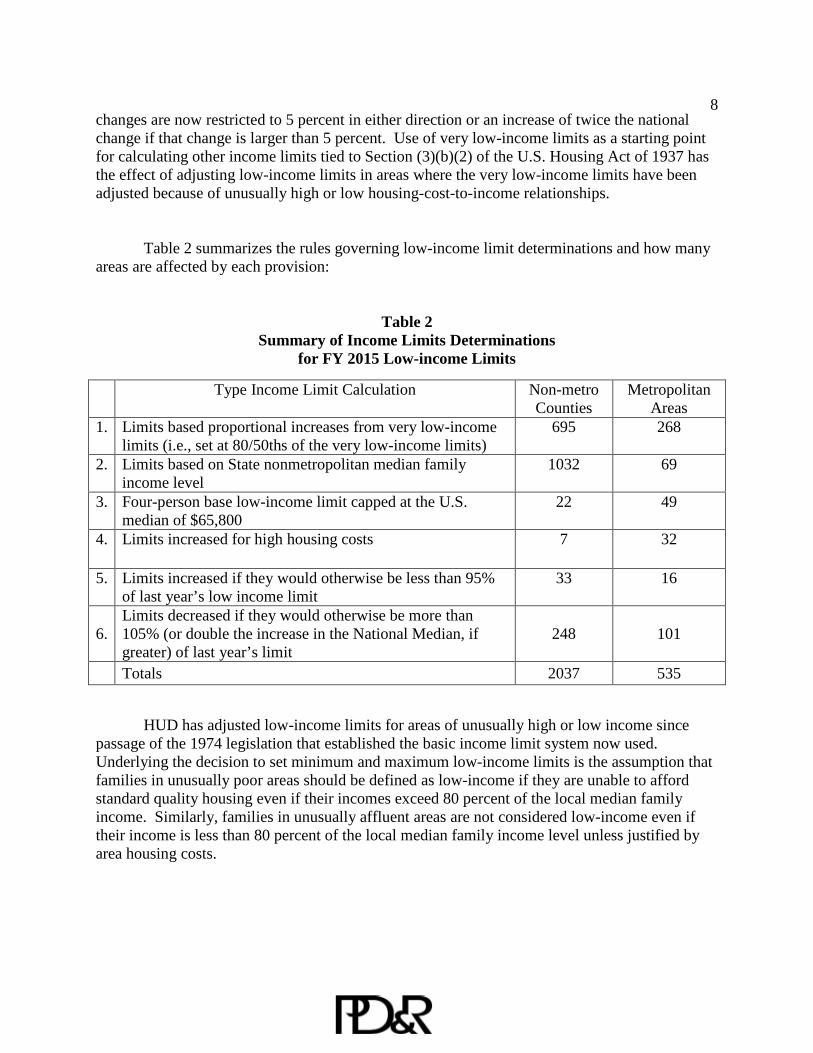
8changes are now restricted to 5 percent in either direction or an increase of twice the nationalchange if that change is larger than 5 percent. Use of very low-income limits as a starting pointfor calculating other income limits tied to Section (3)(b)(2) of the U.S. Housing Act of 1937 hasthe effect of adjusting low-income limits in areas where the very low-income limits have beenadjusted because of unusually high or low housing-cost-to-income relationships.
Table 2 summarizes the rules governing low-income limit determinations and how manyareas are affected by each provision:
Table 2Summary of Income Limits Determinations
for FY 2015 Low-income Limits
Type Income Limit Calculation Non-metroCounties
MetropolitanAreas
1. Limits based proportional increases from very low-incomelimits (i.e., set at 80/50ths of the very low-income limits)
695 268
2. Limits based on State nonmetropolitan median familyincome level
1032 69
3. Four-person base low-income limit capped at the U.S.median of $65,800
22 49
4. Limits increased for high housing costs 7 32
5. Limits increased if they would otherwise be less than 95%of last year’s low income limit
33 16
6.Limits decreased if they would otherwise be more than105% (or double the increase in the National Median, ifgreater) of last year’s limit
248 101
Totals 2037 535
HUD has adjusted low-income limits for areas of unusually high or low income sincepassage of the 1974 legislation that established the basic income limit system now used.Underlying the decision to set minimum and maximum low-income limits is the assumption thatfamilies in unusually poor areas should be defined as low-income if they are unable to affordstandard quality housing even if their incomes exceed 80 percent of the local median familyincome. Similarly, families in unusually affluent areas are not considered low-income even iftheir income is less than 80 percent of the local median family income level unless justified byarea housing costs.
9Beginning with the FY 2013 Income Limits, HUD uses 40th percentile rents instead of
FMRs that include 50th percentile areas to calculate high housing cost areas and continues thatpractice for the FY 2015 Income Limits. The purpose of this change is to prevent fluctuations inLow-Income Housing Tax Credit Difficult Development Area (DDA) determinations that resultsolely from high housing cost income limit fluctuations as areas go in and out of the 50thpercentile FMR program.
Extremely Low Income Limits
The Quality Housing and Work Responsibility Act of 1998 established a new incomelimit standard based on 30 percent of median family income (the extremely low income limits),which was to be adjusted for family size and for areas of unusually high or low family income.A statutory change was made in 1999 to clarify that these income limits should be tied to theSection 8 very low-income limits. The Consolidated Appropriations Act, 2014 further modifiedand redefined these limits as Extremely Low Family income limits to ensure that these incomelimits would not fall below the poverty guidelines determined for each family size. Specifically,extremely low income families are defined to be very low-income families whose incomes arethe greater of the Poverty Guidelines as published and periodically updated by the Department ofHealth and Human Services or the 30 percent income limits calculated by HUD. Puerto Rico andother territories are specifically excluded from this adjustment. There are separate povertyguidelines for Alaska and Hawaii. The remaining 48 states and the District of Columbia use thesame poverty guidelines. The extremely low income limits therefore are first calculated as30/50ths (60 percent) of the Section 8 very low-income limits. They are then compared to theappropriate poverty guideline and if the poverty guideline is higher, that value is chosen. If thepoverty guideline is above the very low income limit at that family size, the extremely lowincome limit is set at the very low income limit because the definition of extremely low incomelimits caps them at the very low-income levels.
Family Size Adjustments
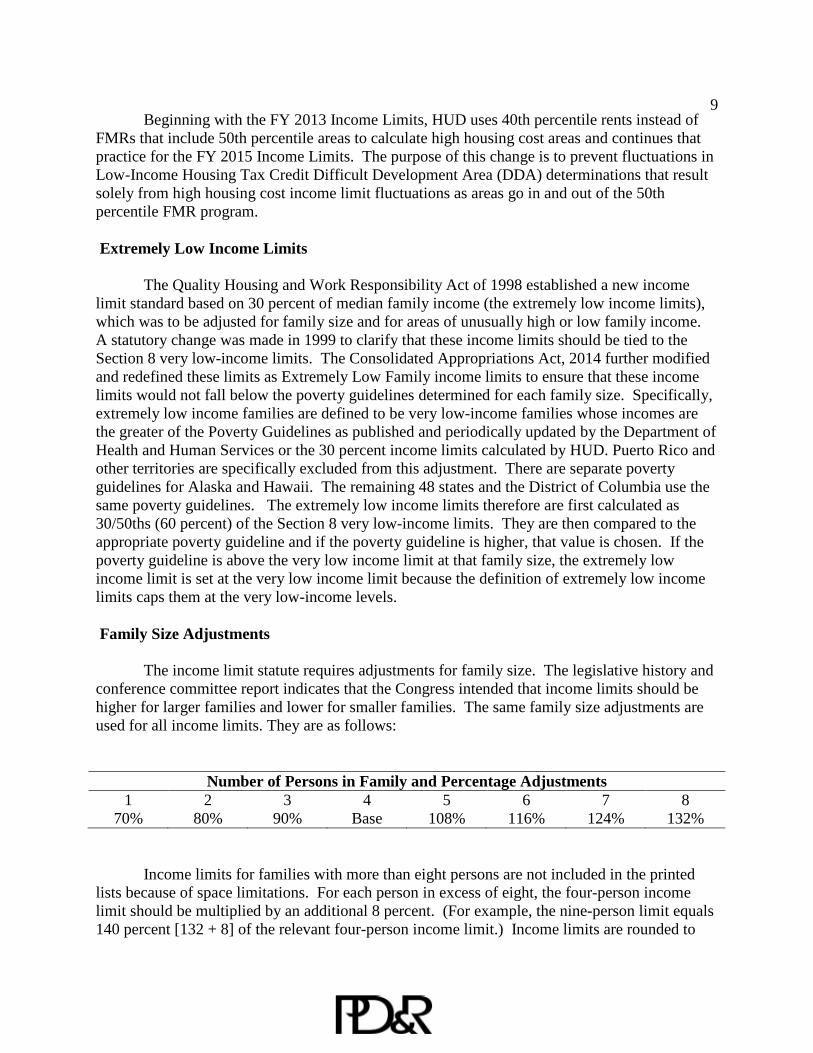
The income limit statute requires adjustments for family size. The legislative history andconference committee report indicates that the Congress intended that income limits should behigher for larger families and lower for smaller families. The same family size adjustments areused for all income limits. They are as follows:
Number of Persons in Family and Percentage Adjustments1 2 3 4 5 6 7 8
70% 80% 90% Base 108% 116% 124% 132%
Income limits for families with more than eight persons are not included in the printedlists because of space limitations. For each person in excess of eight, the four-person incomelimit should be multiplied by an additional 8 percent. (For example, the nine-person limit equals140 percent [132 + 8] of the relevant four-person income limit.) Income limits are rounded to

10the nearest $50. Local agencies may round income limits for nine or more persons to thenearest $50, or may use the un-rounded numbers. Family size-adjusted income limits are not re-tested for compliance with the 5-percent rule, as discussed below. Rounding anomalies producesome family size-adjusted income limits whose annual change is slightly larger or smaller than 5percent.
Due to the extremely low income definition changes, these family size adjustments are nolonger sufficient to determine the level of extremely low income limits. The poverty guidelineshave fixed dollar amount adjustments between household sizes (different for Alaska and Hawaiithan the rest of the U.S.). Therefore the actual amounts shown for 1- to 8-person families will notnecessarily follow the percentages shown above. For families with more than 8 persons, HUDhas developed a tool that should be used to calculate the extremely low income limit for that areaat http://www.huduser.org/portal/datasets/il/il15/index.html. Please use the FY 2015 IncomeLimits Documentation system, pick the area in question, and select “Click Here” under the label“Extremely Low-Income Limits.” Near the bottom of the explanations, there is a drop down boxto select the number of household members needed (from 9 to 20).
5-Percent Rule
As outlined earlier in these briefing materials, in response to comments received aboutHUD’s intention to eliminate the traditional hold-harmless provision for HUD Section 8 IncomeLimits received prior to the publication of FY2010 Income Limits, HUD is maintaining theconstraint on the size of changes income limits can make in any one year. Specifically, the low-income and very low-income four-person limits will not be allowed to decrease more than 5percent or increase more than 5 percent or twice the national increase in median family income,whichever of those is larger. The 5-percent rule does not apply to the extremely low incomelimits where these are set according to the poverty threshold.
This policy was implemented in the following way:
The four person very low income limit is computed as half of the local median family income.Median family incomes are rounded to 100 so, by definition, the raw four person income limit isrounded to 50.
The cap for the four person very low income is last year’s four-person very low-incomemultiplied by 1.05 and rounded down to the nearest $50 or twice the change in the nationalmedian family income, also rounded down, whichever is larger. The cap is rounded down toensure that it is less than or equal to 105 percent of last year’s four-person very low-incomelimit.
The floor for the four-person very low-income is last year’s four-person very low-incomemultiplied by .95 and rounded up to the nearest $50. The floor is rounded up to ensure that it isgreater than or equal to 95 percent of last year’s four person very low income.
If the otherwise adjusted four-person very low-income is above the cap then it is set at the cap.

11If it is below the floor then it is set at the floor.
Family size adjustments are made to the floored/capped four-person very low-income limit. Noadditional adjustments are made to families of more or less than four persons for the very low-income limit except that it is then rounded up to the nearest $50.
The cap and floor are applied in an analogous way to the four-person low-income limit.
No additional capping or flooring is done to any income limit based on either the very low-income limit or the low income limit.
Family size adjusted limits may be slightly larger or smaller than the cap or floor imposed on thefour-person low and very low incomes due to rounding.
12
Housing and Economic Recovery Act of 2008
Prior to FY 2010, HUD held Section 8 Income Limits harmless primarily so that MultifamilyTax Subsidy Housing Projects7 would not be subject to reductions in income limits andmaximum rents. Low Income Housing Tax Credit (LIHTC) and tax exempt bond-financedhousing project income limits and rents are tied by statute to HUD’s area median incomeestimates, and by regulation to HUD’s Section 8 Income Limits.
Section 3009 of the Housing and Economic Recovery Act of 2008 (HERA) provides for holdingharmless “area median gross income” for tax credit and tax-exempt bond-financed housingprojects with additional inflation provisions for LIHTC and tax-exempt bond-financed projectsheld harmless by HUD in 2007 and 2008. Because the new law provides a statutory mechanismfor achieving the effect of the income limit hold-harmless policy HUD no longer holds incomelimits harmless.
7Multifamily Tax Subsidy Projects are those projects which are reliant upon Internal Revenue Code (IRC) section 42Low Income Housing Tax Credit, or use tax-exempt private activity bonds under IRC section 142 as part of theirfinancing. In the past we have referred to this group as LIHTC Projects.
13
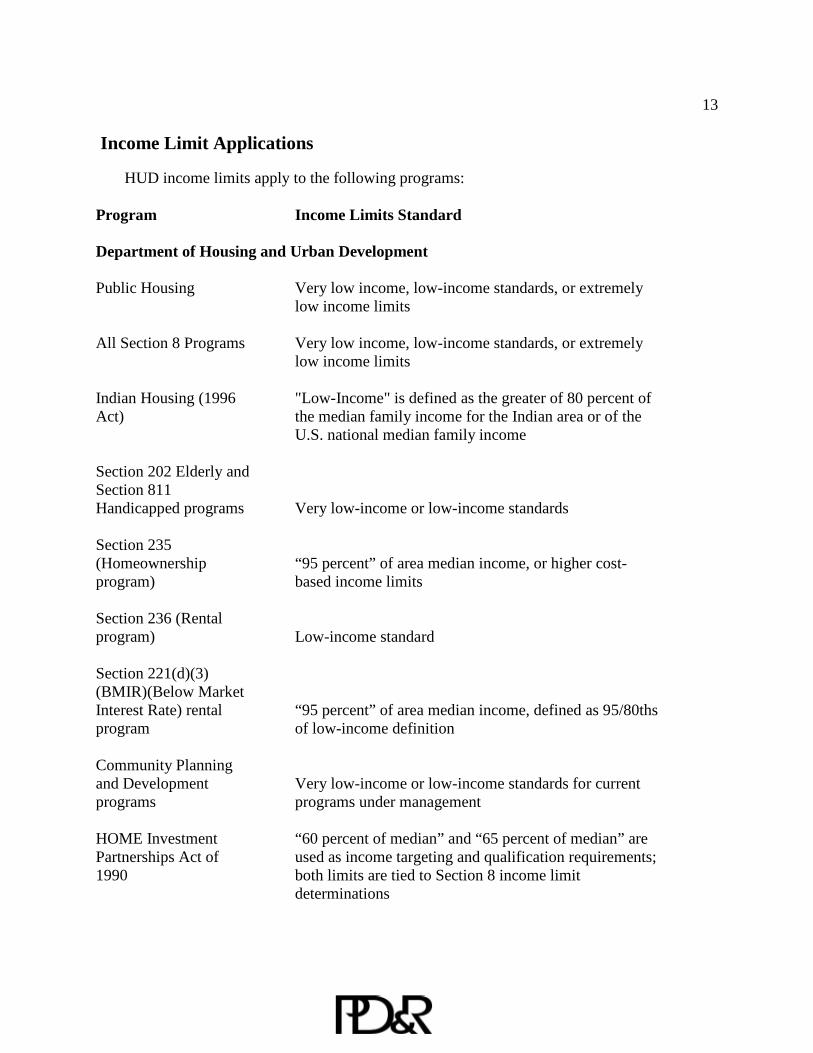
Income Limit Applications
HUD income limits apply to the following programs:
Program Income Limits Standard
Department of Housing and Urban Development
Public Housing Very low income, low-income standards, or extremelylow income limits
All Section 8 Programs Very low income, low-income standards, or extremelylow income limits
Indian Housing (1996Act)
"Low-Income" is defined as the greater of 80 percent ofthe median family income for the Indian area or of theU.S. national median family income
Section 202 Elderly andSection 811Handicapped programs Very low-income or low-income standards
Section 235(Homeownershipprogram)
“95 percent” of area median income, or higher cost-based income limits
Section 236 (Rentalprogram) Low-income standard
Section 221(d)(3)(BMIR)(Below MarketInterest Rate) rentalprogram
“95 percent” of area median income, defined as 95/80thsof low-income definition
Community Planningand Developmentprograms
Very low-income or low-income standards for currentprograms under management
HOME InvestmentPartnerships Act of1990
“60 percent of median” and “65 percent of median” areused as income targeting and qualification requirements;both limits are tied to Section 8 income limitdeterminations
14NationalHomeownership TrustAct of 1990
“95 percent” of median is referenced as the eligibilitystandard, with a “115 percent” of median standard forhigh cost areas
Low-Income HousingPreservation andResidentHomeownership Act of1990
Affordability of units for current occupant of “moderateincome” affects terms under which mortgage may beprepaid; “moderate income” is defined as 80-95 percentof median, with “80 percent” defined as the Section 8low-income standard
Rural Housing and Community Development Service
Rental and ownershipassistance programs
Assistance based on HUD Section 8 very low-income orlow-income standards, or income limits tied to thesestandards
Treasury Programs
Multifamily TaxSubsidy Projects
Current standard is Section 8 very low-income standardor 120 percent of that definition (i.e., the “60 percent” ofmedian standard) for projects determining incomeeligibility and rents who haven’t used income limits priorto FY 2012. Income Limits for projects using incomelimits in FY 2010 or earlier will no longer use Section8 Income Limits. A separate income limitspublication is produced for this program.
Tax-exempt MortgageRevenue Bonds forhomeownershipfinancing
Generally set at 115 percent of area median income, with“115 percent” defined as 230 percent of the Section 8very low-income standard
“Difficult DevelopmentArea” Designation(Low-Income HousingTax Credit)
Areas with the worst housing cost problems as measuredby the FMR to 60 percent of median family income ratio;this designation is awarded to the population-weighted20 percent of the metro and non-metro areas (using HUDarea definitions) with the most severe problems and isrecalculated annually; such areas receive specialadditional tax benefits under this program
15“Qualified CensusTract” (Low-IncomeHousing Tax CreditProgram Definition)
Areas, as defined by the Census and designated by HUD,where 50% of all households have incomes less than 60percent of the area median family income, adjusted forhousehold size, or the poverty rate is 25 percent orhigher; such areas receive special additional tax benefitsunder this program; this calculation is based on 2010Census data and income limit policies and areadefinitions in effect as of the date estimates are prepared
“Qualified CensusTract” (MortgageRevenue BondProgram)
Areas, as defined by the Census, where 70 percent of allfamilies have incomes less that 80 percent of the statemedian family income, based on 2010 Census data
Federal Deposit Insurance Corporation
Disposition ofMultifamily Housing toNon-profit and PublicAgencies
Not less than 35 percent of all dwelling units must bemade available for occupancy and be affordable for low-income families, and at least 20 percent must be madeavailable for occupancy and be affordable for very low-income families. An “affordable rent” is defined as therent that would be paid by a family paying 30 percent ofincome for rent whose income is “65 percent of median”.This 65 percent figure is defined in relation to the verylow-income standard (i.e., normally as 65/50ths of thestandard)
Disposition of SingleFamily Housing
For rentals, priority is given to non-profits and publicagencies that make the dwellings affordable to low-income households. Households who intend to occupy adwelling as their primary residence whose adjustedincome does not exceed 115 percent of area medianincome, as determined by the Secretary of HUD, aregiven a purchase priority for the first 3 months a propertyis for sale.
Federal Home Loan Banks
Rental program fundingPriorities
Very low-income, “60 percent of median” (defined as120 percent of very low-income), and low-incomestandards used
Homeownershipfunding priorities
115 percent and 140 percent of median family incomelimits are used

16Federal Housing Finance Agency
Income-based HousingGoals of Freddie Macand Fannie Mae
Goals for percentages of loans are established forhouseholds with incomes at or below specifiedpercentages of the HUD-published median familyincome for metropolitan and nonmetropolitan areas, asdetailed in 12 CFR, Part 1282. The area definitions usedrelate to OMB metropolitan area definitions and themedian family income estimates for the nonmetropolitanportions of each state.
Other Federal Banking Regulatory Provisions
Targeting of loan fundsto low-incomehouseholds and areas
Varies by agency
Uniform Relocation Act
Reimbursement tohouseholds forced torelocate from theirresidence by Federalagency
Extent of replacement housing assistance dependent onqualifying as Low-income, as defined by HUD; Actapplies to all Federal agencies that initiate action thatforces households to relocate from their residence
Department of Veterans Affairs
Eligibility for disabilityincome supportpayments to veterans
Eligibility for non-service related income supportpayments is restricted to families with incomes below theHUD low-income standard
ATTACHMENT 1
U.S. HOUSING ACT OF 1937 PROVISIONSRELATED TO INCOME LIMITS
(As Amended through 2014)
Section 3:
(a)(1) Dwelling units assisted under this Act shall be rented only to families who are low-income
families at the time of their initial occupancy of such units.....
(b) When used in this Act:
(1) The term "low-income housing" means decent, safe, and sanitary dwellings assisted under
this Act....
(2)(A) The term "low-income families" means those families whose incomes do not exceed 80
per centum of the median income for the area, as determined by the Secretary with adjustments for
smaller and larger families, except that the Secretary may establish income ceiling higher or lower
than 80 per centum of the median for the area on the basis of the Secretary's findings that such
variations are necessary because of prevailing levels of construction costs or unusually high or low
family incomes.
(B) The term "very low-income families" means lower income families whose incomes do
not exceed 50 per centum of the median family income for the area, as determined by the Secretary
with adjustments for smaller and larger families, except that the Secretary may establish income
ceilings higher or lower than 50 per centum of the median for the area on the basis of the Secretary's
findings that such variations are necessary because of unusually high or low family incomes.
C) The term extremely low –income families means very low-income families whose incomes
do not exceed the higher of—
(i) the poverty guidelines updated periodically by the Department of Health and Human Services
under the authority of section 673(2) of the Community Services Block Grant Act applicable to a
family of the size involved (except that this clause shall not apply in the case of public housing
agencies or projects located in Puerto Rico or any other territory or possession of the United
States); or
(ii) 30 percent of the median family income for the area, as determined by the Secretary, with
adjustments for smaller and larger families (except that the Secretary may establish income ceilings
higher or lower than 30 percent of the median for the area on the basis of the Secretary’s findings
that such variations are necessary because of unusually high or low family incomes).

(D) Such ceilings shall be established in consultation with the Secretary of Agriculture for
any rural area, as defined in section 520 of the Housing Act of 1949, taking into account the subsidy
characteristics and types of programs to which such ceilings apply. In determining median incomes
(of persons, families, or households) for an area or establishing any ceilings or limits based on
income under this Act, the Secretary shall determine or establish area median incomes and income
ceilings and limits for Westchester and Rockland Counties, in the State of New York, as if each
such county were an area not contained within the metropolitan statistical area in which it is located.
In determining such area median incomes or establishing such income ceilings or limits for the
portions of such metropolitan statistical area that does not include Westchester or Rockland
Counties, the Secretary shall determine or establish area median incomes and income ceilings and
limits as if such portion included Westchester and Rockland Counties. In determining areas that are
designated as difficult development areas for the purposes of the low-income housing tax credit, the
Secretary shall include Westchester and Rockland Counties, New York, in the New York City
metropolitan area.
Section 16:
Sec. 16. (a) Income Eligibility for Public Housing
(2)(A) Targeting. - Except as provided in paragraph 4, of the public housing dwelling units
of a public housing agency made available for occupancy in any fiscal year by eligible families, not
less than 40 percent shall be occupied by extremely low-income families.
(4)(D) Fungibility Floor. - Notwithstanding any authority under subparagraph (A), of the
public housing dwelling units of a public housing agency made available for occupancy in any
fiscal year by eligible families, not less than 30 percent shall be occupied by families whose
incomes at the time of commencement of occupancy do not exceed 30 percent of the area median
income, as determined by the Secretary with adjustments for smaller and larger families; except that
the Secretary may establish income ceilings higher or lower than 30 percent of the area median
income on the basis of the Secretary’s findings that such variations are necessary because of
unusually high or low family incomes.
Sec. 16. (b) Income eligibility for Tenant-Based Section 8 Assistance
(1) IN GENERAL. - Of the families initially provided tenant-based assistance under section
8 by a public housing agency in any fiscal year, not less than 75 percent shall be extremely low-
income families.
Sec. 16. (c) Income Eligibility for Project-Based Section 8 Assistance
(1) Pre-1981 Act Projects. - Not more than 25 percent of the dwelling units that were
available for occupancy under section 8 housing assistance payments contracts under this Act
before the effective date of the Housing and Community Development Amendments of 1981, and
which will be leased on or after such effective date shall be available for leasing by lower income
families other than very low-income families.
(2) Post-1981 Act Projects. - Not more than 15 per cent of the dwelling units which became
available for occupancy under section 8 housing assistance payments contracts under this Act on or
after the effective date of the Housing and Community Development Amendments of 1981 shall be
available for leasing by lower income families other than very low-income families.
(3) Targeting. - For each project assisted under a contract for project-based assistance, of
the dwelling units that become available for occupancy in any fiscal year that are assisted under the
contract, not less than 40 percent shall be available for leasing only by extremely low-income
families.

(5) Exception. - The limitations established in paragraphs (1), (2), and (3) shall not apply to
dwelling units made available under project-based contracts under section 8 for the purpose of
preventing displacement, or ameliorating the effects of displacement.
Section 567 of the HCD Act of 1987 Amendment Affecting Section 3 of the 1937 Act:
"For purposes of calculating the median income for any area that is not within a
metropolitan statistical area (as established by the Office of Management and Budget) for programs
under title I of the Housing and Community Development Act of 1974, the United States Housing
Act of 1937, the National Housing Act, or title V of the Housing Act of 1949, the Secretary of
Housing and Urban Development or the Secretary of Agriculture (as appropriate) shall use
whichever of the following is higher:
(1) the median income of the county in which the area is located; or,
(2) the median income of the entire non-metropolitan area of the State.

ATTACHMENT 2
HUD PROCEDURE FOR ESTIMATING FY 2015MEDIAN FAMILY INCOMES
HUD updated its Median Family Income (MFI) estimate procedure to take advantage of newnationally comprehensive data available from the Census Bureau’s American Community Survey(ACS), beginning with the FY 2011 MFIs. In December 2010, the first set of 5-year ACS data waspublished. These 5-year aggregations, covering surveys administered in 2005 through 2009,provided income data for most areas of geography8. Because of the increase in the geographiccoverage of the 5-year data, HUD’s methodology for calculating FY 2011 MFI no longer was basedon 2000 Decennial Census data, but rather, the 2005 – 2009 ACS data for all but the areas in theVirgin Islands and Guam of the Pacific Islands. The FY 2015 MFIs, which HUD is publishing atthis time, use the 5-year series of income data from 2008 to 2012. HUD uses Consumer Price Index(CPI) data to inflate the ACS data from annual 2012 to the midpoint of FY 2015, based on a CPIforecast, published by the Congressional Budget Office (CBO) in August 2014. Separate HUDMFI estimates are calculated for all Metropolitan Statistical Areas (MSAs), HUD Metro FMRAreas, and nonmetropolitan counties.
The ACS, conducted annually, was designed to produce, upon compilation of 5 years of data,estimates similar to the long-form sample survey previously conducted with the Decennial Census.Each year since full implementation of the survey in 2005, the Census Bureau collected an ACSsample sufficient to provide estimates of most survey items for areas with populations of 65,000 ormore. After the 2007 ACS, the Census Bureau released data aggregated from the ACS samplescollected over the three years, 2005, 2006, and 2007. This allowed the Census Bureau to releaseestimates for most items for areas with populations of 20,000 or more. FY 2010 MFIs reflectedACS survey data aggregated over 2006, 2007 and 2008. After the 2009 ACS sample, the CensusBureau had sufficient data to release aggregated five-year estimates. Five-year estimates aredesigned to provide estimates for geographic areas of all sizes relevant to MFI and income limitproduction.
8 The ACS covers the 50 United States, and a separate survey called the Puerto Rico CommunitySurvey (PRCS) covers Puerto Rico. The US Virgin Islands and the Pacific Islands (AmericanSamoa, Commonwealth of the Northern Mariana Islands, and Guam) are not covered by the ACS orPRCS. Detailed demographic and socio-economic information covering these island areas havebeen collected by a special Long Form survey conducted in conjunction with the 2010 DecennialCensus. Our special data tabulations for these regions were recently released by Census and will bereleased with the FY 2016 Fair Market Rent and then the FY 2016 median family income andincome limit calculations. Separate rent and income data are available for American Samoa, theCommonwealth of the Northern Mariana Islands, and St. Johns, VI; previously only data in thePacific Islands was available for Guam and St. Johns received the same income as for St. Thomas.

As mentioned above, HUD uses the 2008-2012 5-year ACS data in the calculation process for theFY 2015 MFIs. Specifically, for each metropolitan area, subarea of a metropolitan area, and non-metropolitan county, 5-year ACS data is used as the new basis for calculating MFI estimates. Thisis the way it has been done since the 5-year ACS data first became available, for use in the FY 2011MFI estimates. In areas where there is a valid 1-year ACS survey median family income result,HUD endeavors to use this data as well to take advantage of more recent survey information. Byusing both the 5-year data and the 1-year data, where available, HUD is establishing a new basis forMFI estimates while also capturing the most recent information available.
MFI estimates are based on the most currently available data, but the delay in collecting andreporting the survey data mean that 2012 ACS income data is used for FY 2015 estimates that havean as-of date of mid-2012. A new and annually revised trend factor based on the CBO forecast ofCPI is used to inflate the estimate from mid-2012 to April, 2015 (or mid FY 2015).
Median family9 incomes start with the development of estimates of MFI for the metropolitan areasand non-metropolitan FMR/income limit areas (including U.S. territories). Attachment 2 provides adetailed explanation of how median family income estimates are calculated. The major steps are asfollows:
HUD uses 2008-2012 5-year ACS estimates of median family income calculated for the areas usedfor FMRs and income limits as the new basis for FY 2015. In areas where there is also a 2012 1-year ACS estimate of median family income, the 1-year income data is used if the estimate isgreater than its margin of error estimate. Once the appropriate 2012 ACS data has been selected,the data are set as of April 2015 using the CPI forecast by the CBO.
9 Family refers to the Census definition of a family, which is a householder with one or more otherpersons living in the same household who are related to the householder by birth, marriage, oradoption. The definition of family excludes one-person households and multi-person households ofunrelated individuals.
All places:
All estimates (using either 5-year data or 5-year data augmented with 1-year data) are updated withCPI from mid-2012 to April, 2015.
For the non-Puerto Rico Insular Areas of the United States,10 which currently lack ACS (or PRCS)coverage, national ACS income changes are used as surrogates to update 2000 Decennial Censusdata (which collected 1999 incomes). HUD will incorporate the new income data for these areasfrom the 2010 Decennial Census (which collected 2009 incomes), which included a "long form"collection of detailed socio-economic information in these areas only next year, after providing anopportunity on commenting on the changes resulting from the data re-benchmarking.
10 The areas without ACS coverage are the U.S. Virgin Islands, Guam, American Samoa, and theNorthern Marianas Islands. Puerto Rico is covered by the ACS-equivalent Puerto Rico CommunitySurvey.

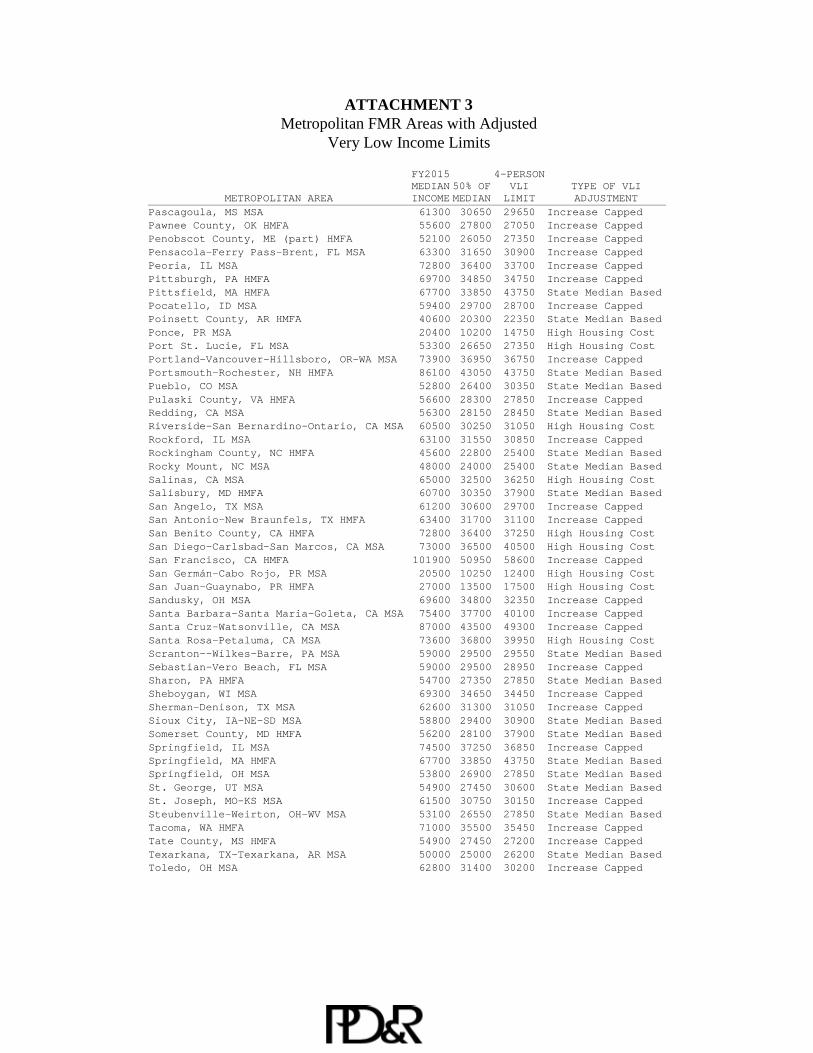
ATTACHMENT 3Metropolitan FMR Areas with Adjusted
Very Low Income Limits
METROPOLITAN AREA
FY2015MEDIANINCOME
50% OFMEDIAN
4-PERSONVLILIMIT
TYPE OF VLIADJUSTMENT
Abilene, TX MSA 57700 28850 27800 Increase CappedAguadilla-Isabela-San Sebastián, PR MSA 19300 9650 13400 Increase Capped
Akron, OH MSA 66700 33350 32850 Increase Capped
Albany, GA MSA 45900 22950 23050 State Median Based
Altoona, PA MSA 54800 27400 29550 State Median Based
Amarillo, TX MSA 59400 29700 30150 Floored at 5%
Anderson, IN MSA 58000 29000 28400 Increase Capped
Anderson, SC MSA 51100 25550 25750 Floored at 5%Anson County, NC HMFA 41500 20750 25400 State Median Based
Appleton, WI MSA 77100 38550 37700 Increase Capped
Arecibo, PR HMFA 20900 10450 14050 Floored at 5%
Armstrong County, PA HMFA 53100 26550 29550 State Median Based
Atlanta-Sandy Springs-Marietta, GA HMFA 68300 34150 34100 Increase Capped
Atlantic City-Hammonton, NJ MSA 67300 33650 34250 High Housing Cost
Auburn-Opelika, AL MSA 67600 33800 31700 Increase CappedBakersfield-Delano, CA MSA 52000 26000 28450 State Median Based
Baltimore-Towson, MD HMFA 89600 44800 44200 Increase Capped
Barnstable Town, MA MSA 80300 40150 43750 State Median Based
Barranquitas-Aibonito-Quebradillas, PR H 16900 8450 12500 Floored at 5%
Battle Creek, MI MSA 53400 26700 27100 State Median Based
Beaumont-Port Arthur, TX MSA 58700 29350 28550 Increase CappedBergen-Passaic, NJ HMFA 93700 46850 46350 Increase Capped
Berkshire County, MA (part) HMFA 74400 37200 43750 State Median Based
Billings, MT MSA 66200 33100 32100 Increase Capped
Binghamton, NY MSA 66400 33200 32650 Increase Capped
Blacksburg-Christiansburg-Radford, VA HM 57800 28900 33700 Floored at 5%
Boise City-Nampa, ID HMFA 61300 30650 30150 Increase Capped
Boone County, WV HMFA 55800 27900 27700 Increase CappedBowling Green, KY MSA 60800 30400 30300 Increase Capped
Brazoria County, TX HMFA 80400 40200 40150 Increase Capped
Bridgeport, CT HMFA 89000 44500 44300 Increase Capped
Brockton, MA HMFA 81200 40600 43750 State Median Based
Brownsville-Harlingen, TX MSA 35400 17700 26200 State Median Based
Buffalo-Niagara Falls, NY MSA 69000 34500 33850 Increase Capped
Caguas, PR HMFA 26900 13450 16050 High Housing CostCasper, WY MSA 75500 37750 37450 Increase Capped
Champaign-Urbana, IL MSA 72500 36250 35950 Increase Capped
Charleston, WV HMFA 61600 30800 29550 Increase Capped
Chattanooga, TN-GA MSA 59000 29500 29150 Increase Capped
Chico, CA MSA 53900 26950 28450 State Median Based
Cleveland, TN MSA 47200 23600 24650 Floored at 5%
College Station-Bryan, TX MSA 62000 31000 30450 Increase CappedColumbia, MO MSA 72600 36300 36250 Increase Capped
Columbia, SC HMFA 64700 32350 30850 Increase Capped
Columbus, GA-AL MSA 58200 29100 27000 Increase Capped
Corpus Christi, TX HMFA 58800 29400 27850 Increase Capped
Corvallis, OR MSA 78600 39300 39250 Increase Capped
Crestview-Fort Walton Beach-Destin, FL M 67500 33750 33250 Increase Capped
Cumberland, MD-WV MSA 51600 25800 37900 State Median BasedDalton, GA HMFA 43600 21800 23050 State Median Based

ATTACHMENT 3Metropolitan FMR Areas with Adjusted
Very Low Income Limits
METROPOLITAN AREA
FY2015MEDIANINCOME
50% OFMEDIAN
4-PERSONVLILIMIT
TYPE OF VLIADJUSTMENT
Danville, IL MSA 52800 26400 29950 State Median BasedDanville, VA MSA 51800 25900 26550 State Median Based
Darlington County, SC HMFA 44000 22000 23700 Floored at 5%
Davenport-Moline-Rock Island, IA-IL MSA 69000 34500 33250 Increase Capped
Decatur, IL MSA 56900 28450 29950 State Median Based
Deltona-Daytona Beach-Ormond Beach, FL M 51800 25900 26250 High Housing Cost
Dubuque, IA MSA 65700 32850 33000 Floored at 5%
Duluth, MN-WI MSA 63500 31750 31900 State Median BasedEaston-Raynham, MA HMFA 114800 57400 52650 Low Housing CostUSM
El Centro, CA MSA 44500 22250 28450 State Median Based
El Paso, TX MSA 47600 23800 26200 State Median Based
Elizabethtown, KY MSA 60100 30050 29800 Increase Capped
Elkhart-Goshen, IN MSA 53300 26650 27450 State Median Based
Erie, PA MSA 62000 31000 30300 Increase Capped
Fairbanks, AK MSA 85600 42800 40900 Increase CappedFajardo, PR MSA 26500 13250 15900 High Housing Cost
Fargo, ND-MN MSA 76600 38300 38150 Increase Capped
Farmington, NM MSA 54700 27350 27550 Floored at 5%
Fitchburg-Leominster, MA HMFA 81100 40550 43750 State Median Based
Flagstaff, AZ MSA 59400 29700 30100 High Housing Cost
Flint, MI MSA 53800 26900 27100 State Median Based
Florence-Muscle Shoals, AL MSA 58600 29300 27600 Increase CappedFort Collins-Loveland, CO MSA 79300 39650 38900 Increase Capped
Fort Lauderdale, FL HMFA 63300 31650 34550 High Housing Cost
Fort Worth-Arlington, TX HMFA 70500 35250 34850 Increase Capped
Franklin County, AR HMFA 44000 22000 22350 State Median Based
Franklin County, MA (part) HMFA 74300 37150 43750 State Median Based
Fresno, CA MSA 47600 23800 28450 State Median Based
Gainesville, GA MSA 60700 30350 29700 Increase CappedGiles County, VA HMFA 56600 28300 28050 Increase Capped
Grand Forks, ND-MN MSA 74200 37100 36950 Increase Capped
Grand Junction, CO MSA 57800 28900 30350 State Median Based
Grant County, KY HMFA 54200 27100 27850 State Median Based
Great Falls, MT MSA 61600 30800 30750 Increase Capped
Greeley, CO MSA 69600 34800 33350 Increase CappedGuayama, PR MSA 18400 9200 15600 Increase Capped
Hagerstown, MD HMFA 65300 32650 37900 State Median Based
Hanford-Corcoran, CA MSA 50000 25000 28450 State Median Based
Hattiesburg, MS MSA 46500 23250 24350 Floored at 5%
Henry County, AL HMFA 54400 27200 26800 Increase Capped
Hickory-Lenoir-Morganton, NC MSA 53200 26600 26150 Increase Capped
Honolulu, HI MSA 86900 43450 47900 High Housing CostHot Springs, AR MSA 50700 25350 24300 Increase Capped
Huntington-Ashland, WV-KY-OH MSA 54900 27450 27000 Increase Capped
Huntsville, AL MSA 75000 37500 36900 Increase Capped
Idaho Falls, ID MSA 61700 30850 30150 Increase Capped
Indianapolis, IN HMFA 69700 34850 34050 Increase Capped
Jackson, TN MSA 64900 32450 27200 Increase Capped
Jacksonville, NC MSA 50000 25000 25400 State Median BasedJanesville, WI MSA 58600 29300 30500 State Median Based

ATTACHMENT 3Metropolitan FMR Areas with Adjusted
Very Low Income Limits
METROPOLITAN AREA
FY2015MEDIANINCOME
50% OFMEDIAN
4-PERSONVLILIMIT
TYPE OF VLIADJUSTMENT
Jersey City, NJ HMFA 63600 31800 38300 High Housing CostJohnstown, PA MSA 55600 27800 29550 State Median Based
Jonesboro, AR HMFA 57700 28850 27650 Increase Capped
Kankakee-Bradley, IL MSA 68100 34050 31250 Increase Capped
Kendall County, IL HMFA 87300 43650 44900 Floored at 5%
Kenosha County, WI HMFA 72700 36350 35050 Increase Capped
La Crosse, WI-MN MSA 70700 35350 35100 Increase Capped
Lake Charles, LA MSA 59400 29700 29600 Increase CappedLake Havasu City-Kingman, AZ MSA 44700 22350 23200 State Median Based
Laredo, TX MSA 43200 21600 26200 State Median Based
Las Cruces, NM MSA 45200 22600 24200 State Median Based
Las Vegas-Paradise, NV MSA 59200 29600 30700 State Median Based
Laurens County, SC HMFA 43600 21800 25450 Increase Capped
Lawrence, KS MSA 74100 37050 35650 Increase Capped
Lawrence, MA-NH HMFA 86800 43400 43750 State Median BasedLewiston-Auburn, ME MSA 63500 31750 29700 Increase Capped
Lima, OH MSA 54200 27100 27850 State Median Based
Livingston County, MI HMFA 88400 44200 42000 Increase Capped
Logan, UT-ID MSA 57200 28600 30600 State Median Based
Los Angeles-Long Beach, CA HMFA 63000 31500 41500 High Housing Cost
Lowell, MA HMFA 96400 48200 48000 Increase CappedMacon County, TN HMFA 44000 22000 23450 State Median Based
Madera-Chowchilla, CA MSA 45800 22900 28450 State Median Based
Mankato-North Mankato, MN MSA 73900 36950 35450 Increase Capped
Mansfield, OH MSA 53300 26650 27850 State Median Based
Marshall County, MS HMFA 41700 20850 23450 State Median Based
Martinsburg, WV HMFA 61600 30800 37900 State Median Based
Matanuska-Susitna Borough, AK HMFA 83900 41950 41550 Increase CappedMayagüez, PR MSA 24100 12050 13850 High Housing Cost
McAllen-Edinburg-Mission, TX MSA 37500 18750 26200 State Median Based
Meade County, SD HMFA 64800 32400 32000 Increase Capped
Merced, CA MSA 52500 26250 28450 State Median Based
Miami-Miami Beach-Kendall, FL HMFA 49900 24950 33850 High Housing Cost
Michigan City-La Porte, IN MSA 55100 27550 29650 Floored at 5%
Midland, TX MSA 72500 36250 36150 Increase CappedMissoula, MT MSA 69800 34900 32400 Increase Capped
Modesto, CA MSA 53300 26650 28450 State Median Based
Morgantown, WV MSA 65500 32750 32300 Increase Capped
Muncie, IN MSA 51700 25850 27450 State Median Based
Muskegon-Norton Shores, MI MSA 51900 25950 27100 State Median Based
Napa, CA MSA 84200 42100 43650 Increase Capped
New York, NY HMFA 63700 31850 43150 High Housing CostNewaygo County, MI HMFA 53000 26500 27100 State Median Based
North Port-Bradenton-Sarasota, FL MSA 62300 31150 30350 Increase Capped
Ocala, FL MSA 47300 23650 23850 State Median Based
Odessa, TX MSA 65400 32700 29800 Increase Capped
Orange County, CA HMFA 85900 42950 46850 High Housing Cost
Owen County, IN HMFA 52400 26200 27450 State Median Based
Oxnard-Thousand Oaks-Ventura, CA MSA 85300 42650 45300 High Housing CostPalm Coast, FL MSA 49200 24600 27650 Floored at 5%
ATTACHMENT 3Metropolitan FMR Areas with Adjusted
Very Low Income Limits
METROPOLITAN AREA
FY2015MEDIANINCOME
50% OFMEDIAN
4-PERSONVLILIMIT
TYPE OF VLIADJUSTMENT
Pascagoula, MS MSA 61300 30650 29650 Increase CappedPawnee County, OK HMFA 55600 27800 27050 Increase Capped
Penobscot County, ME (part) HMFA 52100 26050 27350 Increase Capped
Pensacola-Ferry Pass-Brent, FL MSA 63300 31650 30900 Increase Capped
Peoria, IL MSA 72800 36400 33700 Increase Capped
Pittsburgh, PA HMFA 69700 34850 34750 Increase Capped
Pittsfield, MA HMFA 67700 33850 43750 State Median Based
Pocatello, ID MSA 59400 29700 28700 Increase CappedPoinsett County, AR HMFA 40600 20300 22350 State Median Based
Ponce, PR MSA 20400 10200 14750 High Housing Cost
Port St. Lucie, FL MSA 53300 26650 27350 High Housing Cost
Portland-Vancouver-Hillsboro, OR-WA MSA 73900 36950 36750 Increase Capped
Portsmouth-Rochester, NH HMFA 86100 43050 43750 State Median Based
Pueblo, CO MSA 52800 26400 30350 State Median Based
Pulaski County, VA HMFA 56600 28300 27850 Increase CappedRedding, CA MSA 56300 28150 28450 State Median Based
Riverside-San Bernardino-Ontario, CA MSA 60500 30250 31050 High Housing Cost
Rockford, IL MSA 63100 31550 30850 Increase Capped
Rockingham County, NC HMFA 45600 22800 25400 State Median Based
Rocky Mount, NC MSA 48000 24000 25400 State Median Based
Salinas, CA MSA 65000 32500 36250 High Housing CostSalisbury, MD HMFA 60700 30350 37900 State Median Based
San Angelo, TX MSA 61200 30600 29700 Increase Capped
San Antonio-New Braunfels, TX HMFA 63400 31700 31100 Increase Capped
San Benito County, CA HMFA 72800 36400 37250 High Housing Cost
San Diego-Carlsbad-San Marcos, CA MSA 73000 36500 40500 High Housing Cost
San Francisco, CA HMFA 101900 50950 58600 Increase Capped
San Germán-Cabo Rojo, PR MSA 20500 10250 12400 High Housing CostSan Juan-Guaynabo, PR HMFA 27000 13500 17500 High Housing Cost
Sandusky, OH MSA 69600 34800 32350 Increase Capped
Santa Barbara-Santa Maria-Goleta, CA MSA 75400 37700 40100 Increase Capped
Santa Cruz-Watsonville, CA MSA 87000 43500 49300 Increase Capped
Santa Rosa-Petaluma, CA MSA 73600 36800 39950 High Housing Cost
Scranton--Wilkes-Barre, PA MSA 59000 29500 29550 State Median Based
Sebastian-Vero Beach, FL MSA 59000 29500 28950 Increase CappedSharon, PA HMFA 54700 27350 27850 State Median Based
Sheboygan, WI MSA 69300 34650 34450 Increase Capped
Sherman-Denison, TX MSA 62600 31300 31050 Increase Capped
Sioux City, IA-NE-SD MSA 58800 29400 30900 State Median Based
Somerset County, MD HMFA 56200 28100 37900 State Median Based
Springfield, IL MSA 74500 37250 36850 Increase Capped
Springfield, MA HMFA 67700 33850 43750 State Median BasedSpringfield, OH MSA 53800 26900 27850 State Median Based
St. George, UT MSA 54900 27450 30600 State Median Based
St. Joseph, MO-KS MSA 61500 30750 30150 Increase Capped
Steubenville-Weirton, OH-WV MSA 53100 26550 27850 State Median Based
Tacoma, WA HMFA 71000 35500 35450 Increase Capped
Tate County, MS HMFA 54900 27450 27200 Increase Capped
Texarkana, TX-Texarkana, AR MSA 50000 25000 26200 State Median BasedToledo, OH MSA 62800 31400 30200 Increase Capped
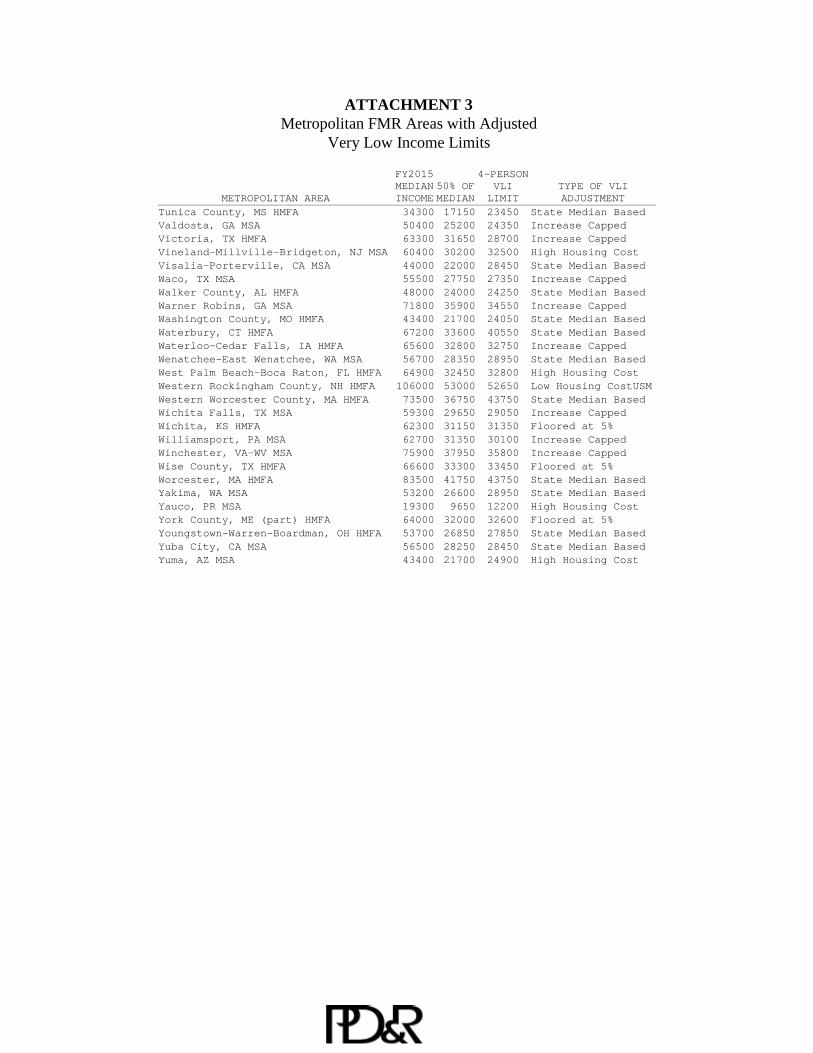
ATTACHMENT 3Metropolitan FMR Areas with Adjusted
Very Low Income Limits
METROPOLITAN AREA
FY2015MEDIANINCOME
50% OFMEDIAN
4-PERSONVLILIMIT
TYPE OF VLIADJUSTMENT
Tunica County, MS HMFA 34300 17150 23450 State Median BasedValdosta, GA MSA 50400 25200 24350 Increase Capped
Victoria, TX HMFA 63300 31650 28700 Increase Capped
Vineland-Millville-Bridgeton, NJ MSA 60400 30200 32500 High Housing Cost
Visalia-Porterville, CA MSA 44000 22000 28450 State Median Based
Waco, TX MSA 55500 27750 27350 Increase Capped
Walker County, AL HMFA 48000 24000 24250 State Median Based
Warner Robins, GA MSA 71800 35900 34550 Increase CappedWashington County, MO HMFA 43400 21700 24050 State Median Based
Waterbury, CT HMFA 67200 33600 40550 State Median Based
Waterloo-Cedar Falls, IA HMFA 65600 32800 32750 Increase Capped
Wenatchee-East Wenatchee, WA MSA 56700 28350 28950 State Median Based
West Palm Beach-Boca Raton, FL HMFA 64900 32450 32800 High Housing Cost
Western Rockingham County, NH HMFA 106000 53000 52650 Low Housing CostUSM
Western Worcester County, MA HMFA 73500 36750 43750 State Median BasedWichita Falls, TX MSA 59300 29650 29050 Increase Capped
Wichita, KS HMFA 62300 31150 31350 Floored at 5%
Williamsport, PA MSA 62700 31350 30100 Increase Capped
Winchester, VA-WV MSA 75900 37950 35800 Increase Capped
Wise County, TX HMFA 66600 33300 33450 Floored at 5%
Worcester, MA HMFA 83500 41750 43750 State Median BasedYakima, WA MSA 53200 26600 28950 State Median Based
Yauco, PR MSA 19300 9650 12200 High Housing Cost
York County, ME (part) HMFA 64000 32000 32600 Floored at 5%
Youngstown-Warren-Boardman, OH HMFA 53700 26850 27850 State Median Based
Yuba City, CA MSA 56500 28250 28450 State Median Based
Yuma, AZ MSA 43400 21700 24900 High Housing Cost
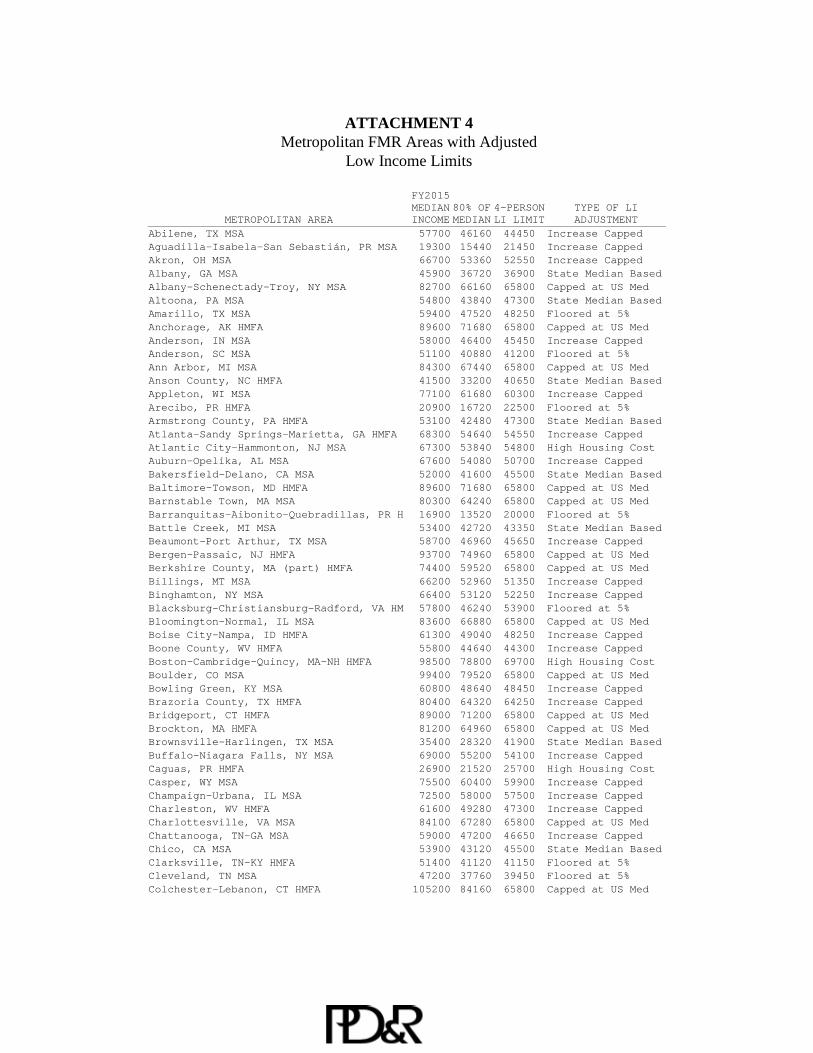
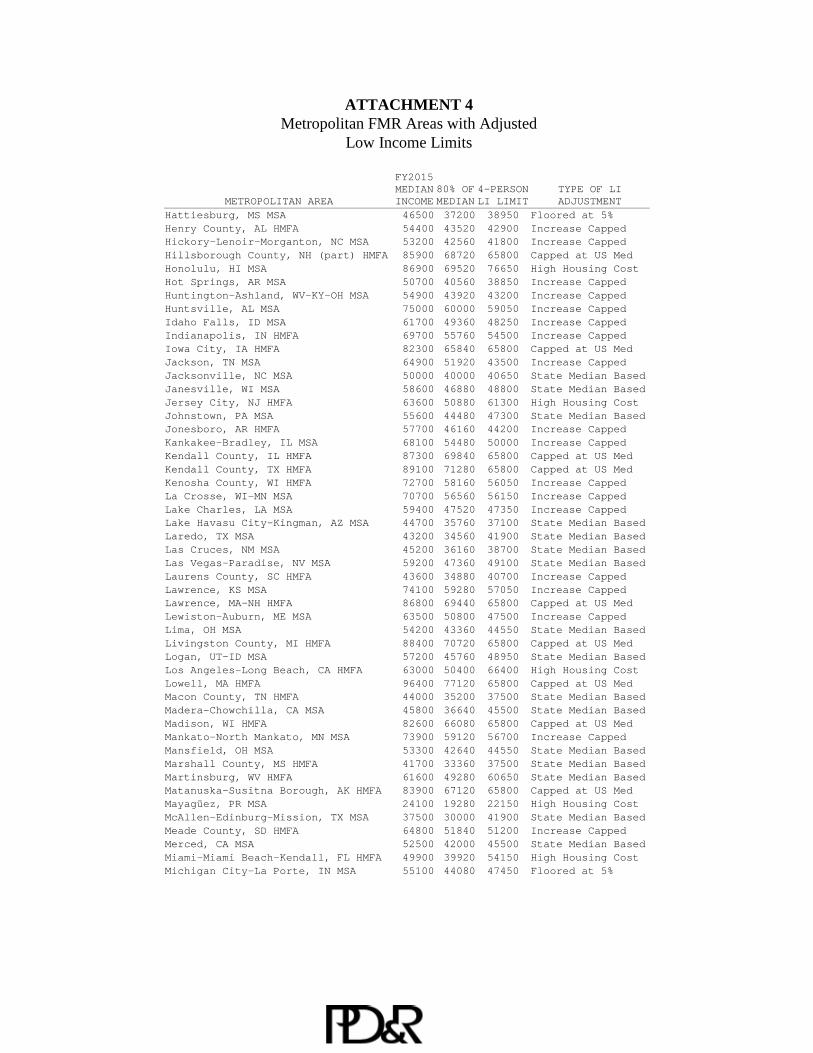
ATTACHMENT 4Metropolitan FMR Areas with Adjusted
Low Income Limits
METROPOLITAN AREA
FY2015MEDIANINCOME
80% OFMEDIAN
4-PERSONLI LIMIT
TYPE OF LIADJUSTMENT
Abilene, TX MSA 57700 46160 44450 Increase Capped
Aguadilla-Isabela-San Sebastián, PR MSA 19300 15440 21450 Increase CappedAkron, OH MSA 66700 53360 52550 Increase Capped
Albany, GA MSA 45900 36720 36900 State Median Based
Albany-Schenectady-Troy, NY MSA 82700 66160 65800 Capped at US Med
Altoona, PA MSA 54800 43840 47300 State Median Based
Amarillo, TX MSA 59400 47520 48250 Floored at 5%
Anchorage, AK HMFA 89600 71680 65800 Capped at US Med
Anderson, IN MSA 58000 46400 45450 Increase CappedAnderson, SC MSA 51100 40880 41200 Floored at 5%
Ann Arbor, MI MSA 84300 67440 65800 Capped at US Med
Anson County, NC HMFA 41500 33200 40650 State Median Based
Appleton, WI MSA 77100 61680 60300 Increase Capped
Arecibo, PR HMFA 20900 16720 22500 Floored at 5%
Armstrong County, PA HMFA 53100 42480 47300 State Median Based
Atlanta-Sandy Springs-Marietta, GA HMFA 68300 54640 54550 Increase CappedAtlantic City-Hammonton, NJ MSA 67300 53840 54800 High Housing Cost
Auburn-Opelika, AL MSA 67600 54080 50700 Increase Capped
Bakersfield-Delano, CA MSA 52000 41600 45500 State Median Based
Baltimore-Towson, MD HMFA 89600 71680 65800 Capped at US Med
Barnstable Town, MA MSA 80300 64240 65800 Capped at US Med
Barranquitas-Aibonito-Quebradillas, PR H 16900 13520 20000 Floored at 5%
Battle Creek, MI MSA 53400 42720 43350 State Median BasedBeaumont-Port Arthur, TX MSA 58700 46960 45650 Increase Capped
Bergen-Passaic, NJ HMFA 93700 74960 65800 Capped at US Med
Berkshire County, MA (part) HMFA 74400 59520 65800 Capped at US Med
Billings, MT MSA 66200 52960 51350 Increase Capped
Binghamton, NY MSA 66400 53120 52250 Increase Capped
Blacksburg-Christiansburg-Radford, VA HM 57800 46240 53900 Floored at 5%Bloomington-Normal, IL MSA 83600 66880 65800 Capped at US Med
Boise City-Nampa, ID HMFA 61300 49040 48250 Increase Capped
Boone County, WV HMFA 55800 44640 44300 Increase Capped
Boston-Cambridge-Quincy, MA-NH HMFA 98500 78800 69700 High Housing Cost
Boulder, CO MSA 99400 79520 65800 Capped at US Med
Bowling Green, KY MSA 60800 48640 48450 Increase Capped
Brazoria County, TX HMFA 80400 64320 64250 Increase CappedBridgeport, CT HMFA 89000 71200 65800 Capped at US Med
Brockton, MA HMFA 81200 64960 65800 Capped at US Med
Brownsville-Harlingen, TX MSA 35400 28320 41900 State Median Based
Buffalo-Niagara Falls, NY MSA 69000 55200 54100 Increase Capped
Caguas, PR HMFA 26900 21520 25700 High Housing Cost
Casper, WY MSA 75500 60400 59900 Increase Capped
Champaign-Urbana, IL MSA 72500 58000 57500 Increase CappedCharleston, WV HMFA 61600 49280 47300 Increase Capped
Charlottesville, VA MSA 84100 67280 65800 Capped at US Med
Chattanooga, TN-GA MSA 59000 47200 46650 Increase Capped
Chico, CA MSA 53900 43120 45500 State Median Based
Clarksville, TN-KY HMFA 51400 41120 41150 Floored at 5%
Cleveland, TN MSA 47200 37760 39450 Floored at 5%
Colchester-Lebanon, CT HMFA 105200 84160 65800 Capped at US Med

ATTACHMENT 4Metropolitan FMR Areas with Adjusted
Low Income Limits
METROPOLITAN AREA
FY2015MEDIANINCOME
80% OFMEDIAN
4-PERSONLI LIMIT
TYPE OF LIADJUSTMENT
College Station-Bryan, TX MSA 62000 49600 48700 Increase Capped
Columbia, MO MSA 72600 58080 58000 Increase CappedColumbia, SC HMFA 64700 51760 49350 Increase Capped
Columbus, GA-AL MSA 58200 46560 43200 Increase Capped
Corpus Christi, TX HMFA 58800 47040 44550 Increase Capped
Corvallis, OR MSA 78600 62880 62800 Increase Capped
Crestview-Fort Walton Beach-Destin, FL M 67500 54000 53200 Increase Capped
Cumberland, MD-WV MSA 51600 41280 60650 State Median Based
Dalton, GA HMFA 43600 34880 36900 State Median BasedDanbury, CT HMFA 112400 89920 73850 High Housing Cost
Danville, IL MSA 52800 42240 47900 State Median Based
Danville, VA MSA 51800 41440 42500 State Median Based
Darlington County, SC HMFA 44000 35200 37900 Floored at 5%
Davenport-Moline-Rock Island, IA-IL MSA 69000 55200 53200 Increase Capped
Decatur, IL MSA 56900 45520 47900 State Median Based
Deltona-Daytona Beach-Ormond Beach, FL M 51800 41440 42000 High Housing CostDubuque, IA MSA 65700 52560 52800 Floored at 5%
Duluth, MN-WI MSA 63500 50800 51050 State Median Based
Eastern Worcester County, MA HMFA 101300 81040 65800 Capped at US Med
Easton-Raynham, MA HMFA 114800 91840 65800 Capped at US Med
El Centro, CA MSA 44500 35600 45500 State Median Based
El Paso, TX MSA 47600 38080 41900 State Median Based
Elizabethtown, KY MSA 60100 48080 47700 Increase CappedElkhart-Goshen, IN MSA 53300 42640 43900 State Median Based
Erie, PA MSA 62000 49600 48450 Increase Capped
Fairbanks, AK MSA 85600 68480 65450 Increase Capped
Fajardo, PR MSA 26500 21200 25450 High Housing Cost
Fargo, ND-MN MSA 76600 61280 61050 Increase Capped
Farmington, NM MSA 54700 43760 44100 Floored at 5%Fitchburg-Leominster, MA HMFA 81100 64880 65800 Capped at US Med
Flagstaff, AZ MSA 59400 47520 48150 High Housing Cost
Flint, MI MSA 53800 43040 43350 State Median Based
Florence-Muscle Shoals, AL MSA 58600 46880 44150 Increase Capped
Fort Collins-Loveland, CO MSA 79300 63440 62250 Increase Capped
Fort Lauderdale, FL HMFA 63300 50640 55300 High Housing Cost
Fort Worth-Arlington, TX HMFA 70500 56400 55750 Increase CappedFranklin County, AR HMFA 44000 35200 35750 State Median Based
Franklin County, MA (part) HMFA 74300 59440 65800 Capped at US Med
Fresno, CA MSA 47600 38080 45500 State Median Based
Gainesville, GA MSA 60700 48560 47500 Increase Capped
Giles County, VA HMFA 56600 45280 44900 Increase Capped
Grand Forks, ND-MN MSA 74200 59360 59100 Increase Capped
Grand Junction, CO MSA 57800 46240 48550 State Median BasedGrant County, KY HMFA 54200 43360 44550 State Median Based
Great Falls, MT MSA 61600 49280 49200 Increase Capped
Greeley, CO MSA 69600 55680 53350 Increase Capped
Guayama, PR MSA 18400 14720 24950 Increase Capped
Hagerstown, MD HMFA 65300 52240 60650 State Median Based
Hanford-Corcoran, CA MSA 50000 40000 45500 State Median Based
Hartford-West Hartford-East Hartford, CT 87500 70000 65800 Capped at US Med
ATTACHMENT 4Metropolitan FMR Areas with Adjusted
Low Income Limits
METROPOLITAN AREA
FY2015MEDIANINCOME
80% OFMEDIAN
4-PERSONLI LIMIT
TYPE OF LIADJUSTMENT
Hattiesburg, MS MSA 46500 37200 38950 Floored at 5%
Henry County, AL HMFA 54400 43520 42900 Increase CappedHickory-Lenoir-Morganton, NC MSA 53200 42560 41800 Increase Capped
Hillsborough County, NH (part) HMFA 85900 68720 65800 Capped at US Med
Honolulu, HI MSA 86900 69520 76650 High Housing Cost
Hot Springs, AR MSA 50700 40560 38850 Increase Capped
Huntington-Ashland, WV-KY-OH MSA 54900 43920 43200 Increase Capped
Huntsville, AL MSA 75000 60000 59050 Increase Capped
Idaho Falls, ID MSA 61700 49360 48250 Increase CappedIndianapolis, IN HMFA 69700 55760 54500 Increase Capped
Iowa City, IA HMFA 82300 65840 65800 Capped at US Med
Jackson, TN MSA 64900 51920 43500 Increase Capped
Jacksonville, NC MSA 50000 40000 40650 State Median Based
Janesville, WI MSA 58600 46880 48800 State Median Based
Jersey City, NJ HMFA 63600 50880 61300 High Housing Cost
Johnstown, PA MSA 55600 44480 47300 State Median BasedJonesboro, AR HMFA 57700 46160 44200 Increase Capped
Kankakee-Bradley, IL MSA 68100 54480 50000 Increase Capped
Kendall County, IL HMFA 87300 69840 65800 Capped at US Med
Kendall County, TX HMFA 89100 71280 65800 Capped at US Med
Kenosha County, WI HMFA 72700 58160 56050 Increase Capped
La Crosse, WI-MN MSA 70700 56560 56150 Increase Capped
Lake Charles, LA MSA 59400 47520 47350 Increase CappedLake Havasu City-Kingman, AZ MSA 44700 35760 37100 State Median Based
Laredo, TX MSA 43200 34560 41900 State Median Based
Las Cruces, NM MSA 45200 36160 38700 State Median Based
Las Vegas-Paradise, NV MSA 59200 47360 49100 State Median Based
Laurens County, SC HMFA 43600 34880 40700 Increase Capped
Lawrence, KS MSA 74100 59280 57050 Increase CappedLawrence, MA-NH HMFA 86800 69440 65800 Capped at US Med
Lewiston-Auburn, ME MSA 63500 50800 47500 Increase Capped
Lima, OH MSA 54200 43360 44550 State Median Based
Livingston County, MI HMFA 88400 70720 65800 Capped at US Med
Logan, UT-ID MSA 57200 45760 48950 State Median Based
Los Angeles-Long Beach, CA HMFA 63000 50400 66400 High Housing Cost
Lowell, MA HMFA 96400 77120 65800 Capped at US MedMacon County, TN HMFA 44000 35200 37500 State Median Based
Madera-Chowchilla, CA MSA 45800 36640 45500 State Median Based
Madison, WI HMFA 82600 66080 65800 Capped at US Med
Mankato-North Mankato, MN MSA 73900 59120 56700 Increase Capped
Mansfield, OH MSA 53300 42640 44550 State Median Based
Marshall County, MS HMFA 41700 33360 37500 State Median Based
Martinsburg, WV HMFA 61600 49280 60650 State Median BasedMatanuska-Susitna Borough, AK HMFA 83900 67120 65800 Capped at US Med
Mayagüez, PR MSA 24100 19280 22150 High Housing Cost
McAllen-Edinburg-Mission, TX MSA 37500 30000 41900 State Median Based
Meade County, SD HMFA 64800 51840 51200 Increase Capped
Merced, CA MSA 52500 42000 45500 State Median Based
Miami-Miami Beach-Kendall, FL HMFA 49900 39920 54150 High Housing Cost
Michigan City-La Porte, IN MSA 55100 44080 47450 Floored at 5%
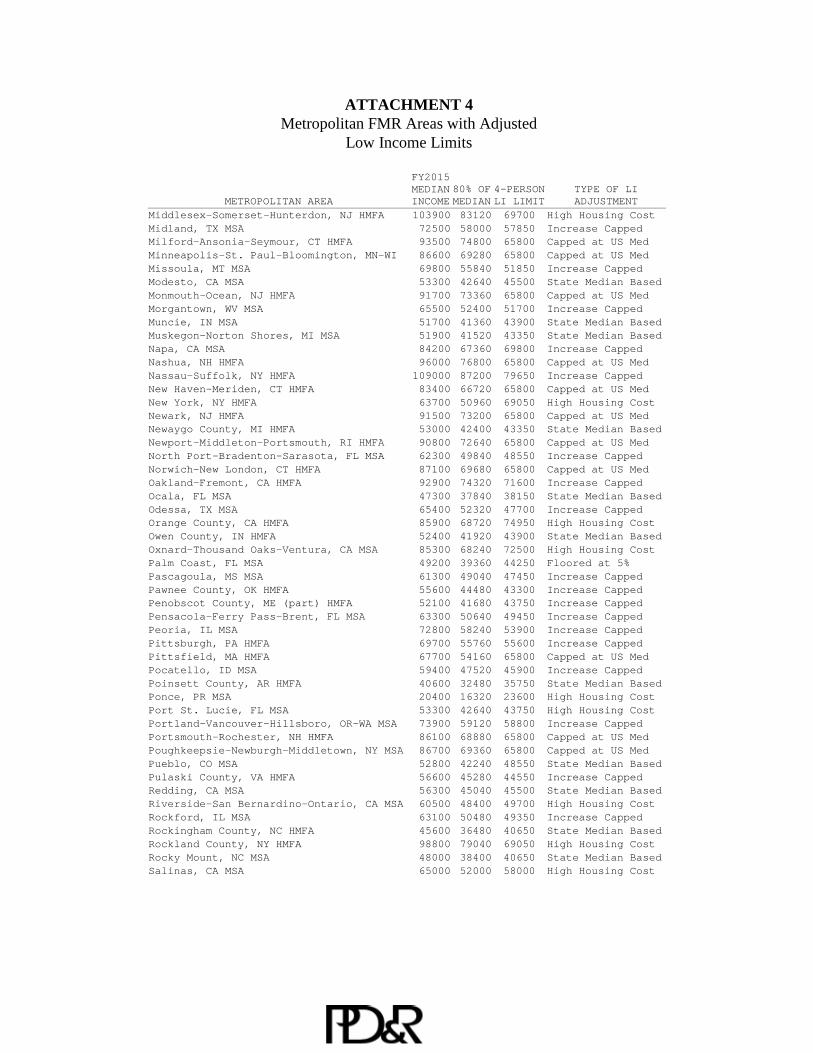
ATTACHMENT 4Metropolitan FMR Areas with Adjusted
Low Income Limits
METROPOLITAN AREA
FY2015MEDIANINCOME
80% OFMEDIAN
4-PERSONLI LIMIT
TYPE OF LIADJUSTMENT
Middlesex-Somerset-Hunterdon, NJ HMFA 103900 83120 69700 High Housing Cost
Midland, TX MSA 72500 58000 57850 Increase CappedMilford-Ansonia-Seymour, CT HMFA 93500 74800 65800 Capped at US Med
Minneapolis-St. Paul-Bloomington, MN-WI 86600 69280 65800 Capped at US Med
Missoula, MT MSA 69800 55840 51850 Increase Capped
Modesto, CA MSA 53300 42640 45500 State Median Based
Monmouth-Ocean, NJ HMFA 91700 73360 65800 Capped at US Med
Morgantown, WV MSA 65500 52400 51700 Increase Capped
Muncie, IN MSA 51700 41360 43900 State Median BasedMuskegon-Norton Shores, MI MSA 51900 41520 43350 State Median Based
Napa, CA MSA 84200 67360 69800 Increase Capped
Nashua, NH HMFA 96000 76800 65800 Capped at US Med
Nassau-Suffolk, NY HMFA 109000 87200 79650 Increase Capped
New Haven-Meriden, CT HMFA 83400 66720 65800 Capped at US Med
New York, NY HMFA 63700 50960 69050 High Housing Cost
Newark, NJ HMFA 91500 73200 65800 Capped at US MedNewaygo County, MI HMFA 53000 42400 43350 State Median Based
Newport-Middleton-Portsmouth, RI HMFA 90800 72640 65800 Capped at US Med
North Port-Bradenton-Sarasota, FL MSA 62300 49840 48550 Increase Capped
Norwich-New London, CT HMFA 87100 69680 65800 Capped at US Med
Oakland-Fremont, CA HMFA 92900 74320 71600 Increase Capped
Ocala, FL MSA 47300 37840 38150 State Median Based
Odessa, TX MSA 65400 52320 47700 Increase CappedOrange County, CA HMFA 85900 68720 74950 High Housing Cost
Owen County, IN HMFA 52400 41920 43900 State Median Based
Oxnard-Thousand Oaks-Ventura, CA MSA 85300 68240 72500 High Housing Cost
Palm Coast, FL MSA 49200 39360 44250 Floored at 5%
Pascagoula, MS MSA 61300 49040 47450 Increase Capped
Pawnee County, OK HMFA 55600 44480 43300 Increase CappedPenobscot County, ME (part) HMFA 52100 41680 43750 Increase Capped
Pensacola-Ferry Pass-Brent, FL MSA 63300 50640 49450 Increase Capped
Peoria, IL MSA 72800 58240 53900 Increase Capped
Pittsburgh, PA HMFA 69700 55760 55600 Increase Capped
Pittsfield, MA HMFA 67700 54160 65800 Capped at US Med
Pocatello, ID MSA 59400 47520 45900 Increase Capped
Poinsett County, AR HMFA 40600 32480 35750 State Median BasedPonce, PR MSA 20400 16320 23600 High Housing Cost
Port St. Lucie, FL MSA 53300 42640 43750 High Housing Cost
Portland-Vancouver-Hillsboro, OR-WA MSA 73900 59120 58800 Increase Capped
Portsmouth-Rochester, NH HMFA 86100 68880 65800 Capped at US Med
Poughkeepsie-Newburgh-Middletown, NY MSA 86700 69360 65800 Capped at US Med
Pueblo, CO MSA 52800 42240 48550 State Median Based
Pulaski County, VA HMFA 56600 45280 44550 Increase CappedRedding, CA MSA 56300 45040 45500 State Median Based
Riverside-San Bernardino-Ontario, CA MSA 60500 48400 49700 High Housing Cost
Rockford, IL MSA 63100 50480 49350 Increase Capped
Rockingham County, NC HMFA 45600 36480 40650 State Median Based
Rockland County, NY HMFA 98800 79040 69050 High Housing Cost
Rocky Mount, NC MSA 48000 38400 40650 State Median Based
Salinas, CA MSA 65000 52000 58000 High Housing Cost
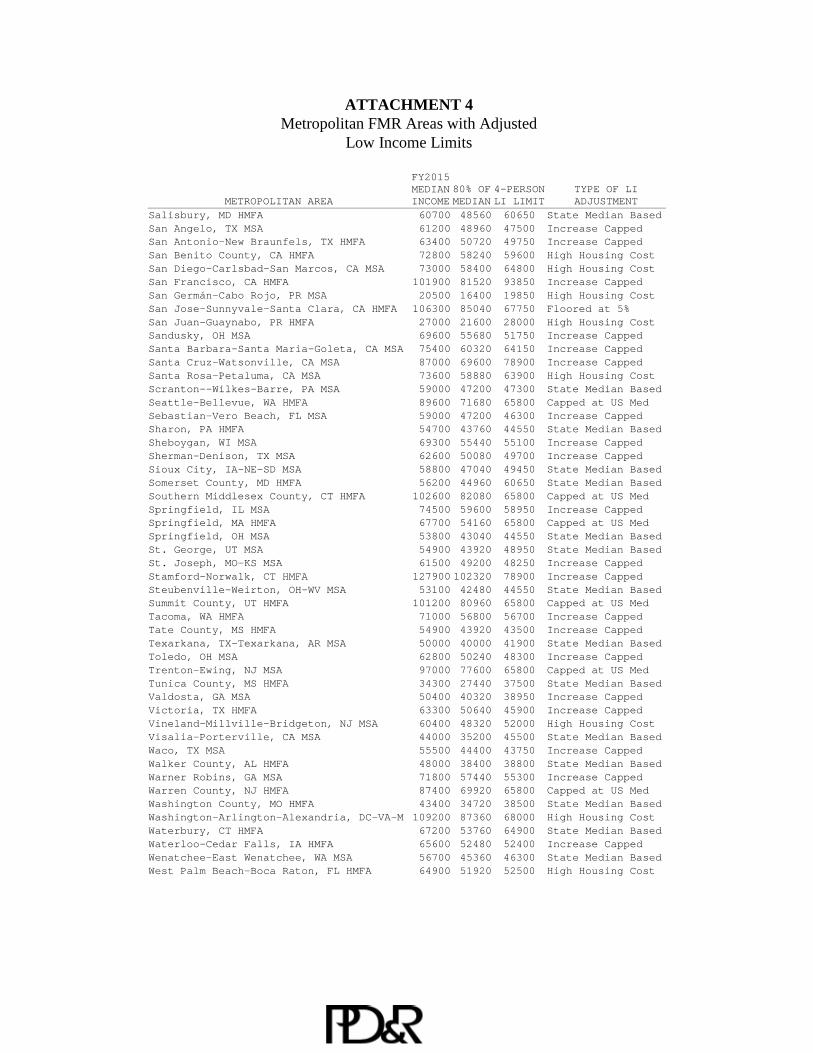
ATTACHMENT 4Metropolitan FMR Areas with Adjusted
Low Income Limits
METROPOLITAN AREA
FY2015MEDIANINCOME
80% OFMEDIAN
4-PERSONLI LIMIT
TYPE OF LIADJUSTMENT
Salisbury, MD HMFA 60700 48560 60650 State Median Based
San Angelo, TX MSA 61200 48960 47500 Increase CappedSan Antonio-New Braunfels, TX HMFA 63400 50720 49750 Increase Capped
San Benito County, CA HMFA 72800 58240 59600 High Housing Cost
San Diego-Carlsbad-San Marcos, CA MSA 73000 58400 64800 High Housing Cost
San Francisco, CA HMFA 101900 81520 93850 Increase Capped
San Germán-Cabo Rojo, PR MSA 20500 16400 19850 High Housing Cost
San Jose-Sunnyvale-Santa Clara, CA HMFA 106300 85040 67750 Floored at 5%
San Juan-Guaynabo, PR HMFA 27000 21600 28000 High Housing CostSandusky, OH MSA 69600 55680 51750 Increase Capped
Santa Barbara-Santa Maria-Goleta, CA MSA 75400 60320 64150 Increase Capped
Santa Cruz-Watsonville, CA MSA 87000 69600 78900 Increase Capped
Santa Rosa-Petaluma, CA MSA 73600 58880 63900 High Housing Cost
Scranton--Wilkes-Barre, PA MSA 59000 47200 47300 State Median Based
Seattle-Bellevue, WA HMFA 89600 71680 65800 Capped at US Med
Sebastian-Vero Beach, FL MSA 59000 47200 46300 Increase CappedSharon, PA HMFA 54700 43760 44550 State Median Based
Sheboygan, WI MSA 69300 55440 55100 Increase Capped
Sherman-Denison, TX MSA 62600 50080 49700 Increase Capped
Sioux City, IA-NE-SD MSA 58800 47040 49450 State Median Based
Somerset County, MD HMFA 56200 44960 60650 State Median Based
Southern Middlesex County, CT HMFA 102600 82080 65800 Capped at US Med
Springfield, IL MSA 74500 59600 58950 Increase CappedSpringfield, MA HMFA 67700 54160 65800 Capped at US Med
Springfield, OH MSA 53800 43040 44550 State Median Based
St. George, UT MSA 54900 43920 48950 State Median Based
St. Joseph, MO-KS MSA 61500 49200 48250 Increase Capped
Stamford-Norwalk, CT HMFA 127900 102320 78900 Increase Capped
Steubenville-Weirton, OH-WV MSA 53100 42480 44550 State Median BasedSummit County, UT HMFA 101200 80960 65800 Capped at US Med
Tacoma, WA HMFA 71000 56800 56700 Increase Capped
Tate County, MS HMFA 54900 43920 43500 Increase Capped
Texarkana, TX-Texarkana, AR MSA 50000 40000 41900 State Median Based
Toledo, OH MSA 62800 50240 48300 Increase Capped
Trenton-Ewing, NJ MSA 97000 77600 65800 Capped at US Med
Tunica County, MS HMFA 34300 27440 37500 State Median BasedValdosta, GA MSA 50400 40320 38950 Increase Capped
Victoria, TX HMFA 63300 50640 45900 Increase Capped
Vineland-Millville-Bridgeton, NJ MSA 60400 48320 52000 High Housing Cost
Visalia-Porterville, CA MSA 44000 35200 45500 State Median Based
Waco, TX MSA 55500 44400 43750 Increase Capped
Walker County, AL HMFA 48000 38400 38800 State Median Based
Warner Robins, GA MSA 71800 57440 55300 Increase CappedWarren County, NJ HMFA 87400 69920 65800 Capped at US Med
Washington County, MO HMFA 43400 34720 38500 State Median Based
Washington-Arlington-Alexandria, DC-VA-M 109200 87360 68000 High Housing Cost
Waterbury, CT HMFA 67200 53760 64900 State Median Based
Waterloo-Cedar Falls, IA HMFA 65600 52480 52400 Increase Capped
Wenatchee-East Wenatchee, WA MSA 56700 45360 46300 State Median Based
West Palm Beach-Boca Raton, FL HMFA 64900 51920 52500 High Housing Cost

ATTACHMENT 4Metropolitan FMR Areas with Adjusted
Low Income Limits
METROPOLITAN AREA
FY2015MEDIANINCOME
80% OFMEDIAN
4-PERSONLI LIMIT
TYPE OF LIADJUSTMENT
Westchester County, NY Statutory Excepti 105700 84560 71600 Increase Capped
Westerly-Hopkinton-New Shoreham, RI HMFA 83000 66400 65800 Capped at US MedWestern Rockingham County, NH HMFA 106000 84800 65800 Capped at US Med
Western Worcester County, MA HMFA 73500 58800 65800 Capped at US Med
Wichita Falls, TX MSA 59300 47440 46500 Increase Capped
Wichita, KS HMFA 62300 49840 50150 Floored at 5%
Williamsport, PA MSA 62700 50160 48150 Increase Capped
Winchester, VA-WV MSA 75900 60720 57300 Increase Capped
Wise County, TX HMFA 66600 53280 53500 Floored at 5%Worcester, MA HMFA 83500 66800 65800 Capped at US Med
Yakima, WA MSA 53200 42560 46300 State Median Based
Yauco, PR MSA 19300 15440 19500 High Housing Cost
York County, ME (part) HMFA 64000 51200 52200 Floored at 5%
York-Kittery-South Berwick, ME HMFA 84200 67360 65800 Capped at US Med
Youngstown-Warren-Boardman, OH HMFA 53700 42960 44550 State Median Based
Yuba City, CA MSA 56500 45200 45500 State Median BasedYuma, AZ MSA 43400 34720 39850 High Housing Cost

ATTACHMENT 5FY 2014 - 2015 Distribution of changes in Area Median Income
(100 Percent = FY 2014 Income Level)
STATE
Percent Change
lessthan80%
80%to
84.9%
85%to
89.9%
90%to
94.9%95 to99.9
100%to105%
105.1%to110%
110.1%to115%
115.1%to120%
120.1%to 125
125.1%ormore Median
1 100
AK 2 6 13 6 1 1 102
AL 2 3 8 31 6 3 102
AR 1 1 15 37 7 4 1 102
AZ 1 1 11 1 102
CA 1 3 9 29 5 2 2 102
CO 1 3 13 30 6 1 1 102
CT 3 6 2 1 102
DE 1 1 102
FL 2 7 10 23 9 1 101
GA 4 8 24 45 19 8 1 1 102
GU 1 103
HI 1 2 2 105
IA 1 13 62 13 1 103
ID 4 12 12 9 1 102
IL 1 2 10 50 13 3 1 1 103
IN 1 1 16 42 6 102
KS 1 4 12 54 15 3 1 103
KY 1 4 17 45 22 5 102
LA 2 10 22 9 1 103
MA 2 10 3 1 1 105
MD 4 4 3 2 101
ME 1 15 1 1 103
MI 1 10 54 7 2 1 102
MN 7 52 11 103
MO 2 22 54 17 1 102
MS 1 3 15 31 18 2 102
MT 1 4 6 21 13 6 1 1 2 104
NC 4 2 23 37 11 1 3 101
ND 1 1 3 24 13 9 1 105
NE 1 12 47 19 8 1 104
NH 3 6 1 103
NJ 1 3 101
NM 1 8 16 3 1 1 102
NV 2 5 8 1 100
NY 2 31 13 1 104
OH 9 41 12 3 1 102
OK 1 9 41 12 3 1 103
OR 10 14 5 2 103
PA 3 4 33 5 4 2 103
PR 1 1 4 3 1 2 105
RI 2 3 1 102
SC 3 1 10 13 7 2 101
SD 3 6 26 18 6 3 105
TN 1 2 16 46 7 1 1 102
TX 1 2 13 36 99 38 15 6 1 2 102
UT 2 3 16 4 1 103
VA 1 2 3 11 30 9 3 1 101
VI 2 103
VT 12 102
WA 1 5 17 8 2 103
WI 11 41 9 1 102
WV 5 18 15 1 1 105
WY 1 4 13 4 1 102
US 7 32 88 446 1398 440 115 35 5 6 102

ATTACHMENT 5AFY 2014 - 2015 Distribution of changes in Area Median Income
(100 Percent = FY 2014 Income Level)Metropolitan Areas
STATE
Percent Change
lessthan80%
80%to
84.9%
85%to
89.9%
90%to
94.9%95 to99.9
100%to105%
105.1%to110%
110.1%to115%
115.1%to120%
120.1%to 125
125.1%ormore Median
1 100
AK 2 1 107
AL 3 7 2 2 102
AR 3 5 1 2 101
AZ 6 102
CA 1 1 7 15 3 1 2 101
CO 1 1 4 1 1 103
CT 2 5 2 1 103
DE 1 106
FL 1 1 4 12 6 102
GA 3 9 5 4 105
HI 1 105
IA 1 9 1 103
ID 1 1 4 107
IL 1 1 2 5 3 3 1 105
IN 1 1 6 10 2 102
KS 1 3 1 101
KY 2 5 2 101
LA 3 3 3 102
MA 1 9 3 1 1 105
MD 2 3 1 107
ME 1 4 1 1 102
MI 3 14 1 102
MN 2 3 1 105
MO 4 11 2 102
MS 1 1 2 1 102
MT 1 2 111
NC 1 8 9 3 100
ND 1 2 106
NE 4 104
NH 3 104
NJ 1 3 101
NM 1 1 2 99
NV 3 102
NY 1 13 7 104
OH 4 9 4 1 102
OK 6 1 105
OR 1 2 1 2 105
PA 1 2 10 1 2 103
PR 1 1 4 2 1 2 104
RI 2 3 1 102
SC 1 1 4 4 1 98
SD 2 1 98
TN 1 4 9 2 1 102
TX 2 4 13 14 2 1 104
UT 1 6 103
VA 1 3 8 2 2 102
VT 1 102
WA 2 6 3 102
WI 4 8 3 102
WV 1 1 4 107
WY 1 1 104
US 3 6 13 98 272 101 33 7 2 103
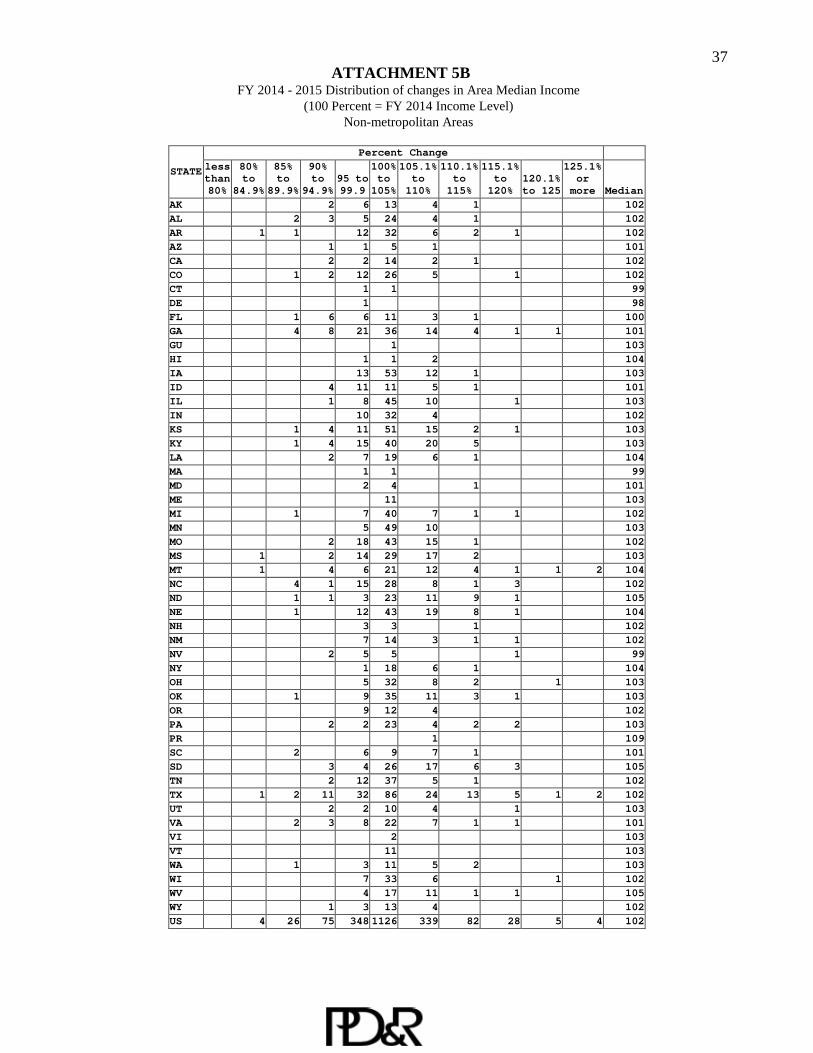
37ATTACHMENT 5B
FY 2014 - 2015 Distribution of changes in Area Median Income(100 Percent = FY 2014 Income Level)
Non-metropolitan Areas
STATE
Percent Change
lessthan80%
80%to
84.9%
85%to
89.9%
90%to
94.9%95 to99.9
100%to105%
105.1%to110%
110.1%to115%
115.1%to120%
120.1%to 125
125.1%ormore Median
AK 2 6 13 4 1 102
AL 2 3 5 24 4 1 102
AR 1 1 12 32 6 2 1 102
AZ 1 1 5 1 101
CA 2 2 14 2 1 102
CO 1 2 12 26 5 1 102
CT 1 1 99
DE 1 98
FL 1 6 6 11 3 1 100
GA 4 8 21 36 14 4 1 1 101
GU 1 103
HI 1 1 2 104
IA 13 53 12 1 103
ID 4 11 11 5 1 101
IL 1 8 45 10 1 103
IN 10 32 4 102
KS 1 4 11 51 15 2 1 103
KY 1 4 15 40 20 5 103
LA 2 7 19 6 1 104
MA 1 1 99
MD 2 4 1 101
ME 11 103
MI 1 7 40 7 1 1 102
MN 5 49 10 103
MO 2 18 43 15 1 102
MS 1 2 14 29 17 2 103
MT 1 4 6 21 12 4 1 1 2 104
NC 4 1 15 28 8 1 3 102
ND 1 1 3 23 11 9 1 105
NE 1 12 43 19 8 1 104
NH 3 3 1 102
NM 7 14 3 1 1 102
NV 2 5 5 1 99
NY 1 18 6 1 104
OH 5 32 8 2 1 103
OK 1 9 35 11 3 1 103
OR 9 12 4 102
PA 2 2 23 4 2 2 103
PR 1 109
SC 2 6 9 7 1 101
SD 3 4 26 17 6 3 105
TN 2 12 37 5 1 102
TX 1 2 11 32 86 24 13 5 1 2 102
UT 2 2 10 4 1 103
VA 2 3 8 22 7 1 1 101
VI 2 103
VT 11 103
WA 1 3 11 5 2 103
WI 7 33 6 1 102
WV 4 17 11 1 1 105
WY 1 3 13 4 102
US 4 26 75 348 1126 339 82 28 5 4 102
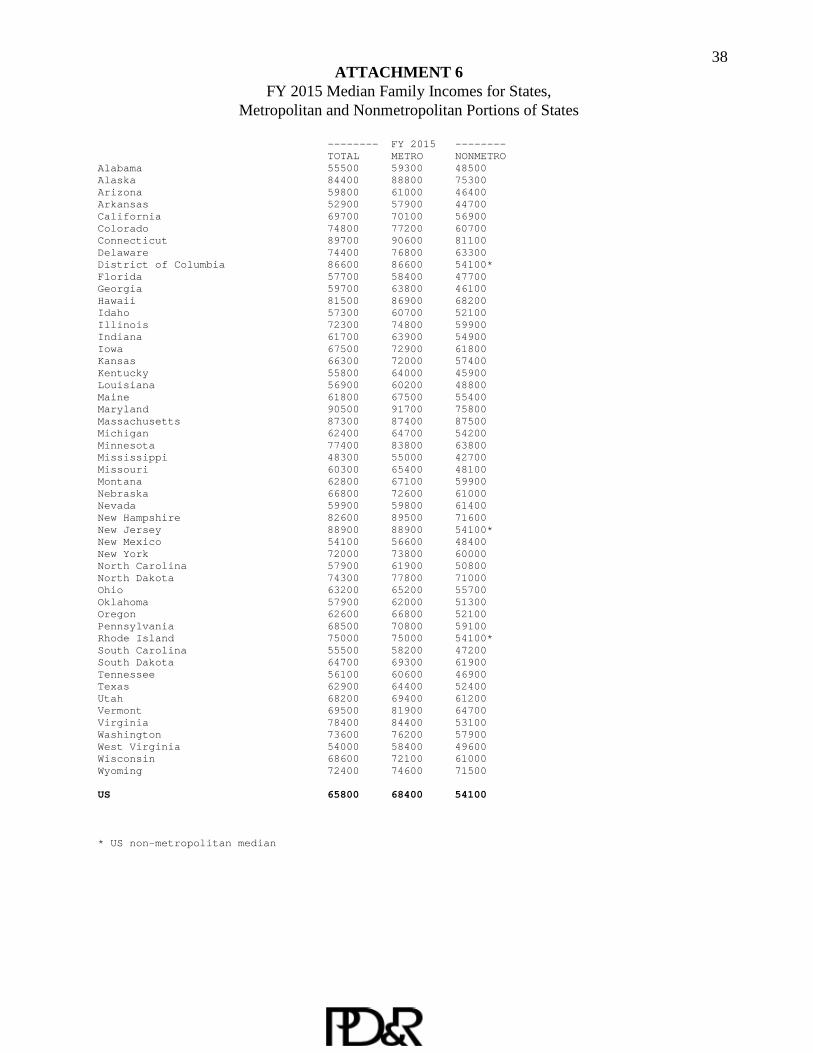
38ATTACHMENT 6
FY 2015 Median Family Incomes for States,Metropolitan and Nonmetropolitan Portions of States
-------- FY 2015 --------TOTAL METRO NONMETRO
Alabama 55500 59300 48500Alaska 84400 88800 75300Arizona 59800 61000 46400Arkansas 52900 57900 44700California 69700 70100 56900Colorado 74800 77200 60700Connecticut 89700 90600 81100Delaware 74400 76800 63300District of Columbia 86600 86600 54100*Florida 57700 58400 47700Georgia 59700 63800 46100Hawaii 81500 86900 68200Idaho 57300 60700 52100Illinois 72300 74800 59900Indiana 61700 63900 54900Iowa 67500 72900 61800Kansas 66300 72000 57400Kentucky 55800 64000 45900Louisiana 56900 60200 48800Maine 61800 67500 55400Maryland 90500 91700 75800Massachusetts 87300 87400 87500Michigan 62400 64700 54200Minnesota 77400 83800 63800Mississippi 48300 55000 42700Missouri 60300 65400 48100Montana 62800 67100 59900Nebraska 66800 72600 61000Nevada 59900 59800 61400New Hampshire 82600 89500 71600New Jersey 88900 88900 54100*New Mexico 54100 56600 48400New York 72000 73800 60000North Carolina 57900 61900 50800North Dakota 74300 77800 71000Ohio 63200 65200 55700Oklahoma 57900 62000 51300Oregon 62600 66800 52100Pennsylvania 68500 70800 59100Rhode Island 75000 75000 54100*South Carolina 55500 58200 47200South Dakota 64700 69300 61900Tennessee 56100 60600 46900Texas 62900 64400 52400Utah 68200 69400 61200Vermont 69500 81900 64700Virginia 78400 84400 53100Washington 73600 76200 57900West Virginia 54000 58400 49600Wisconsin 68600 72100 61000Wyoming 72400 74600 71500
US 65800 68400 54100
* US non-metropolitan median