Embed Size (px)
Citation preview
FY 2018 Budget Justification USDA Forest Service
Table of Contents
Budget Overview
Appendix A: Forest Service Budget Summary
Appendix B: 3-Year Summary of Appropriations
Appendix C: 3-Year Summary of FTEs
Appendix D: Revenue, Receipts, and Transfers
Appendix E: Org Chart
Appendix F: Available Funds and Staff Years
Appendix G: Permanent Positions by Grade and Staff Year Summary
Appendix H: Motor Vehicle Fleet
Appendix I: Lead-Off Tabular Statement
Appendix J: Summary of Increases and Decreases
Appendix K: Project Statements
Appendix L: Classification by Objects
Appendix M: Shared Funding Project
FY 2018 Budget Justification USDA Forest Service
Overview 1
“The greatest good for the greatest number in the long run.” Gifford Pinchot, first Chief of the U.S. Forest Service (1905-1910)
Mission – the Forest Service’s mission to sustain the health, diversity, and productivity of the Nation's forests and grasslands to meet the needs of present and future generations.
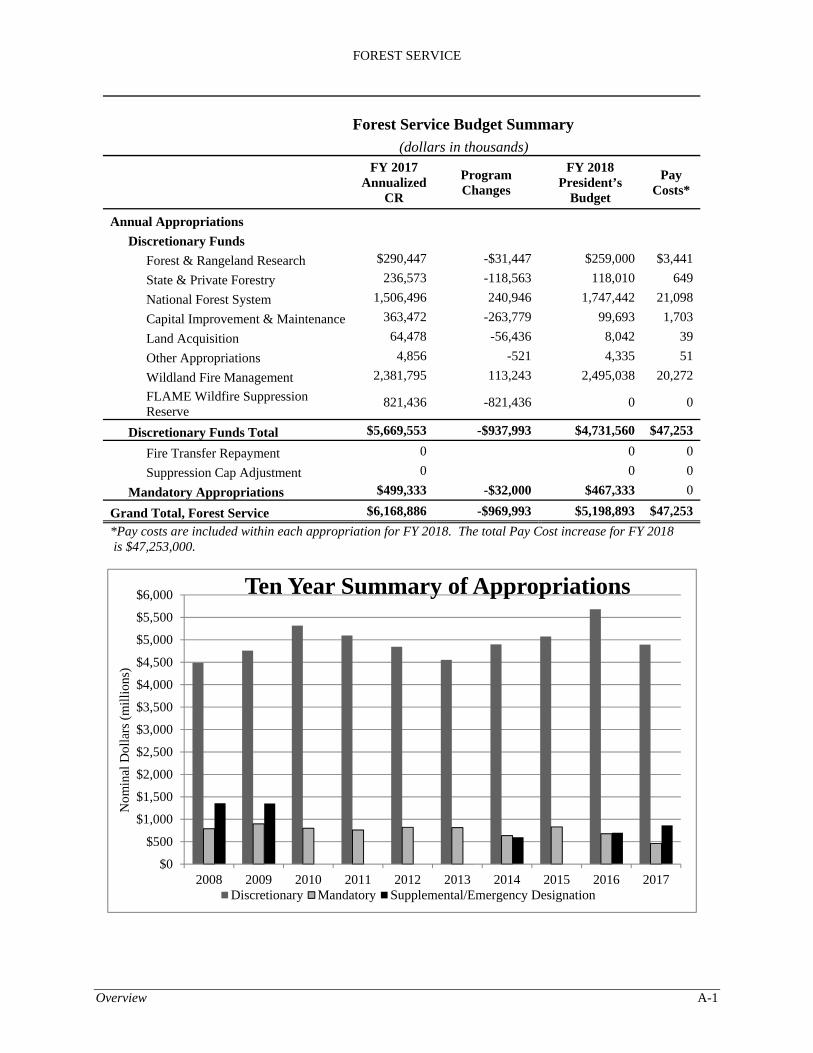
Budget Overview – The 2018 Forest Service budget for discretionary appropriations is $4.73 billion, a decrease of $938 million below the 2017 annualized Continuing Resolution. It includes $1.75 billion for the management of National Forest System lands and $2.5 billion for Wildland Fire Management. The Administration outlined specific guidance and priorities in the FY 2018 Budget Blueprint to Make America Great Again. In particular, these are:
Fully funding wildland fire preparedness and suppression activities at $2.4 billion. Suppression is funded at 100 percent of the 10-year average for suppression expenditures to ensure the resources necessary to protect life and property.
Reducing funding for lower priority activities in the National Forest System, such as new Federal land acquisitions; instead, the 2018 President’s Budget focuses on maintaining existing forests and grasslands.
Jobs and Economic Contribution – The Forest Service supports considerable economic activity in national, regional and local economies through natural resource management, research and development, wildland fire management infrastructure investment, grants, and payments to other government entities, and by providing sustainable use of the national forests and grasslands. A recent analysis indicated Forest Service programs and work in FY 2014 contributed nearly 360,000 jobs (average annual full-time, part-time, temporary, and seasonal) and more than $30 billion in gross domestic product (GDP) capturing the cumulative jobs and GDP effects (direct, indirect, and induced components). Almost 65 percent of the economic activity was generated by resource use effects such as recreation visitor use, hunting and fishing, energy and minerals development, forest products, and livestock grazing.
The FY 2018 budget proposal maintains significant Forest Service economic activity, particularly benefitting many rural forest and grassland dependent communities as well as the nation as a whole. The proposed Forest Service program of work is projected to contribute between 340,000 and 370,000 jobs in the economy and between $30 billion and $31 billion in GDP. A greater share of the economic benefit, up to 70 percent, is anticipated to be generated by resource use effects in FY 2018. While all resource uses are important to the nation, recreation and wildlife visitor use will continue to provide the single largest category of economic contribution.
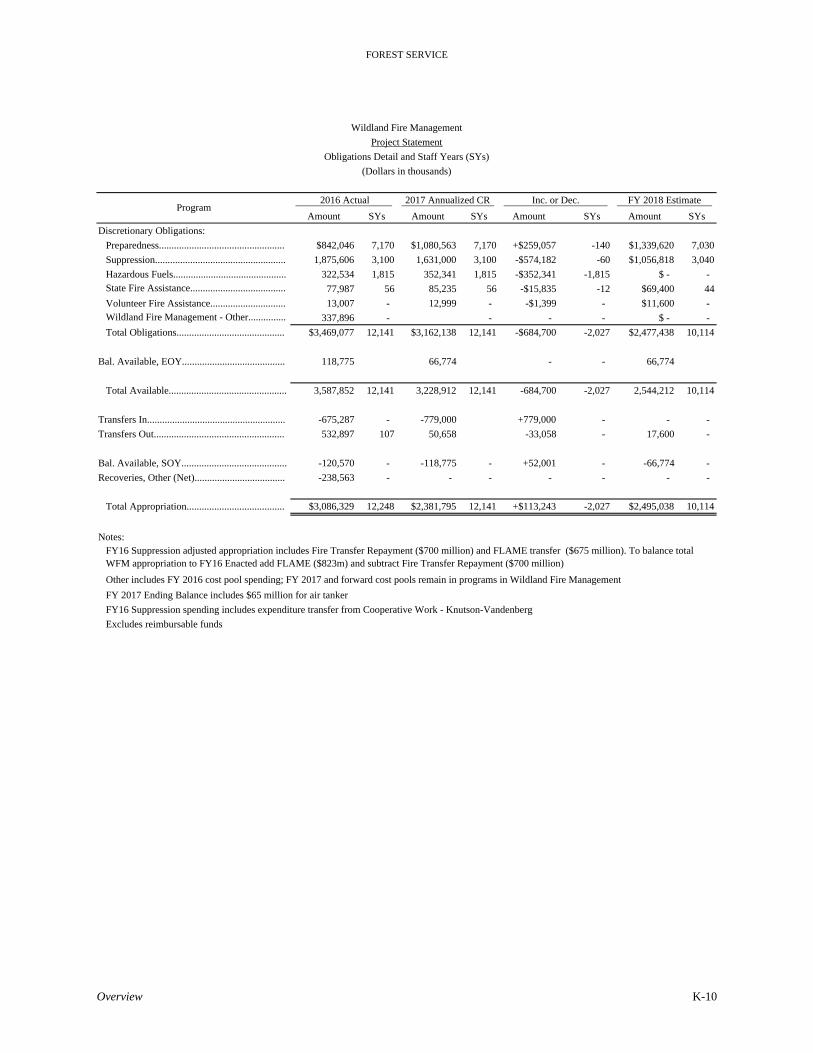
Wildland Fire Management – In 2018, the Wildland Fire Management budget is $2.495 billion, a decrease of $708 million below the 2017 annualized Continuing Resolution funding level. The significant changes to the appropriation are:
An increase of $259 million to Preparedness funding to improve accountability at both the national and regional level. The Forest Service is strengthening its financial accountability and increasing predictability in its budget planning and execution process. Starting in FY 2018, Forest Service firefighters will charge all base hours (the first eight hours of each day) to Preparedness and, when fighting fires, charge any hours over eight per day to Suppression. This funding honors a 2002 commitment to implement joint Forest Service/Department of the Interior business rules for budget planning of base 8-hour expenditures. This funding increase was shifted from the Suppression program where it was historically charged.
An increase of $247 million to Suppression funding to fully fund the 10-year average expenditure for suppression operations. In 2018, the 10-year average is $1.057 billion. When compared to the 2017 budget, this seems like a reduction because the 10-year average was rebased. However, since base 8-hour expenditures will be charged to Preparedness, the 10-year average was recalculated with those expenditures removed from the last 10-years of expenditure data.
The Federal Land Assistance, Management and Enhancement (FLAME) Wildfire Suppression Reserve Fund is not funded. The FLAME fund was intended as distinct appropriation providing funds to cover fires escaping initial attack (response) that are sufficiently large and complex, or when overall fire activity is at such high levels that the resources appropriated to the Suppression account are about to be completely obligated.
FY 2018 Budget Justification USDA Forest Service
Overview 2
However, as a practical matter, these funds are not a reserve, but are now part of the base program as suppression costs have exceeded the base appropriation in all but two years since enactment of the FLAME Act. It is now duplicative and is not funded to reduce inefficiencies in budget execution.
Hazardous Fuels has been moved from the Wildland Fire Management appropriation to the National Forest System appropriation. Nearly all hazardous fuels reduction work takes place on or adjacent to National Forest System lands and the funds are allocated to the Regions which are responsible for the broader restoration portfolio. The proposal to appropriate hazardous fuels within the National Forest System aims to improve coordination within the National Forest System and increase goods and services coming from National Forest System lands.
The Joint Fire Science program is not proposed for funding because it is duplicative with research efforts already being conducted through the Forest and Rangeland Research appropriation and the National Fire Plan Research and Development budget line item.
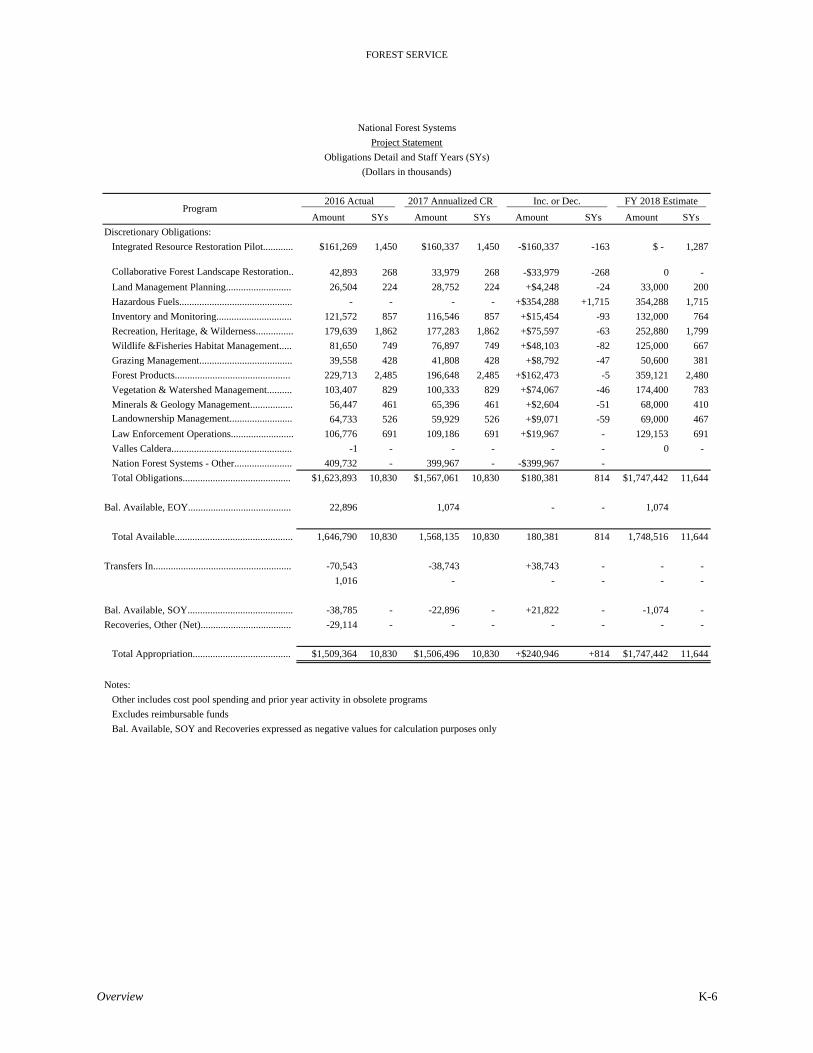
National Forest System – In 2018, the National Forest System budget is $1.75 billion, including Hazardous Fuels funding. The significant changes to the appropriation are:
Forest Products funding remains unchanged from 2017 levels and signifies the Administration’s commitment to rural communities, jobs creation, shared stewardship, and the production of goods and services from National Forest System lands. Through the use of tools like the Good Neighbor and other Farm Bill authorities utilizing funding within permanent and trust accounts, the Forest Service aims to sell 3.2 billion board feet of timber while improving the resilience of more than 1.7 million acres of National Forest System lands.
An increase of $2.7 million to Law Enforcement and Investigations for marijuana eradication operations. Marijuana grow sites present a tremendous risk to public safety and environmental quality. Law enforcement officers work to protect public safety by removing the criminal element from National Forest System lands; however, the pesticides, herbicides, and rodenticides used to grow marijuana contaminate the land and the rerouting of water to marijuana grow sites create detrimental conditions for forests already stressed by drought. The increase in funding will result in restored sites free of hazardous chemicals. Evidence shows restored sites are repopulated by the criminal element less than unrestored sites.
A decrease of $8.3 million to Recreation, Heritage, and Wilderness. This program provides the public with outdoor opportunities in their national forests and grasslands. Each year, there are nearly 149 million visits to the national forests and grasslands and visitors engage in activities that include, hiking, camping, skiing, shooting sports, and water sports, among others. The Forest Service Recreation program contributes roughly $10 billion to the Gross Domestic Product, and sustains about 143,000 full- and part-time jobs.
A decrease of $56 million to the Land Acquisition program. In 2018, the Forest Service will complete the acquisition of Congressionally identified projects in prior year appropriations bill reports; however, the Administration is not proposing additional land acquisitions using funds from the Land and Water Conservation Fund.
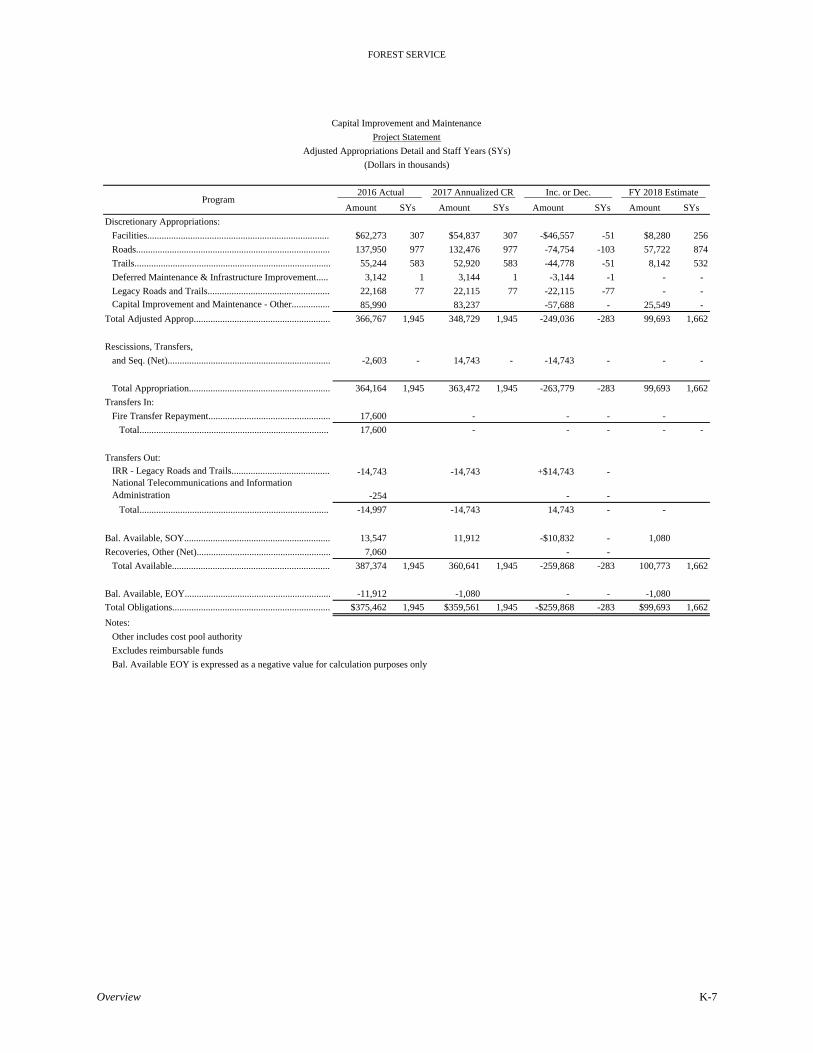
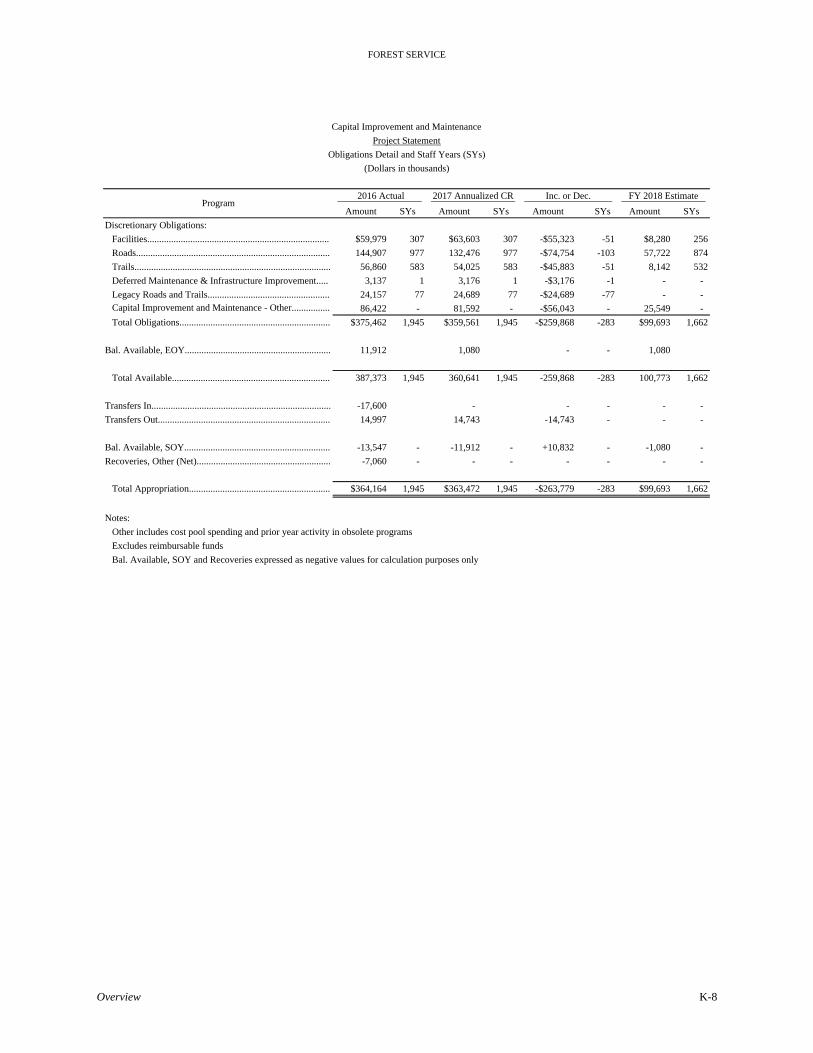
Infrastructure – In 2018, the Capital Improvement and Maintenance budget is nearly $100 million, a decrease of $264 million below the 2017 annualized Continuing Resolution funding level. The President’s Budget refocuses the Capital Improvement and Maintenance programs on retaining staff to manage existing infrastructure, primarily National Forest System Roads.
National Forest System roads provide access to outdoor recreational activities like hunting and fishing which bolster local economies in and around national forests, and access for first responders in the event of wildland fire and other emergency situations. National Forest System roads also allow for safe and efficient extraction of timber and minerals from national forests and grasslands.
The budget also provides focused funding for staff who work on high-priority facilities, roads, and trails, but does not provide funding for deferred maintenance. Both facilities and trails are key to the mission of the Forest Service. Forest Service will focus on fixing facilities and trails that pose serious threats to public health or safety, a natural resource, or to the ability of the Forest Service to implement its mission.
FY 2018 Budget Justification USDA Forest Service
Overview 3
At the proposed level of $99,693,000, the 2018 budget focuses the Capital Improvement and Maintenance programs on managing existing infrastructure and maintaining public safety.
The budget does not provide separate funding for the Legacy Roads and Trails program. The critical work of the Legacy Roads and Trails program will be administered as part of regular Roads and Trails program activities.
Legislative Proposals
Recreation Fee Program – The 2018 budget proposes appropriations language for permanent authorization of the Federal Lands Recreation Enhancement Act (FLREA) which is currently scheduled to expire on September 30, 2018. The Forest Service receives approximately $65 million annually in recreation fee revenue. This includes approximately $12 million from National Recreation Reservation Service fees; $10 million from certain special use permits; $2 million from interagency pass sales; $21 million for fees such as campgrounds and cabin rentals; and $20 million for fees such as picnic areas and day use sites. Ninety-five percent of the recreation fees collected on a national forest stay at that national forest to be reinvested in recreation sites and services. If FLREA expires without reauthorization, the agencies will have no recreation fee authority for operations and maintenance of recreation facilities or for payment for the National Recreation Reservation System.
Communications Site Program – The Forest Service seeks authority to retain $4.5 million from annual communication site rental fees to better manage the growing use of Forest Service lands for communications facilities. This will result in an increased annual return on investment to the Treasury within two years. This proposal will result in:
Reduced processing time for new applications to provide better customer service (currently it takes one to three years to process a new application).
Enhanced and expanded telecommunications provided to rural communities via broadband, personal communications systems, and emergency services.
Increased safety of visitors, agency staff, and first responders though additional communications capacity and reliability.
The Forest Service proposes to use funds from the Purchaser Elect account as an offset for FY 2018 and FY 2019 while the agency sets up staff and program infrastructure to collect fees. The offset will be $3.7 million and $2.7 million in FY 2018 and 2019, respectively.
Administrative Sites Conveyance Program – The 2018 budget proposes appropriations language to reauthorize the Forest Service Facilities Realignment and Enhancement Act of 2005 (FSREA). FSFREA would allow the Secretary to convey administrative sites that the Forest Service no longer needs, and retain the proceeds from the sales for the acquisition, improvement, maintenance, reconstruction, or construction of facilities. The authority is a valuable tool for managing facilities, addressing deferred maintenance, and providing facilities which better serve the public. Reauthorization would allow for better utilization of existing resources, increase the agency’s ability to address health and safety issues, and enhanced service to the public.
Small Tracts Act – The 2018 budget proposes to expand the Forest Service’s small parcel conveyance authority to establish additional categories of the National Forest System lands which the Secretary of Agriculture is authorized to sell, interchange or exchange, if in the public interest. The proposal increases the maximum value of the land that can be conveyed under this authority from $150,000 to $500,000 to better align with current land values. Proceeds from the sale of National Forest System lands under this proposed authority will be collected under the Sisk Act and may be used for acquisition of resource lands or administrative facilities. Grazing permits – The 2018 budget proposes an amendment to the Federal Land Management Policy Act (FLPMA) to correct the National Defense Appropriations Act (NDAA) amendment to FLPMA section 402 and that it remain in effect for FY 2018 and each fiscal year thereafter. The proposed amendment addresses concerns around the renewal of grazing permits issued by the Forest Service. The current authority applies to grazing on National Forests in the contiguous Western States, but not to grazing on National Grasslands and on eastern National Forests. With this amendment, the terms and conditions would apply to grazing permits issued by the Forest Service on any

FY 2018 Budget Justification USDA Forest Service
Overview 4
National Forest System lands and would allow the Eastern forests and grasslands the flexibility accorded to Western forests and grasslands with regard to meeting NEPA schedules. The amendment would also prevent the Forest Service from being in violation of the 1995 Rescission Act and, therefore, less vulnerable to legal challenges.
FY 2018 Budget Justification USDA Forest Service
Overview 5
Corrections for Forest Service’s FY 2018 President’s Budget
The Fiscal Year 2016 total obligations (direct plus reimbursable, line 0900) in the Budget Appendix of the FY 2018 President’s Budget are correct, but the split between reimbursable and direct spending is incorrect. The FY 2016 total obligations in the Project Statement and Classification by Objects in the Forest Service’s FY 2018 Budget Overview appendices are correct. The FY 2017 and 2018 obligations in the Project Statement and Classification by Objects match the appropriation level plus the allocation of prior year balances.

FY 2018 Budget Justification USDA Forest Service
Overview 6
This page intentionally left blank
FOREST SERVICE
Overview A-1
Forest Service Budget Summary
(dollars in thousands)
FY 2017 Annualized
CR
Program Changes
FY 2018 President’s
Budget
Pay Costs*
Annual Appropriations
Discretionary Funds Forest & Rangeland Research $290,447 -$31,447 $259,000 $3,441
State & Private Forestry 236,573 -118,563 118,010 649
National Forest System 1,506,496 240,946 1,747,442 21,098
Capital Improvement & Maintenance 363,472 -263,779 99,693 1,703
Land Acquisition 64,478 -56,436 8,042 39
Other Appropriations 4,856 -521 4,335 51
Wildland Fire Management 2,381,795 113,243 2,495,038 20,272
FLAME Wildfire Suppression Reserve
821,436 -821,436 0 0
Discretionary Funds Total $5,669,553 -$937,993 $4,731,560 $47,253
Fire Transfer Repayment 0 0 0
Suppression Cap Adjustment 0 0 0
Mandatory Appropriations $499,333 -$32,000 $467,333 0
Grand Total, Forest Service $6,168,886 -$969,993 $5,198,893 $47,253
*Pay costs are included within each appropriation for FY 2018. The total Pay Cost increase for FY 2018 is $47,253,000.
$0
$500
$1,000
$1,500
$2,000
$2,500
$3,000
$3,500
$4,000
$4,500
$5,000
$5,500
$6,000
2008 2009 2010 2011 2012 2013 2014 2015 2016 2017
Nom
inal
Dol
lars
(m
illi
ons)
Ten Year Summary of Appropriations
Discretionary Mandatory Supplemental/Emergency Designation
FOREST SERVICE
Overview B-1
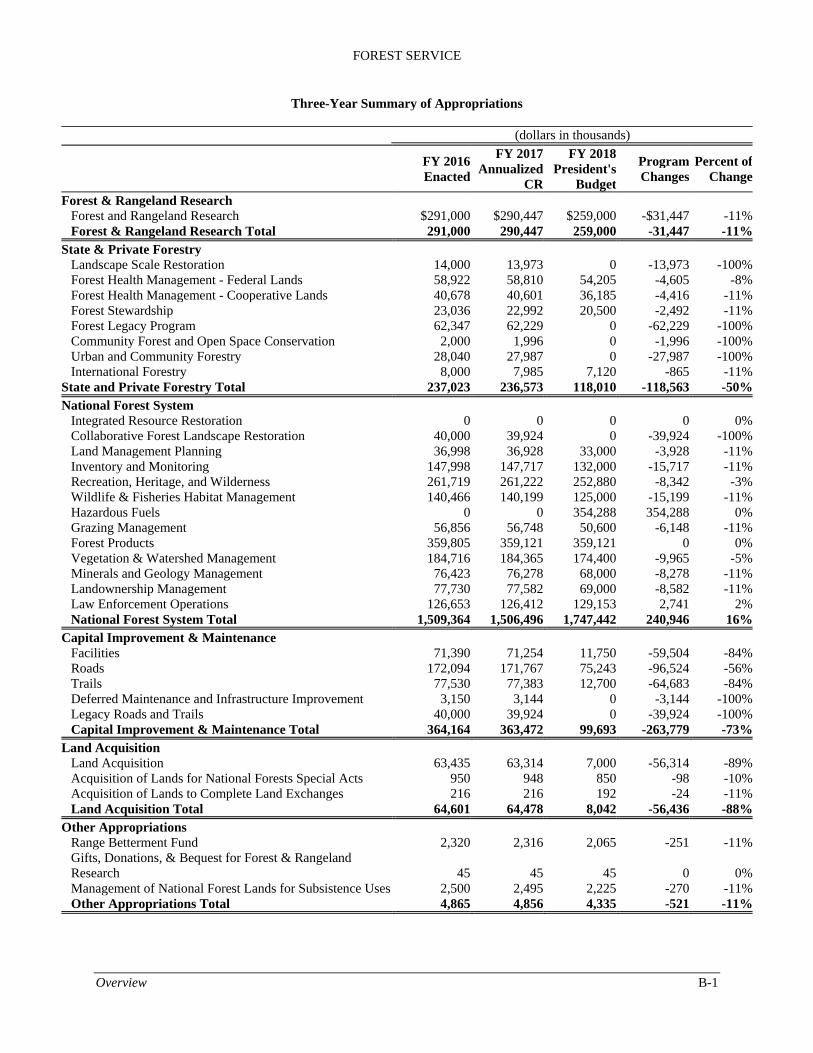
Three-Year Summary of Appropriations (dollars in thousands)
FY 2016Enacted
FY 2017 Annualized
CR
FY 2018 President's
Budget
Program Changes
Percent of Change
Forest & Rangeland Research Forest and Rangeland Research $291,000 $290,447 $259,000 -$31,447 -11%Forest & Rangeland Research Total 291,000 290,447 259,000 -31,447 -11%
State & Private Forestry Landscape Scale Restoration 14,000 13,973 0 -13,973 -100%Forest Health Management - Federal Lands 58,922 58,810 54,205 -4,605 -8%Forest Health Management - Cooperative Lands 40,678 40,601 36,185 -4,416 -11%Forest Stewardship 23,036 22,992 20,500 -2,492 -11%Forest Legacy Program 62,347 62,229 0 -62,229 -100%Community Forest and Open Space Conservation 2,000 1,996 0 -1,996 -100%Urban and Community Forestry 28,040 27,987 0 -27,987 -100%International Forestry 8,000 7,985 7,120 -865 -11%
State and Private Forestry Total 237,023 236,573 118,010 -118,563 -50%National Forest System
Integrated Resource Restoration 0 0 0 0 0%Collaborative Forest Landscape Restoration 40,000 39,924 0 -39,924 -100%Land Management Planning 36,998 36,928 33,000 -3,928 -11%Inventory and Monitoring 147,998 147,717 132,000 -15,717 -11%Recreation, Heritage, and Wilderness 261,719 261,222 252,880 -8,342 -3%Wildlife & Fisheries Habitat Management 140,466 140,199 125,000 -15,199 -11%Hazardous Fuels 0 0 354,288 354,288 0%Grazing Management 56,856 56,748 50,600 -6,148 -11%Forest Products 359,805 359,121 359,121 0 0%Vegetation & Watershed Management 184,716 184,365 174,400 -9,965 -5%Minerals and Geology Management 76,423 76,278 68,000 -8,278 -11%Landownership Management 77,730 77,582 69,000 -8,582 -11%Law Enforcement Operations 126,653 126,412 129,153 2,741 2%National Forest System Total 1,509,364 1,506,496 1,747,442 240,946 16%
Capital Improvement & Maintenance Facilities 71,390 71,254 11,750 -59,504 -84%Roads 172,094 171,767 75,243 -96,524 -56%Trails 77,530 77,383 12,700 -64,683 -84%Deferred Maintenance and Infrastructure Improvement 3,150 3,144 0 -3,144 -100%Legacy Roads and Trails 40,000 39,924 0 -39,924 -100%Capital Improvement & Maintenance Total 364,164 363,472 99,693 -263,779 -73%
Land Acquisition Land Acquisition 63,435 63,314 7,000 -56,314 -89%Acquisition of Lands for National Forests Special Acts 950 948 850 -98 -10%Acquisition of Lands to Complete Land Exchanges 216 216 192 -24 -11%Land Acquisition Total 64,601 64,478 8,042 -56,436 -88%
Other Appropriations Range Betterment Fund 2,320 2,316 2,065 -251 -11%Gifts, Donations, & Bequest for Forest & Rangeland Research 45 45 45 0 0%Management of National Forest Lands for Subsistence Uses 2,500 2,495 2,225 -270 -11%Other Appropriations Total 4,865 4,856 4,335 -521 -11%
FOREST SERVICE
Overview B-2
FY 2016Enacted
FY 2017 Annualized
CR
FY 2018 President's
Budget
Program Changes
Percent of Change
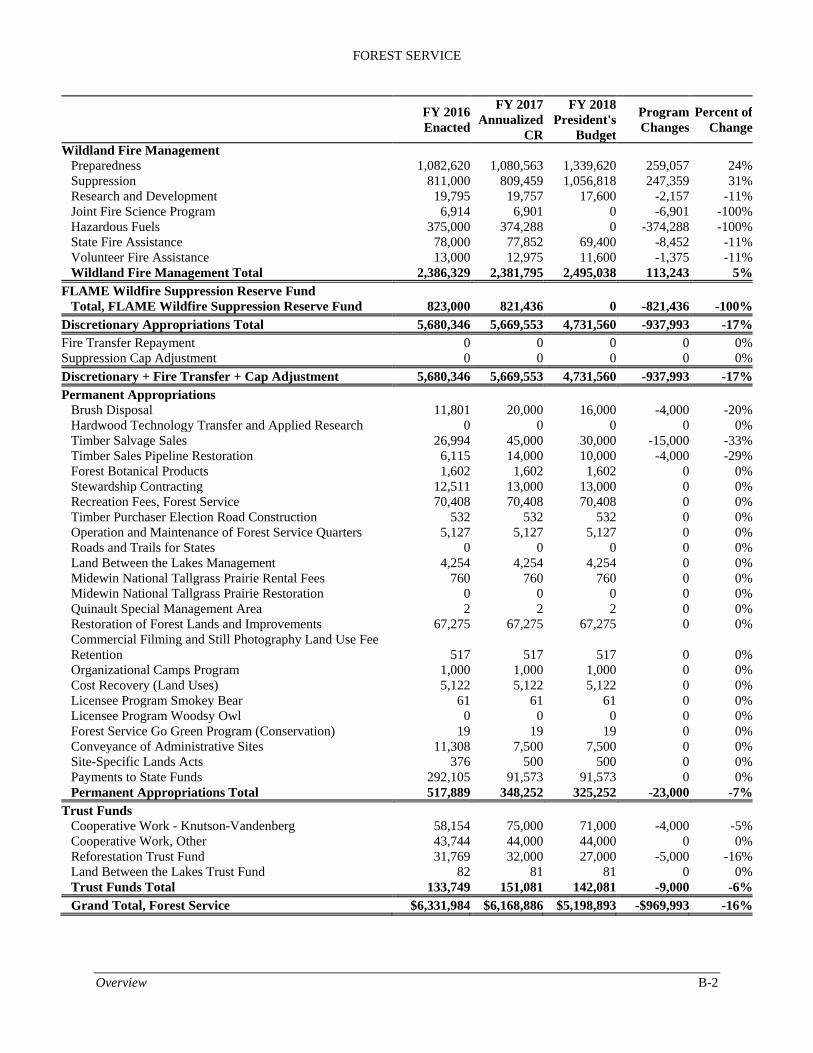
Wildland Fire Management Preparedness 1,082,620 1,080,563 1,339,620 259,057 24%Suppression 811,000 809,459 1,056,818 247,359 31%Research and Development 19,795 19,757 17,600 -2,157 -11%Joint Fire Science Program 6,914 6,901 0 -6,901 -100%Hazardous Fuels 375,000 374,288 0 -374,288 -100%State Fire Assistance 78,000 77,852 69,400 -8,452 -11%Volunteer Fire Assistance 13,000 12,975 11,600 -1,375 -11%Wildland Fire Management Total 2,386,329 2,381,795 2,495,038 113,243 5%
FLAME Wildfire Suppression Reserve Fund Total, FLAME Wildfire Suppression Reserve Fund 823,000 821,436 0 -821,436 -100%
Discretionary Appropriations Total 5,680,346 5,669,553 4,731,560 -937,993 -17%Fire Transfer Repayment 0 0 0 0 0%Suppression Cap Adjustment 0 0 0 0 0%
Discretionary + Fire Transfer + Cap Adjustment 5,680,346 5,669,553 4,731,560 -937,993 -17%Permanent Appropriations
Brush Disposal 11,801 20,000 16,000 -4,000 -20%Hardwood Technology Transfer and Applied Research 0 0 0 0 0%Timber Salvage Sales 26,994 45,000 30,000 -15,000 -33%Timber Sales Pipeline Restoration 6,115 14,000 10,000 -4,000 -29%Forest Botanical Products 1,602 1,602 1,602 0 0%Stewardship Contracting 12,511 13,000 13,000 0 0%Recreation Fees, Forest Service 70,408 70,408 70,408 0 0%Timber Purchaser Election Road Construction 532 532 532 0 0%Operation and Maintenance of Forest Service Quarters 5,127 5,127 5,127 0 0%Roads and Trails for States 0 0 0 0 0%Land Between the Lakes Management 4,254 4,254 4,254 0 0%Midewin National Tallgrass Prairie Rental Fees 760 760 760 0 0%Midewin National Tallgrass Prairie Restoration 0 0 0 0 0%Quinault Special Management Area 2 2 2 0 0%Restoration of Forest Lands and Improvements 67,275 67,275 67,275 0 0%Commercial Filming and Still Photography Land Use Fee Retention 517 517 517 0 0%Organizational Camps Program 1,000 1,000 1,000 0 0%Cost Recovery (Land Uses) 5,122 5,122 5,122 0 0%Licensee Program Smokey Bear 61 61 61 0 0%Licensee Program Woodsy Owl 0 0 0 0 0%Forest Service Go Green Program (Conservation) 19 19 19 0 0%Conveyance of Administrative Sites 11,308 7,500 7,500 0 0%Site-Specific Lands Acts 376 500 500 0 0%Payments to State Funds 292,105 91,573 91,573 0 0%Permanent Appropriations Total 517,889 348,252 325,252 -23,000 -7%
Trust Funds Cooperative Work - Knutson-Vandenberg 58,154 75,000 71,000 -4,000 -5%Cooperative Work, Other 43,744 44,000 44,000 0 0%Reforestation Trust Fund 31,769 32,000 27,000 -5,000 -16%Land Between the Lakes Trust Fund 82 81 81 0 0%Trust Funds Total 133,749 151,081 142,081 -9,000 -6%Grand Total, Forest Service $6,331,984 $6,168,886 $5,198,893 -$969,993 -16%
FOREST SERVICE
Overview C-1
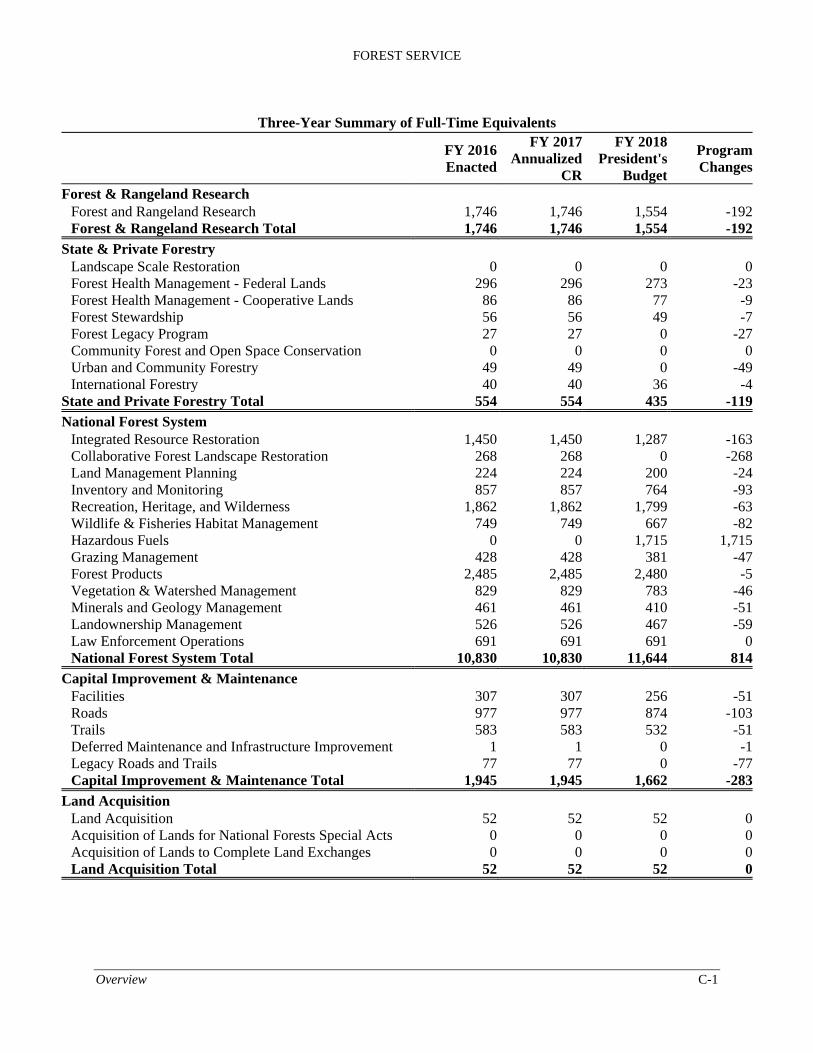
Three-Year Summary of Full-Time Equivalents
FY 2016 Enacted
FY 2017Annualized
CR
FY 2018 President's
Budget
ProgramChanges
Forest & Rangeland Research Forest and Rangeland Research 1,746 1,746 1,554 -192Forest & Rangeland Research Total 1,746 1,746 1,554 -192
State & Private Forestry Landscape Scale Restoration 0 0 0 0Forest Health Management - Federal Lands 296 296 273 -23Forest Health Management - Cooperative Lands 86 86 77 -9Forest Stewardship 56 56 49 -7Forest Legacy Program 27 27 0 -27Community Forest and Open Space Conservation 0 0 0 0Urban and Community Forestry 49 49 0 -49International Forestry 40 40 36 -4
State and Private Forestry Total 554 554 435 -119
National Forest System Integrated Resource Restoration 1,450 1,450 1,287 -163Collaborative Forest Landscape Restoration 268 268 0 -268Land Management Planning 224 224 200 -24Inventory and Monitoring 857 857 764 -93Recreation, Heritage, and Wilderness 1,862 1,862 1,799 -63Wildlife & Fisheries Habitat Management 749 749 667 -82Hazardous Fuels 0 0 1,715 1,715Grazing Management 428 428 381 -47Forest Products 2,485 2,485 2,480 -5Vegetation & Watershed Management 829 829 783 -46Minerals and Geology Management 461 461 410 -51Landownership Management 526 526 467 -59Law Enforcement Operations 691 691 691 0National Forest System Total 10,830 10,830 11,644 814
Capital Improvement & Maintenance Facilities 307 307 256 -51Roads 977 977 874 -103Trails 583 583 532 -51Deferred Maintenance and Infrastructure Improvement 1 1 0 -1Legacy Roads and Trails 77 77 0 -77Capital Improvement & Maintenance Total 1,945 1,945 1,662 -283
Land Acquisition Land Acquisition 52 52 52 0Acquisition of Lands for National Forests Special Acts 0 0 0 0Acquisition of Lands to Complete Land Exchanges 0 0 0 0Land Acquisition Total 52 52 52 0
FOREST SERVICE
Overview C-2
FY 2016 Enacted
FY 2017Annualized
CR
FY 2018 President's
Budget
ProgramChanges
Other Appropriations
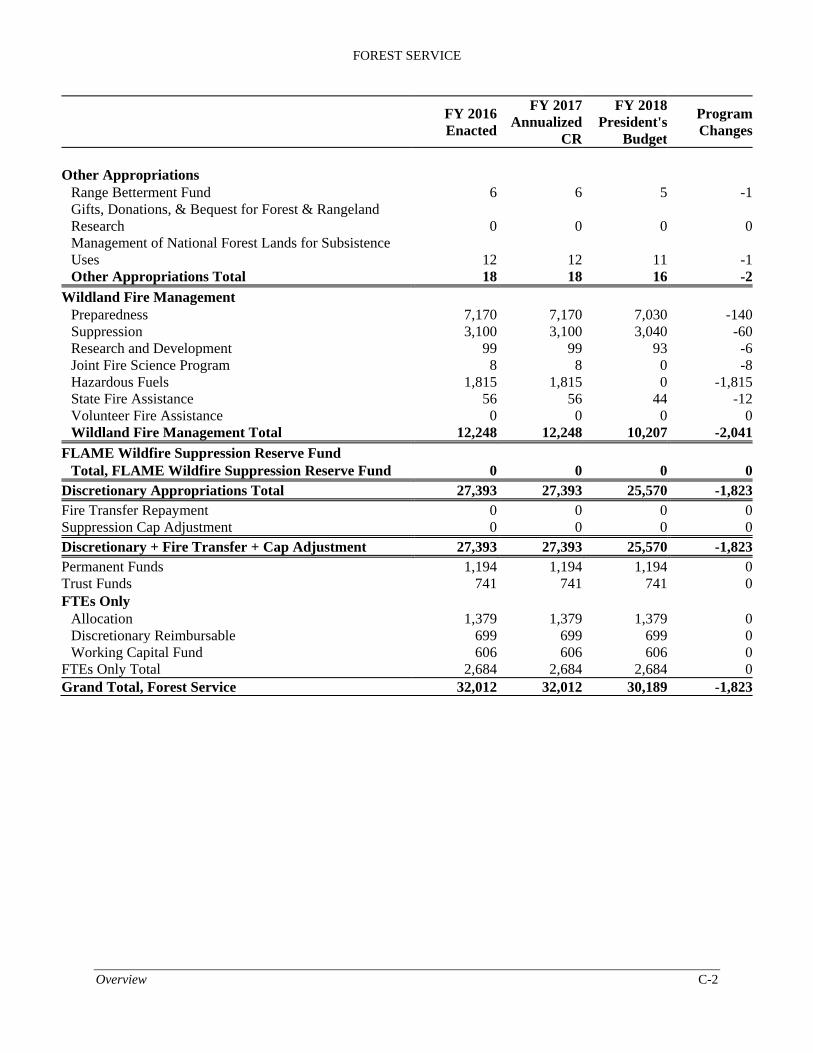
Range Betterment Fund 6 6 5 -1Gifts, Donations, & Bequest for Forest & Rangeland Research 0 0 0 0Management of National Forest Lands for Subsistence Uses 12 12 11 -1Other Appropriations Total 18 18 16 -2
Wildland Fire Management Preparedness 7,170 7,170 7,030 -140Suppression 3,100 3,100 3,040 -60Research and Development 99 99 93 -6Joint Fire Science Program 8 8 0 -8Hazardous Fuels 1,815 1,815 0 -1,815State Fire Assistance 56 56 44 -12Volunteer Fire Assistance 0 0 0 0Wildland Fire Management Total 12,248 12,248 10,207 -2,041
FLAME Wildfire Suppression Reserve Fund Total, FLAME Wildfire Suppression Reserve Fund 0 0 0 0
Discretionary Appropriations Total 27,393 27,393 25,570 -1,823Fire Transfer Repayment 0 0 0 0Suppression Cap Adjustment 0 0 0 0Discretionary + Fire Transfer + Cap Adjustment 27,393 27,393 25,570 -1,823Permanent Funds 1,194 1,194 1,194 0Trust Funds 741 741 741 0FTEs Only
Allocation 1,379 1,379 1,379 0Discretionary Reimbursable 699 699 699 0Working Capital Fund 606 606 606 0
FTEs Only Total 2,684 2,684 2,684 0Grand Total, Forest Service 32,012 32,012 30,189 -1,823

FOREST SERVICE
Overview D-1
Revenue, Receipts, and TransfersFY 2016 Enacted
FY 2017 Estimated
FY 2018 President's
Budget 1908
Act
R
ecei
pt?
Timber ManagementNational Forest Fund (NFF) Receipts $29,957 $30,000 $30,000 Yes
Mandatory Transfers from NFF: Timber Roads--Purchaser Election Program (2,000) (2,000)
Acquisition of Lands for National Forests, Special Acts 1/ (200) (200) (200)Ten-Percent Roads and Trails Fund 1/ (3,600) (3,600)
Cooperative Work - Knutson-Vandenberg Fund 210,171 39,000 40,000 YesTimber Salvage Sales 35,919 26,000 29,000 YesTimber Sales Pipeline Restoration Fund 5,151 6,000 6,000 YesCredits to Timber Purchasers (not receipts)
Credits for Road Construction (sales before April 1, 1999) YesSpecified Road Costs (15,476) (15,000) (15,000) Yes
Brush Disposal 7,695 8,000 8,000Forest Botanical Products 1,570 1,000 1,000
Total Timber Management Receipts $290,463 $110,000 $114,000Total Timber Management Receipts and Credits $305,939 $125,000 $129,000
Net Timber Management Deposits to NFF and Grasslands Fund $29,757 $24,200 $24,200
Grazing Management
National Forest Fund (NFF) Receipts $8,486 $8,000 $8,000 YesGrasslands and Land Utilization Projects (LUP) 684 500 500 No
Mandatory Transfers from NFF & Grasslands & LUP's:Range Betterment Fund (50 Percent Grazing) (3,273) (3,000) (3,000) YesAcquisition of Lands for National Forests, Special Acts 1/ (50) (50) (50)Ten-Percent Roads and Trails Fund 1/ (1,000) (1,000)
Total Grazing Management Receipts $9,170 $8,500 $8,500Fund $5,847 $4,450 $4,450
Minerals Management
National Forest Fund (NFF) Receipts $1,940 $2,000 $2,000 YesMinerals Receipts on Acquired Lands to NFF from ONNR 11,093 15,000 15,000 YesGrasslands and Land Utilization Projects (LUP) from ONNR 109,358 90,000 90,000 NoMandatory Transfers from NFF:
Acquisition of Lands for National Forests, Special Acts 1/ (10) (10) (10)Ten-Percent Roads and Trails Fund 1/ (200) (200)
Total Minerals Receipts $122,391 $107,000 $107,000Total Minerals Deposits to NFF and Grasslands Fund $122,381 $106,790 $106,790
Revenue, Receipts, and Transfers
FOREST SERVICE
Overview D-2
Revenue, Receipts, and TransfersFY 2016 Enacted
FY 2017 Estimated
FY 2018 President's
Budget 1908
Act
R
ecei
pt?
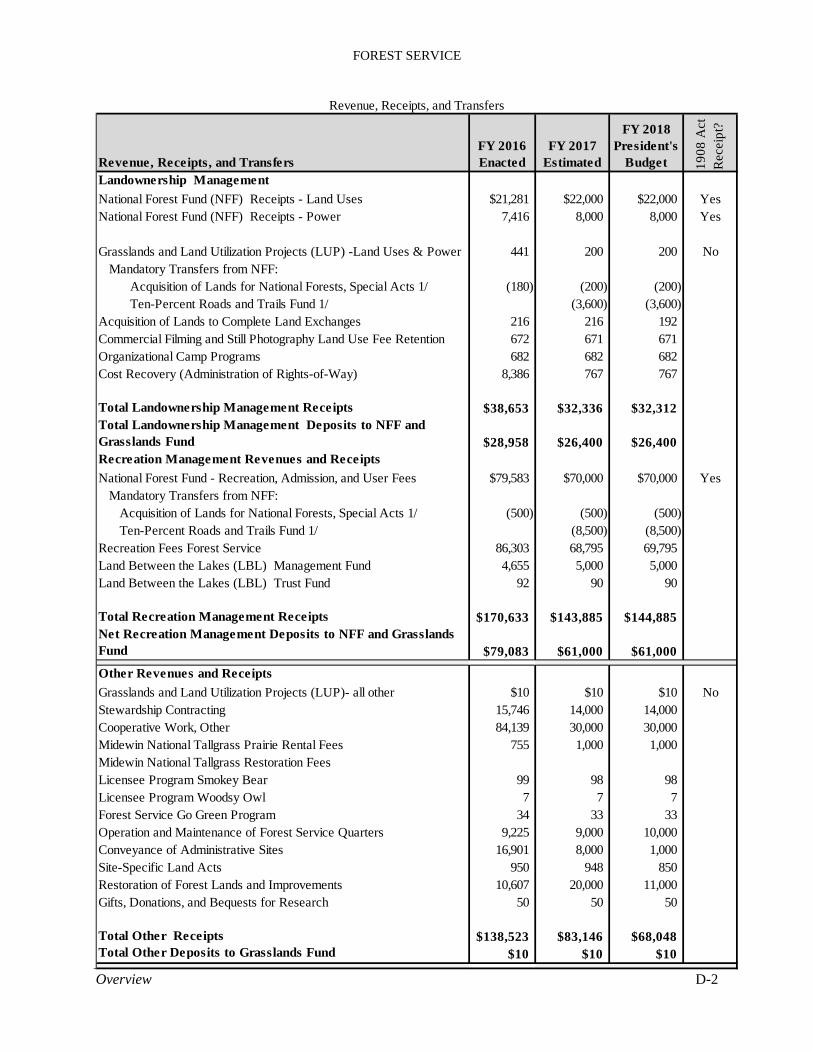
Landownership Management
National Forest Fund (NFF) Receipts - Land Uses $21,281 $22,000 $22,000 YesNational Forest Fund (NFF) Receipts - Power 7,416 8,000 8,000 Yes
Grasslands and Land Utilization Projects (LUP) -Land Uses & Power 441 200 200 NoMandatory Transfers from NFF:
Acquisition of Lands for National Forests, Special Acts 1/ (180) (200) (200)Ten-Percent Roads and Trails Fund 1/ (3,600) (3,600)
Acquisition of Lands to Complete Land Exchanges 216 216 192Commercial Filming and Still Photography Land Use Fee Retention 672 671 671Organizational Camp Programs 682 682 682Cost Recovery (Administration of Rights-of-Way) 8,386 767 767
Total Landownership Management Receipts $38,653 $32,336 $32,312Total Landownership Management Deposits to NFF and Grasslands Fund $28,958 $26,400 $26,400Recreation Management Revenues and Receipts
National Forest Fund - Recreation, Admission, and User Fees $79,583 $70,000 $70,000 YesMandatory Transfers from NFF:
Acquisition of Lands for National Forests, Special Acts 1/ (500) (500) (500)Ten-Percent Roads and Trails Fund 1/ (8,500) (8,500)
Recreation Fees Forest Service 86,303 68,795 69,795Land Between the Lakes (LBL) Management Fund 4,655 5,000 5,000Land Between the Lakes (LBL) Trust Fund 92 90 90
Total Recreation Management Receipts $170,633 $143,885 $144,885Net Recreation Management Deposits to NFF and Grasslands Fund $79,083 $61,000 $61,000
Other Revenues and Receipts
Grasslands and Land Utilization Projects (LUP)- all other $10 $10 $10 NoStewardship Contracting 15,746 14,000 14,000Cooperative Work, Other 84,139 30,000 30,000Midewin National Tallgrass Prairie Rental Fees 755 1,000 1,000Midewin National Tallgrass Restoration FeesLicensee Program Smokey Bear 99 98 98Licensee Program Woodsy Owl 7 7 7Forest Service Go Green Program 34 33 33Operation and Maintenance of Forest Service Quarters 9,225 9,000 10,000Conveyance of Administrative Sites 16,901 8,000 1,000Site-Specific Land Acts 950 948 850Restoration of Forest Lands and Improvements 10,607 20,000 11,000Gifts, Donations, and Bequests for Research 50 50 50
Total Other Receipts $138,523 $83,146 $68,048Total Other Deposits to Grasslands Fund $10 $10 $10
Revenue, Receipts, and Transfers
FOREST SERVICE
Overview D-3
Revenue, Receipts, and TransfersFY 2016 Enacted
FY 2017 Estimated
FY 2018 President's
Budget 1908
Act
R
ecei
pt?
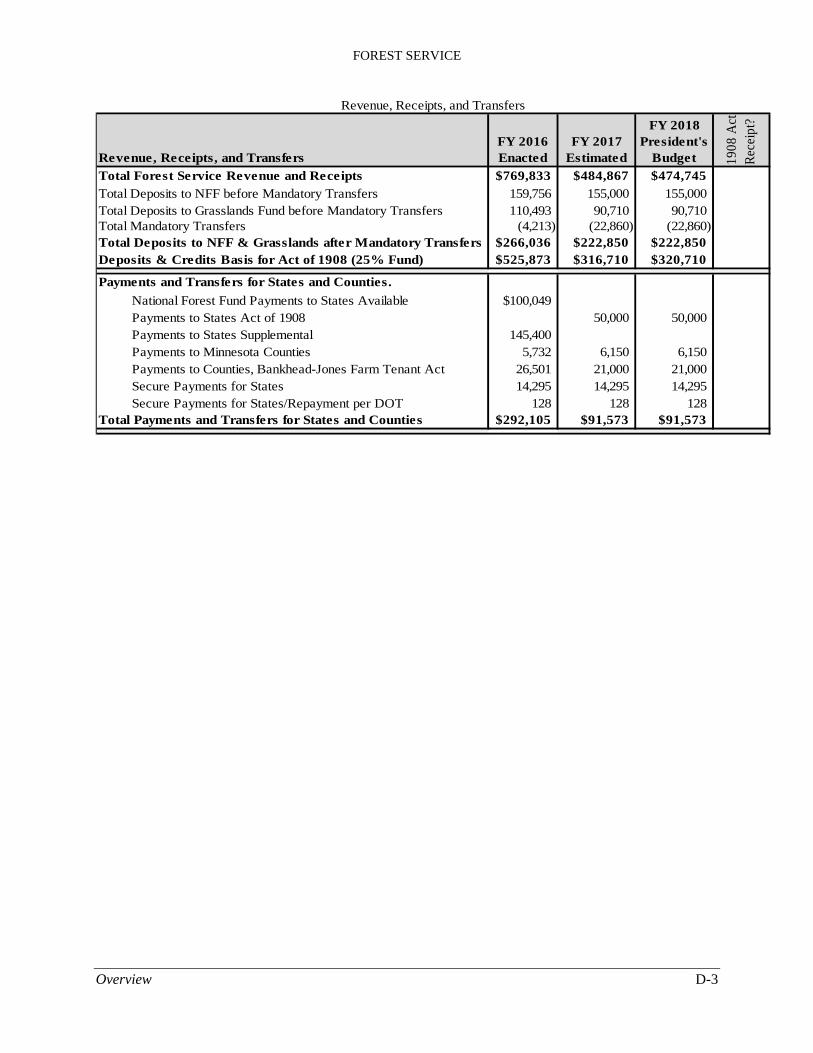
Total Forest Service Revenue and Receipts $769,833 $484,867 $474,745
Total Deposits to NFF before Mandatory Transfers 159,756 155,000 155,000Total Deposits to Grasslands Fund before Mandatory Transfers 110,493 90,710 90,710Total Mandatory Transfers (4,213) (22,860) (22,860)Total Deposits to NFF & Grasslands after Mandatory Transfers $266,036 $222,850 $222,850Deposits & Credits Basis for Act of 1908 (25% Fund) $525,873 $316,710 $320,710
Payments and Transfers for States and Counties.
National Forest Fund Payments to States Available $100,049Payments to States Act of 1908 50,000 50,000Payments to States Supplemental 145,400Payments to Minnesota Counties 5,732 6,150 6,150Payments to Counties, Bankhead-Jones Farm Tenant Act 26,501 21,000 21,000Secure Payments for States 14,295 14,295 14,295Secure Payments for States/Repayment per DOT 128 128 128
Total Payments and Transfers for States and Counties $292,105 $91,573 $91,573
Revenue, Receipts, and Transfers
FOREST SERVICE
Overview E-1
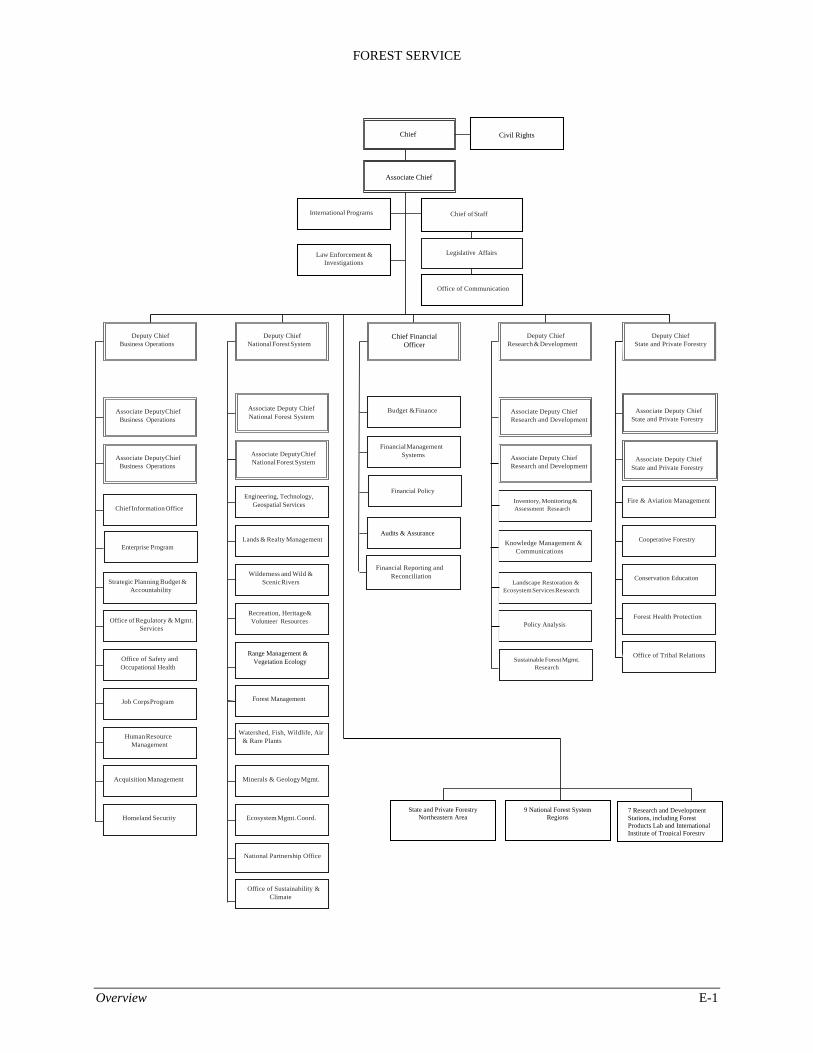
Associate Chief
International Programs Chief of Staff
Law Enforcement & Legislative Affairs
Investigations
Office of Communication
Deputy Chief Business Operations
Deputy Chief National Forest System
Deputy Chief Research & Development
Deputy Chief State and Private Forestry
Associate Deputy Chief Business Operations
Budget & Finance
Associate Deputy Chief Research and Development
Associate Deputy Chief Business Operations
Associate Deputy Chief National Forest System
Financial Management Systems
Associate Deputy Chief Research and Development
Chief Information Office
Engineering, Technology, Geospatial Services
Inventory, Monitoring & Assessment Research
Fire & Aviation Management
Lands & Realty Management
Knowledge Management &
Communications
Cooperative Forestry
Strategic Planning Budget & Accountability
Wilderness and Wild & Scenic Rivers
Landscape Restoration & Ecosystem Services Research
Conservation Education
Office of Regulatory & Mgmt. Services
Recreation, Heritage & Volunteer Resources
Policy Analysis
Forest Health Protection
Office of Safety and Occupational Health
Range Management & Vegetation Ecology
Sustainable Forest Mgmt. Research
Office of Tribal Relations
Job Corps Program Forest Management
Human Resource Management
Watershed, Fish, Wildlife, Air & Rare Plants
Acquisition Management Minerals & Geology Mgmt.
Homeland Security Ecosystem Mgmt. Coord.
National Partnership Office
Office of Sustainability & Climate
Associate Deputy Chief National Forest System
Associate Deputy Chief
State and Private Forestry
Associate Deputy Chief
State and Private Forestry
Financial Policy
Enterprise Program
Financial Reporting and
Reconciliation
Chief Civil Rights
Chief Financial Officer
7 Research and Development Stations, including Forest Products Lab and International Institute of Tropical Forestry
9 National Forest System Regions State and Private Forestry
Northeastern Area
Audits & Assurance
FOREST SERVICE
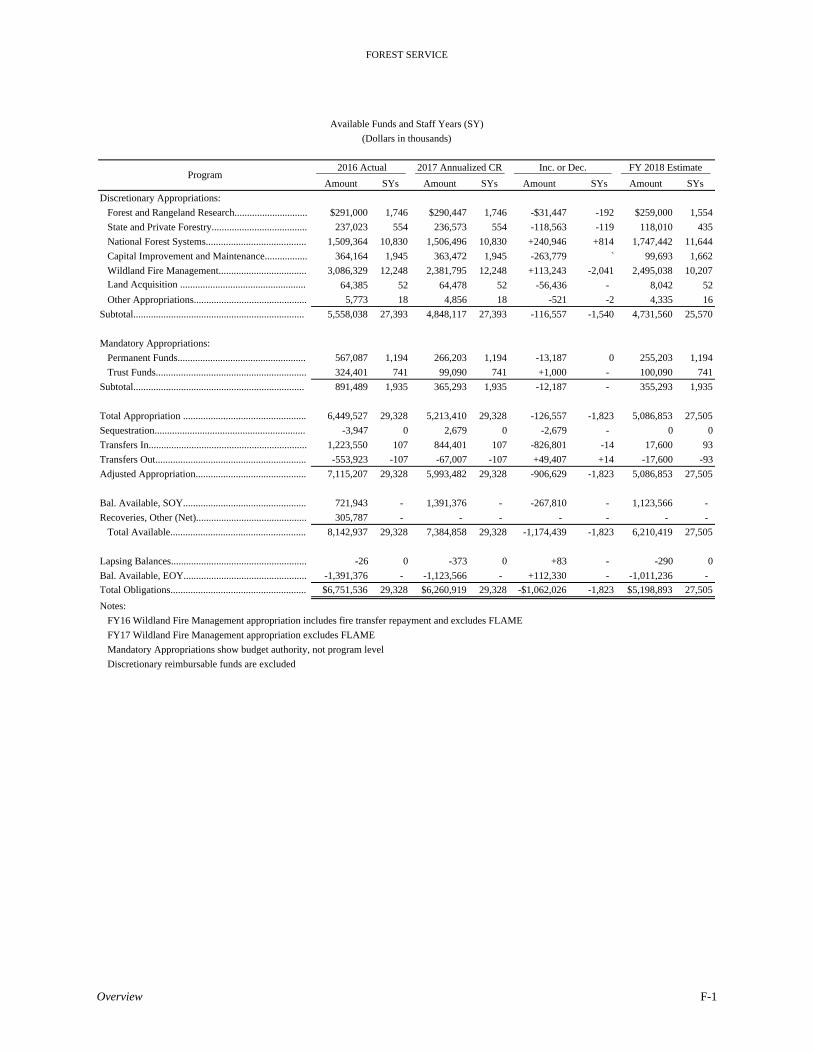
Amount SYs Amount SYs Amount SYs Amount SYs
Discretionary Appropriations:
Forest and Rangeland Research............................. $291,000 1,746 $290,447 1,746 -$31,447 -192 $259,000 1,554
State and Private Forestry...................................... 237,023 554 236,573 554 -118,563 -119 118,010 435
National Forest Systems........................................ 1,509,364 10,830 1,506,496 10,830 +240,946 +814 1,747,442 11,644
Capital Improvement and Maintenance................. 364,164 1,945 363,472 1,945 -263,779 ` 99,693 1,662
Wildland Fire Management................................... 3,086,329 12,248 2,381,795 12,248 +113,243 -2,041 2,495,038 10,207 Land Acquisition .................................................. 64,385 52 64,478 52 -56,436 - 8,042 52
Other Appropriations............................................. 5,773 18 4,856 18 -521 -2 4,335 16
Subtotal.................................................................... 5,558,038 27,393 4,848,117 27,393 -116,557 -1,540 4,731,560 25,570
Mandatory Appropriations:
Permanent Funds................................................... 567,087 1,194 266,203 1,194 -13,187 0 255,203 1,194
Trust Funds............................................................ 324,401 741 99,090 741 +1,000 - 100,090 741
Subtotal.................................................................... 891,489 1,935 365,293 1,935 -12,187 - 355,293 1,935
Total Appropriation ................................................. 6,449,527 29,328 5,213,410 29,328 -126,557 -1,823 5,086,853 27,505
Sequestration............................................................ -3,947 0 2,679 0 -2,679 - 0 0
Transfers In............................................................... 1,223,550 107 844,401 107 -826,801 -14 17,600 93
Transfers Out............................................................ -553,923 -107 -67,007 -107 +49,407 +14 -17,600 -93
Adjusted Appropriation............................................ 7,115,207 29,328 5,993,482 29,328 -906,629 -1,823 5,086,853 27,505
Bal. Available, SOY................................................. 721,943 - 1,391,376 - -267,810 - 1,123,566 -
Recoveries, Other (Net)............................................ 305,787 - - - - - - -
Total Available...................................................... 8,142,937 29,328 7,384,858 29,328 -1,174,439 -1,823 6,210,419 27,505
Lapsing Balances...................................................... -26 0 -373 0 +83 - -290 0
Bal. Available, EOY................................................. -1,391,376 - -1,123,566 - +112,330 - -1,011,236 -
Total Obligations...................................................... $6,751,536 29,328 $6,260,919 29,328 -$1,062,026 -1,823 $5,198,893 27,505
Notes:
Mandatory Appropriations show budget authority, not program level
Discretionary reimbursable funds are excluded
FY16 Wildland Fire Management appropriation includes fire transfer repayment and excludes FLAME
FY17 Wildland Fire Management appropriation excludes FLAME
Available Funds and Staff Years (SY)
(Dollars in thousands)
Program 2016 Actual 2017 Annualized CR Inc. or Dec. FY 2018 Estimate
Overview F-1
FOREST SERVICE
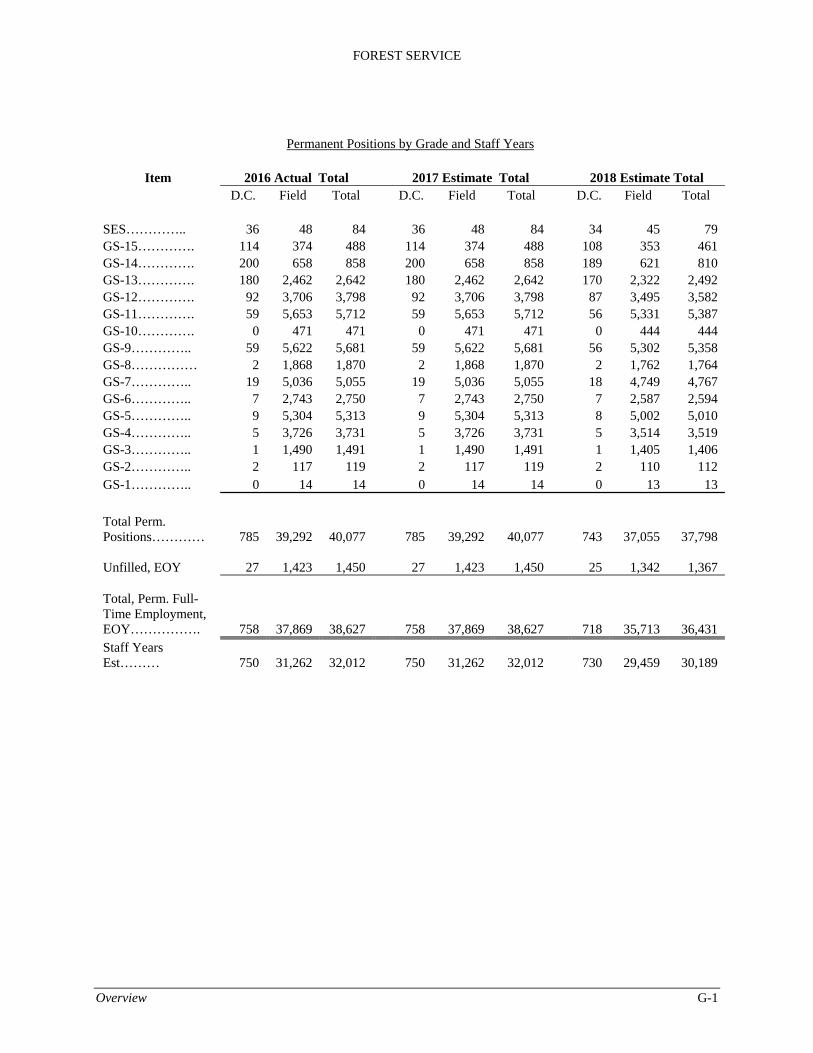
Overview G-1
Permanent Positions by Grade and Staff Years
Item 2016 Actual Total 2017 Estimate Total 2018 Estimate Total
D.C. Field Total D.C. Field Total D.C. Field Total
SES………….. 36 48 84 36 48 84 34 45 79 GS-15…………. 114 374 488 114 374 488 108 353 461 GS-14…………. 200 658 858 200 658 858 189 621 810 GS-13…………. 180 2,462 2,642 180 2,462 2,642 170 2,322 2,492 GS-12…………. 92 3,706 3,798 92 3,706 3,798 87 3,495 3,582 GS-11…………. 59 5,653 5,712 59 5,653 5,712 56 5,331 5,387 GS-10…………. 0 471 471 0 471 471 0 444 444 GS-9………….. 59 5,622 5,681 59 5,622 5,681 56 5,302 5,358 GS-8…………… 2 1,868 1,870 2 1,868 1,870 2 1,762 1,764 GS-7………….. 19 5,036 5,055 19 5,036 5,055 18 4,749 4,767 GS-6………….. 7 2,743 2,750 7 2,743 2,750 7 2,587 2,594 GS-5………….. 9 5,304 5,313 9 5,304 5,313 8 5,002 5,010 GS-4………….. 5 3,726 3,731 5 3,726 3,731 5 3,514 3,519 GS-3………….. 1 1,490 1,491 1 1,490 1,491 1 1,405 1,406 GS-2………….. 2 117 119 2 117 119 2 110 112 GS-1………….. 0 14 14 0 14 14 0 13 13
Total Perm. Positions………… 785 39,292 40,077 785 39,292 40,077 743 37,055 37,798 Unfilled, EOY 27 1,423 1,450 27 1,423 1,450 25 1,342 1,367 Total, Perm. Full-Time Employment, EOY……………. 758 37,869 38,627 758 37,869 38,627 718 35,713 36,431 Staff Years Est……… 750 31,262 32,012 750 31,262 32,012 730 29,459 30,189

FOREST SERVICE
Overview H-1
4x2 4x4
2016 628 667 11,165 7,856 - 101 2,236 22,653 $57,212
Change
2017 605 660 11,113 7,788 - 99 2,229 22,494 $59,500
Change -23 -7 -52 -68 - -2 -7 -159 $2,288
2018 797 658 11,096 7,761 - 99 2,223 22,634 $61,880
Change 192 -2 -17 -27 - - -6 140 $2,380
** Excludes acquisiton costs and gains from sale of vehicles as shown in FAST.
Motor Vehicle Fleet
Size, Composition, and Annual Operating Costs of Vehicle Fleet
(Dollars in Thousands)
Fiscal Year
Number of Vehicles by Type *
Annual Operating Costs**
Sedans and
Station Wagons
Light Trucks, SUVs, and Vans Medium
Duty Vehicles
Ambu- lances
BusesHeavy Duty
Vehicles
Total Number
of Vehicles
* Numbers include vehicles owned by the agency and leased from commercial sources or GSA.

FOREST SERVICE
Overview I-1
Lead-Off Tabular Statement
Current Law
Forest and Rangeland Research
Budget Estimate, 2018 $259,000,000
2017 Annualized Continuing Resolution 290,447,000
Change in Appropriation -31,447,000
State and Private Forestry
Budget Estimate, 2018 $118,010,000
2017 Annualized Continuing Resolution 236,573,000
Change in Appropriation -118,563,000
National Forest System
Budget Estimate, 2018 $1,747,442,000
2017 Annualized Continuing Resolution 1,506,496,000
Change in Appropriation 240,946,000
National Forest System - Proposed Legislation
Budget Estimate, Current Law 2018 $1,747,442,000
Change Due to Proposed Legislation1 4,500,000
Net 2018 Request 1,751,942,000
Capital Improvement & Maintenance
Budget Estimate, 2018 $99,693,000
2017 Annualized Continuing Resolution 363,472,000
Change in Appropriation -263,779,000
1 Communication site fee retention
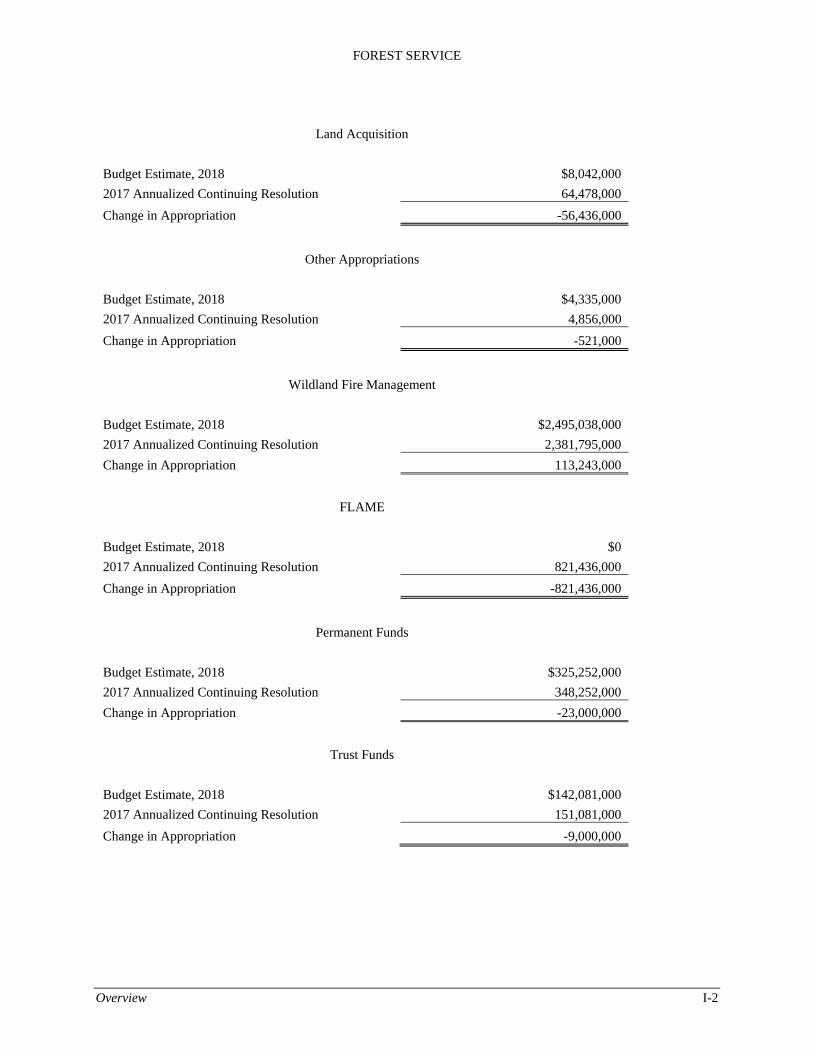
FOREST SERVICE
Overview I-2
Land Acquisition
Budget Estimate, 2018 $8,042,000
2017 Annualized Continuing Resolution 64,478,000
Change in Appropriation -56,436,000
Other Appropriations
Budget Estimate, 2018 $4,335,000
2017 Annualized Continuing Resolution 4,856,000
Change in Appropriation -521,000
Wildland Fire Management
Budget Estimate, 2018 $2,495,038,000
2017 Annualized Continuing Resolution 2,381,795,000
Change in Appropriation 113,243,000
FLAME
Budget Estimate, 2018 $0
2017 Annualized Continuing Resolution 821,436,000
Change in Appropriation -821,436,000
Permanent Funds
Budget Estimate, 2018 $325,252,000
2017 Annualized Continuing Resolution 348,252,000
Change in Appropriation -23,000,000
Trust Funds
Budget Estimate, 2018 $142,081,000
2017 Annualized Continuing Resolution 151,081,000
Change in Appropriation -9,000,000

FOREST SERVICE
Overview J-1
Summary of Increases and Decreases (dollars in thousands)
Program 2015
Actual 2016
Change 2017
Change 2018
Change
2018 President's
Budget
Discretionary Appropriations:
Forest and Rangeland Research
Forest and Rangeland Research $296,000 -$5,000 -$553 -$31,447 $259,000
Forest and Rangeland Research Total 296,000 -$5,000 -$553 -$31,447 259,000
State and Private Forestry
Landscape Scale Restoration 14,000 - -27 -13,973 -
Forest Health Mgmt. - Fed Lands 58,922 - -112 -4,605 54,205
Forest Health Mgmt. - Coop Lands 45,655 -4,977 -77 -4,416 36,185
Forest Stewardship 23,036 - -44 -2,492 20,500
Forest Legacy Program 53,000 9,347 -118 -62,229 -
Community Forest & Open Space Cons 2,000 - -4 -1,996 -
Urban and Community Forestry 28,040 - -53 -27,987 -
International Forestry 8,000 - -15 -865 7,120
State and Private Forestry Total 232,653 4,370 -450 -118,563 118,010
National Forest System
Integrated Resource Restoration - - - - -
Collaborative Forest Landscape Rest 40,000 - -76 -39,924 -
Collaborative Forest Landscape Rest 2,000 -2,000 - - -
Land Management Planning 37,754 -756 -70 -3,928 33,000
Inventory and Monitoring 151,019 -3,021 -281 -15,717 132,000
Recreation, Heritage, and Wilderness 261,719 0 -497 -8,342 252,880
Wildlife & Fisheries Habitat Management 140,466 0 -267 -15,199 125,000
Hazardous Fuels - - - 354,288 354,288
Grazing Management 55,356 1,500 -108 -6,148 50,600
Forest Products 339,130 20,675 -684 - 359,121
Vegetation & Watershed Management 184,716 - -351 -9,965 174,400
Minerals and Geology Management 76,423 - -145 -8,278 68,000
Landownership Management 77,730 - -148 -8,582 69,000
Law Enforcement Operations 126,653 - -241 2,741 129,153
Valles Caldera National Preserve 3,364 -3,364 - - -
National Forest System Total 1,496,330 13,034 -2,868 240,946 1,747,442
Capital Improvement and Maintenance
Facilities 71,600 -210 -136 -59,504 11,750
Roads 168,094 4,000 -327 -96,524 75,243
Trails 77,530 - -147 -64,683 12,700
Deferred Maintenance 3,150 - -6 -3,144 -
Legacy Roads and Trails 40,000 - -76 -39,924 -
Capital Improvement and Maintenance Total 360,374 3,790 -692 -263,779 99,693
Land Acquisition
Land Acquisition 47,500 15,935 -121 -56,314 7,000
Acquisition of Lands for National Forest Special Acts 950 - -2 -98 850
Acquisition of Lands to Complete Land Exchanges 216 - - -24 192
Land Acquisition Total 48,666 15,935 -123 -56,436 8,042
Other Appropriations
Range Betterment 2,320 0 -4 -251 2,065

FOREST SERVICE
Overview J-2
2015 Actual
2016 Change
2017 Change
2018 Change
2018 President’s
Budget
Gifts, Don., & Beq for Forest & Rangeland Research 45 - - - 45
Management of National Forest Lands for Subsistence Uses 2,500 - -5 -270 2,225
Other Appropriations Total 4,865 - -9 -521 4,335
Wildland Fire Management
Preparedness 1,145,840 -63,220 -2,057 259,057 1,339,620
Suppression 708,000 103,000 -1,541 247,359 1,056,818
Hazardous Fuels 361,749 13,251 -712 -374,288 -
Research and Development 19,795 - -38 -2,157 17,600
Joint Fire Science Program 6,914 - -13 -6,901 -
State Fire Assistance 78,000 - -148 -8,452 69,400
Volunteer Fire Assistance 13,000 - -25 -1,375 11,600
Wildland Fire Management Total 2,333,298 53,031 -4,534 113,243 2,495,038
FLAME Wildfire Suppression Reserve Fund
Total, FLAME Wildfire Suppression Reserve Fund 303,060 519,940 -1,564 -821,436 -
Discretionary Appropriation Total $5,073,246 $607,100 -$10,793 -$937,993 $4,731,560
Suppression Cap Adjustment - - - - -
Discretionary + Fire Transfer + Cap Adjustment $5,073,246 $5,680,346 -$10,793 $937,993 $4,731,560
Permanent Appropriations:
Brush Disposal 9,125 2,676 8,199 -4,000 16,000
Hardwood Technology Transfer and Applied Research 3 -3 - - -
Timber Salvage Sales 29,626 -2,632 18,006 -15,000 30,000
Timber Sales Pipeline Restoration 4,509 1,606 7,885 -4,000 10,000
Forest Botanical Products 1,662 -60 - - 1,602
Stewardship Contracting 9,256 3,255 489 - 13,000
Recreation Fees, Forest Service 64,476 5,932 - - 70,408
Timber Purchaser Election Road Construction 142 390 - - 532
Operation and Maintenance of Forest Service Quarters 8,317 -3,190 - - 5,127
Roads and Trails for States - - - - -
Land Between the Lakes Management 3,512 742 - - 4,254
Midewin National Tallgrass Prairie Rental Fee 634 126 - - 760
Midewin National Tallgrass Prairie Restoration - - - - -
Valles Caldera 105 -105 - - -
Quinault Special Management Area 10 -8 - - 2
Restoration of Forest Lands & Improvements 61,071 6,204 - - 67,275
Commercial Filming and Still Photography Land 404 113 - - 517
Organizational Camps Programs 469 531 - - 1,000
Cost Recovery (Administration of Rights-of-Way) 4,925 197 - - 5,122
Licensee Program Smokey Bear 54 7 - - 61
Licensee Program Woodsy Owl - - - - -
Forest Service Go Green Program (Conservation) 26 -7 - - 19
Conveyance of Administrative Sites 3,606 7,702 -3,808 - 7,500
Site-Specific Lands Acts 4,262 -3,886 124 - 500
Payments to State Funds 318,326 -26,221 -200,532 - 91,573
Permanent Appropriations Total: $524,520 -$6,631 -$169,637 -$23,000 $325,252
Trust Funds
Cooperative Work - Knutson-Vandenberg 210,901 -152,747 16,846 -4,000 71,000
Cooperative Work, Other 88,000 -44,256 256 - 44,000
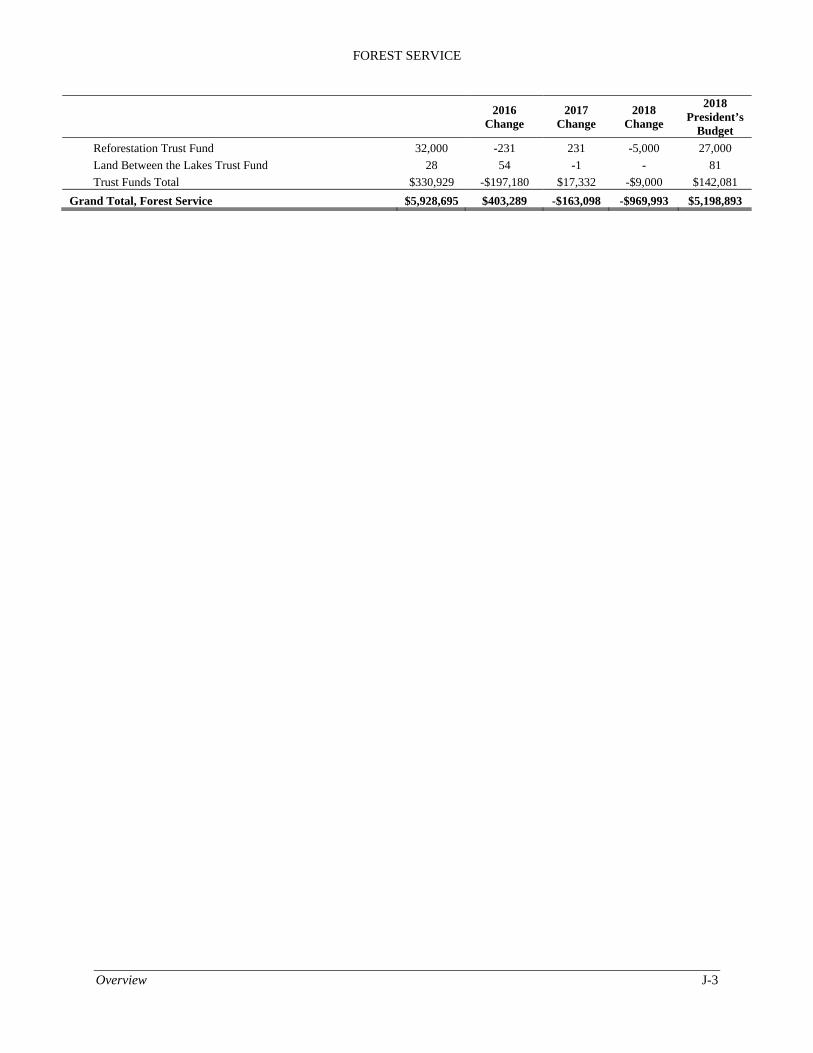
FOREST SERVICE
Overview J-3
2016 Change
2017 Change
2018 Change
2018 President’s
Budget
Reforestation Trust Fund 32,000 -231 231 -5,000 27,000
Land Between the Lakes Trust Fund 28 54 -1 - 81
Trust Funds Total $330,929 -$197,180 $17,332 -$9,000 $142,081
Grand Total, Forest Service $5,928,695 $403,289 -$163,098 -$969,993 $5,198,893
FOREST SERVICE
Amount SYs Amount SYs Amount SYs Amount SYs
Discretionary Appropriations:
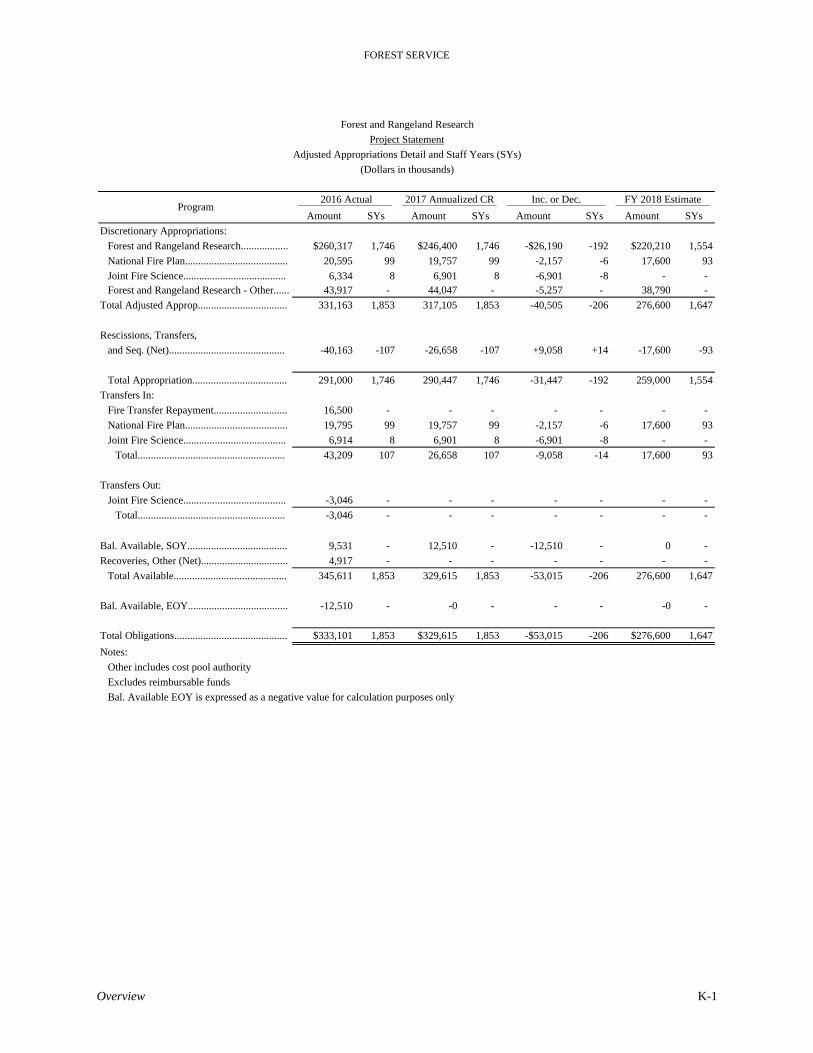
Forest and Rangeland Research.................. $260,317 1,746 $246,400 1,746 -$26,190 -192 $220,210 1,554
National Fire Plan....................................... 20,595 99 19,757 99 -2,157 -6 17,600 93
Joint Fire Science....................................... 6,334 8 6,901 8 -6,901 -8 - - Forest and Rangeland Research - Other...... 43,917 - 44,047 - -5,257 - 38,790 -
Total Adjusted Approp.................................. 331,163 1,853 317,105 1,853 -40,505 -206 276,600 1,647
Rescissions, Transfers,
and Seq. (Net)............................................ -40,163 -107 -26,658 -107 +9,058 +14 -17,600 -93
Total Appropriation.................................... 291,000 1,746 290,447 1,746 -31,447 -192 259,000 1,554
Transfers In:
Fire Transfer Repayment............................ 16,500 - - - - - - -
National Fire Plan....................................... 19,795 99 19,757 99 -2,157 -6 17,600 93
Joint Fire Science....................................... 6,914 8 6,901 8 -6,901 -8 - -
Total........................................................ 43,209 107 26,658 107 -9,058 -14 17,600 93
Transfers Out:
Joint Fire Science....................................... -3,046 - - - - - - -
Total........................................................ -3,046 - - - - - - -
Bal. Available, SOY...................................... 9,531 - 12,510 - -12,510 - 0 -
Recoveries, Other (Net)................................. 4,917 - - - - - - -
Total Available........................................... 345,611 1,853 329,615 1,853 -53,015 -206 276,600 1,647
Bal. Available, EOY...................................... -12,510 - -0 - - - -0 -
Total Obligations........................................... $333,101 1,853 $329,615 1,853 -$53,015 -206 $276,600 1,647
Notes:
Other includes cost pool authority
Excludes reimbursable funds
Bal. Available EOY is expressed as a negative value for calculation purposes only
Project Statement
Adjusted Appropriations Detail and Staff Years (SYs)
(Dollars in thousands)
Forest and Rangeland Research
FY 2018 EstimateProgram
2016 Actual 2017 Annualized CR Inc. or Dec.
Overview K-1

FOREST SERVICE
Amount SYs Amount SYs Amount SYs Amount SYs
Discretionary Obligations:
Forest and Rangeland Research.................. $264,418 1,746 $252,359 1,746 -$32,149 -192 $220,210 1,554
National Fire Plan....................................... 19,701 99 21,856 99 -4,256 -6 17,600 93
Joint Fire Science....................................... 4,967 8 11,353 - -11,353 - - -
Research - Other......................................... 44,014 - 44,047 - -5,257 - 38,790 -
Total........................................................... 333,101 1,853 329,615 1,845 -53,015 -198 276,600 1,647
Bal. Available, EOY...................................... 12,510 - 0 - - - 0 -
Total Available........................................... 345,611 1,853 329,615 1,845 -53,015 -198 276,600 1,647
Transfers In................................................... -43,209 -107 -26,658 -107 +9,058 +14 -17,600 -93
Transfers Out................................................ 3,046 - - - - - - -
Bal. Available, SOY...................................... -9,531 - -12,510 - +12,510 - - -
Recoveries, Other (Net)................................. -4,917 - - - - - - -
Total Appropriation.................................... $291,000 1,746 $290,447 1,738 -$31,447 -184 $259,000 1,554
Notes:
Other includes cost pool spending
Excludes reimbursable funds
Bal. Available, SOY and Recoveries expressed as negative values for calculation purposes only
Project Statement
Obligations Detail and Staff Years (SYs)
(Dollars in thousands)
Forest and Rangeland Research
FY 2018 EstimateProgram
2016 Actual 2017 Annualized CR Inc. or Dec.
Overview K-2
FOREST SERVICE
Amount SYs Amount SYs Amount SYs Amount SYs
Discretionary Appropriations:
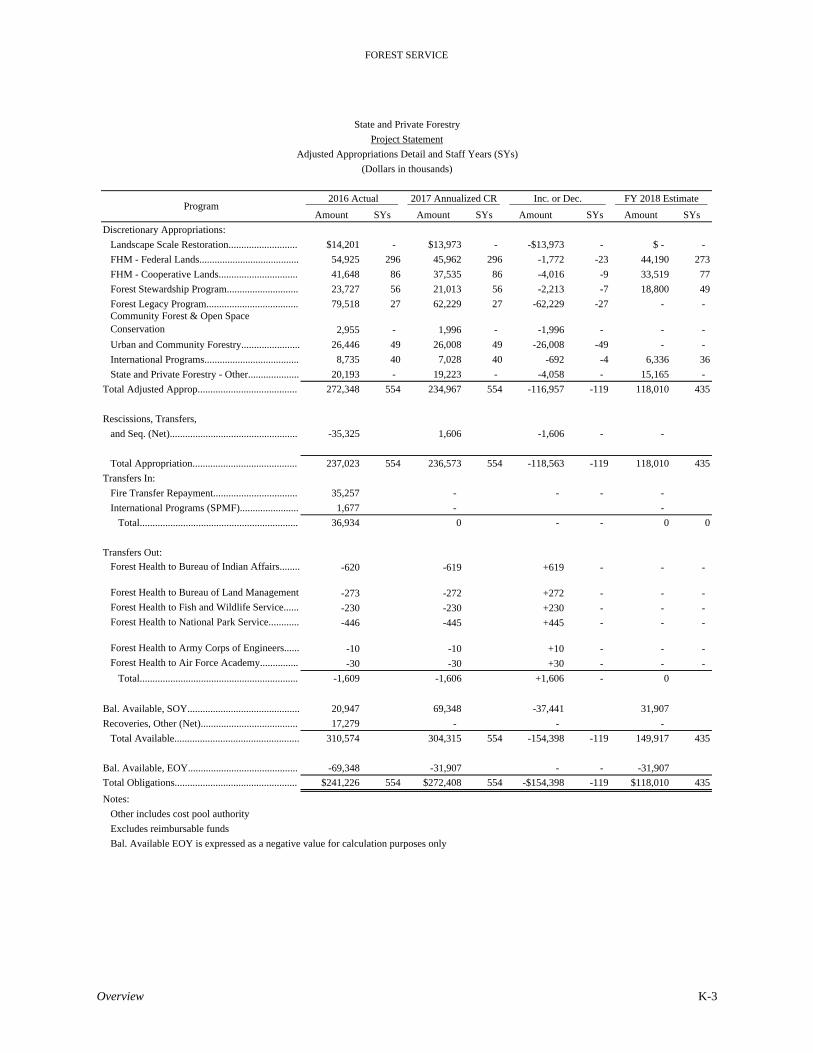
Landscape Scale Restoration........................... $14,201 - $13,973 - -$13,973 - $ - -
FHM - Federal Lands....................................... 54,925 296 45,962 296 -1,772 -23 44,190 273
FHM - Cooperative Lands............................... 41,648 86 37,535 86 -4,016 -9 33,519 77
Forest Stewardship Program............................ 23,727 56 21,013 56 -2,213 -7 18,800 49
Forest Legacy Program.................................... 79,518 27 62,229 27 -62,229 -27 - - Community Forest & Open Space Conservation 2,955 - 1,996 - -1,996 - - -
Urban and Community Forestry....................... 26,446 49 26,008 49 -26,008 -49 - -
International Programs..................................... 8,735 40 7,028 40 -692 -4 6,336 36
State and Private Forestry - Other.................... 20,193 - 19,223 - -4,058 - 15,165 -
Total Adjusted Approp....................................... 272,348 554 234,967 554 -116,957 -119 118,010 435
Rescissions, Transfers,
and Seq. (Net).................................................. -35,325 1,606 -1,606 - -
Total Appropriation......................................... 237,023 554 236,573 554 -118,563 -119 118,010 435
Transfers In:
Fire Transfer Repayment................................. 35,257 - - - -
International Programs (SPMF)....................... 1,677 - -
Total.............................................................. 36,934 0 - - 0 0
Transfers Out:Forest Health to Bureau of Indian Affairs........ -620 -619 +619 - - -
Forest Health to Bureau of Land Management -273 -272 +272 - - - Forest Health to Fish and Wildlife Service...... -230 -230 +230 - - - Forest Health to National Park Service............ -446 -445 +445 - - -
Forest Health to Army Corps of Engineers...... -10 -10 +10 - - - Forest Health to Air Force Academy............... -30 -30 +30 - - -
Total.............................................................. -1,609 -1,606 +1,606 - 0
Bal. Available, SOY............................................ 20,947 69,348 -37,441 31,907
Recoveries, Other (Net)...................................... 17,279 - - -
Total Available................................................. 310,574 304,315 554 -154,398 -119 149,917 435
Bal. Available, EOY........................................... -69,348 -31,907 - - -31,907
Total Obligations................................................ $241,226 554 $272,408 554 -$154,398 -119 $118,010 435
Notes:
Other includes cost pool authority
Excludes reimbursable funds
Bal. Available EOY is expressed as a negative value for calculation purposes only
State and Private Forestry
Project Statement
Adjusted Appropriations Detail and Staff Years (SYs)
(Dollars in thousands)
Program 2016 Actual 2017 Annualized CR Inc. or Dec. FY 2018 Estimate
Overview K-3
FOREST SERVICE
Amount SYs Amount SYs Amount SYs Amount SYs
Discretionary Obligations:
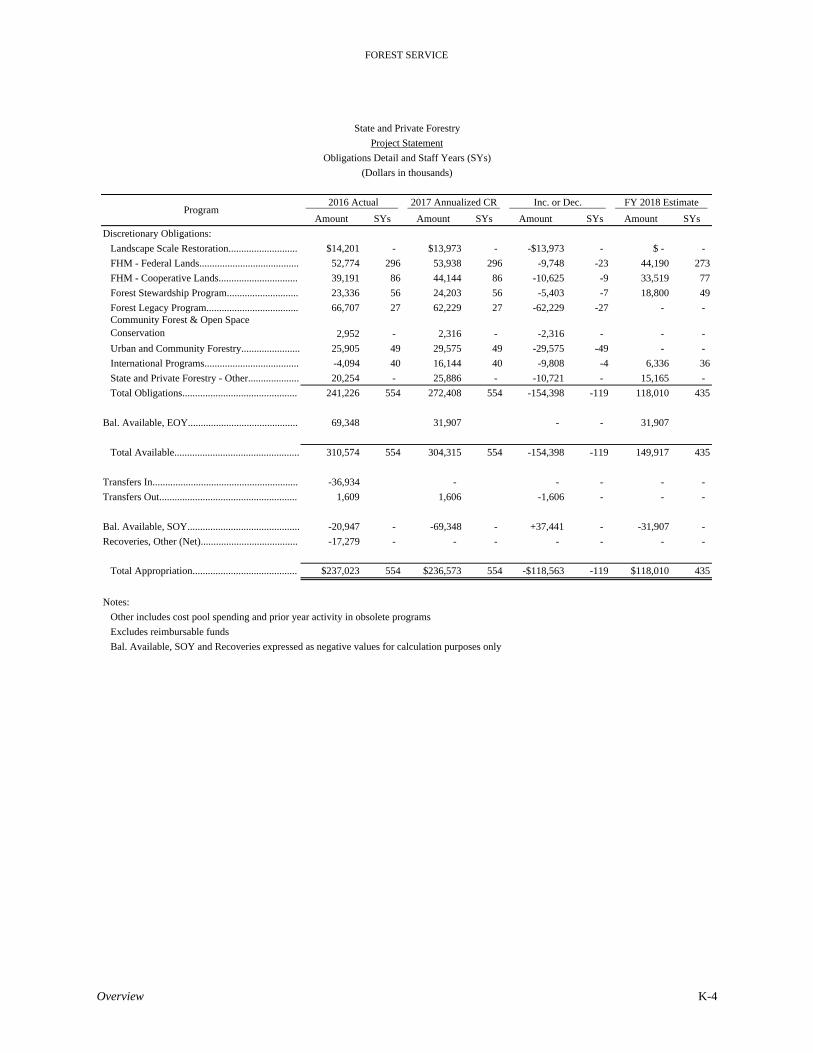
Landscape Scale Restoration........................... $14,201 - $13,973 - -$13,973 - $ - -
FHM - Federal Lands....................................... 52,774 296 53,938 296 -9,748 -23 44,190 273
FHM - Cooperative Lands............................... 39,191 86 44,144 86 -10,625 -9 33,519 77
Forest Stewardship Program............................ 23,336 56 24,203 56 -5,403 -7 18,800 49
Forest Legacy Program.................................... 66,707 27 62,229 27 -62,229 -27 - - Community Forest & Open Space Conservation 2,952 - 2,316 - -2,316 - - -
Urban and Community Forestry....................... 25,905 49 29,575 49 -29,575 -49 - -
International Programs..................................... -4,094 40 16,144 40 -9,808 -4 6,336 36
State and Private Forestry - Other.................... 20,254 - 25,886 - -10,721 - 15,165 -
Total Obligations............................................. 241,226 554 272,408 554 -154,398 -119 118,010 435
Bal. Available, EOY........................................... 69,348 31,907 - - 31,907
Total Available................................................. 310,574 554 304,315 554 -154,398 -119 149,917 435
Transfers In......................................................... -36,934 - - - - -
Transfers Out...................................................... 1,609 1,606 -1,606 - - -
Bal. Available, SOY............................................ -20,947 - -69,348 - +37,441 - -31,907 -
Recoveries, Other (Net)...................................... -17,279 - - - - - - -
Total Appropriation......................................... $237,023 554 $236,573 554 -$118,563 -119 $118,010 435
Notes:
Other includes cost pool spending and prior year activity in obsolete programs
Excludes reimbursable funds
Bal. Available, SOY and Recoveries expressed as negative values for calculation purposes only
State and Private Forestry
Project Statement
Obligations Detail and Staff Years (SYs)
(Dollars in thousands)
Program 2016 Actual 2017 Annualized CR Inc. or Dec. FY 2018 Estimate
Overview K-4
FOREST SERVICE
Amount SYs Amount SYs Amount SYs Amount SYs
Discretionary Appropriations:
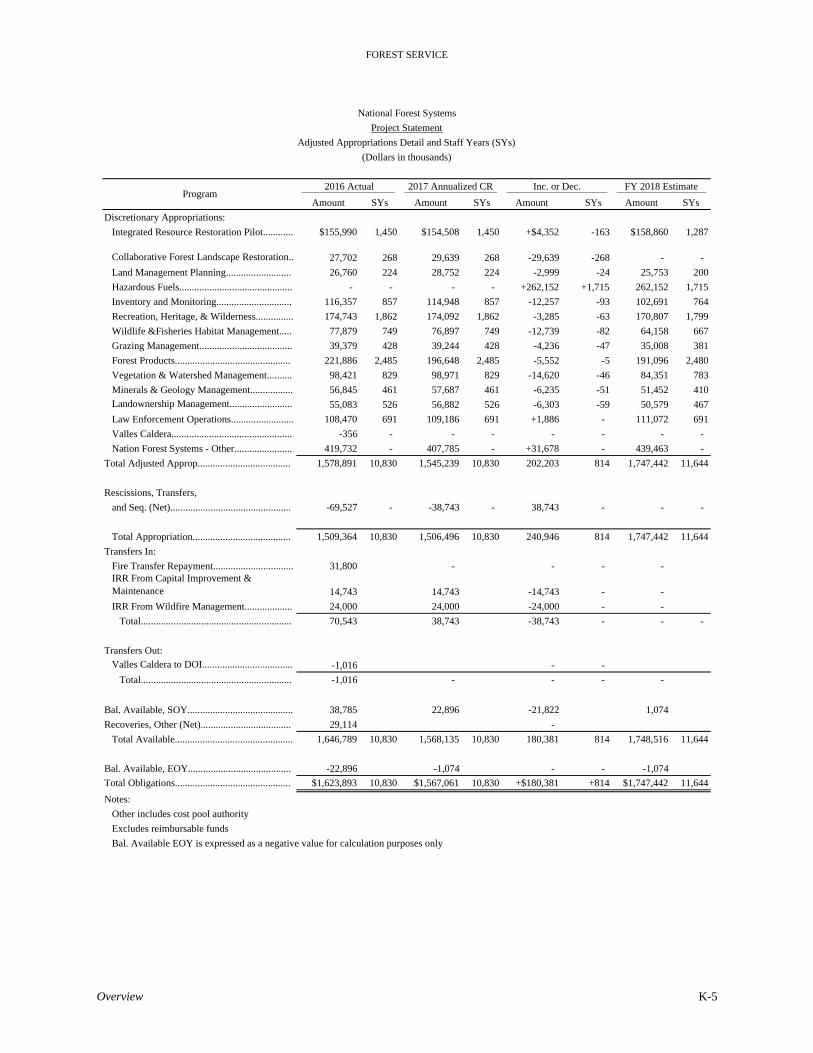
Integrated Resource Restoration Pilot............ $155,990 1,450 $154,508 1,450 +$4,352 -163 $158,860 1,287
Collaborative Forest Landscape Restoration.. 27,702 268 29,639 268 -29,639 -268 - -
Land Management Planning.......................... 26,760 224 28,752 224 -2,999 -24 25,753 200
Hazardous Fuels............................................. - - - - +262,152 +1,715 262,152 1,715
Inventory and Monitoring.............................. 116,357 857 114,948 857 -12,257 -93 102,691 764
Recreation, Heritage, & Wilderness............... 174,743 1,862 174,092 1,862 -3,285 -63 170,807 1,799
Wildlife &Fisheries Habitat Management..... 77,879 749 76,897 749 -12,739 -82 64,158 667
Grazing Management..................................... 39,379 428 39,244 428 -4,236 -47 35,008 381
Forest Products.............................................. 221,886 2,485 196,648 2,485 -5,552 -5 191,096 2,480
Vegetation & Watershed Management.......... 98,421 829 98,971 829 -14,620 -46 84,351 783
Minerals & Geology Management................. 56,845 461 57,687 461 -6,235 -51 51,452 410 Landownership Management......................... 55,083 526 56,882 526 -6,303 -59 50,579 467
Law Enforcement Operations......................... 108,470 691 109,186 691 +1,886 - 111,072 691
Valles Caldera................................................ -356 - - - - - - -
Nation Forest Systems - Other....................... 419,732 - 407,785 - +31,678 - 439,463 -
Total Adjusted Approp..................................... 1,578,891 10,830 1,545,239 10,830 202,203 814 1,747,442 11,644
Rescissions, Transfers,
and Seq. (Net)................................................ -69,527 - -38,743 - 38,743 - - -
Total Appropriation....................................... 1,509,364 10,830 1,506,496 10,830 240,946 814 1,747,442 11,644
Transfers In:
Fire Transfer Repayment................................ 31,800 - - - -IRR From Capital Improvement & Maintenance 14,743 14,743 -14,743 - -
IRR From Wildfire Management................... 24,000 24,000 -24,000 - -
Total............................................................ 70,543 38,743 -38,743 - - -
Transfers Out:Valles Caldera to DOI.................................... -1,016 - -
Total............................................................ -1,016 - - - -
Bal. Available, SOY.......................................... 38,785 22,896 -21,822 1,074
Recoveries, Other (Net).................................... 29,114 -
Total Available............................................... 1,646,789 10,830 1,568,135 10,830 180,381 814 1,748,516 11,644
Bal. Available, EOY......................................... -22,896 -1,074 - - -1,074
Total Obligations.............................................. $1,623,893 10,830 $1,567,061 10,830 +$180,381 +814 $1,747,442 11,644
Notes:
Other includes cost pool authority
Excludes reimbursable funds
Bal. Available EOY is expressed as a negative value for calculation purposes only
National Forest Systems
Project Statement
Adjusted Appropriations Detail and Staff Years (SYs)
(Dollars in thousands)
Program 2016 Actual 2017 Annualized CR Inc. or Dec. FY 2018 Estimate
Overview K-5
FOREST SERVICE
Amount SYs Amount SYs Amount SYs Amount SYs
Discretionary Obligations:
Integrated Resource Restoration Pilot............ $161,269 1,450 $160,337 1,450 -$160,337 -163 $ - 1,287
Collaborative Forest Landscape Restoration.. 42,893 268 33,979 268 -$33,979 -268 0 -
Land Management Planning.......................... 26,504 224 28,752 224 +$4,248 -24 33,000 200
Hazardous Fuels............................................. - - - - +$354,288 +1,715 354,288 1,715
Inventory and Monitoring.............................. 121,572 857 116,546 857 +$15,454 -93 132,000 764
Recreation, Heritage, & Wilderness............... 179,639 1,862 177,283 1,862 +$75,597 -63 252,880 1,799
Wildlife &Fisheries Habitat Management..... 81,650 749 76,897 749 +$48,103 -82 125,000 667
Grazing Management..................................... 39,558 428 41,808 428 +$8,792 -47 50,600 381
Forest Products.............................................. 229,713 2,485 196,648 2,485 +$162,473 -5 359,121 2,480
Vegetation & Watershed Management.......... 103,407 829 100,333 829 +$74,067 -46 174,400 783
Minerals & Geology Management................. 56,447 461 65,396 461 +$2,604 -51 68,000 410 Landownership Management......................... 64,733 526 59,929 526 +$9,071 -59 69,000 467
Law Enforcement Operations......................... 106,776 691 109,186 691 +$19,967 - 129,153 691
Valles Caldera................................................ -1 - - - - - 0 -
Nation Forest Systems - Other....................... 409,732 - 399,967 - -$399,967 -
Total Obligations........................................... $1,623,893 10,830 $1,567,061 10,830 $180,381 814 $1,747,442 11,644
Bal. Available, EOY......................................... 22,896 1,074 - - 1,074
Total Available............................................... 1,646,790 10,830 1,568,135 10,830 180,381 814 1,748,516 11,644
Transfers In....................................................... -70,543 -38,743 +38,743 - - -
1,016 - - - - -
Bal. Available, SOY.......................................... -38,785 - -22,896 - +21,822 - -1,074 -
Recoveries, Other (Net).................................... -29,114 - - - - - - -
Total Appropriation....................................... $1,509,364 10,830 $1,506,496 10,830 +$240,946 +814 $1,747,442 11,644
Notes:
Other includes cost pool spending and prior year activity in obsolete programs
Excludes reimbursable funds
Bal. Available, SOY and Recoveries expressed as negative values for calculation purposes only
National Forest Systems
Project Statement
Obligations Detail and Staff Years (SYs)
(Dollars in thousands)
Program 2016 Actual 2017 Annualized CR Inc. or Dec. FY 2018 Estimate
Overview K-6
FOREST SERVICE
Amount SYs Amount SYs Amount SYs Amount SYs
Discretionary Appropriations:
Facilities............................................................................ $62,273 307 $54,837 307 -$46,557 -51 $8,280 256
Roads................................................................................. 137,950 977 132,476 977 -74,754 -103 57,722 874
Trails.................................................................................. 55,244 583 52,920 583 -44,778 -51 8,142 532
Deferred Maintenance & Infrastructure Improvement..... 3,142 1 3,144 1 -3,144 -1 - -
Legacy Roads and Trails................................................... 22,168 77 22,115 77 -22,115 -77 - - Capital Improvement and Maintenance - Other................ 85,990 83,237 -57,688 - 25,549 -
Total Adjusted Approp......................................................... 366,767 1,945 348,729 1,945 -249,036 -283 99,693 1,662
Rescissions, Transfers,
and Seq. (Net).................................................................... -2,603 - 14,743 - -14,743 - - -
Total Appropriation........................................................... 364,164 1,945 363,472 1,945 -263,779 -283 99,693 1,662
Transfers In:
Fire Transfer Repayment................................................... 17,600 - - - -
Total............................................................................... 17,600 - - - - -
Transfers Out:IRR - Legacy Roads and Trails......................................... -14,743 -14,743 +$14,743 - National Telecommunications and Information Administration -254 - -
Total............................................................................... -14,997 -14,743 14,743 - -
Bal. Available, SOY............................................................. 13,547 11,912 -$10,832 - 1,080
Recoveries, Other (Net)........................................................ 7,060 - -
Total Available.................................................................. 387,374 1,945 360,641 1,945 -259,868 -283 100,773 1,662
Bal. Available, EOY............................................................. -11,912 -1,080 - - -1,080
Total Obligations.................................................................. $375,462 1,945 $359,561 1,945 -$259,868 -283 $99,693 1,662
Notes:
Other includes cost pool authority
Excludes reimbursable funds
Bal. Available EOY is expressed as a negative value for calculation purposes only
Capital Improvement and Maintenance
Project Statement
Adjusted Appropriations Detail and Staff Years (SYs)
(Dollars in thousands)
Program 2016 Actual 2017 Annualized CR Inc. or Dec. FY 2018 Estimate
Overview K-7
FOREST SERVICE
Amount SYs Amount SYs Amount SYs Amount SYs
Discretionary Obligations:
Facilities............................................................................ $59,979 307 $63,603 307 -$55,323 -51 $8,280 256
Roads................................................................................. 144,907 977 132,476 977 -$74,754 -103 57,722 874
Trails.................................................................................. 56,860 583 54,025 583 -$45,883 -51 8,142 532
Deferred Maintenance & Infrastructure Improvement..... 3,137 1 3,176 1 -$3,176 -1 - -
Legacy Roads and Trails................................................... 24,157 77 24,689 77 -$24,689 -77 - - Capital Improvement and Maintenance - Other................ 86,422 - 81,592 - -$56,043 - 25,549 -
Total Obligations............................................................... $375,462 1,945 $359,561 1,945 -$259,868 -283 $99,693 1,662
Bal. Available, EOY............................................................. 11,912 1,080 - - 1,080
Total Available.................................................................. 387,373 1,945 360,641 1,945 -259,868 -283 100,773 1,662
Transfers In........................................................................... -17,600 - - - - -
Transfers Out........................................................................ 14,997 14,743 -14,743 - - -
Bal. Available, SOY............................................................. -13,547 - -11,912 - +10,832 - -1,080 -
Recoveries, Other (Net)........................................................ -7,060 - - - - - - -
Total Appropriation........................................................... $364,164 1,945 $363,472 1,945 -$263,779 -283 $99,693 1,662
Notes:
Other includes cost pool spending and prior year activity in obsolete programs
Excludes reimbursable funds
Bal. Available, SOY and Recoveries expressed as negative values for calculation purposes only
Capital Improvement and Maintenance
Project Statement
Obligations Detail and Staff Years (SYs)
(Dollars in thousands)
Program 2016 Actual 2017 Annualized CR Inc. or Dec. FY 2018 Estimate
Overview K-8

FOREST SERVICE
Amount SYs Amount SYs Amount SYs Amount SYs
Discretionary Appropriations:
Preparedness.................................................. $813,510 7,170 $1,080,563 7,170 +$259,057 -140 $1,339,620 7,030
Suppression.................................................... 1,602,577 3,100 1,588,459 3,100 -531,641 -60 1,056,818 3,040
Hazardous Fuels............................................. 299,884 1,815 350,288 1,815 -350,288 -1,815 - - State Fire Assistance...................................... 81,308 56 77,852 56 -8,452 -12 69,400 44
Volunteer Fire Assistance.............................. 13,032 - 12,975 - -1,375 - 11,600 -
Wildland Fire Management - Other............... 418,408 - - - - - -
Total Adjusted Approp..................................... 3,228,719 12,141 3,110,137 12,141 -632,699 -2,027 2,477,438 10,114
Rescissions, Transfers,
and Seq. (Net)................................................ -142,390 107 -728,342 107 745,942 -14 17,600 93
Total Appropriation....................................... 3,086,329 12,248 2,381,795 12,248 113,243 -2,041 2,495,038 10,207
Transfers In:
FLAME.......................................................... 675,165 779,000 -$779,000 -
Department of Interior................................... 122 - - -
Total............................................................ 675,287 779,000 -779,000 - - -
Transfers Out:National Forest System - IRR........................ -24,000 -24,000 +$24,000 - Fire Transfer................................................... -479,039 - - - National Fire Plan.......................................... -19,795 -99 -19,757 -99 +$2,157 +6 -17,600 -93Joint Fire Science........................................... -6,914 -8 -6,901 -8 +$6,901 +8 - -
Department of Interior................................... -3,148 - - -
Total............................................................ -532,897 -107 -50,658 -107 33,058 14 -17,600 -93
Bal. Available, SOY.......................................... 120,570 118,775 -$52,001 - 66,774
Recoveries, Other (Net).................................... 238,563 - -
Total Available............................................... 3,587,852 12,141 3,228,912 12,141 -684,700 -2,027 2,544,212 10,114
Bal. Available, EOY......................................... -118,775 -66,774 - - -66,774
Total Obligations.............................................. $3,469,076 12,141 $3,162,138 12,141 -$684,700 -2,027 $2,477,438 10,114
Notes:
Other includes FY 2016 cost pool authority; FY 2017 and forward cost pools remain in programs in Wildland Fire Management
Excludes reimbursable funds
FY16 Suppression adjusted appropriation includes net transfers for Fire Transfer Repayment ($700 million) and FLAME transfer ($675 million)
Wildland Fire Management
Project Statement
Adjusted Appropriations Detail and Staff Years (SYs)
(Dollars in thousands)
Program 2016 Actual 2017 Annualized CR Inc. or Dec. FY 2018 Estimate
FY 2017 Ending Balance includes $65 million for air tanker
Overview K-9
FOREST SERVICE
Amount SYs Amount SYs Amount SYs Amount SYs
Discretionary Obligations:
Preparedness.................................................. $842,046 7,170 $1,080,563 7,170 +$259,057 -140 $1,339,620 7,030
Suppression.................................................... 1,875,606 3,100 1,631,000 3,100 -$574,182 -60 $1,056,818 3,040
Hazardous Fuels............................................. 322,534 1,815 352,341 1,815 -$352,341 -1,815 $ - - State Fire Assistance...................................... 77,987 56 85,235 56 -$15,835 -12 $69,400 44
Volunteer Fire Assistance.............................. 13,007 - 12,999 - -$1,399 - $11,600 - Wildland Fire Management - Other............... 337,896 - - - - $ - -
Total Obligations........................................... $3,469,077 12,141 $3,162,138 12,141 -$684,700 -2,027 $2,477,438 10,114
Bal. Available, EOY......................................... 118,775 66,774 - - 66,774
Total Available............................................... 3,587,852 12,141 3,228,912 12,141 -684,700 -2,027 2,544,212 10,114
Transfers In....................................................... -675,287 - -779,000 +779,000 - - -
Transfers Out.................................................... 532,897 107 50,658 -33,058 - 17,600 -
Bal. Available, SOY.......................................... -120,570 - -118,775 - +52,001 - -66,774 -
Recoveries, Other (Net).................................... -238,563 - - - - - - -
Total Appropriation....................................... $3,086,329 12,248 $2,381,795 12,141 +$113,243 -2,027 $2,495,038 10,114
Notes:
FY 2017 Ending Balance includes $65 million for air tanker
FY16 Suppression spending includes expenditure transfer from Cooperative Work - Knutson-Vandenberg
Excludes reimbursable funds
Other includes FY 2016 cost pool spending; FY 2017 and forward cost pools remain in programs in Wildland Fire Management
Program 2016 Actual 2017 Annualized CR Inc. or Dec. FY 2018 Estimate
FY16 Suppression adjusted appropriation includes Fire Transfer Repayment ($700 million) and FLAME transfer ($675 million). To balance total WFM appropriation to FY16 Enacted add FLAME ($823m) and subtract Fire Transfer Repayment ($700 million)
Project Statement
Obligations Detail and Staff Years (SYs)
(Dollars in thousands)
Wildland Fire Management
Overview K-10
FOREST SERVICE
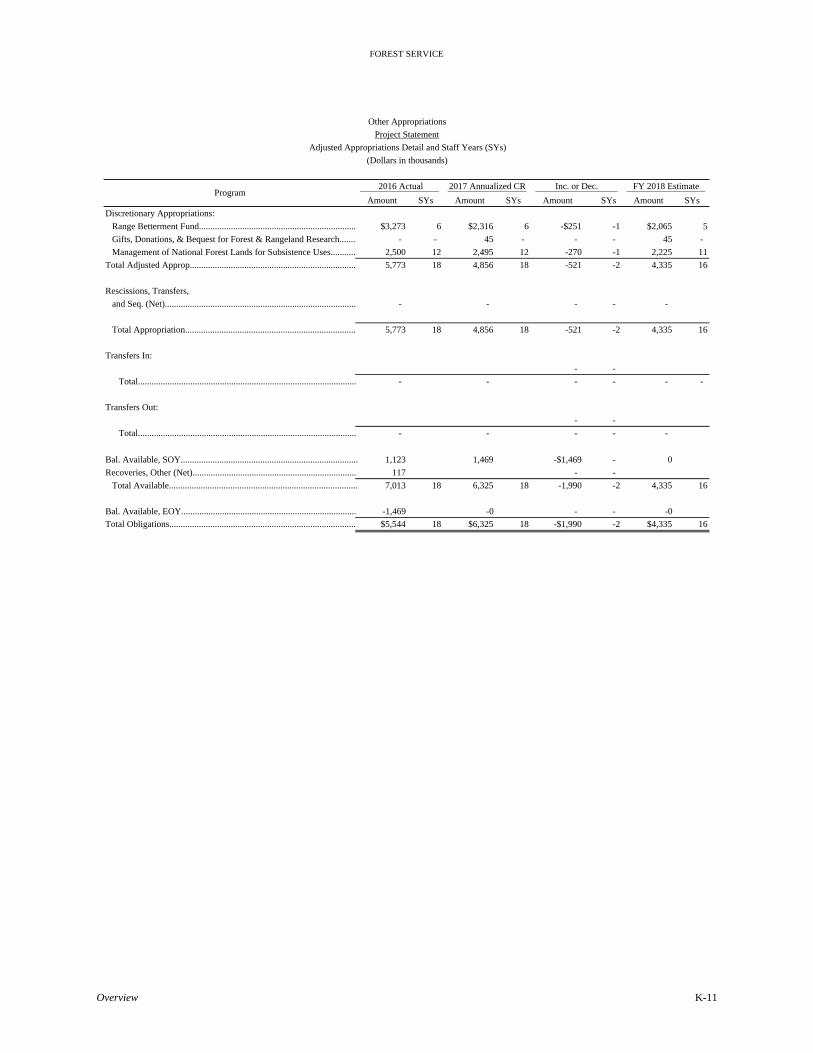
Amount SYs Amount SYs Amount SYs Amount SYs
Discretionary Appropriations:
Range Betterment Fund..................................................................... $3,273 6 $2,316 6 -$251 -1 $2,065 5
Gifts, Donations, & Bequest for Forest & Rangeland Research....... - - 45 - - - 45 -
Management of National Forest Lands for Subsistence Uses........... 2,500 12 2,495 12 -270 -1 2,225 11
Total Adjusted Approp......................................................................... 5,773 18 4,856 18 -521 -2 4,335 16
Rescissions, Transfers,
and Seq. (Net).................................................................................... - - - - -
Total Appropriation........................................................................... 5,773 18 4,856 18 -521 -2 4,335 16
Transfers In:
- -
Total................................................................................................ - - - - - -
Transfers Out:
- -
Total................................................................................................ - - - - -
Bal. Available, SOY.............................................................................. 1,123 1,469 -$1,469 - 0
Recoveries, Other (Net)........................................................................ 117 - -
Total Available................................................................................... 7,013 18 6,325 18 -1,990 -2 4,335 16
Bal. Available, EOY............................................................................. -1,469 -0 - - -0
Total Obligations.................................................................................. $5,544 18 $6,325 18 -$1,990 -2 $4,335 16
Other Appropriations
Project Statement
Adjusted Appropriations Detail and Staff Years (SYs)
(Dollars in thousands)
Program 2016 Actual 2017 Annualized CR Inc. or Dec. FY 2018 Estimate
Overview K-11
FOREST SERVICE
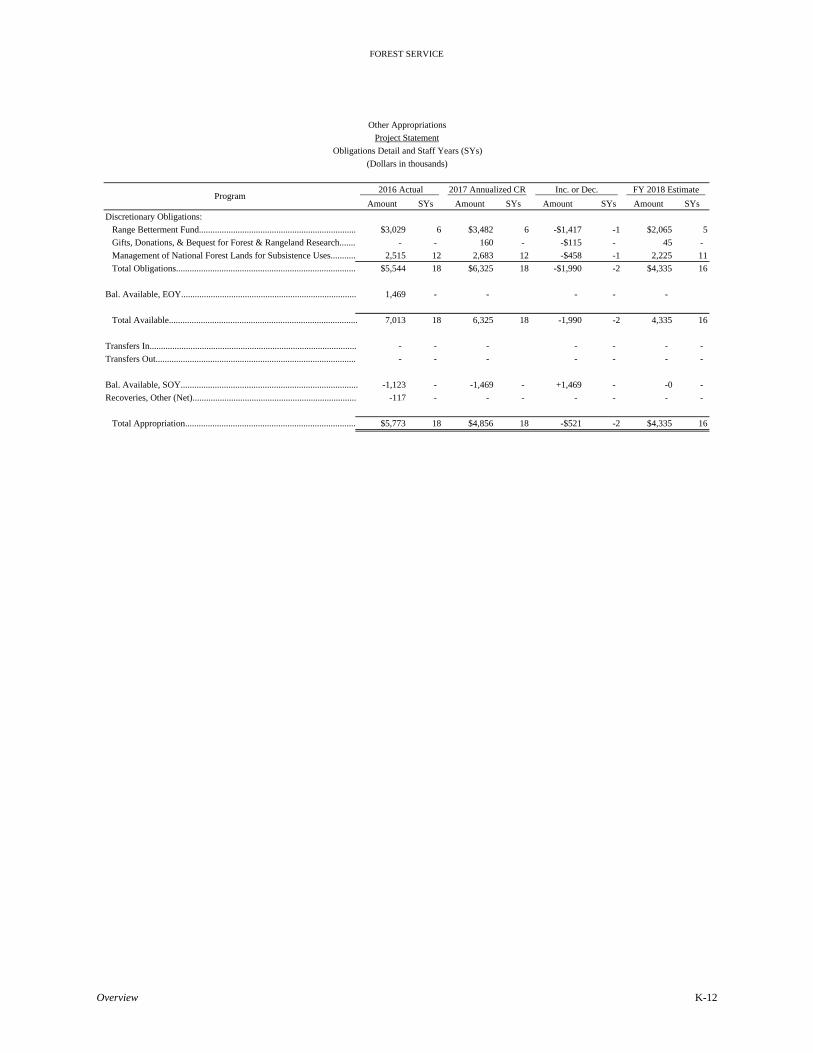
Amount SYs Amount SYs Amount SYs Amount SYs
Discretionary Obligations:
Range Betterment Fund..................................................................... $3,029 6 $3,482 6 -$1,417 -1 $2,065 5
Gifts, Donations, & Bequest for Forest & Rangeland Research....... - - 160 - -$115 - 45 -
Management of National Forest Lands for Subsistence Uses........... 2,515 12 2,683 12 -$458 -1 2,225 11
Total Obligations............................................................................... $5,544 18 $6,325 18 -$1,990 -2 $4,335 16
Bal. Available, EOY............................................................................. 1,469 - - - - -
Total Available................................................................................... 7,013 18 6,325 18 -1,990 -2 4,335 16
Transfers In........................................................................................... - - - - - - -
Transfers Out........................................................................................ - - - - - - -
Bal. Available, SOY.............................................................................. -1,123 - -1,469 - +1,469 - -0 -
Recoveries, Other (Net)........................................................................ -117 - - - - - - -
Total Appropriation........................................................................... $5,773 18 $4,856 18 -$521 -2 $4,335 16
Other Appropriations
Project Statement
Obligations Detail and Staff Years (SYs)
(Dollars in thousands)
Program 2016 Actual 2017 Annualized CR Inc. or Dec. FY 2018 Estimate
Overview K-12

FOREST SERVICE
Amount SYs Amount SYs Amount SYs Amount SYs
Discretionary Appropriations:
Land Acquisition.............................................................................. $79,616 52 $63,314 52 -$56,314 - $7,000 52
Acquisition of Land for National Forests Special Acts................... 950 - 948 - -98 - 850 -
Acquisition of Lands to Complete Land Exchanges........................ - - 216 - -24 - 192 -
Total Adjusted Approp........................................................................ 80,566 52 64,478 52 -56,436 - 8,042 52
Rescissions, Transfers,
and Seq. (Net)................................................................................... -16,181 - - - -
Total Appropriation.......................................................................... 64,385 52 64,478 52 -56,436 - 8,042 52
Transfers In:
Fire Transfer Repayment.................................................................. 16,181 - - - -
Total............................................................................................... 16,181 - - - - -
Transfers Out:
- -
Total............................................................................................... - - - - -
Bal. Available, SOY............................................................................ 4,058 33,924 -$373 - 33,551
Recoveries, Other (Net)...................................................................... 910 - -
Total Available................................................................................. 85,535 52 98,402 52 -56,809 - 41,593 52
Lapsing Balances -26 -373 -290
Bal. Available, EOY............................................................................ -33,924 -33,551 +290 - -33,261
Total Obligations................................................................................. $51,585 52 $64,478 52 -$56,436 - $8,042 52
Land Acquisition
Project Statement
Adjusted Appropriations Detail and Staff Years (SYs)
(Dollars in thousands)
Program 2016 Actual 2017 Annualized CR Inc. or Dec. FY 2018 Estimate
Overview K-13

FOREST SERVICE
Amount SYs Amount SYs Amount SYs Amount SYs
Discretionary Obligations:
Land Acquisition.............................................................................. $51,263 52 $63,314 52 -$56,314 - $7,000 52
Acquisition of Land for National Forests Special Acts................... 317 - 948 - -$98 - 850 -
Acquisition of Lands to Complete Land Exchanges........................ 5 - 216 - -$24 - 192 -
Total Obligations.............................................................................. $51,585 52 $64,478 52 -$56,436 0 $8,042 52
Lapsing Balances................................................................................. 26 373 290
Bal. Available, EOY............................................................................ 33,924 33,551 -290 - 33,261
Total Available................................................................................. 85,535 52 98,402 52 -56,726 - 41,593 52
Transfers In......................................................................................... -16,181 - - - - -
Transfers Out....................................................................................... - - - - - -
Bal. Available, SOY............................................................................ -4,058 - -33,924 - +373 - -33,551 -
Recoveries, Other (Net)...................................................................... -910 - - - - - - -
Total Appropriation.......................................................................... $64,385 52 $64,478 52 -$56,436 - $8,042 52
Project Statement
Obligations Detail and Staff Years (SYs)
(Dollars in thousands)
Land Acquisition
Program 2016 Actual 2017 Annualized CR Inc. or Dec. FY 2018 Estimate
Overview K-14
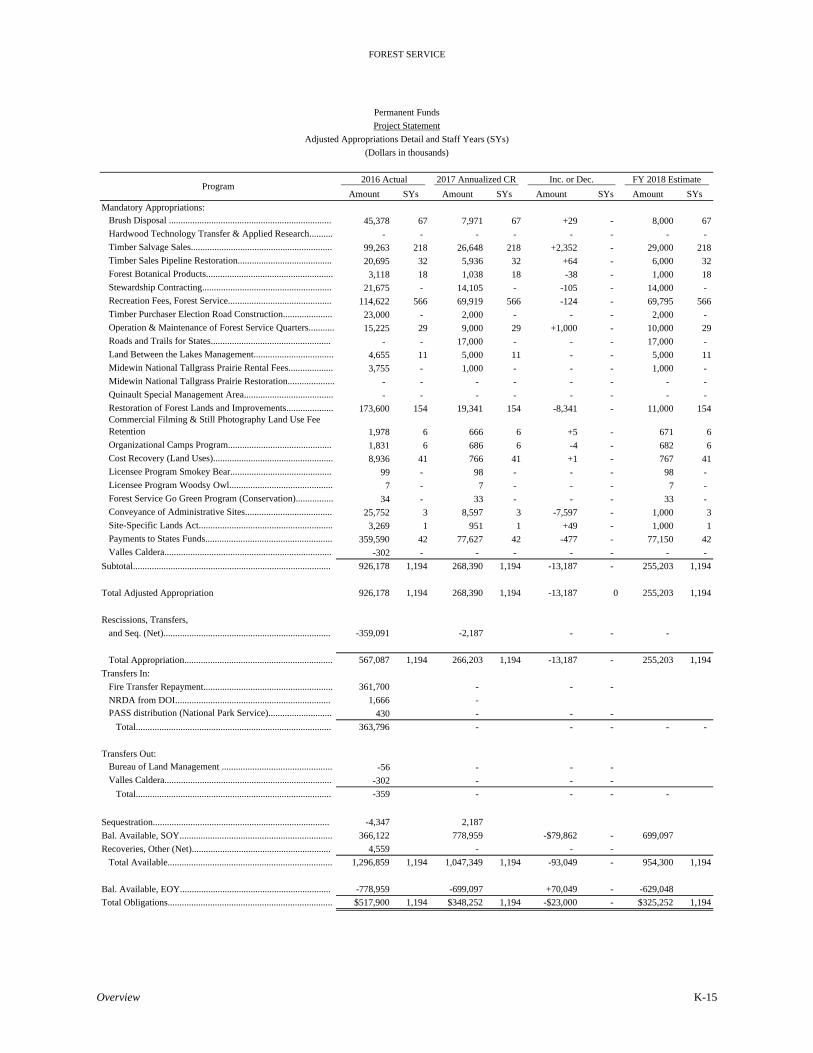
FOREST SERVICE
Amount SYs Amount SYs Amount SYs Amount SYs
Mandatory Appropriations:Brush Disposal ..................................................................... 45,378 67 7,971 67 +29 - 8,000 67 Hardwood Technology Transfer & Applied Research.......... - - - - - - - - Timber Salvage Sales............................................................ 99,263 218 26,648 218 +2,352 - 29,000 218 Timber Sales Pipeline Restoration........................................ 20,695 32 5,936 32 +64 - 6,000 32 Forest Botanical Products...................................................... 3,118 18 1,038 18 -38 - 1,000 18 Stewardship Contracting....................................................... 21,675 - 14,105 - -105 - 14,000 - Recreation Fees, Forest Service............................................ 114,622 566 69,919 566 -124 - 69,795 566 Timber Purchaser Election Road Construction..................... 23,000 - 2,000 - - - 2,000 - Operation & Maintenance of Forest Service Quarters........... 15,225 29 9,000 29 +1,000 - 10,000 29 Roads and Trails for States................................................... - - 17,000 - - - 17,000 - Land Between the Lakes Management.................................. 4,655 11 5,000 11 - - 5,000 11 Midewin National Tallgrass Prairie Rental Fees................... 3,755 - 1,000 - - - 1,000 - Midewin National Tallgrass Prairie Restoration.................... - - - - - - - - Quinault Special Management Area...................................... - - - - - - - - Restoration of Forest Lands and Improvements.................... 173,600 154 19,341 154 -8,341 - 11,000 154 Commercial Filming & Still Photography Land Use Fee Retention 1,978 6 666 6 +5 - 671 6 Organizational Camps Program............................................ 1,831 6 686 6 -4 - 682 6 Cost Recovery (Land Uses)................................................... 8,936 41 766 41 +1 - 767 41 Licensee Program Smokey Bear........................................... 99 - 98 - - - 98 - Licensee Program Woodsy Owl............................................ 7 - 7 - - - 7 - Forest Service Go Green Program (Conservation)................ 34 - 33 - - - 33 - Conveyance of Administrative Sites..................................... 25,752 3 8,597 3 -7,597 - 1,000 3 Site-Specific Lands Act......................................................... 3,269 1 951 1 +49 - 1,000 1 Payments to States Funds...................................................... 359,590 42 77,627 42 -477 - 77,150 42 Valles Caldera....................................................................... -302 - - - - - - -
Subtotal.................................................................................... 926,178 1,194 268,390 1,194 -13,187 - 255,203 1,194
Total Adjusted Appropriation 926,178 1,194 268,390 1,194 -13,187 0 255,203 1,194
Rescissions, Transfers,
and Seq. (Net)....................................................................... -359,091 -2,187 - - -
Total Appropriation............................................................... 567,087 1,194 266,203 1,194 -13,187 - 255,203 1,194
Transfers In:
Fire Transfer Repayment....................................................... 361,700 - - -
NRDA from DOI.................................................................. 1,666 -PASS distribution (National Park Service)........................... 430 - - -
Total................................................................................... 363,796 - - - - -
Transfers Out:Bureau of Land Management ............................................... -56 - - - Valles Caldera....................................................................... -302 - - -
Total................................................................................... -359 - - - -
Sequestration........................................................................... -4,347 2,187
Bal. Available, SOY................................................................. 366,122 778,959 -$79,862 - 699,097
Recoveries, Other (Net)........................................................... 4,559 - - -
Total Available...................................................................... 1,296,859 1,194 1,047,349 1,194 -93,049 - 954,300 1,194
Bal. Available, EOY................................................................ -778,959 -699,097 +70,049 - -629,048
Total Obligations...................................................................... $517,900 1,194 $348,252 1,194 -$23,000 - $325,252 1,194
Permanent Funds
Project Statement
Adjusted Appropriations Detail and Staff Years (SYs)
(Dollars in thousands)
Program 2016 Actual 2017 Annualized CR Inc. or Dec. FY 2018 Estimate
Overview K-15
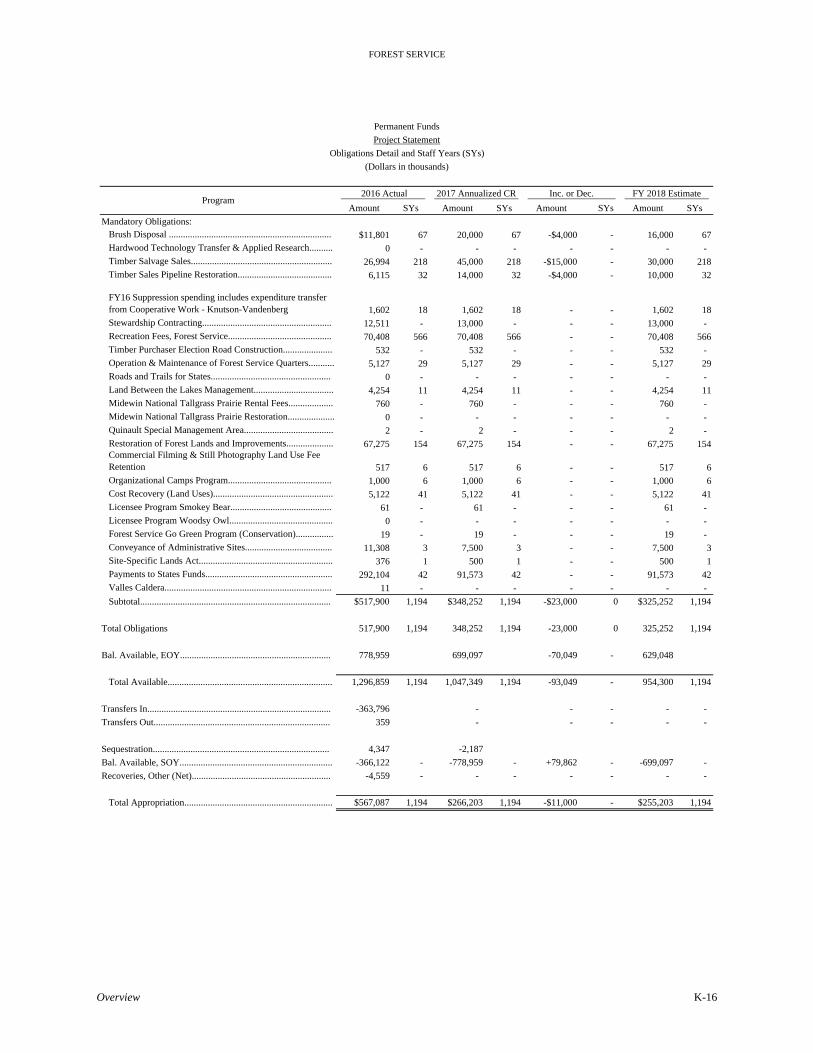
FOREST SERVICE
Amount SYs Amount SYs Amount SYs Amount SYs
Mandatory Obligations:Brush Disposal ..................................................................... $11,801 67 20,000 67 -$4,000 - 16,000 67 Hardwood Technology Transfer & Applied Research.......... 0 - - - - - - - Timber Salvage Sales............................................................ 26,994 218 45,000 218 -$15,000 - 30,000 218 Timber Sales Pipeline Restoration........................................ 6,115 32 14,000 32 -$4,000 - 10,000 32
FY16 Suppression spending includes expenditure transfer from Cooperative Work - Knutson-Vandenberg 1,602 18 1,602 18 - - 1,602 18 Stewardship Contracting....................................................... 12,511 - 13,000 - - - 13,000 - Recreation Fees, Forest Service............................................ 70,408 566 70,408 566 - - 70,408 566 Timber Purchaser Election Road Construction..................... 532 - 532 - - - 532 - Operation & Maintenance of Forest Service Quarters........... 5,127 29 5,127 29 - - 5,127 29 Roads and Trails for States................................................... 0 - - - - - - - Land Between the Lakes Management.................................. 4,254 11 4,254 11 - - 4,254 11 Midewin National Tallgrass Prairie Rental Fees................... 760 - 760 - - - 760 - Midewin National Tallgrass Prairie Restoration.................... 0 - - - - - - - Quinault Special Management Area...................................... 2 - 2 - - - 2 - Restoration of Forest Lands and Improvements.................... 67,275 154 67,275 154 - - 67,275 154 Commercial Filming & Still Photography Land Use Fee Retention 517 6 517 6 - - 517 6 Organizational Camps Program............................................ 1,000 6 1,000 6 - - 1,000 6 Cost Recovery (Land Uses)................................................... 5,122 41 5,122 41 - - 5,122 41 Licensee Program Smokey Bear........................................... 61 - 61 - - - 61 - Licensee Program Woodsy Owl............................................ 0 - - - - - - - Forest Service Go Green Program (Conservation)................ 19 - 19 - - - 19 - Conveyance of Administrative Sites..................................... 11,308 3 7,500 3 - - 7,500 3 Site-Specific Lands Act......................................................... 376 1 500 1 - - 500 1 Payments to States Funds...................................................... 292,104 42 91,573 42 - - 91,573 42 Valles Caldera....................................................................... 11 - - - - - - -
Subtotal................................................................................. $517,900 1,194 $348,252 1,194 -$23,000 0 $325,252 1,194
Total Obligations 517,900 1,194 348,252 1,194 -23,000 0 325,252 1,194
Bal. Available, EOY................................................................ 778,959 699,097 -70,049 - 629,048
Total Available...................................................................... 1,296,859 1,194 1,047,349 1,194 -93,049 - 954,300 1,194
Transfers In.............................................................................. -363,796 - - - - -
Transfers Out........................................................................... 359 - - - - -
Sequestration........................................................................... 4,347 -2,187
Bal. Available, SOY................................................................. -366,122 - -778,959 - +79,862 - -699,097 -
Recoveries, Other (Net)........................................................... -4,559 - - - - - - -
Total Appropriation............................................................... $567,087 1,194 $266,203 1,194 -$11,000 - $255,203 1,194
Permanent Funds
Project Statement
Obligations Detail and Staff Years (SYs)
(Dollars in thousands)
Program 2016 Actual 2017 Annualized CR Inc. or Dec. FY 2018 Estimate
Overview K-16
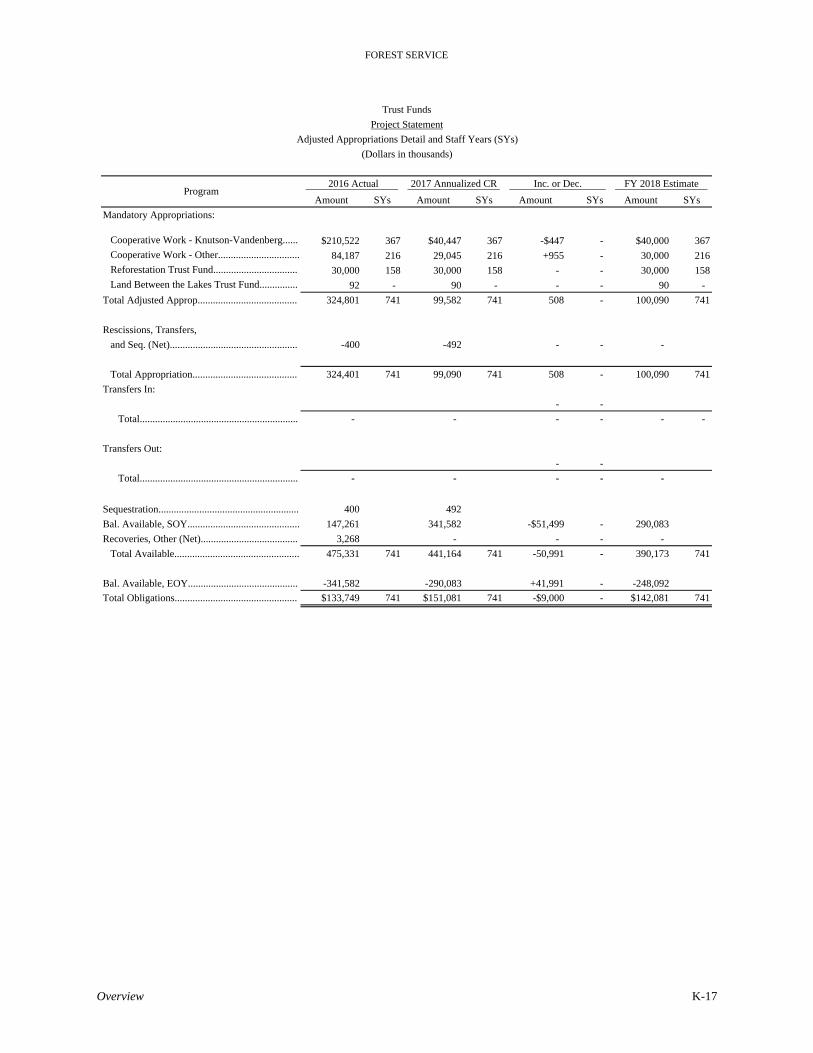
FOREST SERVICE
Amount SYs Amount SYs Amount SYs Amount SYs
Mandatory Appropriations:
Cooperative Work - Knutson-Vandenberg...... $210,522 367 $40,447 367 -$447 - $40,000 367 Cooperative Work - Other................................ 84,187 216 29,045 216 +955 - 30,000 216 Reforestation Trust Fund................................. 30,000 158 30,000 158 - - 30,000 158 Land Between the Lakes Trust Fund............... 92 - 90 - - - 90 -
Total Adjusted Approp....................................... 324,801 741 99,582 741 508 - 100,090 741
Rescissions, Transfers,
and Seq. (Net).................................................. -400 -492 - - -
Total Appropriation......................................... 324,401 741 99,090 741 508 - 100,090 741
Transfers In:
- -
Total.............................................................. - - - - - -
Transfers Out:
- -
Total.............................................................. - - - - -
Sequestration....................................................... 400 492
Bal. Available, SOY............................................ 147,261 341,582 -$51,499 - 290,083
Recoveries, Other (Net)...................................... 3,268 - - - -
Total Available................................................. 475,331 741 441,164 741 -50,991 - 390,173 741
Bal. Available, EOY........................................... -341,582 -290,083 +41,991 - -248,092
Total Obligations................................................ $133,749 741 $151,081 741 -$9,000 - $142,081 741
Trust Funds
Project Statement
Adjusted Appropriations Detail and Staff Years (SYs)
(Dollars in thousands)
Program 2016 Actual 2017 Annualized CR Inc. or Dec. FY 2018 Estimate
Overview K-17
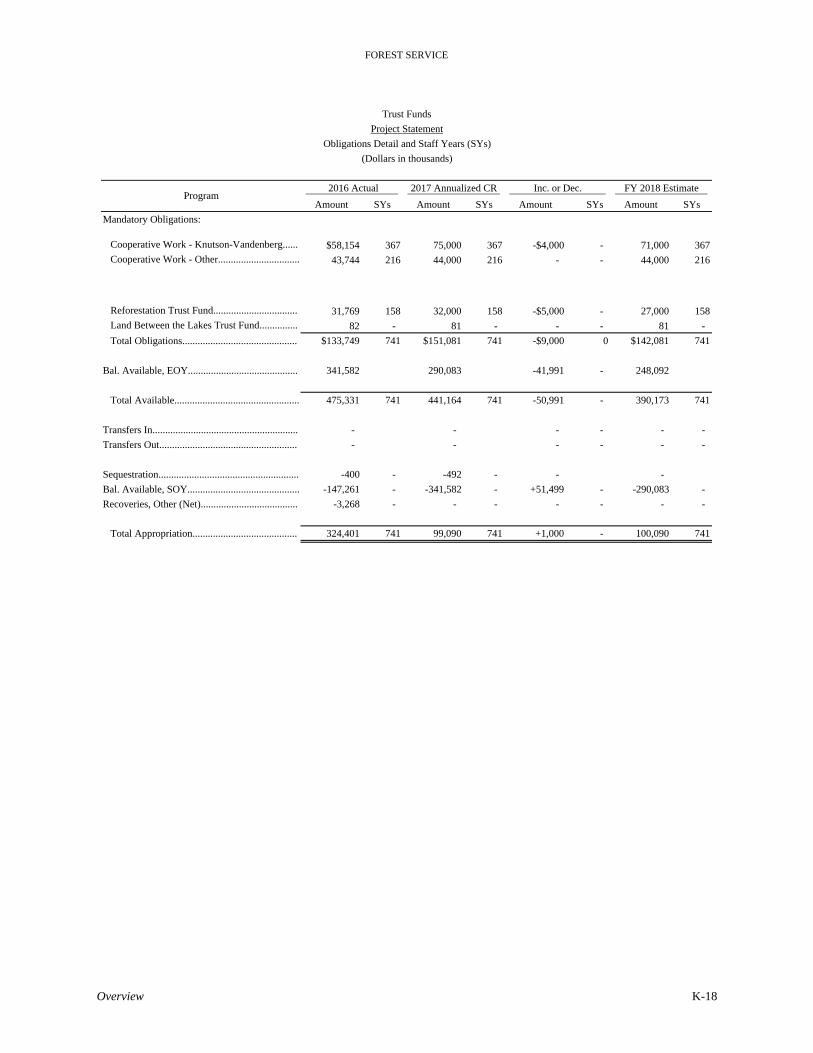
FOREST SERVICE
Amount SYs Amount SYs Amount SYs Amount SYs
Mandatory Obligations:
Cooperative Work - Knutson-Vandenberg...... $58,154 367 75,000 367 -$4,000 - 71,000 367 Cooperative Work - Other................................ 43,744 216 44,000 216 - - 44,000 216
Reforestation Trust Fund................................. 31,769 158 32,000 158 -$5,000 - 27,000 158 Land Between the Lakes Trust Fund............... 82 - 81 - - - 81 -
Total Obligations............................................. $133,749 741 $151,081 741 -$9,000 0 $142,081 741
Bal. Available, EOY........................................... 341,582 290,083 -41,991 - 248,092
Total Available................................................. 475,331 741 441,164 741 -50,991 - 390,173 741
Transfers In......................................................... - - - - - -
Transfers Out...................................................... - - - - - -
Sequestration....................................................... -400 - -492 - - -
Bal. Available, SOY............................................ -147,261 - -341,582 - +51,499 - -290,083 -
Recoveries, Other (Net)...................................... -3,268 - - - - - - -
Total Appropriation......................................... 324,401 741 99,090 741 +1,000 - 100,090 741
Program 2016 Actual 2017 Annualized CR Inc. or Dec. FY 2018 Estimate
Project Statement
Obligations Detail and Staff Years (SYs)
(Dollars in thousands)
Trust Funds
Overview K-18
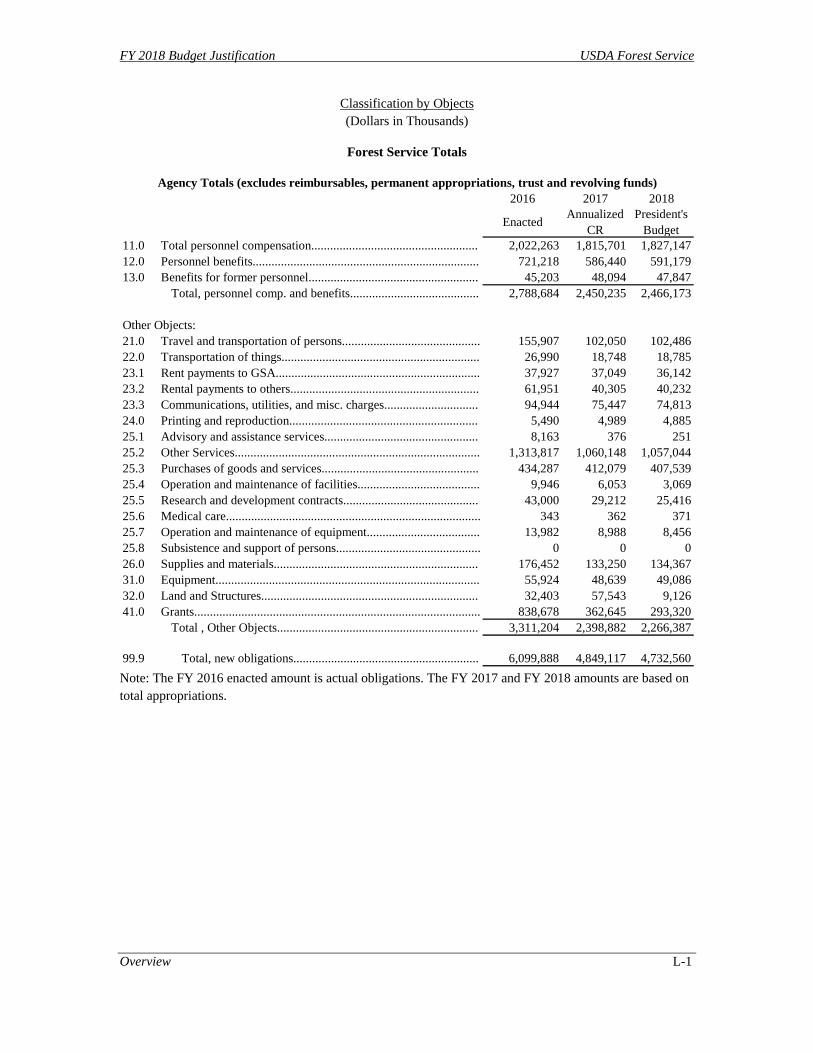
FY 2018 Budget Justification USDA Forest Service
Overview L-1
Classification by Objects (Dollars in Thousands)
Forest Service Totals
2016 2017 2018
Enacted Annualized
CRPresident's
Budget11.0 Total personnel compensation..................................................... 2,022,263 1,815,701 1,827,14712.0 Personnel benefits........................................................................ 721,218 586,440 591,17913.0 Benefits for former personnel...................................................... 45,203 48,094 47,847
Total, personnel comp. and benefits......................................... 2,788,684 2,450,235 2,466,173
Other Objects:21.0 Travel and transportation of persons............................................ 155,907 102,050 102,48622.0 Transportation of things............................................................... 26,990 18,748 18,78523.1 Rent payments to GSA................................................................. 37,927 37,049 36,14223.2 Rental payments to others............................................................ 61,951 40,305 40,23223.3 Communications, utilities, and misc. charges.............................. 94,944 75,447 74,81324.0 Printing and reproduction............................................................ 5,490 4,989 4,88525.1 Advisory and assistance services................................................. 8,163 376 25125.2 Other Services.............................................................................. 1,313,817 1,060,148 1,057,04425.3 Purchases of goods and services.................................................. 434,287 412,079 407,53925.4 Operation and maintenance of facilities....................................... 9,946 6,053 3,06925.5 Research and development contracts........................................... 43,000 29,212 25,41625.6 Medical care................................................................................. 343 362 37125.7 Operation and maintenance of equipment.................................... 13,982 8,988 8,45625.8 Subsistence and support of persons.............................................. 0 0 026.0 Supplies and materials................................................................. 176,452 133,250 134,36731.0 Equipment.................................................................................... 55,924 48,639 49,08632.0 Land and Structures..................................................................... 32,403 57,543 9,12641.0 Grants........................................................................................... 838,678 362,645 293,320
Total , Other Objects................................................................ 3,311,204 2,398,882 2,266,387
99.9 Total, new obligations........................................................... 6,099,888 4,849,117 4,732,560
Agency Totals (excludes reimbursables, permanent appropriations, trust and revolving funds)
Note: The FY 2016 enacted amount is actual obligations. The FY 2017 and FY 2018 amounts are based on total appropriations.

FY 2018 Budget Justification USDA Forest Service
Overview L-2
Classification by Objects (Dollars in Thousands)
Forest and Rangeland Research
11.0 Total personnel compensation..................................................... 148,123 145,563 129,80212.0 Personnel benefits........................................................................ 50,700 45,232 40,33513.0 Benefits for former personnel...................................................... 994 1,738 1,550
Total, personnel comp. and benefits......................................... 199,817 192,533 171,687
Other Objects:21.0 Travel and transportation of persons............................................ 7,953 6,634 5,91622.0 Transportation of things............................................................... 1,988 1,735 1,54723.1 Rent payments to GSA................................................................. 3,976 4,420 3,94223.2 Rental payments to others............................................................ 3,976 3,281 2,92523.3 Communications, utilities, and misc. charges.............................. 6,959 6,153 5,48724.0 Printing and reproduction............................................................ 994 677 60425.1 Advisory and assistance services................................................. 25 30 2725.2 Other Services.............................................................................. 20,876 17,950 16,00625.3 Purchases of goods and services.................................................. 19,882 14,653 13,06625.4 Operation and maintenance of facilities....................................... 994 215 19225.5 Research and development contracts........................................... 40,759 25,721 22,93625.6 Medical care................................................................................. 4 5 425.7 Operation and maintenance of equipment.................................... 994 1,090 97225.8 Subsistence and support of persons.............................................. 0 0 026.0 Supplies and materials................................................................. 6,959 5,352 4,77331.0 Equipment.................................................................................... 5,965 2,855 2,54632.0 Land and Structures..................................................................... 45 46 4141.0 Grants........................................................................................... 10,935 7,097 6,328
Total , Other Objects................................................................ 133,284 97,914 87,313
99.9 Total, new obligations........................................................... 333,101 290,447 259,000
Note: The FY 2016 enacted amount is actual obligations. The FY 2017 and FY 2018 amounts are based on total appropriations.

FY 2018 Budget Justification USDA Forest Service
Overview L-3
Classification by Objects (Dollars in Thousands)
State and Private Forestry 2016 2017 2018
Enacted Annualized
CRPresident's
Budget11.0 Total personnel compensation..................................................... 43,899 40,152 20,02912.0 Personnel benefits........................................................................ 14,944 12,046 6,00913.0 Benefits for former personnel...................................................... 248 265 132
Total, personnel comp. and benefits......................................... 59,091 52,463 26,170
Other Objects:21.0 Travel and transportation of persons............................................ 3,736 3,273 1,63222.0 Transportation of things............................................................... 0 437 21823.1 Rent payments to GSA................................................................. 1,868 1,403 70023.2 Rental payments to others............................................................ 934 710 35423.3 Communications, utilities, and misc. charges.............................. 1,868 1,535 76624.0 Printing and reproduction............................................................ 0 284 14125.1 Advisory and assistance services................................................. 0 75 3725.2 Other Services.............................................................................. 16,812 13,760 6,86425.3 Purchases of goods and services.................................................. 11,208 6,381 3,18325.4 Operation and maintenance of facilities....................................... 0 27 1325.5 Research and development contracts........................................... 0 2,264 1,12925.6 Medical care................................................................................. 0 1 125.7 Operation and maintenance of equipment.................................... 0 124 6225.8 Subsistence and support of persons.............................................. 0 0 026.0 Supplies and materials................................................................. 1,868 1,724 86031.0 Equipment.................................................................................... 1,868 598 29832.0 Land and Structures..................................................................... 0 10 541.0 Grants........................................................................................... 141,973 151,505 75,575
Total , Other Objects................................................................ 182,135 184,110 91,840
99.9 Total, new obligations........................................................... 241,226 236,573 118,010 Note: The FY 2016 enacted amount is actual obligations. The FY 2017 and FY 2018 amounts are based on total appropriations.

FY 2018 Budget Justification USDA Forest Service
Overview L-4
Classification by Object (Dollars in Thousands)
National Forest System
2016 2017 2018
Enacted Annualized
CRPresident's
Budget11.0 Total personnel compensation..................................................... 736,226 716,023 830,54212.0 Personnel benefits........................................................................ 282,320 249,396 289,28413.0 Benefits for former personnel...................................................... 6,983 11,270 13,073
Total, personnel comp. and benefits......................................... 1,025,529 976,689 1,132,899
Other Objects:21.0 Travel and transportation of persons............................................ 44,892 28,069 32,55922.0 Transportation of things............................................................... 9,976 8,419 9,76523.1 Rent payments to GSA................................................................. 13,966 15,190 17,61923.2 Rental payments to others............................................................ 20,950 13,024 15,10723.3 Communications, utilities, and misc. charges.............................. 32,921 28,760 33,36024.0 Printing and reproduction............................................................ 2,993 2,611 3,02925.1 Advisory and assistance services................................................. 1,995 91 10525.2 Other Services.............................................................................. 177,572 170,614 197,90125.3 Purchases of goods and services.................................................. 162,608 154,410 179,10625.4 Operation and maintenance of facilities....................................... 1,995 936 1,08625.5 Research and development contracts........................................... 249 654 75825.6 Medical care................................................................................. 100 117 13625.7 Operation and maintenance of equipment.................................... 4,988 3,256 3,77725.8 Subsistence and support of persons.............................................. 0 0 026.0 Supplies and materials................................................................. 33,918 31,597 36,65131.0 Equipment.................................................................................... 23,942 21,756 25,23532.0 Land and Structures..................................................................... 455 455 52841.0 Grants........................................................................................... 64,844 49,847 57,819
Total , Other Objects................................................................ 598,364 529,807 614,543
99.9 Total, new obligations........................................................... 1,623,893 1,506,496 1,747,442
Note: The FY 2016 enacted amount is actual obligations. The FY 2017 and FY 2018 amounts are based on total appropriations.
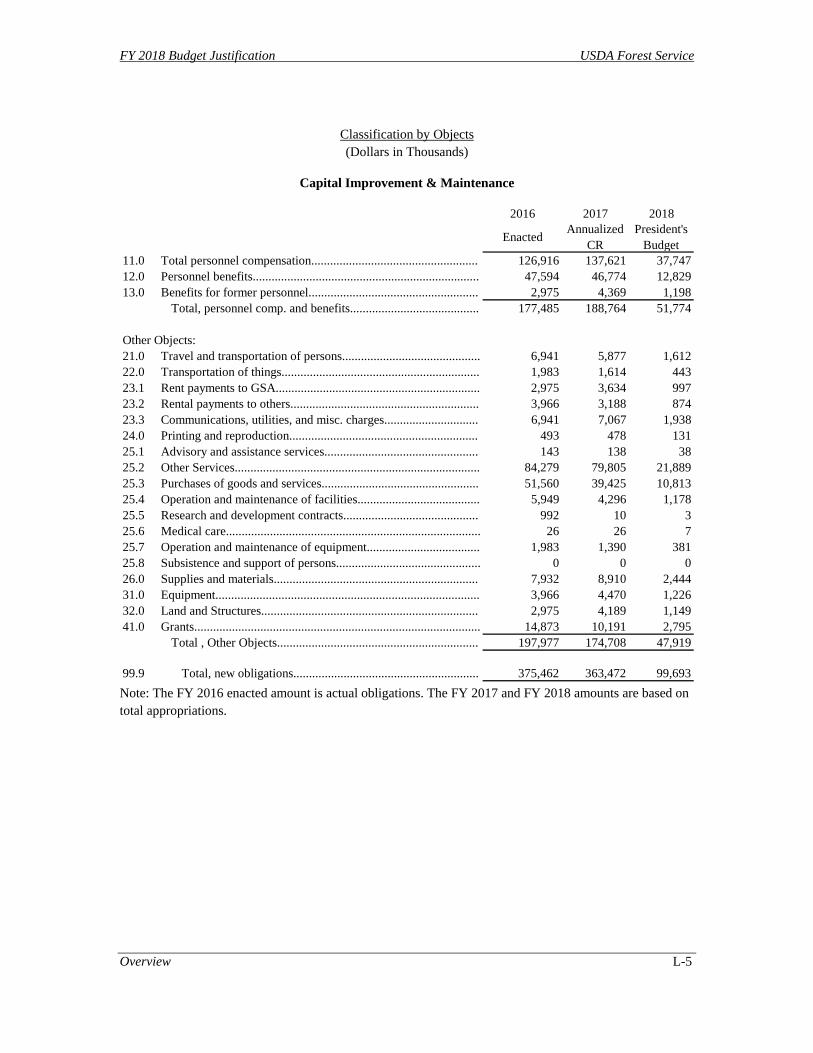
FY 2018 Budget Justification USDA Forest Service
Overview L-5
Classification by Objects (Dollars in Thousands)
Capital Improvement & Maintenance
2016 2017 2018
Enacted Annualized
CRPresident's
Budget11.0 Total personnel compensation..................................................... 126,916 137,621 37,74712.0 Personnel benefits........................................................................ 47,594 46,774 12,82913.0 Benefits for former personnel...................................................... 2,975 4,369 1,198
Total, personnel comp. and benefits......................................... 177,485 188,764 51,774
Other Objects:21.0 Travel and transportation of persons............................................ 6,941 5,877 1,61222.0 Transportation of things............................................................... 1,983 1,614 44323.1 Rent payments to GSA................................................................. 2,975 3,634 99723.2 Rental payments to others............................................................ 3,966 3,188 87423.3 Communications, utilities, and misc. charges.............................. 6,941 7,067 1,93824.0 Printing and reproduction............................................................ 493 478 13125.1 Advisory and assistance services................................................. 143 138 3825.2 Other Services.............................................................................. 84,279 79,805 21,88925.3 Purchases of goods and services.................................................. 51,560 39,425 10,81325.4 Operation and maintenance of facilities....................................... 5,949 4,296 1,17825.5 Research and development contracts........................................... 992 10 325.6 Medical care................................................................................. 26 26 725.7 Operation and maintenance of equipment.................................... 1,983 1,390 38125.8 Subsistence and support of persons.............................................. 0 0 026.0 Supplies and materials................................................................. 7,932 8,910 2,44431.0 Equipment.................................................................................... 3,966 4,470 1,22632.0 Land and Structures..................................................................... 2,975 4,189 1,14941.0 Grants........................................................................................... 14,873 10,191 2,795
Total , Other Objects................................................................ 197,977 174,708 47,919
99.9 Total, new obligations........................................................... 375,462 363,472 99,693 Note: The FY 2016 enacted amount is actual obligations. The FY 2017 and FY 2018 amounts are based on total appropriations.
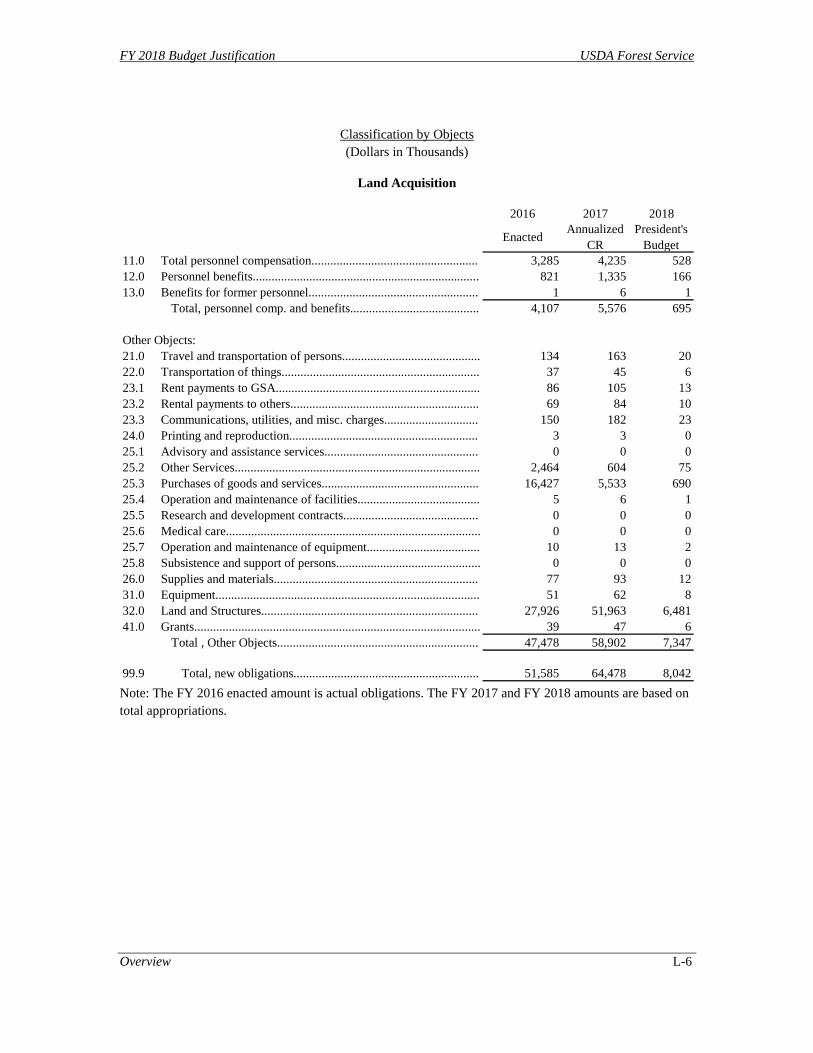
FY 2018 Budget Justification USDA Forest Service
Overview L-6
Classification by Objects (Dollars in Thousands)
Land Acquisition
2016 2017 2018
Enacted Annualized
CRPresident's
Budget11.0 Total personnel compensation..................................................... 3,285 4,235 52812.0 Personnel benefits........................................................................ 821 1,335 16613.0 Benefits for former personnel...................................................... 1 6 1
Total, personnel comp. and benefits......................................... 4,107 5,576 695
Other Objects:21.0 Travel and transportation of persons............................................ 134 163 2022.0 Transportation of things............................................................... 37 45 623.1 Rent payments to GSA................................................................. 86 105 1323.2 Rental payments to others............................................................ 69 84 1023.3 Communications, utilities, and misc. charges.............................. 150 182 2324.0 Printing and reproduction............................................................ 3 3 025.1 Advisory and assistance services................................................. 0 0 025.2 Other Services.............................................................................. 2,464 604 7525.3 Purchases of goods and services.................................................. 16,427 5,533 69025.4 Operation and maintenance of facilities....................................... 5 6 125.5 Research and development contracts........................................... 0 0 025.6 Medical care................................................................................. 0 0 025.7 Operation and maintenance of equipment.................................... 10 13 225.8 Subsistence and support of persons.............................................. 0 0 026.0 Supplies and materials................................................................. 77 93 1231.0 Equipment.................................................................................... 51 62 832.0 Land and Structures..................................................................... 27,926 51,963 6,48141.0 Grants........................................................................................... 39 47 6
Total , Other Objects................................................................ 47,478 58,902 7,347
99.9 Total, new obligations........................................................... 51,585 64,478 8,042
Note: The FY 2016 enacted amount is actual obligations. The FY 2017 and FY 2018 amounts are based on total appropriations.

FY 2018 Budget Justification USDA Forest Service
Overview L-7
Classification by Objects (Dollars in Thousands)
Other Appropriations (Range Betterment, Subsistence, & Research Gifts & Donations)
Enacted Annualized
CRPresident's
Budget11.0 Total personnel compensation..................................................... 852 2,062 1,84112.0 Personnel benefits........................................................................ 852 745 66513.0 Benefits for former personnel...................................................... 3 4 4
Total, personnel comp. and benefits......................................... 1,707 2,810 2,509
Other Objects:21.0 Travel and transportation of persons............................................ 255 299 26722.0 Transportation of things............................................................... 7 8 723.1 Rent payments to GSA................................................................. 57 67 6023.2 Rental payments to others............................................................ 57 67 6023.3 Communications, utilities, and misc. charges.............................. 107 125 11224.0 Printing and reproduction............................................................ 7 8 725.1 Advisory and assistance services................................................. 0 0 025.2 Other Services.............................................................................. 852 453 40525.3 Purchases of goods and services.................................................. 609 714 63825.4 Operation and maintenance of facilities....................................... 3 4 425.5 Research and development contracts........................................... 0 0 025.6 Medical care................................................................................. 0 0 025.7 Operation and maintenance of equipment.................................... 7 8 725.8 Subsistence and support of persons.............................................. 0 0 026.0 Supplies and materials................................................................. 1,703 89 7931.0 Equipment.................................................................................... 133 156 13932.0 Land and Structures..................................................................... 2 2 241.0 Grants........................................................................................... 38 45 40
Total , Other Objects................................................................ 3,837 2,046 1,826
99.9 Total, new obligations........................................................... 5,544 4,856 4,335
Note: The FY 2016 enacted amount is actual obligations. The FY 2017 and FY 2018 amounts are based on total appropriations.

FY 2018 Budget Justification USDA Forest Service
Overview L-8
Classification by Objects (Dollars in Thousands)
Wildland Fire Management (including FLAME)
2016 2017 2018
Enacted Annualized
CRPresident's
Budget11.0 Total personnel compensation..................................................... 962,962 770,047 806,65912.0 Personnel benefits........................................................................ 323,987 230,912 241,89013.0 Benefits for former personnel...................................................... 33,999 30,442 31,889
Total, personnel comp. and benefits......................................... 1,320,948 1,031,400 1,080,438
Other Objects:21.0 Travel and transportation of persons............................................ 91,996 57,734 60,47922.0 Transportation of things............................................................... 12,999 6,491 6,79923.1 Rent payments to GSA................................................................. 14,999 12,231 12,81223.2 Rental payments to others............................................................ 31,999 19,952 20,90023.3 Communications, utilities, and misc. charges.............................. 45,998 31,623 33,12724.0 Printing and reproduction............................................................ 1,000 928 97225.1 Advisory and assistance services................................................. 6,000 41 4325.2 Other Services.............................................................................. 1,010,962 776,963 813,90425.3 Purchases of goods and services.................................................. 171,993 190,963 200,04225.4 Operation and maintenance of facilities....................................... 1,000 569 59625.5 Research and development contracts........................................... 1,000 563 59025.6 Medical care................................................................................. 213 212 22325.7 Operation and maintenance of equipment.................................... 6,000 3,107 3,25525.8 Subsistence and support of persons.............................................. 0 0 026.0 Supplies and materials................................................................. 123,995 85,484 89,54831.0 Equipment.................................................................................... 19,999 18,742 19,63332.0 Land and Structures..................................................................... 1,000 878 92041.0 Grants........................................................................................... 605,976 143,914 150,75742.0 Insurance Claims and Indemnities............................................... 1,000 1,000 1,000
Total , Other Objects................................................................ 2,148,129 1,351,395 1,415,600
99.9 Total, new obligations........................................................... 3,469,077 2,382,795 2,496,038
Note: The FY 2016 enacted amount is actual obligations. The FY 2017 and FY 2018 amounts are based on total appropriations.
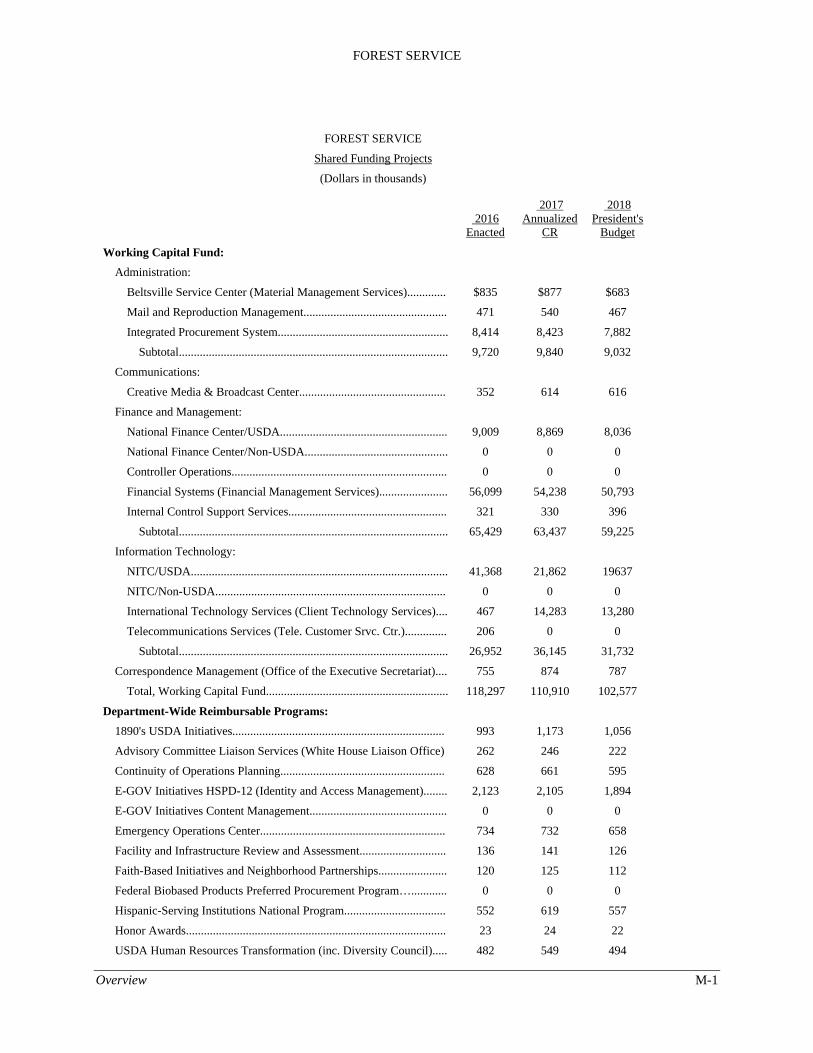
FOREST SERVICE
Overview M-1
FOREST SERVICE
Shared Funding Projects
(Dollars in thousands)
2016 Enacted
2017 Annualized
CR
2018 President's
Budget
Working Capital Fund:
Administration:
Beltsville Service Center (Material Management Services)............. $835 $877 $683
Mail and Reproduction Management................................................ 471 540 467
Integrated Procurement System......................................................... 8,414 8,423 7,882
Subtotal.......................................................................................... 9,720 9,840 9,032
Communications:
Creative Media & Broadcast Center................................................. 352 614 616
Finance and Management:
National Finance Center/USDA........................................................ 9,009 8,869 8,036
National Finance Center/Non-USDA................................................ 0 0 0
Controller Operations........................................................................ 0 0 0
Financial Systems (Financial Management Services)....................... 56,099 54,238 50,793
Internal Control Support Services..................................................... 321 330 396
Subtotal.......................................................................................... 65,429 63,437 59,225
Information Technology:
NITC/USDA...................................................................................... 41,368 21,862 19637
NITC/Non-USDA............................................................................. 0 0 0
International Technology Services (Client Technology Services).... 467 14,283 13,280
Telecommunications Services (Tele. Customer Srvc. Ctr.).............. 206 0 0
Subtotal.......................................................................................... 26,952 36,145 31,732
Correspondence Management (Office of the Executive Secretariat).... 755 874 787
Total, Working Capital Fund............................................................. 118,297 110,910 102,577
Department-Wide Reimbursable Programs:
1890's USDA Initiatives....................................................................... 993 1,173 1,056
Advisory Committee Liaison Services (White House Liaison Office) 262 246 222
Continuity of Operations Planning....................................................... 628 661 595
E-GOV Initiatives HSPD-12 (Identity and Access Management)........ 2,123 2,105 1,894
E-GOV Initiatives Content Management.............................................. 0 0 0
Emergency Operations Center.............................................................. 734 732 658
Facility and Infrastructure Review and Assessment............................. 136 141 126
Faith-Based Initiatives and Neighborhood Partnerships....................... 120 125 112
Federal Biobased Products Preferred Procurement Program…............ 0 0 0
Hispanic-Serving Institutions National Program.................................. 552 619 557
Honor Awards....................................................................................... 23 24 22
USDA Human Resources Transformation (inc. Diversity Council)..... 482 549 494
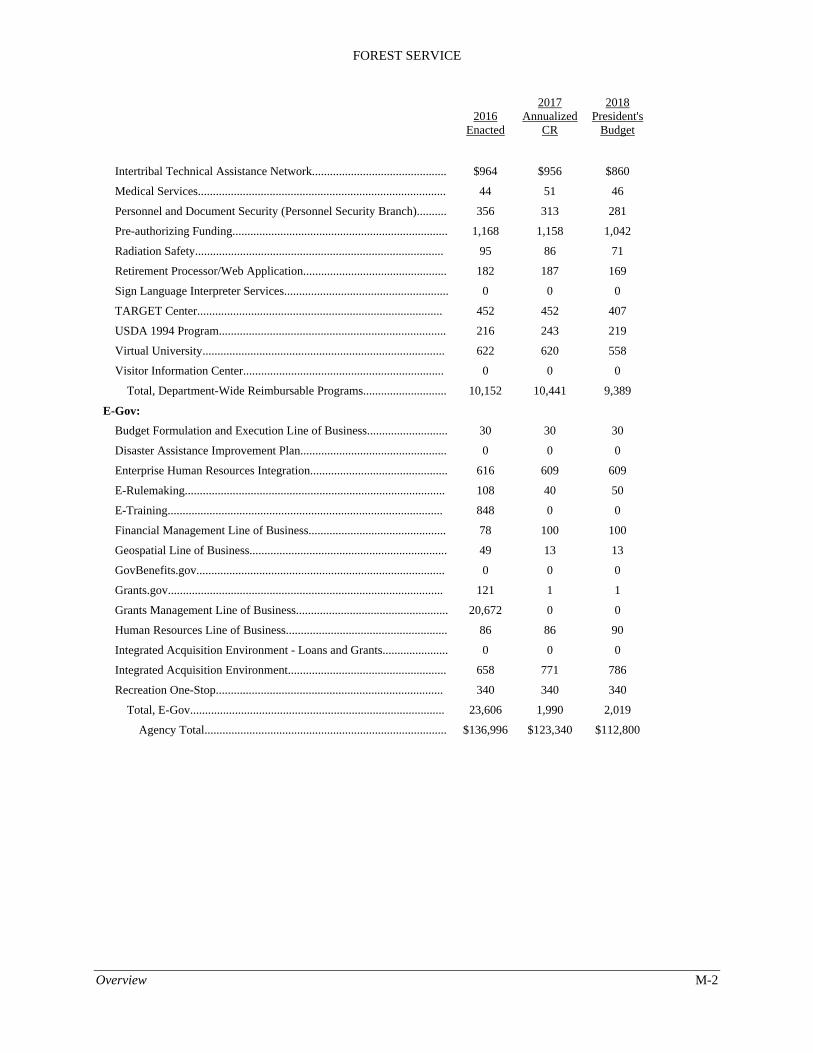
FOREST SERVICE
Overview M-2
Intertribal Technical Assistance Network.............................................
2016 Enacted
$964
2017 Annualized
CR
$956
2018 President's
Budget
$860
Medical Services................................................................................... 44 51 46
Personnel and Document Security (Personnel Security Branch).......... 356 313 281
Pre-authorizing Funding........................................................................ 1,168 1,158 1,042
Radiation Safety................................................................................... 95 86 71
Retirement Processor/Web Application................................................ 182 187 169
Sign Language Interpreter Services....................................................... 0 0 0
TARGET Center.................................................................................. 452 452 407
USDA 1994 Program............................................................................ 216 243 219
Virtual University................................................................................. 622 620 558
Visitor Information Center................................................................... 0 0 0
Total, Department-Wide Reimbursable Programs............................ 10,152 10,441 9,389
E-Gov:
Budget Formulation and Execution Line of Business........................... 30 30 30
Disaster Assistance Improvement Plan................................................. 0 0 0
Enterprise Human Resources Integration.............................................. 616 609 609
E-Rulemaking....................................................................................... 108 40 50
E-Training............................................................................................ 848 0 0
Financial Management Line of Business.............................................. 78 100 100
Geospatial Line of Business.................................................................. 49 13 13
GovBenefits.gov................................................................................... 0 0 0
Grants.gov............................................................................................ 121 1 1
Grants Management Line of Business................................................... 20,672 0 0
Human Resources Line of Business...................................................... 86 86 90
Integrated Acquisition Environment - Loans and Grants...................... 0 0 0
Integrated Acquisition Environment..................................................... 658 771 786
Recreation One-Stop............................................................................ 340 340 340
Total, E-Gov..................................................................................... 23,606 1,990 2,019
Agency Total................................................................................. $136,996 $123,340 $112,800