Embed Size (px)
Citation preview

FY 2020 RESULTSAND OUTLOOK

2
HIGHLIGHTS
2020 RESULTS
STRATEGY
OUTLOOK
01
02
03
04
05
2020 ACHIEVEMENTS

Sales€38.1bn
-10.4% -3.8%
actual
Operating income
€2,855m -15.8% -12.3%
Op. margin 7.5%, -50 bps
Free cash flow
€3,044m
like-for-like
Recurring net income€1,470mEPS €2.74, -22.4%
-23.2%
2020 RESULTS PRESENTATION
-2.5% +4.8%
+15.8% +22.4%
+23.4%
H2-20202020
+63.9%
3 /
actual like-for-like
actual actual
Op. margin 10.0%, +160 bps
-9.3%EBITDA
€4,415m+13.3%
EBITDA margin 11.6%, +20 bps EBITDA margin 13.7%, +200 bps

Responsible management of the health crisis with regard to all of the Group’s stakeholders
Solid achievements in ESG, with new commitments for 2030:
2030 CO2 targets validated by the SBT* initiative, reduction of 4% in our CO2 emissions
compared to 2019, internal carbon price increased to €50/t
10Mt of raw materials not extracted thanks to our efforts in support of the circular economy
Record employee engagement score of 82%
Target of 25% of women in managerial roles within the Group met in 2020
Successful completion of “Transform & Grow”:
Recurring and structural savings of €250 million at the end of 2020, meeting the target a
year earlier than planned
Portfolio optimization: completed or signed divestments represent sales of more than €4.6bn,
with a positive impact on the operating margin
4 / 2020 RESULTS PRESENTATION* Science-Based Targets

Strong 4.8% organic growth in H2, accelerating to 6.4% in Q4
Sharp rebound in operating income in H2 2020, up 22.4% like-for-like, with a record operating
margin of 10% (up 160 bps versus H2 2019)
Record recurring net income in H2, up 23.4% to €1,198 million
Increase of 20 bps in EBITDA margin to 11.6% over the full year, and increase of 200 bps in H2
Record free cash flow of €3,044 million in 2020, up 64%
Sharp decrease in net debt: €7.2 billion at end-December 2020, compared to €10.5 billion at end-
December 2019
5 / 2020 RESULTS PRESENTATION

HIGHLIGHTS
2020 RESULTS
STRATEGY
OUTLOOK
01
02
03
04
05
2020 ACHIEVEMENTS

7 /
Health
protection
Financial
strength
21
Barrier gestures in our
plants, offices, distribution
outlets
New ways of working
€250m “Transform & Grow”
savings delivered
Fast action on several
initiatives for additional
savings
Cost
savings
Strong balance sheet
Selective Capex
Best-in-class cash
generation and conversion
3
2020 RESULTS PRESENTATION

2020 RESULTS PRESENTATION8 /
1. Philanthropy and sponsorship: in kind or in value
2. % of participants who “totally agree” with 4 engagement-
related questions; 7pt above benchmark
3. Absolute reduction to 10.4Mt (10Mt at constant scope), on
track to deliver a 33% reduction by 2030
Saint-Gobain
employee
engagement
Index2
+3pt vs. 2019
Women
managers
+1.2ptvs. 2019
Scope 1 + 2 CO2
emissions
vs. 20193
Revised internal
carbon price
for Capex
Reduction in non-
recovered waste
vs. 2019
Group accident
frequency rate
TRAR
-0.4vs. 2019
Avoided extractions
of raw material
extracted
Actions for our
communities1
Production lines
for surgical masksin France, USA,
Brazil & China
+€20 vs. 2019
-22% vs. 2017

THANK YOU TO ALL OUR TEAMS
FOR STANDING
UNITED& SHOWING
SOLIDARITYTHROUGHOUT
THE CRISIS
9 / 2020 RESULTS PRESENTATION

10 / 2020 RESULTS PRESENTATION
TECHNOLOGICAL NICHES SUPPORTING
OUR INNOVATION
OUR CUSTOMERS
CONSOLIDATION OF LEADERSHIP POSITIONS TO BETTER SERVE
SELECTIVE REINFORCEMENT OF
OUR FOOTPRINT
ON NEW PROMISING MARKETS
Growth Capex deployment
in the context of the pandemic
13 acquisitions in 2020
Logistics center in
Nordics Distribution
New Life Sciences
capacities in the USA
Coater jumbo startup
for Glass in Poland
Technical textiles capacity
in Czech Republic
Plaster plants in India
and China
Construction chemical
plant in Chile
€1.7bn invested in acquisitions and growth Capex
Isonat woodfiber insulation
expansion in France
Digital services in
Distribution for tradespeople

Making Saint-Gobain stronger
11 / 2020 RESULTS PRESENTATION

LEAN, AGILE, PERFORMANCE-DRIVEN CUSTOMER CENTRIC
Application
synergies
Sales
channel
synergies
• Incentivized country / market CEOs • 100% of bonus aligned to country / market
performance (operating income, cash flow, return)
• One line of command & simplification of all
business processes
• Nurturing “Trust, Empowerment,
Collaboration” culture at all levels
Accountability
Ownership
90%
CEOs native
to their country
November 2020 group-wide employee survey
+4pt vs. 2019
Managers say T&G will
improve Saint-Gobain’s
growth 32 78%
12 / 2020 RESULTS PRESENTATION
Improvement in
Employee Net
Promoter score
(eNPS)1
1. eNPS estimated as sum of (positive responses – negative responses) to the question
“I would recommend my company to friends & family”
+10pt vs. 2019
Intermediation platform for renovation in France,
building construction ecosystem in Brazil
Ceilings & Acoustics business in Brazil,
Saint-Gobain Solutions in France
Common technical referral teams;
integrated approach to DIY
Recycling initiatives linking distribution
& local manufacturing plants

H2
H1
2019 2020 Total
35
80
85
50
€120m€130m
Cost savings delivered 1 year ahead of schedule
Streamlined organizations
Country/market synergies
& optimization
Leaner central and support
functions
13 / 2020 RESULTS PRESENTATION
Asia-Pacific
Americas
High Performance Solutions
Europe & central functions

€4.6bn sales divested (closed or signed)
since T&G launch
€740m sales acquired
since T&G launch
• 31 transactions of which 13 acquisitions closed in 2020
• Driven by country CEO portfolio reviews
• 26 transactions of which 7 divestments closed in 2020
• €1.3bn sales closed or signed in 2020
~3%
Average profitability
>20%EBITDA/sales
Average profitability
Value creation at the heart of management practices
EBITDA/sales
Technological niches New geographiesConsolidation
14 / 2020 RESULTS PRESENTATION
Sales divested* Sales acquired
* closed

Integration ahead of plan, exceeding expectations…
• Management and teams successfully integrated,
synergies delivered faster than expected despite
operational impact of the Covid crisis: US$ 20m
• Value creation on track for Year 3
* 2020 estimated over 12 months (consolidated over 11 months as of February)
…sharp increase in housing starts
Source: US Census Bureau, US department of Housing15 / 2020 RESULTS PRESENTATION
EBITDA incl. synergies
Above US$ 110m
objective
23%
H2-2019
21%26%
H1-2020 H2-2020
Q4 2019 Q1 2020 Q2 2020 Q3 2020 Q4 2020
1.20At acquisition date
1.711.46
1.07
Housing starts,
annualized rate (million)

H2-2018 8.1% Restated operating income margin post-IFRS 16 at T&G launch
Portfolio +55 bps €3.4bn sales divested, profitable acquisitions for €740m sales
Cost structure +60 bps T&G savings
Exceptional +50 bps Price-cost spread, discretionary savings, net of additional Covid costs
Volume & mix +25 bps +3.4% volume growth, negative mix evolution on HPS, FX effect
H2-2020 10.0%
Operating margin reconciliation
16 / 2020 RESULTS PRESENTATION
Operating margin improvement in 2021
of more than 100 bps vs. 2018

HIGHLIGHTS
STRATEGY
OUTLOOK
01
02
03
04
05
2020 ACHIEVEMENTS
2020 RESULTS
A. GROUP
B. SEGMENTS

18 /
41 761H2-2019sales
Exchangerates
Structure Price Volumes H2-2020sales
20,896
(€m)
20,364
(€m)
+1.4%
-3.2%
-2.5%
-4.1%
+3.4%
H2
+4.8%like-for-like
Exchange rates: depreciation of the
Brazilian real and other emerging
country currencies, the US dollar and
the Norwegian krone
Structure: divestments as part of
“Transform & Grow” and acquisition of
Continental Building Products
2020 RESULTS PRESENTATION
41 7612019 sales Exchangerates
Structure Price Volumes 2020 sales
42,573
(€m)
38,128
(€m)-3.8%like-for-like
+0.9%
-3.9%-4.7%
-10.4%-2.7%FULL YEAR

+0.6% +0.2%
+0.9% +1.8%-5.5%
-19.4%
+2.3%
+4.6%
Q1-2020/ Q2-2020/ Q3-2020/ Q4-2020/ Q1-2019 Q2-2019 Q3-2019 Q4-2019
+6.4%
-4.9%
-19.2%
+3.2%
H1/H1: -12.3% H2/H2: +4.8%
2020 RESULTS PRESENTATION19 /
Volumes Prices
Upward trends in sales prices
generating a positive price-cost spread
Good momentum in volumes, reinforced
in the post-pandemic period by increased
demand on the renovation market

3,390
2,855
2019 2020
8.0% 7.5%
-15.8%actual
2020 RESULTS PRESENTATION
H21,752 2,028 +15.8%
8.4% 10.0% +160bps
Sharp rebound in H2 of 22.4% like-for-like; record operating margin of 10% (up 160 bps versus H2 2019)
Positive price-cost spread ~ +€160m, of which €110m in H2
Strong action on costs, with €690m in cost savings in 2020
20 /

“Transform & Grow” structural savings
€130m in 2020,
on top of €120m in 2019
Operational excellence program
to compensate for cost inflation
€320m in 2020 (vs. €310m in 2019)
€320m
2020
H2
H1
2020
80
50
€130m
* €150m additional savings in 2021
Savings related to Covid crisis
€240m in 2020, of which €80m in H2
Reduction in discretionary
spending
50*
80
110
€240m
2020
Net impact of partial
unemployment
Savings to lower the break-even
point of Covid-affected
businesses
21 /2020 RESULTS PRESENTATION

22 /
1,5141,638
827
1,6931,752
2,028
H1-2018 H1-2019 H1-2020 H2-2018 H2-2019 H2-2020
4.7% 8.4%
2020 RESULTS PRESENTATION
8.1% 10.0%7.3% 7.6%
2018 restated for IFRS 16

23 /2020 RESULTS PRESENTATION
€m2019 2020
2020/2019
H2-2020/H2-2019
Operating income 3,390 2,855 -15.8% +15.8%
Non-operating costs (421) (342)
Disposal gains (losses) and impacts resultingfrom changes in Group structure
(13) (58)
Asset write-downs and other (403) (1,023)
Business income 2,553 1,432 -43.9% +13.9%
Operating income 3,390 2,855 -15.8% +15.8%
Operating depreciation and amortization 1,901 1,902
Non-operating costs (421) (342)
EBITDA 4,870 4,415 -9.3% +13.3%
EBITDA margin 11.4% 11.6% +20 bps +200 bps
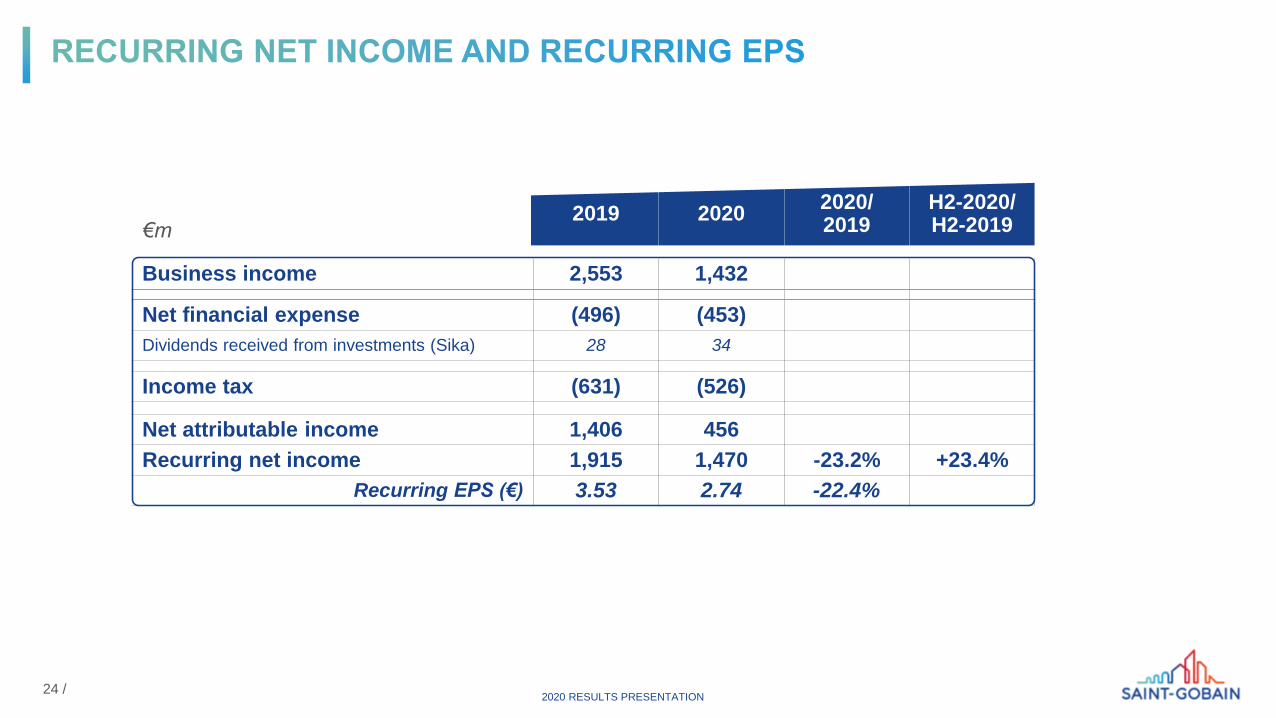
€m2019 2020
2020/2019
H2-2020/H2-2019
Business income 2,553 1,432
Net financial expense (496) (453)
Dividends received from investments (Sika) 28 34
Income tax (631) (526)
Net attributable income 1,406 456
Recurring net income 1,915 1,470 -23.2% +23.4%
Recurring EPS (€) 3.53 2.74 -22.4%
24 /2020 RESULTS PRESENTATION

25 /
3,740
3,044
+1,148
-453
-526
-865
2020EBITDA*
Finance costsexcl. Sikadividends
Tax Capital expenditureexcl. additional
capacity**
Change in WCRover a 12-month
period
Free cash flow
2019: €4,188m €1,857m
FCF conversion: 81%
FCF conversion: 44%
+64%
2020 RESULTS PRESENTATION
** Capital expenditure = €1,236m, including €371m in additional capacity investments linked to organic growth
* EBITDA less depreciation of right-of-use assets: €4,415m - €675m = €3,740m (versus €4,188m in 2019)

26 /
* €0.15bn reduction in net debt at December 31, 2020 relating to debt carried by entities in the process of being sold.
** Before IFRS 16: estimates.
10.5
7.2*
19.818.2
12-2019 12-2020
before IFRS 16** after IFRS 16
7.3
4.1
20.018.4
12-2019 12-2020
Net debt
Shareholders’ equity
Net debt/shareholders’ equity 36% 22% 53% 39%
Net debt/EBITDA 1.8 1.1 2.2 1.6
2020 RESULTS PRESENTATION

27 /
21.8%
11.9%
22.0%
11.3%
ROI ROCE
2019
2020
before IFRS 16 after IFRS 16
18.7%
11.1%
18.4%
10.4%
ROI ROCE
2019
2020
2020 RESULTS PRESENTATION

HIGHLIGHTS
STRATEGY
OUTLOOK
01
02
03
04
05
2020 ACHIEVEMENTS
2020 RESULTS
A. GROUP
B. SEGMENTS

96612.7%
6139.4%
H1-19 H2-19 H1-20 H2-20
13.0% 12.5%
Operating income (€m)
and margin (%)
2019 sales Exchangerates
Structure Price Volumes 2020 sales
Sales (€m)
-10.6%
+0.5%
7,584 6,544
-10.1%like-for-like
-13.7%actual
-0.2%
Mobility (7%): -13.3%Other industries (10%): -7.9%
-3.4%
o/w*:
29 /
-1.9%like-for-like
in H2
7.4% 11.1%
* Sales by segment: as a % of Group total and like-for-like growth
2020 RESULTS PRESENTATION

2019 sales Exchangerates
Structure Price Volumes 2020 sales
15,058 12,807
-14.9%actual
-10.0%
Nordics (14%): +2.8%UK (9%): -13.2%Germany (3%): -2.3%
o/w*:
-1.8%
-3.4%
+0.3%
-3.1%like-for-like
30 /
+2.0%like-for-like
in H2
9466.3%
7886.2%
H1-19 H2-19 H1-20 H2-20
6.0% 6.6% 4.2% 7.9%
Operating income (€m)
and margin (%)
Sales (€m)
* Sales by country: as a % of Group total and like-for-like growth
2020 RESULTS PRESENTATION

2019 sales Exchangerates
Structure Price Volumes 2020 sales
-3.2%
+1.1%
13,624 12,454
-8.6%actual
-4.9%like-for-like
France (24%): -4.7%Spain-Italy (4%): -8.5%
o/w*:
-6.0%
-0.5%
31 /
+6.7%like-for-like
in H2
7365.4%
6445.2%
H1-19 H2-19 H1-20 H2-20
5.0% 5.8% 1.7% 8.0%
Operating income (€m)
and margin (%)
Sales (€m)
* Sales by country: as a % of Group total and like-for-like growth
2020 RESULTS PRESENTATION

562
656
2019 2020
10.1% 11.5%
2019 sales Exchangerates
Structure Price Volumes 2020 sales
+7.2%
5,555 5,697
+2.6%actual
+4.7%like-for-like
North America (11%): +2.8%Latin America (4%): +8.8%
o/w*:
-9.3%
+2.3%
+2.4%
32 /
+15.7%like-for-like
in H2Operating income (€m)
and margin (%)
Sales (€m)
* Sales by country: as a % of Group total and like-for-like growth
2020 RESULTS PRESENTATION
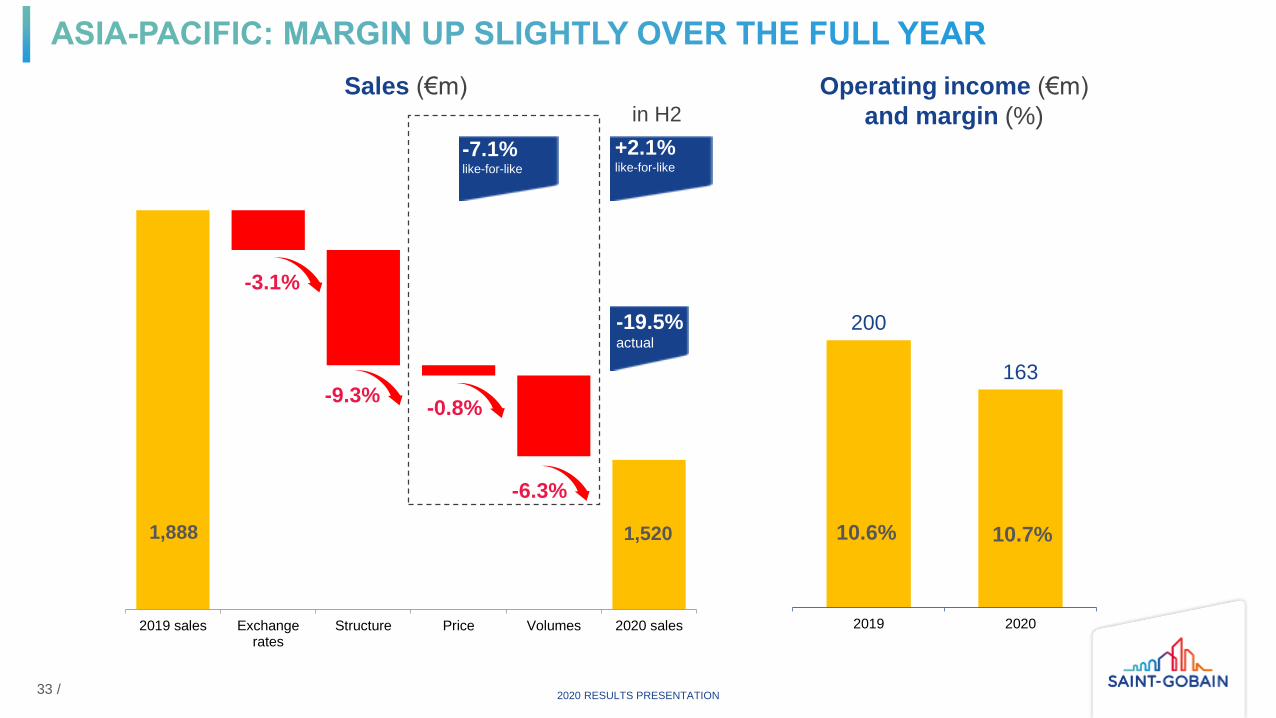
200
163
2019 2020
10.6% 10.7%
2019 sales Exchangerates
Structure Price Volumes 2020 sales
1,888 1,520
-19.5%actual
-9.3%
-7.1%like-for-like
-6.3%
-0.8%
-3.1%
33 /
+2.1%like-for-like
in H2
Operating income (€m)
and margin (%)
Sales (€m)
2020 RESULTS PRESENTATION

HIGHLIGHTS
2020 RESULTS
STRATEGY
OUTLOOK
01
02
03
04
05
2020 ACHIEVEMENTS

-40%decline in FDI*
>30%of the EU Recovery
Plan dedicated to
climate action
** % of European building material manufacturers. Source: The impact of COVID-19 on Construction, USP
* Foreign Direct Investments in 2020. Source: UNCTAD, June 2020
More local More sustainable
58% think that
construction will
become more digital**
More digital
THE WORLD IN 2021 AND BEYOND
2020 RESULTS PRESENTATION35 /
NET-ZERO CARBON
BY 2050
2020 RESULTS PRESENTATION
A- rating
36 /

Our achievements
Ethics
New managers trained in our
Principles of Conduct & Action
Compliance
New whistleblowing line
Responsible purchasing
Contracts with partner suppliers including
the supplier charter
Governance
Independent directors on Board
Board meetings in 2020
Creation of a CSR Board Committee
37 /
ESG criteria in executive long-term incentive plans
Total Recordable Accident Rate (TRAR)
-8.1 vs. 2010, -0.4 vs. 2019
Health & Safety for all employees
Main priority during pandemic:
Adapt our processes to insure safe interaction
amongst employees and with our suppliers, and
welcome our customers in strict compliance with
health measures
Health charter for our employees, clients,
suppliers and neighbors
Committed to durably reduce our TRAR
below 2 by 2025
For and with our stakeholders
Masks produced by Saint-Gobain on 4 production lines
2020 RESULTS PRESENTATION
Managers trained in anti-corruption

Our achievements
1. Environmental Product Declaration38 /
Contribute through our Products & Solutions
Worldwide leader for EPD1 in Construction
~1,300 verified EPD in 33 countries
Improve our operations & supply chain
CO2 emissions
Industrial water withdrawal, with no
discharge in drought areas
Of Product ranges subject to
Life Cycle Analyses
vs. 2017CO2 emissions Scope 1 + 2 CO2 emissions Scope 3
vs. 2017 emissions on an absolute basis
Scope 1+2: -4% vs. 2019 in real terms
kgCO2/€ of sales Electricity from
renewable sources
Water discharge
vs. 2019
TCFD climate scenarios published
2020 RESULTS PRESENTATION
Integrate recycled materials in our products
and solutions
Virgin raw materials avoided in 2020
Reduction of non-recovered waste
Create collection networks & services
Avoided virgin raw
materials
Recyclable packaging
vs. 2017
Non-recovered waste Recycled or bio-sourced
content on packaging
Collection points in our distribution network
vs. 2019
vs. 2017
2030 circular economy roadmap defined
SBTi validated

Our achievements
For and with our employees
With local communities as recognized trusted local partner
Employees responding to satisfaction survey
Shares held by employees (Group Savings Plan)
Employees received training in 2020
Diversity Index
Women managers
vs. 17.5% in 2010
Senior managers
vs. 5% in 2010
Increase diversity
Coverage of parental pillar of
“CARE by Saint-Gobain"
social protection program
For and with the families of our employees
Women on average on all our
business ExCos by 2025
Women on ExCo Women on Board
Engagement Index
Signed agreements
Donations for our communities
Employees involved in
formulation of purpose
Creation of 1st training apprenticeship center in France
39 /2020 RESULTS PRESENTATION
Engage our employees
Minimum share of women in recruiting
processes (40% in mature countries)

Roofing solutions
Refractories for high temp.Glazing solutions for mobility
Solid electrolytes for batteriesTechnical ceramics
CO2eq avoided
emissions thanks to our
insulation solutions
sold in 1 year1
Flooring solutions
1. Internal methodology developed in partnership with EY Sustainable Performance & Transformation: Avoided emissions calculated as difference between greenhouse gas emissions associated with product Life Cycle Analyses & gain unlocked by the
product vs. a reference basic solution multiplied by its lifespan (e.g 30 years for insulation, 50 for glass). Reference solution & scenario defined for each product in portfolio
For our processes: CO2 commitments toward carbon neutrality
2020 2030 2050
Internal carbon prices increased:
€50 for investment,
€150 for R&D
Absolute emissions reduction vs. 2017
-33%Scope 1 + 2
-16%Scope 3
For our customers: solutions for sustainability & performance
Insulation systems
Lightweight façade solutions
-1,200Mt
2030 targets SBT-validated
2020 RESULTS PRESENTATION40 /

LIGHT
CONSTRUCTION
ENERGY
EFFICIENCY
END-TO-END
SOLUTIONS
Sustainability & Performance
41 /2020 RESULTS PRESENTATION

12
43
5
1Mechanical ventilation
External thermal insulation
composite systems (ETICS)
Glass wool, wood fiber
Double-glazed windows
Heat pump, thermodynamic
boiler, water radiators
2
3
4
5
Energy-efficient renovation of a single-family house in France
+136% “Energy renovation”
key words web
search1
1. Google trends Sept-Dec 2020 vs. 2019 2. USP survey
3. Euroconstruct 4. 2020 vs. 2019 internal data
88% People spend more
time at home since
the pandemic2
€600bnAnnual EU spend on
renovation3
+89%Visitors on
Saint-Gobain
renovation website4
72% of buildings in
Europe to be
renovated by 2050
100% solutions manufactured or distributed by Saint-Gobain
6
6
Intermediation with end customer
-88 % *Potential maximum yearly
energy expense reduction
+4classes
Energy performance analysis
x2 objective Annual renovation
rate in the EU
2020 RESULTS PRESENTATION
Saint-Gobain, the one-stop-shop for renovation
42 / * Calculations for a single-family house built between 1948 and 1974
based on the French report to the European Commission

2xExpected increase
in people over 60 by
20501
1. OECD 2. United Nations DESA 3. WHO
4. PR Newswire data for 2017-2022 period 5. Bizenergy Advisor
2/3 Share of world
population in urban
areas by 20502
+3.6%Expected 5y growth
in surgeries
performed4
340kWh Average yearly electricity
use /m² in a hospital
in the USA5
3%Target for yearly
public building
renovation
Health, shock
resilience and
acoustic
performance:
partitions,
ceilings,
and X-ray
plasterboards
Visual and thermal
comfort:
architectural membranes,
Sage electrochromic
glass
Air quality1
2
3
5
6
7
12
3
6
7
54
4
Upstream project
assistance:
prescription, BIM
8
8
Renovation of a hospital
Saint-Gobain, the one-stop-shop for
Sustainability & Performance
-20% * Energy consumption* Example of Montfermeil renovation in France -
also includes savings enabled by consumption
monitoring through captors
-11% * Potential reduction in
length of patient stays
* Building 4 People report published by BPIE
(Building Performance Institute Europe)
2bn/ yearAvg EIB investment in
healthcare infrastructure
and innovation3
2020 RESULTS PRESENTATION
100% solutions manufactured or distributed by Saint-Gobain
43 /

1
23
Micaver electrical
insulation3
Thermal insulation2
Climacoat heated
windshield1
1
5
4
3
2x3Passenger transport
increase 2015-20501
~15% Contribution of
transport sector to
world CO2 emissions2
€5-10tn Recovery plans
worldwide with
mobility initiatives3
36mestimated regular
users of car sharing
services by 20254
27mExpected
electric vehicle in
circulation by 2030
1
5
Lightweight glazing
Thermal & acoustic insulation3
Tolerance rings4
Films & battery separators
1. BCC Research 2. WRI 3. €750bn in EU, $1.9tn in the USA, €6tn in China
4. Frost & Sullivan 5. IEA 6. European Commission
x2Total energy use
increase in transport
sector 2010-20505
Saint-Gobain electric mobility solutions
-7kgAverage car weight reduction
thanks to Saint-Gobain solutions
2020 RESULTS PRESENTATION
Tinted glass & repair 2
Well-being & energy savings
Performance & energy savings
Well-being & energy savings
Performance solutions
to consume less energy per kilometer44 /

OUR PURPOSE

HIGHLIGHTS
2020 RESULTS
STRATEGY
OUTLOOK
01
02
03
04
05
2020 ACHIEVEMENTS

2020 RESULTS PRESENTATION
2020 DIVIDEND (Board’s recommendation to the June 3,
2021 AGM)
€1.33 PER SHARE
Dividend yield at Dec. 31, 2020: 3.5%
Payout ratio based on recurring net income: 48%
PAYMENT
In cash
CALENDAR
June 3, 2021: AGM
June 7, 2021: ex-dividend date
June 9, 2021: payment date
Reduction in the number of shares outstanding to 530 million at end-December 2020 versus 542 million at end-December 2019
Share buybacks
47 /
2020 RESULTS PRESENTATION
High Performance Solutions: continued sequential improvement in most industrial markets. Businesses related to customer investment should rally steadily during the year, although are expected to remain down on the good level recorded in 2018
Northern Europe: continued outperformance in construction and support from stimulus programs; Nordic countries and Germany should benefit from good momentum in renovation, except in the event of strict new lockdown measures; the UK should bounce back though the environment remains uncertain
Southern Europe - Middle East & Africa: continued outperformance in construction thanks to strong residential renovation markets and support from national and European stimulus plans which should particularly benefit the Group’s energy-efficient renovation solutions, notably in France, although certain markets such as new construction remain down
Americas: market growth – particularly new residential construction in both North America –as expected – and Latin America
Asia-Pacific: market growth, with continued good momentum in China and a sharp rebound expected in India
48 /

2020 RESULTS PRESENTATION49 /
Improvement in the Group’s profitable growth profile:continuation of its portfolio optimization (divestments and acquisitions)
outperformance versus the market thanks to its range of integrated solutions
strategy of differentiation and innovation to develop solutions for sustainability and performance
Rise of more than 100 basis points in the operating margin compared to the 2018 margin of 7.7%, and ongoing strong discipline in terms of free cash flow generation:
constant focus on the price-cost spread amid inflation in costs
reduction in costs as part of additional post-coronavirus adaptation measures
continuation of the operational excellence program
maintaining the structural drivers for improvement in operating working capital requirement
capital expenditure of around €1.5 billion and ongoing digital transformation
continued reduction in non-operating costs
For 2021, the Group is targeting a significant like-for-like increase in operating income, withan improvement of more than 100 basis points in the operating margin compared to the7.7% margin in 2018 (assuming that volumes return to their 2018 levels), confirming thesuccess of “Transform & Grow”.

50 /
Saint-Gobain new leadership team will present its strategic vision and roadmap for
profitable growth:
Leveraging its solutions for Sustainability
and Performance
With financial and ESG targets
OCTOBER 6, 2021
2020 RESULTS PRESENTATION

51 /
This presentation contains forward-looking statements with respect to Saint-Gobain’s financial condition, results,business, strategy, plans and outlook. Forward-looking statements are generally identified by the use of the words"expect", "anticipate", "believe", "intend", "estimate", "plan" and similar expressions. Although Saint-Gobainbelieves that the expectations reflected in such forward-looking statements are based on reasonable assumptionsas at the time of publishing this document, investors are cautioned that these statements are not guarantees of itsfuture performance. Actual results may differ materially from the forward-looking statements as a result of anumber of known and unknown risks, uncertainties and other factors, many of which are difficult to predict and aregenerally beyond the control of Saint-Gobain, including but not limited to the risks described in Saint-Gobain’sregistration document available on its website (www.saint-gobain.com) and the main risks and uncertaintiespresented in the half-year 2020 financial report. Accordingly, readers of this document are cautioned against relyingon these forward-looking statements. These forward-looking statements are made as of the date of this document.Saint-Gobain disclaims any intention or obligation to complete, update or revise these forward-looking statements,whether as a result of new information, future events or otherwise. This presentation does not constitute any offerto purchase or exchange, nor any solicitation of an offer to sell or exchange securities of Saint-Gobain. Norepresentation or warranty, express or implied, is made by Saint-Gobain or its managers, corporate officers,employees, contractors, representatives or advisors as to the accuracy or completeness of the information oropinions contained in this presentation.
2020 RESULTS PRESENTATION

2020 RESULTSAND OUTLOOK

53 /
22%
26%30%
16%
6%21%
28%22%
23%
6%
Breakdown of 2020 Operating income
Industrial assetsat December 31, 2020
HPS
NorthernEurope
Americas
Southern Europe -ME & Africa
Asia-Pacific
HPS
NorthernEurope
Americas
Southern Europe - ME
& Africa
Asia-Pacific
2020 RESULTS PRESENTATION
54 /
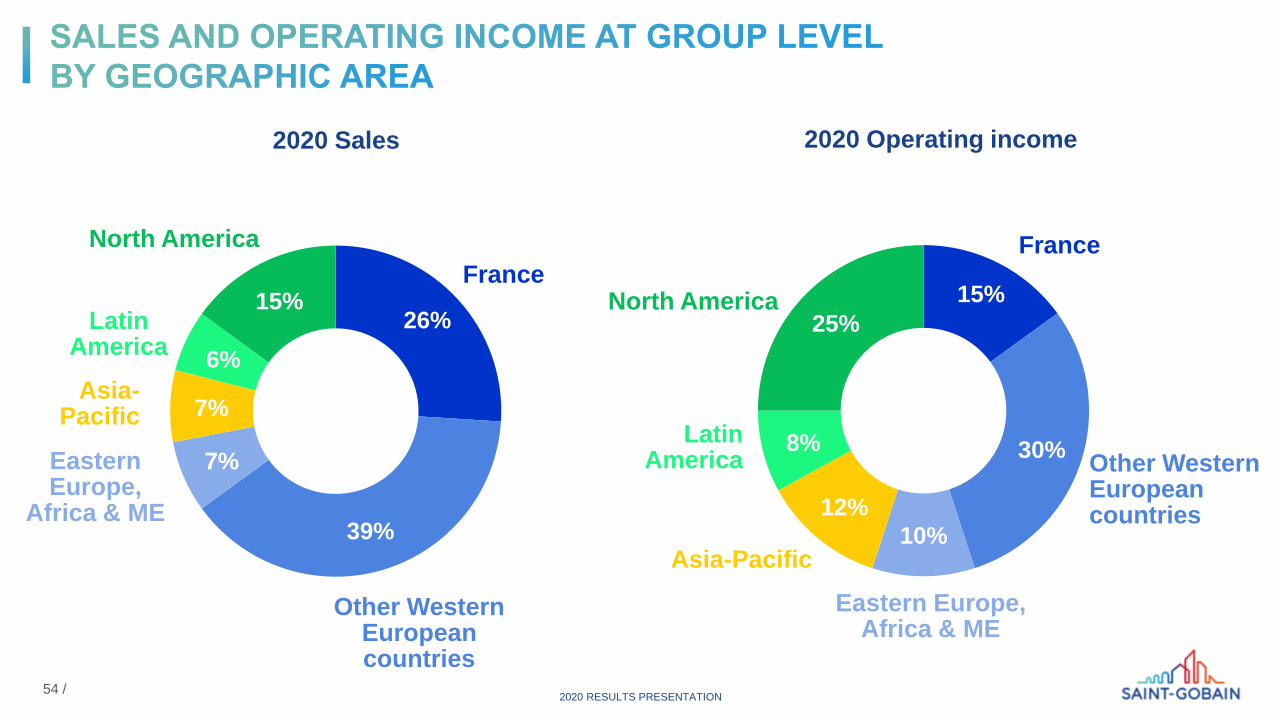
26%
39%
7%
7%
6%
15%
North America
France
Other Western Europeancountries
Asia-Pacific
Latin America
15%
30%
10%
12%
8%
25%North America
France
Other Western Europeancountries
Asia-Pacific
Latin America
Eastern Europe,Africa & ME
Eastern Europe,
Africa & ME
2020 Sales 2020 Operating income
2020 RESULTS PRESENTATION

2019 sales Exchangerates
Structure Price Volumes 2020 sales
19,006 16,347
-14.0%actual
-9.8%
-3.2%like-for-like
-4.2%
-1.0%
+1.0%
2020 RESULTS PRESENTATION55 /
+5.2%like-for-like
in H2
7493.9%
6804.2%
H1-19 H2-19 H1-20 H2-20
3.6% 4.4% 1.8% 6.2%
Operating income (€m)
and margin (%)
Sales (€m)

1%
1%
1%
7%
7%
7%
4%
21%
7%
3%
22%
5%
1%
9%
2%
1%
1%RENOVATION / INFRAST.
54%**
NEW RESIDENTIALCONSTRUCTION
22%
MOBILITY
7%
OTHER INDUSTRIES
7%
NEW NON-RESIDENTIALCONSTRUCTION
10%
HPS
~17%
NORTHERN
EUROPE
~32%
SOUTHERN
EUROPE -
ME & AFRICA
~32%
ASIA-PACIFIC
~4%
56 /
AMERICAS
~15%* Saint-Gobain estimated end markets
** Renovation: 48%
Infrastructure: 6%
2020 RESULTS PRESENTATION

Theme Saint-Gobain indicators 2019 2020
CLIMATE CO2 emissions (Mt) – scope 1+2 10.8 10.4
CO2eq avoided emissions thanks to our insulation solutions sold in 1 year (Mt) 1,200*
kgCO2/€ sales 0.25 0.27ENERGY Renewable electricity contribution as part of electricity consumption (%) 18.2% 18.9%
WATER Industrial water withdrawal (M of m3) 48.9 45.4CIRCULAR ECONOMY Avoided virgin raw materials (Mt) 8.5 10.1HEALTH & SAFETY Group accident frequency rate (TRAR)
(employees, temporary workers and permanent subcontractors)2.2 1.8
DIVERSITY Share of women managers among managers (%) 24.2% 25.3%Share of women on Group executive committee (%) 25%
ENGAGEMENT Satisfaction survey:& TALENT DEVELOPMENT Employees responding (% total) 74% 78%
Engagement index score 79 82 Employees feel adequately trained to do their work (% respondents) 87% 88%
SOCIAL PROTECTION "CARE by Saint-Gobain" social protection program coverage (% employees): parental pillar (14 weeks maternity leave on full salary and a minimum of 3
days leave on full salary for the spouse after the birth or adoption of a child)100%
ETHICS & COMPLIANCE % of new managers trained to our Principles of Conduct and Action in their first year
93% 97%
DIVERSITY Share of women on Board (%) 45% 45%
BOARD STRUCTURE Share of independent directors on Board (%) 73% 82%
MANAGEMENT INCENTIVES % ESG criteria in long-term incentive plans 15% 20%
GROUP SAVINGS PLAN Proportion of shares held by Group employees’ savings plan (%) 8.7% 9.1%
* Estimate based on 2017 sales of insulative solutions
G
S
E
57 /2020 RESULTS PRESENTATION