Embed Size (px)
Citation preview
CAT System Optimization Support Services
FY 22 Service ProposalsCHARLOTTESVILLE AREA TRANSITUPDATED JANUARY 2021 (DRAFT)
1

Existing CAT Network
2
Pre-COVID• 13 routes (including Free Trolley)• Service span generally 6 am to 12 midnight• Limited Sunday service (4 routes)• Accessibility (within ¼ mile of weekday service):
• 62,469 population• 19,711 minority population• 4,492 low-income households• 2,837 no-vehicle households
COVID• No change in service coverage• Evening service ends by 9 pm• Reduced frequency on select routes• Sunday service eliminated
CAT System Optimization Support Services

CAT Service Assessment
3CAT System Optimization Support Services
• CAT was experiencing annual ridership declines prior to COVID, despite increase in service hours
• CAT has experienced a significant loss in ridership due to COVID (as all transit agencies have)
• Routes 5, 7 and the Free Trolley carry majority of CAT ridership and have experienced the most significant ridership loss from COVID
• Routes 1 and 9 are CAT’s poorest-performing routes
• This summer, buses were running ahead of schedule due to lighter-than-normal traffic conditions
0
500
1,000
1,500
2,000
2,500
1 2 3 4 5 6 7 8 9 10 11 T
Route
Average Weekday Ridership
Summer '19 Fall '19 Summer' 20
• Summer 2019 Weekday Ridership = 5,734• Fall 2019 System Weekday Ridership = 6,966• Summer 2020 Weekday Ridership = 2,650
2,405,1512,275,515
2,423,740 2,337,8772,189,612
2,052,376
0
500,000
1,000,000
1,500,000
2,000,000
2,500,000
3,000,000
2013 2014 2015 2016 2017 2018
Annual CAT Ridership
27.1
24.323.2 22.7 22.4
19.8
0.0
5.0
10.0
15.0
20.0
25.0
30.0
2013 2014 2015 2016 2017 2018
Pass. Trips / Revenue Bus-Hour
FY 2021 Service/Budget
4CAT System Optimization Support Services
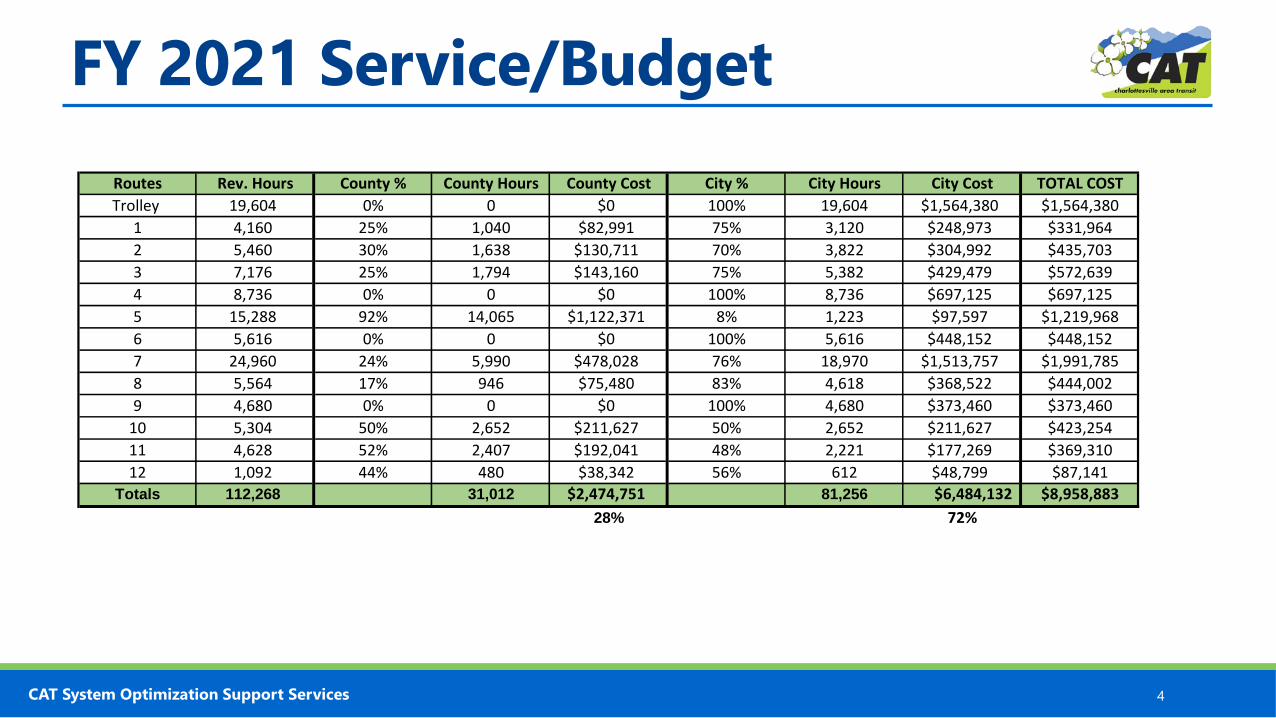
Routes Rev. Hours County % County Hours County Cost City % City Hours City Cost TOTAL COSTTrolley 19,604 0% 0 $0 100% 19,604 $1,564,380 $1,564,380
1 4,160 25% 1,040 $82,991 75% 3,120 $248,973 $331,9642 5,460 30% 1,638 $130,711 70% 3,822 $304,992 $435,7033 7,176 25% 1,794 $143,160 75% 5,382 $429,479 $572,6394 8,736 0% 0 $0 100% 8,736 $697,125 $697,1255 15,288 92% 14,065 $1,122,371 8% 1,223 $97,597 $1,219,9686 5,616 0% 0 $0 100% 5,616 $448,152 $448,1527 24,960 24% 5,990 $478,028 76% 18,970 $1,513,757 $1,991,7858 5,564 17% 946 $75,480 83% 4,618 $368,522 $444,0029 4,680 0% 0 $0 100% 4,680 $373,460 $373,460
10 5,304 50% 2,652 $211,627 50% 2,652 $211,627 $423,25411 4,628 52% 2,407 $192,041 48% 2,221 $177,269 $369,31012 1,092 44% 480 $38,342 56% 612 $48,799 $87,141
Totals 112,268 31,012 $2,474,751 81,256 $6,484,132 $8,958,88328% 72%

Systemwide Changes
5CAT System Optimization Support Services
• 9th Street/Avon Street bridge closing• Downtown staging location modified
• loop via High Street (EB) and Market Street (WB)• Bus staging between 6th Street and 8th Street• Routes from east return (outbound) to High Street via 7th Street
• Consistent Weekday and Saturday span of service:• 6:00 am to 11:00 pm for major routes• 6:30 am to 9:00 pm for all other routes
• Consistent Sunday span of service• 7:30 am to 9:00 pm for all routes operating on Sunday

Downtown Routing
6CAT System Optimization Support Services
Downtown routing for routes from the west and south
Downtown routing for routes from the north and east

Primary Service Objectives
7CAT System Optimization Support Services
• Provide service on South 1st Street South (Route 6)• Provide service to The Center on Rio Road (Route 11)• Restore Sunday service• Provide consistent 30-minute or better weekday service (all-day) on/along:
• US 29 corridor (Routes 5 & 7)• Avon Street (Route 2)• 5th Street (Route 3)
• No longer have frequencies worse than 60 minutes• Improve Trolley service levels back to 15 minutes
Service Proposals
8CAT System Optimization Support Services
• Lower and upper limit bounds defined• Lower limit restores pre-pandemic service hours, but with several service
modifications• Upper limit reflects 27% increase in service hours
• New weekend service on select routes• Improved service frequencies on select routes• Additional service between UVA & US 29 corridor

Route 1
9CAT System Optimization Support Services
Proposed Service Modifications• No change to alignment (besides downtown for bridge
reconstruction)• Two options:
• Maintain weekday service only• Add Saturday service
Revenue HoursExisting Service Change
Route Pre-Pandemic Pandemic Route Option 1 Option 21 4,100 3,800 1 4,100 4,900
Totals 4,100 3,800 Totals 4,100 4,900% Change from Pre-Pandemic 0% 20%
• Option 1 reflects weekday service only• Option 2 reflects addition of Saturday service
Pre-pandemic weekday ridership = 149

Route 2
10CAT System Optimization Support Services
Proposed Service Modifications• Route 2 modified to operate bi-directional on Avon Street• Two patterns:
• 2A operates to/from Willoughby Square all time periods at 60-min. frequencies
• 2B operates to/from PVCC on weekdays at 60-min. frequencies
• Frequencies are 30-minutes weekdays, 60-minutes Saturdays and Sundays
• WB stop needed at 5th Street StationRevenue Hours
Existing Service ChangeRoute Pre-Pandemic Pandemic Route Proposal
2 5,700 4,500 2A 6,3002B 3,300
Totals 5,700 4,500 Totals 9,600% Change from Pre-Pandemic 68%
Pre-pandemic weekday ridership = 176
Route 3
11CAT System Optimization Support Services
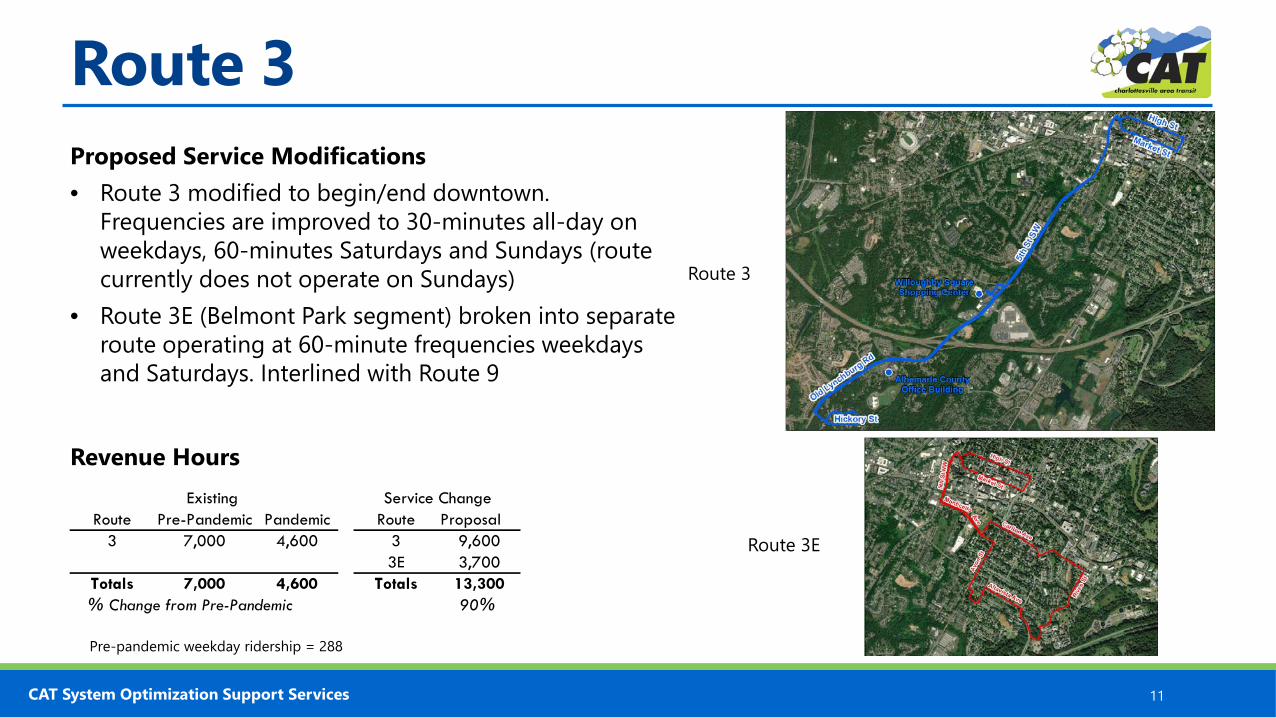
Proposed Service Modifications• Route 3 modified to begin/end downtown.
Frequencies are improved to 30-minutes all-day on weekdays, 60-minutes Saturdays and Sundays (route currently does not operate on Sundays)
• Route 3E (Belmont Park segment) broken into separate route operating at 60-minute frequencies weekdays and Saturdays. Interlined with Route 9
Revenue HoursExisting Service Change
Route Pre-Pandemic Pandemic Route Proposal3 7,000 4,600 3 9,600
3E 3,700Totals 7,000 4,600 Totals 13,300% Change from Pre-Pandemic 90%
Route 3
Route 3E
Pre-pandemic weekday ridership = 288

Route 4
12CAT System Optimization Support Services
Proposed Service Modifications• Continue pandemic 60-minute service frequencies• Interline Route 4 with Route 10 to provide
additional recovery time for this route
Revenue HoursExisting Service Change
Route Pre-Pandemic Pandemic Route Proposal4 8,500 4,600 4 4,900
Totals 8,500 4,600 Totals 4,900% Change from Pre-Pandemic -42%
Pre-pandemic weekday ridership = 373

Route 5
13CAT System Optimization Support Services
Proposed Service Modifications• Terminate north end of Route 5 at Fashion
Square• Two options for south end:
• Option 1: terminus at Barracks Center • Option 2: terminus at UVA Hospital
• Operate at 30-minute frequencies
Revenue HoursExisting Service Change
Route Pre-Pandemic Pandemic Route Option 1 Option 25 15,200 12,900 5 10,500 20,800
Totals 15,200 12,900 Totals 10,500 20,800% Change from Pre-Pandemic -31% 37%
Option 1
Option 2Pre-pandemic weekday ridership = 725

Route 6
14CAT System Optimization Support Services
Proposed Service Modifications• Eliminate Route 6 SB deviation to UVA Hospital – all trips operate
direction to/from Willoughby Square Shopping Center• Interline with Route 4 at Willoughby Square
Revenue HoursExisting Service Change
Route Pre-Pandemic Pandemic Route Proposal6 5,500 4,600 6 3,500
Totals 5,500 4,600 3,500% Change from Pre-Pandemic -36%
Pre-pandemic weekday ridership = 296

Routes 7 & 12
15CAT System Optimization Support Services
Proposed Service Modifications• Extend Route 7 to Walmart and operate 7-days/week • Operate at either 20 or 30-minute frequencies (Options 1 &
2)• With extension of Route 7, Route 12 no longer needs to
operate on Sundays
Revenue HoursExisting Service Change
Route Pre-Pandemic Pandemic Route Option 1 Option 27 24,800 12,900 7 33,500 25,00012 1,100 0 12 0 0
Totals 25,900 12,900 Totals 33,500 25,000% Change from Pre-Pandemic 29% -3%
Pre-pandemic weekday ridership = 1,944
Route 8
16CAT System Optimization Support Services
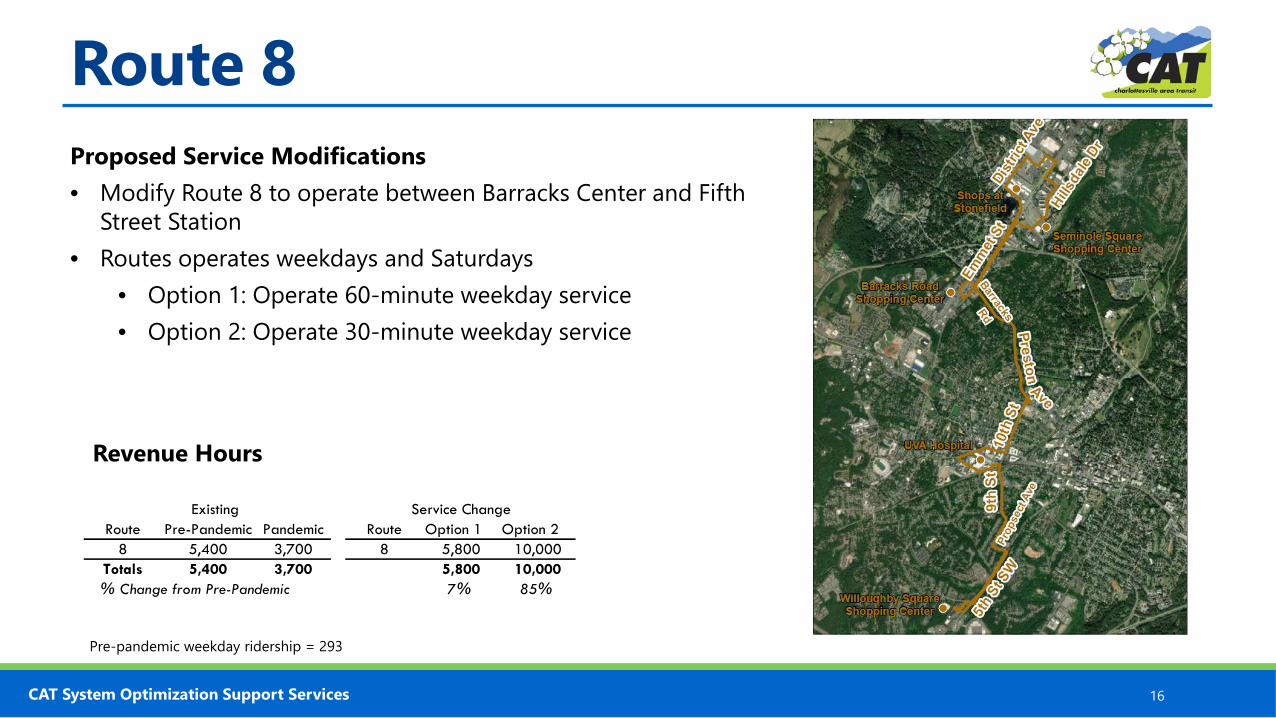
Proposed Service Modifications• Modify Route 8 to operate between Barracks Center and Fifth
Street Station• Routes operates weekdays and Saturdays
• Option 1: Operate 60-minute weekday service• Option 2: Operate 30-minute weekday service
Revenue Hours
Existing Service ChangeRoute Pre-Pandemic Pandemic Route Option 1 Option 2
8 5,400 3,700 8 5,800 10,000Totals 5,400 3,700 5,800 10,000% Change from Pre-Pandemic 7% 85%
Pre-pandemic weekday ridership = 293
Route 9
17CAT System Optimization Support Services
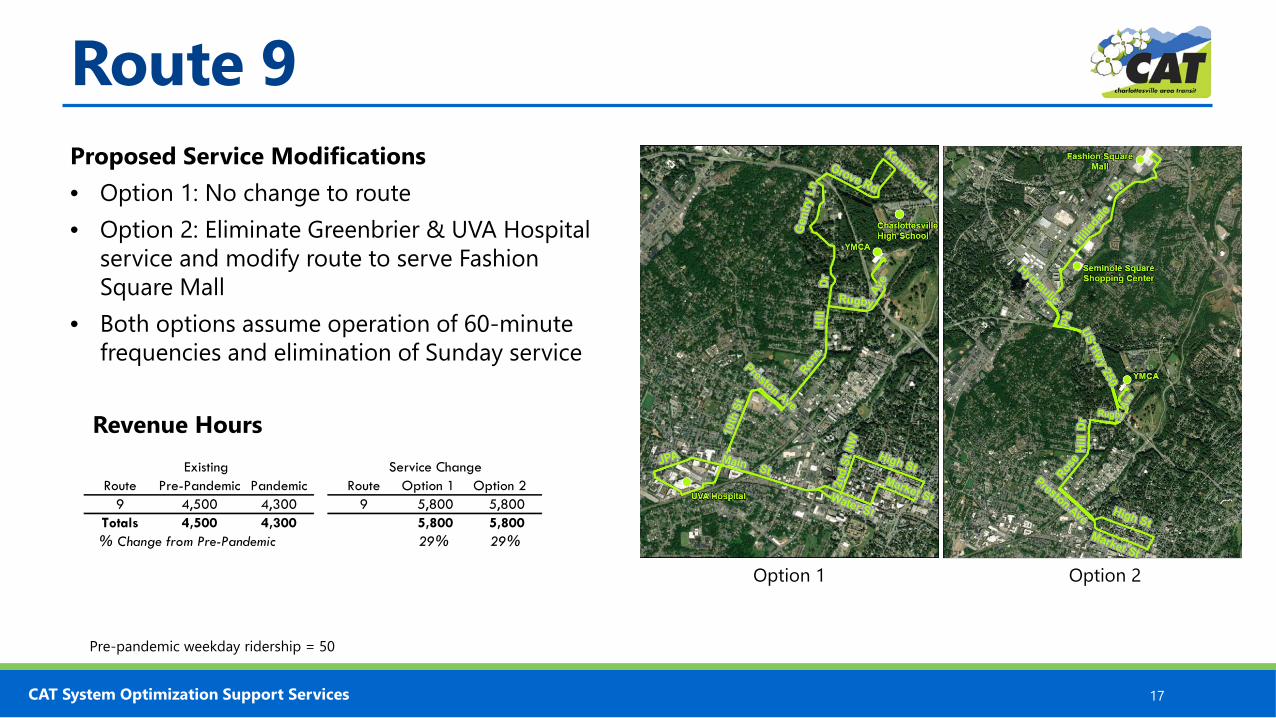
Proposed Service Modifications• Option 1: No change to route• Option 2: Eliminate Greenbrier & UVA Hospital
service and modify route to serve Fashion Square Mall
• Both options assume operation of 60-minute frequencies and elimination of Sunday service
Revenue Hours
Option 1 Option 2
Existing Service ChangeRoute Pre-Pandemic Pandemic Route Option 1 Option 2
9 4,500 4,300 9 5,800 5,800Totals 4,500 4,300 5,800 5,800% Change from Pre-Pandemic 29% 29%
Pre-pandemic weekday ridership = 50
Route 10
18CAT System Optimization Support Services
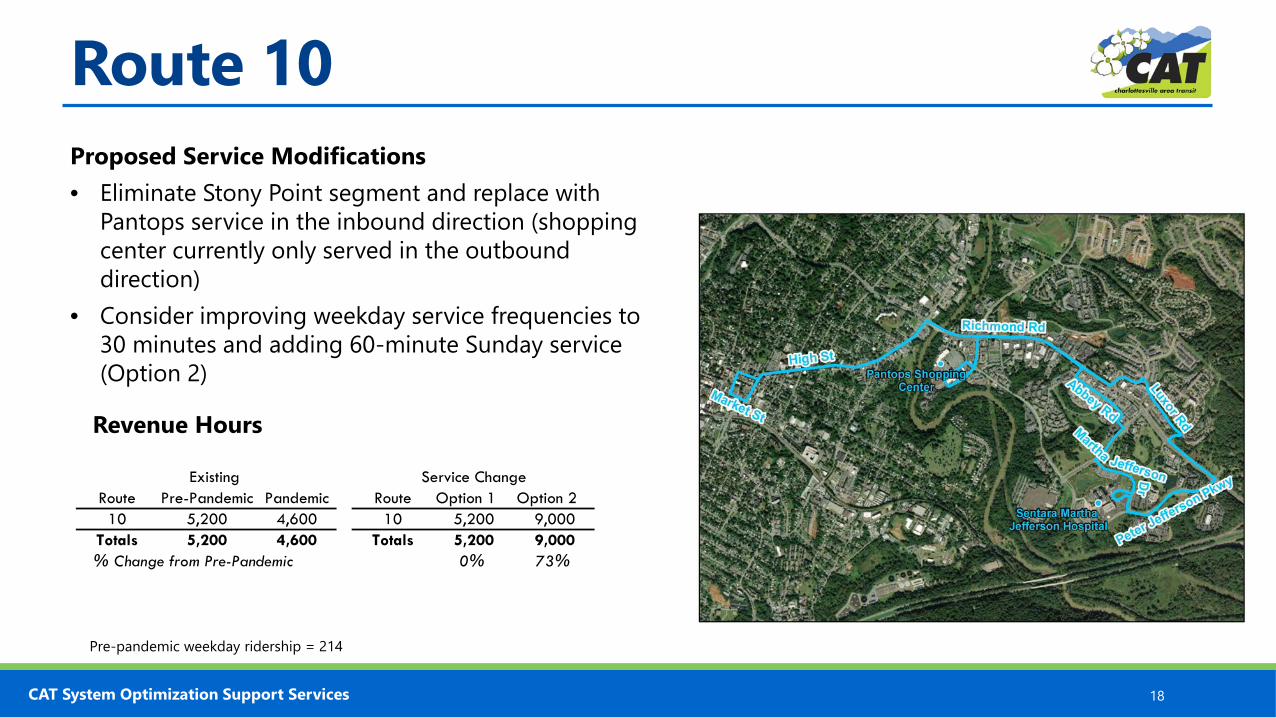
Proposed Service Modifications• Eliminate Stony Point segment and replace with
Pantops service in the inbound direction (shopping center currently only served in the outbound direction)
• Consider improving weekday service frequencies to 30 minutes and adding 60-minute Sunday service (Option 2)
Revenue Hours
Existing Service ChangeRoute Pre-Pandemic Pandemic Route Option 1 Option 2
10 5,200 4,600 10 5,200 9,000Totals 5,200 4,600 Totals 5,200 9,000% Change from Pre-Pandemic 0% 73%
Pre-pandemic weekday ridership = 214
Route 11
19CAT System Optimization Support Services
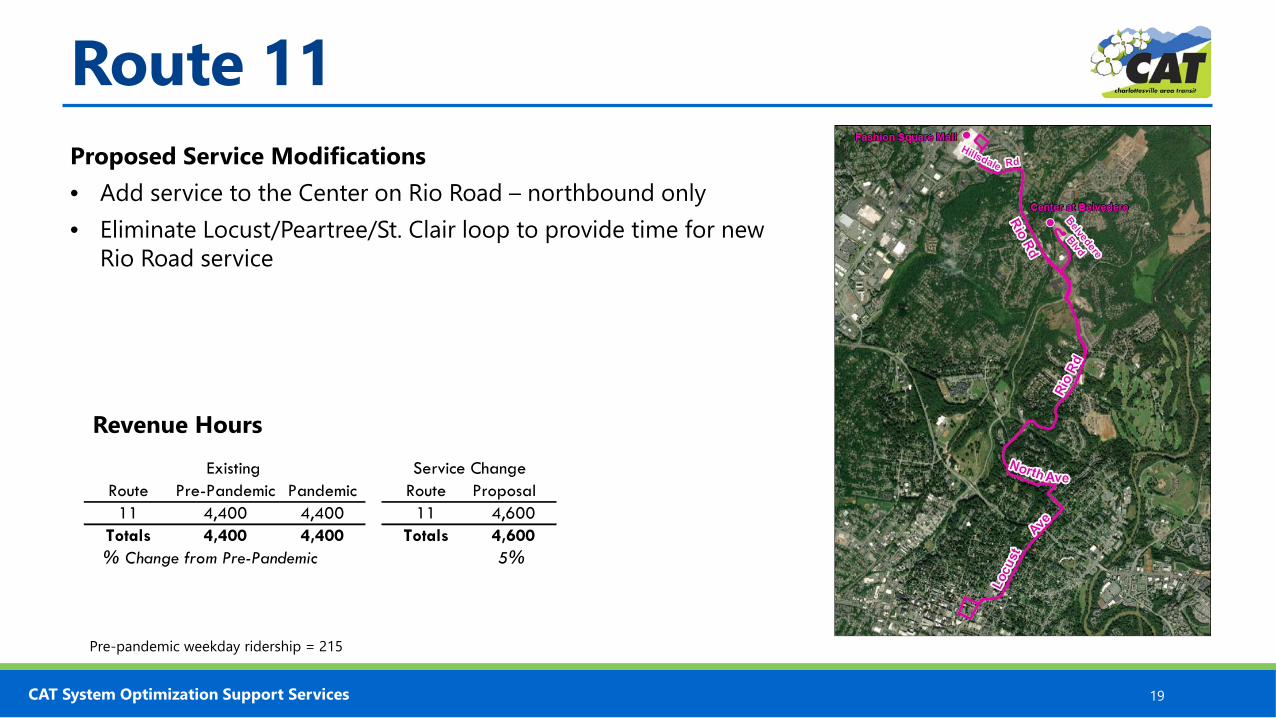
Proposed Service Modifications• Add service to the Center on Rio Road – northbound only• Eliminate Locust/Peartree/St. Clair loop to provide time for new
Rio Road service
Revenue HoursExisting Service Change
Route Pre-Pandemic Pandemic Route Proposal11 4,400 4,400 11 4,600
Totals 4,400 4,400 Totals 4,600% Change from Pre-Pandemic 5%
Pre-pandemic weekday ridership = 215
Trolley
20CAT System Optimization Support Services
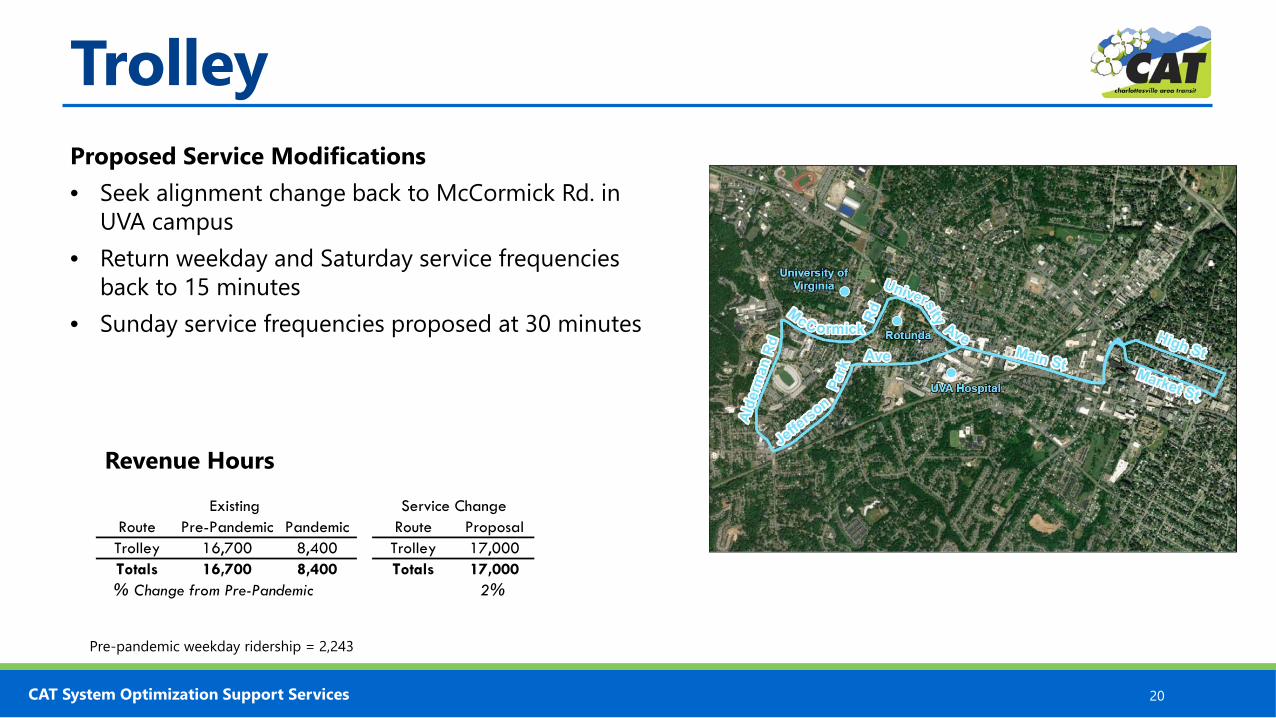
Proposed Service Modifications• Seek alignment change back to McCormick Rd. in
UVA campus• Return weekday and Saturday service frequencies
back to 15 minutes• Sunday service frequencies proposed at 30 minutes
Revenue Hours
Existing Service ChangeRoute Pre-Pandemic Pandemic Route ProposalTrolley 16,700 8,400 Trolley 17,000Totals 16,700 8,400 Totals 17,000% Change from Pre-Pandemic 2%
Pre-pandemic weekday ridership = 2,243
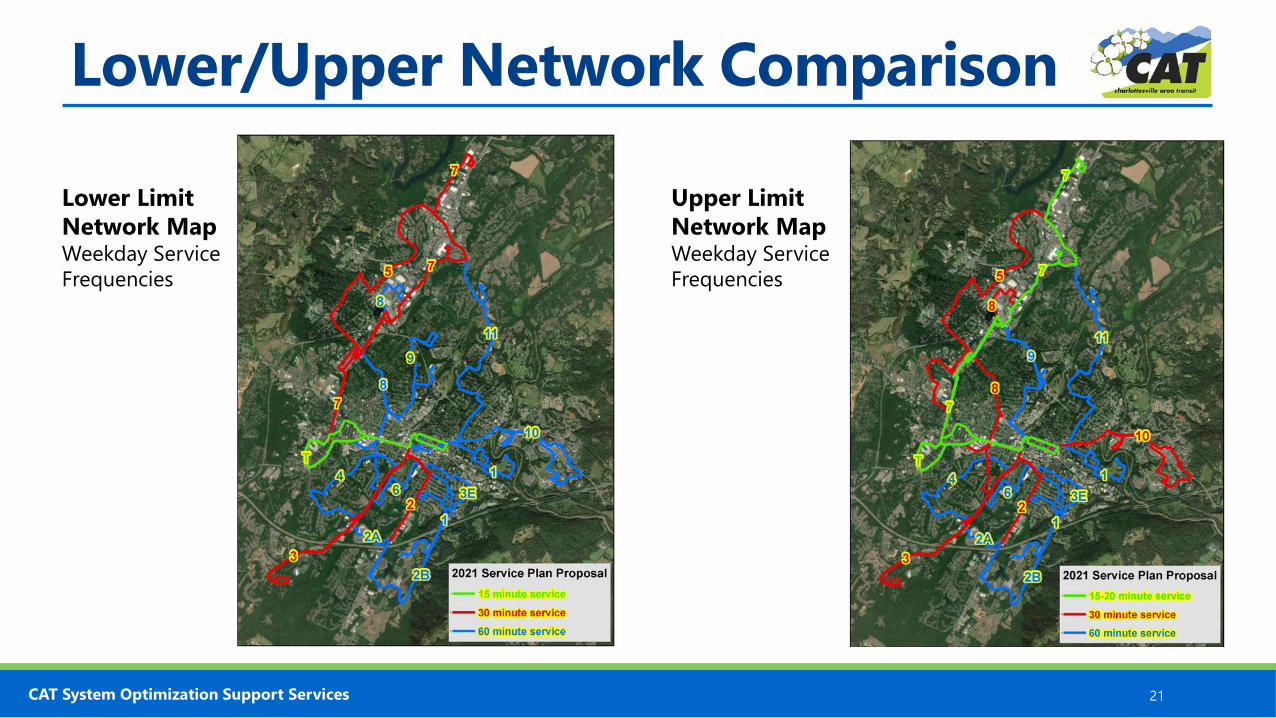
Lower/Upper Network Comparison
21CAT System Optimization Support Services
Lower LimitNetwork MapWeekday Service Frequencies
Upper LimitNetwork MapWeekday Service Frequencies

Revenue Hours Summary
22CAT System Optimization Support Services
Pre- Lower Limit Upper LimitRoute Route Name Pandemic Pandemic Proposal Proposal
1 PVCC & Woolen Mills 4,100 3,800 4,100 4,9002A Downtown-Fifth St. Station 5,700 4,500 6,300 6,3002B Downtown-PVCC n/a n/a 3,300 3,3003 Downtown-Southwood 7,000 4,600 9,600 9,6003E Downtown-Belmont Park n/a n/a 3,700 3,7004 Downtown-Cherry Ave & Harris Rd 8,600 4,600 4,900 4,9005 Barracks Ctr.-Fashion Sq. Mall 15,200 12,900 10,500 20,8006 Downtown-Ridge Street 5,500 4,600 3,500 3,5007 Emmet Street & Seminole Trail 24,800 12,900 25,000 33,5008 Prospect Ave-Barracks Road 5,400 3,700 5,800 10,0009 Downtown-Rose Hill 4,500 4,300 5,800 5,800
10 Pantops 5,200 4,600 5,200 9,00011 Downtown-Locust Avenue & Rio Road 4,400 4,400 4,600 4,60012 Seminole Trail 1,100 0 n/a n/aT Free Trolley 16,700 8,400 17,000 17,000
TOTALS 108,200 73,300 109,300 136,900Percent Change from Pre-Pandemic Service -32% 1% 27%
Transit Accessibility• Weekday Access
• Lower Limit = no change• Upper Limit = +2 percent
• Weekday 30-Minute or Better Service• Lower Limit = +7 percent• Upper Limit = +11 percent
• Saturday Service • Lower Limit = +3 percent• Upper Limit = +6 percent
• Sunday Service • Lower Limit = +4 percent• Upper Limit = +11 percent

Lower Limit Proposal
23CAT System Optimization Support Services
Hours and Costs by JurisdictionLower Limit County City Total
Route Route Name Proposal Percentage Hours Cost Percentage Hours Cost Cost1 PVCC & Woolen Mills 4,100 24% 984 $78,730 76% 3,116 $249,311 $328,041
2A Downtown-Fifth St. Station 6,300 35% 2,205 $176,422 65% 4,095 $327,641 $504,0632B Downtown-PVCC 3,300 64% 2,112 $168,981 36% 1,188 $95,052 $264,0333 Downtown-Southwood 9,600 39% 3,781 $302,487 61% 5,819 $465,609 $768,0963E Downtown-Belmont Park 3,700 0% 0 $0 100% 3,700 $296,037 $296,0374 Downtown-Cherry Ave & Harris Rd 4,900 0% 0 $0 100% 4,900 $392,049 $392,0495 Barracks Ctr.-Fashion Sq. Mall 10,500 87% 9,092 $727,424 13% 1,408 $112,681 $840,1056 Downtown-Ridge Street 3,500 0% 0 $0 100% 3,500 $280,035 $280,0357 Emmet Street & Seminole Trail 25,000 42% 10,500 $840,105 58% 14,500 $1,160,145 $2,000,2508 Prospect Ave-Barracks Road 5,800 0% 0 $0 100% 5,800 $464,058 $464,0589 Downtown-Rose Hill 5,800 9% 522 $41,765 91% 5,278 $422,293 $464,05810 Pantops 5,200 71% 3,667 $293,370 29% 1,533 $122,682 $416,05211 Downtown-Locust Avenue & Rio Road 4,600 63% 2,891 $231,343 37% 1,709 $136,703 $368,046T Free Trolley 17,000 0% 0 $0 100% 17,000 $1,360,170 $1,360,170
TOTALS 109,300 33% 35,753 $2,860,628 67% 73,547 $5,884,465 $8,745,093FY 2020 Budget $2,474,751 $6,484,132 $8,958,883Change from 2020 $385,877 -$599,667 -$213,790

Upper Limit Proposal
24CAT System Optimization Support Services
Hours and Costs by JurisdictionUpper Limit County City Total
Route Route Name Proposal Percentage Hours Cost Percentage Hours Cost Cost1 PVCC & Woolen Mills 4,900 24% 1,176 $94,092 76% 3,724 $297,957 $392,049
2A Downtown-Fifth St. Station 6,300 35% 2,205 $176,422 65% 4,095 $327,641 $504,0632B Downtown-PVCC 3,300 64% 2,112 $168,981 36% 1,188 $95,052 $264,0333 Downtown-Southwood 9,600 39% 3,781 $302,487 61% 5,819 $465,609 $768,0963E Downtown-Belmont Park 3,700 0% 0 $0 100% 3,700 $296,037 $296,0374 Downtown-Cherry Ave & Harris Rd 4,900 0% 0 $0 100% 4,900 $392,049 $392,0495 Barracks Ctr.-Fashion Sq. Mall 20,800 67% 13,936 $1,115,019 33% 6,864 $549,189 $1,664,2086 Downtown-Ridge Street 3,500 0% 0 $0 100% 3,500 $280,035 $280,0357 Emmet Street & Seminole Trail 33,500 42% 14,070 $1,125,741 58% 19,430 $1,554,594 $2,680,3358 Prospect Ave-Barracks Road 10,000 9% 900 $72,009 91% 9,100 $728,091 $800,1009 Downtown-Rose Hill 5,800 18% 1,018 $81,414 82% 4,782 $382,644 $464,05810 Pantops 9,000 71% 6,346 $507,756 29% 2,654 $212,334 $720,09011 Downtown-Locust Avenue & Rio Road 4,600 63% 2,891 $231,343 37% 1,709 $136,703 $368,046T Free Trolley 17,000 0% 0 $0 100% 17,000 $1,360,170 $1,360,170
TOTALS 136,900 35% 48,435 $3,875,264 65% 88,465 $7,077,220 $10,953,369FY 2020 Budget $2,474,751 $6,484,132 $8,958,883Change from 2020 $1,400,513 $593,088 $1,994,486

City/County Boundary Assumptions
25CAT System Optimization Support Services
• Route 1 county portion starts on Monticello Ave. at Moores Creek Bridge• Route 2A county portion starts on Avon Street at Moores Creek bridge to just west of Fifth Street
Station• Route 2B county portion starts on Avon Street at Moores Creek bridge• Route 3 county portion starts on 5th Street at Moores Creek bridge• Route 5 (lower limit scenario) county portion starts at 250 Bypass• Route 5 (upper limit scenario) county portion starts at 250 Bypass and also includes Massie Rd /
Copeley Rd from just west of Arlington Blvd. to north of Ivy Road• Route 7 county portion starts on Hillsdale Dr just south of Greenbrier Dr.• Route 8 county portion is along District Avenue, north/west of Seminole Trail• Route 9 (upper limit scenario) county portion starts on Hillsdale Dr., just south of Greenbrier Dr.• Route 10 county portion starts at Rivanna River bridge• Route 11 county portion starts on Park Street at Melbourne Rd.