Embed Size (px)
Citation preview
PNNL-15583
FY05 FM Dial Summary Report W. W. Harper J. S. Thompson J. D. Strasburg T. L. Stewart E. C. Golovich M. T. Batdorf December 2005 Prepared for the U.S. Department of Energy under Contract DE-AC05-76RL01830
DISCLAIMER This report was prepared as an account of work sponsored by an agency of the United States Government. Neither the United States Government nor any agency thereof, nor Battelle Memorial Institute, nor any of their employees, makes any warranty, express or implied, or assumes any legal liability or responsibility for the accuracy, completeness, or usefulness of any information, apparatus, product, or process disclosed, or represents that its use would not infringe privately owned rights. Reference herein to any specific commercial product, process, or service by trade name, trademark, manufacturer, or otherwise does not necessarily constitute or imply its endorsement, recommendation, or favoring by the United States Government or any agency thereof, or Battelle Memorial Institute. The views and opinions of authors expressed herein do not necessarily state or reflect those of the United States Government or any agency thereof. PACIFIC NORTHWEST NATIONAL LABORATORY operated by BATTELLE for the UNITED STATES DEPARTMENT OF ENERGY under Contract DE-AC05-76RL01830 Printed in the United States of America Available to DOE and DOE contractors from the Office of Scientific and Technical Information,
P.O. Box 62, Oak Ridge, TN 37831-0062; ph: (865) 576-8401 fax: (865) 576-5728
email: [email protected] Available to the public from the National Technical Information Service, U.S. Department of Commerce, 5285 Port Royal Rd., Springfield, VA 22161
ph: (800) 553-6847 fax: (703) 605-6900
email: [email protected] online ordering: http://www.ntis.gov/ordering.htm
This document was printed on recycled paper.
(9/2003)
PNNL-15583
FY05 FM Dial Summary Report W. W. Harper J. D. Strasburg E. C. Golovich J. S. Thompson T. L. Stewart M. T. Batdorf December 2005 Prepared for the U.S. Department of Energy under Contract DE-AC05-76RL01830 Pacific Northwest National Laboratory Richland, Washington 99352

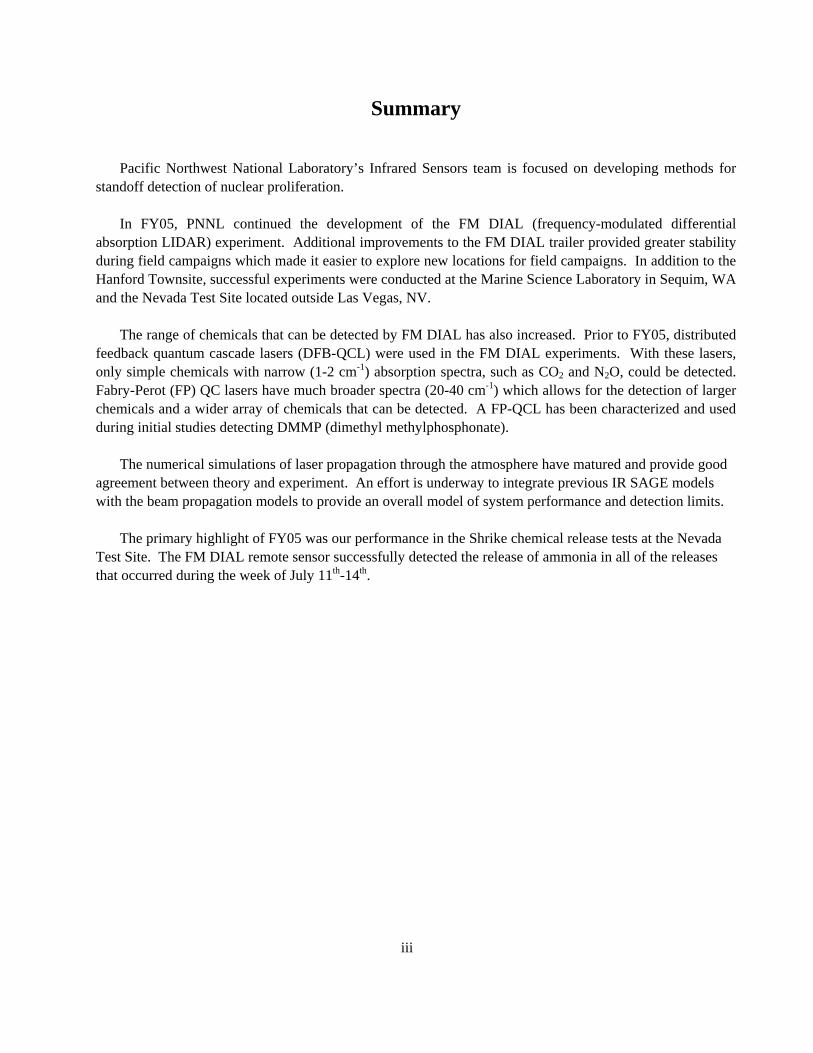
Summary Pacific Northwest National Laboratory’s Infrared Sensors team is focused on developing methods for standoff detection of nuclear proliferation. In FY05, PNNL continued the development of the FM DIAL (frequency-modulated differential absorption LIDAR) experiment. Additional improvements to the FM DIAL trailer provided greater stability during field campaigns which made it easier to explore new locations for field campaigns. In addition to the Hanford Townsite, successful experiments were conducted at the Marine Science Laboratory in Sequim, WA and the Nevada Test Site located outside Las Vegas, NV. The range of chemicals that can be detected by FM DIAL has also increased. Prior to FY05, distributed feedback quantum cascade lasers (DFB-QCL) were used in the FM DIAL experiments. With these lasers, only simple chemicals with narrow (1-2 cm-1) absorption spectra, such as CO2 and N2O, could be detected. Fabry-Perot (FP) QC lasers have much broader spectra (20-40 cm-1) which allows for the detection of larger chemicals and a wider array of chemicals that can be detected. A FP-QCL has been characterized and used during initial studies detecting DMMP (dimethyl methylphosphonate). The numerical simulations of laser propagation through the atmosphere have matured and provide good agreement between theory and experiment. An effort is underway to integrate previous IR SAGE models with the beam propagation models to provide an overall model of system performance and detection limits. The primary highlight of FY05 was our performance in the Shrike chemical release tests at the Nevada Test Site. The FM DIAL remote sensor successfully detected the release of ammonia in all of the releases that occurred during the week of July 11th-14th.
iii
Contents Summary ............................................................................................................................................ iii 1.0 Introduction ............................................................................................................................... 1.1 1.1 Proposed FY05 Milestones ............................................................................................... 1.1 1.2 FY05 Accomplishments.................................................................................................... 1.1 2.0 System Development ................................................................................................................ 2.1 3.0 Broadband Characterization ...................................................................................................... 3.1 4.0 Model Development .................................................................................................................. 4.1 4.1 Beam-propagation Simulations ........................................................................................ 4.1 4.2 IR SAGE Integration......................................................................................................... 4.3 5.0 Model Validation .................................................................................................................. 5.1 5.1 Marine Sciences Laboratory ............................................................................................ 5.1 5.2 Hanford Townsite ............................................................................................................. 5.2 5.3 Atmospheric Turbulence Comparisons ............................................................................ 5.4 6.0 NTS Shrike Tests ...................................................................................................................... 6.1 7.0 Plans for FY06 .......................................................................................................................... 7.1 7.1 Narrow-band FM DIAL .................................................................................................. 7.1 7.2 Broad-band FM Laser Spectroscopy ............................................................................... 7.1 7.3 Monostatic Study ............................................................................................................. 7.3 7.4 Numerical Modeling ....................................................................................................... 7.3 8.0 References ................................................................................................................................ 8.1
iv
Figures 2.1 Comparison between old and new Dewar designs. ................................................................... 2.1 2.2 Screenshot of the Scope Utility data acquisition software. ........................................................ 2.2 3.1 Spectra of nitrous oxide, benzene, and DMMP. The inset shows narrow individual lines in the nitrous oxide spectrum, compared to a broad band contour of DMMP ................................... 3.2 3.2 Multimode output of a Fabry-Perot QCL device with a 20 cm-1 spectral bandwidth. The red inset represents a single mode laser output and the associated arrow represents a 1 cm-1 tuning range…………………………………………………………………………………… 3.3 4.1 Comparison between experimental and simulated scintillation data as a function of the Rytov parameter………………………………………………………………………………………… 4.3 4.2 Atmospheric transmission spectra with and without HCL plume absorbance near 2821 cm-1…. 4.5 4.3 Calculation of FM-DIAL first harmonic response with and without HCL……………………… 4.5 5.1 Remote sensing trailer deployed at the Marine Sciences Laboratory…………………………… 5.1 5.2 Comparison of scintillation index results from the Hanford Townsite dots and stars) with those from the Marine Sciences Laboratory (circles, squares) ………………………………………. 5.2 5.3 Remote sensing trailer deployed at the Hanford Townsite …………………………………...... 5.3 5.4 Results of one of the ammonia release results from the Hanford Townsite tests ……………… 5.4 5.5 Variability of the index-of-refraction structure constant over a 24-hour period for different experimental locations ………………………………………………………………………….. 5.5 6.1 Remote sensing trailer deployed at Frenchman Flats at the Nevada Test Site ……………… . .. 6.1 6.2 Schematic of the FM DIAL trailer and retro-reflector relative to the ammonia release point at the Nevada Test Site …………………………………………………………………………..... 6.2 6.3 Three consecutive ammonia releases observed July 13th at NTS …………………………… . ... 6.3 6.4 FM DIAL results of the the first release showing the data processed in 5 s (red) and 0.5 s (black) time intervals. The structure exhibited in the 0.5 s data is due to plume dynamics …………... 6.4
v

6.5 Signals observed while the portable plume generator was purged of ammonia ……………... . 6.5 7.1 Schematic of transceiver scheme for FM DIAL miniaturization ………………………………. 7.1 7.2 Schematic of Broad-band Fabry-Perot Laser Spectroscopy technique ………………………… 7.2
vi
1.0 Introduction The FM DIAL project has seen much progress since its conception in FY00. During FY01, a laboratory bench system was constructed and exploratory experiments were conducted. FY02, the system was mounted on a cart and the first FM DIAL experiments were performed outside. The experiment was moved into a custom-designed temperature-controlled mobile trailer in FY03. During FY04, the numerical simulations of beam propagation through the atmosphere were developed; though the model was incomplete, initial comparisons with experimental results were promising. In addition several more field campaigns were conducted to gain an understanding of atmospheric turbulence and system performance detecting chemicals under different release conditions. In FY05, the FM DIAL experiment continued to push to meet new expectations. 1.1 Proposed FY05 Milestones To continue to advance the FM DIAL experiment, milestones were set for five areas: range enhancement, chemical sensing techniques, model integration, model validation and optimized ground field experiments. This included:
1. Implementing a logarithmic amplifier detection strategy. 2. Characterization of recently procured, broadband Fabry-Perot laser devices. 3. Incorporation of recently improved turbulence models with IR-SAGE, the previous model of the
FM DIAL sensor. 4. Performing detailed model validation by comparing modeling results with field experiments. 5. Participation in Shrike Tests at Nevada Test Site in July 2005.
1.2 FY05 Accomplishments Advances within the FM DIAL program continued throughout FY05. Changes made to the trailer and data acquisition give improved performance during field campaigns. An initial look into implementing a logarithmic amplifier within the detection scheme has given directions for mitigating turbulence/digitization noise and improving system sensitivity at long ranges in FY06. Methods for the detection of molecules with broad absorption features have begun to take form. Modeling programs have been made more robust by adding details of the transmit and receive optics, detector, and other elements of the system. Finally, FY05 culminated with successful results at the Shrike tests at the Nevada Test Site. Each of these accomplishments will be described in detail in the following sections.
1.1

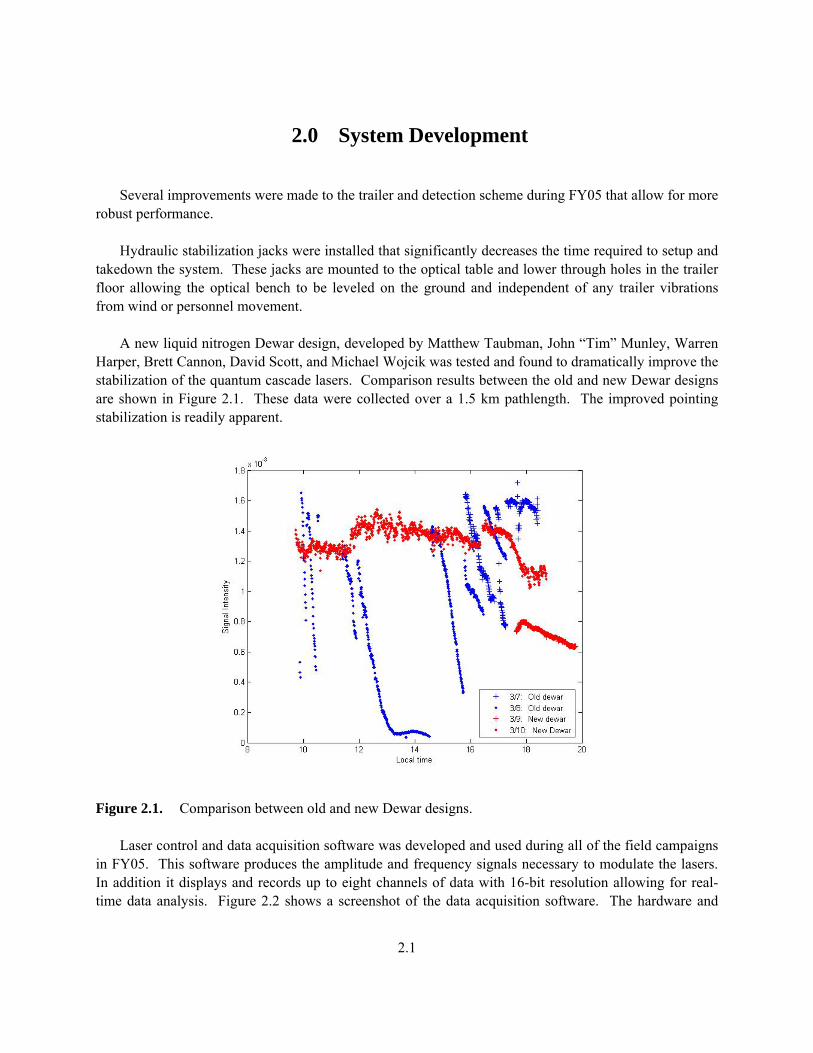
2.0 System Development Several improvements were made to the trailer and detection scheme during FY05 that allow for more robust performance. Hydraulic stabilization jacks were installed that significantly decreases the time required to setup and takedown the system. These jacks are mounted to the optical table and lower through holes in the trailer floor allowing the optical bench to be leveled on the ground and independent of any trailer vibrations from wind or personnel movement. A new liquid nitrogen Dewar design, developed by Matthew Taubman, John “Tim” Munley, Warren Harper, Brett Cannon, David Scott, and Michael Wojcik was tested and found to dramatically improve the stabilization of the quantum cascade lasers. Comparison results between the old and new Dewar designs are shown in Figure 2.1. These data were collected over a 1.5 km pathlength. The improved pointing stabilization is readily apparent.
Figure 2.1. Comparison between old and new Dewar designs. Laser control and data acquisition software was developed and used during all of the field campaigns in FY05. This software produces the amplitude and frequency signals necessary to modulate the lasers. In addition it displays and records up to eight channels of data with 16-bit resolution allowing for real-time data analysis. Figure 2.2 shows a screenshot of the data acquisition software. The hardware and
2.1
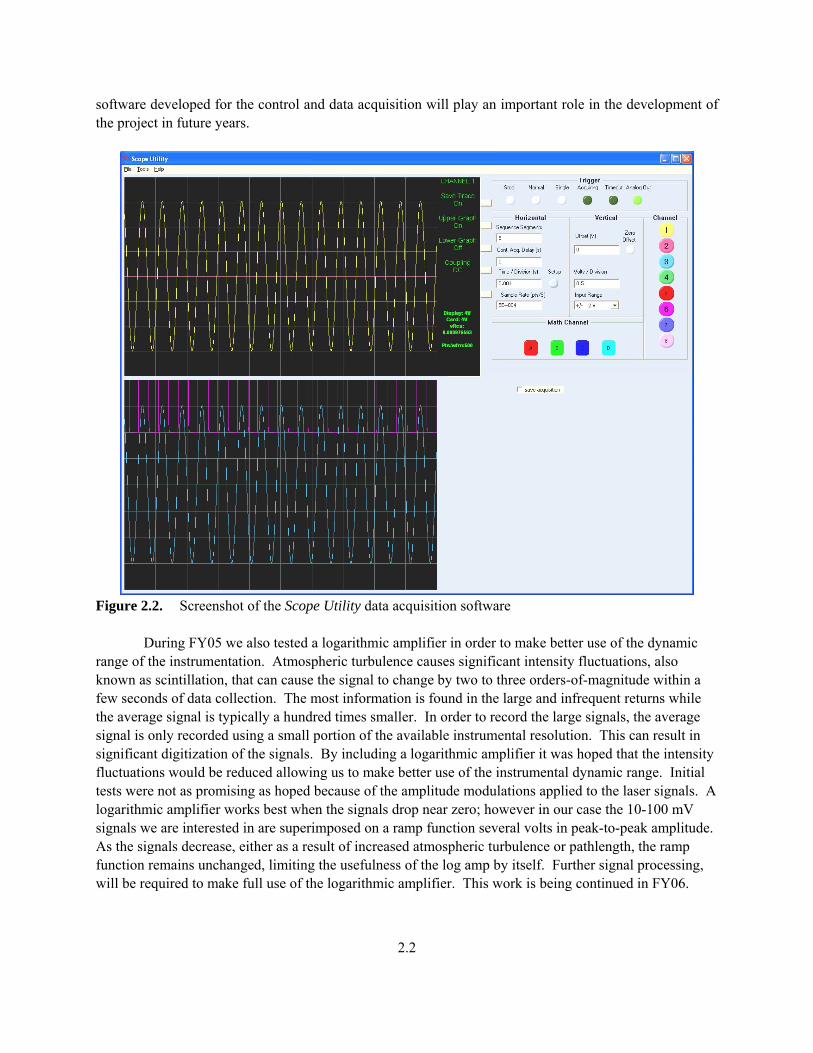
software developed for the control and data acquisition will play an important role in the development of the project in future years.
Figure 2.2. Screenshot of the Scope Utility data acquisition software During FY05 we also tested a logarithmic amplifier in order to make better use of the dynamic range of the instrumentation. Atmospheric turbulence causes significant intensity fluctuations, also known as scintillation, that can cause the signal to change by two to three orders-of-magnitude within a few seconds of data collection. The most information is found in the large and infrequent returns while the average signal is typically a hundred times smaller. In order to record the large signals, the average signal is only recorded using a small portion of the available instrumental resolution. This can result in significant digitization of the signals. By including a logarithmic amplifier it was hoped that the intensity fluctuations would be reduced allowing us to make better use of the instrumental dynamic range. Initial tests were not as promising as hoped because of the amplitude modulations applied to the laser signals. A logarithmic amplifier works best when the signals drop near zero; however in our case the 10-100 mV signals we are interested in are superimposed on a ramp function several volts in peak-to-peak amplitude. As the signals decrease, either as a result of increased atmospheric turbulence or pathlength, the ramp function remains unchanged, limiting the usefulness of the log amp by itself. Further signal processing, will be required to make full use of the logarithmic amplifier. This work is being continued in FY06.
2.2
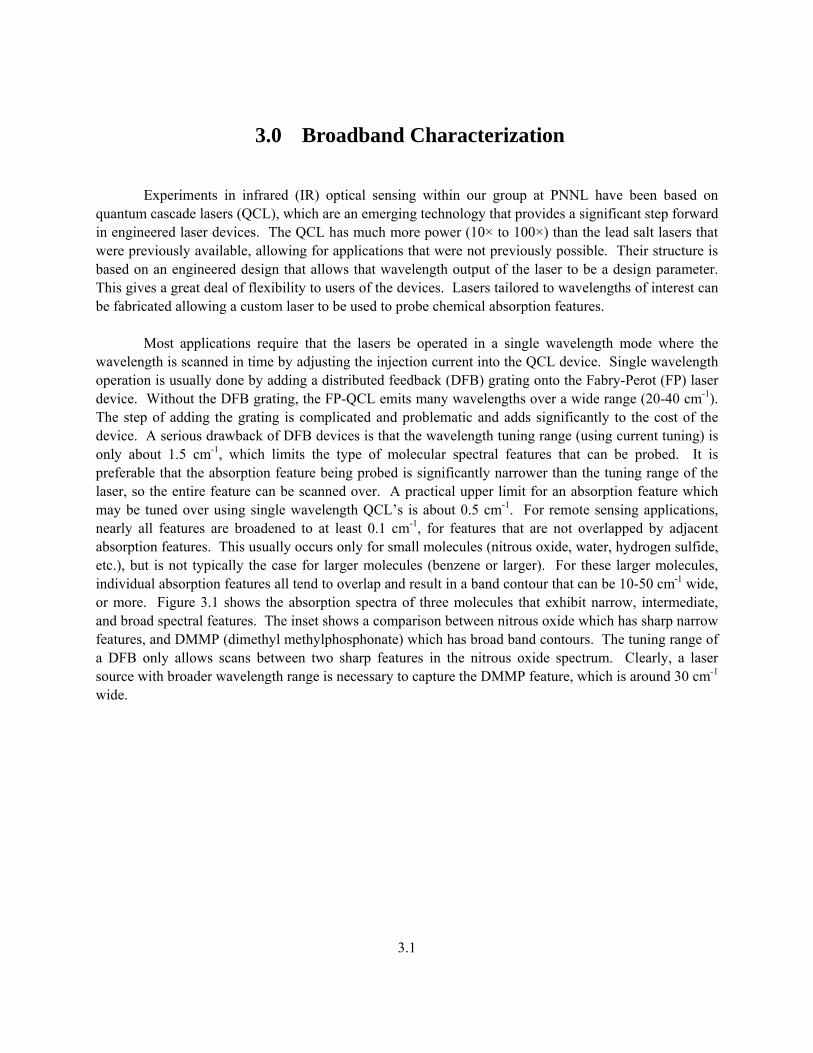
3.0 Broadband Characterization Experiments in infrared (IR) optical sensing within our group at PNNL have been based on quantum cascade lasers (QCL), which are an emerging technology that provides a significant step forward in engineered laser devices. The QCL has much more power (10× to 100×) than the lead salt lasers that were previously available, allowing for applications that were not previously possible. Their structure is based on an engineered design that allows that wavelength output of the laser to be a design parameter. This gives a great deal of flexibility to users of the devices. Lasers tailored to wavelengths of interest can be fabricated allowing a custom laser to be used to probe chemical absorption features. Most applications require that the lasers be operated in a single wavelength mode where the wavelength is scanned in time by adjusting the injection current into the QCL device. Single wavelength operation is usually done by adding a distributed feedback (DFB) grating onto the Fabry-Perot (FP) laser device. Without the DFB grating, the FP-QCL emits many wavelengths over a wide range (20-40 cm-1). The step of adding the grating is complicated and problematic and adds significantly to the cost of the device. A serious drawback of DFB devices is that the wavelength tuning range (using current tuning) is only about 1.5 cm-1, which limits the type of molecular spectral features that can be probed. It is preferable that the absorption feature being probed is significantly narrower than the tuning range of the laser, so the entire feature can be scanned over. A practical upper limit for an absorption feature which may be tuned over using single wavelength QCL’s is about 0.5 cm-1. For remote sensing applications, nearly all features are broadened to at least 0.1 cm-1, for features that are not overlapped by adjacent absorption features. This usually occurs only for small molecules (nitrous oxide, water, hydrogen sulfide, etc.), but is not typically the case for larger molecules (benzene or larger). For these larger molecules, individual absorption features all tend to overlap and result in a band contour that can be 10-50 cm-1 wide, or more. Figure 3.1 shows the absorption spectra of three molecules that exhibit narrow, intermediate, and broad spectral features. The inset shows a comparison between nitrous oxide which has sharp narrow features, and DMMP (dimethyl methylphosphonate) which has broad band contours. The tuning range of a DFB only allows scans between two sharp features in the nitrous oxide spectrum. Clearly, a laser source with broader wavelength range is necessary to capture the DMMP feature, which is around 30 cm-1 wide.
3.1
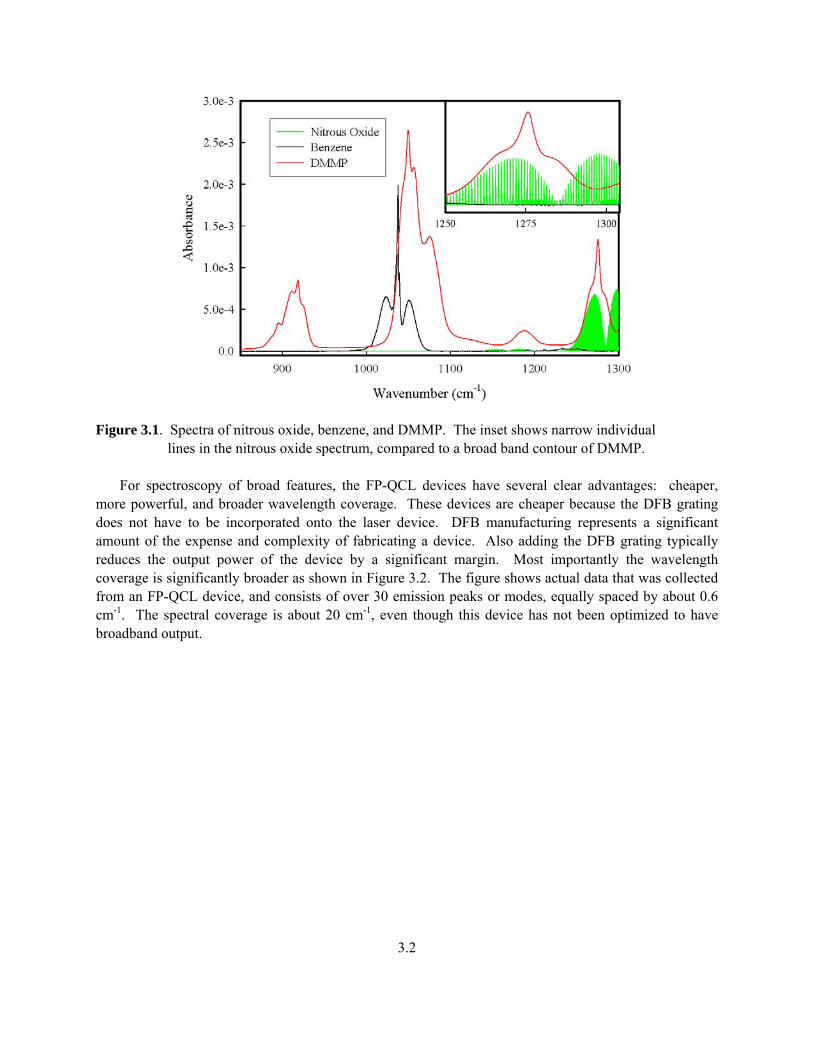
Figure 3.1. Spectra of nitrous oxide, benzene, and DMMP. The inset shows narrow individual lines in the nitrous oxide spectrum, compared to a broad band contour of DMMP. For spectroscopy of broad features, the FP-QCL devices have several clear advantages: cheaper, more powerful, and broader wavelength coverage. These devices are cheaper because the DFB grating does not have to be incorporated onto the laser device. DFB manufacturing represents a significant amount of the expense and complexity of fabricating a device. Also adding the DFB grating typically reduces the output power of the device by a significant margin. Most importantly the wavelength coverage is significantly broader as shown in Figure 3.2. The figure shows actual data that was collected from an FP-QCL device, and consists of over 30 emission peaks or modes, equally spaced by about 0.6 cm-1. The spectral coverage is about 20 cm-1, even though this device has not been optimized to have broadband output.
3.2
Figure 3.2. Multimode output of a Fabry-Perot QCL device with a 20 cm-1 spectral bandwidth. The red inset represents a single mode laser output and the associated arrow represents a 1 cm-1 tuning range.
3.3

4.0 Model Development During FY05 significant progress was made on the numerical model of system performance. A numerical simulation of laser beam propagation through atmospheric turbulence has been developed and agrees well with the experimental observations. In addition components of IR SAGE, an atmospheric model developed under previous NA-22 projects, have been incorporated into the beam propagation model to allow for one-to-one comparison with experimental detection sensitivities. 4.1 Beam-propagation Simulations In an effort to better understand the impact of atmospheric turbulence on the performance of the FM DIAL trailer-based system, we constructed a numerical simulation of laser beam propagation through a series of random phase screens. Under this technique the beam undergoes free-space propagation between phase screens. Each phase screen is a thin sheet that adjusts the phase of the beam. These phase fluctuations become amplitude fluctuations during the free-space propagation between screens. The atmosphere is assumed to be “frozen” over the time scales necessary for the round-trip beam propagation, typically on the order of tens of microseconds. The spatial variation in the atmosphere over the path is modeled by using several equally spaced phase screens between the transmitter and the retro-reflector. Techniques for modeling laser beam propagation by use of thin phase screens have been discussed in the literature for several years (Martin, 1988; Martin, 1990; Coles, 1995; Frehlich, 2000; Belmonte, 2000). PNNL’s numerical simulations follow the same general techniques. The phase screens are N x N arrays of random complex numbers whose statistics match those of the atmospheric fluctuations in the index of refraction. The spectrum of the fluctuations in the index of refraction has many forms ranging from the simple power-law Kolmogorov spectrum (Andrews, 1998) 2 2 2 11/ 6( , ) 0.033 ( )n x y n x yk k C k k −Φ = +
to the more realistic atmospheric spectrum developed by Hill, (Hill, 1978) and defined analytically by Andrews (Andrews, 1998)
7 /122 2 2 22
2 2
11/ 62 22 2
2 2
( , ) 0.033 1 1.802 0.254
1exp
x y x yn x y n
l l
x yx y
l o
k k k kk k C
k k
k kk k
k L
−
−
⎛ ⎞⎛ ⎞+ +⎜ ⎟Φ = + − ⎜ ⎟⎜ ⎟⎜ ⎟⎝ ⎠⎝ ⎠
⎡ ⎤+ ⎛ ⎞× + +⎢ ⎥⎜ ⎟
⎢ ⎥ ⎝ ⎠⎣ ⎦
where Cn
2 is the structure constant of the index of refraction, Lo2 is the outer scale of turbulence and ki =
3.3/lo with lo equal to the inner scale of turbulence. The outer scale of turbulence is the largest eddy size formed by the injection of turbulent energy such as wind sheer. The inner scale of turbulence is the
4.1
smallest stable eddy size. Eddies smaller than the inner scale are dissipated into heat. The phase spectrum follows from the index of refraction spectrum 2( , ) 2 ( , )x y o n xk k k Z k kπΦ = Δ Φ y
where ΔZ is the spacing between subsequent phase screens. The variance of the distribution can then be found by
2
2 2( , ) ( , )x y xk k k kN xπσ ⎛ ⎞= Φ⎜ ⎟Δ⎝ ⎠
y
where N 2 is the number of grid elements and Δx is the grid spacing. The phase screen in x-space is calculated by ( , ) ( , )x yx y C k kφ σ⎡ ⎤= ⎣ ⎦FFT
where FFT represents a Fast Fourier Transform and C is an N xN array of complex random numbers with a mean of zero and a variance of one. This results in two independent phase screens from the real and imaginary parts of φ(x, y). All propagation takes place in the z-direction using the electric field, the amplitude of which is represented by U. To obtain the final results, the amplitude of the electric field is transformed into intensity. The simulation begins with a collimated Gaussian beam
⎥⎥
⎦
⎤
⎢⎢
⎣
⎡ −−= 2
22
2 exp2),(oo
oW
yx
WyxU
π
where Wo is the initial 1/e2 intensity radius. The constant factor normalizes the intensity such that
*( , ) d d ( , ) ( , ) d d 1I x y x y U x y U x y x y= =∫ ∫
where U*(x, y) is the complex conjugate of U(x, y). This initial beam is then propagated using the standard Fourier optics techniques to move between x-space and k-space. Under these circumstances the propagation operator in k-space becomes
( )2 2
( , ) exp2
x yprop x y
o
i Z k kU k k
k
⎡ ⎤− Δ +⎢ ⎥=⎢ ⎥⎣ ⎦
where ΔZ is the distance between phase screens, ko = 2π/λ is the wave number of the laser beam and Δx is again the grid spacing of the simulation. Using the equations above, the amplitude of the electric field just prior to the first phase screen would be [ ]1
1 ( , ) ( , ) ( , )o prop xU x y U x y U k k−− y⎡ ⎤= ⎣ ⎦FFT FFT
and the field just after the phase screen would be [ ]1 1( , ) ( , ) exp ( , )U x y U x y i x yφ+ −=
where φ(x, y) is the phase screen calculated as described above. This procedure is then repeated for the second phase screen by replacing Uo(x, y) with U1+ (x, y) and so on until the last phase screen is reached.
4.2
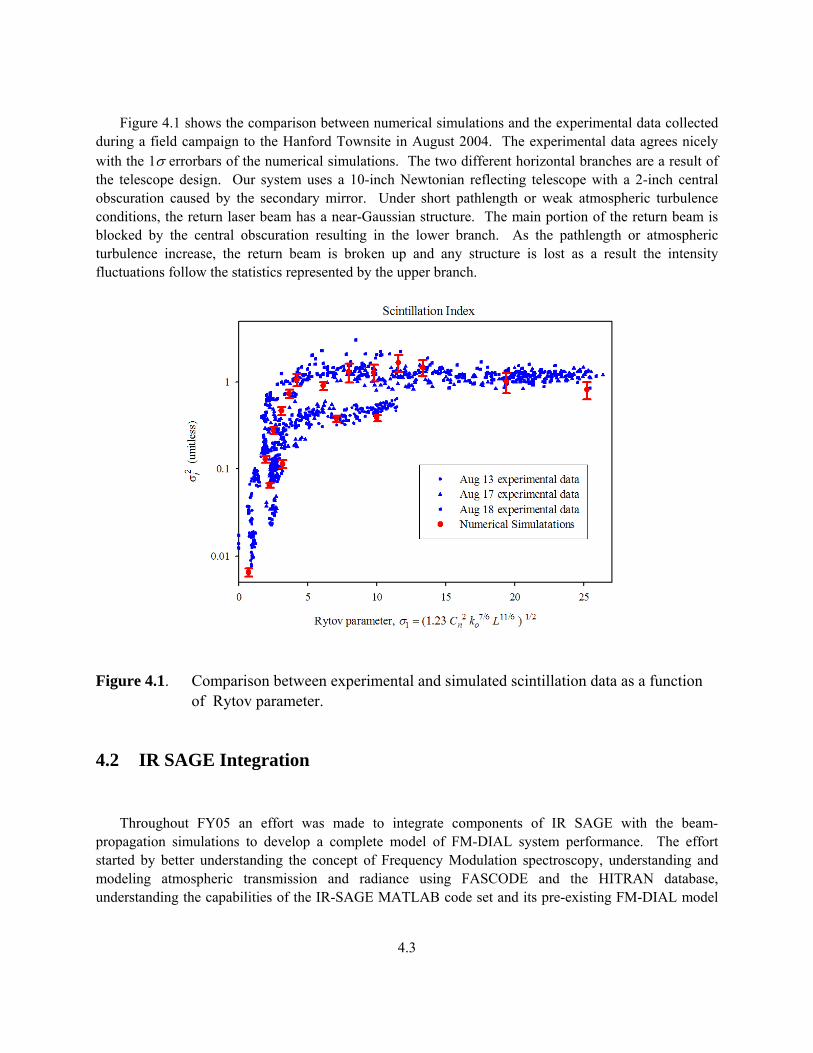
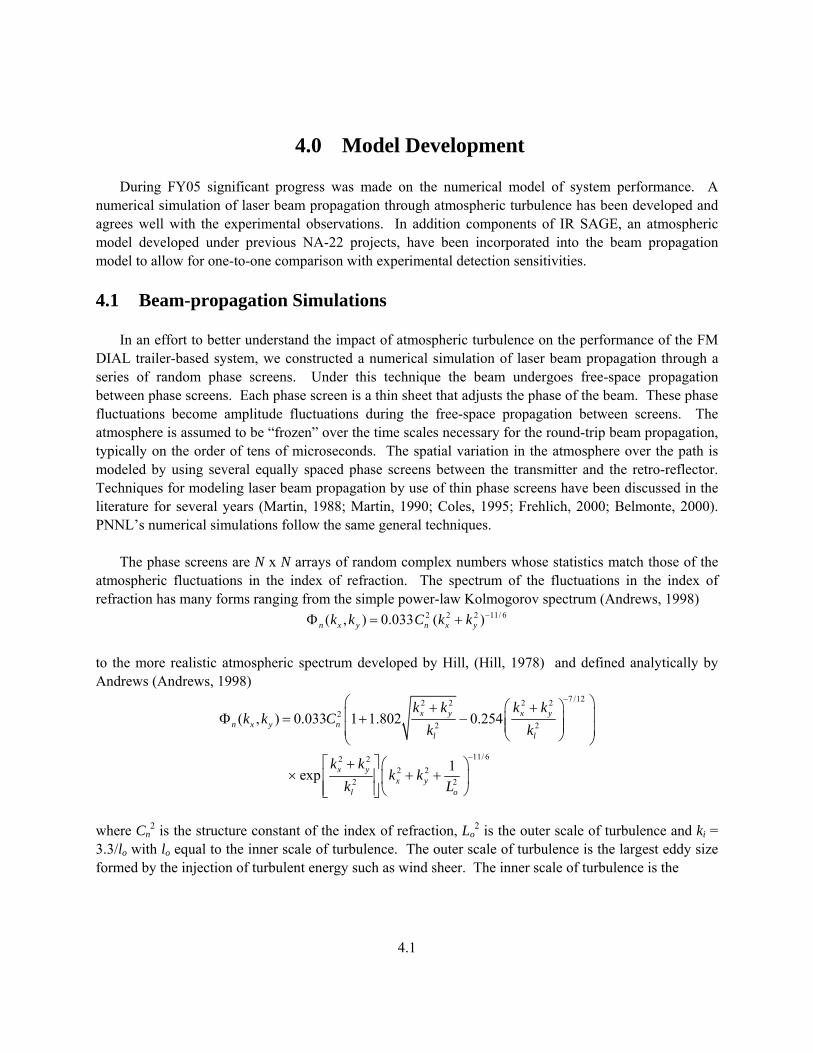
Figure 4.1 shows the comparison between numerical simulations and the experimental data collected during a field campaign to the Hanford Townsite in August 2004. The experimental data agrees nicely with the 1σ errorbars of the numerical simulations. The two different horizontal branches are a result of the telescope design. Our system uses a 10-inch Newtonian reflecting telescope with a 2-inch central obscuration caused by the secondary mirror. Under short pathlength or weak atmospheric turbulence conditions, the return laser beam has a near-Gaussian structure. The main portion of the return beam is blocked by the central obscuration resulting in the lower branch. As the pathlength or atmospheric turbulence increase, the return beam is broken up and any structure is lost as a result the intensity fluctuations follow the statistics represented by the upper branch.
Figure 4.1. Comparison between experimental and simulated scintillation data as a function of Rytov parameter. 4.2 IR SAGE Integration Throughout FY05 an effort was made to integrate components of IR SAGE with the beam-propagation simulations to develop a complete model of FM-DIAL system performance. The effort started by better understanding the concept of Frequency Modulation spectroscopy, understanding and modeling atmospheric transmission and radiance using FASCODE and the HITRAN database, understanding the capabilities of the IR-SAGE MATLAB code set and its pre-existing FM-DIAL model
4.3
(Sheen, et. al. 2002), examining the current FM-DIAL system setup, and exchanging code and information with David Sheen who was the primary modeler prior to FY2005. Pieces from the proof-of-concept modeling for FM-DIAL in 2000 (Sheen, 2000), the IR-SAGE project (Sheen, et. al., 2001, 2002), and the Artemis Project (Sheen, 2004), in addition with other non-published work, will all play a part in the future FM-DIAL system model. Objectives that have already been met include:
• Installation of the HITRAN database and FASCODE atmospheric transmission model. • Generation of sample atmospheric transmission spectra over specified wavelength intervals in the
infrared spectrum using FASCODE. • Investigation of the IR-SAGE received signal generator and physics model and its pertinence to a
stand-alone FM-DIAL model. Large portions of these models give effects that are insignificant in the current FM-DIAL system (such as ground clutter), since a retro-reflector is being used as a target. Turbulence, which is not modeled in IR-SAGE, swamps these other effects when a retro-reflector is used. The physics model includes:
⎯ ground variability, ⎯ atmospheric variability, ⎯ backscatter (though the current FM-DIAL system is not using aerosols in experiments), ⎯ instrument noise, ⎯ speckle noise induced from rough targets (which is not currently pertinent to the project
because a retro-reflector is currently being used). • Analysis of Monte Carlo techniques used in IR-SAGE for determining the chemical detection
sensitivity of modeled sensors. • Review of the Artemis and IR-SAGE MATLAB source code.
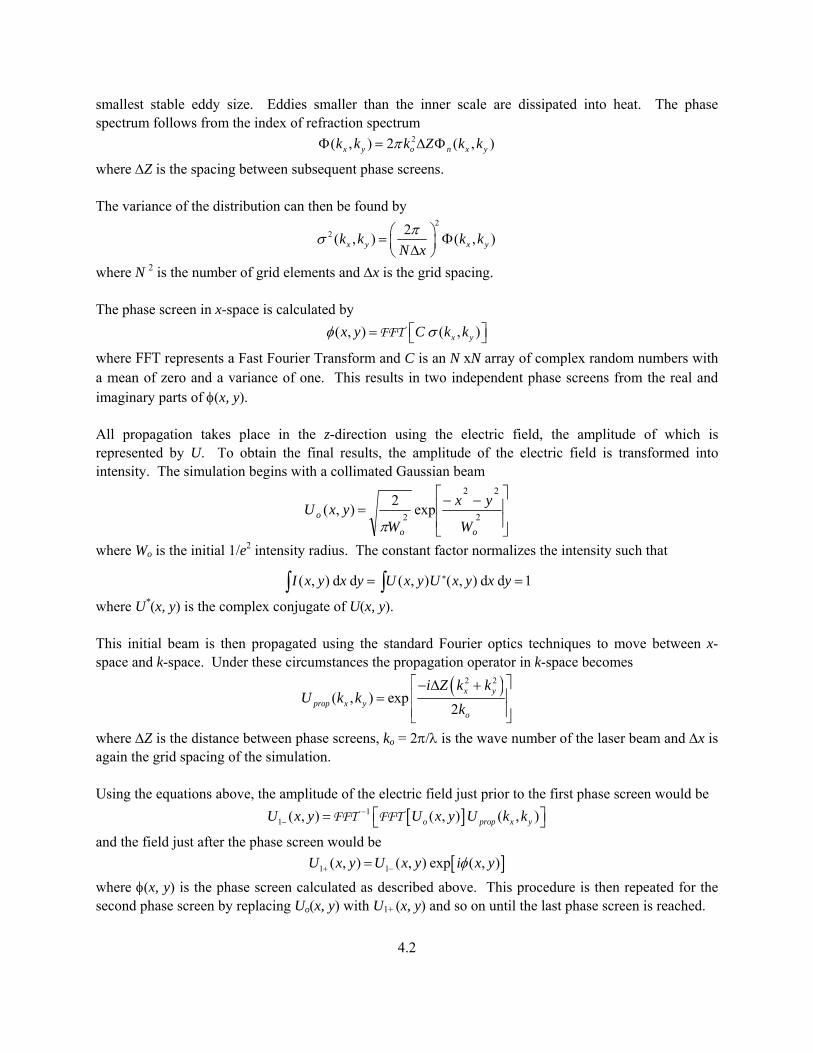
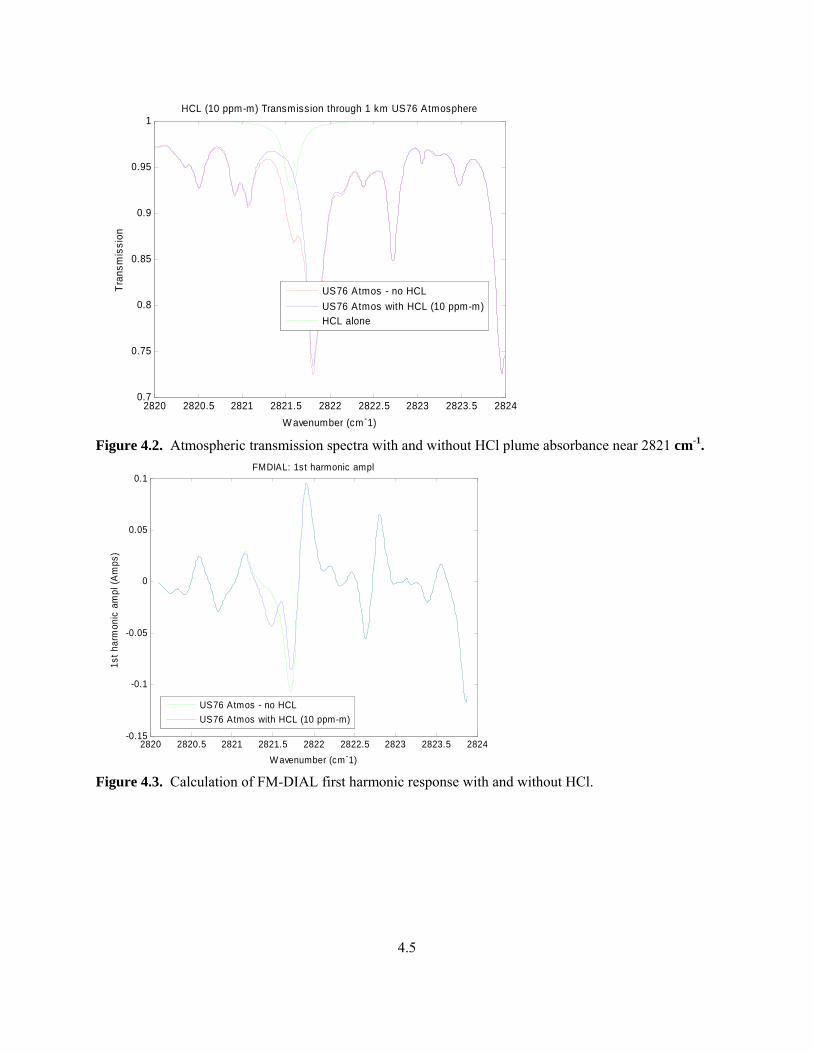
A key portion of the IR-SAGE FM-DIAL sensor model developed in FY02 (Sheen, et. al. 2002) concerns modeling the transmission of a continuous active IR laser beam through the atmosphere and finding the resulting harmonics from a frequency modulation over the transmission spectra. Scripts were recreated in MATLAB independent of the IR-SAGE code to better understand this mechanism and results identical with those published in Sheen, et. al., 2002 were developed. Below are these reproduced results. In Figure 4.2 the atmosphere is modeled using FASCODE, assuming a 1 km of US 1976 Standard Atmosphere within a restricted wavenumber range of 2820 cm-1 and 2824 cm-1. The chemical plume consists of HCl concentrated at 10 ppm-m (parts per million-meter). Within the specified wavenumber range HCl has a peak Lorenztian absorptance feature at 2821.6 cm-1 of approximately 0.07. Using frequency modulation spectroscopy on these spectra over this wavenumber range gives a first harmonic response illustrated in Figure otice how subtle the HCl transmission is when superimposed on the general atmospheric transmission in Figure 4.2, yet is clearly discernable on the superimposed first harmonic in Figure 4.3.
4.4
2820 2820.5 2821 2821.5 2822 2822.5 2823 2823.5 28240.7
0.75
0.8
0.85
0.9
0.95
1
W avenumber (cm-1)
Tran
smis
sion
HCL (10 ppm-m) Transmission through 1 km US76 Atmosphere
US76 Atmos - no HCLUS76 Atmos with HCL (10 ppm-m)HCL alone
Figure 4.2. Atmospheric transmission spectra with and without HCl plume absorbance near 2821 cm-1.
2820 2820.5 2821 2821.5 2822 2822.5 2823 2823.5 2824-0.15
-0.1
-0.05
0
0.05
0.1
W avenumber (cm-1)
1st h
arm
onic
am
pl (A
mps
)
FMDIAL: 1st harmonic ampl
US76 Atmos - no HCLUS76 Atmos with HCL (10 ppm-m)
Figure 4.3. Calculation of FM-DIAL first harmonic response with and without HCl.
4.5

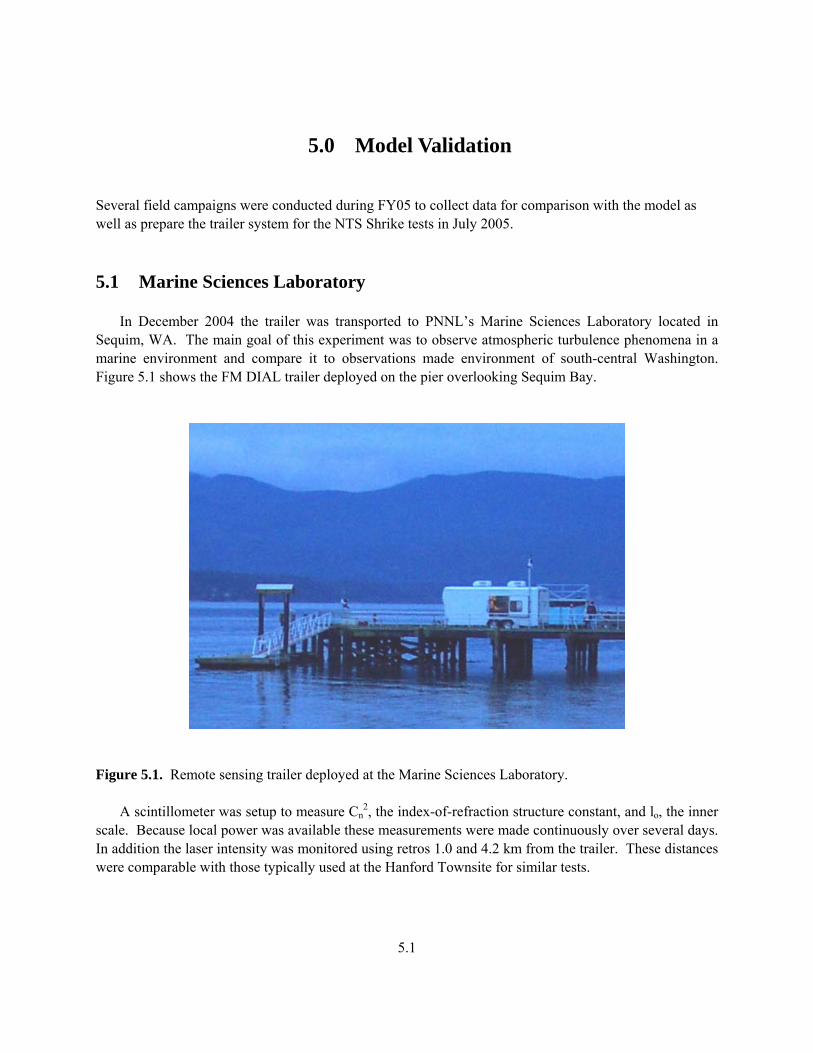
5.0 Model Validation Several field campaigns were conducted during FY05 to collect data for comparison with the model as well as prepare the trailer system for the NTS Shrike tests in July 2005. 5.1 Marine Sciences Laboratory In December 2004 the trailer was transported to PNNL’s Marine Sciences Laboratory located in Sequim, WA. The main goal of this experiment was to observe atmospheric turbulence phenomena in a marine environment and compare it to observations made environment of south-central Washington. Figure 5.1 shows the FM DIAL trailer deployed on the pier overlooking Sequim Bay.
Figure 5.1. Remote sensing trailer deployed at the Marine Sciences Laboratory. A scintillometer was setup to measure Cn
2, the index-of-refraction structure constant, and lo, the inner scale. Because local power was available these measurements were made continuously over several days. In addition the laser intensity was monitored using retros 1.0 and 4.2 km from the trailer. These distances were comparable with those typically used at the Hanford Townsite for similar tests.
5.1
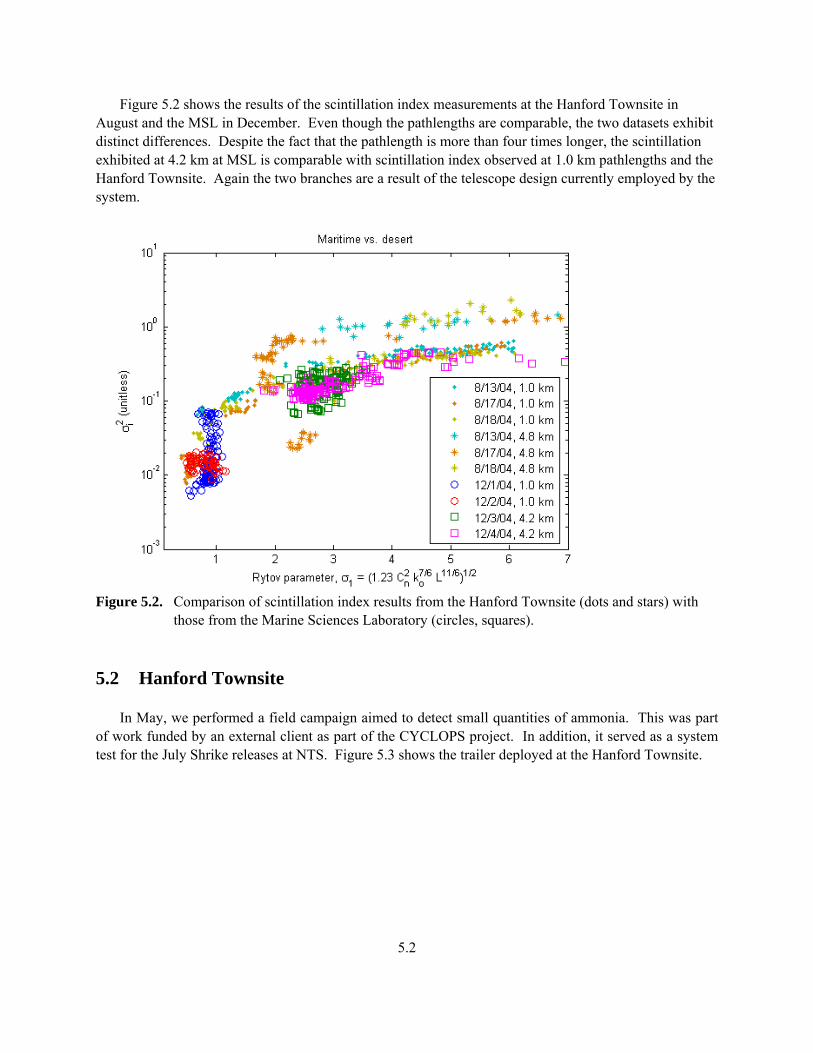
Figure 5.2 shows the results of the scintillation index measurements at the Hanford Townsite in August and the MSL in December. Even though the pathlengths are comparable, the two datasets exhibit distinct differences. Despite the fact that the pathlength is more than four times longer, the scintillation exhibited at 4.2 km at MSL is comparable with scintillation index observed at 1.0 km pathlengths and the Hanford Townsite. Again the two branches are a result of the telescope design currently employed by the system.
Figure 5.2. Comparison of scintillation index results from the Hanford Townsite (dots and stars) with those from the Marine Sciences Laboratory (circles, squares). 5.2 Hanford Townsite In May, we performed a field campaign aimed to detect small quantities of ammonia. This was part of work funded by an external client as part of the CYCLOPS project. In addition, it served as a system test for the July Shrike releases at NTS. Figure 5.3 shows the trailer deployed at the Hanford Townsite.
5.2
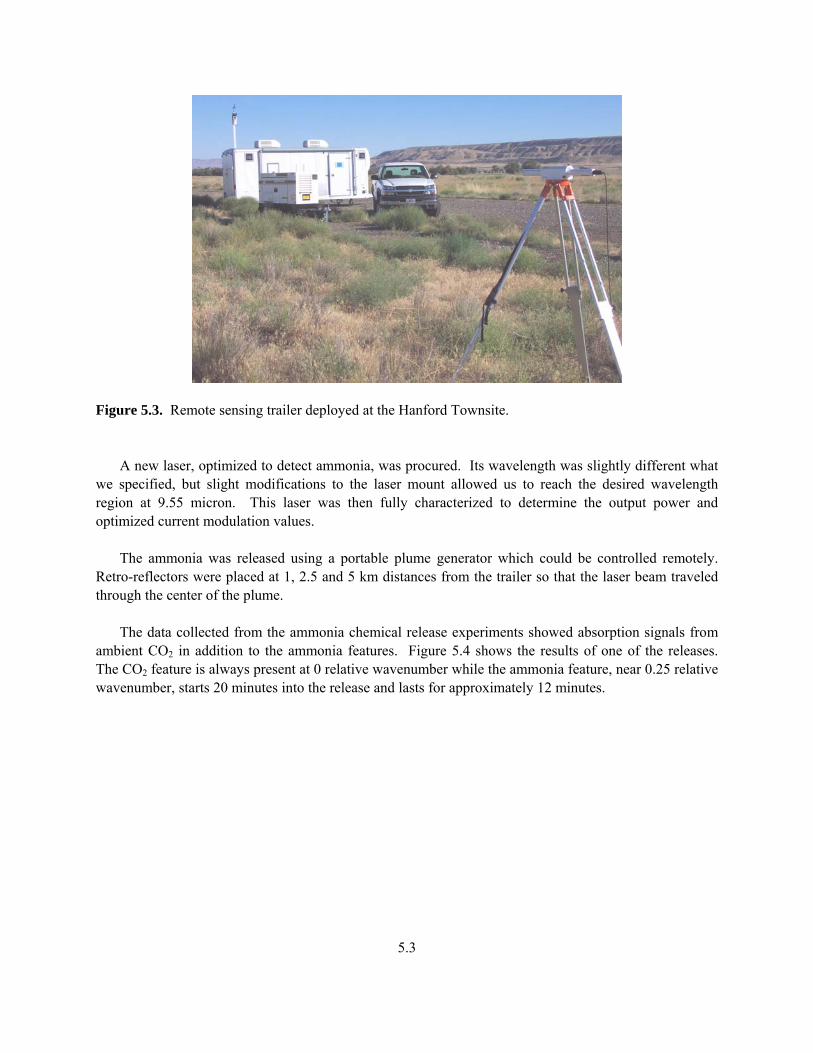
Figure 5.3. Remote sensing trailer deployed at the Hanford Townsite. A new laser, optimized to detect ammonia, was procured. Its wavelength was slightly different what we specified, but slight modifications to the laser mount allowed us to reach the desired wavelength region at 9.55 micron. This laser was then fully characterized to determine the output power and optimized current modulation values. The ammonia was released using a portable plume generator which could be controlled remotely. Retro-reflectors were placed at 1, 2.5 and 5 km distances from the trailer so that the laser beam traveled through the center of the plume. The data collected from the ammonia chemical release experiments showed absorption signals from ambient CO2 in addition to the ammonia features. Figure 5.4 shows the results of one of the releases. The CO2 feature is always present at 0 relative wavenumber while the ammonia feature, near 0.25 relative wavenumber, starts 20 minutes into the release and lasts for approximately 12 minutes.
5.3
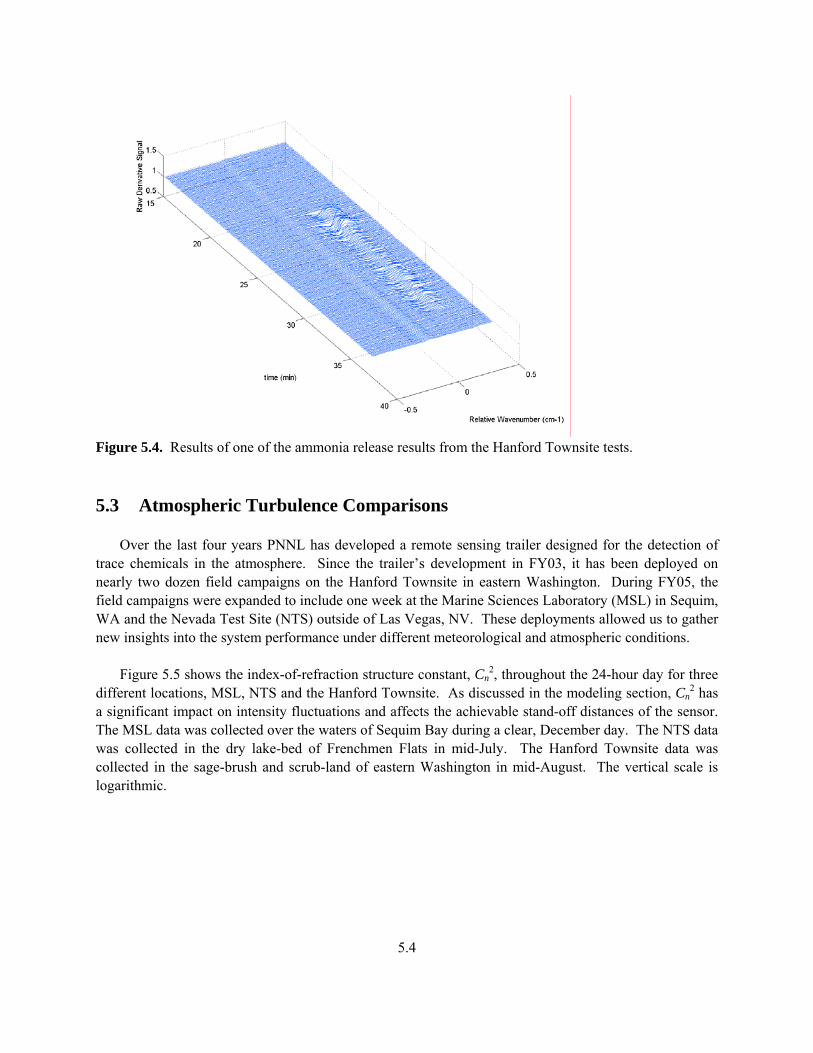
Figure 5.4. Results of one of the ammonia release results from the Hanford Townsite tests. 5.3 Atmospheric Turbulence Comparisons
Over the last four years PNNL has developed a remote sensing trailer designed for the detection of trace chemicals in the atmosphere. Since the trailer’s development in FY03, it has been deployed on nearly two dozen field campaigns on the Hanford Townsite in eastern Washington. During FY05, the field campaigns were expanded to include one week at the Marine Sciences Laboratory (MSL) in Sequim, WA and the Nevada Test Site (NTS) outside of Las Vegas, NV. These deployments allowed us to gather new insights into the system performance under different meteorological and atmospheric conditions. Figure 5.5 shows the index-of-refraction structure constant, Cn
2, throughout the 24-hour day for three different locations, MSL, NTS and the Hanford Townsite. As discussed in the modeling section, Cn
2 has a significant impact on intensity fluctuations and affects the achievable stand-off distances of the sensor. The MSL data was collected over the waters of Sequim Bay during a clear, December day. The NTS data was collected in the dry lake-bed of Frenchmen Flats in mid-July. The Hanford Townsite data was collected in the sage-brush and scrub-land of eastern Washington in mid-August. The vertical scale is logarithmic.
5.4
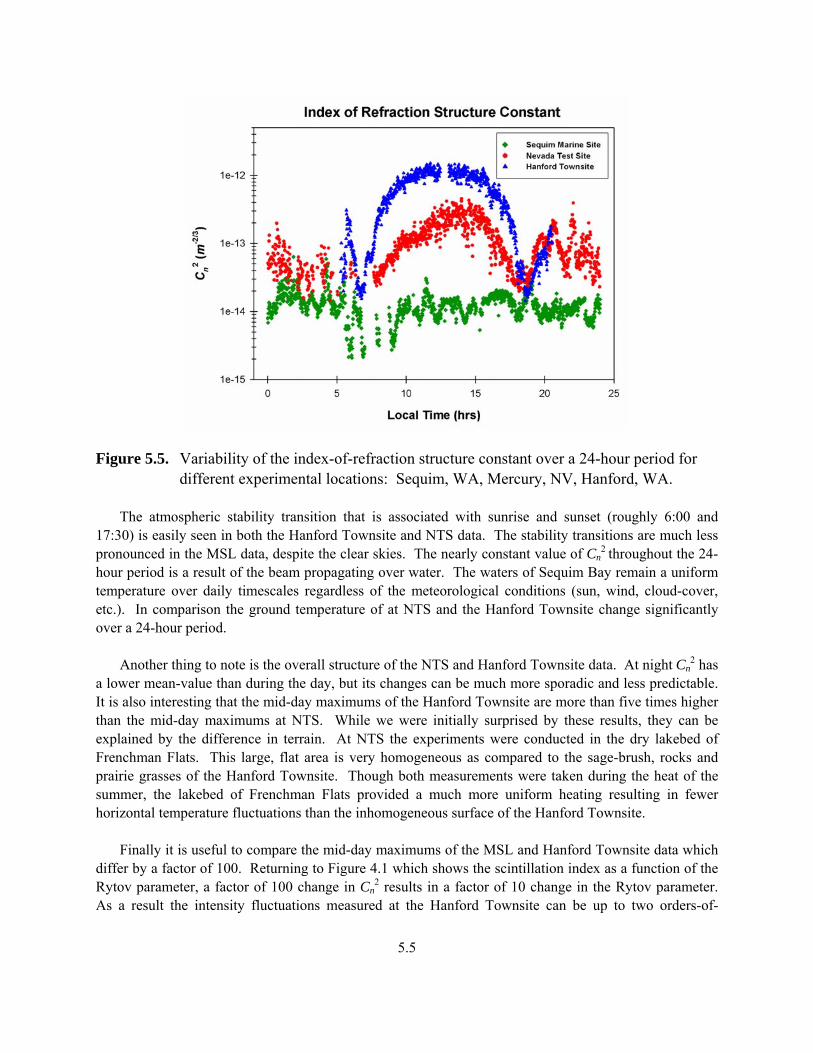
Figure 5.5. Variability of the index-of-refraction structure constant over a 24-hour period for different experimental locations: Sequim, WA, Mercury, NV, Hanford, WA. The atmospheric stability transition that is associated with sunrise and sunset (roughly 6:00 and 17:30) is easily seen in both the Hanford Townsite and NTS data. The stability transitions are much less pronounced in the MSL data, despite the clear skies. The nearly constant value of Cn
2 throughout the 24-
hour period is a result of the beam propagating over water. The waters of Sequim Bay remain a uniform temperature over daily timescales regardless of the meteorological conditions (sun, wind, cloud-cover, etc.). In comparison the ground temperature of at NTS and the Hanford Townsite change significantly over a 24-hour period. Another thing to note is the overall structure of the NTS and Hanford Townsite data. At night Cn
2 has a lower mean-value than during the day, but its changes can be much more sporadic and less predictable. It is also interesting that the mid-day maximums of the Hanford Townsite are more than five times higher than the mid-day maximums at NTS. While we were initially surprised by these results, they can be explained by the difference in terrain. At NTS the experiments were conducted in the dry lakebed of Frenchman Flats. This large, flat area is very homogeneous as compared to the sage-brush, rocks and prairie grasses of the Hanford Townsite. Though both measurements were taken during the heat of the summer, the lakebed of Frenchman Flats provided a much more uniform heating resulting in fewer horizontal temperature fluctuations than the inhomogeneous surface of the Hanford Townsite. Finally it is useful to compare the mid-day maximums of the MSL and Hanford Townsite data which differ by a factor of 100. Returning to Figure 4.1 which shows the scintillation index as a function of the Rytov parameter, a factor of 100 change in Cn
2 results in a factor of 10 change in the Rytov parameter. As a result the intensity fluctuations measured at the Hanford Townsite can be up to two orders-of-
5.5

magnitude stronger than the fluctuations measured over the same pathlength at MSL, implying much larger achievable pathlengths over water. These observations have important consequences for potential CONOPS.
5.6
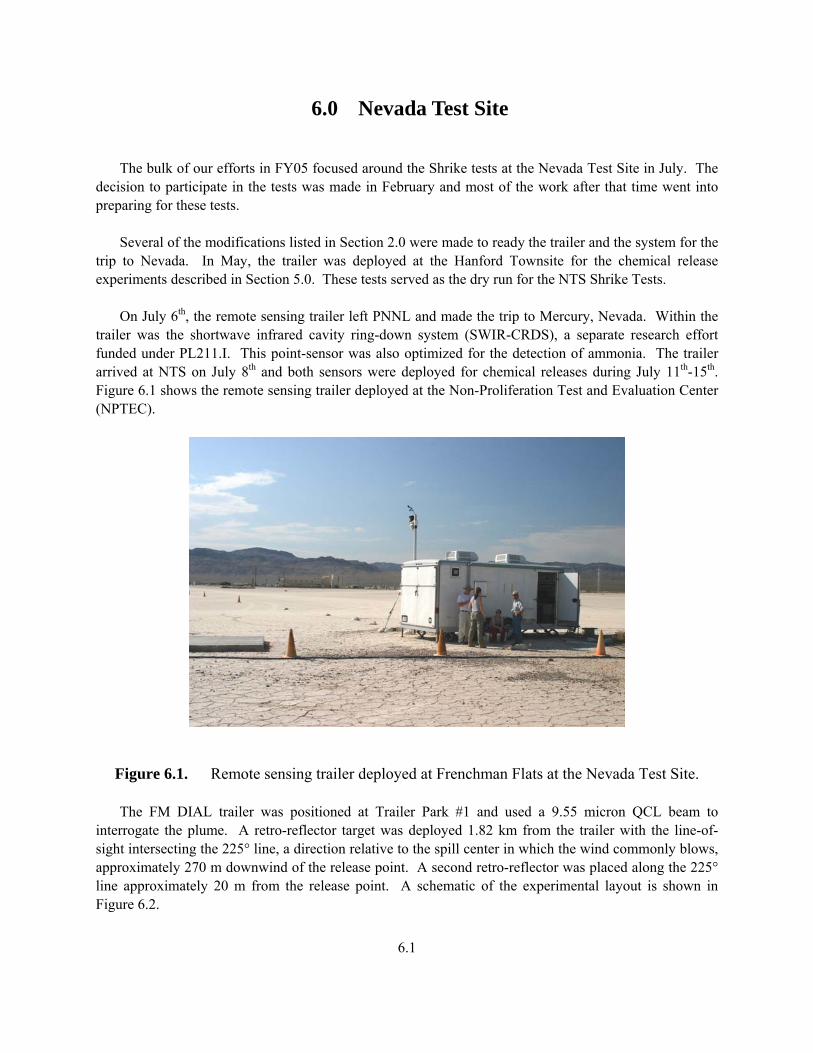
6.0 Nevada Test Site The bulk of our efforts in FY05 focused around the Shrike tests at the Nevada Test Site in July. The decision to participate in the tests was made in February and most of the work after that time went into preparing for these tests. Several of the modifications listed in Section 2.0 were made to ready the trailer and the system for the trip to Nevada. In May, the trailer was deployed at the Hanford Townsite for the chemical release experiments described in Section 5.0. These tests served as the dry run for the NTS Shrike Tests. On July 6th, the remote sensing trailer left PNNL and made the trip to Mercury, Nevada. Within the trailer was the shortwave infrared cavity ring-down system (SWIR-CRDS), a separate research effort funded under PL211.I. This point-sensor was also optimized for the detection of ammonia. The trailer arrived at NTS on July 8th and both sensors were deployed for chemical releases during July 11th-15th. Figure 6.1 shows the remote sensing trailer deployed at the Non-Proliferation Test and Evaluation Center (NPTEC).
Figure 6.1. Remote sensing trailer deployed at Frenchman Flats at the Nevada Test Site. The FM DIAL trailer was positioned at Trailer Park #1 and used a 9.55 micron QCL beam to interrogate the plume. A retro-reflector target was deployed 1.82 km from the trailer with the line-of-sight intersecting the 225° line, a direction relative to the spill center in which the wind commonly blows, approximately 270 m downwind of the release point. A second retro-reflector was placed along the 225° line approximately 20 m from the release point. A schematic of the experimental layout is shown in Figure 6.2.
6.1

Figure 6.2. Experimental layout of FM DIAL trailer and retro-reflector relative to the ammonia release point at the Nevada Test Site. The FM-DIAL trailer collected data from the afternoon of July 11th through the afternoon of July 14th. Unfavorable winds canceled the chemical releases on July 11th, 12th and 14th, but the FM-DIAL system detected ammonia in all four of the releases on July 13th. During the first release the system was aligned with the retro 20 m from the release point. In this case the ammonia signal was so strong that at times 100% of the laser light was absorbed. This is in contrast to the typical 0.1% or smaller absorbencies typically observed. Our usual data analysis routines were unable to process the large signals properly. During the next three releases, we monitored the plume using the 1.82 km retro-reflector 270 m down the 225 line from the release point. The results of these releases are shown in Figure 6.3. Classification restrictions from an external client require that only the normalized signal response be included in this document.
6.2
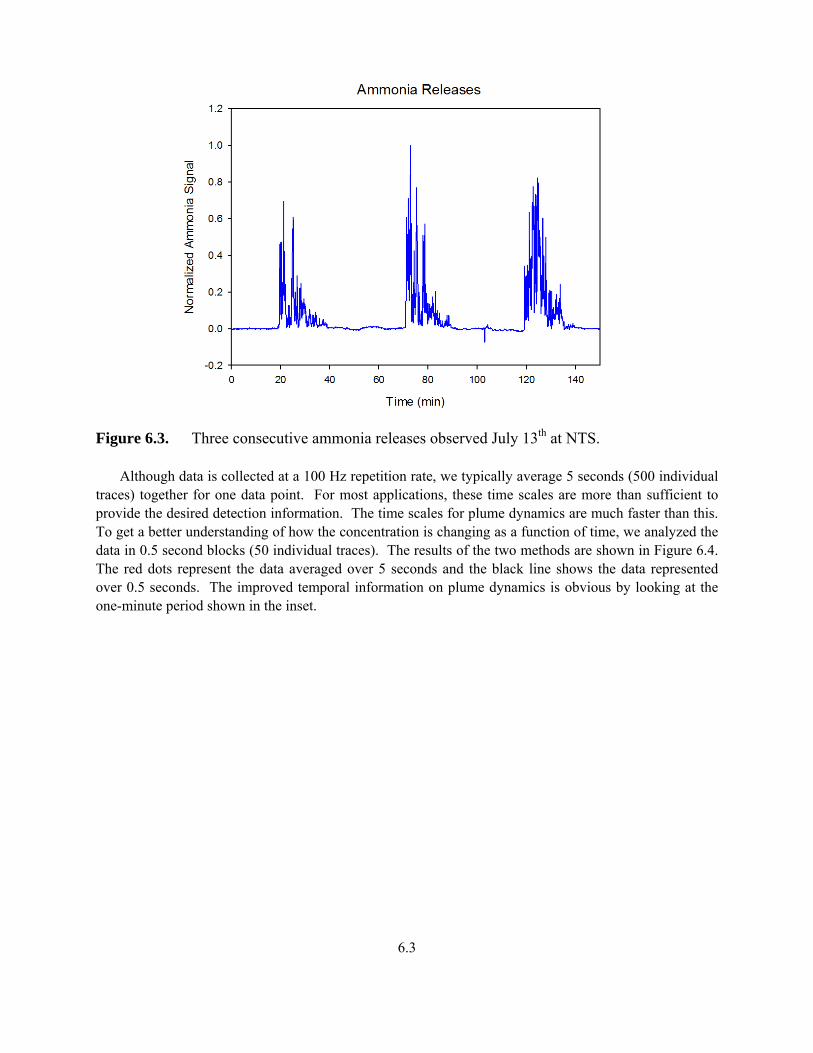
Figure 6.3. Three consecutive ammonia releases observed July 13th at NTS. Although data is collected at a 100 Hz repetition rate, we typically average 5 seconds (500 individual traces) together for one data point. For most applications, these time scales are more than sufficient to provide the desired detection information. The time scales for plume dynamics are much faster than this. To get a better understanding of how the concentration is changing as a function of time, we analyzed the data in 0.5 second blocks (50 individual traces). The results of the two methods are shown in Figure 6.4. The red dots represent the data averaged over 5 seconds and the black line shows the data represented over 0.5 seconds. The improved temporal information on plume dynamics is obvious by looking at the one-minute period shown in the inset.
6.3
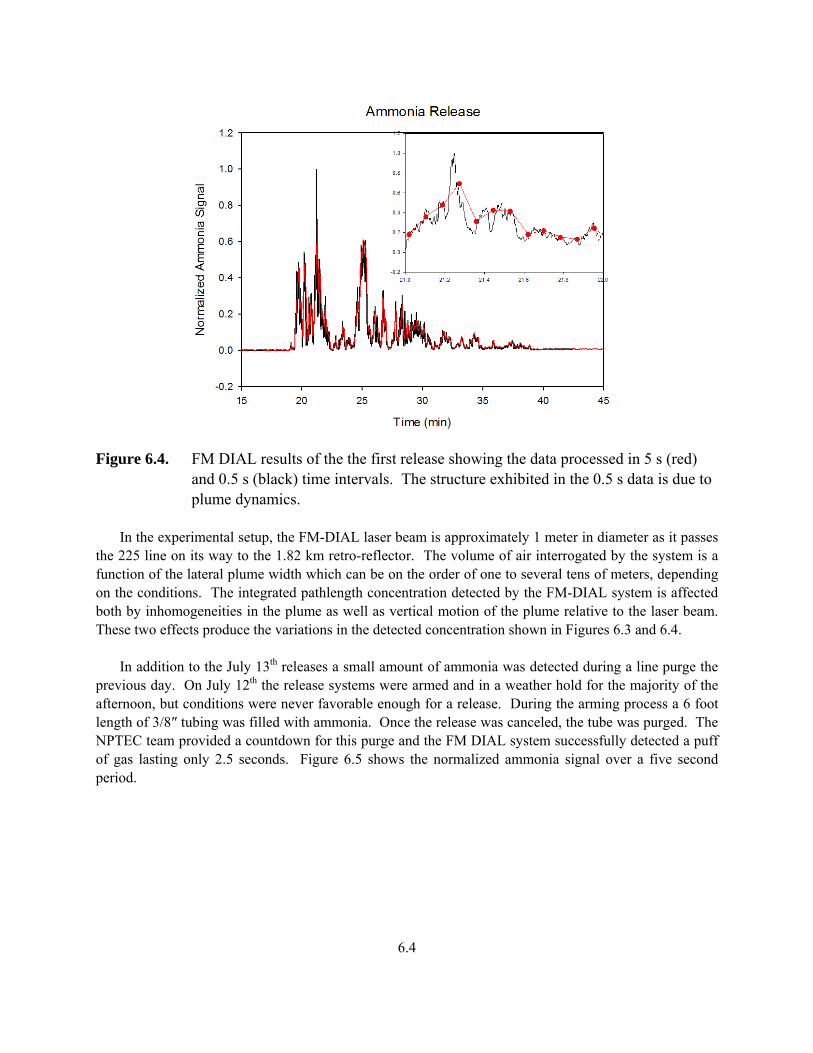
Figure 6.4. FM DIAL results of the the first release showing the data processed in 5 s (red) and 0.5 s (black) time intervals. The structure exhibited in the 0.5 s data is due to plume dynamics. In the experimental setup, the FM-DIAL laser beam is approximately 1 meter in diameter as it passes the 225 line on its way to the 1.82 km retro-reflector. The volume of air interrogated by the system is a function of the lateral plume width which can be on the order of one to several tens of meters, depending on the conditions. The integrated pathlength concentration detected by the FM-DIAL system is affected both by inhomogeneities in the plume as well as vertical motion of the plume relative to the laser beam. These two effects produce the variations in the detected concentration shown in Figures 6.3 and 6.4. In addition to the July 13th releases a small amount of ammonia was detected during a line purge the previous day. On July 12th the release systems were armed and in a weather hold for the majority of the afternoon, but conditions were never favorable enough for a release. During the arming process a 6 foot length of 3/8″ tubing was filled with ammonia. Once the release was canceled, the tube was purged. The NPTEC team provided a countdown for this purge and the FM DIAL system successfully detected a puff of gas lasting only 2.5 seconds. Figure 6.5 shows the normalized ammonia signal over a five second period.
6.4
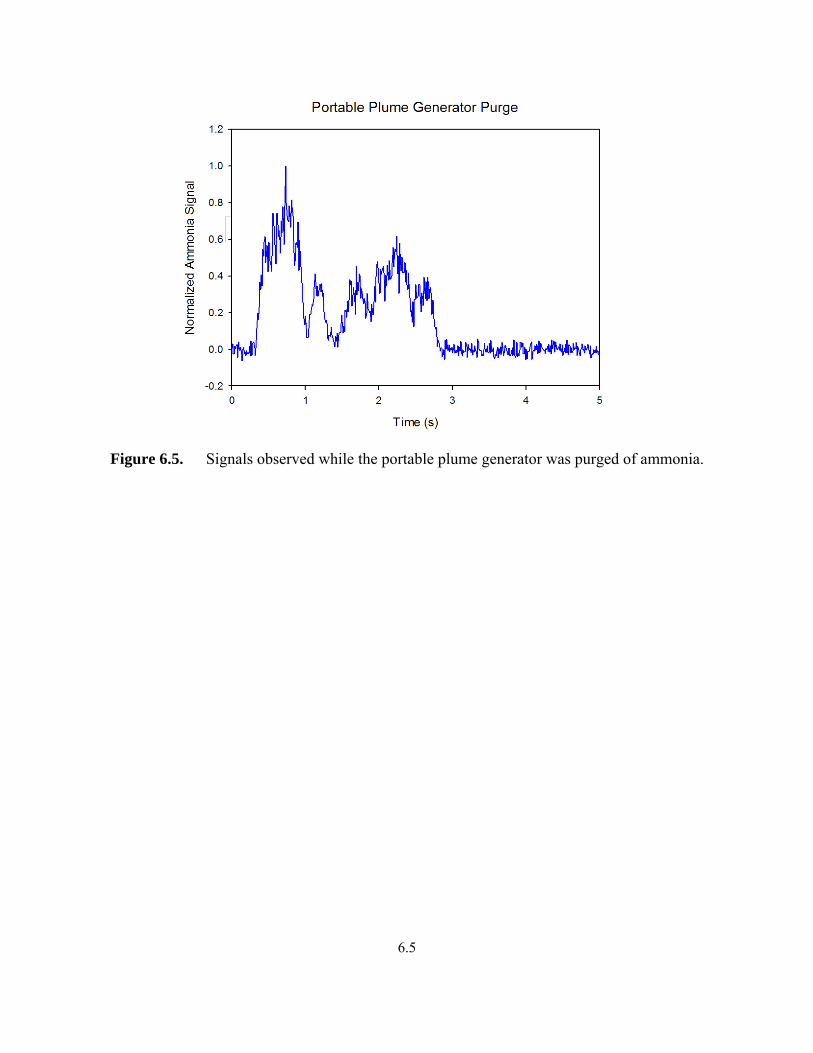
Figure 6.5. Signals observed while the portable plume generator was purged of ammonia.
6.5

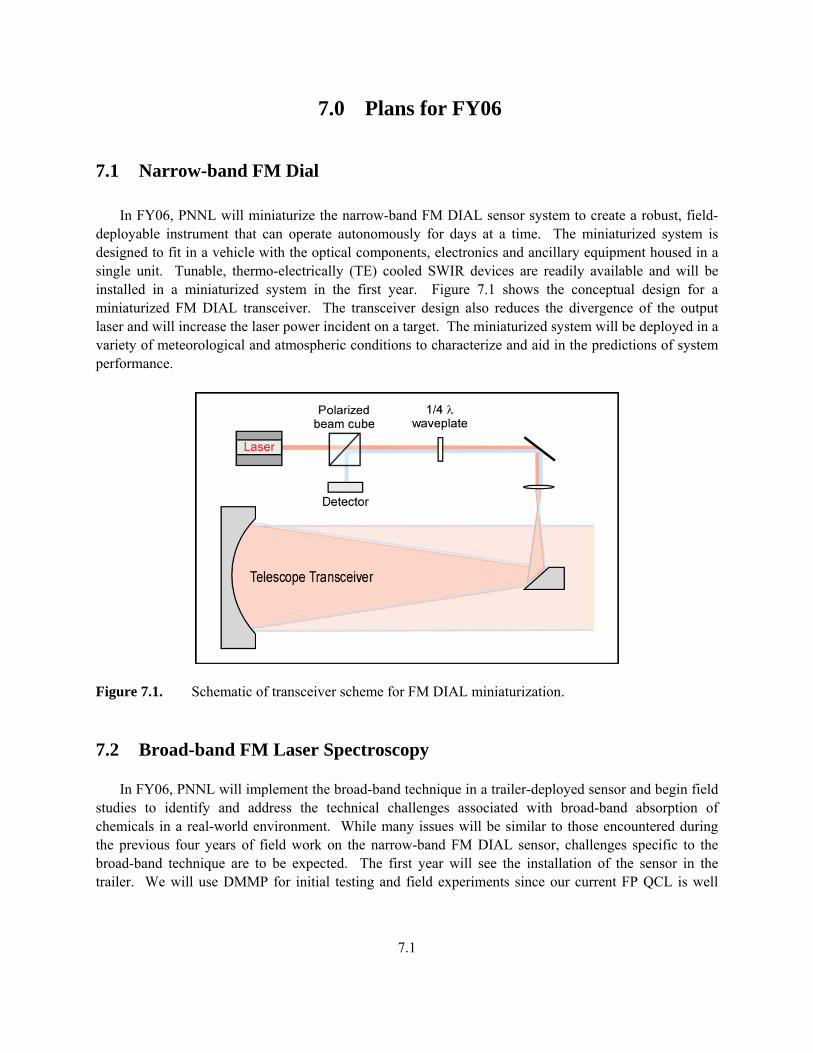
7.0 Plans for FY06 7.1 Narrow-band FM Dial In FY06, PNNL will miniaturize the narrow-band FM DIAL sensor system to create a robust, field-deployable instrument that can operate autonomously for days at a time. The miniaturized system is designed to fit in a vehicle with the optical components, electronics and ancillary equipment housed in a single unit. Tunable, thermo-electrically (TE) cooled SWIR devices are readily available and will be installed in a miniaturized system in the first year. Figure 7.1 shows the conceptual design for a miniaturized FM DIAL transceiver. The transceiver design also reduces the divergence of the output laser and will increase the laser power incident on a target. The miniaturized system will be deployed in a variety of meteorological and atmospheric conditions to characterize and aid in the predictions of system performance.
Figure 7.1. Schematic of transceiver scheme for FM DIAL miniaturization. 7.2 Broad-band FM Laser Spectroscopy In FY06, PNNL will implement the broad-band technique in a trailer-deployed sensor and begin field studies to identify and address the technical challenges associated with broad-band absorption of chemicals in a real-world environment. While many issues will be similar to those encountered during the previous four years of field work on the narrow-band FM DIAL sensor, challenges specific to the broad-band technique are to be expected. The first year will see the installation of the sensor in the trailer. We will use DMMP for initial testing and field experiments since our current FP QCL is well
7.1
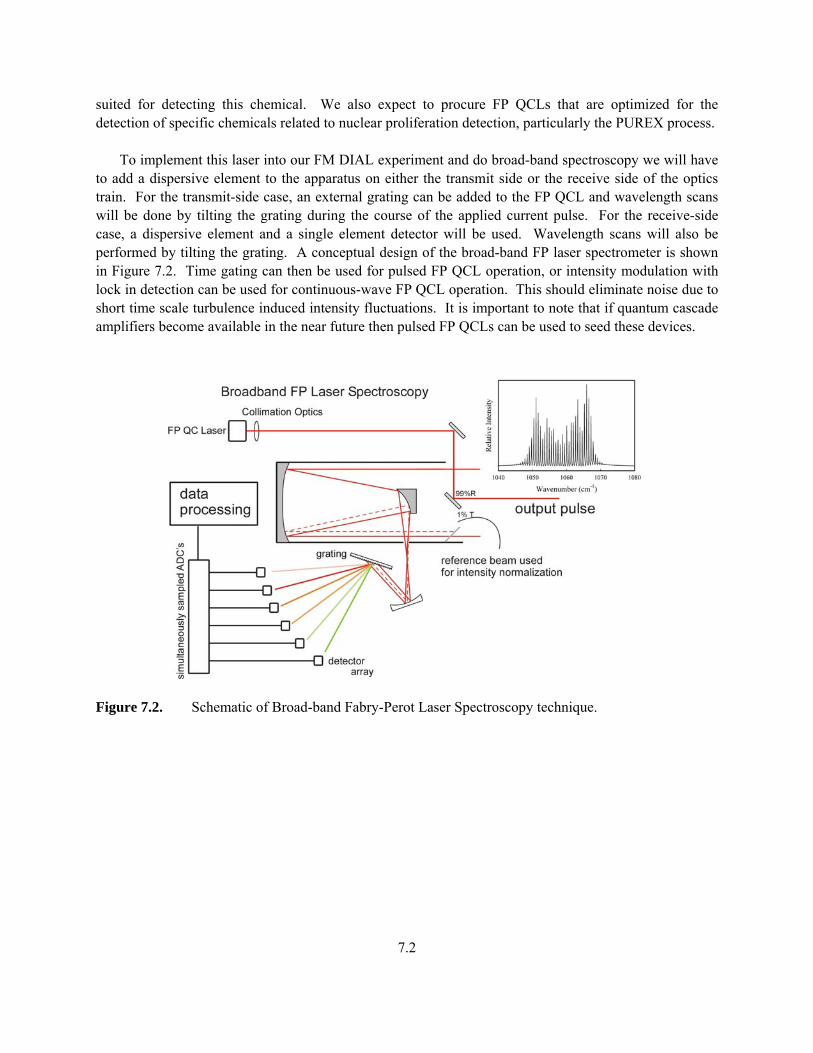
suited for detecting this chemical. We also expect to procure FP QCLs that are optimized for the detection of specific chemicals related to nuclear proliferation detection, particularly the PUREX process. To implement this laser into our FM DIAL experiment and do broad-band spectroscopy we will have to add a dispersive element to the apparatus on either the transmit side or the receive side of the optics train. For the transmit-side case, an external grating can be added to the FP QCL and wavelength scans will be done by tilting the grating during the course of the applied current pulse. For the receive-side case, a dispersive element and a single element detector will be used. Wavelength scans will also be performed by tilting the grating. A conceptual design of the broad-band FP laser spectrometer is shown in Figure 7.2. Time gating can then be used for pulsed FP QCL operation, or intensity modulation with lock in detection can be used for continuous-wave FP QCL operation. This should eliminate noise due to short time scale turbulence induced intensity fluctuations. It is important to note that if quantum cascade amplifiers become available in the near future then pulsed FP QCLs can be used to seed these devices.
Figure 7.2. Schematic of Broad-band Fabry-Perot Laser Spectroscopy technique.
7.2
7.3 Monostatic Study In FY06, PNNL will undertake a detailed study of the monostatic capabilities of the current LWIR and SWIR systems. Objects of different materials with different reflectivity will return infrared laser light with different efficiencies. We will measure the maximum achievable transmission/target separation for various objects including license plates, road signs, retro-reflective tape, vehicles, buildings, metal vents and rocks. Empirical measurements in conjunction with numerical modeling will be used to determine a suitable target of interest and design an optimized narrow-band and broad-band sensor for monostatic performance at target/transmitter separations of up to 1 km. 7.4 Numerical Modeling In FY06 PNNL will continue to expand and develop the numerical simulations and models of sensor performance. Speckle effects associated with diffuse (monostatic) targets, plume contaminants for a broad-band system, effects of moving platforms or targets and the variability of atmospheric constituents are all areas that will need to be addressed in the models in order to accurately predict sensor performance under various circumstances. In addition to the models for sensor performance, chemometric analysis techniques will need to be developed for the analysis of broad-band absorption features.
7.3

8.0 References
Andrews LC and RL Phillips 1998. “Laser Beam Propagation through Random Media.” SPIE Optical Engineering Press, Bellingham, WA. Belmonte A 2000. “Feasibility study for the simulation of beam propagation: consideration of coherent lidar performance.” Applied Optics 39, 5426-5445. Coles WA, JP Filice, RG Frehlich, and M Yadlowsky 1995. “Simulation of wave propagation in three-dimensional random media.” Applied Optics 34, 2089-2101. Frehlich R 2000. “Simulation of laser propagation in a turbulent atmosphere.” Applied Optics 29, 292-297 (2000). Hill RJ 1978. “Models of scalar spectrum for turbulent advection.” J. Fluid Mech. 88. 541-567. Martin JM and SM Flatte 1988. “Intensity images and statistics from numerical simulation of wave propagation in 3-D random media.” Applied Optics 27, 2111-2126. Martin JM and SM Flatte 1990. “Simulation of point-source scintillation through three-dimensional random media.” J. Opt. Soc. Am. A 7, 838-847. Sheen DM. 2000. Frequency Modulation Spectroscopy Modeling for Remote Chemical Detection, PNNL-13324, Pacific Northwest National Laboratory, Richland, Washington. Sheen DM, NB Gallagher, PG Heasler, JF Schultz, BM Wise, SW Sharpe, and KK Anderson. 2001. Infrared Chemical Detection Systems Modeling and Advanced Chemometric Analysis, PNNL-13737, Pacific Northwest National Laboratory, Richland, Washington. Sheen DM, NB Gallagher, and JF Schultz. 2002. Chemical Sensor Modeling and Data Analysis Algorithm Development in FY02, PNNL-14036, Pacific Northwest National Laboratory, Richland, Washington. Sheen DM. 2004. Spectral Algorithm Stimulator for Lidar-based Chemical Weapon Detection Systems, PNNL-14869, Pacific Northwest National Laboratory, Richland, Washington.
8.1

PNNL-15583
Distribution No. of Copies OFFSITE
LTC Ariel Cuadrado United States DOE NNSA/NA-22 1000 Independence Ave. SW Washington, DC 20585 Dr. Rhys M. Williams United States DOE NNSA/NA-22 1000 Independence Ave. SW Washington, DC 20585 Dr. David Berry United States DOE NNSA/NA-22 1000 Independence Ave. SW Washington, DC 20585 Mr. Ralph Hastings United States DOE NNSA/NA-22 1000 Independence Ave. SW Washington, DC 20585 Mr. Eric Sander United States DOE NNSA/NA-22 1000 Independence Ave. SW Washington, DC 20585 Mr. W. Randy Bell United States DOE NNSA/NA-22 1000 Independence Ave. SW Washington, DC 20585
No. of Copies
Professor Henryk Temkin Program Manager DARPA, MTO 3701 N. Fairfax Dr. Arlington, VA 22203-1714
ONSITE 27 Pacific Northwest National Laboratory
Batdorf, MT K5-25 Bruckner-Lea, C K5-25 Clemmer, RG K8-29 Dudder, GB K8-29 Golovich, EC K5-25 Harper, WW K5-25 Schultz, JF (10) K5-25 Sharpe, SW K8-88 Stewart, TL K5-25 Strasburg, JD K5-25 Thompson, JS K5-25 Information Release Office (7) K1-06
Distr.1


![DUAL BAND FM TRANSCEIVER iC-w32a iC-w32e - Icom · dual band fm transceiver ... 42 14 options ..... 43 table of contents. panel description 1 1 q antenna ... [vol] @3 [dial] vol dial](https://img.pdfslide.net/doc/110x75/5b03d4b97f8b9a3c378ccab5/dual-band-fm-transceiver-ic-w32a-ic-w32e-band-fm-transceiver-42-14-options.jpg)


![Fy05 07 Strategic Plan[1]](https://img.pdfslide.net/doc/110x75/558a9d49d8b42ad4108b467b/fy05-07-strategic-plan1.jpg)