Embed Size (px)
DESCRIPTION
FY09 SHERM Metrics-Based Performance Summary. Indicators of Performance in the Areas of Losses, Compliance, Finances, and Client Satisfaction. Overview. The objective of this report is to provide a metrics-based review of SHERM operations in FY09 in four key areas: - PowerPoint PPT Presentation
Citation preview
FY09 SHERM Metrics-Based Performance Summary
Indicators of Performance in the Areas of
Losses, Compliance, Finances, and Client Satisfaction
Overview
• The objective of this report is to provide a metrics-based review of SHERM operations in FY09 in four key areas:
Losses Compliance Personnel With external agencies Property With internal assessments
Finances Client Satisfaction Expenditures External clients served Revenues Internal department staff
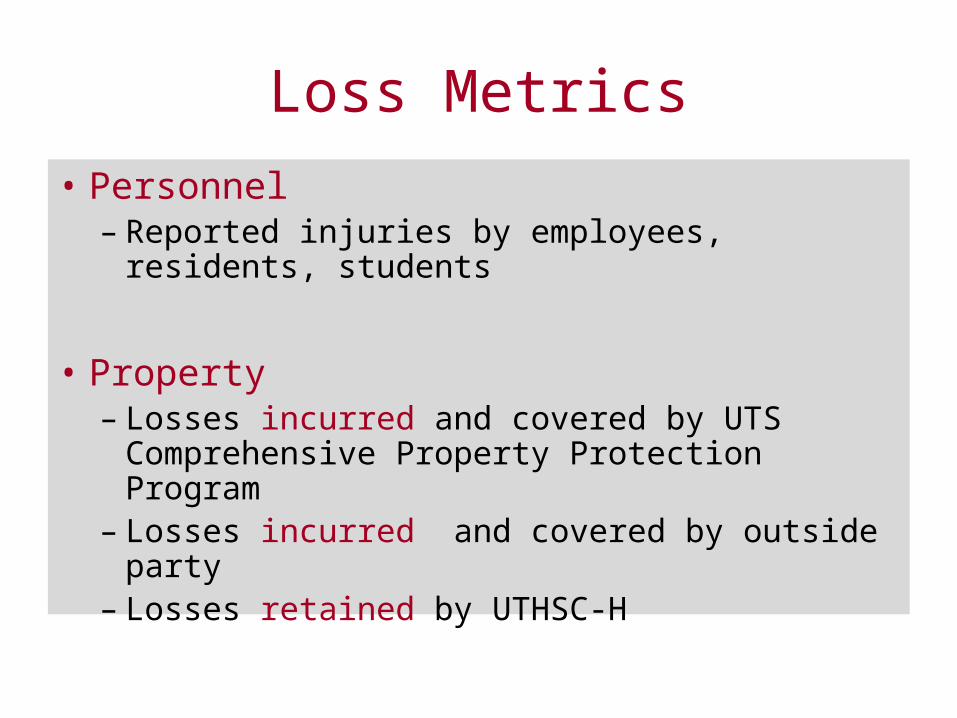
Loss Metrics
• Personnel– Reported injuries by employees, residents,
students
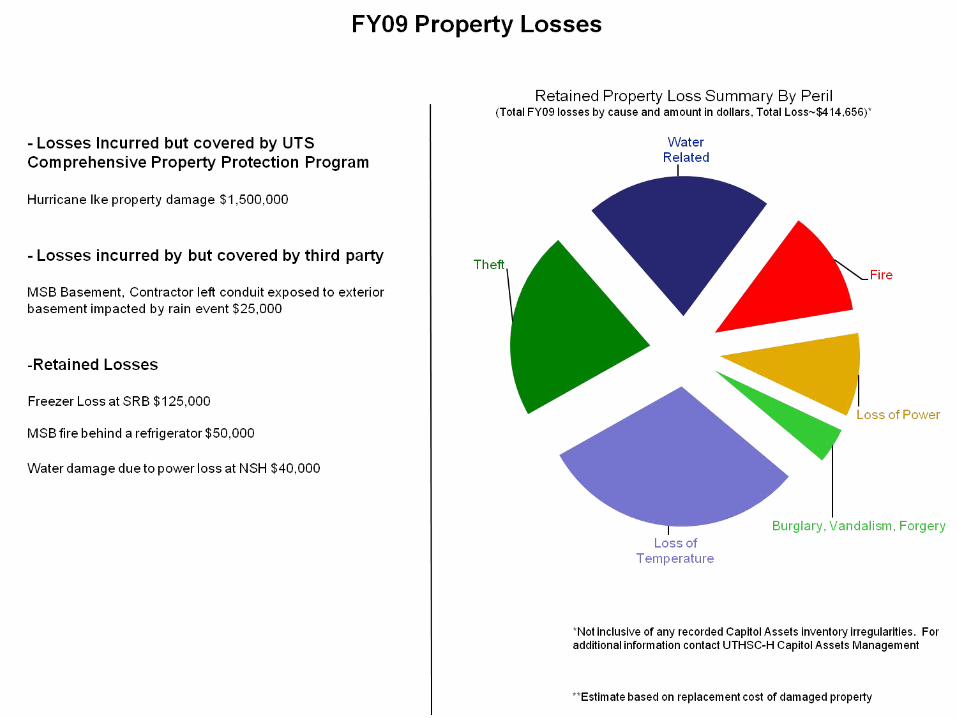
• Property– Losses incurred and covered by UTS
Comprehensive Property Protection Program– Losses incurred and covered by outside party– Losses retained by UTHSC-H
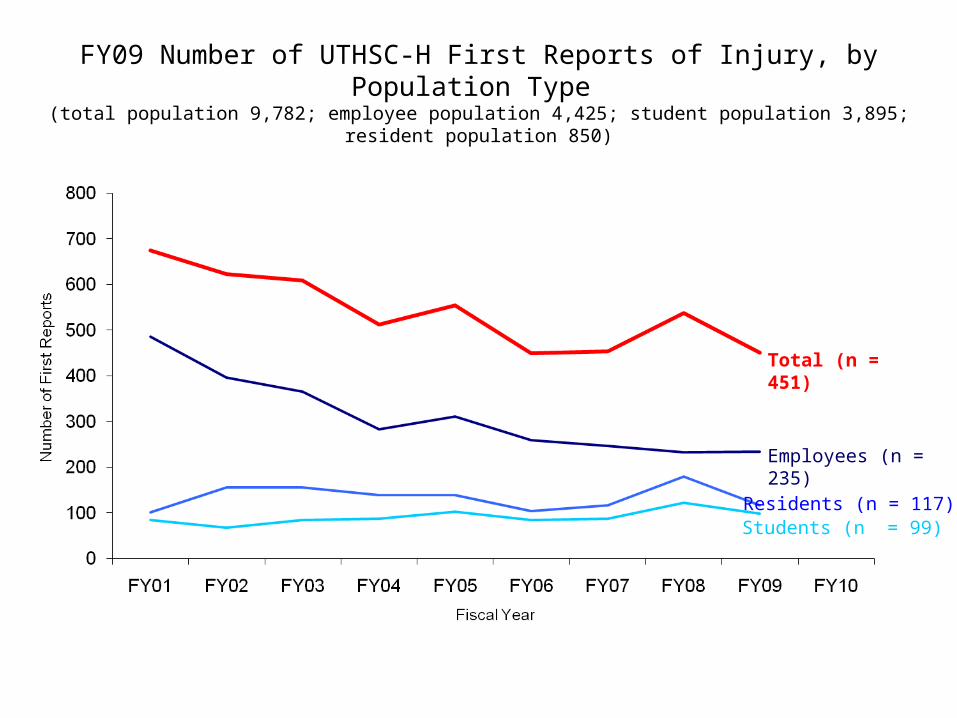
FY09 Number of UTHSC-H First Reports of Injury, by Population Type (total population 9,782; employee population 4,425; student population 3,895; resident population 850)
Total (n = 451)
Employees (n = 235)
Residents (n = 117)Students (n = 99)
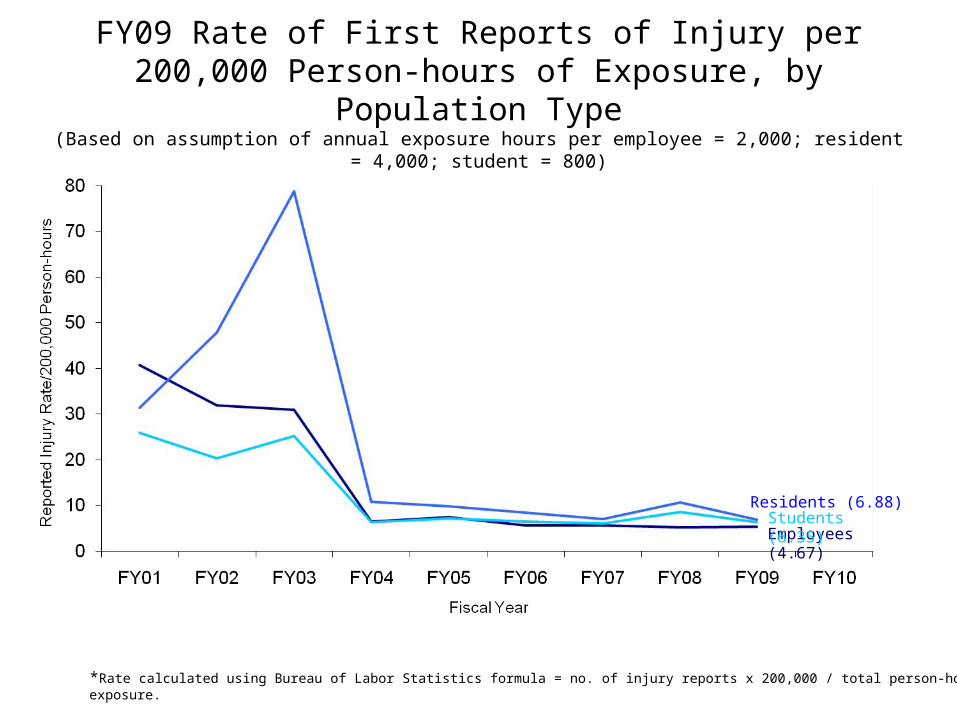
FY09 Rate of First Reports of Injury per 200,000 Person-hours of Exposure, by Population Type
(Based on assumption of annual exposure hours per employee = 2,000; resident = 4,000; student = 800)
Employees (4.67)
Residents (6.88)Students (6.35)
*Rate calculated using Bureau of Labor Statistics formula = no. of injury reports x 200,000 / total person-hours of exposure.
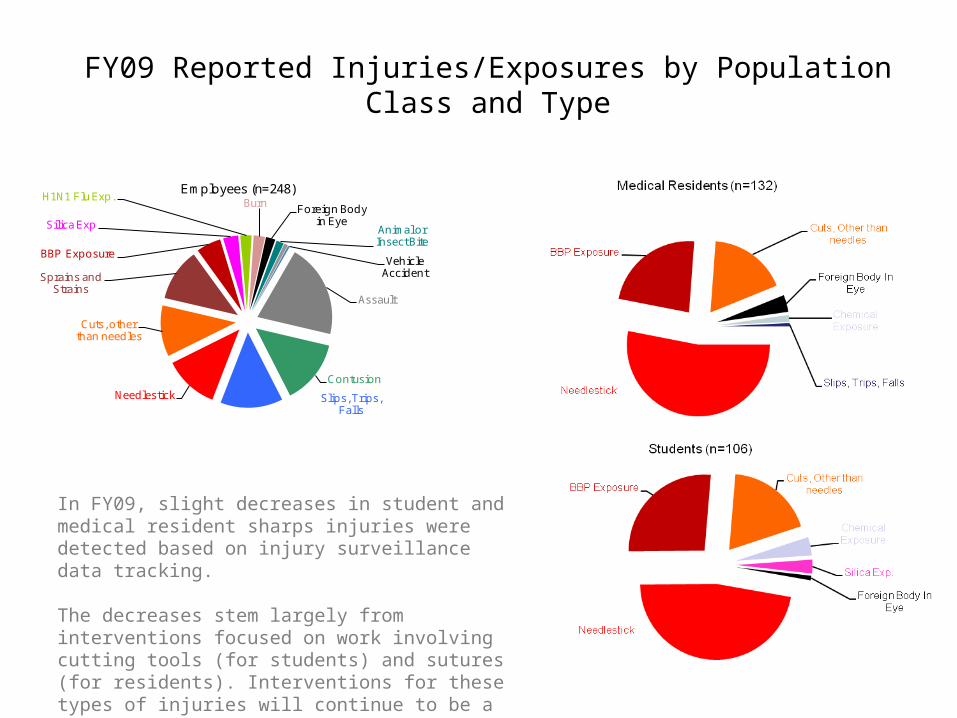
FY09 Reported Injuries/Exposures by Population Class and Type
Assault
Contusion
Slips, Trips, Falls
Needlestick
Cuts, other than needles
Sprains and Strains
BBP Exposure
Silica Exp
H1N1 Flu Exp.Burn Foreign Body
in EyeAnimal or Insect Bite
Vehicle Accident
Employees (n=248)
In FY09, slight decreases in student and medical resident sharps injuries were detected based on injury surveillance data tracking.
The decreases stem largely from interventions focused on work involving cutting tools (for students) and sutures (for residents). Interventions for these types of injuries will continue to be a major focus of FY10 efforts
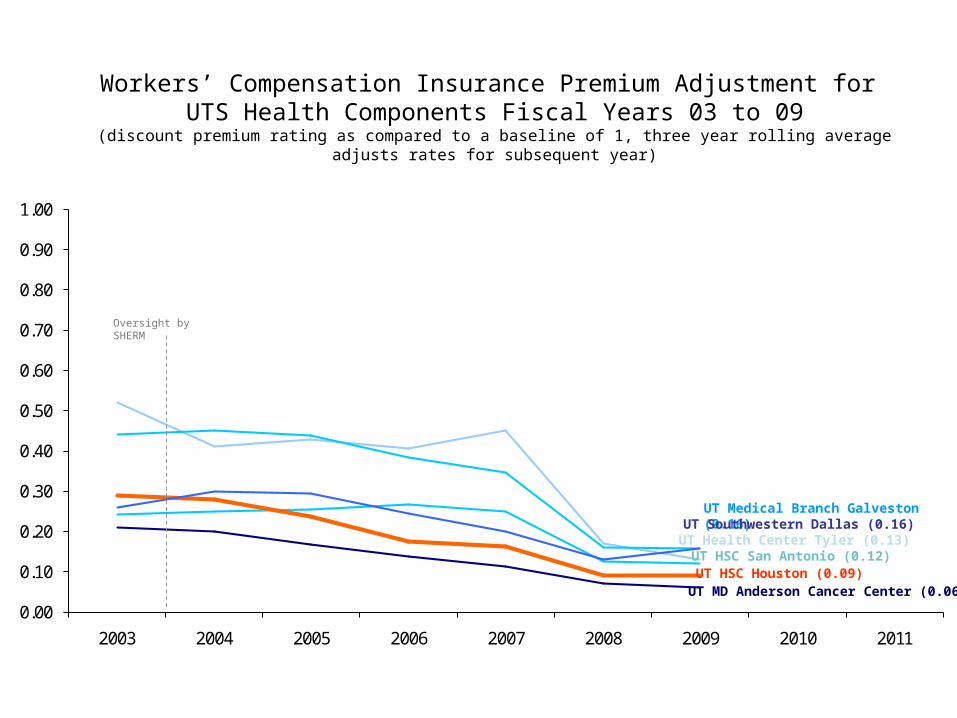
Workers’ Compensation Insurance Premium Adjustment for UTS Health Components Fiscal Years 03 to 09
(discount premium rating as compared to a baseline of 1, three year rolling average adjusts rates for subsequent year)
0.00
0.10
0.20
0.30
0.40
0.50
0.60
0.70
0.80
0.90
1.00
2003 2004 2005 2006 2007 2008 2009 2010 2011
UT Health Center Tyler (0.13)
UT Medical Branch Galveston (0.16)
UT HSC San Antonio (0.12)
UT Southwestern Dallas (0.16)
UT HSC Houston (0.09)UT MD Anderson Cancer Center (0.06)
Oversight by SHERM
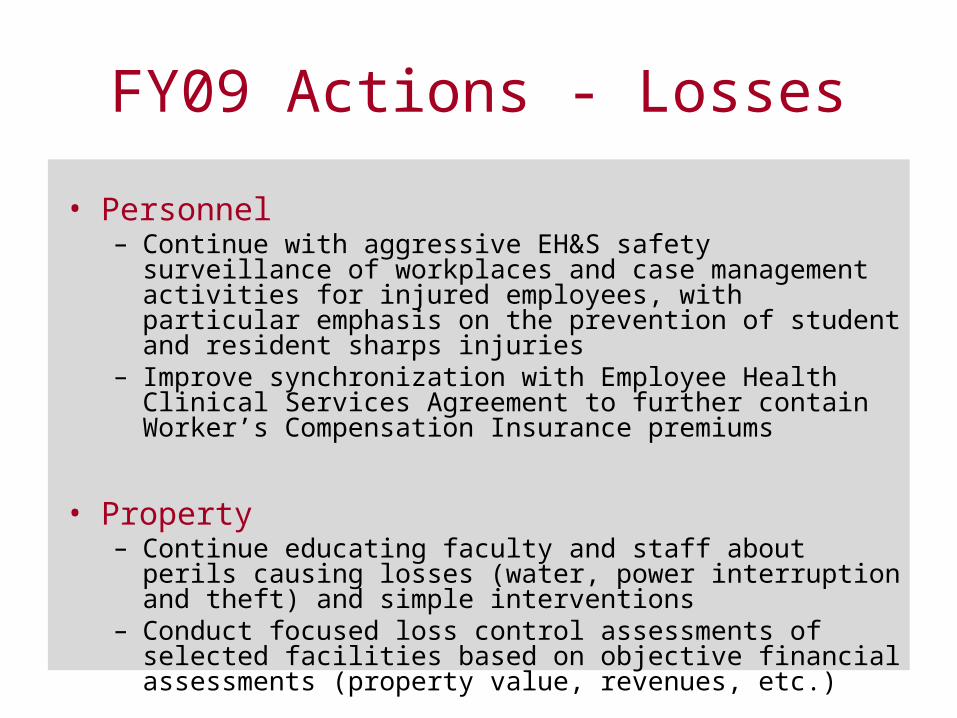
FY09 Actions - Losses
• Personnel– Continue with aggressive EH&S safety surveillance of
workplaces and case management activities for injured employees, with particular emphasis on the prevention of student and resident sharps injuries
– Improve synchronization with Employee Health Clinical Services Agreement to further contain Worker’s Compensation Insurance premiums
• Property– Continue educating faculty and staff about perils causing losses
(water, power interruption and theft) and simple interventions– Conduct focused loss control assessments of selected facilities
based on objective financial assessments (property value, revenues, etc.)
Compliance Metrics
• With external agencies– Regulatory inspections, peer reviews– Other compliance related activities
• With internal assessments– Results of EH&S routine safety surveillance activities
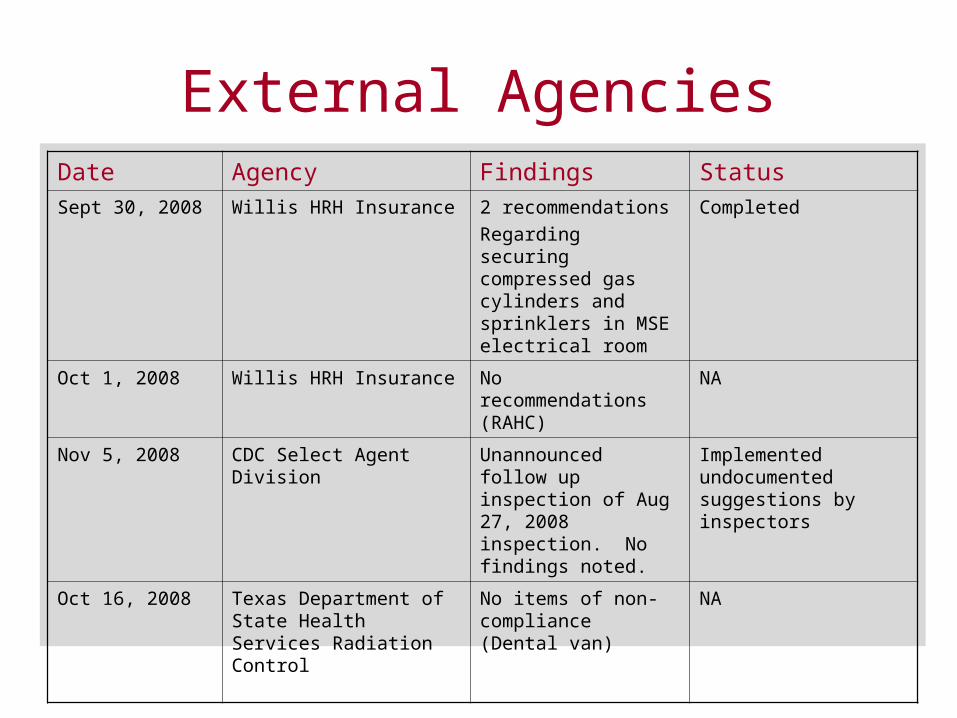
External AgenciesDate Agency Findings Status
Sept 30, 2008 Willis HRH Insurance 2 recommendations
Regarding securing compressed gas cylinders and sprinklers in MSE electrical room
Completed
Oct 1, 2008 Willis HRH Insurance No recommendations (RAHC)
NA
Nov 5, 2008 CDC Select Agent Division Unannounced follow up inspection of Aug 27, 2008 inspection. No findings noted.
Implemented undocumented suggestions by inspectors
Oct 16, 2008 Texas Department of State Health Services Radiation Control
No items of non-compliance (Dental van)
NA
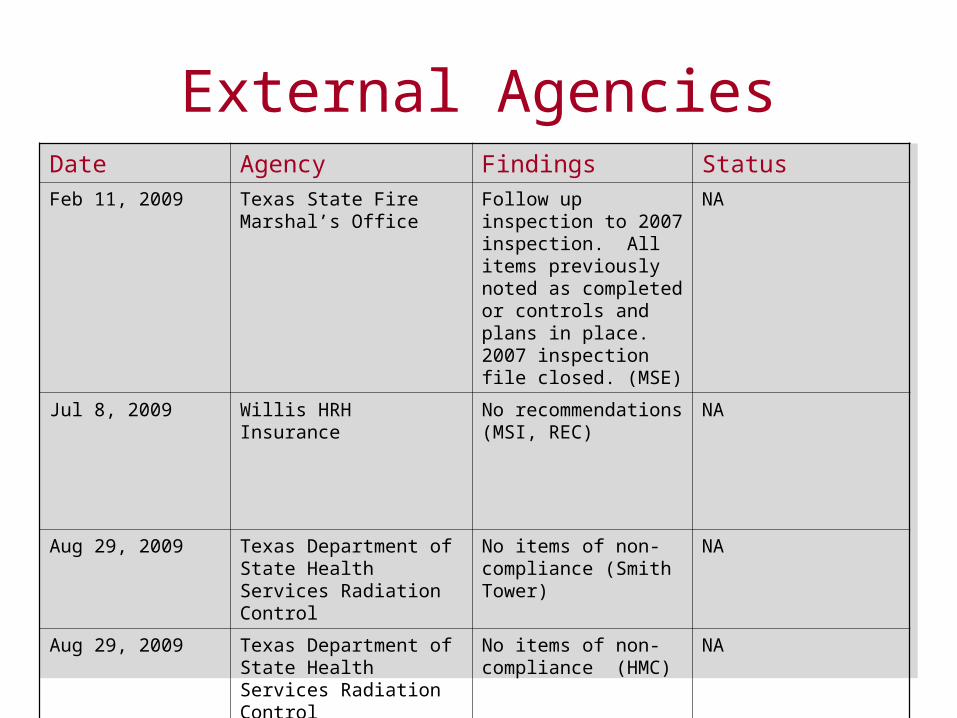
External AgenciesDate Agency Findings StatusFeb 11, 2009 Texas State Fire Marshal’s
OfficeFollow up inspection to 2007 inspection. All items previously noted as completed or controls and plans in place. 2007 inspection file closed. (MSE)
NA
Jul 8, 2009 Willis HRH Insurance No recommendations (MSI, REC)
NA
Aug 29, 2009 Texas Department of State Health Services Radiation Control
No items of non-compliance (Smith Tower)
NA
Aug 29, 2009 Texas Department of State Health Services Radiation Control
No items of non-compliance (HMC)
NA
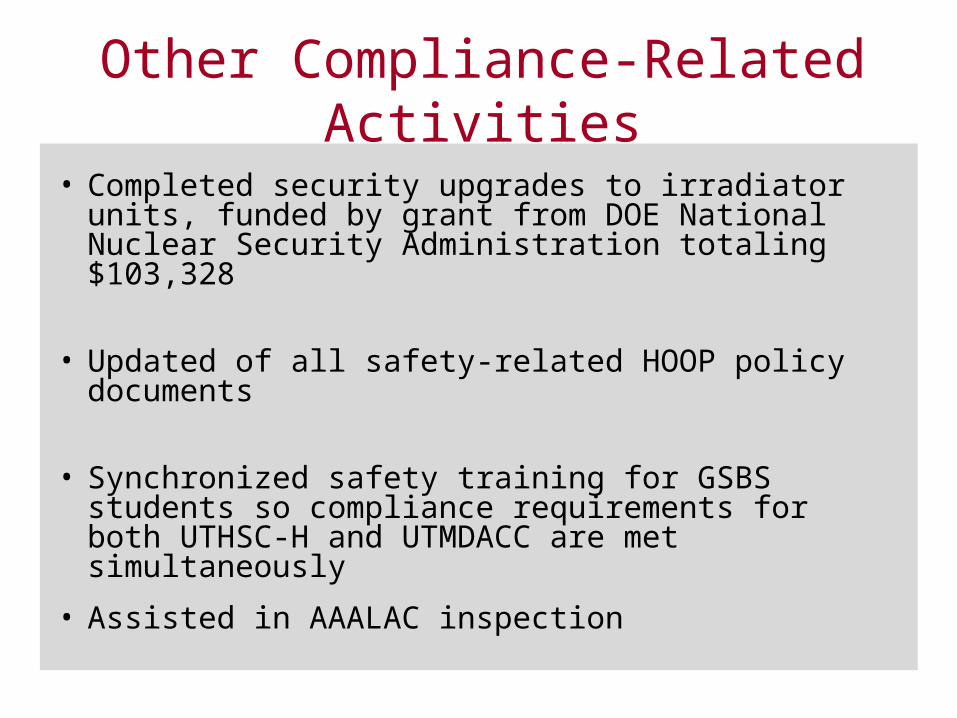
Other Compliance-Related Activities
• Completed security upgrades to irradiator units, funded by grant from DOE National Nuclear Security Administration totaling $103,328
• Updated of all safety-related HOOP policy documents
• Synchronized safety training for GSBS students so compliance requirements for both UTHSC-H and UTMDACC are met simultaneously
• Assisted in AAALAC inspection
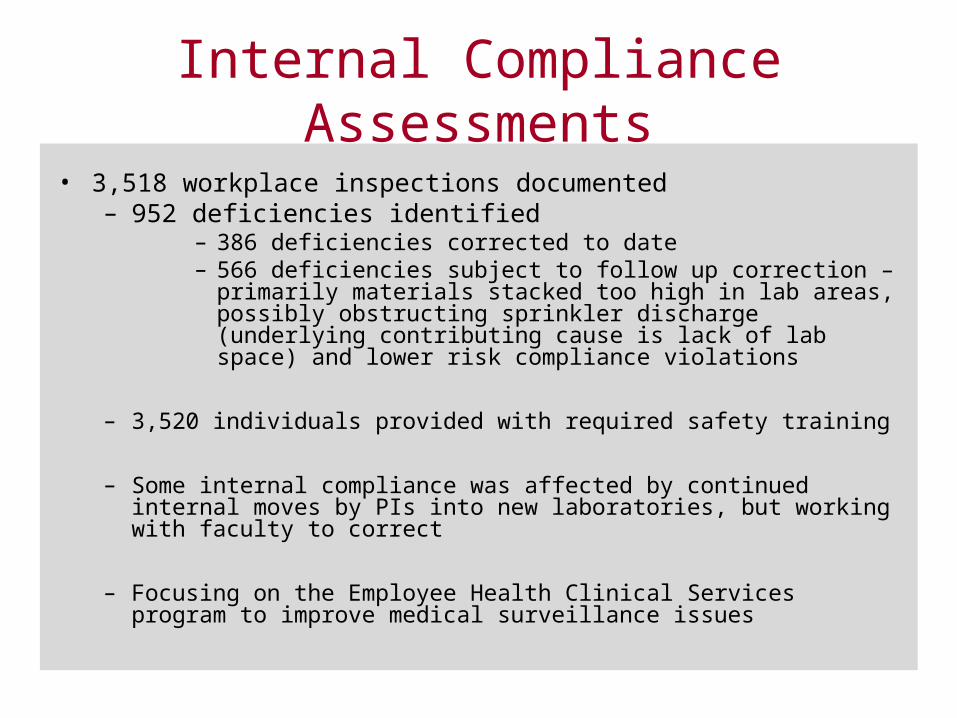
Internal Compliance Assessments
• 3,518 workplace inspections documented– 952 deficiencies identified
– 386 deficiencies corrected to date– 566 deficiencies subject to follow up correction – primarily
materials stacked too high in lab areas, possibly obstructing sprinkler discharge (underlying contributing cause is lack of lab space) and lower risk compliance violations
– 3,520 individuals provided with required safety training
– Some internal compliance was affected by continued internal moves by PIs into new laboratories, but working with faculty to correct
– Focusing on the Employee Health Clinical Services program to improve medical surveillance issues
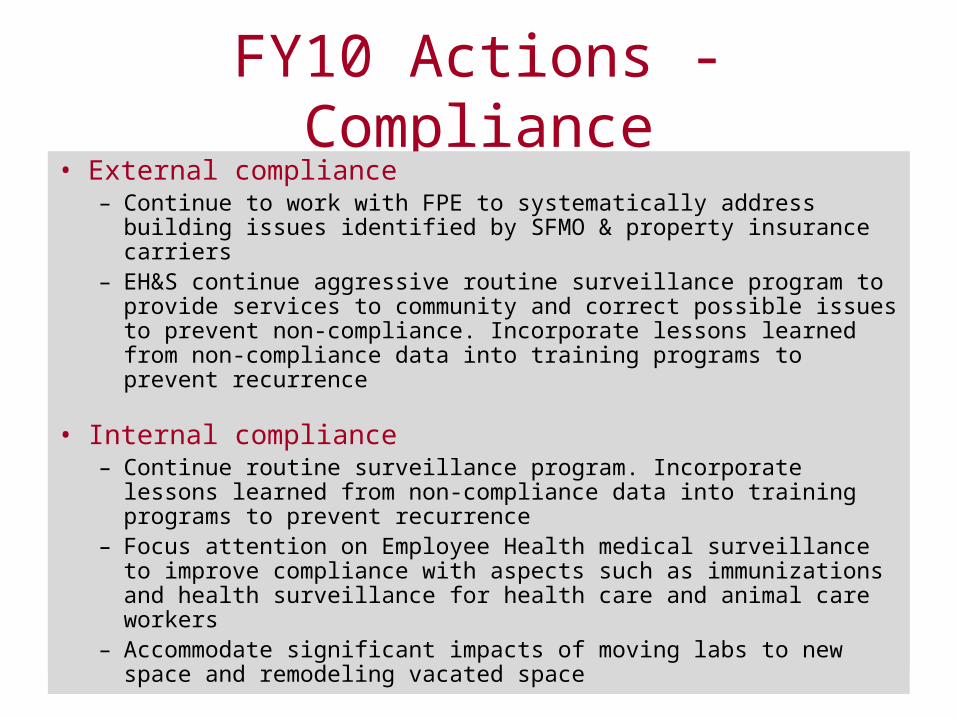
FY10 Actions - Compliance• External compliance
– Continue to work with FPE to systematically address building issues identified by SFMO & property insurance carriers
– EH&S continue aggressive routine surveillance program to provide services to community and correct possible issues to prevent non-compliance. Incorporate lessons learned from non-compliance data into training programs to prevent recurrence
• Internal compliance– Continue routine surveillance program. Incorporate lessons
learned from non-compliance data into training programs to prevent recurrence
– Focus attention on Employee Health medical surveillance to improve compliance with aspects such as immunizations and health surveillance for health care and animal care workers
– Accommodate significant impacts of moving labs to new space and remodeling vacated space
Financial Metrics
• Expenditures– Program cost, cost drivers
• Revenues– Sources of revenue, amounts
0.00
1,000,000.00
2,000,000.00
3,000,000.00
4,000,000.00
5,000,000.00
6,000,000.00
FY06 FY07 FY08 FY09 FY10
$0
$500,000
$1,000,000
$1,500,000
$2,000,000
$2,500,000
$3,000,000
FY06 FY07 FY08 FY09 FY10
$0
$100,000
$200,000
$300,000
$400,000
$500,000
$600,000
$700,000
$800,000
$900,000
$1,000,000
FY06 FY07 FY08 FY09 FY10
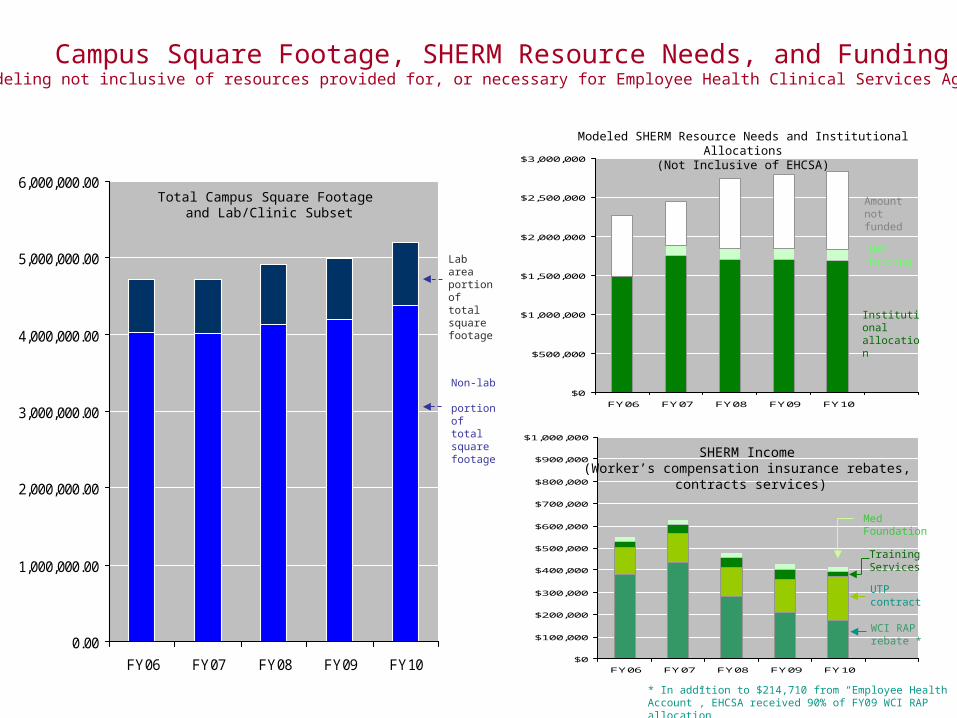
Campus Square Footage, SHERM Resource Needs, and Funding(modeling not inclusive of resources provided for, or necessary for Employee Health Clinical Services Agreement)
Total Campus Square Footage and Lab/Clinic Subset
Modeled SHERM Resource Needs and Institutional Allocations(Not Inclusive of EHCSA)
SHERM Income (Worker’s compensation insurance rebates,
contracts services)
Lab area portion of total square footage
Non-lab portion of total square footage
Institutional allocation
Amount not funded
WCI RAP rebate *
UTP contract
IMM funding
Med Foundation
Training Services
* In addition to $214,710 from “Employee Health Account”, EHCSA received 90% of FY09 WCI RAP allocation
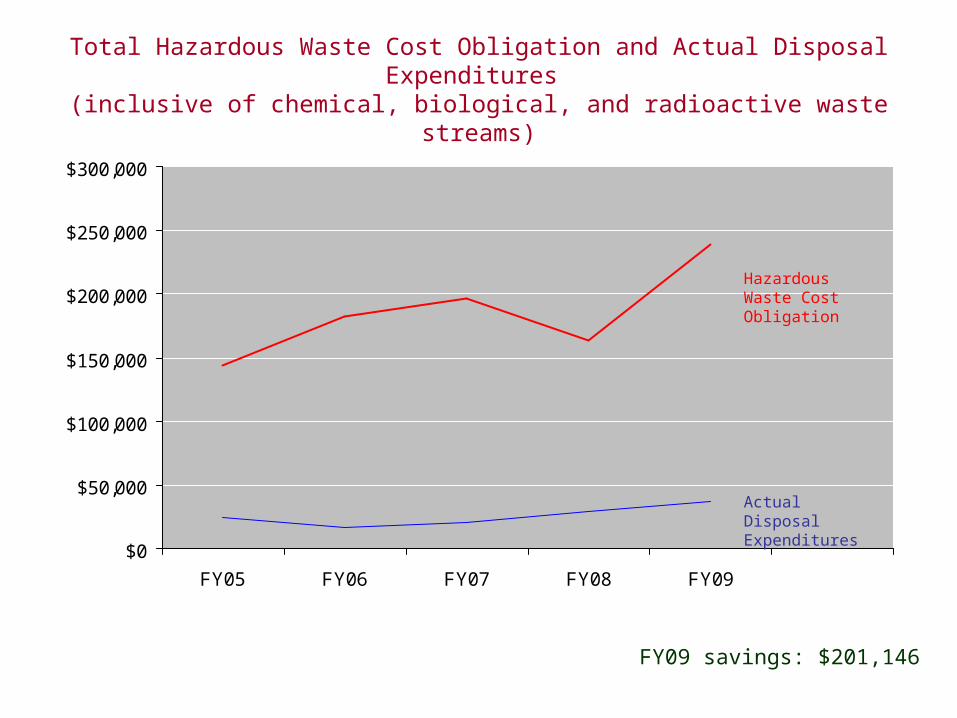
Total Hazardous Waste Cost Obligation and Actual Disposal Expenditures (inclusive of chemical, biological, and radioactive waste streams)
$0
$50,000
$100,000
$150,000
$200,000
$250,000
$300,000
FY05 FY06 FY07 FY08 FY09
Hazardous Waste Cost Obligation
Actual Disposal Expenditures
FY09 savings: $201,146
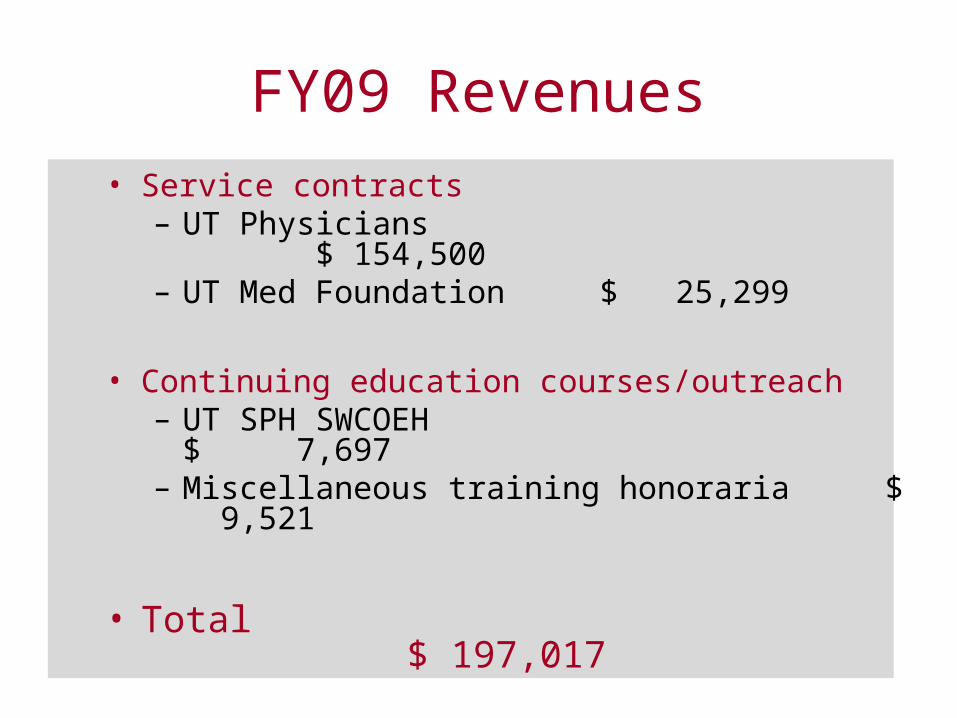
FY09 Revenues
• Service contracts– UT Physicians $ 154,500– UT Med Foundation $ 25,299
• Continuing education courses/outreach– UT SPH SWCOEH $ 7,697– Miscellaneous training honoraria $ 9,521
• Total $ 197,017
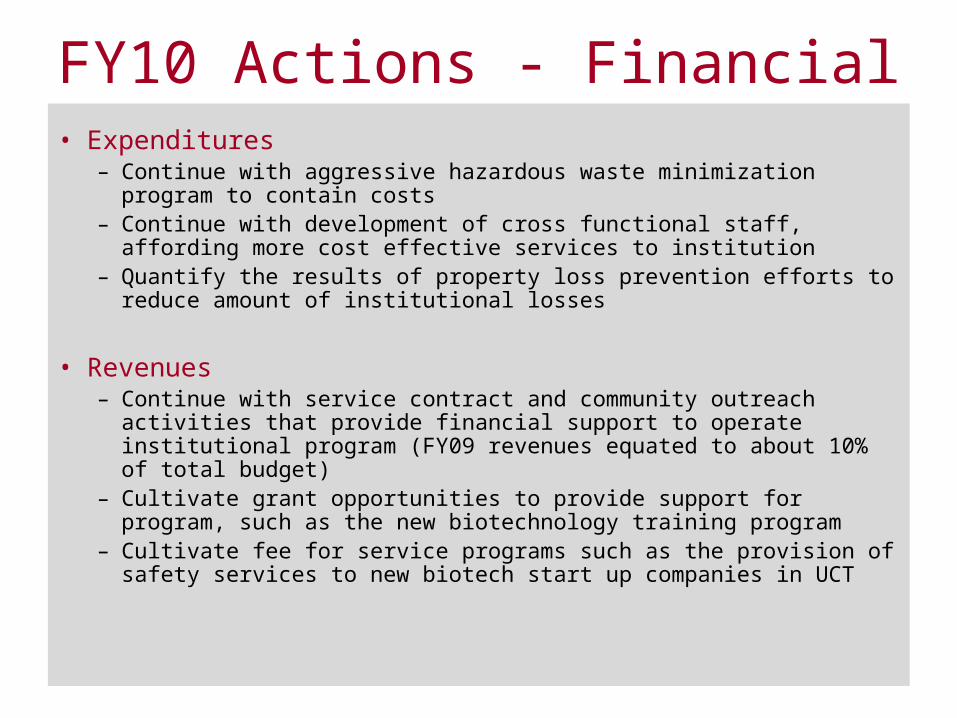
FY10 Actions - Financial• Expenditures
– Continue with aggressive hazardous waste minimization program to contain costs
– Continue with development of cross functional staff, affording more cost effective services to institution
– Quantify the results of property loss prevention efforts to reduce amount of institutional losses
• Revenues– Continue with service contract and community outreach activities that
provide financial support to operate institutional program (FY09 revenues equated to about 10% of total budget)
– Cultivate grant opportunities to provide support for program, such as the new biotechnology training program
– Cultivate fee for service programs such as the provision of safety services to new biotech start up companies in UCT
Client Satisfaction Metrics
• External clients served– Results of targeted awareness survey
• Internal department staff– Summary of professional development activities
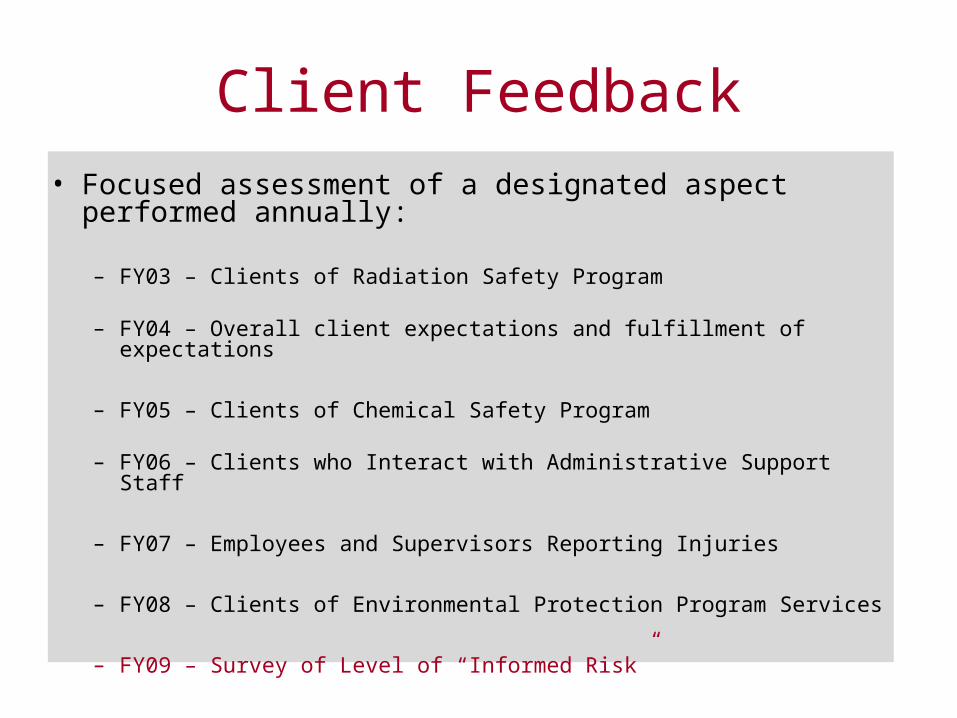
Client Feedback
• Focused assessment of a designated aspect performed annually:
– FY03 – Clients of Radiation Safety Program
– FY04 – Overall client expectations and fulfillment of expectations
– FY05 – Clients of Chemical Safety Program
– FY06 – Clients who Interact with Administrative Support Staff
– FY07 – Employees and Supervisors Reporting Injuries
– FY08 – Clients of Environmental Protection Program Services
– FY09 – Survey of Level of “Informed Risk”
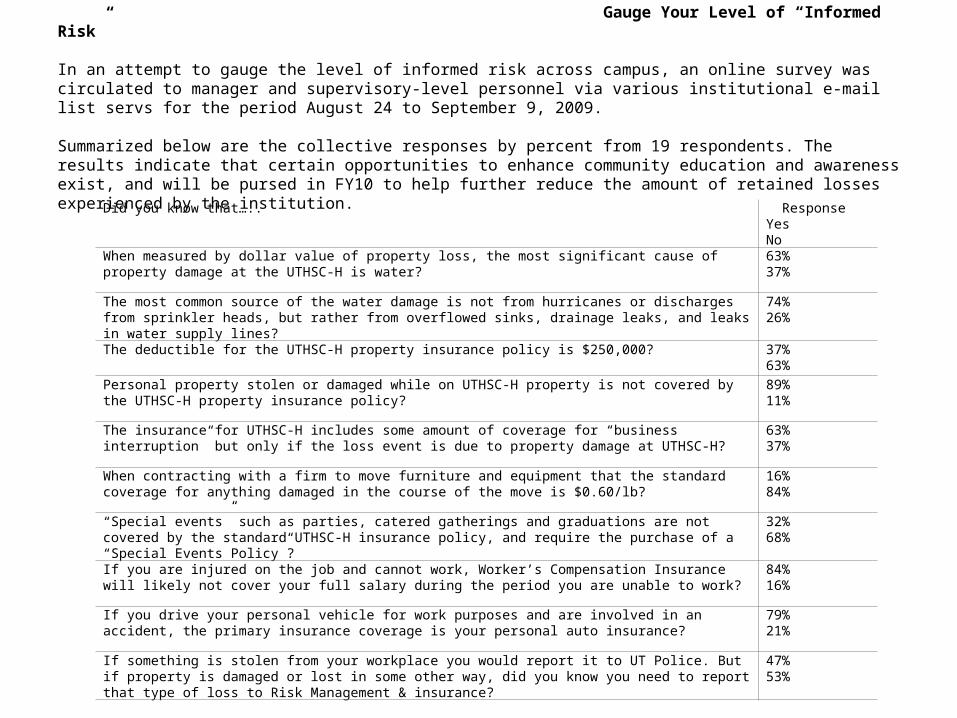
Did you know that….. ResponseYes No
When measured by dollar value of property loss, the most significant cause of property damage at the UTHSC-H is water? 63% 37%
The most common source of the water damage is not from hurricanes or discharges from sprinkler heads, but rather from overflowed sinks, drainage leaks, and leaks in water supply lines?
74% 26%
The deductible for the UTHSC-H property insurance policy is $250,000? 37% 63%
Personal property stolen or damaged while on UTHSC-H property is not covered by the UTHSC-H property insurance policy? 89% 11%
The insurance for UTHSC-H includes some amount of coverage for “business interruption” but only if the loss event is due to property damage at UTHSC-H?
63% 37%
When contracting with a firm to move furniture and equipment that the standard coverage for anything damaged in the course of the move is $0.60/lb?
16% 84%
“Special events” such as parties, catered gatherings and graduations are not covered by the standard UTHSC-H insurance policy, and require the purchase of a “Special Events Policy”?
32% 68%
If you are injured on the job and cannot work, Worker’s Compensation Insurance will likely not cover your full salary during the period you are unable to work?
84% 16%
If you drive your personal vehicle for work purposes and are involved in an accident, the primary insurance coverage is your personal auto insurance?
79% 21%
If something is stolen from your workplace you would report it to UT Police. But if property is damaged or lost in some other way, did you know you need to report that type of loss to Risk Management & insurance?
47% 53%
Gauge Your Level of “Informed Risk” In an attempt to gauge the level of informed risk across campus, an online survey was circulated to manager and supervisory-level personnel via various institutional e-mail list servs for the period August 24 to September 9, 2009. Summarized below are the collective responses by percent from 19 respondents. The results indicate that certain opportunities to enhance community education and awareness exist, and will be pursed in FY10 to help further reduce the amount of retained losses experienced by the institution.
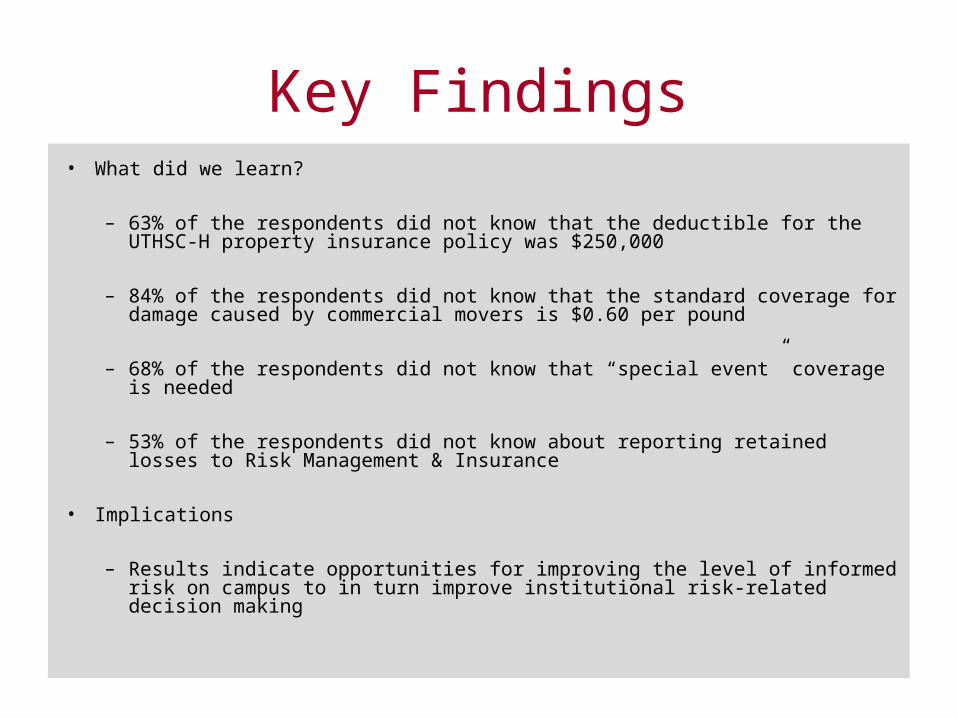
Key Findings• What did we learn?
– 63% of the respondents did not know that the deductible for the UTHSC-H property insurance policy was $250,000
– 84% of the respondents did not know that the standard coverage for damage caused by commercial movers is $0.60 per pound
– 68% of the respondents did not know that “special event” coverage is needed
– 53% of the respondents did not know about reporting retained losses to Risk Management & Insurance
• Implications
– Results indicate opportunities for improving the level of informed risk on campus to in turn improve institutional risk-related decision making
Internal Department Staff Satisfaction
• Continued support of ongoing academic pursuits
• Weekly continuing education sessions on a variety of topics
• Sought non-monetary reward ideas from staff
• Participation in teaching in continuing education course offerings
• Involvement in novel student and disabled veteran internship training programs
• Membership, participation in professional organizations
Staff Involvement in Emergency Preparedness, Response, and Recovery
• Significant time and effort was directed towards preparatory and recovery work for several notable emergencies in FY09– Hurricane Ike– Novel H1N1 influenza– MSB fire– New Student Housing water damage from leak in pump room
• Recent state legislation and UTS expectations will likely mandate more resources being dedicated solely to emergency preparedness
FY10 Actions – Client Satisfaction
• External Clients– Continue with “customer service” approach to operations– Provide targeted “informed risk” education based on findings of
recent survey to enhance decision making when risks are involved
• Internal Clients (departmental staff)– Continue with professional development seminars– Continue with involvement in training courses and outreach
activities– Continue mentoring sessions on academic activities– Conduct staff survey focused on job satisfaction– Continue 360o evaluations on supervisors to garner feedback
from staff
Metrics Caveats
• Important to remember what isn’t effectively captured by these metrics:
• Increasing complexity of research protocols
• Increased collaborations and associated challenges
• Increased complexity of regulatory environment
• Impacts of construction – both navigation and reviews
• The pain, suffering, apprehension associated with any injury – every dot on the graph is a person
• The things that didn’t happen
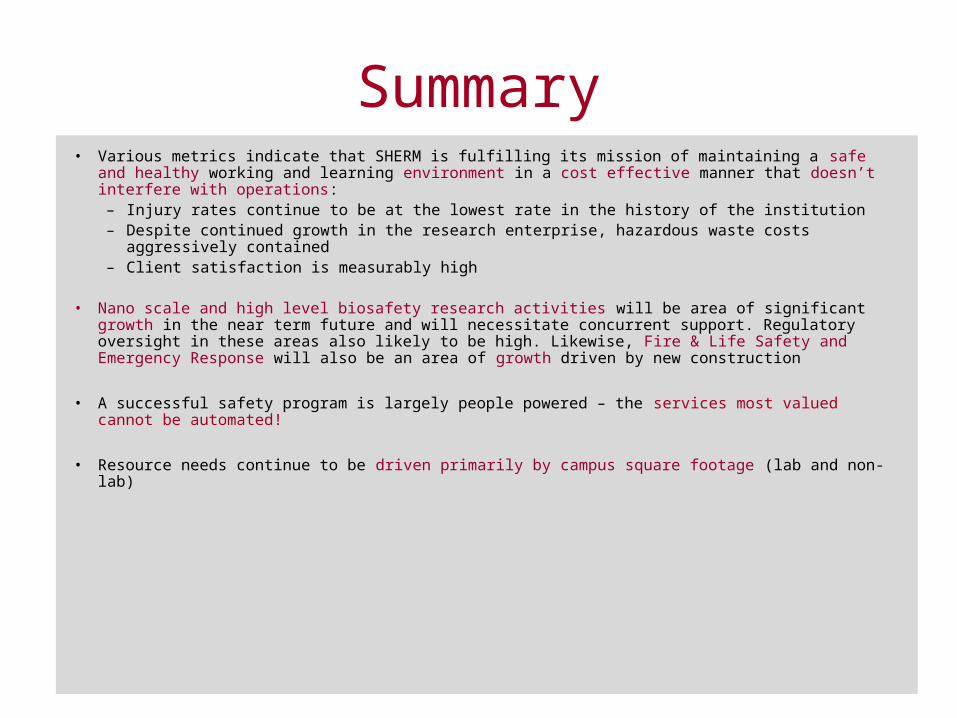
Summary• Various metrics indicate that SHERM is fulfilling its mission of maintaining a safe and healthy working
and learning environment in a cost effective manner that doesn’t interfere with operations:– Injury rates continue to be at the lowest rate in the history of the institution– Despite continued growth in the research enterprise, hazardous waste costs aggressively
contained– Client satisfaction is measurably high
• Nano scale and high level biosafety research activities will be area of significant growth in the near term future and will necessitate concurrent support. Regulatory oversight in these areas also likely to be high. Likewise, Fire & Life Safety and Emergency Response will also be an area of growth driven by new construction
• A successful safety program is largely people powered – the services most valued cannot be automated!
• Resource needs continue to be driven primarily by campus square footage (lab and non-lab)


![[Editors of Walter Foster, Sherm Cohen] Cartooning(BookZZ.org)](https://img.pdfslide.net/doc/110x75/563db93d550346aa9a9b65f9/editors-of-walter-foster-sherm-cohen-cartooningbookzzorg.jpg)