Embed Size (px)
Citation preview
SARACEN MINERAL HOLDINGS LIMITED ACN: 009 215 347
FY16 financial results
Net profit up 132% to A$25.9m Free cashflow set to surge on back of production ramp up to 300,000ozpa
and end of major capital expenditure program
Corporate Details: 26th August 2016 ASX code: SAR Corporate Structure: Ordinary shares on issue: 806.2m Unvested employee performance rights: 15.6m Market Capitalisation: A$1.22b (share price A$1.515) Cash & Bullion (30 June): A$40.3m Debt: Nil Directors: Mr Geoff Clifford Non-Executive Chairman Mr Raleigh Finlayson Managing Director Mr Mark Connelly Non-Executive Mr Martin Reed Non-Executive Ms Samantha Tough Non-Executive Substantial Shareholders: Van Eck Global 14.1% Wroxby 7.0% Karara Capital 5.2% Registered Office: Level 4 89 St Georges Terrace Perth WA 6000 Telephone: +61 8 6229 9100 Facsimile: +61 8 6229 9199
For further details contact:
Troy Irvin Telephone +61 8 6229 9100
Key Points • Net Profit rises 132% to A$25.9m (2015: A$11.1m)
• Gold production rises 13% to a record 188,656 ounces (2015:
167,531 ounces)
• Revenue up 11% to A$276.5m (2015: A$249.9m); All-in sustaining costs down 4% to A$1095/oz
• Operating cash flow rises 68% to record A$109.8m (2015: A$65.4m)
• Debt-free with cash and bullion of A$40.3m at 30 June 2016, after
spending A$97.6m on capital growth and exploration in the year
• On track to achieve ~300,000ozpa from the June quarter 2017; AISC to hit A$950 in FY20¹
• FY17 exploration budget tripled to A$42m to drive increased
inventory and potential for growth beyond 300,000ozpa Saracen Mineral Holdings (ASX: SAR) has delivered a 132% increase in net profit after tax (NPAT) to A$25.9 million for FY2016, capping a strong operational and financial performance at its growing WA gold operations. The NPAT, which was after allowing for an income tax provision of A$12.4 million, was struck on an 11% increase in sales revenue to A$276.5 million and driven in part by increased gold sales of 188,024 ounces (2015: 164,114 ounces). EBITDA² rose by 11% to A$73.5 million reflecting the higher production levels combined with a 4% reduction in all-in sustaining costs (AISC) to A$1095/oz. The key results are tabulated on page 2. Due to the increased production, operating costs increased from A$162.7 million in 2015 to A$178.8 million. The charge for amortisation and depreciation decreased from A$49.5 million to A$33.9 million following completion of the Whirling Dervish open pit.
Operating cash flow rose by 68% to a record A$109.8m, driven by record production volumes, lower costs and a strong Australian-dollar gold price. At the end of the year, the Company held cash and bullion of $40.3 million with no debt. This was after spending A$97.6m during the period on capital development and exploration, mainly construction of Saracen’s second gold mine, Thunderbox (refer to Table 2 for further details).
For
per
sona
l use
onl
y
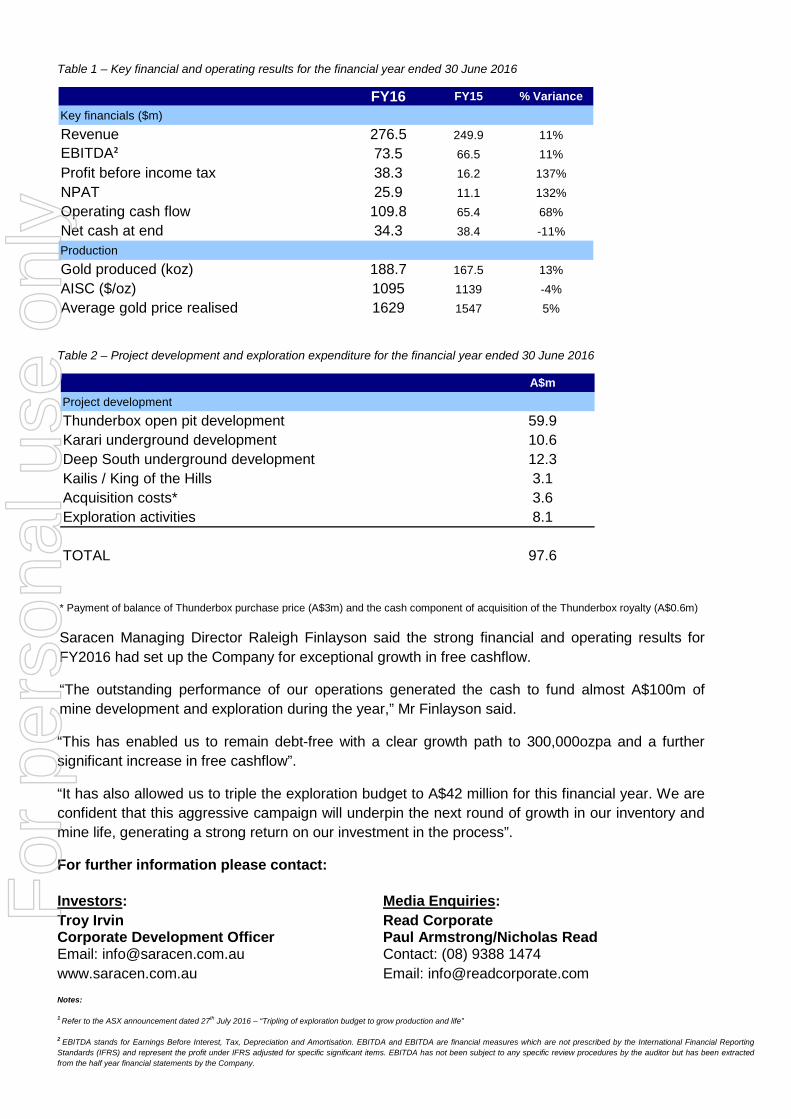
Table 1 – Key financial and operating results for the financial year ended 30 June 2016
Table 2 – Project development and exploration expenditure for the financial year ended 30 June 2016
* Payment of balance of Thunderbox purchase price (A$3m) and the cash component of acquisition of the Thunderbox royalty (A$0.6m)
Saracen Managing Director Raleigh Finlayson said the strong financial and operating results for FY2016 had set up the Company for exceptional growth in free cashflow.
“The outstanding performance of our operations generated the cash to fund almost A$100m of mine development and exploration during the year,” Mr Finlayson said.
“This has enabled us to remain debt-free with a clear growth path to 300,000ozpa and a further significant increase in free cashflow”.
“It has also allowed us to triple the exploration budget to A$42 million for this financial year. We are confident that this aggressive campaign will underpin the next round of growth in our inventory and mine life, generating a strong return on our investment in the process”.
For further information please contact:
Investors: Media Enquiries: Troy Irvin Read Corporate Corporate Development Officer Paul Armstrong/Nicholas Read Email: [email protected] Contact: (08) 9388 1474 www.saracen.com.au Email: [email protected]
Notes: 1 Refer to the ASX announcement dated 27th July 2016 – “Tripling of exploration budget to grow production and life”
2 EBITDA stands for Earnings Before Interest, Tax, Depreciation and Amortisation. EBITDA and EBITDA are financial measures which are not prescribed by the International Financial Reporting Standards (IFRS) and represent the profit under IFRS adjusted for specific significant items. EBITDA has not been subject to any specific review procedures by the auditor but has been extracted from the half year financial statements by the Company.
FY16 FY15 % VarianceKey financials ($m)Revenue 276.5 249.9 11%EBITDA² 73.5 66.5 11%Profit before income tax 38.3 16.2 137%NPAT 25.9 11.1 132%Operating cash flow 109.8 65.4 68%Net cash at end 34.3 38.4 -11%ProductionGold produced (koz) 188.7 167.5 13%AISC ($/oz) 1095 1139 -4%Average gold price realised 1629 1547 5%
A$mProject development Thunderbox open pit development 59.9Karari underground development 10.6Deep South underground development 12.3Kailis / King of the Hills 3.1Acquisition costs* 3.6Exploration activities 8.1
TOTAL 97.6
For
per
sona
l use
onl
y
Saracen Mineral Holdings Limited
ACN: 009 215 347
PO Box 2563 Perth WA 6001
Phone: +61 8 6229 9100 Fax: +61 8 6229 9199
ASX APPENDIX 4E
SARACEN MINERAL HOLDINGS LIMITED ABN: 52 009 215 347
RESULTS FOR ANNOUNCEMENT TO THE MARKET
FOR THE YEAR ENDED 30 JUNE 2016 (Previous corresponding period is the year ended 30 June 2015)
KEY INFORMATION 30 Jun 2016
$'000 30 Jun 2015
$'000 Up / (down)
$’000
Percentage increase / (decrease)
Revenue from ordinary activities 276,502 249,872 26,630 11%
Profit from ordinary activities after tax attributable to members 25,889 11,148 14,741 132%
Net profit/(loss) attributable to members 19,922 (2,412) 22,334 N/A DIVIDEND INFORMATION
No dividend has been proposed or declared. NET TANGIBLE ASSETS PER SECURITY 30 June 2016 30 June 2015
Net tangible assets per security $0.33 $0.29
EARNINGS PER SHARE 30 June 2016
Cents 30 June 2015
Cents
Basic earnings per share 3.26 1.41
Diluted earnings per share 3.20 1.40
CONTROL GAINED OR LOST OVER ENTITIES IN THE PERIOD
There have been no gains or losses of control over entities during the year ended 30 June 2016.
Additional Appendix 4E disclosure requirements under ASX Listing Rule 4.3A can be found in the Directors Report to the financial statements, which is attached, at the following page reference:-
Review of results (Directors’ Report) Page 4 Statement of profit or loss and other comprehensive income Page 28 Statement of financial position Page 29 Statement of changes in equity Page 30 Statement of cash flows Page 31 Notes to the financial statements Page 32 Earnings per security Page 47 Segment results Page 60 Independent audit report Page 67
This report is based on, and should be read in conjunction with, the attached financial report for the period ended 30 June 2016 for Saracen Mineral Holdings Limited, which has been audited by BDO Audit (WA) Pty Ltd.
For
per
sona
l use
onl
y
SARACEN MINERAL HOLDINGS LIMITED ACN 009 215 347
Financial Report for the Year Ended 30 June 2016
For
per
sona
l use
onl
y
Saracen Mineral Holdings Limited Contents
2
Financial Report For the year ended 30 June 2016
CORPORATE DIRECTORY ............................................................................................................................................. 3
DIRECTORS’ REPORT ................................................................................................................................................... 4
AUDITOR’S INDEPENDENCE DECLARATION ................................................................................................................27
CONSOLIDATED STATEMENT OF PROFIT OR LOSS AND OTHER COMPREHENSIVE INCOME ........................................28
CONSOLIDATED STATEMENT OF FINANCIAL POSITION ..............................................................................................29
CONSOLIDATED STATEMENT OF CHANGES IN EQUITY ...............................................................................................30
CONSOLIDATED STATEMENT OF CASH FLOWS ...........................................................................................................31
NOTES TO THE CONSOLIDATED FINANCIAL STATEMENTS ..........................................................................................32
DIRECTORS’ DECLARATION ........................................................................................................................................66
INDEPENDENT AUDITORS REPORT .............................................................................................................................67
For
per
sona
l use
onl
y
Saracen Mineral Holdings Limited Corporate Directory
3
Corporate Directory Board of Directors
Mr Geoffrey Clifford (Non-Executive Chairman) Mr Raleigh Finlayson (Managing Director) Mr Mark Connelly (Non-Executive Director) Mr Martin Reed (Non-Executive Director) Ms Samantha Tough (Non-Executive Director)
Secretary Mr Gerard Kaczmarek
Registered Office and Business Address Level 4 89 St Georges Terrace Perth WA 6000 Telephone: 08 6229 9100 Facsimile: 08 6229 9199 Website: saracen.com.au
Stock Exchange Listing Listed on the Australian Securities Exchange (ASX Code: SAR)
Auditors BDO Audit (WA) Pty Ltd 38 Station Street Subiaco WA 6008 Telephone: +61 8 6382 4600 Facsimile: +61 8 6382 4601
Solicitors DLA Piper Level 31, Central Park 152 – 158 St Georges Tce Perth WA 6000
Bankers Commonwealth Bank of Australia Limited 367 Collins Street Melbourne VIC 3000
and
Macquarie Bank Limited 50 Martin Place Sydney NSW 2000
Share Registry Computershare Investor Services Pty Limited 452 Johnston Street Abbotsford VIC 3067 Telephone: 1300 787 272 or 03 9415 5000 Facsimile: 03 9473 2500
For
per
sona
l use
onl
y
Saracen Mineral Holdings Limited Directors’ Report
4
Directors’ Report
The Directors of Saracen Mineral Holdings Limited (“Saracen” or “the Company”) present their report, together with the financial statements on the consolidated entity consisting of Saracen Mineral Holdings Limited and its controlled entities (the “Group”) for the financial year ended 30 June 2016. In order to comply with the provisions of the Corporations Act 2001, the Directors report as follow:- DIRECTORS
The names and particulars of the Company’s directors in office during the financial year and at the date of this report are as follows. Directors held office for this entire period unless otherwise stated.
Geoffrey Clifford Non-Executive Chairman (appointed Director 1 October 2013 & Chairman 26 November 2014) (Member of the Audit and Risk Management Committees) Mr Clifford is an accountant with more than 35 years’ experience in senior accounting, finance and company secretarial roles. He holds a Bachelor of Business degree from Curtin University and is a FCPA, FGIA and FAICD. Mr Clifford is a professional company director, currently serving as a non-executive director on the Board of Independence Group NL. From 2007 to 2011, he was a non-executive director (including as Chairman for the period 2008 to 2011) of Atlas Iron Limited. Prior to this, he spent eight years as the General Manager Administration and Company Secretary of Portman Limited. Mr Clifford became Non-Executive Chairman of the Company upon the retirement of the then Chairman, Mr Staltari, at the conclusion of the Annual General Meeting held on 26 November 2014. During the past three (3) years Mr Clifford has held directorships in the following other listed entities:- Company Appointed Resigned
Independence Group Limited December 2012 Current
Raleigh Finlayson Managing Director (appointed 2 April 2013) (Member of the Risk Management Committee) Mr Finlayson is a Mining Engineer, having studied at the Western Australian School of Mines and is the holder of a First Class Mine Managers Certificate, a Graduate Certificate in Applied Finance and Investment and is part way through a Masters of Mineral Economics at Curtin University. He is a member of the Australasian Institute of Mining and Metallurgy. Mr Finlayson has over 17 years of technical and operational experience in the mining industry in multiple disciplines including both underground and open pit operations. Since joining the Company, he has managed the timely completion of the Definitive Feasibility Study and development of the Carosue Dam operations in 2009 and was the Chief Operating Officer before being appointed Managing Director in April 2013. Mr Finlayson is a member of the Risk Management Committee. Mr Finlayson does not hold, and has not over the last three (3) years held, a directorship in any other public listed company. Mark Connelly Non-Executive Director (appointed 1 May 2015) (Chairman of the Audit Committee and member of the Remuneration & Nomination Committee) Mr Connelly holds a Bachelor of Business degree from Edith Cowan University and has over 29 years’ experience covering the development, construction and operation of mining projects across a variety of commodities (including gold and base metals) and jurisdictions (including Australia, West Africa, North America and Europe). Most recently Mr Connelly was Managing Director of Papillon Resources and was instrumental in the US$570m takeover of Papillon by B2Gold Corp in October 2014. Prior to Papillon, Mr Connelly was Chief Operating Officer of Endeavour Mining Corporation, following its merger with Adamus Resources Limited, where he was Managing Director and CEO. Mr Connelly has also held senior executive positions with Newmont Mining Corporation and Inmet Mining Corporation. He is a CPA, MAICD, AIM and SME.
For
per
sona
l use
onl
y
Saracen Mineral Holdings Limited Directors’ Report
5
During the past three (3) years Mr Connelly has held directorships in the following other listed entities:- Company Appointed Resigned
Cardinal Resources Tiger Resources Limited West African Resources Limited Ausdrill Limited B2Gold Corporation Manas Resources Limited Papillon Resources Limited
November 2015 October 2015 June 2015 July 2012 October 2014 January 2013 November 2012
Current Current Current Current June 2016 June 2015 October 2014
Martin Reed Non-Executive Director (appointed 24 August 2012) (Chairman of the Risk Management Committee and a member of the Remuneration & Nomination Committee) Mr Reed is a qualified mining engineer (BE Mining, Grad Dip Management, AICD Diploma) with over 35 years’ experience in operations management and project development across a range of commodities, countries and sizes of operations. Recent roles have included Chief Operating Officer and Project Manager for a number of metals companies including Sirius Resources, Sandfire Resources, St Barbara Limited, Paladin Energy Ltd and Windimurra Vanadium Limited. Prior to these appointments, Mr Reed held a number of senior executive positions in the mining industry including roles where he was responsible for the planning and development of several large mining operations in remote locations. Mr Reed does not hold, and has not over the last three (3) years held, a directorship in any other public listed company. Samantha Tough Non-Executive Director (appointed 1 October 2013) (Chairman of the Remuneration and Nomination Committee and a member of the Audit Committee) Ms Tough completed a Bachelor of Laws and Bachelor of Jurisprudence at the University of Western Australia and worked as a barrister and solicitor before progressing to the commercial sector. She is a Fellow of the AICD. Ms Tough is a professional company director with more than 15 years’ experience on public and private company boards. She has a depth of industry experience in resources and energy. Ms Tough’s executive roles include General Manager North West Shelf at Woodside Energy Ltd, Director Strategy for Hardman Resources Ltd, Senior Vice President Natural Resources at the Commonwealth Bank and Project Director for the Pilbara Power Project. During the past three (3) years Ms Tough has held directorships in the following other listed entities:- Company Appointed Resigned
Cape plc Molopo Energy Limited Southern Cross Goldfields Limited
January 2015 December 2014 July 2007
Current Current September 2013
Strike Resources Limited January 2012 November 2015 Barrie Parker Non-Executive Director (retired 25 November 2015) Mr Parker holds a degree in Minerals Engineering from the University of Birmingham and is a Fellow of the Australasian Institute of Mining and Metallurgy. He worked in the international mining industry for almost 50 years, primarily in operations management and project development roles, including managing the initial development of the Boddington and Sunrise Dam Gold mines. He was also the Regional Manager and Director of the AngloGold companies in Australia and South East Asia. Mr Parker was a member of the remuneration and chairman of the risk management committee. Mr Parker does not hold, and has not over the last three (3) years held, a directorship in any other public listed company.
For
per
sona
l use
onl
y
Saracen Mineral Holdings Limited Directors’ Report
6
COMPANY SECRETARY Gerard Kaczmarek (appointed 17 September 2012) Mr Kaczmarek graduated from the Australian National University (ANU) with a Bachelor in Economics and Accounting. He has over 30 years’ experience in the resources and mineral processing industry in Australia and overseas. He was Company Secretary and Chief Financial Officer for gold mining company Troy Resources Limited for almost ten years and prior to that spent seven years at Burmine Limited before its merger with Sons of Gwalia Limited. He commenced his career with the base metals division of CRA, now Rio Tinto. He is a CPA and MAICD. Mr Kaczmarek does not hold, and has not over the last three (3) years held, a directorship in any other public listed company. INTERESTS IN SHARES AND OPTIONS OF THE COMPANY AND RELATED BODIES CORPORATE As at the date of this report, the direct and indirect interests of the Directors and their related parties in the shares and Performance Rights of Saracen were:-
Director Ordinary Shares Performance Rights over ordinary shares - unlisted
Geoffrey Clifford - -
Raleigh Finlayson 4,381,819 9,035,000
Mark Connelly - -
Martin Reed 30,000 -
Samantha Tough - -
PRINCIPAL ACTIVITIES The principal activity of the Group during the year was gold mining and mineral exploration. REVIEW AND RESULTS OF OPERATIONS Overview Carosue Dam Operations Saracen Mineral Holdings Limited owns 100% of the Carosue Dam Operations (CDO) through its wholly owned subsidiary Saracen Gold Mines Pty Ltd. Saracen acquired the CDO assets in 2006 and commenced commercial production in 2010. Since then, Saracen has produced over 850,000 ounces of gold from open pits and underground mines. Saracen’s CDO tenement holdings and gold deposits are located in one of the world’s most prospective gold provinces, incorporating the Laverton and Keith Kilkenny Tectonic Zones, north-east of Kalgoorlie, Western Australia. This province is home to several world class gold mines and deposits including Sunrise Dam, Granny Smith, and Wallaby. In excess of 23 million ounces of gold in resources have been found and/or brought into production in this province. Saracen is building a long-term strategic infrastructure and resource position in this area. CDO comprises a 2.3 Mtpa processing plant, 238 person accommodation village and water and power infrastructure located approx. 120 km north-north-east of Kalgoorlie. The CDO processing plant was originally commissioned in November 2000 and has a nameplate capacity of 2.4 Mtpa based on a blend of hard and soft ores. Thunderbox Operations In January 2014, the Group acquired the Thunderbox Operations (TBO) from Norilsk Nickel Australia Pty Ltd for consideration of A$20 million cash on settlement, A$3 million cash on commencement of commercial production (paid in April 2016), and a 1.5% NSR Royalty on the TBO gold production (capped at A$17 million) which was acquired by Saracen in April 2016 for cash and shares for an equivalent consideration at that time of A$8.6 million.
For
per
sona
l use
onl
y
Saracen Mineral Holdings Limited Directors’ Report
7
TBO is located in the highly prospective Yandal Belt and the Agnew-Wiluna Belt in the North Eastern Goldfields of Western Australia and are centred on the Thunderbox Open Pit and CIL gold treatment plant located 45km south of the town of Leinster in Western Australia and immediately adjacent to the sealed Goldfields Highway. TBO includes the Thunderbox Project (comprising the Thunderbox, Rainbow and Mangilla gold deposits), the Bannockburn Project (comprising the Bannockburn and North Well gold deposits) and the Waterloo Project (comprising the Waterloo and Amorac nickel deposits). The Thunderbox processing facility has an annual capacity of 2.5 Mtpa and incorporates a single-stage crusher, a SAG mill and a ball mill as well as conventional CIL leaching and elution circuits. Infrastructure includes a 268 person accommodation village, airstrip, contract power supply, Goldfields Gas pipeline spur, borefield water supply and telecommunication services. In March 2015, a decision to re-commence mining at the Thunderbox deposit was taken by the Board. The mining pre-strip commenced in July 2015 and the plant refurbishment commenced in September 2015. In August 2015, the Group acquired the Kailis and King of the Hills (KoTH) projects from St Barbara Ltd for a consideration of $3m cash in two tranches: $0.3m on acquisition, plus $2.7m upon the earlier of commercial production from Kailis or 4 years following acquisition. Kailis is located 5km from Leonora and 80km south of Saracen’s Thunderbox project, and within 1km of the sealed Goldfields Highway. In the 1990’s Sons of Gwalia mined a small open pit at Kailis with reconciled production of 250kt @ 6.2 g/t for ~50koz. King of the Hills is located 65km to the south of Thunderbox, immediately adjacent to the Goldfields Highway. King of the Hills is a significantly mineralised system, which produced ~30Mt @ 1.9g/t for 1.9Moz since 1985. Production: Carosue Dam Operations
For the financial year ended 30 June 2016 (“FY2016”), gold production from the Carosue Dam Operations was 157,191 oz (2015: 167,531 oz) at an All in Sustaining Cost (“AISC”) of $1,067/oz (2015: $1,139/oz).
Carosue Dam Quarter
Mill Production Unit September 15 December 15 March 16 June 16 FY2016
Total Ore Milled t 577,000 569,000 565,000 610,000 2,321,000
g/t 2.3 2.6 2.0 2.3 2.3
Recovery % 91.3% 92.5% 91.9% 92.3% 92.0%
Gold Produced oz 38,140 44,265 33,749 41,037 157,191
Underground Mining
Total Ore Mined t 143,000 248,000 275,000 334,000 1,000,000
g/t 4.3 4.5 2.9 3.2 3.6
Contained Ounces oz 19,759 36,229 26,051 34,065 116,104
Mining of the Whirling Dervish open pit concluded at the end of June 2015 resulting in a large stockpile of ore at the end of FY2015. This stockpile was used to make up the base load mill tonnages during the year, supplemented with higher grade underground ore from Red October, Karari and Deep South. Development work commenced at the Karari underground mine in October 2014 and commercial production was declared in October 2015. Production for the year (including development material) was 520,000 tonnes @ 2.9g/t for 49,000 contained ounces. The Red October underground mine produced above budget tonnes and ounces for the year with total production of 340,000t @ 5.1g/t for 55,700 contained ounces. Development work commenced at the Deep South underground mine in October 2014 and continued throughout the year. Commercial production is expected to be declared in the September 2016 quarter. Production for the year (being all development material) was 143,000 tonnes @ 2.5g/t for 11,500 contained ounces. Gold production for the full year was 157,191 ounces at an AISC of $1,067/oz.
For
per
sona
l use
onl
y
Saracen Mineral Holdings Limited Directors’ Report
8
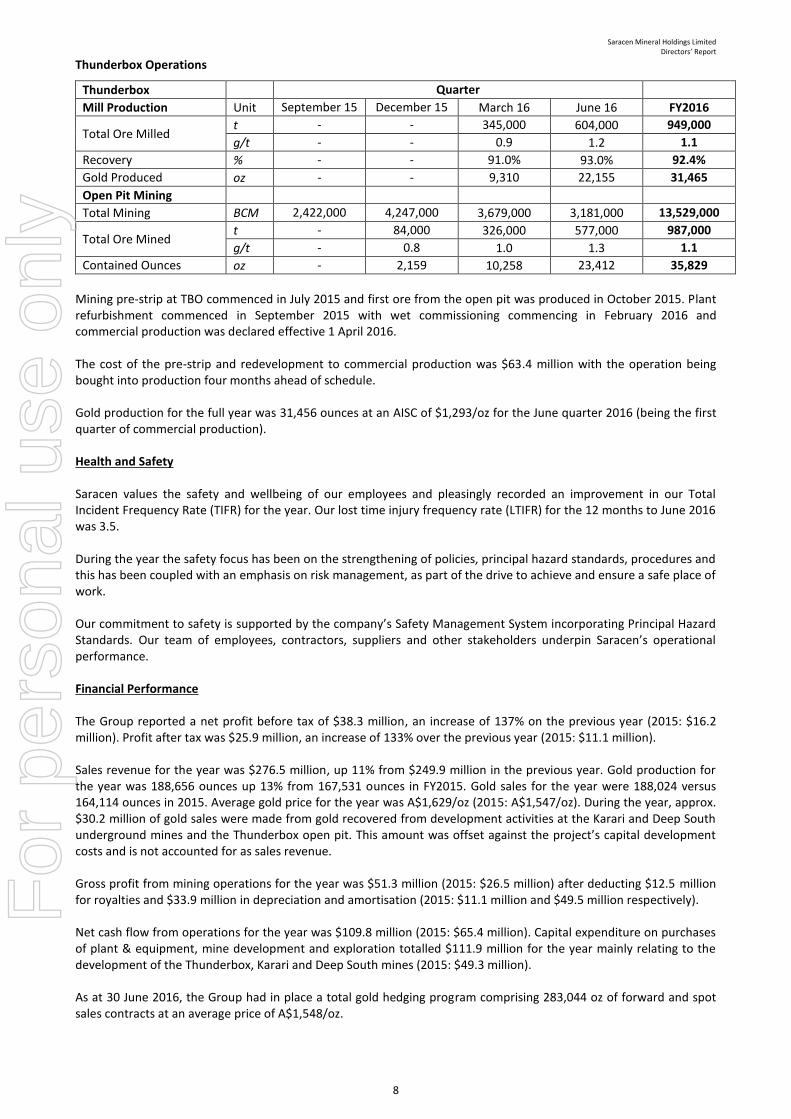
Thunderbox Operations
Thunderbox Quarter
Mill Production Unit September 15 December 15 March 16 June 16 FY2016
Total Ore Milled t - - 345,000 604,000 949,000
g/t - - 0.9 1.2 1.1
Recovery % - - 91.0% 93.0% 92.4%
Gold Produced oz - - 9,310 22,155 31,465
Open Pit Mining
Total Mining BCM 2,422,000 4,247,000 3,679,000 3,181,000 13,529,000
Total Ore Mined t - 84,000 326,000 577,000 987,000
g/t - 0.8 1.0 1.3 1.1
Contained Ounces oz - 2,159 10,258 23,412 35,829
Mining pre-strip at TBO commenced in July 2015 and first ore from the open pit was produced in October 2015. Plant refurbishment commenced in September 2015 with wet commissioning commencing in February 2016 and commercial production was declared effective 1 April 2016. The cost of the pre-strip and redevelopment to commercial production was $63.4 million with the operation being bought into production four months ahead of schedule. Gold production for the full year was 31,456 ounces at an AISC of $1,293/oz for the June quarter 2016 (being the first quarter of commercial production). Health and Safety Saracen values the safety and wellbeing of our employees and pleasingly recorded an improvement in our Total Incident Frequency Rate (TIFR) for the year. Our lost time injury frequency rate (LTIFR) for the 12 months to June 2016 was 3.5. During the year the safety focus has been on the strengthening of policies, principal hazard standards, procedures and this has been coupled with an emphasis on risk management, as part of the drive to achieve and ensure a safe place of work. Our commitment to safety is supported by the company’s Safety Management System incorporating Principal Hazard Standards. Our team of employees, contractors, suppliers and other stakeholders underpin Saracen’s operational performance. Financial Performance The Group reported a net profit before tax of $38.3 million, an increase of 137% on the previous year (2015: $16.2 million). Profit after tax was $25.9 million, an increase of 133% over the previous year (2015: $11.1 million). Sales revenue for the year was $276.5 million, up 11% from $249.9 million in the previous year. Gold production for the year was 188,656 ounces up 13% from 167,531 ounces in FY2015. Gold sales for the year were 188,024 versus 164,114 ounces in 2015. Average gold price for the year was A$1,629/oz (2015: A$1,547/oz). During the year, approx. $30.2 million of gold sales were made from gold recovered from development activities at the Karari and Deep South underground mines and the Thunderbox open pit. This amount was offset against the project’s capital development costs and is not accounted for as sales revenue. Gross profit from mining operations for the year was $51.3 million (2015: $26.5 million) after deducting $12.5 million for royalties and $33.9 million in depreciation and amortisation (2015: $11.1 million and $49.5 million respectively). Net cash flow from operations for the year was $109.8 million (2015: $65.4 million). Capital expenditure on purchases of plant & equipment, mine development and exploration totalled $111.9 million for the year mainly relating to the development of the Thunderbox, Karari and Deep South mines (2015: $49.3 million). As at 30 June 2016, the Group had in place a total gold hedging program comprising 283,044 oz of forward and spot sales contracts at an average price of A$1,548/oz.
For
per
sona
l use
onl
y
Saracen Mineral Holdings Limited Directors’ Report
9
Production & Operational Outlook for 2016/17 and Beyond Carosue Dam Operations In FY2017, gold production will be sourced principally from the Karari and Deep South underground mines and the Whirling Dervish ore stockpiles with a small contribution from the Red October underground mine. Production is forecast to be 155,000 ozs. Saracen’s business plan for CDO for the next 2 years comprises: -
Completing the development of the Deep South underground mine to deliver approx. 500,000 tonnes of ore per annum, grading 4.0g/t;
Commencing underground drill drive development of the Whirling Dervish deposit in the second half of FY2017;
Complete the feasibility study on the Whirling Dervish underground mining project;
Extending the life and quality of its open-pittable resources;
Optimising production through the Carosue Dam processing plant including processing of the extensive ore stockpiles; and
Generating sustaining cash flows. Thunderbox Operations In FY2017, gold production will be sourced principally from the Thunderbox Zone A open pit supplemented by small amounts of ore from the King of the Hills (KoTH). Production is forecast to be 125,000 ozs. Saracen’s business plan for TBO for the next 2 years comprises: -
Mining of the Thunderbox A zone open pit;
Development and mining of the Thunderbox C zone open pit;
Development and mining of the Kailis open pit;
Commencing stable, long life, commercial production;
Extensional drilling on the Thunderbox A zone orebody to confirm underground mining potential;
Extensional drilling at the King of the Hills project to confirm underground mining potential;
Mining at the King of the Hills project to commence;
Continue the underground mining feasibility study for the Thunderbox orebodies; and
Generate sustaining cash flows.
Exploration Nearly 44,000m of underground and surface drilling completed at Karari during FY2016 has significantly expanded the resources and reserves for Karari. Exploration drilling also showed mineralisation remains open to the south of the Karari mine and at depth. A significant drill program at Karari is planned for FY2017 to continue to build on the ever-growing Karari resource. Prior to the commencement of underground mining at Deep South, surface RC and diamond drilling was undertaken to test for resource extensions north and south of the mine and complete a geotechnical study. Downhole geophysics conducted in some of these drill holes identified a strong conductor consistent with gold-bearing sulphide accumulations below the current Mexico resource that lies to the south of the Deep South mine. Following the commencement of underground mining at Deep South in October 2015 approximately 5,500m of underground grade control and resource definition drilling has been completed. An extensive drill program is planned for FY2017 to convert resources in Deep South and the nearby resources of Tennessee and Mexico. Drilling at Red October during FY2016 included 24,400m of underground resource definition and grade control into current and future mining areas. Exploration in the mine included tests of the lower extension of the Marlin lode and exploring for prospective horizons east and west of the current mine. Several targets intersected by this exploration will be followed up with drilling in FY2017. The King of the Hills mine was acquired during FY2016 and Saracen immediately moved forward to realise the value of this resource by commencing underground diamond drill testing of high grade quartz veins under the southern pit of King of the Hill. This program has already shown this high grade mineralisation continues beneath the pit, and further exploration is ongoing. Grade control drilling into remnant mining areas that will form part of the FY2017 LOM plan will continue from FY2016 into FY2017.
For
per
sona
l use
onl
y
Saracen Mineral Holdings Limited Directors’ Report
10
Greenfields exploration undertaken in FY2016 included regional mapping and sampling in the under-explored Mt Celia district, which hosts both the active Deep South and historic Safari Bore mines. This work led to the definition of several targets that are scheduled for drill testing in FY2017. In the Red October district, mapping and surface sampling undertaken during FY2016 identified Anchor-type shear zones approximately 500m north of the Red October mine with coincident soil gold anomalies. These shear zones are closely linked to high-grade gold mineralisation in the Red October and further exploration of these new exploration targets is planned for FY2017. Exploration near the Carosue Dam gold plant included auger drilling near the Blue Manna resource to test for potential gold mineralisation over identified structural targets. A small aircore drill program was also undertaken during FY2016 on an area adjacent to Blue Manna. Greenfields activities at Thunderbox Operations included geological mapping and re-sampling of historic drill holes to advance the knowledge of gold mineralisation in a number of prospects. Drilling activities at Thunderbox were restricted to grade control RC drilling in the Thunderbox pit. Investor Relations During the year the Company presented at several conferences and conducted roadshows to existing and prospective investors, analysts and stockbrokers. These included:-
Diggers and Dealers Conference, August 2015;
Deutsche Bank Gold Day, September 2015;
Denver Gold Conference, September 2015;
Macquarie Bank WA Resources Forum, October 2015;
BMO Global Metals and Mining Conference, February 2016;
Euroz Conference, March 2016;
Macquarie Bank Australia Conference, May 2016;
Read Corporate Resources Rising Stars Conference, May 2016;
European investor roadshows, December 2015 and June 2016;
Asian investor roadshow, June 2016;
Various investor mine site visits; and
Various presentations in Sydney and Melbourne. A copy of each presentation given to these conferences and roadshows is released to the ASX and are available on both the ASX and the Group’s website, saracen.com.au.
Human Resources As at 30 June 2016 the business had 293 employees. The commencement of our Thunderbox Operations saw a significant increase in employee numbers from the 2015 financial year. We continue to promote a workplace culture that embraces diversity, and we currently have approximately 15% female participation. Saracen's core values – Accountability, Communication, Delivery and Choose Your Attitude – continue to promote a strong, results-driven culture, where our people are at the heart of the success of our business. The Bonus Scheme was again utilised to provide further incentive to employees in meeting organisational Key Performance Indicators, each employee’s individual performance in their role was assessed at the mid-year and annual appraisals and this had an impact on their bonus entitlement. Community Support Saracen is proud to be involved in and supportive of community groups and organisations and has maintained our commitment to supporting the local communities in which we operate, despite the current difficult market conditions. During FY2016 Saracen has provided funding to:-
Leonora Golden Gift
The Kalgoorlie City Football Club
SolarisCare Foundation
WA School of Mines Graduates Association
CEO Sleepout
Everyday Hero
Children’s Charity Network
Rockingham Rotary Club
For
per
sona
l use
onl
y
Saracen Mineral Holdings Limited Directors’ Report
11
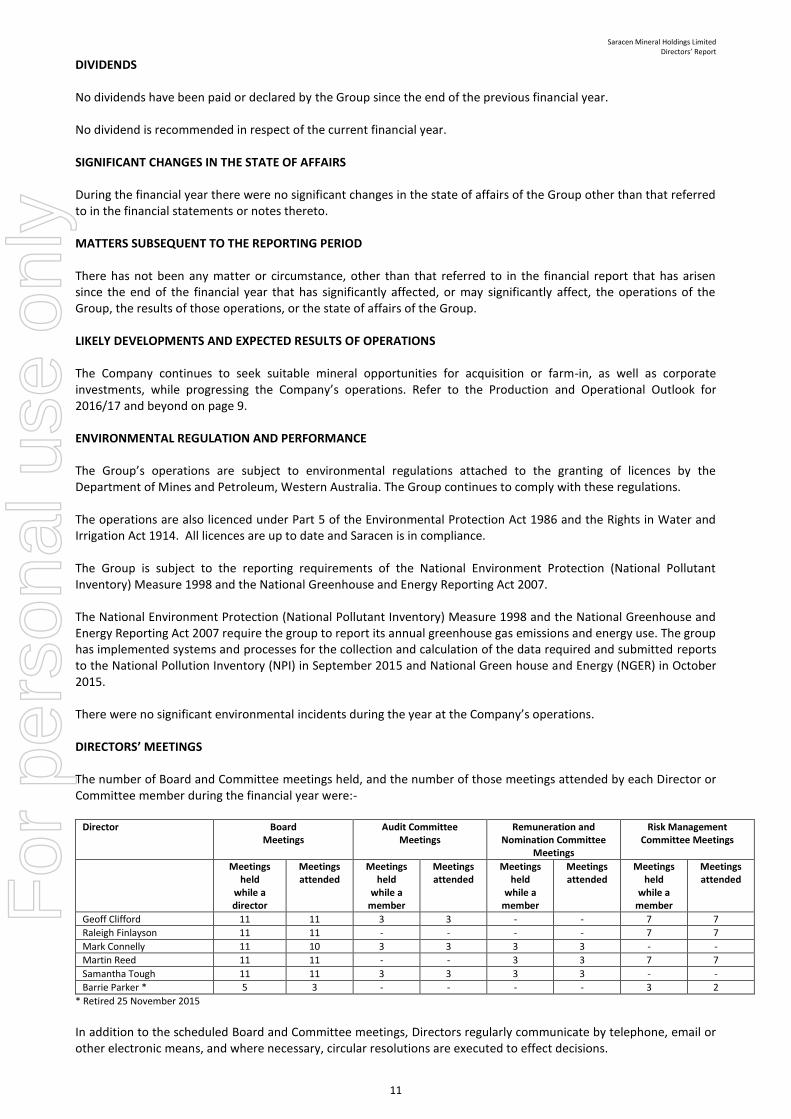
DIVIDENDS No dividends have been paid or declared by the Group since the end of the previous financial year. No dividend is recommended in respect of the current financial year. SIGNIFICANT CHANGES IN THE STATE OF AFFAIRS During the financial year there were no significant changes in the state of affairs of the Group other than that referred to in the financial statements or notes thereto. MATTERS SUBSEQUENT TO THE REPORTING PERIOD There has not been any matter or circumstance, other than that referred to in the financial report that has arisen since the end of the financial year that has significantly affected, or may significantly affect, the operations of the Group, the results of those operations, or the state of affairs of the Group. LIKELY DEVELOPMENTS AND EXPECTED RESULTS OF OPERATIONS The Company continues to seek suitable mineral opportunities for acquisition or farm-in, as well as corporate investments, while progressing the Company’s operations. Refer to the Production and Operational Outlook for 2016/17 and beyond on page 9. ENVIRONMENTAL REGULATION AND PERFORMANCE The Group’s operations are subject to environmental regulations attached to the granting of licences by the Department of Mines and Petroleum, Western Australia. The Group continues to comply with these regulations. The operations are also licenced under Part 5 of the Environmental Protection Act 1986 and the Rights in Water and Irrigation Act 1914. All licences are up to date and Saracen is in compliance. The Group is subject to the reporting requirements of the National Environment Protection (National Pollutant Inventory) Measure 1998 and the National Greenhouse and Energy Reporting Act 2007. The National Environment Protection (National Pollutant Inventory) Measure 1998 and the National Greenhouse and Energy Reporting Act 2007 require the group to report its annual greenhouse gas emissions and energy use. The group has implemented systems and processes for the collection and calculation of the data required and submitted reports to the National Pollution Inventory (NPI) in September 2015 and National Green house and Energy (NGER) in October 2015. There were no significant environmental incidents during the year at the Company’s operations. DIRECTORS’ MEETINGS The number of Board and Committee meetings held, and the number of those meetings attended by each Director or Committee member during the financial year were:-
Director Board Meetings
Audit Committee Meetings
Remuneration and Nomination Committee
Meetings
Risk Management Committee Meetings
Meetings held
while a director
Meetings attended
Meetings held
while a member
Meetings attended
Meetings held
while a member
Meetings attended
Meetings held
while a member
Meetings attended
Geoff Clifford 11 11 3 3 - - 7 7
Raleigh Finlayson 11 11 - - - - 7 7
Mark Connelly 11 10 3 3 3 3 - -
Martin Reed 11 11 - - 3 3 7 7
Samantha Tough 11 11 3 3 3 3 - -
Barrie Parker * 5 3 - - - - 3 2
* Retired 25 November 2015
In addition to the scheduled Board and Committee meetings, Directors regularly communicate by telephone, email or other electronic means, and where necessary, circular resolutions are executed to effect decisions.
For
per
sona
l use
onl
y
Saracen Mineral Holdings Limited Directors’ Report
12
REMUNERATION REPORT (AUDITED) The information provided in this Remuneration Report has been audited as required by section 308(3C) of the Corporations Act 2001. The Directors present the Saracen Mineral Holdings Limited 2016 Remuneration Report, outlining key aspects of our remuneration policy and framework, and remuneration awarded this year. This report forms part of the Directors’ Report. The report is structured as follows:
1. Key management personnel (KMP) covered in this report 2. Key changes since 2015 remuneration report 3. Remuneration governance 4. Executive remuneration policy and framework 5. Link between remuneration and performance 6. Details of remuneration 7. Contractual arrangements with executive KMP 8. Non-executive director arrangements 9. Other statutory information
1. Key management personnel covered in this report The Directors of the Group during or since the end of the financial year were:-
Geoffrey Clifford Non-Executive Chairman Raleigh Finlayson Mark Connelly
Managing Director (Executive)
Non-Executive Director
Martin Reed Non-Executive Director Samantha Tough Non-Executive Director Barrie Parker Non-Executive Director (retired 25 November 2015)
The Key Management Personnel (KMP) during or since the end of the financial year were:-
Craig Bradshaw Gerard (Gerry) Kaczmarek Daniel Howe William (Troy) Irvin
Chief Operating Officer Company Secretary / Chief Financial Officer Chief Geologist Chief Corporate Development Officer
2. Key changes since 2015 remuneration report 2A. Retirement of Non-executive Director Barrie Parker retired at the Annual General Meeting held on 25 November 2015. The Directors consider the size and composition of the Saracen Board to be appropriate and have not replaced Mr Parker during the financial year. 2B. Approval of Performance Rights issued to the Managing Director The issue of 10,000,000 performance rights to Raleigh Finlayson, which was provisionally included in the 2015 remuneration report, was approved by shareholders at the Annual General Meeting held on 25 November 2015. Refer to “4 - Executive Remuneration Policy and Framework” below for further details. 2C. Issue of Performance Rights to KMP During the year an additional 2,805,000 performance rights were granted to employees of which 800,000 were allocated to KMP. Refer to “4 - Executive Remuneration Policy and Framework” below for further details.
For
per
sona
l use
onl
y
Saracen Mineral Holdings Limited Directors’ Report
13
3. Remuneration Governance
3A. Remuneration decision making The Remuneration & Nomination Committee (”RNC”) is a sub-committee of the Board. It is primarily responsible for making recommendations to the Board on:-
the over-arching executive remuneration framework;
operation of the incentive plans which apply to executive directors and senior executives (the executive team) including key performance indicators and performance hurdles;
remuneration levels of executives; and
Non-executive Director fees. The committee reviews and determines the Group’s remuneration policy and structure annually to ensure it remains aligned to business needs, and meets the Group’s remuneration principles. From time to time, the committee also engages external remuneration consultants to assist with this review, see “9E – Use of remuneration consultants” below for further information. In particular, the Board aims to ensure that remuneration practices are:
competitive and reasonable, enabling the company to attract and retain key talent;
aligned to the company’s strategic and business objectives and the creation of shareholder value;
transparent and easily understood; and
acceptable to shareholders. The RNC has delegated authority to the Managing Director for approving remuneration recommendations for employees other than KMP, within the parameters of approved Group wide remuneration levels and structures. The members of the remuneration committee are all independent, Non-Executive Directors and, as at the date of this report, comprised: Samantha Tough – Chair of Committee, Non-Executive Director Mark Connelly – Non-Executive Director Martin Reed – Non-Executive Director 3B. Clawback of remuneration In the event of serious misconduct or a material misstatement in the Group’s financial statements, the Board has the discretion to reduce, cancel or clawback any unvested short term or long term incentives. 3C. Share trading policy The Group’s securities trading policy applies to all Directors and KMP. In accordance with the policy, employees, other than Directors of the company, may only deal in Saracen Mineral Holdings Limited securities in the period of 30 days from the day following:-
the announcement of half-year results; or
the announcement of annual results; or
the announcement of quarterly results; or
the holding of the Annual General Meeting.
These are collectively referred to as the “Window Period”. The policy prohibits employees from dealing in Saracen Mineral Holdings Limited securities while in possession of material non-public information relevant to the Group, even if it is within a Window Period. Directors of the Group are prohibited from dealing in Securities of Saracen Mineral Holdings Limited outside of a Window Period and must receive written consent from the Chairman or the Board for any dealing in the Group’s securities within a Window Period. 4. Executive Remuneration Policy and Framework The RNC is responsible for determining remuneration policies in respect of executives and KMP. In establishing such policies, the RNC is guided by external remuneration surveys and industry practices, commensurate with the scale and
For
per
sona
l use
onl
y
Saracen Mineral Holdings Limited Directors’ Report
14
size of the Group’s operations. Target positioning of total remuneration against market is the 50th
percentile. The policies and remuneration levels are reviewed regularly to ensure that the Group remains competitive as an employer. The executive remuneration framework for KMPs has three components as per the table below:-
Element Consist of Purpose Performance Metrics
Fixed Remuneration (FR)
Base pay and benefits, including superannuation
Provide competitive market salary including superannuation and benefits
Nil
Short-term incentives (STI)
Cash payments targeted at a percentage of FR
Reward for in-year performance
- Group Total Incident Frequency Rate (TIFR);
- Corporate Costs; - Core Values (specific to individual); and - Group all in cost*.
Long-term incentives (LTI)
Performance Rights Alignment to long-term shareholder value
All issues except Tranche 5 - 3 Year Peer Group Total Shareholder
Return** comparison; - 3 Year Growth of Ore Reserves; and - 3 Year Increase in share price. Tranche 5 issued to Managing Director - Commencement of production at
Thunderbox before 31 December 2016; and
- 2 and 3 Year Peer Group TSR comparison.
* This is the Group’s “All in Cost” which includes all costs except for a cost incurred only as a result of a higher gold price (eg. a royalty based on gold price). ** Total Shareholder Return (TSR) is calculated as the increase in the price of a Group’s shares on the ASX over and in respect of the performance, based on the 30 day VWAP for those shares, plus any reinvested dividends, expressed as a percentage of the 30 day VWAP share price.
(i) Base pay and benefits The Group has employment agreements with all KMP. These agreements are capable of termination in accordance with standard employment terms. The terms of the agreements are open ended although the Group retains the right to terminate an agreement immediately by making a payment equal to the notice period in lieu of that person working out their notice period. KMP are also entitled to receive, on termination of employment, their statutory entitlements of accrued annual and long service leave. Each employment agreement outlines the components of remuneration paid to each executive but does not prescribe how remuneration levels are modified from year to year. Remuneration levels are reviewed each year. Additional details of KMP employment agreements can be found below at section “7 – Contractual arrangements with executive KMP”. Other than above, or as disclosed elsewhere in the Remuneration Report, no KMP are subject to specific employment agreements. Operating and non-operating key performance indicators (“KPIs”) relevant to each KMP are set so as to form a basis of assessment of future levels of remuneration. The KPIs set for KMP are mostly directly aligned to the Group’s intrinsic business performance, for example, performance against the annual budget, health and safety measures, and other operational criteria. The Board retains the right to determine an executive’s remuneration depending on the outcome of the annual performance reviews and other factors that the Directors consider relevant. A formal annual performance review system is in place whereby KMP performance against individual and corporate KPI’s are reviewed and discussed. In addition to base salary, superannuation is paid on the base salary at the statutory level. KMP may elect to contribute additional amounts to superannuation subject to legislative limits.
For
per
sona
l use
onl
y
Saracen Mineral Holdings Limited Directors’ Report
15
(ii) Short-term incentives (“STI”)
The STI is an annual “at risk” component of remuneration for KMP. It is payable based on their performance against KPIs set at the beginning of the financial year. STIs are structured to remunerate KMP for achieving annual targets on an individual and a group basis which are designed around the success of the business. The STI is payable in cash after allowance for tax deductions. For FY2016, the KPIs set for KMP related to safety, gold production, cash flow generation, closing cash balance, production costs and personal performance. Refer to the table below for the structure of the STI plan: Feature Description
Max opportunity
CEO and other KMP: 25% of base salary
Performance metrics:
Metric Target Weighting Actuals Bonus Achieved
Weighted Bonus Base Case -
0% Mid Case - 50%
Stretch Case - 100%
Group TIFR 326 301 277 20% 358 0% 0%
Corporate Costs $45/oz $44/oz $43/oz 20% $40/oz 100% 20%
Core Values (specific to individual)
3 rating 2 rating 1 rating 20% 2 rating* 50% 10%
Group all in cost $1,508/oz $1,429/oz $1,350oz 40% $1,459oz 31% 12%
Percentage of maximum STI received 42%**
* The CEO and all other KMP achieved the same rating. ** All KMP achieved the same percentage of maximum available STI. The RNC determined that for FY2016, the Managing Director and other KMP would receive 42% of their maximum available STI (11% of base salary). The STI amounts payable for FY2016 are included in the remuneration calculation in the table under section “(i) Details of Remuneration”. These amounts will be paid in FY2017. (iii) Long-term incentives (“LTI”) LTI awards are structured to reward KMP for the long term performance of the Group relative to its peers and, from the commencement of FY2014, are granted in the form of Performance Rights. Prior to this, LTIs had been in the form of Employee Options. The latter have not been used for employee incentive purposes over the last three years. Performance Rights The Saracen Mineral Holdings Limited Performance Rights Plan (“Plan”) was approved by shareholders at the Company’s 2013 Annual General Meeting. The Plan provides the Board with the discretion to grant Performance Rights to eligible participants that will vest subject to the achievement of performance hurdles or KPIs as determined by the Board from time to time. The objective of the Plan is to attract, motivate and retain KMPs and it is considered by the Group that the Plan and the future issue of Performance Rights under the Plan will provide selected participants with the opportunity to participate in the future growth of the Group. The Plan will enable the Group to make grants to Eligible Participants so that long term incentives form a key component of their total annual remuneration. The Board believes that grants under the Plan will serve a number of purposes including:-
to act as a key retention tool; and
to focus attention on future Shareholder value generation. Under the Plan, Eligible Participants will be granted Performance Rights. Vesting of any of these Performance Rights will be subject to the achievement of various KPIs which can be varied each year and aligned to the individual’s performance. Each Performance Right represents a right to be issued one Share at a future point in time, subject to the satisfaction of any vesting conditions. No exercise price is payable. The quantum of Performance Rights to be granted will be determined with reference to market practice and will be subject to approval by the Board.
For
per
sona
l use
onl
y
Saracen Mineral Holdings Limited Directors’ Report
16
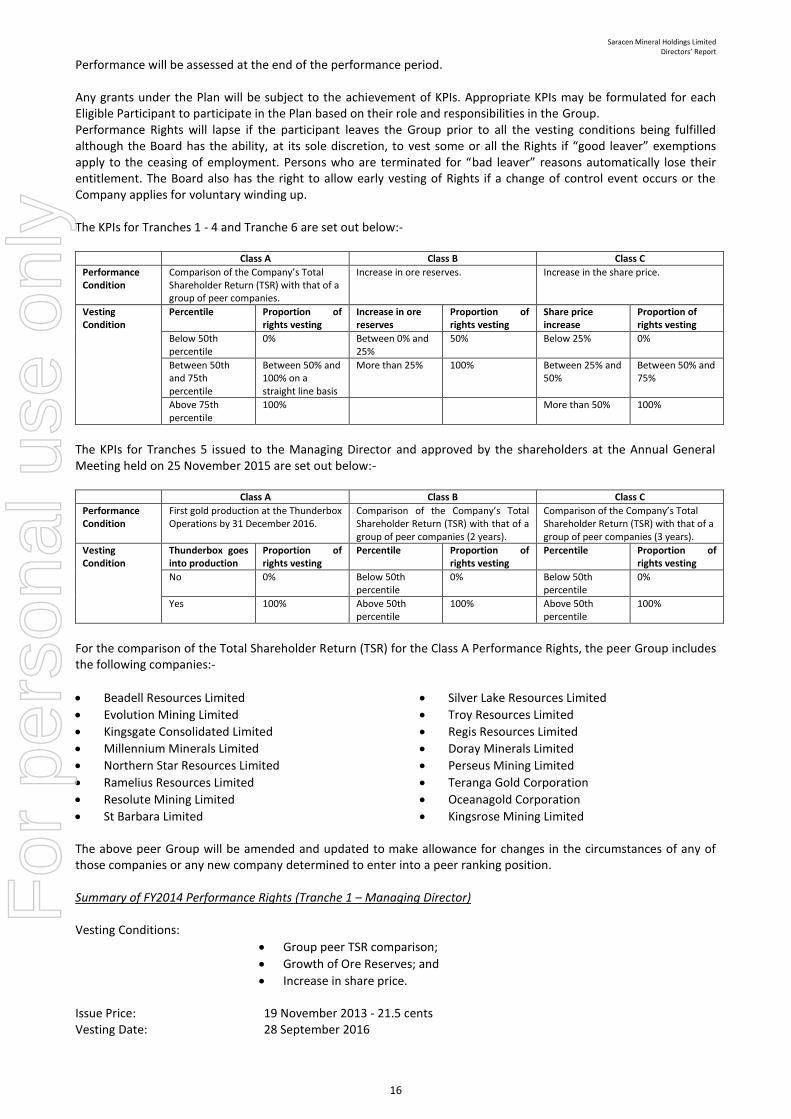
Performance will be assessed at the end of the performance period. Any grants under the Plan will be subject to the achievement of KPIs. Appropriate KPIs may be formulated for each Eligible Participant to participate in the Plan based on their role and responsibilities in the Group. Performance Rights will lapse if the participant leaves the Group prior to all the vesting conditions being fulfilled although the Board has the ability, at its sole discretion, to vest some or all the Rights if “good leaver” exemptions apply to the ceasing of employment. Persons who are terminated for “bad leaver” reasons automatically lose their entitlement. The Board also has the right to allow early vesting of Rights if a change of control event occurs or the Company applies for voluntary winding up. The KPIs for Tranches 1 - 4 and Tranche 6 are set out below:-
Class A Class B Class C
Performance Condition
Comparison of the Company’s Total Shareholder Return (TSR) with that of a group of peer companies.
Increase in ore reserves. Increase in the share price.
Vesting Condition
Percentile Proportion of rights vesting
Increase in ore reserves
Proportion of rights vesting
Share price increase
Proportion of rights vesting
Below 50th percentile
0% Between 0% and 25%
50% Below 25% 0%
Between 50th and 75th percentile
Between 50% and 100% on a straight line basis
More than 25% 100% Between 25% and 50%
Between 50% and 75%
Above 75th percentile
100% More than 50% 100%
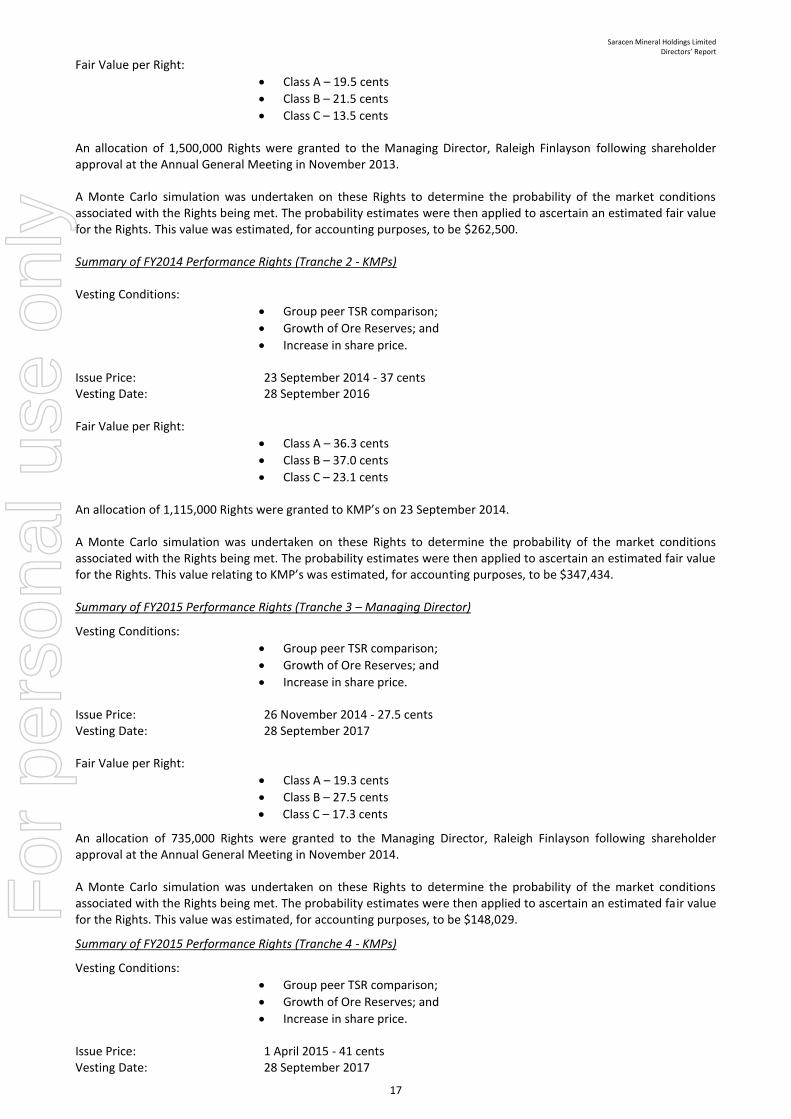
The KPIs for Tranches 5 issued to the Managing Director and approved by the shareholders at the Annual General Meeting held on 25 November 2015 are set out below:-
Class A Class B Class C
Performance Condition
First gold production at the Thunderbox Operations by 31 December 2016.
Comparison of the Company’s Total Shareholder Return (TSR) with that of a group of peer companies (2 years).
Comparison of the Company’s Total Shareholder Return (TSR) with that of a group of peer companies (3 years).
Vesting Condition
Thunderbox goes into production
Proportion of rights vesting
Percentile Proportion of rights vesting
Percentile Proportion of rights vesting
No 0% Below 50th percentile
0% Below 50th percentile
0%
Yes 100% Above 50th percentile
100% Above 50th percentile
100%
For the comparison of the Total Shareholder Return (TSR) for the Class A Performance Rights, the peer Group includes the following companies:-
Beadell Resources Limited
Evolution Mining Limited
Kingsgate Consolidated Limited
Millennium Minerals Limited
Northern Star Resources Limited
Ramelius Resources Limited
Resolute Mining Limited
St Barbara Limited
Silver Lake Resources Limited
Troy Resources Limited
Regis Resources Limited
Doray Minerals Limited
Perseus Mining Limited
Teranga Gold Corporation
Oceanagold Corporation
Kingsrose Mining Limited
The above peer Group will be amended and updated to make allowance for changes in the circumstances of any of those companies or any new company determined to enter into a peer ranking position. Summary of FY2014 Performance Rights (Tranche 1 – Managing Director) Vesting Conditions:
Group peer TSR comparison;
Growth of Ore Reserves; and
Increase in share price.
Issue Price: 19 November 2013 - 21.5 cents Vesting Date: 28 September 2016
For
per
sona
l use
onl
y
Saracen Mineral Holdings Limited Directors’ Report
17
Fair Value per Right:
Class A – 19.5 cents
Class B – 21.5 cents
Class C – 13.5 cents An allocation of 1,500,000 Rights were granted to the Managing Director, Raleigh Finlayson following shareholder approval at the Annual General Meeting in November 2013. A Monte Carlo simulation was undertaken on these Rights to determine the probability of the market conditions associated with the Rights being met. The probability estimates were then applied to ascertain an estimated fair value for the Rights. This value was estimated, for accounting purposes, to be $262,500. Summary of FY2014 Performance Rights (Tranche 2 - KMPs) Vesting Conditions:
Group peer TSR comparison;
Growth of Ore Reserves; and
Increase in share price.
Issue Price: 23 September 2014 - 37 cents Vesting Date: 28 September 2016 Fair Value per Right:
Class A – 36.3 cents
Class B – 37.0 cents
Class C – 23.1 cents An allocation of 1,115,000 Rights were granted to KMP’s on 23 September 2014. A Monte Carlo simulation was undertaken on these Rights to determine the probability of the market conditions associated with the Rights being met. The probability estimates were then applied to ascertain an estimated fair value for the Rights. This value relating to KMP’s was estimated, for accounting purposes, to be $347,434. Summary of FY2015 Performance Rights (Tranche 3 – Managing Director)
Vesting Conditions:
Group peer TSR comparison;
Growth of Ore Reserves; and
Increase in share price.
Issue Price: 26 November 2014 - 27.5 cents Vesting Date: 28 September 2017 Fair Value per Right:
Class A – 19.3 cents
Class B – 27.5 cents
Class C – 17.3 cents
An allocation of 735,000 Rights were granted to the Managing Director, Raleigh Finlayson following shareholder approval at the Annual General Meeting in November 2014. A Monte Carlo simulation was undertaken on these Rights to determine the probability of the market conditions associated with the Rights being met. The probability estimates were then applied to ascertain an estimated fair value for the Rights. This value was estimated, for accounting purposes, to be $148,029.
Summary of FY2015 Performance Rights (Tranche 4 - KMPs)
Vesting Conditions:
Group peer TSR comparison;
Growth of Ore Reserves; and
Increase in share price.
Issue Price: 1 April 2015 - 41 cents Vesting Date: 28 September 2017
For
per
sona
l use
onl
y
Saracen Mineral Holdings Limited Directors’ Report
18
Fair Value per Right:
Class A – 33.8 cents
Class B – 41.0 cents
Class C – 25.3 cents
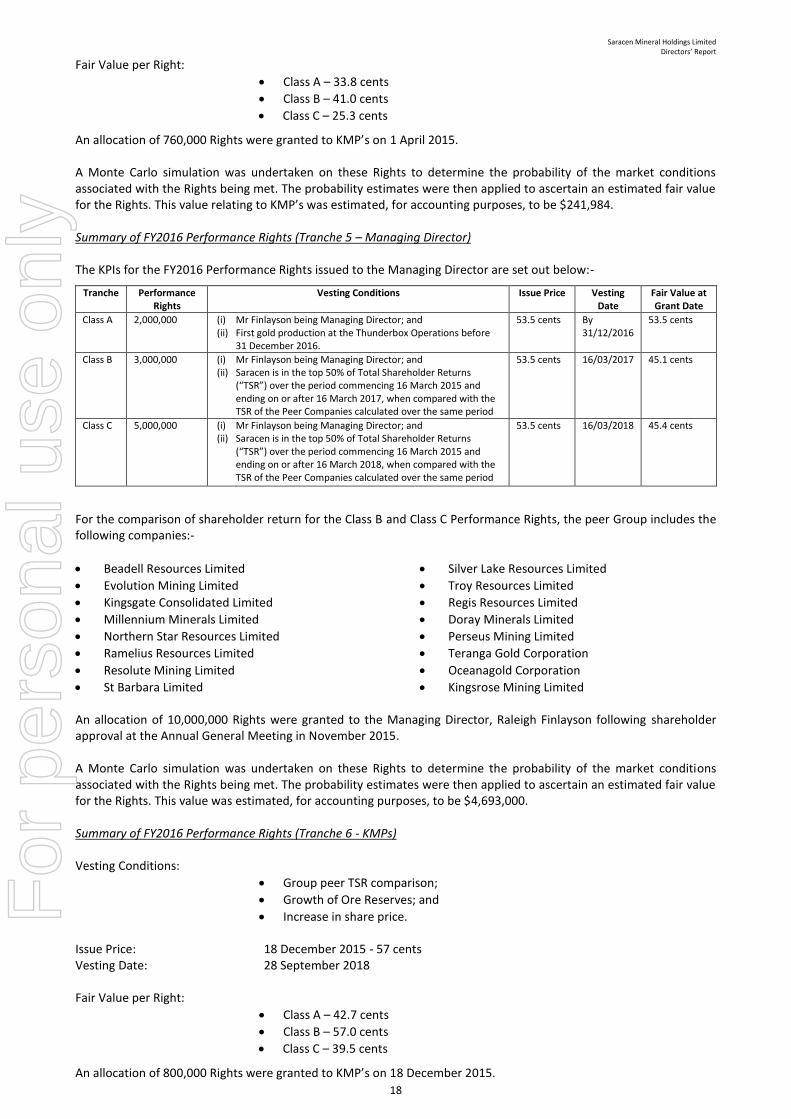
An allocation of 760,000 Rights were granted to KMP’s on 1 April 2015. A Monte Carlo simulation was undertaken on these Rights to determine the probability of the market conditions associated with the Rights being met. The probability estimates were then applied to ascertain an estimated fair value for the Rights. This value relating to KMP’s was estimated, for accounting purposes, to be $241,984. Summary of FY2016 Performance Rights (Tranche 5 – Managing Director) The KPIs for the FY2016 Performance Rights issued to the Managing Director are set out below:-
Tranche Performance Rights
Vesting Conditions Issue Price Vesting Date
Fair Value at Grant Date
Class A 2,000,000 (i) Mr Finlayson being Managing Director; and (ii) First gold production at the Thunderbox Operations before
31 December 2016.
53.5 cents By 31/12/2016
53.5 cents
Class B 3,000,000 (i) Mr Finlayson being Managing Director; and (ii) Saracen is in the top 50% of Total Shareholder Returns
(“TSR”) over the period commencing 16 March 2015 and ending on or after 16 March 2017, when compared with the TSR of the Peer Companies calculated over the same period
53.5 cents 16/03/2017 45.1 cents
Class C 5,000,000 (i) Mr Finlayson being Managing Director; and (ii) Saracen is in the top 50% of Total Shareholder Returns
(“TSR”) over the period commencing 16 March 2015 and ending on or after 16 March 2018, when compared with the TSR of the Peer Companies calculated over the same period
53.5 cents 16/03/2018 45.4 cents
For the comparison of shareholder return for the Class B and Class C Performance Rights, the peer Group includes the following companies:-
Beadell Resources Limited
Evolution Mining Limited
Kingsgate Consolidated Limited
Millennium Minerals Limited
Northern Star Resources Limited
Ramelius Resources Limited
Resolute Mining Limited
St Barbara Limited
Silver Lake Resources Limited
Troy Resources Limited
Regis Resources Limited
Doray Minerals Limited
Perseus Mining Limited
Teranga Gold Corporation
Oceanagold Corporation
Kingsrose Mining Limited An allocation of 10,000,000 Rights were granted to the Managing Director, Raleigh Finlayson following shareholder approval at the Annual General Meeting in November 2015. A Monte Carlo simulation was undertaken on these Rights to determine the probability of the market conditions associated with the Rights being met. The probability estimates were then applied to ascertain an estimated fair value for the Rights. This value was estimated, for accounting purposes, to be $4,693,000. Summary of FY2016 Performance Rights (Tranche 6 - KMPs) Vesting Conditions:
Group peer TSR comparison;
Growth of Ore Reserves; and
Increase in share price.
Issue Price: 18 December 2015 - 57 cents Vesting Date: 28 September 2018 Fair Value per Right:
Class A – 42.7 cents
Class B – 57.0 cents
Class C – 39.5 cents
An allocation of 800,000 Rights were granted to KMP’s on 18 December 2015.
For
per
sona
l use
onl
y
Saracen Mineral Holdings Limited Directors’ Report
19
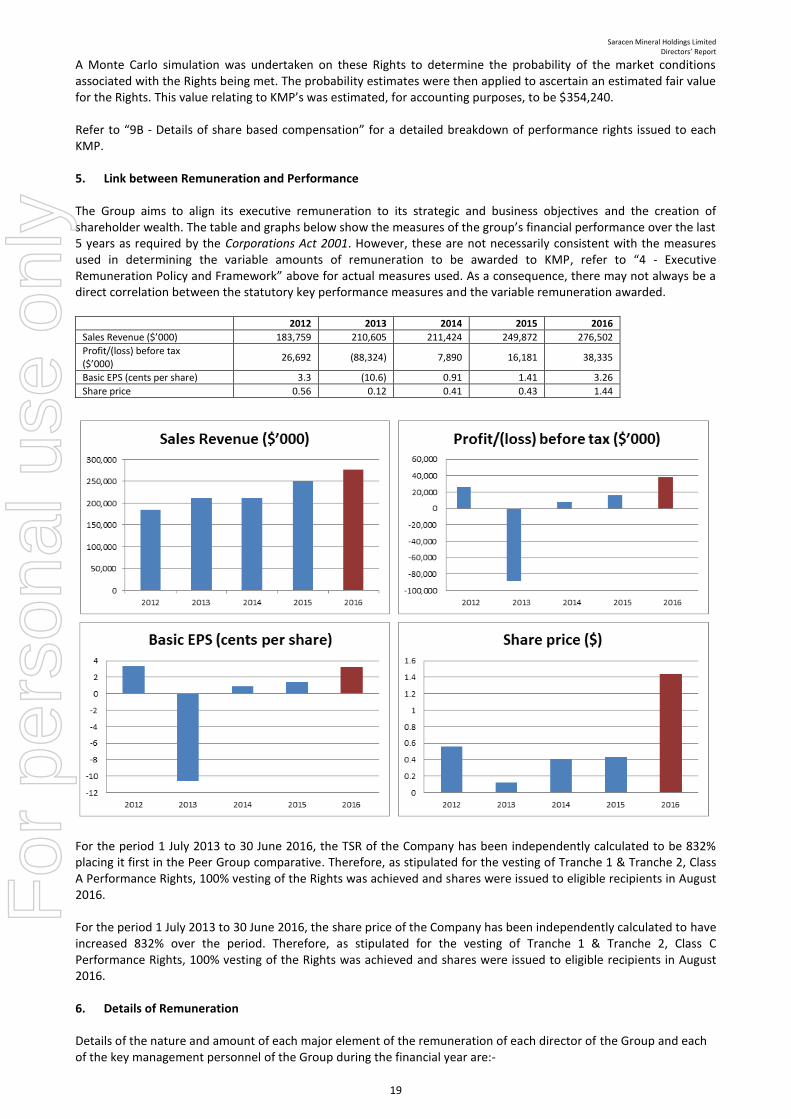
A Monte Carlo simulation was undertaken on these Rights to determine the probability of the market conditions associated with the Rights being met. The probability estimates were then applied to ascertain an estimated fair value for the Rights. This value relating to KMP’s was estimated, for accounting purposes, to be $354,240. Refer to “9B - Details of share based compensation” for a detailed breakdown of performance rights issued to each KMP. 5. Link between Remuneration and Performance The Group aims to align its executive remuneration to its strategic and business objectives and the creation of shareholder wealth. The table and graphs below show the measures of the group’s financial performance over the last 5 years as required by the Corporations Act 2001. However, these are not necessarily consistent with the measures used in determining the variable amounts of remuneration to be awarded to KMP, refer to “4 - Executive Remuneration Policy and Framework” above for actual measures used. As a consequence, there may not always be a direct correlation between the statutory key performance measures and the variable remuneration awarded.
2012 2013 2014 2015 2016
Sales Revenue ($’000) 183,759 210,605 211,424 249,872 276,502
Profit/(loss) before tax ($’000)
26,692 (88,324) 7,890 16,181 38,335
Basic EPS (cents per share) 3.3 (10.6) 0.91 1.41 3.26
Share price 0.56 0.12 0.41 0.43 1.44
For the period 1 July 2013 to 30 June 2016, the TSR of the Company has been independently calculated to be 832% placing it first in the Peer Group comparative. Therefore, as stipulated for the vesting of Tranche 1 & Tranche 2, Class A Performance Rights, 100% vesting of the Rights was achieved and shares were issued to eligible recipients in August 2016. For the period 1 July 2013 to 30 June 2016, the share price of the Company has been independently calculated to have increased 832% over the period. Therefore, as stipulated for the vesting of Tranche 1 & Tranche 2, Class C Performance Rights, 100% vesting of the Rights was achieved and shares were issued to eligible recipients in August 2016. 6. Details of Remuneration Details of the nature and amount of each major element of the remuneration of each director of the Group and each of the key management personnel of the Group during the financial year are:-
For
per
sona
l use
onl
y
Saracen Mineral Holdings Limited Directors’ Report
20
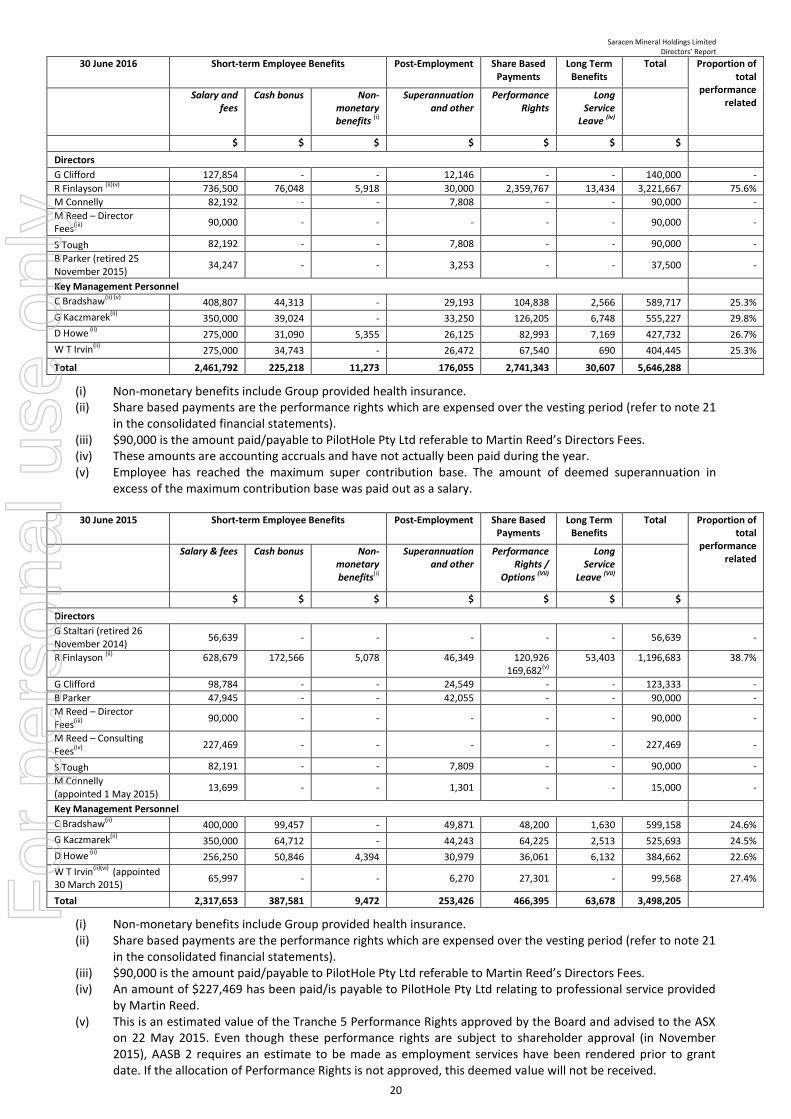
30 June 2016 Short-term Employee Benefits Post-Employment Share Based Payments
Long Term Benefits
Total Proportion of total
performance related
Salary and fees
Cash bonus Non-monetary benefits (i)
Superannuation and other
Performance Rights
Long Service
Leave (iv)
$ $ $ $ $ $ $
Directors
G Clifford 127,854 - - 12,146 - - 140,000 -
R Finlayson (ii)(v) 736,500 76,048 5,918 30,000 2,359,767 13,434 3,221,667 75.6%
M Connelly 82,192 - - 7,808 - - 90,000 -
M Reed – Director Fees(iii) 90,000 - - - - - 90,000 -
S Tough 82,192 - - 7,808 - - 90,000 -
B Parker (retired 25 November 2015)
34,247 - - 3,253 - - 37,500 -
Key Management Personnel
C Bradshaw(ii) (v) 408,807 44,313 - 29,193 104,838 2,566 589,717 25.3%
G Kaczmarek(ii) 350,000 39,024 - 33,250 126,205 6,748 555,227 29.8%
D Howe (ii) 275,000 31,090 5,355 26,125 82,993 7,169 427,732 26.7%
W T Irvin(ii) 275,000 34,743 - 26,472 67,540 690 404,445 25.3%
Total 2,461,792 225,218 11,273 176,055 2,741,343 30,607 5,646,288
(i) Non-monetary benefits include Group provided health insurance. (ii) Share based payments are the performance rights which are expensed over the vesting period (refer to note 21
in the consolidated financial statements). (iii) $90,000 is the amount paid/payable to PilotHole Pty Ltd referable to Martin Reed’s Directors Fees. (iv) These amounts are accounting accruals and have not actually been paid during the year. (v) Employee has reached the maximum super contribution base. The amount of deemed superannuation in
excess of the maximum contribution base was paid out as a salary. 30 June 2015 Short-term Employee Benefits Post-Employment Share Based
Payments Long Term
Benefits Total Proportion of
total performance
related Salary & fees Cash bonus Non-
monetary benefits(i)
Superannuation and other
Performance Rights /
Options (Vii)
Long Service
Leave (Vii)
$ $ $ $ $ $ $
Directors
G Staltari (retired 26 November 2014)
56,639 - - - - - 56,639 -
R Finlayson (ii)
628,679
172,566
5,078
46,349
120,926 169,682(v)
53,403
1,196,683
38.7%
G Clifford 98,784 - - 24,549 - - 123,333 -
B Parker 47,945 - - 42,055 - - 90,000 -
M Reed – Director Fees(iii) 90,000 - - - - - 90,000 -
M Reed – Consulting Fees(iv)
227,469 - - - - - 227,469 -
S Tough 82,191 - - 7,809 - - 90,000 -
M Connelly (appointed 1 May 2015)
13,699 - - 1,301 - - 15,000 -
Key Management Personnel
C Bradshaw(ii) 400,000 99,457 - 49,871 48,200 1,630 599,158 24.6%
G Kaczmarek(ii) 350,000 64,712 - 44,243 64,225 2,513 525,693 24.5%
D Howe (ii) 256,250 50,846 4,394 30,979 36,061 6,132 384,662 22.6%
W T Irvin(ii)(vi) (appointed 30 March 2015) 65,997 - - 6,270 27,301 - 99,568 27.4%
Total 2,317,653 387,581 9,472 253,426 466,395 63,678 3,498,205
(i) Non-monetary benefits include Group provided health insurance. (ii) Share based payments are the performance rights which are expensed over the vesting period (refer to note 21
in the consolidated financial statements). (iii) $90,000 is the amount paid/payable to PilotHole Pty Ltd referable to Martin Reed’s Directors Fees. (iv) An amount of $227,469 has been paid/is payable to PilotHole Pty Ltd relating to professional service provided
by Martin Reed. (v) This is an estimated value of the Tranche 5 Performance Rights approved by the Board and advised to the ASX
on 22 May 2015. Even though these performance rights are subject to shareholder approval (in November 2015), AASB 2 requires an estimate to be made as employment services have been rendered prior to grant date. If the allocation of Performance Rights is not approved, this deemed value will not be received.
For
per
sona
l use
onl
y
Saracen Mineral Holdings Limited Directors’ Report
21
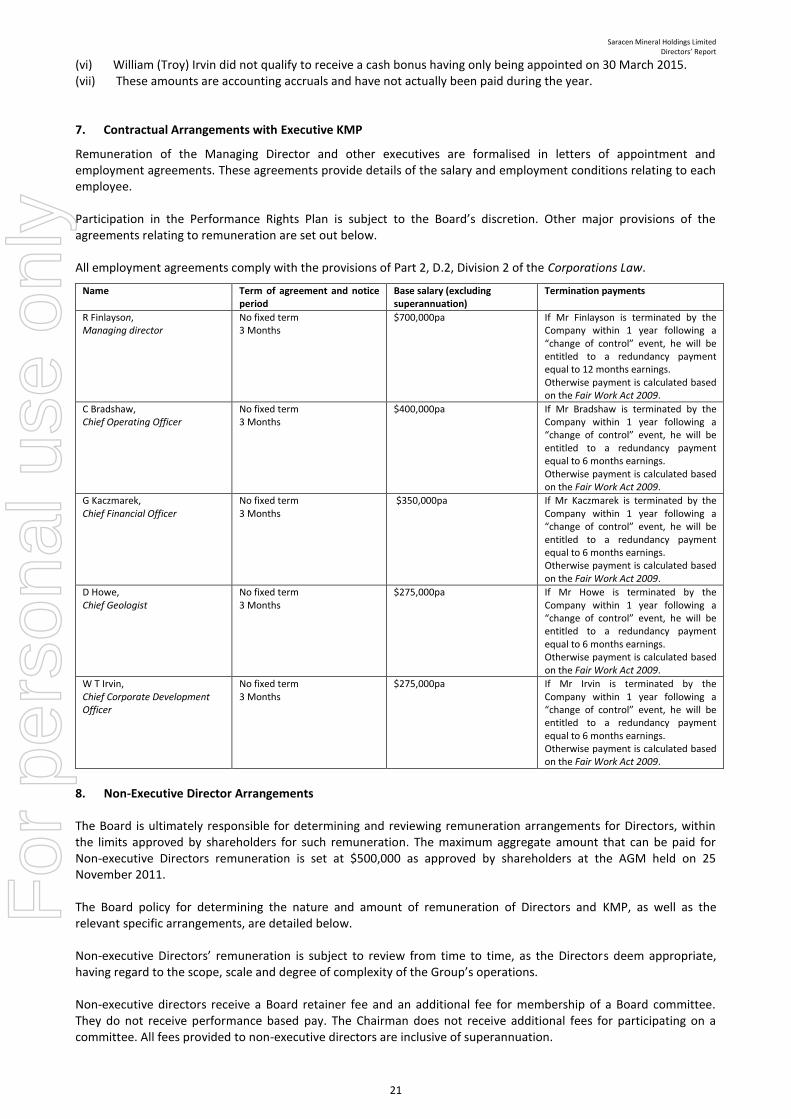
(vi) William (Troy) Irvin did not qualify to receive a cash bonus having only being appointed on 30 March 2015. (vii) These amounts are accounting accruals and have not actually been paid during the year. 7. Contractual Arrangements with Executive KMP
Remuneration of the Managing Director and other executives are formalised in letters of appointment and employment agreements. These agreements provide details of the salary and employment conditions relating to each employee. Participation in the Performance Rights Plan is subject to the Board’s discretion. Other major provisions of the agreements relating to remuneration are set out below. All employment agreements comply with the provisions of Part 2, D.2, Division 2 of the Corporations Law.
Name Term of agreement and notice period
Base salary (excluding superannuation)
Termination payments
R Finlayson, Managing director
No fixed term 3 Months
$700,000pa If Mr Finlayson is terminated by the Company within 1 year following a “change of control” event, he will be entitled to a redundancy payment equal to 12 months earnings. Otherwise payment is calculated based on the Fair Work Act 2009.
C Bradshaw, Chief Operating Officer
No fixed term 3 Months
$400,000pa If Mr Bradshaw is terminated by the Company within 1 year following a “change of control” event, he will be entitled to a redundancy payment equal to 6 months earnings. Otherwise payment is calculated based on the Fair Work Act 2009.
G Kaczmarek, Chief Financial Officer
No fixed term 3 Months
$350,000pa If Mr Kaczmarek is terminated by the Company within 1 year following a “change of control” event, he will be entitled to a redundancy payment equal to 6 months earnings. Otherwise payment is calculated based on the Fair Work Act 2009.
D Howe, Chief Geologist
No fixed term 3 Months
$275,000pa If Mr Howe is terminated by the Company within 1 year following a “change of control” event, he will be entitled to a redundancy payment equal to 6 months earnings. Otherwise payment is calculated based on the Fair Work Act 2009.
W T Irvin, Chief Corporate Development Officer
No fixed term 3 Months
$275,000pa If Mr Irvin is terminated by the Company within 1 year following a “change of control” event, he will be entitled to a redundancy payment equal to 6 months earnings. Otherwise payment is calculated based on the Fair Work Act 2009.
8. Non-Executive Director Arrangements The Board is ultimately responsible for determining and reviewing remuneration arrangements for Directors, within the limits approved by shareholders for such remuneration. The maximum aggregate amount that can be paid for Non-executive Directors remuneration is set at $500,000 as approved by shareholders at the AGM held on 25 November 2011. The Board policy for determining the nature and amount of remuneration of Directors and KMP, as well as the relevant specific arrangements, are detailed below. Non-executive Directors’ remuneration is subject to review from time to time, as the Directors deem appropriate, having regard to the scope, scale and degree of complexity of the Group’s operations. Non-executive directors receive a Board retainer fee and an additional fee for membership of a Board committee. They do not receive performance based pay. The Chairman does not receive additional fees for participating on a committee. All fees provided to non-executive directors are inclusive of superannuation.
For
per
sona
l use
onl
y
Saracen Mineral Holdings Limited Directors’ Report
22
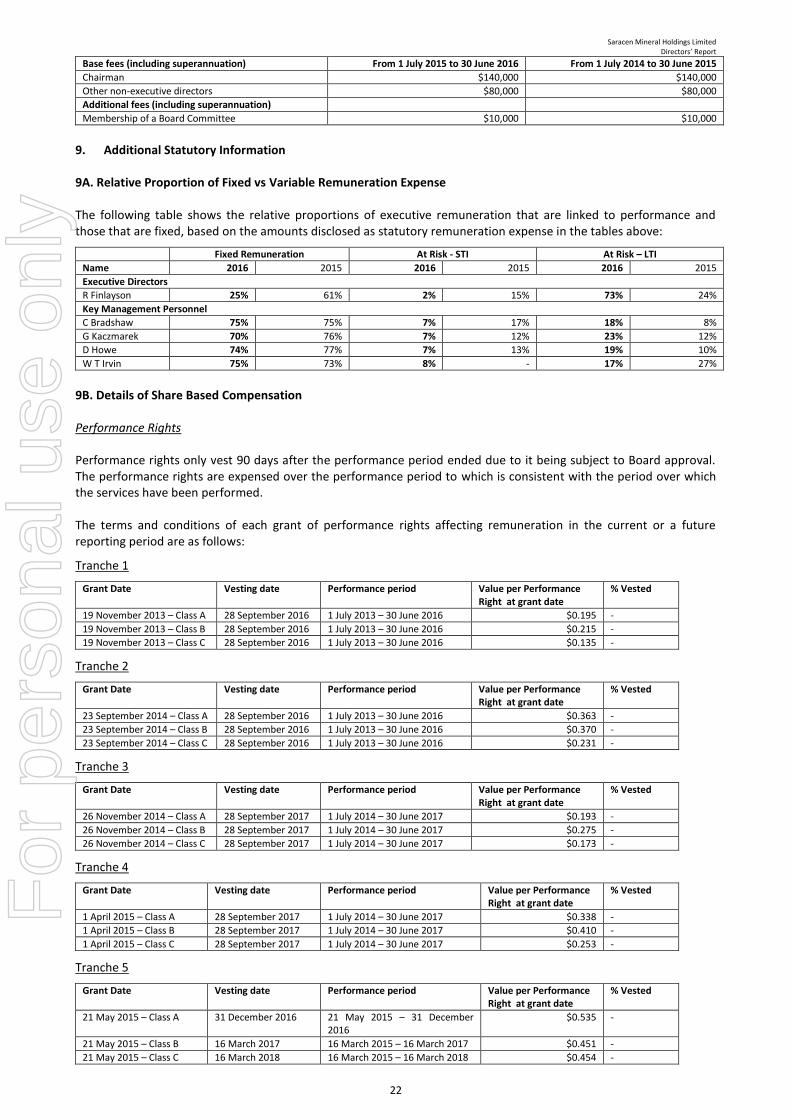
Base fees (including superannuation) From 1 July 2015 to 30 June 2016 From 1 July 2014 to 30 June 2015
Chairman $140,000 $140,000
Other non-executive directors $80,000 $80,000
Additional fees (including superannuation)
Membership of a Board Committee $10,000 $10,000
9. Additional Statutory Information 9A. Relative Proportion of Fixed vs Variable Remuneration Expense The following table shows the relative proportions of executive remuneration that are linked to performance and those that are fixed, based on the amounts disclosed as statutory remuneration expense in the tables above:
Fixed Remuneration At Risk - STI At Risk – LTI
Name 2016 2015 2016 2015 2016 2015
Executive Directors
R Finlayson 25% 61% 2% 15% 73% 24%
Key Management Personnel
C Bradshaw 75% 75% 7% 17% 18% 8%
G Kaczmarek 70% 76% 7% 12% 23% 12%
D Howe 74% 77% 7% 13% 19% 10%
W T Irvin 75% 73% 8% - 17% 27%
9B. Details of Share Based Compensation Performance Rights Performance rights only vest 90 days after the performance period ended due to it being subject to Board approval. The performance rights are expensed over the performance period to which is consistent with the period over which the services have been performed. The terms and conditions of each grant of performance rights affecting remuneration in the current or a future reporting period are as follows:
Tranche 1
Grant Date Vesting date Performance period Value per Performance Right at grant date
% Vested
19 November 2013 – Class A 28 September 2016 1 July 2013 – 30 June 2016 $0.195 -
19 November 2013 – Class B 28 September 2016 1 July 2013 – 30 June 2016 $0.215 -
19 November 2013 – Class C 28 September 2016 1 July 2013 – 30 June 2016 $0.135 -
Tranche 2
Grant Date Vesting date Performance period Value per Performance Right at grant date
% Vested
23 September 2014 – Class A 28 September 2016 1 July 2013 – 30 June 2016 $0.363 -
23 September 2014 – Class B 28 September 2016 1 July 2013 – 30 June 2016 $0.370 -
23 September 2014 – Class C 28 September 2016 1 July 2013 – 30 June 2016 $0.231 -
Tranche 3
Grant Date Vesting date Performance period Value per Performance Right at grant date
% Vested
26 November 2014 – Class A 28 September 2017 1 July 2014 – 30 June 2017 $0.193 -
26 November 2014 – Class B 28 September 2017 1 July 2014 – 30 June 2017 $0.275 -
26 November 2014 – Class C 28 September 2017 1 July 2014 – 30 June 2017 $0.173 -
Tranche 4
Grant Date Vesting date Performance period Value per Performance Right at grant date
% Vested
1 April 2015 – Class A 28 September 2017 1 July 2014 – 30 June 2017 $0.338 -
1 April 2015 – Class B 28 September 2017 1 July 2014 – 30 June 2017 $0.410 -
1 April 2015 – Class C 28 September 2017 1 July 2014 – 30 June 2017 $0.253 -
Tranche 5
Grant Date Vesting date Performance period Value per Performance Right at grant date
% Vested
21 May 2015 – Class A 31 December 2016 21 May 2015 – 31 December 2016
$0.535 -
21 May 2015 – Class B 16 March 2017 16 March 2015 – 16 March 2017 $0.451 -
21 May 2015 – Class C 16 March 2018 16 March 2015 – 16 March 2018 $0.454 -
For
per
sona
l use
onl
y
Saracen Mineral Holdings Limited Directors’ Report
23
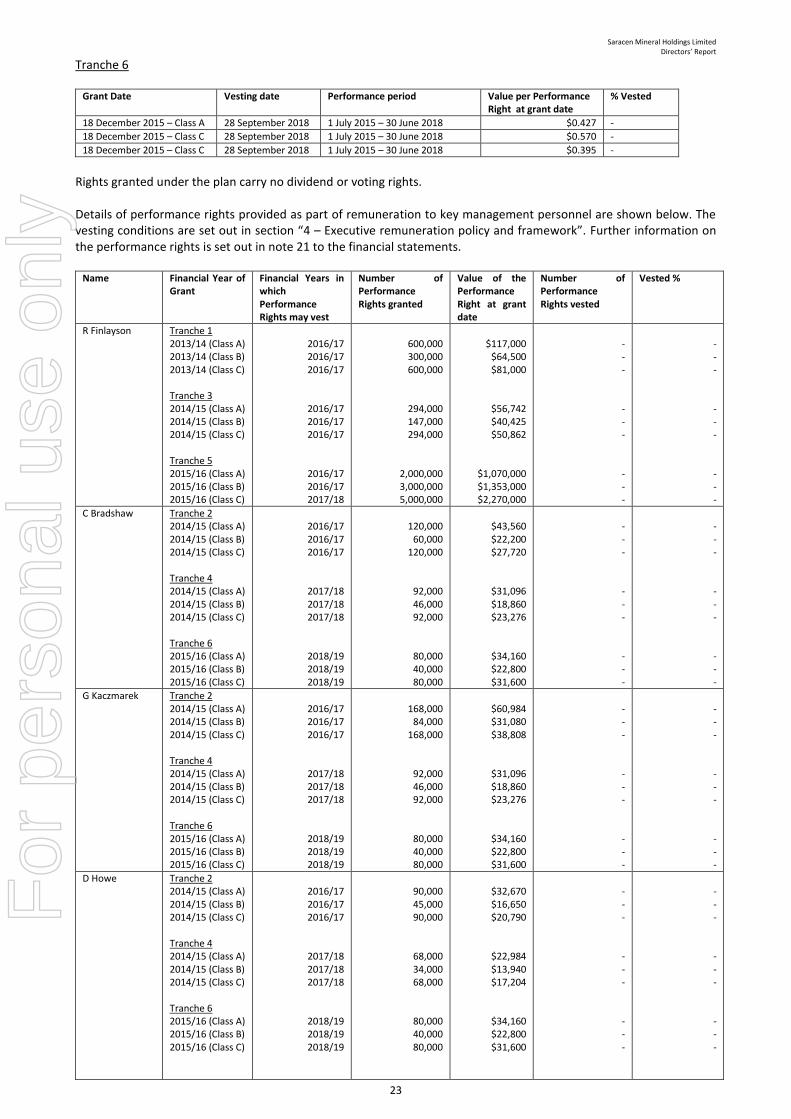
Tranche 6
Grant Date Vesting date Performance period Value per Performance Right at grant date
% Vested
18 December 2015 – Class A 28 September 2018 1 July 2015 – 30 June 2018 $0.427 -
18 December 2015 – Class C 28 September 2018 1 July 2015 – 30 June 2018 $0.570 -
18 December 2015 – Class C 28 September 2018 1 July 2015 – 30 June 2018 $0.395 -
Rights granted under the plan carry no dividend or voting rights. Details of performance rights provided as part of remuneration to key management personnel are shown below. The vesting conditions are set out in section “4 – Executive remuneration policy and framework”. Further information on the performance rights is set out in note 21 to the financial statements.
Name Financial Year of Grant
Financial Years in which Performance Rights may vest
Number of Performance Rights granted
Value of the Performance Right at grant date
Number of Performance Rights vested
Vested %
R Finlayson Tranche 1 2013/14 (Class A) 2013/14 (Class B) 2013/14 (Class C) Tranche 3 2014/15 (Class A) 2014/15 (Class B) 2014/15 (Class C) Tranche 5 2015/16 (Class A) 2015/16 (Class B) 2015/16 (Class C)
2016/17 2016/17 2016/17
2016/17 2016/17 2016/17
2016/17 2016/17 2017/18
600,000 300,000 600,000
294,000 147,000 294,000
2,000,000 3,000,000 5,000,000
$117,000
$64,500 $81,000
$56,742 $40,425 $50,862
$1,070,000 $1,353,000 $2,270,000
- - -
- - -
- - -
- - -
- - -
- - -
C Bradshaw Tranche 2 2014/15 (Class A) 2014/15 (Class B) 2014/15 (Class C) Tranche 4 2014/15 (Class A) 2014/15 (Class B) 2014/15 (Class C) Tranche 6 2015/16 (Class A) 2015/16 (Class B) 2015/16 (Class C)
2016/17 2016/17 2016/17
2017/18 2017/18 2017/18
2018/19 2018/19 2018/19
120,000
60,000 120,000
92,000 46,000 92,000
80,000 40,000 80,000
$43,560 $22,200 $27,720
$31,096 $18,860 $23,276
$34,160 $22,800 $31,600
- - -
- - -
- - -
- - -
- - -
- - -
G Kaczmarek Tranche 2 2014/15 (Class A) 2014/15 (Class B) 2014/15 (Class C) Tranche 4 2014/15 (Class A) 2014/15 (Class B) 2014/15 (Class C) Tranche 6 2015/16 (Class A) 2015/16 (Class B) 2015/16 (Class C)
2016/17 2016/17 2016/17
2017/18 2017/18 2017/18
2018/19 2018/19 2018/19
168,000
84,000 168,000
92,000 46,000 92,000
80,000 40,000 80,000
$60,984 $31,080 $38,808
$31,096 $18,860 $23,276
$34,160 $22,800 $31,600
- - -
- - -
- - -
- - -
- - -
- - -
D Howe Tranche 2 2014/15 (Class A) 2014/15 (Class B) 2014/15 (Class C) Tranche 4 2014/15 (Class A) 2014/15 (Class B) 2014/15 (Class C) Tranche 6 2015/16 (Class A) 2015/16 (Class B) 2015/16 (Class C)
2016/17 2016/17 2016/17
2017/18 2017/18 2017/18
2018/19 2018/19 2018/19
90,000 45,000 90,000
68,000 34,000 68,000
80,000 40,000 80,000
$32,670 $16,650 $20,790
$22,984 $13,940 $17,204
$34,160 $22,800 $31,600
- - -
- - -
- - -
- - -
- - -
- - -
For
per
sona
l use
onl
y
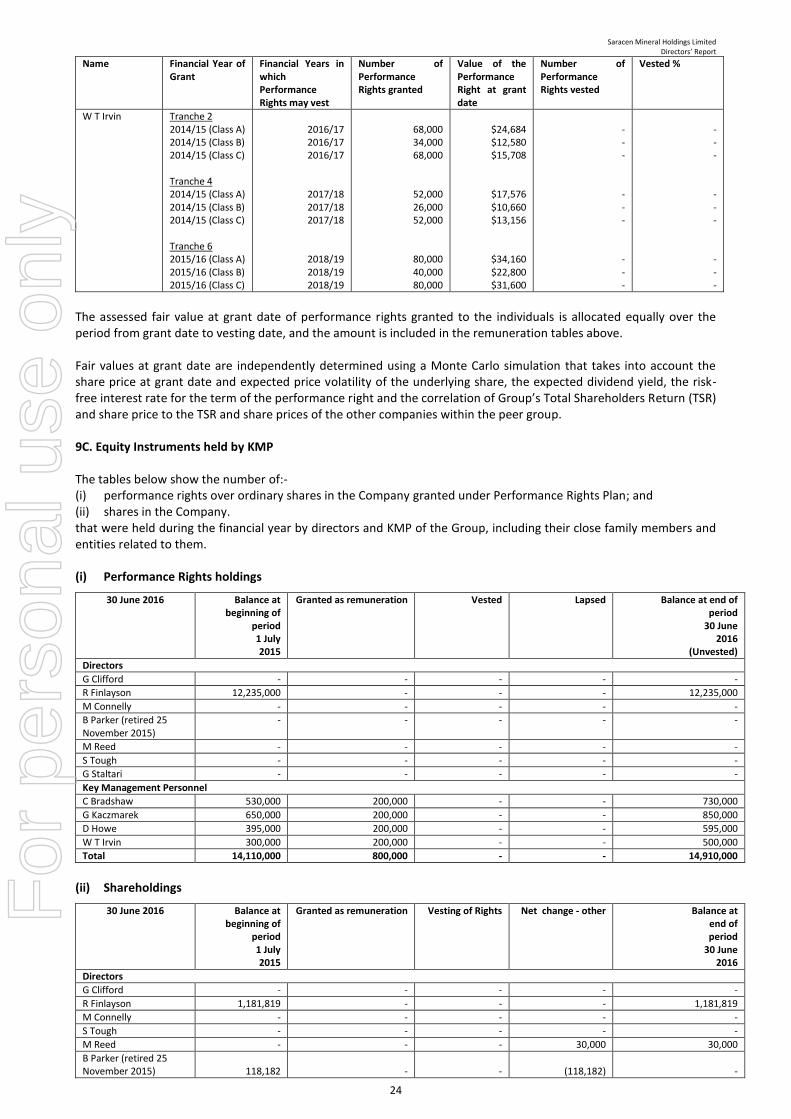
Saracen Mineral Holdings Limited Directors’ Report
24
Name Financial Year of Grant
Financial Years in which Performance Rights may vest
Number of Performance Rights granted
Value of the Performance Right at grant date
Number of Performance Rights vested
Vested %
W T Irvin Tranche 2 2014/15 (Class A) 2014/15 (Class B) 2014/15 (Class C) Tranche 4 2014/15 (Class A) 2014/15 (Class B) 2014/15 (Class C) Tranche 6 2015/16 (Class A) 2015/16 (Class B) 2015/16 (Class C)
2016/17 2016/17 2016/17
2017/18 2017/18 2017/18
2018/19 2018/19 2018/19
68,000 34,000 68,000
52,000 26,000 52,000
80,000 40,000 80,000
$24,684 $12,580 $15,708
$17,576 $10,660 $13,156
$34,160 $22,800 $31,600
- - -
- - -
- - -
- - -
- - -
- - -
The assessed fair value at grant date of performance rights granted to the individuals is allocated equally over the period from grant date to vesting date, and the amount is included in the remuneration tables above. Fair values at grant date are independently determined using a Monte Carlo simulation that takes into account the share price at grant date and expected price volatility of the underlying share, the expected dividend yield, the risk-free interest rate for the term of the performance right and the correlation of Group’s Total Shareholders Return (TSR) and share price to the TSR and share prices of the other companies within the peer group. 9C. Equity Instruments held by KMP The tables below show the number of:- (i) performance rights over ordinary shares in the Company granted under Performance Rights Plan; and (ii) shares in the Company. that were held during the financial year by directors and KMP of the Group, including their close family members and entities related to them. (i) Performance Rights holdings
30 June 2016 Balance at beginning of
period 1 July 2015
Granted as remuneration Vested Lapsed Balance at end of period
30 June 2016
(Unvested)
Directors
G Clifford - - - - -
R Finlayson 12,235,000 - - - 12,235,000
M Connelly - - - - -
B Parker (retired 25 November 2015)
- - - - -
M Reed - - - - -
S Tough - - - - -
G Staltari - - - - -
Key Management Personnel
C Bradshaw 530,000 200,000 - - 730,000
G Kaczmarek 650,000 200,000 - - 850,000
D Howe 395,000 200,000 - - 595,000
W T Irvin 300,000 200,000 - - 500,000
Total 14,110,000 800,000 - - 14,910,000
(ii) Shareholdings
30 June 2016 Balance at beginning of
period 1 July 2015
Granted as remuneration Vesting of Rights Net change - other Balance at end of period
30 June 2016
Directors
G Clifford - - - - -
R Finlayson 1,181,819 - - - 1,181,819
M Connelly - - - - -
S Tough - - - - -
M Reed - - - 30,000 30,000
B Parker (retired 25 November 2015) 118,182 - - (118,182) -
For
per
sona
l use
onl
y
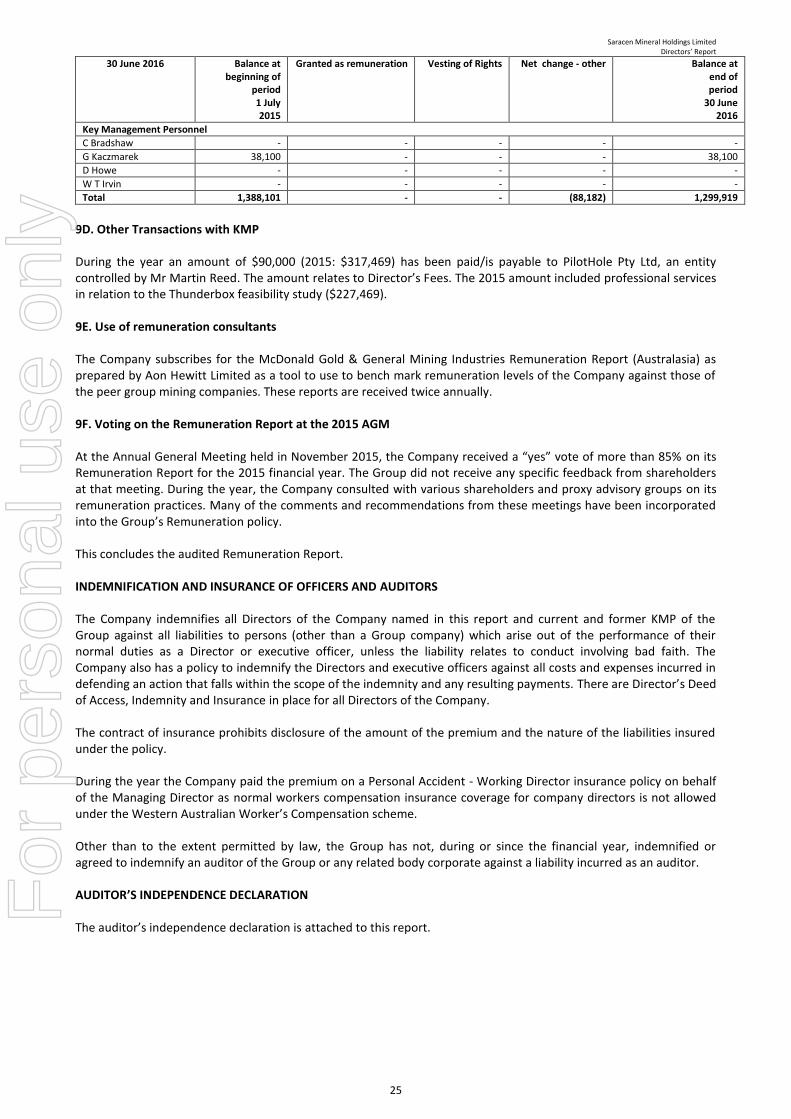
Saracen Mineral Holdings Limited Directors’ Report
25
30 June 2016 Balance at beginning of
period 1 July 2015
Granted as remuneration Vesting of Rights Net change - other Balance at end of period
30 June 2016
Key Management Personnel
C Bradshaw - - - - -
G Kaczmarek 38,100 - - - 38,100
D Howe - - - - -
W T Irvin - - - - -
Total 1,388,101 - - (88,182) 1,299,919
9D. Other Transactions with KMP During the year an amount of $90,000 (2015: $317,469) has been paid/is payable to PilotHole Pty Ltd, an entity controlled by Mr Martin Reed. The amount relates to Director’s Fees. The 2015 amount included professional services in relation to the Thunderbox feasibility study ($227,469). 9E. Use of remuneration consultants The Company subscribes for the McDonald Gold & General Mining Industries Remuneration Report (Australasia) as prepared by Aon Hewitt Limited as a tool to use to bench mark remuneration levels of the Company against those of the peer group mining companies. These reports are received twice annually. 9F. Voting on the Remuneration Report at the 2015 AGM At the Annual General Meeting held in November 2015, the Company received a “yes” vote of more than 85% on its Remuneration Report for the 2015 financial year. The Group did not receive any specific feedback from shareholders at that meeting. During the year, the Company consulted with various shareholders and proxy advisory groups on its remuneration practices. Many of the comments and recommendations from these meetings have been incorporated into the Group’s Remuneration policy. This concludes the audited Remuneration Report. INDEMNIFICATION AND INSURANCE OF OFFICERS AND AUDITORS The Company indemnifies all Directors of the Company named in this report and current and former KMP of the Group against all liabilities to persons (other than a Group company) which arise out of the performance of their normal duties as a Director or executive officer, unless the liability relates to conduct involving bad faith. The Company also has a policy to indemnify the Directors and executive officers against all costs and expenses incurred in defending an action that falls within the scope of the indemnity and any resulting payments. There are Director’s Deed of Access, Indemnity and Insurance in place for all Directors of the Company. The contract of insurance prohibits disclosure of the amount of the premium and the nature of the liabilities insured under the policy. During the year the Company paid the premium on a Personal Accident - Working Director insurance policy on behalf of the Managing Director as normal workers compensation insurance coverage for company directors is not allowed under the Western Australian Worker’s Compensation scheme. Other than to the extent permitted by law, the Group has not, during or since the financial year, indemnified or agreed to indemnify an auditor of the Group or any related body corporate against a liability incurred as an auditor. AUDITOR’S INDEPENDENCE DECLARATION The auditor’s independence declaration is attached to this report.
For
per
sona
l use
onl
y
Saracen Minerals Holdings Limited Directors Report
26
NON-AUDIT SERVICES During the year, BDO Audit (WA) Pty Ltd, the Group’s auditor, and BDO Corporate Tax (WA) Pty Ltd, a related party of the Group’s auditor, provided tax compliance and advisory services in addition to audit services. Together, BDO Audit (WA) Pty Ltd and BDO Corporate Tax (WA) Pty Ltd received, or are due to receive, $76,487 (2015: $63,067) for the non-audit services. The Directors are satisfied that the provision of these services is compatible with the general standard of independence for auditors imposed by the Corporations Act 2001 and do not undermine the general principles relating to auditor independence as set out in APES 110 Code of Ethics for Professional Accountants as they did not involve reviewing or auditing the auditor’s own work, acting in a management or decision making capacity for the Group, acting as an advocate for the Group or jointly sharing risks and rewards. ROUNDING OF AMOUNTS The Company is a company of the kind referred to in ASIC Instrument 2016/191, dated 1 April 2016, and in accordance with that Instrument amounts in the Directors’ Report and the financial statements are rounded off to the nearest thousand dollars, unless otherwise indicated. Signed in accordance with a resolution of directors made pursuant to s.298(2) of the Corporations Act 2001. For and on behalf of the board
RALEIGH FINLAYSON Managing Director 25 August 2016
For
per
sona
l use
onl
y
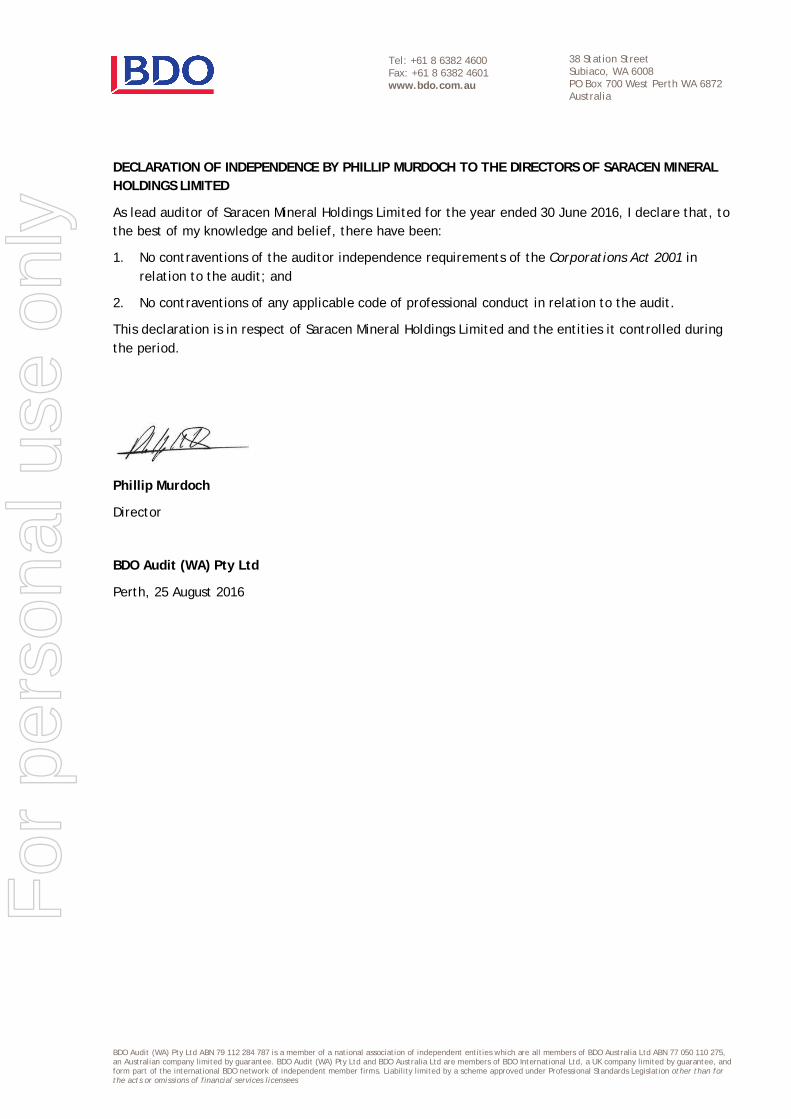
BDO Audit (WA) Pty Ltd ABN 79 112 284 787 is a member of a national association of independent entities which are all members of BDO Australia Ltd ABN 77 050 110 275,an Australian company limited by guarantee. BDO Audit (WA) Pty Ltd and BDO Australia Ltd are members of BDO International Ltd, a UK company limited by guarantee, andform part of the international BDO network of independent member firms. Liability limited by a scheme approved under Professional Standards Legislation other than forthe acts or omissions of financial services licensees
38 Station StreetSubiaco, WA 6008PO Box 700 West Perth WA 6872Australia
Tel: +61 8 6382 4600Fax: +61 8 6382 4601www.bdo.com.au
DECLARATION OF INDEPENDENCE BY PHILLIP MURDOCH TO THE DIRECTORS OF SARACEN MINERALHOLDINGS LIMITED
As lead auditor of Saracen Mineral Holdings Limited for the year ended 30 June 2016, I declare that, tothe best of my knowledge and belief, there have been:
1. No contraventions of the auditor independence requirements of the Corporations Act 2001 inrelation to the audit; and
2. No contraventions of any applicable code of professional conduct in relation to the audit.
This declaration is in respect of Saracen Mineral Holdings Limited and the entities it controlled duringthe period.
Phillip Murdoch
Director
BDO Audit (WA) Pty Ltd
Perth, 25 August 2016
For
per
sona
l use
onl
y
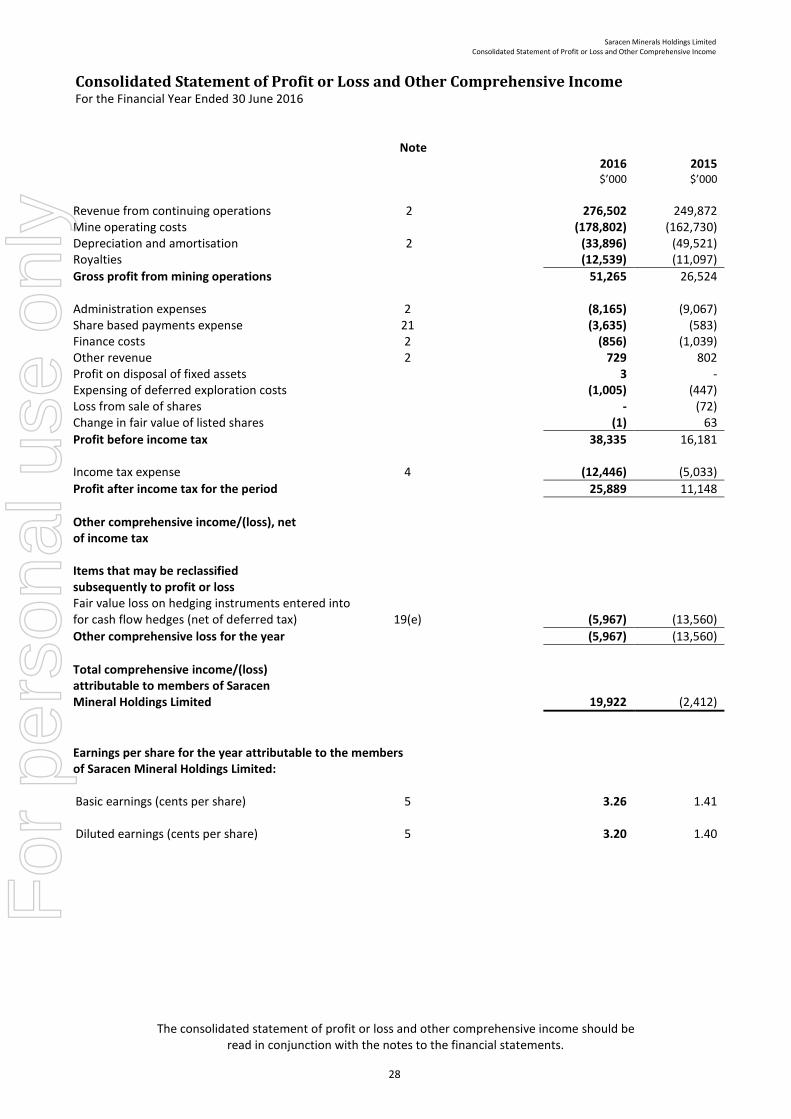
Saracen Minerals Holdings Limited Consolidated Statement of Profit or Loss and Other Comprehensive Income
28
Consolidated Statement of Profit or Loss and Other Comprehensive Income For the Financial Year Ended 30 June 2016
Note
2016 $’000
2015 $’000
Revenue from continuing operations 2 276,502 249,872 Mine operating costs (178,802) (162,730) Depreciation and amortisation 2 (33,896) (49,521) Royalties (12,539) (11,097)
Gross profit from mining operations 51,265 26,524 Administration expenses 2 (8,165) (9,067) Share based payments expense 21 (3,635) (583) Finance costs 2 (856) (1,039) Other revenue 2 729 802 Profit on disposal of fixed assets 3 - Expensing of deferred exploration costs (1,005) (447) Loss from sale of shares - (72) Change in fair value of listed shares (1) 63
Profit before income tax 38,335 16,181 Income tax expense 4 (12,446) (5,033)
Profit after income tax for the period 25,889 11,148
Other comprehensive income/(loss), net of income tax Items that may be reclassified subsequently to profit or loss
Fair value loss on hedging instruments entered into for cash flow hedges (net of deferred tax) 19(e)
(5,967)
(13,560)
Other comprehensive loss for the year (5,967) (13,560)
Total comprehensive income/(loss) attributable to members of Saracen Mineral Holdings Limited
19,922
(2,412)
Earnings per share for the year attributable to the members of Saracen Mineral Holdings Limited:
Basic earnings (cents per share) 5
3.26
1.41
Diluted earnings (cents per share) 5
3.20
1.40
The consolidated statement of profit or loss and other comprehensive income should be read in conjunction with the notes to the financial statements.
For
per
sona
l use
onl
y
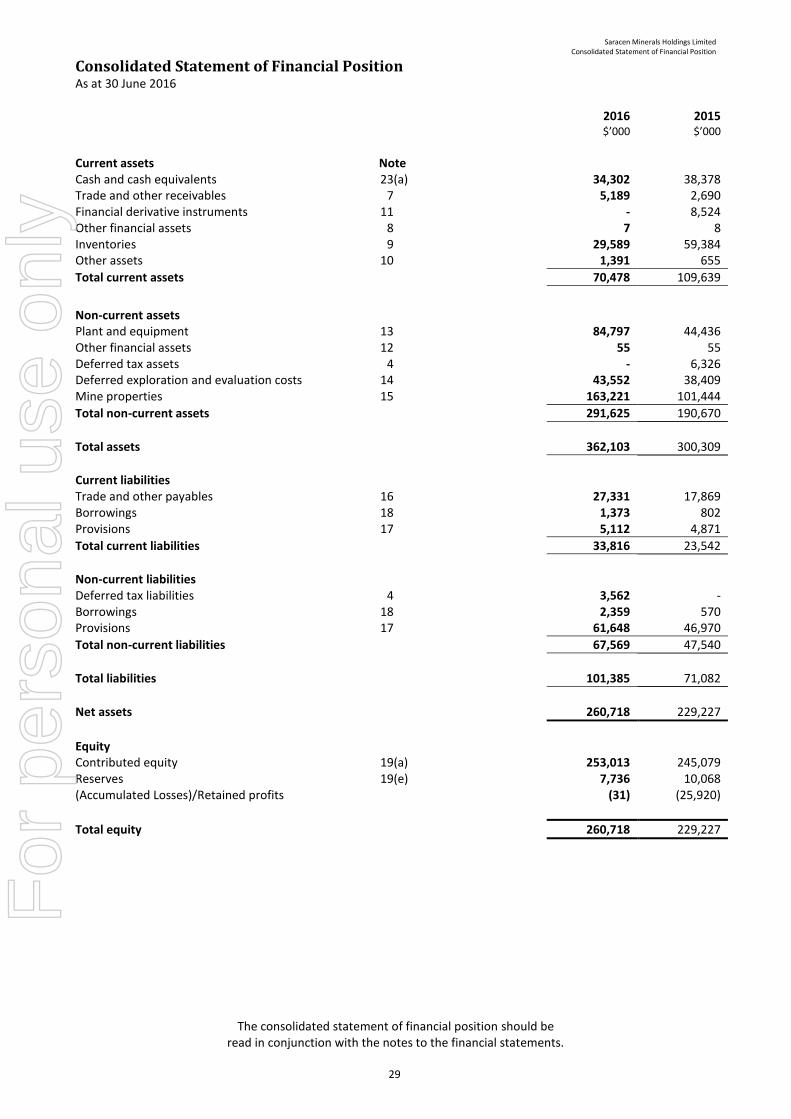
Saracen Minerals Holdings Limited Consolidated Statement of Financial Position
29
Consolidated Statement of Financial Position As at 30 June 2016
2016 $’000
2015 $’000
Current assets Note Cash and cash equivalents 23(a) 34,302 38,378 Trade and other receivables 7 5,189 2,690 Financial derivative instruments 11 - 8,524 Other financial assets 8 7 8 Inventories 9 29,589 59,384 Other assets 10 1,391 655
Total current assets 70,478 109,639
Non-current assets Plant and equipment 13 84,797 44,436 Other financial assets 12 55 55 Deferred tax assets 4 - 6,326 Deferred exploration and evaluation costs 14 43,552 38,409 Mine properties 15 163,221 101,444
Total non-current assets 291,625 190,670
Total assets 362,103 300,309
Current liabilities Trade and other payables 16 27,331 17,869 Borrowings 18 1,373 802 Provisions 17 5,112 4,871
Total current liabilities 33,816 23,542
Non-current liabilities Deferred tax liabilities 4 3,562 - Borrowings 18 2,359 570 Provisions 17 61,648 46,970
Total non-current liabilities 67,569 47,540
Total liabilities 101,385 71,082
Net assets 260,718 229,227
Equity Contributed equity 19(a) 253,013 245,079 Reserves 19(e) 7,736 10,068 (Accumulated Losses)/Retained profits (31) (25,920)
Total equity 260,718 229,227
The consolidated statement of financial position should be
read in conjunction with the notes to the financial statements.
For
per
sona
l use
onl
y
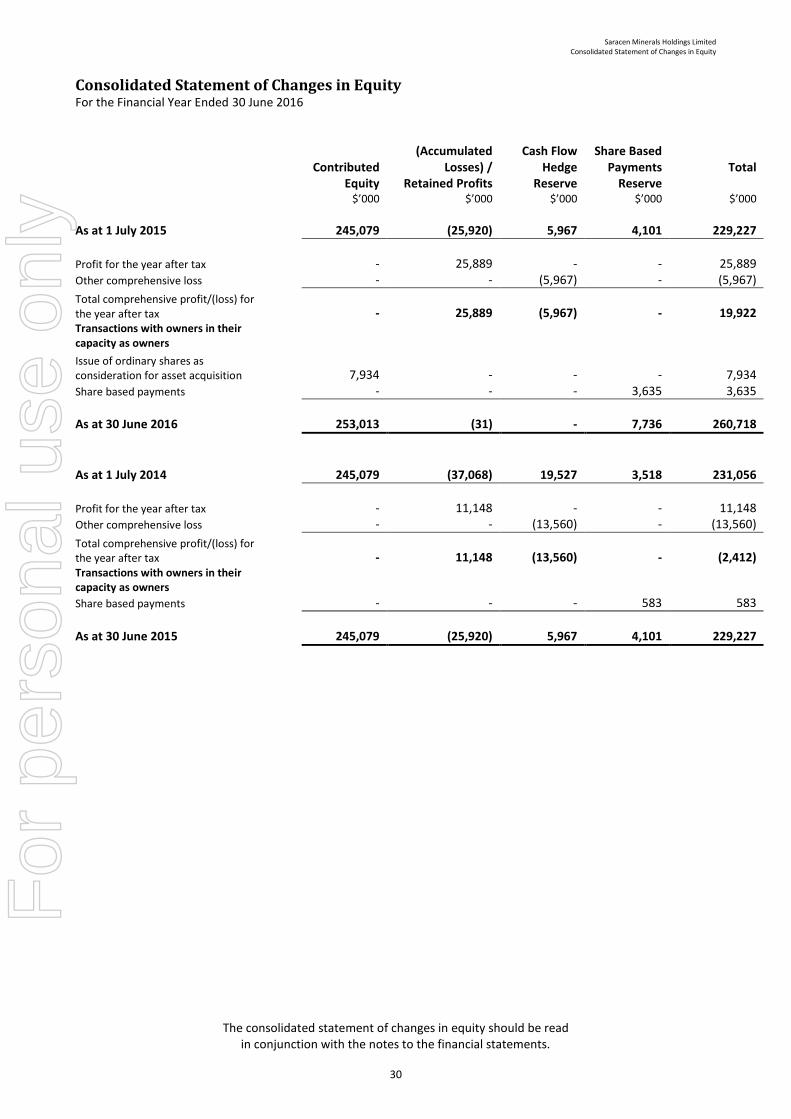
Saracen Minerals Holdings Limited Consolidated Statement of Changes in Equity
30
Consolidated Statement of Changes in Equity For the Financial Year Ended 30 June 2016
Contributed Equity
$’000
(Accumulated Losses) /
Retained Profits $’000
Cash Flow
Hedge Reserve
$’000
Share Based Payments
Reserve $’000
Total
$’000 As at 1 July 2015
245,079 (25,920)
5,967 4,101 229,227
Profit for the year after tax
- 25,889
- - 25,889
Other comprehensive loss - - (5,967) - (5,967)
Total comprehensive profit/(loss) for the year after tax
- 25,889
(5,967) - 19,922
Transactions with owners in their capacity as owners
Issue of ordinary shares as consideration for asset acquisition
7,934 -
- - 7,934
Share based payments - - - 3,635 3,635
As at 30 June 2016
253,013 (31)
- 7,736 260,718
As at 1 July 2014
245,079 (37,068)
19,527 3,518 231,056
Profit for the year after tax
- 11,148
- - 11,148
Other comprehensive loss - - (13,560) - (13,560)
Total comprehensive profit/(loss) for the year after tax
- 11,148
(13,560) - (2,412)
Transactions with owners in their capacity as owners
Share based payments - - - 583 583
As at 30 June 2015
245,079 (25,920)
5,967 4,101 229,227
The consolidated statement of changes in equity should be read in conjunction with the notes to the financial statements.
For
per
sona
l use
onl
y
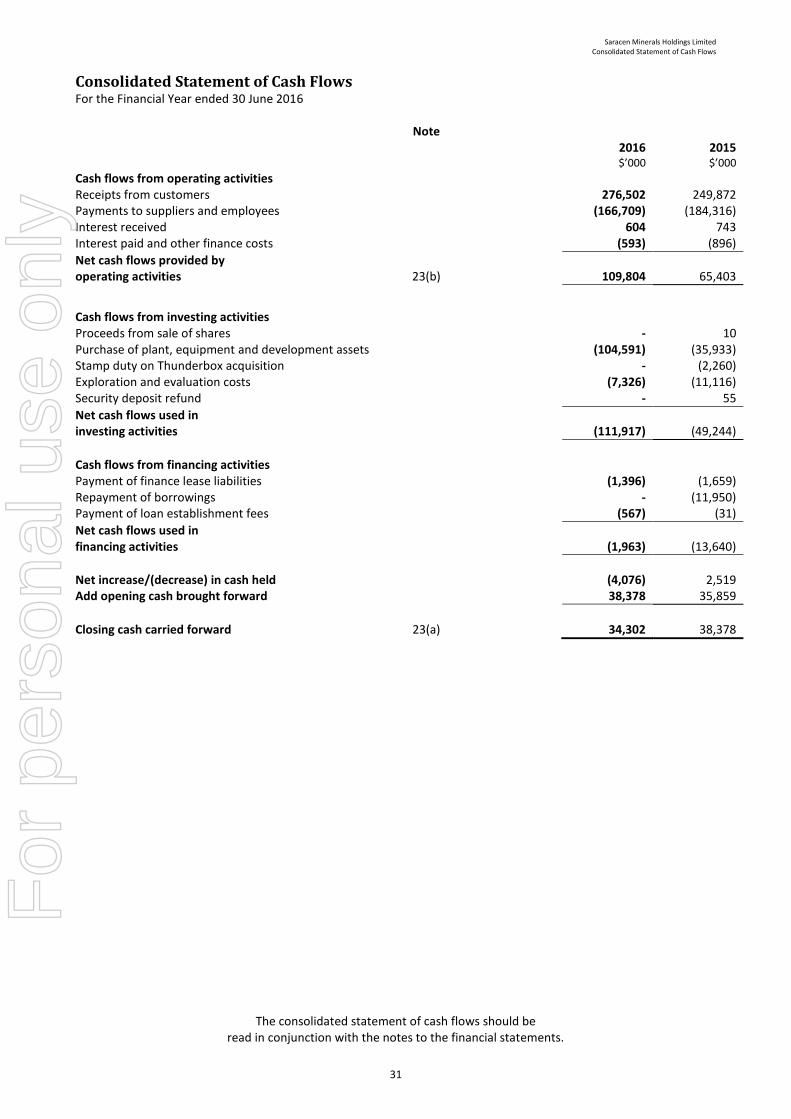
Saracen Minerals Holdings Limited Consolidated Statement of Cash Flows
31
Consolidated Statement of Cash Flows For the Financial Year ended 30 June 2016
Note
2016 $’000
2015 $’000
Cash flows from operating activities Receipts from customers 276,502 249,872 Payments to suppliers and employees (166,709) (184,316) Interest received 604 743 Interest paid and other finance costs (593) (896)
Net cash flows provided by operating activities 23(b)
109,804 65,403
Cash flows from investing activities Proceeds from sale of shares - 10 Purchase of plant, equipment and development assets (104,591) (35,933) Stamp duty on Thunderbox acquisition - (2,260) Exploration and evaluation costs (7,326) (11,116) Security deposit refund - 55
Net cash flows used in investing activities
(111,917) (49,244)
Cash flows from financing activities Payment of finance lease liabilities (1,396) (1,659) Repayment of borrowings - (11,950) Payment of loan establishment fees (567) (31)
Net cash flows used in financing activities
(1,963) (13,640)
Net increase/(decrease) in cash held (4,076) 2,519 Add opening cash brought forward 38,378 35,859
Closing cash carried forward 23(a) 34,302 38,378
The consolidated statement of cash flows should be read in conjunction with the notes to the financial statements.
For
per
sona
l use
onl
y
Saracen Mineral Holdings Limited Notes to the Consolidated Financial Statements
32
Notes to the Consolidated Financial Statements For the Financial Year ended 30 June 2016 NOTE 1 SUMMARY OF SIGNIFICANT ACCOUNTING POLICIES
(a) Reporting Entity
Saracen Mineral Holdings Limited is a for-profit, public company listed on the Australian Securities Exchange (trading under the code: ‘SAR’), incorporated and operating in Australia. Operations and Principal Activities The operations and principal activities comprise mineral development and exploration.
Registered Office Level 4, 89 St Georges Terrace, Perth Western Australia 6000.
(b) Basis of preparation Statement of compliance
The consolidated financial statements are general purpose financial statements which have been prepared in accordance with Australian Accounting Standards Board (AASB) and the Corporations Act 2001. The consolidated financial statements comply with International Financial Reporting Standards (IFRS) adopted by the International Accounting Standards Board (IASB). The consolidated financial statements were authorised for issue by the Board of Directors on 25 August 2016
Basis of measurement
The consolidated financial statements have been prepared on a going concern basis in accordance with the historical cost convention, unless otherwise stated.
Functional and presentation currency These consolidated financial statements are presented in Australian dollars, which is the Group’s functional currency. Rounding off The Company is a company of the kind referred to in ASIC Instrument 2016/191, dated 1 April 2016, and in accordance with that Instrument amounts in the financial report are rounded off to the nearest thousand dollars, unless otherwise stated. New, revised or amended standards and interpretations adopted by the group The Group has adopted all of the new, revised or amending Accounting Standards and Interpretations issued by the Australian Accounting Standards Board ('AASB') that are mandatory for the current reporting period. Any new, revised or amending Accounting Standards or Interpretations that are not yet mandatory have not been early adopted. The adoption of these Accounting Standards and Interpretations did not have any significant impact on the financial performance or position of the consolidated entity. The following Accounting Standards and Interpretations are most relevant to the Group: (i) AASB 2013-9 Amendments to Australian Accounting Standards – Conceptual Framework, Materiality and
Financial Instruments
(ii) AASB 2015-3 Amendments to Australian Accounting Standards arising from the Withdrawal of AASB 1031 Materiality
For
per
sona
l use
onl
y
Saracen Mineral Holdings Limited Notes to the Consolidated Financial Statements
33
NOTE 1 SUMMARY OF SIGNIFICANT ACCOUNTING POLICIES (continued) (b) Basis of preparation (continued)
New standards and interpretations not yet mandatory or early adopted Australian Accounting Standards and Interpretations that have recently been issued or amended but are not yet mandatory, have not been early adopted by the Group for the annual reporting period ended 30 June 2016. The consolidated entity's assessment of the impact of these new or amended Accounting Standards and Interpretations, most relevant to the Group, are set out below. (i) AASB 9 Financial Instruments and its consequential amendments
This standard and its consequential amendments are applicable to annual reporting periods beginning on or after 1 January 2018 and completes phases I and III of the IASB's project to replace IAS 39 (AASB 139) 'Financial Instruments: Recognition and Measurement'. This standard introduces new classification and measurement models for financial assets, using a single approach to determine whether a financial asset is measured at amortised cost or fair value. The accounting for financial liabilities continues to be classified and measured in accordance with AASB 139, with one exception, being that the portion of a change of fair value relating to the entity's own credit risk is to be presented in other comprehensive income unless it would create an accounting mismatch. Chapter 6 'Hedge Accounting' supersedes the general hedge accounting requirements in AASB 139 and provides a new simpler approach to hedge accounting that is intended to more closely align with risk management activities undertaken by entities when hedging financial and non-financial risks. The Group will adopt this standard and the amendments from 1 July 2018. It is not expected for the application of the new standard to have a significant impact on the entity’s financial statements.
(ii) AASB 15 Revenue from Contracts with Customers
The AASB has issued this new standard for the recognition of revenue. This standard is applicable to annual reporting periods beginning on or after 1 January 2018. The standard will replace AASB 118 which covers contracts for goods and services and AASB 111 which covers construction contracts. The new standard is based on the principle that revenue is recognised when control of a good or service transfers to a customer – so the notion of control replaces the existing notion of risks and rewards. It is not expected for the application of the new standard to have a significant impact on the entity’s financial statements.
(iii) AASB 16 Leases
AASB 16 will replace AASB 117 Leases, Interpretation 4 Determining whether an Arrangement contains a Lease, Interpretation 115 Operating Leases – Incentives and Interpretation 127 Evaluating the Substance of Transactions Involving the Legal Form of a Lease. This standard is applicable to annual reporting periods beginning on or after 1 January 2019. The Standard will provide a comprehensive model for the identification of lease arrangements and their treatment in the financial statements of both lessees and lessors. The new Standard introduces three main changes:
Enhanced guidance on identifying whether a contract contains a lease;
A completely new leases accounting model for lessees that require lessees to recognise all leases on balance sheet, except for short-term leases and leases of low value assets; and
Enhanced disclosures.
Lessor accounting will not significantly change. The Group will adopt this standard and the amendments from 1 July 2019. Due to the recent release of this standard, the entity has not yet made a detailed assessment of the impact of this standard.
For
per
sona
l use
onl
y
Saracen Mineral Holdings Limited Notes to the Consolidated Financial Statements
34
NOTE 1 SUMMARY OF SIGNIFICANT ACCOUNTING POLICIES (continued)
(b) Basis of preparation (continued)
(iv) New standards and interpretations not expected to have a significant impact
The following standards are not yet effective and are not expected to have a significant impact on the Group’s consolidated financial statements:
Standard/Interpretation
Effective for annual reporting periods beginning on or after
Expected to be initially applied in the financial year ending
AASB 2014-3 ‘Amendments to Australian Accounting
Standards – Accounting for Acquisitions of Interests in Joint
Operations’
1 January 2016 30 June 2017
AASB 2014-4 ‘Amendments to Australian Accounting
Standards – Clarification of Acceptable Methods of
Depreciation and Amortisation’
1 January 2016 30 June 2017
AASB 2014-9 ‘Amendments to Australian Accounting
Standards – Equity Method in Separate Financial Statements’
1 January 2016 30 June 2017
AASB 2015-1 ‘Amendments to Australian Accounting
Standards – Annual Improvements to Australian Accounting
Standards 2012-2014 Cycle’
1 January 2016 30 June 2017
AASB 2015-2 ‘Amendments to Australian Accounting
Standards – Disclosure Initiative: Amendments to AASB 101’
1 January 2016 30 June 2017
Significant Judgements, Estimates and Assumptions
The preparation of the Group’s consolidated financial statements requires management to make judgements estimates and assumptions that affect the reported amounts of revenues, expenses, assets and liabilities, and the accompanying disclosures at the date of the consolidated financial statements. Estimates and assumptions are continually evaluated and are based on management’s experience and other factors, including expectations of future events that are believed to be reasonable under the circumstances. Uncertainty about these assumptions and estimates could result in outcomes that require a material adjustment to the carrying amount of assets or liabilities affected in future periods. In particular, the Group has identified a number of areas where significant judgements, estimates and assumptions are required. Further information on each of these areas and how they impact the various accounting policies are either described with the associated accounting policy note within Note 1 or are described below: These include: Judgements, estimates and assumptions:
Asset Acquisition not constituting a Business (Note 1 (x))
Exploration and evaluation expenditure (Notes 1(s) and 14)
Impairment of assets (Note 1(o))
Inventories (Notes 1(n) and 9)
Mine rehabilitation (Notes 1(u) and 17)
Ore reserve estimates (Notes 1(t) and 15)
Production start date (Note 1 (y))
Recovery of deferred tax assets (Notes 1(f) and 4)
Share based payments (Notes 1(i) and 21)
Stripping costs (Notes 1(t) and 15)
For
per
sona
l use
onl
y
Saracen Mineral Holdings Limited Notes to the Consolidated Financial Statements
35
NOTE 1 SUMMARY OF SIGNIFICANT ACCOUNTING POLICIES (continued)
(c) Principles of Consolidation
Subsidiaries The consolidated financial statements comprise the financial statements of Saracen Mineral Holdings Limited and its subsidiaries (the Group) as at 30 June each year. Subsidiaries are all entities (including structured entities) over which the Group has control. The Group controls an entity when the Group is exposed to, or has rights to, variable returns from its involvement with the entity and has the ability to affect those returns through its power to direct the activities of the entity. Subsidiaries are consolidated from the date on which control is transferred to the Group and cease to be consolidated from the date on which control is transferred out of the Group.
The acquisition method of accounting is used to account for business combinations by the Group.
In preparing the consolidated financial statements, all intercompany balances and transactions, income and expenses and profit and losses from intra-group transactions have been eliminated in full. Unrealised losses are also eliminated unless the transaction provides evidence of an impairment of the transferred asset. The financial statements of the subsidiaries are prepared for the same reporting period as the parent company, using consistent accounting policies.
(d) Segment reporting
Operating segments are reported in a manner consistent with the internal reporting provided to the Board of Directors.
(e) Revenue Recognition
Revenue is recognised to the extent that it is probable that the economic benefits will flow to the Group and the revenue can be reliably measured. The following specific recognition criteria must be met before revenue is recognised: Gold and silver sales Revenue from the sale of gold and silver is measured at fair value of the consideration received or receivable. Revenue is recognised when the significant risks and rewards of ownership have been transferred to the buyer. Interest income Interest income is recognised when the Group gains control of the right to receive the interest payment.
(f) Taxation
Current tax Current tax is the expected tax payable or receivable on the taxable income or loss for the year, using tax rates enacted or substantively enacted at the reporting date, and any adjustment to tax payable in respect of previous years.
Judgement is required in determining the provision for income tax. There are many transactions and calculations undertaken during the ordinary course of business for which the ultimate tax determination is uncertain. The Group recognises assets and liabilities for the potential tax effect based on the Group's current understanding of tax laws and requirements. Where the final tax outcome of these items is different from the carrying amounts, such differences will impact the current and deferred tax assets and/or provisions in the period in which such determination is made.
Deferred tax Deferred tax is recognised on temporary differences between the carrying amounts of assets and liabilities in the financial statements and the corresponding tax bases used in the computation of taxable profit. Deferred tax liabilities are generally recognised for all taxable temporary differences. Deferred tax assets are generally recognised for all deductible temporary differences to the extent that it is probable that taxable profits will be available against which those deductible temporary differences can be utilised. Such deferred tax assets and liabilities are not recognised if the temporary difference arises from goodwill or from the initial recognition (other than in a business combination) of other assets and liabilities in a transaction that affects neither the taxable profit nor the accounting profit.
For
per
sona
l use
onl
y
Saracen Mineral Holdings Limited Notes to the Consolidated Financial Statements
36
NOTE 1 SUMMARY OF SIGNIFICANT ACCOUNTING POLICIES (continued) (f) Taxation (continued)
The carrying amount of deferred tax assets is reviewed at the end of each reporting period and reduced to the extent that it is no longer probable that sufficient taxable profits will be available to allow all or part of the asset to be recovered.
Deferred tax assets and liabilities are measured at the tax rates that are expected to apply in the period in which the liability is settled or the asset realised, based on tax rates (and tax laws) that have been enacted or substantively enacted by the end of the reporting period. The measurement of deferred tax liabilities and assets reflects the tax consequences that would follow from the manner in which the Group expects, at the end of the reporting period, to recover or settle the carrying amount of its assets and liabilities. Deferred tax assets and liabilities are offset when there is a legally enforceable right to set off current tax assets against current tax liabilities and when they relate to income taxes levied by the same taxation authority and the Group intends to settle its current tax assets and liabilities on a net basis. Significant judgements, estimates and assumptions Deferred tax assets, including those arising from unutilised tax losses, require management to assess the likelihood that the Group will comply with the relevant tax legislation and will generate sufficient taxable earnings in future periods in order to recognise and utilise those deferred tax assets. Estimates of future taxable income are based on forecast cash flows from operations. These assessments require the use of estimates and assumptions such as commodity prices, exchange rates and operating performance over the life of the assets.
Goods and Services Tax (GST)
Revenues, expenses and assets are recognised net of the amount of GST except:
where the GST incurred on a purchase of goods and services is not recoverable from the taxation authority, in which case the GST is recognised as part of the cost of acquisition of the asset or as part of the expense item as applicable; and
receivables and payables are stated with the amount of GST included. The amount of GST recoverable from, or payable to, the taxation authority is included as part of receivables or payables in the statement of financial position. Commitments and contingencies are disclosed net of the amount of GST recoverable from, or payable to, the taxation authority.
(g) Financial Assets and Liabilities
Financial assets and financial liabilities are recognised on the consolidated statement of financial position when the Group becomes party to the contractual provisions of the financial instrument. A financial asset is derecognised when the contractual rights to the cash flows from the financial assets expire or are transferred and no longer controlled by the entity. A financial liability is removed from the statement of financial position when the obligation specified in the contract is discharged, cancelled or expires. Listed shares held for trading are included in the category financial assets at fair value through profit or loss. Financial assets are classified as held for trading if they are acquired for the purpose of selling in the near term. Financial assets at fair value through profit or loss are stated at fair value, with any resultant gain or loss recognised in profit or loss. Financial assets not measured at fair value comprise:
loans and receivables being non-derivative financial assets with fixed or determinable payments that are not quoted in an active market. These are measured at amortised cost using the effective interest method.
held-to-maturity investments being non-derivative financial assets with fixed or determinable payments and fixed maturity that will be held to maturity. These are measured at amortised cost using the effective interest method.
investments in equity instruments that do not have a quoted market price in an active market and whose fair value cannot be reliably measured. These are measured at cost.
For
per
sona
l use
onl
y
Saracen Mineral Holdings Limited Notes to the Consolidated Financial Statements
37
NOTE 1 SUMMARY OF SIGNIFICANT ACCOUNTING POLICIES (continued)
(g) Financial Assets and Liabilities (continued) Available-for-sale financial assets are non-derivative financial assets that are not classified as loans and receivables, held-to-maturity investments or financial assets at fair value through profit or loss. A gain or loss arising from a change in the fair value of an available-for-sale financial asset is recognised directly in equity, through the statement of changes in equity (except for impairment losses and foreign exchange gains and losses) until the financial asset is derecognised at which time the cumulative gain or loss previously recognised in equity is recognised in profit or loss.
(h) Property, Plant and Equipment
Buildings, plant and equipment are stated at historical cost less accumulated depreciation and any accumulated impairment losses. Historical cost includes expenditure that is directly attributable to the acquisition of the items. Subsequent costs are included in the asset’s carrying amount or recognised as a separate asset, as appropriate, only when it is probable that future economic benefits associated with the item will flow to the Group and the cost of the item can be measured reliably. All other repairs and maintenance are charged to the income statement during the financial period in which they are incurred. Depreciation is calculated on a straight-line method over the estimated useful life, or over the remaining life of mine if that is shorter and there is no alternative use for the asset. The useful lives of major assets of a cash-generating unit are often dependant on the lives of the orebodies in the region to which they relate. Where the major assets of a cash-generating unit are not dependant on the life of a related ore orebody, management applies judgement in estimating the remaining service potential of long-lived assets. The following useful lives are used in the calculation of depreciation: Plant and equipment 3 – 33 years
Capital work in progress is projects of a capital nature which usually relates to the construction/installation of buildings, plant or equipment. Upon completion (when ready for use) capital work in progress is transferred to the relevant asset category. Capital work in progress is not depreciated. Where depreciation is attributable to exploration and evaluation activities, costs are treated in accordance with the Accounting Policy Note 1(s). The assets’ residual value, useful lives and amortisation methods are reviewed at each financial year end and if appropriate adjusted.
(i) Employee Benefits
Short-term employee benefits Liabilities for wages and salaries, including non-monetary benefits, annual leave and long service leave expected to be settled within 12 months of the reporting date are recognised in current liabilities in respect of employees' services up to the reporting date and are measured at the amounts expected to be paid when the liabilities are settled. Other long-term employee benefits The liability for annual leave and long service leave not expected to be settled within 12 months of the reporting date are recognised in non-current liabilities, provided there is an unconditional right to defer settlement of the liability. The liability is measured as the present value of expected future payments to be made in respect of services provided by employees up to the reporting date using the projected unit credit method. Consideration is given to the expected future wage and salary levels, experience of employee departures and periods of service. Expected future payments are discounted using market yields at the reporting date on national corporate bonds with terms to maturity and currency that match, as closely as possible, the estimated future cash outflows.
For
per
sona
l use
onl
y
Saracen Mineral Holdings Limited Notes to the Consolidated Financial Statements
38
NOTE 1 SUMMARY OF SIGNIFICANT ACCOUNTING POLICIES (continued) (i) Employee Benefits (continued)
Share-based payments Share based compensation benefits are provided to employees via a Performance Rights Plan (Note 21). The fair value of options/rights granted under this scheme is recognised as a share based payment expense with a corresponding increase in equity. The total amount to be expensed is determined by reference to the fair value of the rights granted, which includes any market performance conditions and the impact of any non-vesting conditions but excludes the impact of any service and non-market performance vesting conditions. Non-market vesting conditions are included in assumptions about the number of rights that are expected to vest. The total expense is recognised over the vesting period, which is the period over which all of the specified vesting conditions are to be satisfied. At the end of each period, the entity revises its estimates of the number of rights that are expected to vest based on the non-market vesting conditions. It recognises the impact of the revision to original estimates, if any, in profit or loss, with a corresponding adjustment to equity. The Group measures the cost of equity settled transactions with vendors by reference to the fair value of goods or services received. Significant judgements, estimates and assumptions
The Group measures the cost of equity settled transactions with employees by reference to the fair value of equity instruments at the date at which they are granted. The fair value is determined using the assumptions detailed in Note 21.
(j) Superannuation Funds
The Group contributes to several accumulation type superannuation funds. Contributions are charged as an expense as they are made. Further information is set out in Note 20(e).
(k) Earnings Per Share
Basic earnings per share is calculated as profit/(loss) after tax attributable to members, adjusted to exclude costs of servicing equity (other than dividends) and preference share dividends, divided by the weighted average number of ordinary shares, adjusted for any bonus element. Diluted earnings per share is calculated as profit/(loss) after tax attributable to members, adjusted for costs of servicing equity (other than dividends) and preference share dividends, the after tax effect of dividends and interest associated with dilutive potential ordinary shares that have been recognised as expenses, and other non-discretionary changes in revenues or expenses during the period that would result from the dilution of potential ordinary shares divided by the weighted average number of ordinary shares and dilutive potential ordinary shares, adjusted for any bonus element.
(l) Cash and Cash Equivalents
Cash on hand and in bank and short-term deposits are stated at nominal value. For the purpose of the statement of cash flows, cash includes cash on hand and in bank, and bank securities readily convertible to cash, net of outstanding bank overdrafts.
(m) Trade and Other Receivables
Receivables to be settled within 30 - 90 days are carried at amounts due. The collectability of debts is assessed at the reporting date and specific allowance is made for any doubtful accounts.
(n) Inventories
Raw materials and stores are valued at the lower of cost and net realisable value. Regular reviews are undertaken to establish whether any items are obsolete or damaged, and if so their carrying value is written down to net realisable value.
For
per
sona
l use
onl
y
Saracen Mineral Holdings Limited Notes to the Consolidated Financial Statements
39
NOTE 1 SUMMARY OF SIGNIFICANT ACCOUNTING POLICIES (continued)
(n) Inventories (continued)
Inventories of ore and gold in circuit are valued at the lower of cost and net realisable value. Costs comprise direct material, labour and an appropriate proportion of variable and fixed overhead on the basis of normal operating capacity, and are included as part of mine operating costs in the consolidated statement of profit or loss and comprehensive income. Net realisable value is the estimated selling price in the ordinary course of business less processing cost and the estimated selling cost. If the ore stockpile is not expected to be processed in 12 months after reporting date, it is included in non-current assets and the net realisable value is calculated on a discounts cash flow basis. Significant judgements, estimates and assumptions Inventories require certain estimates and assumptions most notably in regards grades, volumes and densities. Stockpiles are measured by estimating the number of tonnes added and removed from the stockpile, the number of contained ounces based on assay data, and the estimated recovery percentage. Stockpile tonnages are verified to periodic surveys. Net reliable value tests are performed at each reporting date and represent the estimate future sales price of gold, less cost of completion (processing costs) and the estimated cost necessary to perform the sale. Such estimates and assumptions may change as new information becomes available and could impact on the carrying value of inventories (Note 9).
(o) Impairment of Assets
The Group undertakes an impairment review to determine whether any indicators of impairment are present. Where indicators of impairment exist, an estimate of the recoverable amount of the Cash Generating Unit (CGU) is made. An impairment loss is recognised for the amount by which the asset's carrying amount exceeds its recoverable amount. The recoverable amount is the higher of an asset's fair value less costs to sell and value in use. For the purposes of assessing impairment, assets are grouped at the lowest levels for which there are separately identifiable cash flows. Where an impairment loss subsequently reverses, the carrying amount of the asset, other than goodwill, is increased to the revised estimate of its recoverable amount, but only to the extent the increased carrying amount does not exceed the carrying amount that would have been determined had no impairment loss been recognised in prior years. A reversal of an impairment loss is recognised immediately in profit or loss. An impairment indicator assessment was undertaken for all operation at reporting date and it was concluded that no indicators where identified which would give rise to impairment testing. Significant judgements, estimates and assumptions Assessments of the recoverable amounts require the use of estimates and assumptions such as reserves, mine lives, discount rates, exchange rates, commodity prices, grade of ore mined, recovery percentage, operating performance, costs and capital estimates.
(p) Trade and Other Payables
Liabilities are recognised for amounts to be paid in the future for goods and services received whether or not billed to the Group. Trade payables are usually settled within 30 days of recognition.
For
per
sona
l use
onl
y
Saracen Mineral Holdings Limited Notes to the Consolidated Financial Statements
40
NOTE 1 SUMMARY OF SIGNIFICANT ACCOUNTING POLICIES (continued)
(q) Borrowings
Borrowings are initially recognised at fair value, net of transaction costs incurred. Borrowings are subsequently measured at amortised cost. Any difference between the proceeds (net of transaction costs) and the redemption amount is recognised in profit or loss over the period of the borrowings using the effective interest method. Fees paid on the establishment of loan facilities are recognised as transaction costs of the loan to the extent that it is probable that some or all of the facility will be drawn down. In this case, the fee is deferred until the draw down occurs. To the extent there is no evidence that it is probable that some or all of the facility will be drawn down, the fee is capitalised as a prepayment for liquidity services and amortised over the period of the facility to which it relates.
(r) Provisions Provisions are recognised when the Group has a present obligation as a result of a past event, it is probable a future sacrifice of economic benefits will be required and a reliable estimate of obligation can be made.
(s) Exploration and Evaluation Expenditure
Exploration and evaluation costs related to areas of interest are carried forward to the extent that:
the rights to tenure of the areas of interest are current and the Group controls the area of interest in which the expenditure has been incurred; and
such costs are expected to be recouped through successful development and exploitation of the area of interest, or alternatively by its sale; or
exploration and evaluation activities in the area of interest have not at the reporting date reached a stage which permits a reasonable assessment of the existence or otherwise of economically recoverable reserves, and active and significant operations in, or in relation to, the area of interest are continuing.
Exploration and evaluation costs include the acquisition of rights to explore, studies, exploratory drilling, sampling and associated activities and an allocation of depreciation and amortisation of assets used in exploration and evaluation activities. General and administrative costs are included in the measurement of exploration and evaluation costs where they are related directly to operational activities in a particular area of interest.
The above accounting policy requires certain estimates and assumptions on future events and circumstances, in particular whether an economically viable extraction operation can be established. These estimates and assumptions may change as new information becomes available and could have a material impact on the carrying value of deferred exploration and evaluation costs (Note 14). Exploration and evaluation assets are assessed for impairment where facts and circumstances suggest that the carrying amount of the assets may exceed its recoverable amount. If the recoverable amount is less than the carrying amount, the asset is written down to its recoverable amount and an impairment loss recognised.
Where economically recoverable reserves for an area of interest have been identified, and a decision to develop has occurred, capitalised expenditure is classified as mines under construction. In the event that an area of interest is abandoned or if the Directors consider the expenditure to be of no value, accumulated costs carried forward are written off in the year in which that assessment is made.
Significant judgements, estimates and assumptions
The application of the Group’s accounting policy for exploration and evaluation expenditure requires certain estimates and assumptions on future events and circumstances, in particular whether an economically viable extraction operation can be established. These estimates and assumptions may change as new information becomes available and could have a material impact on the carrying value of deferred exploration and evaluation costs (Note 14). If, after expenditure is capitalised, information becomes available suggesting that the recovery of expenditure is unlikely, the relevant capitalised amount is written off in the statement of profit or loss and other comprehensive oncome in the period when the new information becomes available.
For
per
sona
l use
onl
y
Saracen Mineral Holdings Limited Notes to the Consolidated Financial Statements
41
NOTE 1 SUMMARY OF SIGNIFICANT ACCOUNTING POLICIES (continued) (t) Mines Properties
Mines under construction are accumulated separately for each area of interest in which economically recoverable reserves have been identified and a decision to develop has occurred. This expenditure includes all capitalised exploration and evaluation expenditure in respect of the area of interest, direct costs of construction, an appropriate allocation of overheads and where applicable borrowing costs capitalised during construction. Once mining of the area of interest can commence, the aggregated capitalised costs are classified under non-current assets as mines in production or an appropriate class of property, plant and equipment. Mines in production represent the aggregated exploration and evaluation expenditure and capitalised development costs in respect of areas of interest in which mining is ready to or has commenced. Mine development costs are deferred until commercial production commences, at which time they are amortised on a units-of-production basis over the mineable reserves. Once production commences, further development expenditure is classified as part of the cost of production, unless substantial future economic benefits can be established. Deferred stripping costs represent certain mining costs, principally those that relate to the stripping of waste, which provides access so that future economically recoverable ore can be mined. Stripping (i.e. overburden and other waste removal) costs incurred in the production phase of a surface mine are capitalised to the extent that they improve access to an identified component of the ore body and are subsequently amortised on a systematic basis over the expected useful life of the identified component of the ore body. Capitalised stripping costs are disclosed as a component of Mine Properties. Components of an ore body are determined with reference to life of mine plans and take account of factors such as the geographical separation of mining locations and/or the economic status of mine development decisions.
Capitalised stripping costs are initially measured at cost and represent an accumulation of costs directly incurred in performing the stripping activity that improves access to the identified component of the ore body, plus an allocation of directly attributable overhead costs. The amount of stripping costs deferred is based on a relevant production measure which uses a ratio obtained by dividing the tonnage of waste mined by the quantity of ore mined for an identified component of the ore body. Stripping costs incurred in the period for an identified component of the ore body are deferred to the extent that the current period ratio exceeds the expected waste to ratio for the life of the identified component of the ore body. Such deferred costs are then charged against the statement of profit and loss when the stripping ratio falls below the life of mine ratio. These are a function of the mine design and therefore any changes to the design will generally result in changes to the ratio. Changes in other technical or economic parameters that impact on reserves may also have an impact on the component ratio even though they may not impact the mine design. Changes to the life of mine plan, identified components of an ore body, stripping ratios, units of production and expected useful life are accounted for prospectively. Deferred stripping costs form part of the total investment in a cash generating unit, which is reviewed for impairment if events or changes in circumstances indicate that the carrying value may not be recoverable.
Significant judgements, estimates and assumptions Significant judgement is required to distinguish between development stripping and production stripping and to distinguish between the production stripping that relates to the extraction of inventory and that which relates to the creation of a stripping asset. Once the Group has identified its production stripping for each surface mining operation it identifies the separate components of the ore bodies for each of its mining operations. An identifiable component is a specific volume of the ore body that is made more accessible by the stripping activity. Significant judgement is required to identify and define these components, and also to determine the expected volumes of waste to be stripped and ore to be mined in each of these components. These assessments are undertaken for each individual mining operation based on the information available in the mine plan.
For
per
sona
l use
onl
y
Saracen Mineral Holdings Limited Notes to the Consolidated Financial Statements
42
NOTE 1 SUMMARY OF SIGNIFICANT ACCOUNTING POLICIES (continued)
(t) Mines Properties (continued) Judgement is also required to identify a suitable production measure to be used to allocate production stripping costs between inventory and any stripping activity asset(s) for each component. The Group considers that the ratio of the expected volume (e.g. tonnes) of waste to be stripped for an expected volume (e.g.. in tonnes) of ore to be mined for a specific component of the ore body, is the most suitable production measure. Reserve estimates Estimates of recoverable quantities of proven and probable reserves include assumptions regarding commodity prices, exchange rates, discount rates, recovery rates and production and transportation costs for future cash flows. It also requires interpretation of complex and difficult geological and geophysical models in order to make an assessment of the size, shape, depth and quality of reserves and their anticipated recoveries. The economic, geological and technical factors used to estimate reserves may change from period to period. Changes in reported reserves can impact asset carrying values, the provision for restoration and the recognition of deferred tax assets, due to changes in expected future cash flows. Reserves are integral to the amount of depreciation, depletion and amortisation charged to the profit or loss and the calculation of inventory. The Group prepares reserve estimates in accordance with the JORC Code, guidelines prepared by the Joint Ore Reserves Committee of The Australian Institute of Mining and Metallurgy, Australian Institute of Geoscientists and Mineral Council of Australia. Significant judgements and estimates The determination of ore reserves impacts the accounting for asset carrying values. There are numerous uncertainties inherent in estimating ore reserves, and assumptions that are valid at the time of estimation may change significantly when new information becomes available. Changes in the forecast commodity prices, exchange rates, discount rates, recovery rates and production and transportation costs may change the economic status of reserves and may ultimately results in reserves being restated.
(u) Restoration, Rehabilitation and Environmental Provision
Obligations associated with exploration and development assets are recognised when the Group has a present obligation, the future sacrifice of the economic benefits is probable, and the provision can be measured reliably. The provision is measured at the present value of the future expenditure and a corresponding rehabilitation asset is also recognised. On an ongoing basis, the rehabilitation will be remeasured in line with the changes in the time value of money (recognised as an expense and an increase in the provision), and additional disturbances (recognised as additions to a corresponding asset and rehabilitation liability). Significant judgements and estimates The determination of the provision requires significant judgement in terms of the best estimate of the costs of performing the work required, the timing of the cash flows, the appropriate discount rate and inflation rate. In relation to estimating the costs of performing the work required, significant judgement and estimates are required in relation to estimating the extent of rehabilitation activities, including volume to be rehabilitated and unit rates, technological changes and regulatory changes. When these estimates change or become known in the future, such differences will impact the mine rehabilitation provision on the period in which they change or become known. A change in any, or a combination of, the key estimates used to determine the provision could have a material impact on the carrying value of the provision (Note 17).
For
per
sona
l use
onl
y
Saracen Mineral Holdings Limited Notes to the Consolidated Financial Statements
43
NOTE 1 SUMMARY OF SIGNIFICANT ACCOUNTING POLICIES (continued) (v) Contributed Equity
Ordinary share capital is recognised at the fair value of the consideration received by the Group or at the fair value of equity issued as consideration for the acquisition of assets. Any transaction costs arising on the issue of ordinary shares are recognised directly in equity as a reduction of the share proceeds received.
(w) Leased Assets
Leases are classified as finance leases when the terms of the lease transfer substantially all of the risks and rewards incidental to ownership of the leased assets to the lessee. All other leases are classified as operating leases. Assets held under finance leases are initially recognised at their fair value or, if lower, at amounts equal to the present value of the minimum lease payments, each determined at the inception of the lease. The corresponding liability is included in the consolidated statement of financial position as a finance lease obligation. Lease payments are apportioned between finance charges and reduction of the lease obligation so as to achieve a constant rate of interest on the remaining balance of the liability. Finance charges are expensed, unless they are directly attributable to qualifying assets, in which case they are capitalised. Finance leased assets are amortised on a straight line basis over the estimated useful life of the asset. Where amortisation is attributable to exploration and evaluation activities, costs are treated in accordance with the Accounting Policy Note 1(s). Operating lease payments are recognised as an expense on a straight line basis over the lease term.
(x) Asset Acquisition not constituting a Business When an asset acquisition does not constitute a business combination, the assets and liabilities are assigned a carrying amount based on their relative fair values in an asset purchase transaction and no deferred tax will arise in relation to the acquired assets and assumed liabilities as the initial recognition exemption for deferred tax under AASB 112 applies. No goodwill will arise on the acquisition and transaction costs of the acquisition will be included in the capitalised cost of the asset. Significant judgements and estimates In determining when an acquisition is determined to be an asset acquisition and not a business, significant judgement is required to assess whether the assets acquired constitute a business in accordance with AASB 3. Under AASB 3 a business is an integrated set of activities and assets that is capable of being conducted or managed for the purpose of providing a return, and consists of inputs and processes, which when applied to those inputs has the ability to create outputs.
(y) Production Start Date
Significant judgements and estimates The Group assesses the stage of each mine under construction to determine when a mine moves into the production phase, this being when the mine is substantially complete and ready for its intended use. The Group considers various relevant criteria to assess when the production phase is considered to have commenced. At this point, all related amounts are reclassified from ‘Mines under construction’ to ‘Mines in production’. Some of the criteria used to identify the production start date include, but are not limited to: • Level of capital expenditure incurred compared with the original construction cost estimate • Completion of a reasonable period of testing of the mine plant and equipment • Ability to produce metal in saleable form (within specifications) • Ability to sustain ongoing production of metal • Positive cash flow position from operations.
When a mine development project moves into the production phase, the capitalisation of certain mine development costs and pre-production revenues cease and costs are either regarded as forming part of the cost of inventory or expensed, except for costs that qualify for capitalisation relating to mining asset additions or improvements, underground mine development or mineable reserve development. It is also at this point that amortisation commences.
For
per
sona
l use
onl
y
Saracen Mineral Holdings Limited Notes to the Consolidated Financial Statements
44
NOTE 1 SUMMARY OF SIGNIFICANT ACCOUNTING POLICIES (continued) (z) Derivative Financial Instruments, including Hedge Accounting
The Group holds derivative financial instruments to hedge its foreign currency and commodity risk exposures. On initial designation of the derivative as the hedging instrument, the Group formally documents the relationship between the hedging instrument and hedged item, including the risk management objectives and strategy in undertaking the hedge transaction and the hedged risk, together with the methods that will be used to assess the effectiveness of the hedging relationship. The Group makes an assessment, both at the inception of the hedge relationship as well as on an ongoing basis, of whether the hedging instruments are expected to be highly effective in offsetting the changes in the fair value or cash flows of the respective hedged items attributable to hedged risk, and whether the actual results of each hedge are within a range of 80 – 125 percent. For a cash flow hedge of a forecast transaction, the transaction should be highly probable to occur and should present an exposure to variations in cash flows that ultimately could affect reporting profit or loss.
Derivatives are recognised initially at fair value; any attributable transaction costs are recognised in profit or loss as incurred. Subsequent to initial recognition, derivatives are measured at fair value, any changes therein are accounted for as described below.
Cash flow hedges When a derivative is designated as the hedging instrument in a hedge of the variability in cash flows attributable to a particular risk associated with a recognised asset or liability or a highly probable forecast transaction that could affect profit or loss, the effective portion of changes in the fair value of the derivative is recognised in other comprehensive income and presented in the hedging reserve in equity. Any ineffective portion of changes in the fair value of the derivative is recognised immediately in profit or loss.
When the hedged item is a non-financial asset, the amount accumulated in equity is retained in other comprehensive income and reclassified to profit or loss in the same period or periods during which the non-financial item affects profit or loss. In other cases as well, the amount accumulated in equity is reclassified to profit or loss. If the hedging instrument no longer meets the criteria for hedge accounting, expires or is sold, terminated or exercised, or the designation is revoked, then hedge accounting is discontinued prospectively. If the forecast transaction is no longer expected to occur, then the balance in equity is reclassified to profit or loss.
(aa) Comparatives
Where necessary, comparatives have been reclassified and repositioned for consistency with the current year disclosures.
For
per
sona
l use
onl
y
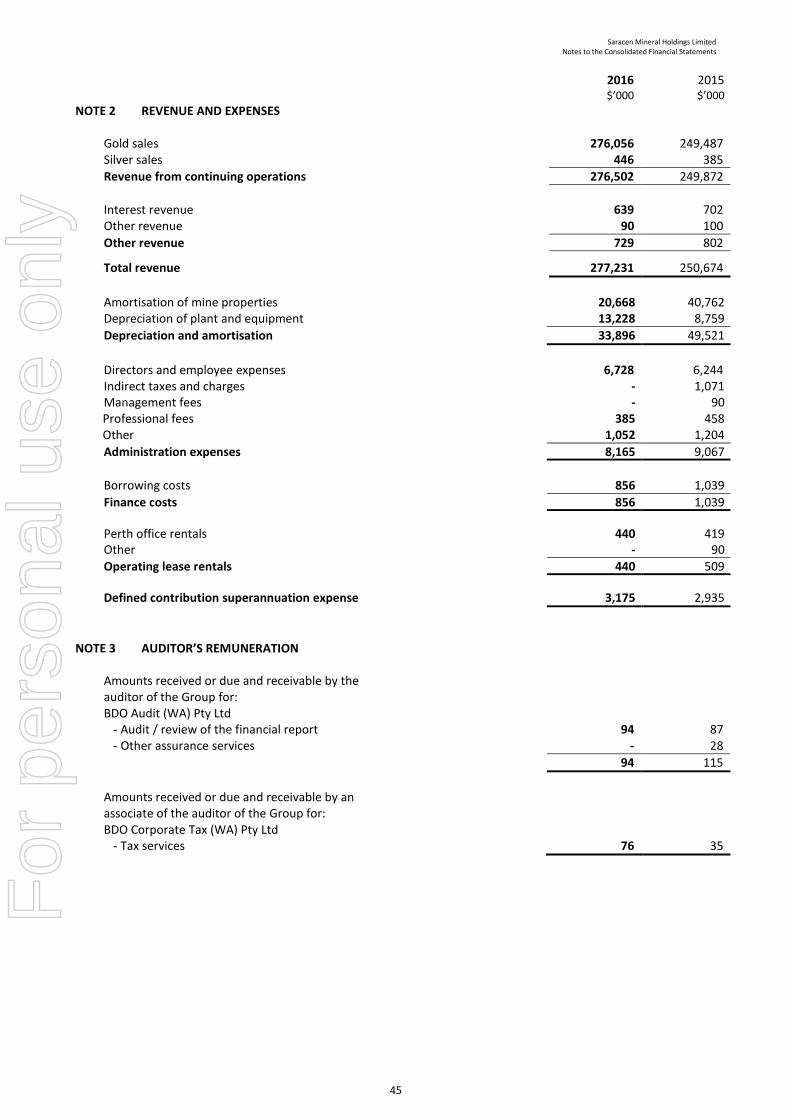
Saracen Mineral Holdings Limited Notes to the Consolidated Financial Statements
45
2016 $’000
2015 $’000
NOTE 2 REVENUE AND EXPENSES Gold sales
276,056
249,487
Silver sales 446 385
Revenue from continuing operations 276,502 249,872
Interest revenue 639 702 Other revenue 90 100
Other revenue 729 802
Total revenue 277,231 250,674
Amortisation of mine properties 20,668 40,762 Depreciation of plant and equipment 13,228 8,759
Depreciation and amortisation 33,896 49,521
Directors and employee expenses 6,728 6,244 Indirect taxes and charges - 1,071 Management fees - 90
Professional fees 385 458 Other 1,052 1,204
Administration expenses 8,165 9,067
Borrowing costs 856 1,039
Finance costs 856 1,039
Perth office rentals 440 419 Other - 90
Operating lease rentals 440 509
Defined contribution superannuation expense 3,175 2,935
NOTE 3 AUDITOR’S REMUNERATION
Amounts received or due and receivable by the auditor of the Group for:
BDO Audit (WA) Pty Ltd - Audit / review of the financial report 94 87 - Other assurance services - 28
94 115
Amounts received or due and receivable by an associate of the auditor of the Group for:
BDO Corporate Tax (WA) Pty Ltd - Tax services 76 35
F
or p
erso
nal u
se o
nly

Saracen Mineral Holdings Limited Notes to the Consolidated Financial Statements
46
2016 $’000
2015 $’000
NOTE 4 INCOME TAX (a) Income tax expense comprises: Current income tax - Current income tax charge / (benefit) - - - Under / (over) recognition in the prior year - - Deferred tax - Movement in temporary differences 12,446 5,033
Income tax expense 12,446 5,033
(b) Reconciliation of prima facie income tax expense to income tax expense per the Consolidated Statement of Profit or Loss and Comprehensive Income: Accounting profit before tax 38,335 16,181 Prime facie income tax expense at 30% (2015: 30%) 11,500 4,854 - Non-deductible expenses 1,098 185 - Recognition of previously unrecognised temporary differences (152) (6)
Income tax expense 12,446 5,033
Effective tax rate 32% 31% (c) Deferred tax assets and liabilities Deferred tax assets and liabilities are attributable to the following:
Balance at 1 July 2015
$’000
Charged / credited to
income $’000
Charged / credited to
equity $’000
Balance at 30 June
2016 $’000
Deferred tax assets Tax losses 12,804 9,227 - 22,031 Provisions 7,938 10,313 - 18,251 Other 209 3 - 212 Undeducted borrowing cost 6 (4) - 2 Undeducted share issue costs 751 (399) - 352
Total 21,708 19,140 - 40,848
Deferred tax liabilities Deferred mining expenditure (12,824) (32,090) (44,914) Property, plant and equipment - 504 - 504 Derivatives (2,558) - 2,558 -
Total (15,382) (31,586) 2,558 (44,410)
Net deferred tax asset/(liability) 6,326 (12,446) 2,558 (3,562)
Balance at 1 July 2014
$’000
Charged / credited to
income $’000
Charged / credited to
equity $’000
Balance at 30 June
2015 $’000
Deferred tax assets Tax losses 23,060 (10,256) - 12,804 Provisions 7,737 201 - 7,938 Other 64 145 - 209 Undeducted borrowing cost 83 (77) - 6 Undeducted share issue costs 1,189 (438) - 751
Total 32,133 (10,425) - 21,708
Deferred tax liabilities Deferred mining expenditure (18,216) 5,392 - (12,824) Derivatives (8,369) - 5,811 (2,558)
Total (26,585) 5,392 5,811 (15,382)
Net deferred tax asset 5,548 5,033 5,811 6,326
For
per
sona
l use
onl
y
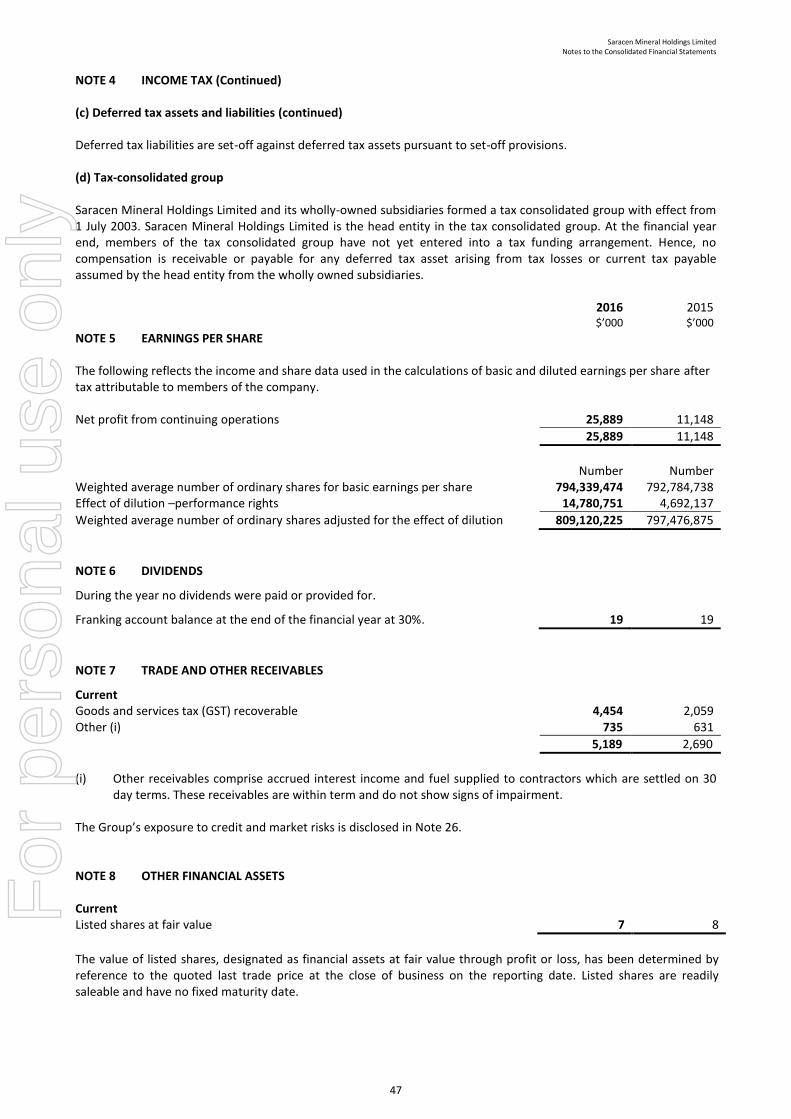
Saracen Mineral Holdings Limited Notes to the Consolidated Financial Statements
47
NOTE 4 INCOME TAX (Continued) (c) Deferred tax assets and liabilities (continued) Deferred tax liabilities are set-off against deferred tax assets pursuant to set-off provisions. (d) Tax-consolidated group Saracen Mineral Holdings Limited and its wholly-owned subsidiaries formed a tax consolidated group with effect from 1 July 2003. Saracen Mineral Holdings Limited is the head entity in the tax consolidated group. At the financial year end, members of the tax consolidated group have not yet entered into a tax funding arrangement. Hence, no compensation is receivable or payable for any deferred tax asset arising from tax losses or current tax payable assumed by the head entity from the wholly owned subsidiaries.
2016 $’000
2015 $’000
NOTE 5 EARNINGS PER SHARE The following reflects the income and share data used in the calculations of basic and diluted earnings per share after tax attributable to members of the company. Net profit from continuing operations 25,889 11,148
25,889 11,148
Number Number Weighted average number of ordinary shares for basic earnings per share 794,339,474 792,784,738 Effect of dilution –performance rights 14,780,751 4,692,137
Weighted average number of ordinary shares adjusted for the effect of dilution 809,120,225 797,476,875
NOTE 6 DIVIDENDS
During the year no dividends were paid or provided for.
Franking account balance at the end of the financial year at 30%. 19 19
NOTE 7 TRADE AND OTHER RECEIVABLES
Current Goods and services tax (GST) recoverable 4,454 2,059 Other (i) 735 631
5,189 2,690
(i) Other receivables comprise accrued interest income and fuel supplied to contractors which are settled on 30
day terms. These receivables are within term and do not show signs of impairment. The Group’s exposure to credit and market risks is disclosed in Note 26.
NOTE 8 OTHER FINANCIAL ASSETS
Current Listed shares at fair value 7 8
The value of listed shares, designated as financial assets at fair value through profit or loss, has been determined by reference to the quoted last trade price at the close of business on the reporting date. Listed shares are readily saleable and have no fixed maturity date.
For
per
sona
l use
onl
y
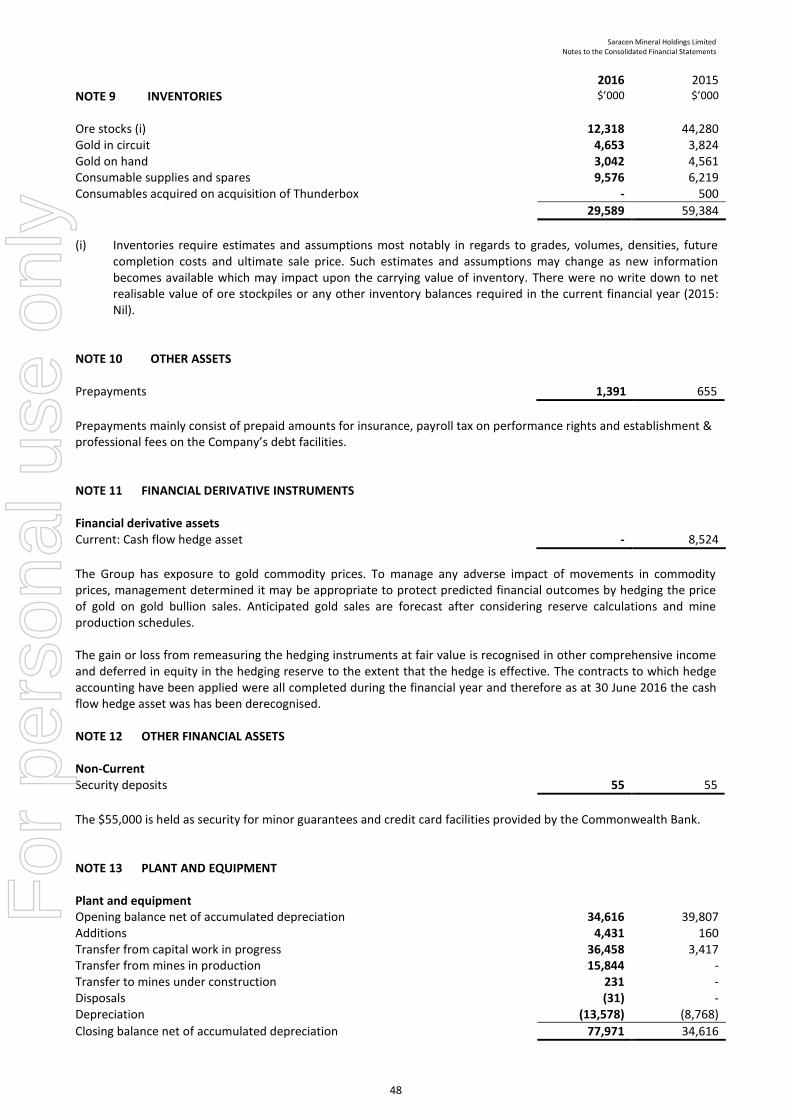
Saracen Mineral Holdings Limited Notes to the Consolidated Financial Statements
48
NOTE 9 INVENTORIES
2016 $’000
2015 $’000
Ore stocks (i) 12,318 44,280 Gold in circuit 4,653 3,824 Gold on hand 3,042 4,561 Consumable supplies and spares 9,576 6,219 Consumables acquired on acquisition of Thunderbox - 500
29,589 59,384
(i) Inventories require estimates and assumptions most notably in regards to grades, volumes, densities, future
completion costs and ultimate sale price. Such estimates and assumptions may change as new information becomes available which may impact upon the carrying value of inventory. There were no write down to net realisable value of ore stockpiles or any other inventory balances required in the current financial year (2015: Nil).
NOTE 10 OTHER ASSETS
Prepayments 1,391 655
Prepayments mainly consist of prepaid amounts for insurance, payroll tax on performance rights and establishment & professional fees on the Company’s debt facilities. NOTE 11 FINANCIAL DERIVATIVE INSTRUMENTS Financial derivative assets Current: Cash flow hedge asset - 8,524
The Group has exposure to gold commodity prices. To manage any adverse impact of movements in commodity prices, management determined it may be appropriate to protect predicted financial outcomes by hedging the price of gold on gold bullion sales. Anticipated gold sales are forecast after considering reserve calculations and mine production schedules. The gain or loss from remeasuring the hedging instruments at fair value is recognised in other comprehensive income and deferred in equity in the hedging reserve to the extent that the hedge is effective. The contracts to which hedge accounting have been applied were all completed during the financial year and therefore as at 30 June 2016 the cash flow hedge asset was has been derecognised. NOTE 12 OTHER FINANCIAL ASSETS Non-Current Security deposits 55 55
The $55,000 is held as security for minor guarantees and credit card facilities provided by the Commonwealth Bank. NOTE 13 PLANT AND EQUIPMENT Plant and equipment
Opening balance net of accumulated depreciation 34,616 39,807 Additions 4,431 160 Transfer from capital work in progress 36,458 3,417 Transfer from mines in production 15,844 - Transfer to mines under construction 231 - Disposals (31) - Depreciation (13,578) (8,768)
Closing balance net of accumulated depreciation 77,971 34,616
For
per
sona
l use
onl
y
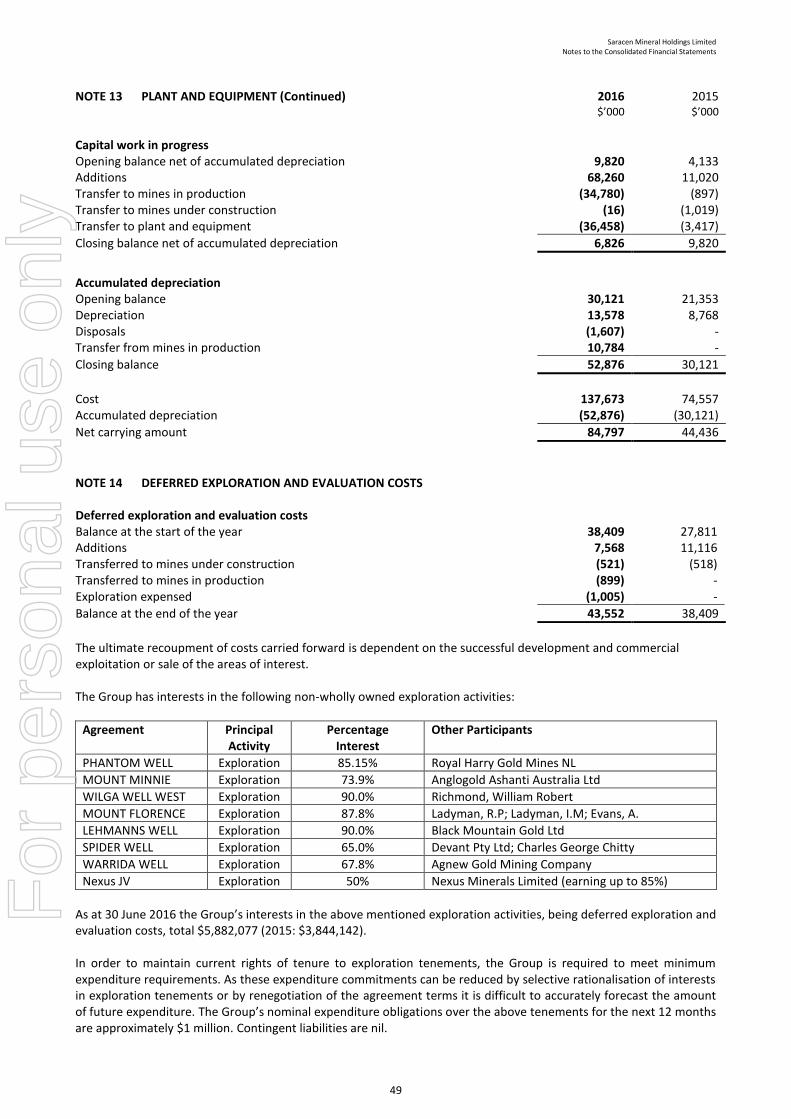
Saracen Mineral Holdings Limited Notes to the Consolidated Financial Statements
49
NOTE 13 PLANT AND EQUIPMENT (Continued)
2016 $’000
2015 $’000
Capital work in progress Opening balance net of accumulated depreciation 9,820 4,133 Additions 68,260 11,020 Transfer to mines in production (34,780) (897) Transfer to mines under construction (16) (1,019) Transfer to plant and equipment (36,458) (3,417)
Closing balance net of accumulated depreciation 6,826 9,820
Accumulated depreciation Opening balance 30,121 21,353 Depreciation 13,578 8,768 Disposals (1,607) - Transfer from mines in production 10,784 -
Closing balance 52,876 30,121
Cost
137,673
74,557
Accumulated depreciation (52,876) (30,121)
Net carrying amount 84,797 44,436
NOTE 14 DEFERRED EXPLORATION AND EVALUATION COSTS
Deferred exploration and evaluation costs Balance at the start of the year 38,409 27,811 Additions 7,568 11,116 Transferred to mines under construction (521) (518) Transferred to mines in production (899) - Exploration expensed (1,005) -
Balance at the end of the year 43,552 38,409
The ultimate recoupment of costs carried forward is dependent on the successful development and commercial exploitation or sale of the areas of interest. The Group has interests in the following non-wholly owned exploration activities:
Agreement Principal Activity
Percentage Interest
Other Participants
PHANTOM WELL Exploration 85.15% Royal Harry Gold Mines NL
MOUNT MINNIE Exploration 73.9% Anglogold Ashanti Australia Ltd
WILGA WELL WEST Exploration 90.0% Richmond, William Robert
MOUNT FLORENCE Exploration 87.8% Ladyman, R.P; Ladyman, I.M; Evans, A.
LEHMANNS WELL Exploration 90.0% Black Mountain Gold Ltd
SPIDER WELL Exploration 65.0% Devant Pty Ltd; Charles George Chitty
WARRIDA WELL Exploration 67.8% Agnew Gold Mining Company
Nexus JV Exploration 50% Nexus Minerals Limited (earning up to 85%)
As at 30 June 2016 the Group’s interests in the above mentioned exploration activities, being deferred exploration and evaluation costs, total $5,882,077 (2015: $3,844,142). In order to maintain current rights of tenure to exploration tenements, the Group is required to meet minimum expenditure requirements. As these expenditure commitments can be reduced by selective rationalisation of interests in exploration tenements or by renegotiation of the agreement terms it is difficult to accurately forecast the amount of future expenditure. The Group’s nominal expenditure obligations over the above tenements for the next 12 months are approximately $1 million. Contingent liabilities are nil.
For
per
sona
l use
onl
y
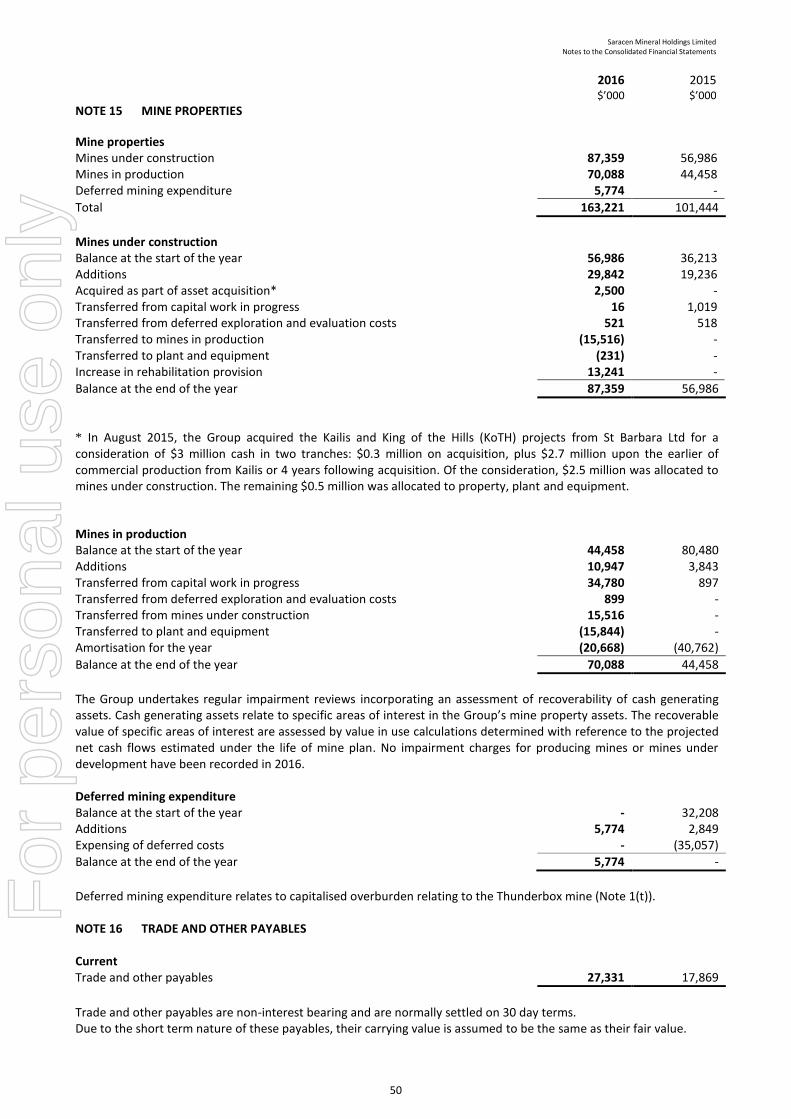
Saracen Mineral Holdings Limited Notes to the Consolidated Financial Statements
50
2016 $’000
2015 $’000
NOTE 15 MINE PROPERTIES
Mine properties Mines under construction 87,359 56,986 Mines in production 70,088 44,458 Deferred mining expenditure 5,774 -
Total 163,221 101,444
Mines under construction Balance at the start of the year 56,986 36,213 Additions 29,842 19,236 Acquired as part of asset acquisition* 2,500 - Transferred from capital work in progress 16 1,019 Transferred from deferred exploration and evaluation costs 521 518 Transferred to mines in production (15,516) - Transferred to plant and equipment (231) - Increase in rehabilitation provision 13,241 -
Balance at the end of the year 87,359 56,986
* In August 2015, the Group acquired the Kailis and King of the Hills (KoTH) projects from St Barbara Ltd for a consideration of $3 million cash in two tranches: $0.3 million on acquisition, plus $2.7 million upon the earlier of commercial production from Kailis or 4 years following acquisition. Of the consideration, $2.5 million was allocated to mines under construction. The remaining $0.5 million was allocated to property, plant and equipment.
Mines in production Balance at the start of the year 44,458 80,480 Additions 10,947 3,843 Transferred from capital work in progress 34,780 897 Transferred from deferred exploration and evaluation costs 899 - Transferred from mines under construction 15,516 - Transferred to plant and equipment (15,844) - Amortisation for the year (20,668) (40,762)
Balance at the end of the year 70,088 44,458
The Group undertakes regular impairment reviews incorporating an assessment of recoverability of cash generating assets. Cash generating assets relate to specific areas of interest in the Group’s mine property assets. The recoverable value of specific areas of interest are assessed by value in use calculations determined with reference to the projected net cash flows estimated under the life of mine plan. No impairment charges for producing mines or mines under development have been recorded in 2016. Deferred mining expenditure Balance at the start of the year - 32,208 Additions 5,774 2,849 Expensing of deferred costs - (35,057)
Balance at the end of the year 5,774 -
Deferred mining expenditure relates to capitalised overburden relating to the Thunderbox mine (Note 1(t)). NOTE 16 TRADE AND OTHER PAYABLES Current Trade and other payables 27,331 17,869
Trade and other payables are non-interest bearing and are normally settled on 30 day terms. Due to the short term nature of these payables, their carrying value is assumed to be the same as their fair value.
For
per
sona
l use
onl
y
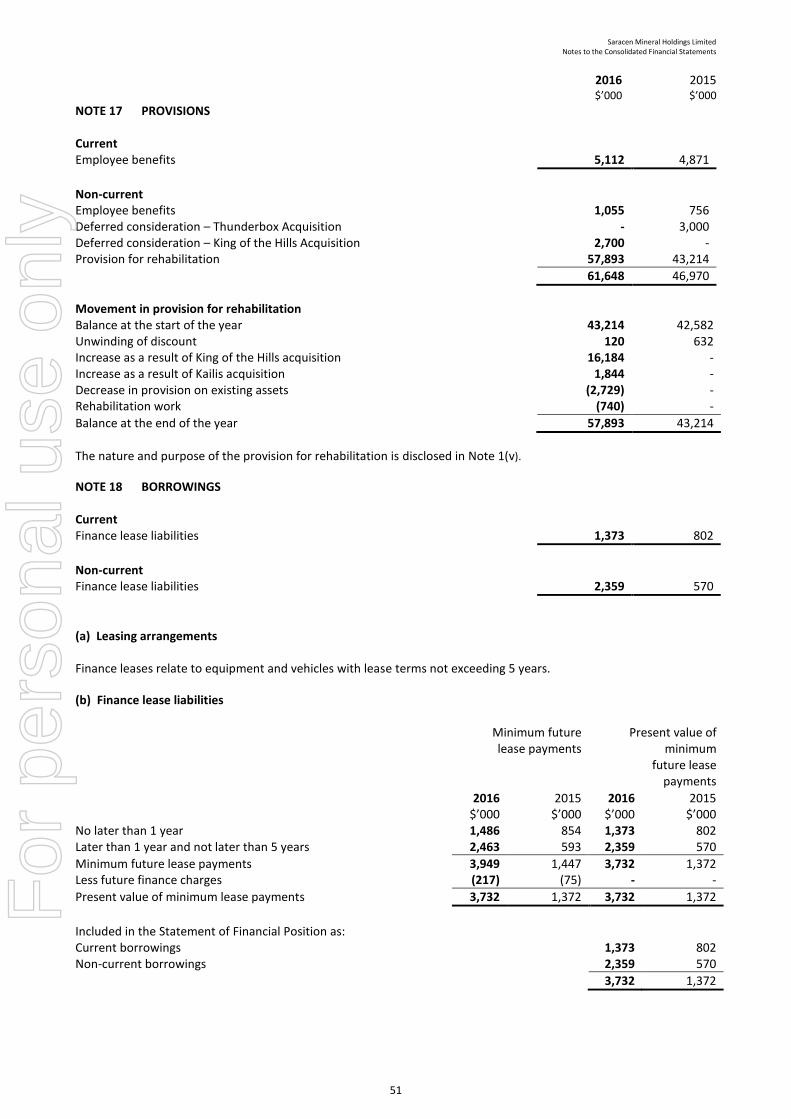
Saracen Mineral Holdings Limited Notes to the Consolidated Financial Statements
51
2016 $’000
2015 $’000
NOTE 17 PROVISIONS
Current Employee benefits 5,112 4,871
Non-current Employee benefits 1,055 756 Deferred consideration – Thunderbox Acquisition - 3,000 Deferred consideration – King of the Hills Acquisition 2,700 - Provision for rehabilitation 57,893 43,214
61,648 46,970
Movement in provision for rehabilitation Balance at the start of the year 43,214 42,582 Unwinding of discount 120 632 Increase as a result of King of the Hills acquisition 16,184 - Increase as a result of Kailis acquisition 1,844 - Decrease in provision on existing assets (2,729) - Rehabilitation work (740) -
Balance at the end of the year 57,893 43,214
The nature and purpose of the provision for rehabilitation is disclosed in Note 1(v).
NOTE 18 BORROWINGS
Current Finance lease liabilities 1,373 802
Non-current Finance lease liabilities 2,359 570
(a) Leasing arrangements Finance leases relate to equipment and vehicles with lease terms not exceeding 5 years.
(b) Finance lease liabilities
Minimum future lease payments
Present value of minimum
future lease payments
2016 $’000
2015 $’000
2016 $’000
2015 $’000
No later than 1 year 1,486 854 1,373 802 Later than 1 year and not later than 5 years 2,463 593 2,359 570
Minimum future lease payments 3,949 1,447 3,732 1,372 Less future finance charges (217) (75) - -
Present value of minimum lease payments 3,732 1,372 3,732 1,372
Included in the Statement of Financial Position as: Current borrowings 1,373 802 Non-current borrowings 2,359 570
3,732 1,372
For
per
sona
l use
onl
y
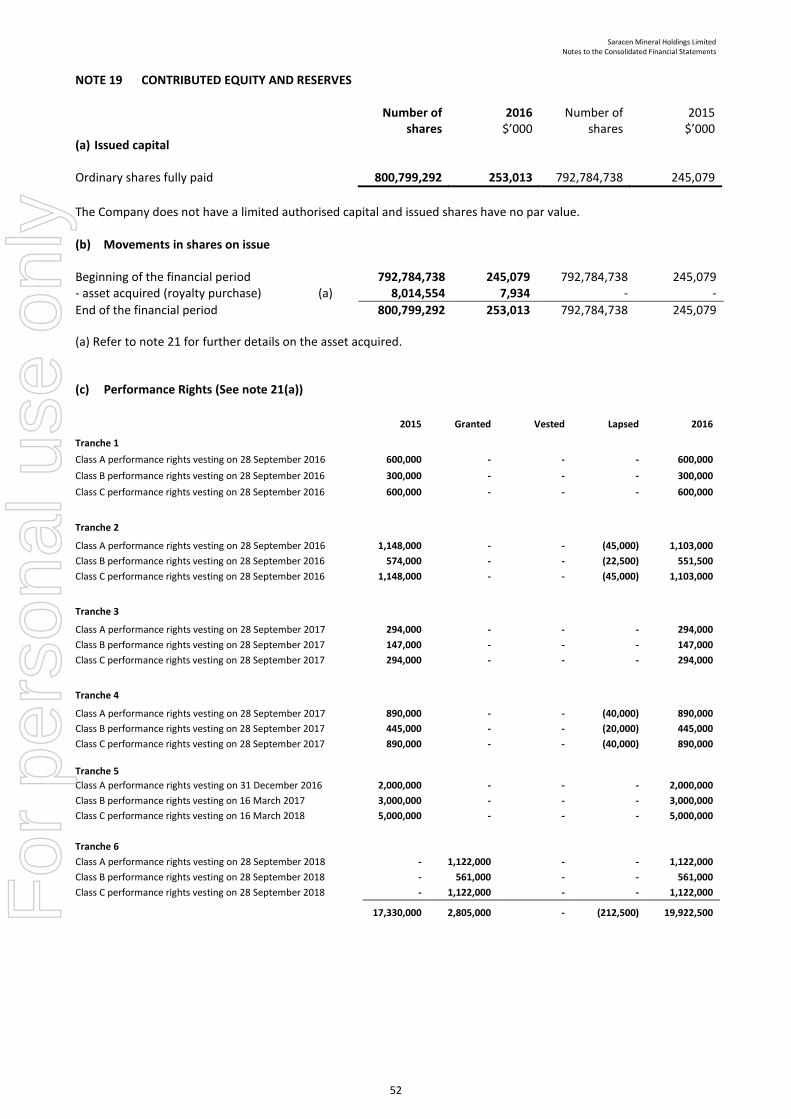
Saracen Mineral Holdings Limited Notes to the Consolidated Financial Statements
52
NOTE 19 CONTRIBUTED EQUITY AND RESERVES
Number of shares
2016 $’000
Number of shares
2015 $’000
(a) Issued capital
Ordinary shares fully paid 800,799,292 253,013 792,784,738 245,079
The Company does not have a limited authorised capital and issued shares have no par value. (b) Movements in shares on issue
Beginning of the financial period 792,784,738 245,079 792,784,738 245,079 - asset acquired (royalty purchase) (a) 8,014,554 7,934 - -
End of the financial period 800,799,292 253,013 792,784,738 245,079
(a) Refer to note 21 for further details on the asset acquired.
(c) Performance Rights (See note 21(a))
30 June 2012
2015 Granted Vested Lapsed 2016
Tranche 1
Class A performance rights vesting on 28 September 2016 600,000 - - - 600,000
Class B performance rights vesting on 28 September 2016 300,000 - - - 300,000
Class C performance rights vesting on 28 September 2016 600,000 - - - 600,000
Tranche 2
Class A performance rights vesting on 28 September 2016 1,148,000 - - (45,000) 1,103,000
Class B performance rights vesting on 28 September 2016 574,000 - - (22,500) 551,500
Class C performance rights vesting on 28 September 2016 1,148,000 - - (45,000) 1,103,000
Tranche 3
Class A performance rights vesting on 28 September 2017 294,000 - - - 294,000
Class B performance rights vesting on 28 September 2017 147,000 - - - 147,000
Class C performance rights vesting on 28 September 2017 294,000 - - - 294,000
Tranche 4
Class A performance rights vesting on 28 September 2017 890,000 - - (40,000) 890,000
Class B performance rights vesting on 28 September 2017 445,000 - - (20,000) 445,000
Class C performance rights vesting on 28 September 2017 890,000 - - (40,000) 890,000
Tranche 5
Class A performance rights vesting on 31 December 2016 2,000,000 - - - 2,000,000
Class B performance rights vesting on 16 March 2017 3,000,000 - - - 3,000,000
Class C performance rights vesting on 16 March 2018 5,000,000 - - - 5,000,000
Tranche 6
Class A performance rights vesting on 28 September 2018 - 1,122,000 - - 1,122,000
Class B performance rights vesting on 28 September 2018 - 561,000 - - 561,000
Class C performance rights vesting on 28 September 2018 - 1,122,000 - - 1,122,000
17,330,000 2,805,000 - (212,500) 19,922,500
For
per
sona
l use
onl
y
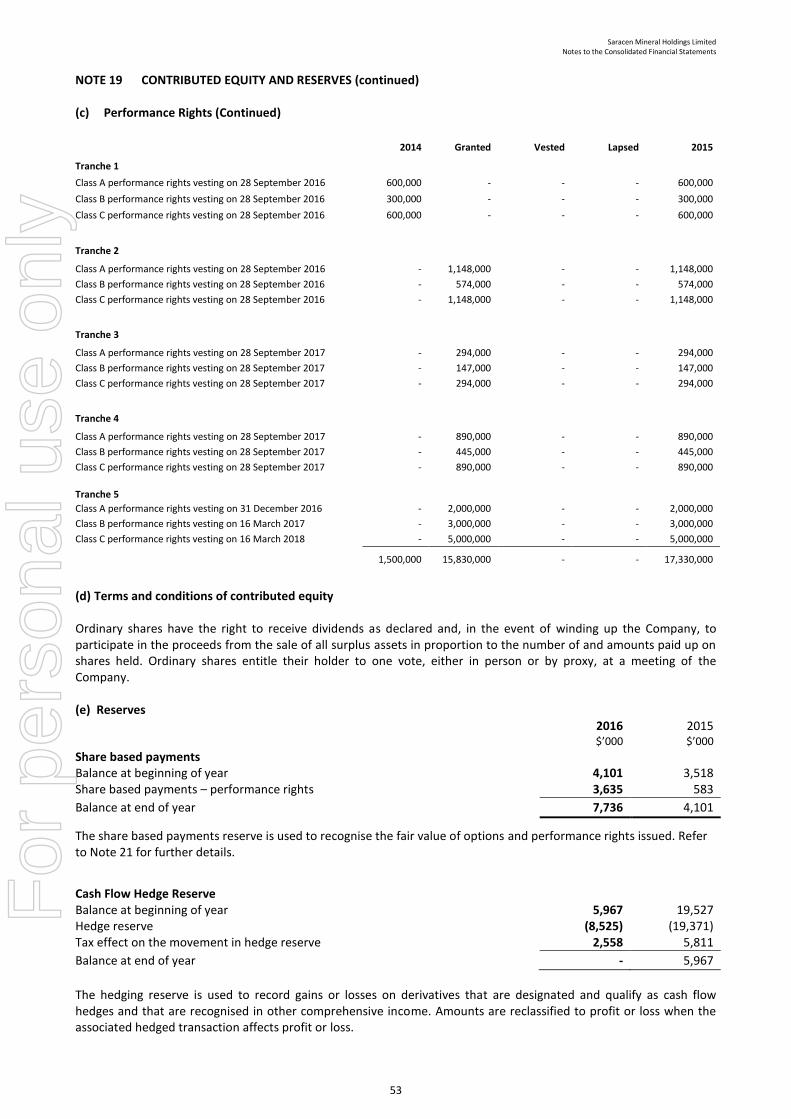
Saracen Mineral Holdings Limited Notes to the Consolidated Financial Statements
53
NOTE 19 CONTRIBUTED EQUITY AND RESERVES (continued) (c) Performance Rights (Continued)
30 June 2012
2014 Granted Vested Lapsed 2015
Tranche 1
Class A performance rights vesting on 28 September 2016 600,000 - - - 600,000
Class B performance rights vesting on 28 September 2016 300,000 - - - 300,000
Class C performance rights vesting on 28 September 2016 600,000 - - - 600,000
Tranche 2
Class A performance rights vesting on 28 September 2016 - 1,148,000 - - 1,148,000
Class B performance rights vesting on 28 September 2016 - 574,000 - - 574,000
Class C performance rights vesting on 28 September 2016 - 1,148,000 - - 1,148,000
Tranche 3
Class A performance rights vesting on 28 September 2017 - 294,000 - - 294,000
Class B performance rights vesting on 28 September 2017 - 147,000 - - 147,000
Class C performance rights vesting on 28 September 2017 - 294,000 - - 294,000
Tranche 4
Class A performance rights vesting on 28 September 2017 - 890,000 - - 890,000
Class B performance rights vesting on 28 September 2017 - 445,000 - - 445,000
Class C performance rights vesting on 28 September 2017 - 890,000 - - 890,000
Tranche 5
Class A performance rights vesting on 31 December 2016 - 2,000,000 - - 2,000,000
Class B performance rights vesting on 16 March 2017 - 3,000,000 - - 3,000,000
Class C performance rights vesting on 16 March 2018 - 5,000,000 - - 5,000,000
1,500,000 15,830,000 - - 17,330,000
(d) Terms and conditions of contributed equity Ordinary shares have the right to receive dividends as declared and, in the event of winding up the Company, to participate in the proceeds from the sale of all surplus assets in proportion to the number of and amounts paid up on shares held. Ordinary shares entitle their holder to one vote, either in person or by proxy, at a meeting of the Company. (e) Reserves
2016 $’000
2015 $’000
Share based payments Balance at beginning of year 4,101 3,518 Share based payments – performance rights 3,635 583
Balance at end of year 7,736 4,101
The share based payments reserve is used to recognise the fair value of options and performance rights issued. Refer to Note 21 for further details.
Cash Flow Hedge Reserve Balance at beginning of year 5,967 19,527 Hedge reserve (8,525) (19,371) Tax effect on the movement in hedge reserve 2,558 5,811
Balance at end of year - 5,967
The hedging reserve is used to record gains or losses on derivatives that are designated and qualify as cash flow hedges and that are recognised in other comprehensive income. Amounts are reclassified to profit or loss when the associated hedged transaction affects profit or loss.
For
per
sona
l use
onl
y
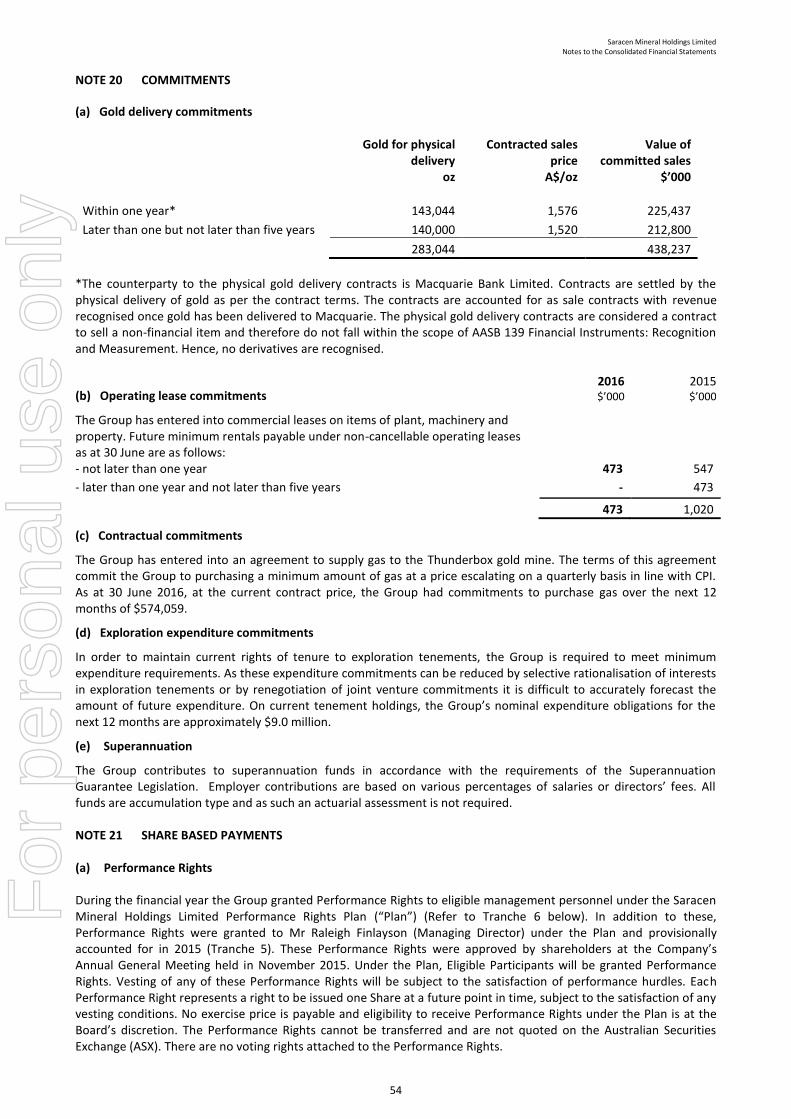
Saracen Mineral Holdings Limited Notes to the Consolidated Financial Statements
54
NOTE 20 COMMITMENTS
(a) Gold delivery commitments
Gold for physical delivery
oz
Contracted sales price
A$/oz
Value of committed sales
$’000
Within one year* 143,044 1,576 225,437
Later than one but not later than five years 140,000 1,520 212,800
283,044 438,237
*The counterparty to the physical gold delivery contracts is Macquarie Bank Limited. Contracts are settled by the physical delivery of gold as per the contract terms. The contracts are accounted for as sale contracts with revenue recognised once gold has been delivered to Macquarie. The physical gold delivery contracts are considered a contract to sell a non-financial item and therefore do not fall within the scope of AASB 139 Financial Instruments: Recognition and Measurement. Hence, no derivatives are recognised.
(b) Operating lease commitments 2016 $’000
2015 $’000
The Group has entered into commercial leases on items of plant, machinery and property. Future minimum rentals payable under non-cancellable operating leases as at 30 June are as follows: - not later than one year 473 547
- later than one year and not later than five years - 473
473 1,020
(c) Contractual commitments
The Group has entered into an agreement to supply gas to the Thunderbox gold mine. The terms of this agreement commit the Group to purchasing a minimum amount of gas at a price escalating on a quarterly basis in line with CPI. As at 30 June 2016, at the current contract price, the Group had commitments to purchase gas over the next 12 months of $574,059.
(d) Exploration expenditure commitments
In order to maintain current rights of tenure to exploration tenements, the Group is required to meet minimum expenditure requirements. As these expenditure commitments can be reduced by selective rationalisation of interests in exploration tenements or by renegotiation of joint venture commitments it is difficult to accurately forecast the amount of future expenditure. On current tenement holdings, the Group’s nominal expenditure obligations for the next 12 months are approximately $9.0 million.
(e) Superannuation
The Group contributes to superannuation funds in accordance with the requirements of the Superannuation Guarantee Legislation. Employer contributions are based on various percentages of salaries or directors’ fees. All funds are accumulation type and as such an actuarial assessment is not required. NOTE 21 SHARE BASED PAYMENTS (a) Performance Rights During the financial year the Group granted Performance Rights to eligible management personnel under the Saracen Mineral Holdings Limited Performance Rights Plan (“Plan”) (Refer to Tranche 6 below). In addition to these, Performance Rights were granted to Mr Raleigh Finlayson (Managing Director) under the Plan and provisionally accounted for in 2015 (Tranche 5). These Performance Rights were approved by shareholders at the Company’s Annual General Meeting held in November 2015. Under the Plan, Eligible Participants will be granted Performance Rights. Vesting of any of these Performance Rights will be subject to the satisfaction of performance hurdles. Each Performance Right represents a right to be issued one Share at a future point in time, subject to the satisfaction of any vesting conditions. No exercise price is payable and eligibility to receive Performance Rights under the Plan is at the Board’s discretion. The Performance Rights cannot be transferred and are not quoted on the Australian Securities Exchange (ASX). There are no voting rights attached to the Performance Rights.
For
per
sona
l use
onl
y
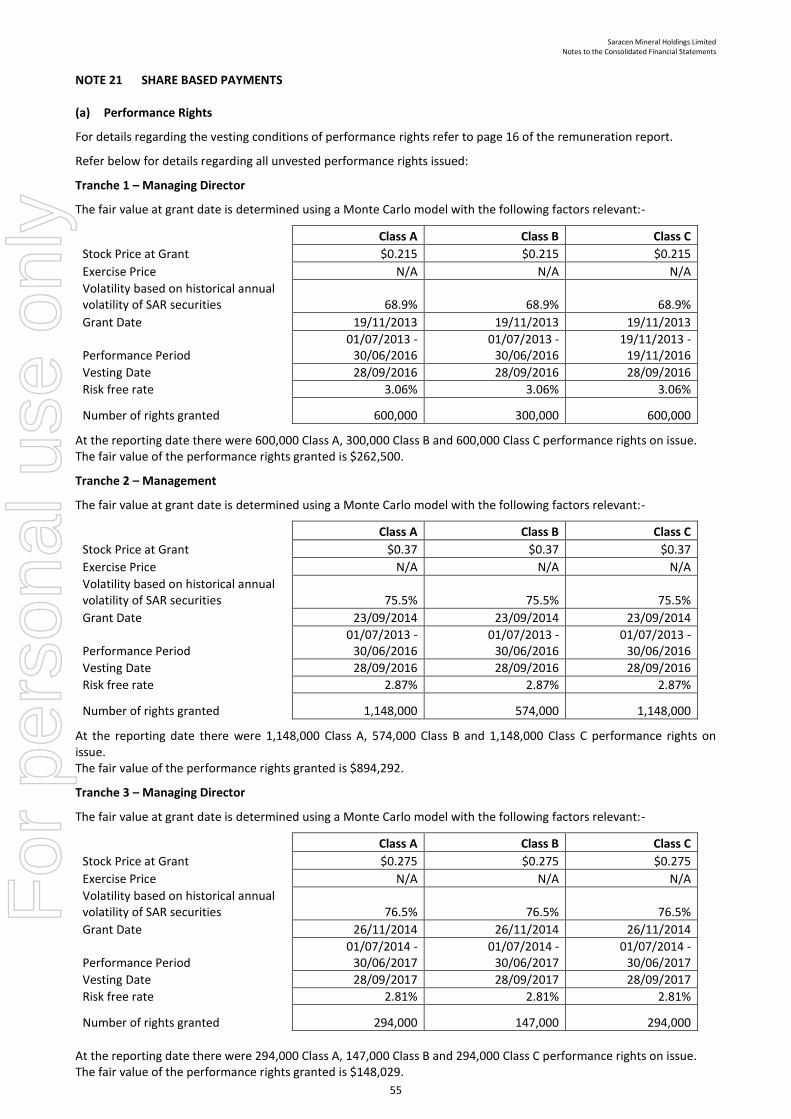
Saracen Mineral Holdings Limited Notes to the Consolidated Financial Statements
55
NOTE 21 SHARE BASED PAYMENTS (a) Performance Rights
For details regarding the vesting conditions of performance rights refer to page 16 of the remuneration report.
Refer below for details regarding all unvested performance rights issued:
Tranche 1 – Managing Director
The fair value at grant date is determined using a Monte Carlo model with the following factors relevant:-
Class A Class B Class C
Stock Price at Grant $0.215 $0.215 $0.215
Exercise Price N/A N/A N/A
Volatility based on historical annual volatility of SAR securities 68.9% 68.9% 68.9%
Grant Date 19/11/2013 19/11/2013 19/11/2013
Performance Period 01/07/2013 -
30/06/2016 01/07/2013 -
30/06/2016 19/11/2013 -
19/11/2016
Vesting Date 28/09/2016 28/09/2016 28/09/2016
Risk free rate 3.06% 3.06% 3.06%
Number of rights granted 600,000 300,000 600,000
At the reporting date there were 600,000 Class A, 300,000 Class B and 600,000 Class C performance rights on issue. The fair value of the performance rights granted is $262,500.
Tranche 2 – Management
The fair value at grant date is determined using a Monte Carlo model with the following factors relevant:-
Class A Class B Class C
Stock Price at Grant $0.37 $0.37 $0.37
Exercise Price N/A N/A N/A
Volatility based on historical annual volatility of SAR securities 75.5% 75.5% 75.5%
Grant Date 23/09/2014 23/09/2014 23/09/2014
Performance Period 01/07/2013 -
30/06/2016 01/07/2013 -
30/06/2016 01/07/2013 -
30/06/2016
Vesting Date 28/09/2016 28/09/2016 28/09/2016
Risk free rate 2.87% 2.87% 2.87%
Number of rights granted 1,148,000 574,000 1,148,000
At the reporting date there were 1,148,000 Class A, 574,000 Class B and 1,148,000 Class C performance rights on issue. The fair value of the performance rights granted is $894,292.
Tranche 3 – Managing Director
The fair value at grant date is determined using a Monte Carlo model with the following factors relevant:-
Class A Class B Class C
Stock Price at Grant $0.275 $0.275 $0.275
Exercise Price N/A N/A N/A
Volatility based on historical annual volatility of SAR securities 76.5% 76.5% 76.5%
Grant Date 26/11/2014 26/11/2014 26/11/2014
Performance Period 01/07/2014 -
30/06/2017 01/07/2014 -
30/06/2017 01/07/2014 -
30/06/2017
Vesting Date 28/09/2017 28/09/2017 28/09/2017
Risk free rate 2.81% 2.81% 2.81%
Number of rights granted 294,000 147,000 294,000
At the reporting date there were 294,000 Class A, 147,000 Class B and 294,000 Class C performance rights on issue. The fair value of the performance rights granted is $148,029.
For
per
sona
l use
onl
y
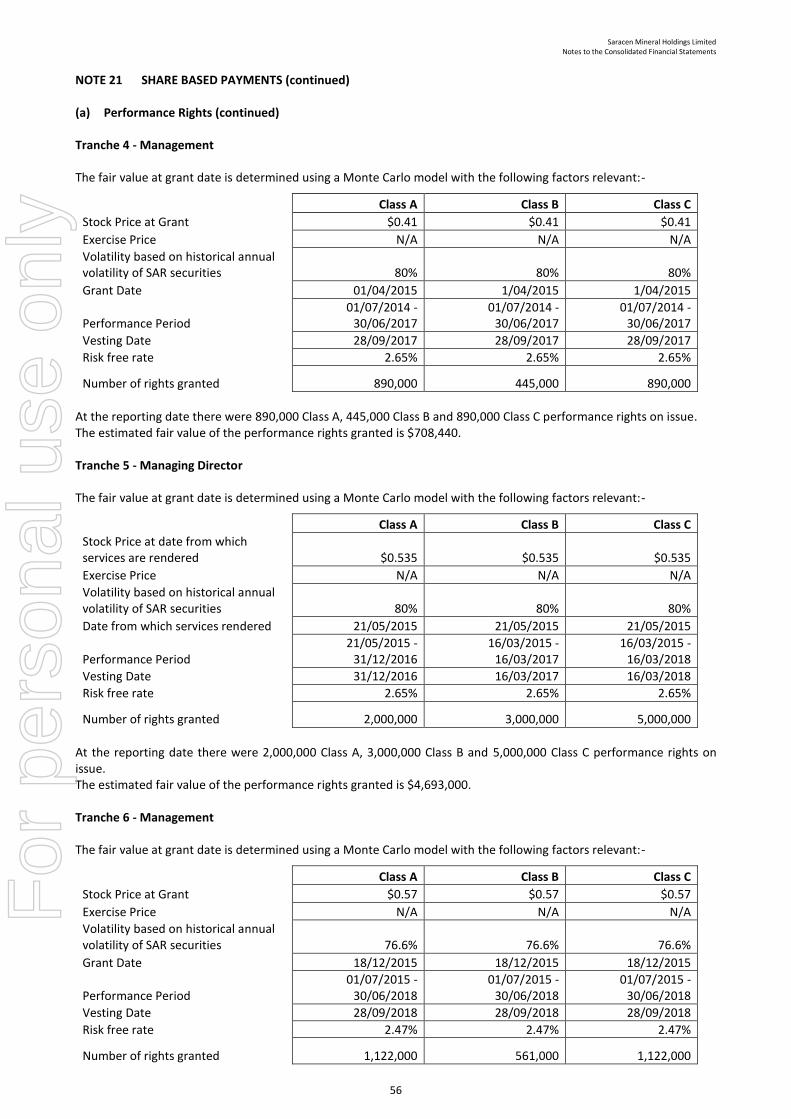
Saracen Mineral Holdings Limited Notes to the Consolidated Financial Statements
56
NOTE 21 SHARE BASED PAYMENTS (continued) (a) Performance Rights (continued) Tranche 4 - Management The fair value at grant date is determined using a Monte Carlo model with the following factors relevant:-
Class A Class B Class C
Stock Price at Grant $0.41 $0.41 $0.41
Exercise Price N/A N/A N/A
Volatility based on historical annual volatility of SAR securities 80% 80% 80%
Grant Date 01/04/2015 1/04/2015 1/04/2015
Performance Period 01/07/2014 -
30/06/2017 01/07/2014 -
30/06/2017 01/07/2014 -
30/06/2017
Vesting Date 28/09/2017 28/09/2017 28/09/2017
Risk free rate 2.65% 2.65% 2.65%
Number of rights granted 890,000 445,000 890,000
At the reporting date there were 890,000 Class A, 445,000 Class B and 890,000 Class C performance rights on issue. The estimated fair value of the performance rights granted is $708,440. Tranche 5 - Managing Director The fair value at grant date is determined using a Monte Carlo model with the following factors relevant:-
Class A Class B Class C
Stock Price at date from which services are rendered $0.535 $0.535 $0.535
Exercise Price N/A N/A N/A
Volatility based on historical annual volatility of SAR securities 80% 80% 80%
Date from which services rendered 21/05/2015 21/05/2015 21/05/2015
Performance Period 21/05/2015 -
31/12/2016 16/03/2015 -
16/03/2017 16/03/2015 -
16/03/2018
Vesting Date 31/12/2016 16/03/2017 16/03/2018
Risk free rate 2.65% 2.65% 2.65%
Number of rights granted 2,000,000 3,000,000 5,000,000
At the reporting date there were 2,000,000 Class A, 3,000,000 Class B and 5,000,000 Class C performance rights on issue. The estimated fair value of the performance rights granted is $4,693,000. Tranche 6 - Management The fair value at grant date is determined using a Monte Carlo model with the following factors relevant:-
Class A Class B Class C
Stock Price at Grant $0.57 $0.57 $0.57
Exercise Price N/A N/A N/A
Volatility based on historical annual volatility of SAR securities 76.6% 76.6% 76.6%
Grant Date 18/12/2015 18/12/2015 18/12/2015
Performance Period 01/07/2015 -
30/06/2018 01/07/2015 -
30/06/2018 01/07/2015 -
30/06/2018
Vesting Date 28/09/2018 28/09/2018 28/09/2018
Risk free rate 2.47% 2.47% 2.47%
Number of rights granted 1,122,000 561,000 1,122,000
For
per
sona
l use
onl
y
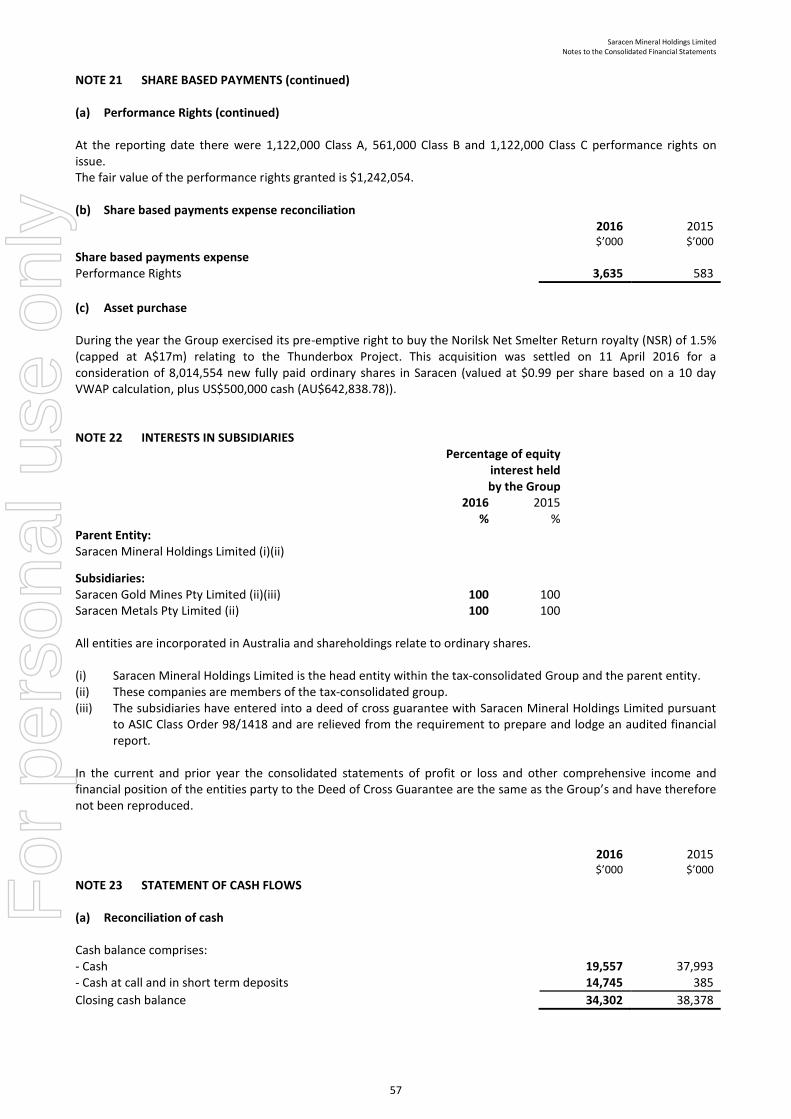
Saracen Mineral Holdings Limited Notes to the Consolidated Financial Statements
57
NOTE 21 SHARE BASED PAYMENTS (continued) (a) Performance Rights (continued) At the reporting date there were 1,122,000 Class A, 561,000 Class B and 1,122,000 Class C performance rights on issue. The fair value of the performance rights granted is $1,242,054. (b) Share based payments expense reconciliation
2016 $’000
2015 $’000
Share based payments expense Performance Rights 3,635 583
(c) Asset purchase During the year the Group exercised its pre-emptive right to buy the Norilsk Net Smelter Return royalty (NSR) of 1.5% (capped at A$17m) relating to the Thunderbox Project. This acquisition was settled on 11 April 2016 for a consideration of 8,014,554 new fully paid ordinary shares in Saracen (valued at $0.99 per share based on a 10 day VWAP calculation, plus US$500,000 cash (AU$642,838.78)). NOTE 22 INTERESTS IN SUBSIDIARIES
Percentage of equity interest held by the Group
2016 %
2015 %
Parent Entity: Saracen Mineral Holdings Limited (i)(ii) Subsidiaries: Saracen Gold Mines Pty Limited (ii)(iii) 100 100 Saracen Metals Pty Limited (ii) 100 100 All entities are incorporated in Australia and shareholdings relate to ordinary shares. (i) Saracen Mineral Holdings Limited is the head entity within the tax-consolidated Group and the parent entity. (ii) These companies are members of the tax-consolidated group. (iii) The subsidiaries have entered into a deed of cross guarantee with Saracen Mineral Holdings Limited pursuant
to ASIC Class Order 98/1418 and are relieved from the requirement to prepare and lodge an audited financial report.
In the current and prior year the consolidated statements of profit or loss and other comprehensive income and financial position of the entities party to the Deed of Cross Guarantee are the same as the Group’s and have therefore not been reproduced.
2016 $’000
2015 $’000
NOTE 23 STATEMENT OF CASH FLOWS
(a) Reconciliation of cash
Cash balance comprises: - Cash 19,557 37,993 - Cash at call and in short term deposits 14,745 385
Closing cash balance 34,302 38,378
For
per
sona
l use
onl
y
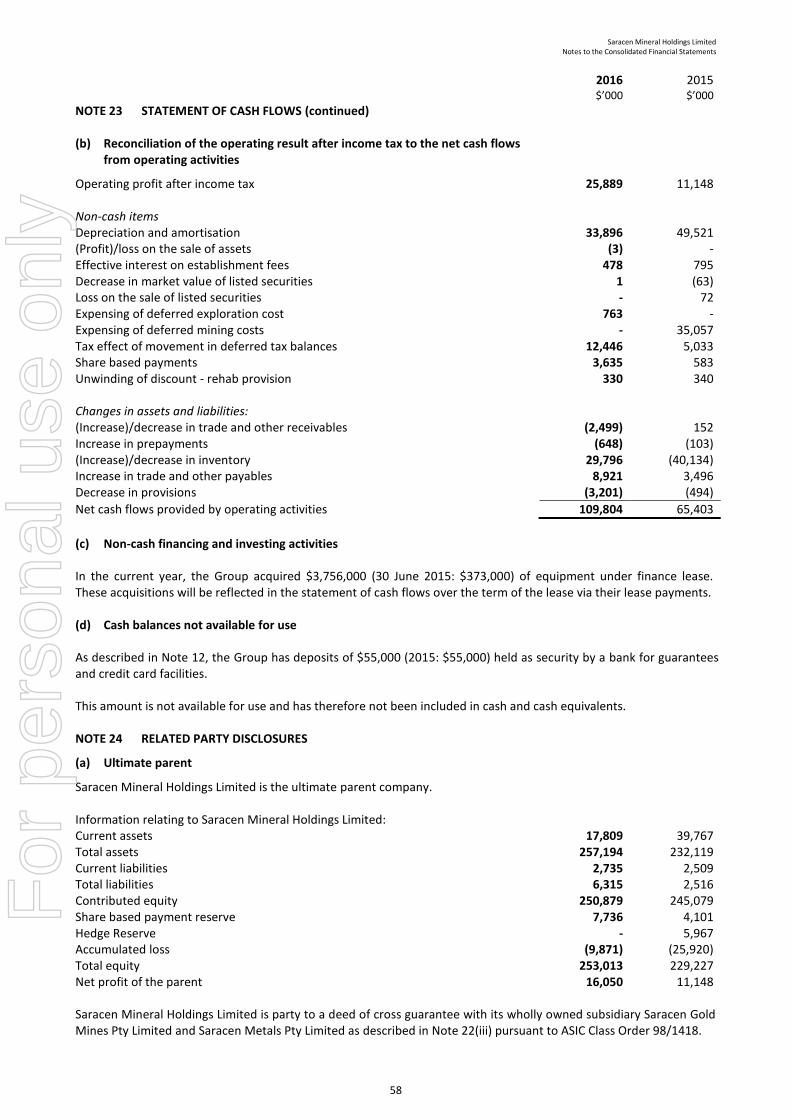
Saracen Mineral Holdings Limited Notes to the Consolidated Financial Statements
58
2016 $’000
2015 $’000
NOTE 23 STATEMENT OF CASH FLOWS (continued)
(b) Reconciliation of the operating result after income tax to the net cash flows from operating activities
Operating profit after income tax 25,889 11,148 Non-cash items Depreciation and amortisation 33,896 49,521 (Profit)/loss on the sale of assets (3) - Effective interest on establishment fees 478 795 Decrease in market value of listed securities 1 (63) Loss on the sale of listed securities - 72 Expensing of deferred exploration cost 763 - Expensing of deferred mining costs - 35,057 Tax effect of movement in deferred tax balances 12,446 5,033 Share based payments 3,635 583 Unwinding of discount - rehab provision 330 340 Changes in assets and liabilities: (Increase)/decrease in trade and other receivables (2,499) 152 Increase in prepayments (648) (103) (Increase)/decrease in inventory 29,796 (40,134) Increase in trade and other payables 8,921 3,496 Decrease in provisions (3,201) (494)
Net cash flows provided by operating activities 109,804 65,403
(c) Non-cash financing and investing activities In the current year, the Group acquired $3,756,000 (30 June 2015: $373,000) of equipment under finance lease. These acquisitions will be reflected in the statement of cash flows over the term of the lease via their lease payments. (d) Cash balances not available for use As described in Note 12, the Group has deposits of $55,000 (2015: $55,000) held as security by a bank for guarantees and credit card facilities. This amount is not available for use and has therefore not been included in cash and cash equivalents. NOTE 24 RELATED PARTY DISCLOSURES
(a) Ultimate parent
Saracen Mineral Holdings Limited is the ultimate parent company. Information relating to Saracen Mineral Holdings Limited:
Current assets 17,809 39,767 Total assets 257,194 232,119 Current liabilities 2,735 2,509 Total liabilities 6,315 2,516 Contributed equity 250,879 245,079 Share based payment reserve 7,736 4,101 Hedge Reserve - 5,967 Accumulated loss (9,871) (25,920) Total equity 253,013 229,227 Net profit of the parent 16,050 11,148
Saracen Mineral Holdings Limited is party to a deed of cross guarantee with its wholly owned subsidiary Saracen Gold Mines Pty Limited and Saracen Metals Pty Limited as described in Note 22(iii) pursuant to ASIC Class Order 98/1418.
For
per
sona
l use
onl
y
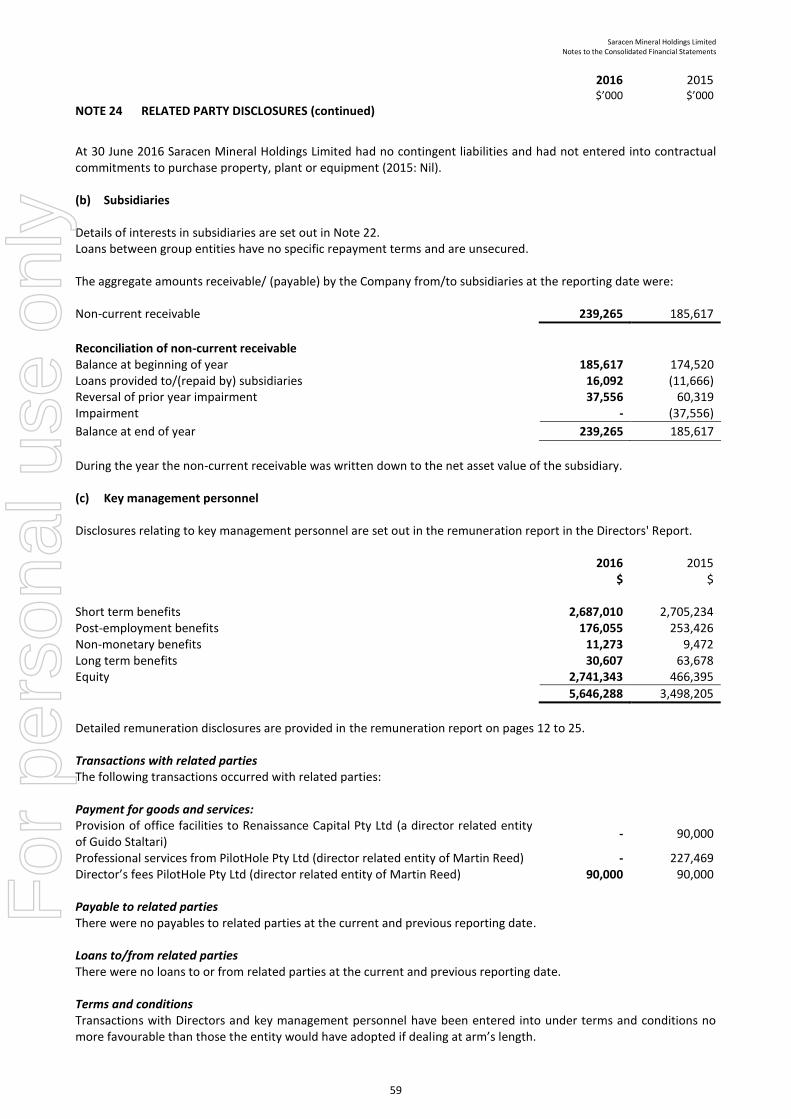
Saracen Mineral Holdings Limited Notes to the Consolidated Financial Statements
59
2016 $’000
2015 $’000
NOTE 24 RELATED PARTY DISCLOSURES (continued)
At 30 June 2016 Saracen Mineral Holdings Limited had no contingent liabilities and had not entered into contractual commitments to purchase property, plant or equipment (2015: Nil). (b) Subsidiaries Details of interests in subsidiaries are set out in Note 22. Loans between group entities have no specific repayment terms and are unsecured. The aggregate amounts receivable/ (payable) by the Company from/to subsidiaries at the reporting date were: Non-current receivable
239,265
185,617
Reconciliation of non-current receivable Balance at beginning of year 185,617 174,520 Loans provided to/(repaid by) subsidiaries 16,092 (11,666) Reversal of prior year impairment 37,556 60,319 Impairment - (37,556)
Balance at end of year 239,265 185,617
During the year the non-current receivable was written down to the net asset value of the subsidiary.
(c) Key management personnel
Disclosures relating to key management personnel are set out in the remuneration report in the Directors' Report.
2016
$ 2015
$
Short term benefits 2,687,010 2,705,234 Post-employment benefits 176,055 253,426 Non-monetary benefits 11,273 9,472 Long term benefits 30,607 63,678 Equity 2,741,343 466,395
5,646,288 3,498,205
Detailed remuneration disclosures are provided in the remuneration report on pages 12 to 25.
Transactions with related parties The following transactions occurred with related parties:
Payment for goods and services: Provision of office facilities to Renaissance Capital Pty Ltd (a director related entity of Guido Staltari)
- 90,000
Professional services from PilotHole Pty Ltd (director related entity of Martin Reed) - 227,469 Director’s fees PilotHole Pty Ltd (director related entity of Martin Reed) 90,000 90,000
Payable to related parties There were no payables to related parties at the current and previous reporting date. Loans to/from related parties There were no loans to or from related parties at the current and previous reporting date. Terms and conditions Transactions with Directors and key management personnel have been entered into under terms and conditions no more favourable than those the entity would have adopted if dealing at arm’s length.
For
per
sona
l use
onl
y
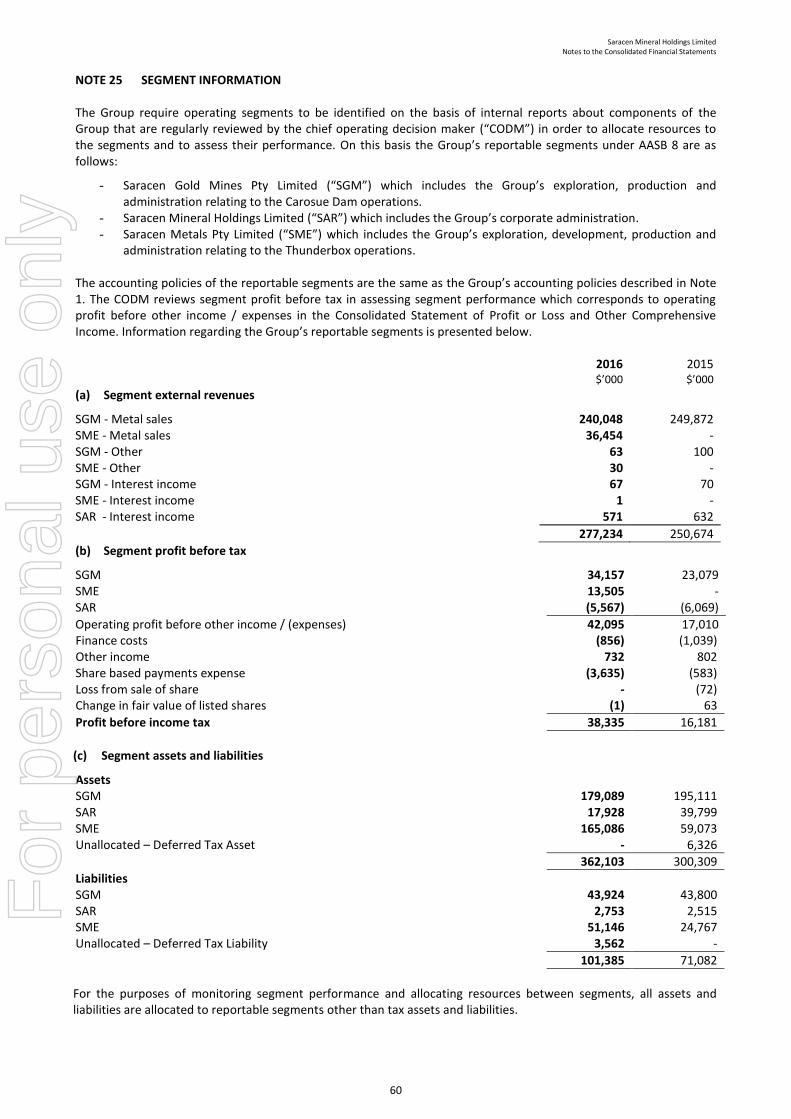
Saracen Mineral Holdings Limited Notes to the Consolidated Financial Statements
60
NOTE 25 SEGMENT INFORMATION The Group require operating segments to be identified on the basis of internal reports about components of the Group that are regularly reviewed by the chief operating decision maker (“CODM”) in order to allocate resources to the segments and to assess their performance. On this basis the Group’s reportable segments under AASB 8 are as follows:
- Saracen Gold Mines Pty Limited (“SGM”) which includes the Group’s exploration, production and administration relating to the Carosue Dam operations.
- Saracen Mineral Holdings Limited (“SAR”) which includes the Group’s corporate administration. - Saracen Metals Pty Limited (“SME”) which includes the Group’s exploration, development, production and
administration relating to the Thunderbox operations.
The accounting policies of the reportable segments are the same as the Group’s accounting policies described in Note 1. The CODM reviews segment profit before tax in assessing segment performance which corresponds to operating profit before other income / expenses in the Consolidated Statement of Profit or Loss and Other Comprehensive Income. Information regarding the Group’s reportable segments is presented below.
2016 $’000
2015 $’000
(a) Segment external revenues
SGM - Metal sales 240,048 249,872 SME - Metal sales 36,454 - SGM - Other 63 100 SME - Other 30 - SGM - Interest income 67 70 SME - Interest income 1 - SAR - Interest income 571 632
277,234 250,674
(b) Segment profit before tax
SGM 34,157 23,079 SME 13,505 - SAR (5,567) (6,069)
Operating profit before other income / (expenses) 42,095 17,010 Finance costs (856) (1,039) Other income 732 802 Share based payments expense (3,635) (583) Loss from sale of share - (72) Change in fair value of listed shares (1) 63
Profit before income tax 38,335 16,181
(c) Segment assets and liabilities
Assets SGM 179,089 195,111 SAR 17,928 39,799 SME 165,086 59,073 Unallocated – Deferred Tax Asset - 6,326
362,103 300,309
Liabilities SGM 43,924 43,800 SAR 2,753 2,515 SME 51,146 24,767 Unallocated – Deferred Tax Liability 3,562 -
101,385 71,082
For the purposes of monitoring segment performance and allocating resources between segments, all assets and liabilities are allocated to reportable segments other than tax assets and liabilities.
For
per
sona
l use
onl
y
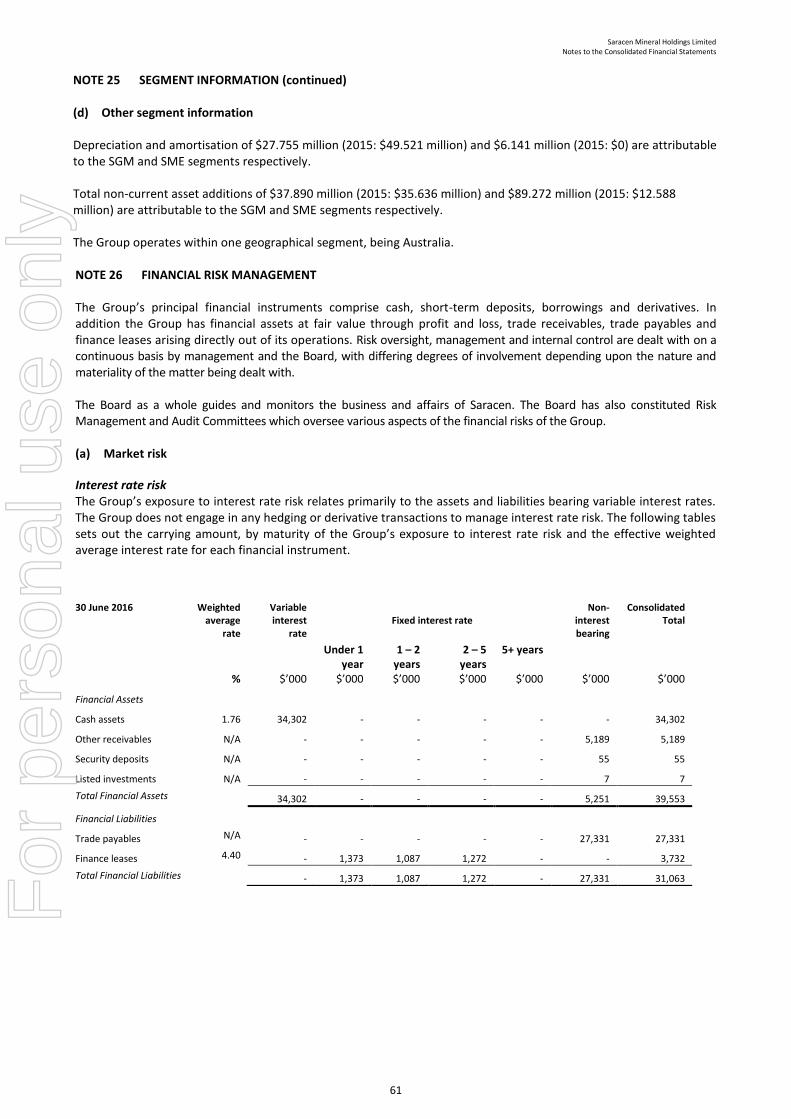
Saracen Mineral Holdings Limited Notes to the Consolidated Financial Statements
61
NOTE 25 SEGMENT INFORMATION (continued) (d) Other segment information Depreciation and amortisation of $27.755 million (2015: $49.521 million) and $6.141 million (2015: $0) are attributable to the SGM and SME segments respectively. Total non-current asset additions of $37.890 million (2015: $35.636 million) and $89.272 million (2015: $12.588 million) are attributable to the SGM and SME segments respectively. The Group operates within one geographical segment, being Australia. NOTE 26 FINANCIAL RISK MANAGEMENT The Group’s principal financial instruments comprise cash, short-term deposits, borrowings and derivatives. In addition the Group has financial assets at fair value through profit and loss, trade receivables, trade payables and finance leases arising directly out of its operations. Risk oversight, management and internal control are dealt with on a continuous basis by management and the Board, with differing degrees of involvement depending upon the nature and materiality of the matter being dealt with. The Board as a whole guides and monitors the business and affairs of Saracen. The Board has also constituted Risk Management and Audit Committees which oversee various aspects of the financial risks of the Group. (a) Market risk
Interest rate risk The Group’s exposure to interest rate risk relates primarily to the assets and liabilities bearing variable interest rates. The Group does not engage in any hedging or derivative transactions to manage interest rate risk. The following tables sets out the carrying amount, by maturity of the Group’s exposure to interest rate risk and the effective weighted average interest rate for each financial instrument.
30 June 2016 Weighted average
rate
Variable interest
rate
Fixed interest rate
Non- interest bearing
Consolidated Total
%
$’000
Under 1 year
$’000
1 – 2 years $’000
2 – 5 years $’000
5+ years
$’000
$’000 $’000
Financial Assets
Cash assets 1.76 34,302 - - - - - 34,302
Other receivables N/A - - - - - 5,189 5,189
Security deposits N/A - - - - - 55 55
Listed investments N/A - - - - - 7 7
Total Financial Assets 34,302 - - - - 5,251 39,553
Financial Liabilities
Trade payables N/A - - - - - 27,331 27,331
Finance leases 4.40 - 1,373 1,087 1,272 - - 3,732
Total Financial Liabilities - 1,373 1,087 1,272 - 27,331 31,063 For
per
sona
l use
onl
y
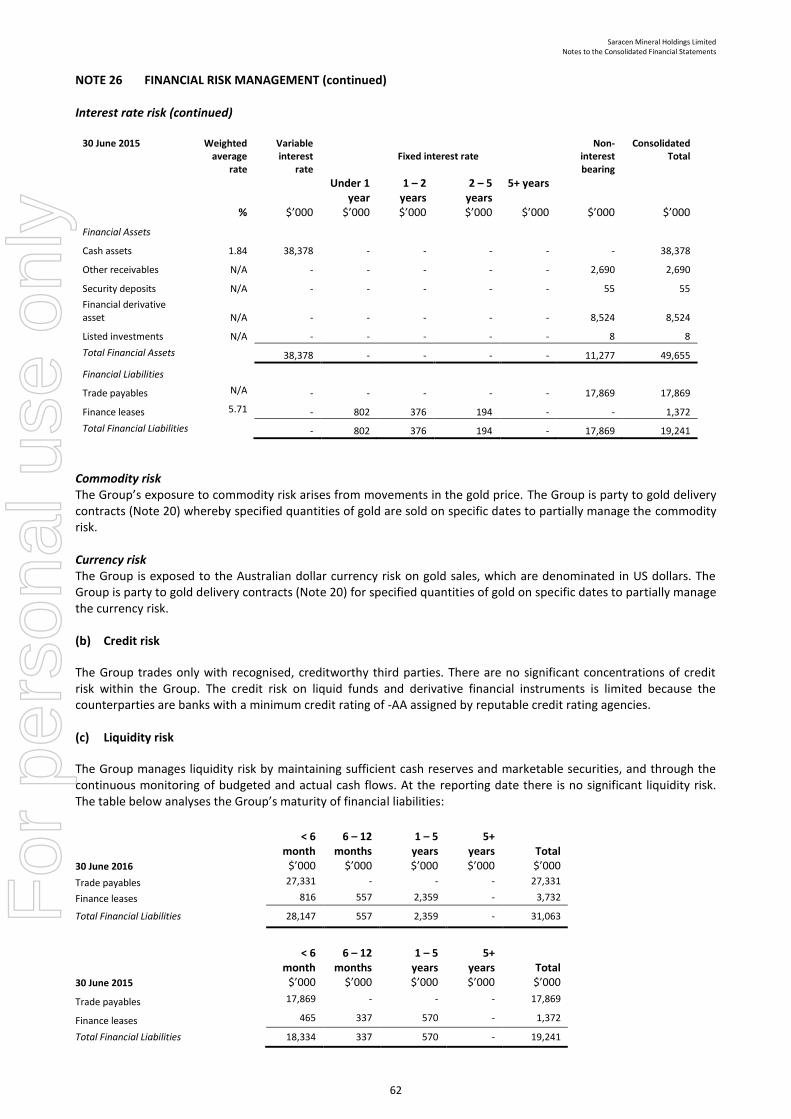
Saracen Mineral Holdings Limited Notes to the Consolidated Financial Statements
62
NOTE 26 FINANCIAL RISK MANAGEMENT (continued)
Interest rate risk (continued)
30 June 2015 Weighted average
rate
Variable interest
rate
Fixed interest rate
Non- interest bearing
Consolidated Total
%
$’000
Under 1 year
$’000
1 – 2 years $’000
2 – 5 years $’000
5+ years
$’000
$’000 $’000
Financial Assets
Cash assets 1.84 38,378 - - - - - 38,378
Other receivables N/A - - - - - 2,690 2,690
Security deposits N/A - - - - - 55 55
Financial derivative asset N/A - - - - - 8,524 8,524
Listed investments N/A - - - - - 8 8
Total Financial Assets 38,378 - - - - 11,277 49,655
Financial Liabilities
Trade payables N/A - - - - - 17,869 17,869
Finance leases 5.71 - 802 376 194 - - 1,372
Total Financial Liabilities - 802 376 194 - 17,869 19,241
Commodity risk The Group’s exposure to commodity risk arises from movements in the gold price. The Group is party to gold delivery contracts (Note 20) whereby specified quantities of gold are sold on specific dates to partially manage the commodity risk.
Currency risk The Group is exposed to the Australian dollar currency risk on gold sales, which are denominated in US dollars. The Group is party to gold delivery contracts (Note 20) for specified quantities of gold on specific dates to partially manage the currency risk. (b) Credit risk
The Group trades only with recognised, creditworthy third parties. There are no significant concentrations of credit risk within the Group. The credit risk on liquid funds and derivative financial instruments is limited because the counterparties are banks with a minimum credit rating of -AA assigned by reputable credit rating agencies. (c) Liquidity risk
The Group manages liquidity risk by maintaining sufficient cash reserves and marketable securities, and through the continuous monitoring of budgeted and actual cash flows. At the reporting date there is no significant liquidity risk. The table below analyses the Group’s maturity of financial liabilities:
30 June 2016
< 6 month
$’000
6 – 12 months
$’000
1 – 5 years $’000
5+ years $’000
Total $’000
Trade payables 27,331 - - - 27,331
Finance leases 816 557 2,359 - 3,732
Total Financial Liabilities 28,147 557 2,359 - 31,063
30 June 2015
< 6 month
$’000
6 – 12 months
$’000
1 – 5 years $’000
5+ years $’000
Total $’000
Trade payables 17,869 - - - 17,869
Finance leases 465 337 570 - 1,372
Total Financial Liabilities 18,334 337 570 - 19,241
For
per
sona
l use
onl
y
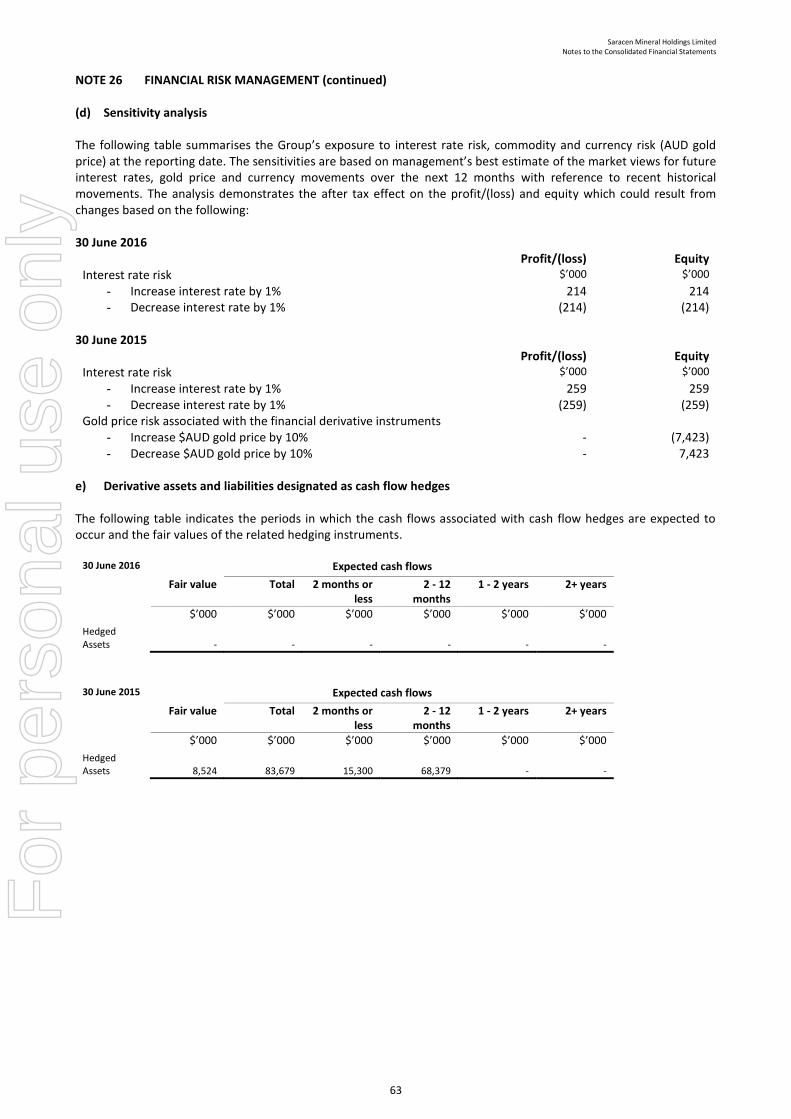
Saracen Mineral Holdings Limited Notes to the Consolidated Financial Statements
63
NOTE 26 FINANCIAL RISK MANAGEMENT (continued) (d) Sensitivity analysis The following table summarises the Group’s exposure to interest rate risk, commodity and currency risk (AUD gold price) at the reporting date. The sensitivities are based on management’s best estimate of the market views for future interest rates, gold price and currency movements over the next 12 months with reference to recent historical movements. The analysis demonstrates the after tax effect on the profit/(loss) and equity which could result from changes based on the following: 30 June 2016
Interest rate risk
Profit/(loss) $’000
Equity $’000
- Increase interest rate by 1% 214 214 - Decrease interest rate by 1% (214) (214)
30 June 2015
Interest rate risk
Profit/(loss) $’000
Equity $’000
- Increase interest rate by 1% 259 259 - Decrease interest rate by 1% (259) (259)
Gold price risk associated with the financial derivative instruments - Increase $AUD gold price by 10% - (7,423) - Decrease $AUD gold price by 10% - 7,423
e) Derivative assets and liabilities designated as cash flow hedges The following table indicates the periods in which the cash flows associated with cash flow hedges are expected to occur and the fair values of the related hedging instruments.
30 June 2016 Expected cash flows
Fair value Total 2 months or less
2 - 12 months
1 - 2 years 2+ years
$’000 $’000 $’000 $’000 $’000 $’000
Hedged Assets - - - - - -
30 June 2015 Expected cash flows
Fair value Total 2 months or less
2 - 12 months
1 - 2 years 2+ years
$’000 $’000 $’000 $’000 $’000 $’000
Hedged Assets 8,524 83,679 15,300 68,379 - -
For
per
sona
l use
onl
y
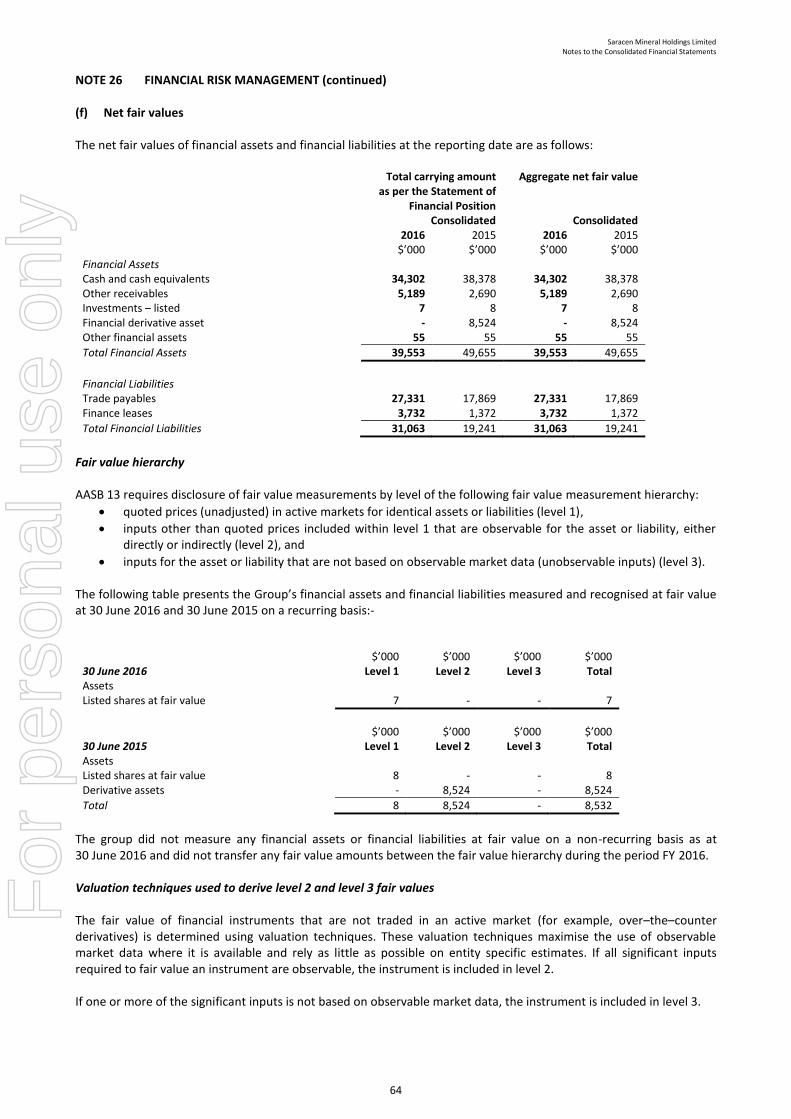
Saracen Mineral Holdings Limited Notes to the Consolidated Financial Statements
64
NOTE 26 FINANCIAL RISK MANAGEMENT (continued) (f) Net fair values The net fair values of financial assets and financial liabilities at the reporting date are as follows:
Total carrying amount as per the Statement of
Financial Position
Aggregate net fair value
Consolidated Consolidated 2016
$’000 2015
$’000 2016
$’000 2015
$’000 Financial Assets Cash and cash equivalents 34,302 38,378 34,302 38,378 Other receivables 5,189 2,690 5,189 2,690 Investments – listed 7 8 7 8 Financial derivative asset - 8,524 - 8,524 Other financial assets 55 55 55 55
Total Financial Assets 39,553 49,655 39,553 49,655
Financial Liabilities Trade payables 27,331 17,869 27,331 17,869 Finance leases 3,732 1,372 3,732 1,372
Total Financial Liabilities 31,063 19,241 31,063 19,241
Fair value hierarchy AASB 13 requires disclosure of fair value measurements by level of the following fair value measurement hierarchy:
quoted prices (unadjusted) in active markets for identical assets or liabilities (level 1),
inputs other than quoted prices included within level 1 that are observable for the asset or liability, either directly or indirectly (level 2), and
inputs for the asset or liability that are not based on observable market data (unobservable inputs) (level 3). The following table presents the Group’s financial assets and financial liabilities measured and recognised at fair value at 30 June 2016 and 30 June 2015 on a recurring basis:-
$’000
$’000
$’000
$’000
30 June 2016 Level 1 Level 2 Level 3 Total Assets Listed shares at fair value 7 - - 7
$’000
$’000
$’000
$’000
30 June 2015 Level 1 Level 2 Level 3 Total Assets Listed shares at fair value 8 - - 8 Derivative assets - 8,524 - 8,524
Total 8 8,524 - 8,532
The group did not measure any financial assets or financial liabilities at fair value on a non-recurring basis as at 30 June 2016 and did not transfer any fair value amounts between the fair value hierarchy during the period FY 2016. Valuation techniques used to derive level 2 and level 3 fair values The fair value of financial instruments that are not traded in an active market (for example, over–the–counter derivatives) is determined using valuation techniques. These valuation techniques maximise the use of observable market data where it is available and rely as little as possible on entity specific estimates. If all significant inputs required to fair value an instrument are observable, the instrument is included in level 2. If one or more of the significant inputs is not based on observable market data, the instrument is included in level 3.
For
per
sona
l use
onl
y
Saracen Mineral Holdings Limited Notes to the Consolidated Financial Statements
65
NOTE 26 FINANCIAL RISK MANAGEMENT (continued) Specific valuation techniques used to value financial instruments include:
The use of quoted market prices or dealer quotes for similar instruments.
Other techniques, such as discounted cash flow analysis, are used to determine fair value for the remaining financial instruments.
In the 2015 financial year and in accordance with AASB 13, Fair Value Measurement, the Group has classified, according to fair value hierarchy, the cash flow hedge as a level 2 asset. The fair value of the cash flow hedge was determined by using observable foreign exchange forward prices and the forward gold prices at the reporting date. The forward curves are derived using a combination of cash and futures prices. Cash flows are then net present valued using the derived forward curves. The contracts to which hedge accounting have been applied were all completed during the financial year therefore as at 30 June 2016 the hedge asset was zero and therefore does not have any level 2 assets or liabilities in 2016. The Group does not have any level 3 assets or liabilities. NOTE 27 CAPITAL MANAGEMENT Management’s objective is to ensure the Group continues as a going concern and in the interests of shareholders. It aims to maintain a capital structure with the lowest cost of capital available to the Group. The Group has detailed planning processes, budgets and cash flow forecasts through which it continually monitors its position against the above objectives. At 30 June 2016 the capital structure consisted of total shareholders’ funds, cash and other financial assets less finance lease borrowings. The Group’s overall strategy remains unchanged from 2015. NOTE 28 CONTINGENT LIABILITIES
There are no contingent liabilities at 30 June 2016 (2015: Nil). NOTE 29 MATTERS SUBSEQUENT TO THE REPORTING DATE There has not been any matter or circumstance, other than that referred to in the financial report that has arisen since the end of the financial year that has significantly affected, or may significantly affect, the operations of the Group, the results of those operations, or the state of affairs of the Group.
For
per
sona
l use
onl
y
Saracen Minerals Holdings Limited Directors Declaration
66
Directors’ Declaration The Directors of Saracen Mineral Holdings Limited declare that, in their opinion:
(a) the financial statements and notes and the Remuneration Report in the Directors’ Report set out on pages 12 to 25, are in accordance with the Corporations Act 2001, including:
(i) giving a true and fair view of the Group’s financial position as at 30 June 2016 and of its performance, for the financial year ended on that date; and
(ii) complying with Australian Accounting Standards (including the Australian Accounting Interpretations) and Corporations Regulations 2001 and other mandatory professional reporting requirements.
(b) the financial report also complies with International Financial Reporting Standards issued by the International
Accounting Standards Board (IASB) as disclosed in Note 1(b); and
(c) there are reasonable grounds to believe that the Company will be able to pay its debts as and when they become due and payable.
At the date of this declaration there are reasonable grounds to believe that the Company and the group entities identified in Note 22 will be able to meet any obligations or liabilities to which they are or may have become subject to by virtue of the Deed of Cross Guarantee between the Company and those group entities pursuant to ASIC Class Order 98/1418. The directors have been given the declarations required by Section 295A of the Corporations Act 2001 by the chief executive officer and chief financial officer for the financial year ended 30 June 2016. Signed in accordance with a resolution of the directors. RALEIGH FINLAYSON Managing Director 25 August 2016
For
per
sona
l use
onl
y
BDO Audit (WA) Pty Ltd ABN 79 112 284 787 is a member of a national association of independent entities which are all members of BDO Australia Ltd ABN 77 050 110 275,an Australian company limited by guarantee. BDO Audit (WA) Pty Ltd and BDO Australia Ltd are members of BDO International Ltd, a UK company limited by guarantee, andform part of the international BDO network of independent member firms. Liability limited by a scheme approved under Professional Standards Legislation other than forthe acts or omissions of financial services licensees
38 Station StreetSubiaco, WA 6008PO Box 700 West Perth WA 6872Australia
Tel: +61 8 6382 4600Fax: +61 8 6382 4601www.bdo.com.au
INDEPENDENT AUDITOR'S REPORT
To the members of Saracen Mineral Holdings Limited
Report on the Audit of the Financial Report
Opinion
We have audited the financial report of Saracen Mineral Holdings Limited (the Company), including its subsidiaries (the Group), which comprises the consolidated statement of financial position as at 30 June 2016, the consolidated statement of comprehensive income, the consolidated statement of changes in equity and the consolidated statement of cash flows for the year then ended, notes comprising a summary of significant accounting policies and other explanatory information, and the directors’ declaration of the Company.
In our opinion:
(a) the accompanying financial report of Saracen Mineral Holdings Limited is in accordance with theCorporations Act 2001, including:
(i) giving a true and fair view of the Group’s consolidated financial position as at 30 June 2016and of its consolidated financial performance for the year ended on that date; and
(ii) complying with Australian Accounting Standards and the Corporations Regulations 2001; and
(b) the financial report also complies with International Financial Reporting Standards as disclosed inNote 1(b).
Basis for opinion
We conducted our audit in accordance with Australian Auditing Standards. Our responsibilities underthose standards are further described in the Auditor’s responsibilities for the audit of the FinancialReport section of our report. We are independent of the Group in accordance with the CorporationsAct 2001 and the ethical requirements of the Accounting Professional and Ethical Standards Board’sAPES 110 Code of Ethics for Professional Accountants (the Code) that are relevant to our audit of thefinancial report in Australia. We have also fulfilled our other ethical responsibilities in accordancewith the Code.
We confirm that the independence declaration required by the Corporations Act 2001, which has beengiven to the directors of Saracen Mineral Holdings Limited, would be in the same terms if given to thedirectors as at the time of this auditor’s report.
We believe that the audit evidence we have obtained is sufficient and appropriate to provide a basisfor our opinion.
Key audit matters
Key audit matters are those matters that, in our professional judgement, were of most significance inour audit of the financial report of the current period. These matters were addressed in the context ofour audit of the financial report as a whole, and in forming our opinion thereon, and we do not providea separate opinion on these matters.
For
per
sona
l use
onl
y
Provision for rehabilitation
As at 30 June 2016, the carrying value of the Group’s provision for rehabilitation was $57.893 million.
The Group’s provision for rehabilitation as disclosed in Note 1(u) and 17 is material to our audit, andrequires significant estimates of future costs.
The determination of the provision requires management’s judgement in relation to estimating thecosts of performing the work required, including volume and unit rates, the timing of cash flows andthe appropriate discount rate.
We assessed the competence and objectivity of the expert used by management in the preparation ofthe cost models.
We evaluated management’s cost model for each mine, and critically challenged the key estimates andassumptions made in the models. We also assessed the expected timing of the rehabilitation to therespective life of mine (‘LoM’) models and assessed the reasonableness of the discount rate applied tothe expected cash flows.
We performed a sensitivity analysis on the key estimates and assumptions in the cost models.
Our testing included comparison of a sample of unit rates included in the cost models to supportingdocumentation including current contracts.
Carrying value of ore stocks and mine properties (mines in production)
Ore stocks
As at 30 June 2016, the carrying value of the Group’s ore stocks was $12.318 million, as disclosed inNote 9.
The carrying value of ore stocks is a significant area of judgement by management as detailed in Note1(n), including determining estimates of future gold prices, future processing costs, ore grades, volumeand density.
In respect to the ore stocks valuations, we considered the appropriateness of the Group’s accountingpolicy and application. We considered the methodology applied by management to record allappropriate costs into the inventory model and management’s calculation of net recoverable value(‘NRV’).
We agreed the ore grades, volume and density included in the model as at 30 June 2016 to technicalreports. We assessed the competence and objectivity of the expert used by management for thepreparation of the technical reports.
We also evaluated the inputs and process undertaken by the expert in preparing the technical reports.
To verify existence of ore stocks at year end, we observed the surveying process and procedures atThunderbox at 30 June 2016 as part of our site visit. We then agreed the ore volumes surveyed andrecorded at site to the volumes included in the inventory model.
In relation to NRV, our testing included comparison of the future gold prices to current gold price data,market consensus and trends and we also critically assessed the expected processing and selling costs(i.e. royalties) to actual rates during the year.
For
per
sona
l use
onl
y
Mine properties (mines in production)
As part of the Group’s carrying value of mines in production of $70.088 million, amortisation representsan area of significant judgement within the financial statements as detailed in Note 1(t) and 15. TheGroup applies the units of production amortisation policy, which involves judgement in determining theappropriate ore reserve estimation attributable to each mine and the cost allocation to each mine.
In respect of the Group’s amortisation calculations on mine properties (mines in production), weevaluated the Group’s amortisation policy in accordance with Australian Accounting Standards and itsconsistent application. As part of this process, we agreed the amortisation rate inputs to supportinginformation, including LoM models, and reserve estimation statements.
We also assessed the competency and objectivity of the expert used by management in compiling thereserve estimation statements.
In relation to the substantial capitalisation of expenditure during the year to mine properties, weperformed detailed testing, including verifying the authorisation, accuracy and completeness of therecording and classification of capital expenditure. Where expenditure was allocated across variousmines, we critically assessed management’s basis for this allocation.
We also critically evaluated management’s assessment that there were no impairment indicatorsidentified in relation to all mine properties which would require impairment testing to be performed.
Carrying value of the deferred stripping asset
As at 30 June 2016, the carrying value of the Group’s deferred stripping asset, as included in mineproperties, was $5.774 million, as disclosed in Note 15.
The recognition and measurement of the asset requires significant management judgement, as detailedin Note 1(t), which includes determining the date of commercial production, identification ofcomponents within the ore body, estimation of the components’ LoM average stripping ratio, theallocation of mining costs to the stripping activity and the amortisation methodology to be applied tothe asset.
We assessed whether the stripping activity asset accounting policy adopted by management in respectto production stripping complies with the relevant accounting interpretation, IFRIC 20: Stripping Costsin the Production Phase of a Surface Mine (‘IFRIC 20’), including satisfying the recognitioncriteria. Under this interpretation a deferred stripping asset can be recognised when the followingcriteria are met; it is probable that future economic benefits associated with the stripping activity willflow to the Group, the component of the ore body can be identified, and the cost relating to thestripping activity can be measured reliably.
We evaluated management’s assessment in determining the date of commercial production as well asthe identification of separate components within the Thunderbox ore body. We compared thisassessment to recent mining public announcements and respective LoM models for consistency.
We assessed management’s calculation of the stripping asset based on actual stripping ratios fromtechnical reports and compared this data to the average stripping ratio per the LoM model.
We also challenged management’s amortisation methodology and evaluated the application of thispolicy in accordance with the accounting interpretation, IFRIC 20.
For
per
sona
l use
onl
y
As part of our testing we also assessed the competency and objectivity of the expert used bymanagement in the preparation of the technical reports.
Other information
The directors are responsible for the other information. The other information comprises theinformation contained in the 2016 Financial Year Results (but does not include the financial report andour auditor’s report thereon), which we obtained prior to the date of this auditor’s report, and theAnnual report to Shareholders, which is expected to be made available to us after that date.
Our opinion on the financial report does not cover the other information and accordingly we do not andwill not express any form of assurance conclusion thereon.
In connection with our audit of the financial report, our responsibility is to read the other informationidentified above and, in doing so, consider whether the other information is materially inconsistentwith the financial report or our knowledge obtained in the audit, or otherwise appears to be materiallymisstated.
If, based on the work we have performed on the other information that we obtained prior to the dateof this auditor’s report, we conclude that there is a material misstatement of this other information,we are required to report that fact. We have nothing to report in this regard.
When we read the Annual report to Shareholders, if we conclude that there is a material misstatementtherein, we are required to communicate the matter to the directors, and will request that it iscorrected. If it is not corrected, we will seek to have the matter appropriately brought to the attentionof users for whom our report is prepared.
Responsibilities of the Directors of the Financial Report
The directors of the Company are responsible for the preparation of the financial report that gives atrue and fair view in accordance with Australian Accounting Standards and the Corporations Act 2001and for such internal control as the directors determine is necessary to enable the preparation of thefinancial report that gives a true and fair view and is free from material misstatement, whether due tofraud or error.
In preparing the financial report, the directors are responsible for assessing the Group’s ability tocontinue as a going concern, disclosing, as applicable, matters related to going concern and using thegoing concern basis of accounting unless the directors either intend to liquidate the Group or to ceaseoperations, or has no realistic alternative but to do so.
Auditor’s responsibilities for the audit of the Financial Report
Our objectives are to obtain reasonable assurance about whether the financial report as a whole is freefrom material misstatement, whether due to fraud or error, and to issue an auditor’s report thatincludes our opinion. Reasonable assurance is a high level of assurance, but is not a guarantee that anaudit conducted in accordance with the Australian Auditing Standards will always detect a materialmisstatement when it exists. Misstatements can arise from fraud or error and are considered materialif, individually or in the aggregate, they could reasonably be expected to influence the economicdecisions of users taken on the basis of this financial report.
A further description of our responsibilities for the audit of the financial report is included in appendix1. This description forms part of our auditor’s report.
For
per
sona
l use
onl
y
Report on the Remuneration Report
Opinion on the Remuneration Report
We have audited the Remuneration Report included in pages 12 to 25 of the directors’ report for theyear ended 30 June 2016.
In our opinion, the Remuneration Report of Saracen Mineral Holdings Limited, for the year ended 30June 2016, complies with section 300A of the Corporations Act 2001.
Responsibilities
The directors of the Company are responsible for the preparation and presentation of theRemuneration Report in accordance with section 300A of the Corporations Act 2001. Our responsibilityis to express an opinion on the Remuneration Report, based on our audit conducted in accordance withAustralian Auditing Standards.
BDO Audit (WA) Pty Ltd
Phillip Murdoch
Director
Perth, 25 August 2016
For
per
sona
l use
onl
y
BDO Audit (WA) Pty Ltd ABN 79 112 284 787 is a member of a national association of independent entities which are all members of BDO Australia Ltd ABN 77 050 110 275,an Australian company limited by guarantee. BDO Audit (WA) Pty Ltd and BDO Australia Ltd are members of BDO International Ltd, a UK company limited by guarantee, andform part of the international BDO network of independent member firms. Liability limited by a scheme approved under Professional Standards Legislation other than forthe acts or omissions of financial services licensees
Tel: +61 8 6382 4600Fax: +61 8 6382 4601www.bdo.com.au
38 Station StreetSubiaco, WA 6008PO Box 700 West Perth WA 6872Australia
Appendix 1 – Additional information on the Auditor’s responsibilities for the audit of the FinancialReport
As part of an audit in accordance with the Australian Auditing Standards, we exercise professionaljudgement and maintain professional scepticism throughout the audit. We also:
• Identify and assess the risks of material misstatement of the financial report, whether due to fraudor error, design and perform audit procedures responsive to those risks, and obtain audit evidencethat is sufficient and appropriate to provide a basis for our opinion. The risk of not detecting amaterial misstatement resulting from fraud is higher than for one resulting from error, as fraudmay involve collusion, forgery, intentional omissions, misrepresentations, or the override ofinternal control.
• Obtain an understanding of internal control relevant to the audit in order to design auditprocedures that are appropriate in the circumstances, but not for the purpose of expressing anopinion on the effectiveness of the Group’s internal control.
• Evaluate the appropriateness of accounting policies used and the reasonableness ofaccounting estimates and related disclosures made by the directors.
• Conclude on the appropriateness of the directors’ use of the going concern basis of accountingand, based on the audit evidence obtained, whether a material uncertainty exists related toevents or conditions that may cast significant doubt on the Group’s ability to continue as a goingconcern. If we conclude that a material uncertainty exists, we are required to draw attention inour auditor’s report to the related disclosures in the financial report or, if such disclosures areinadequate, to modify our opinion. Our conclusions are based on the audit evidence obtained upto the date of our auditor’s report. However, future events or conditions may cause the Group tocease to continue as a going concern.
• Evaluate the overall presentation, structure and content of the financial report, including thedisclosures, and whether the financial report represents the underlying transactions and events ina manner that achieves fair presentation.
• Obtain sufficient appropriate audit evidence regarding the financial information of the entities orbusiness activities within the Group to express an opinion on the financial report. We areresponsible for the direction, supervision and performance of the Group audit. We remain solelyresponsible for the audit opinion.
We communicate with the directors regarding, among other matters, the planned scope and timing ofthe audit and significant audit findings, including any significant deficiencies in internal control thatwe identify during our audit.
We also provide the directors with a statement that we have complied with relevant ethicalrequirements regarding independence, and to communicate with them all relationships and othermatters that may reasonably be thought to bear on our independence, and where applicable, relatedsafeguards.
From the matters communicated with the directors, we determine those matters that were of mostsignificance in the audit of the financial report of the current period and are therefore the key auditmatters. We describe these matters in our auditor’s report unless law or regulation precludes publicdisclosure about the matter or when, in extremely rare circumstances, we determine that a mattershould not be communicated in our report because the adverse consequences of doing so wouldreasonably be expected to outweigh the public interest benefits of such communication.
For
per
sona
l use
onl
y