Embed Size (px)
Citation preview
FINANCIAL SUMMARY
(All financial information has been prepared in accordance with accounting principles generally accepted in the United States of America)
FY2006 Semi -Annua l
(April 1, 2005 through September 30, 2005)
English translation from the original Japanese-language document
TOYOTA MOTOR CORPORATION
Cautionary Statement with Respect to Forward-Looking Statements
This report contains forward-looking statements that reflect Toyota’s plans and expectations. These forward-looking
statements are not guarantees of future performance and involve known and unknown risks, uncertainties and other factors that
may cause Toyota’s actual results, performance, achievements or financial position to be materially different from any future
results, performance, achievements or financial position expressed or implied by these forward-looking statements. These factors
include: (i) changes in economic conditions and market demand affecting, and the competitive environment in, the automotive
markets in Japan, North America, Europe and other markets in which Toyota operates; (ii) fluctuations in currency exchange rates,
particularly with respect to the value of the Japanese yen, the U.S. dollar, the Euro, the Australian dollar and the British pound;
(iii) Toyota’s ability to realize production efficiencies and to implement capital expenditures at the levels and times planned by
management; (iv) changes in the laws, regulations and government policies in the markets in which Toyota operates that affect
Toyota’s automotive operations, particularly laws, regulations and policies relating to trade, environmental protection, vehicle
emissions, vehicle fuel economy and vehicle safety, as well as changes in laws, regulations and government policies that affect
Toyota’s other operations, including the outcome of future litigation and other legal proceedings; (v) political instability in the
markets in which Toyota operates; (vi) Toyota’s ability to timely develop and achieve market acceptance of new products; and
(vii) fuel shortages or interruptions in transportation systems, labor strikes, work stoppages or other interruptions to, or difficulties
in, the employment of labor in the major markets where Toyota purchases materials, components and supplies for the production
of its products or where its products are produced, distributed or sold.
A discussion of these and other factors which may affect Toyota’s actual results, performance, achievements or financial
position is contained in Toyota’s annual report on Form 20-F, which is on file with the United States Securities and Exchange
Commission.
This report contains summarized and condensed financial statements prepared in accordance with accounting principles
generally accepted in the United States of America.
Consolidated 1
OVERVIEW OF ASSOCIATED COMPANIES (All financial information has been prepared in accordance with accounting principles generally accepted in the United States of America)
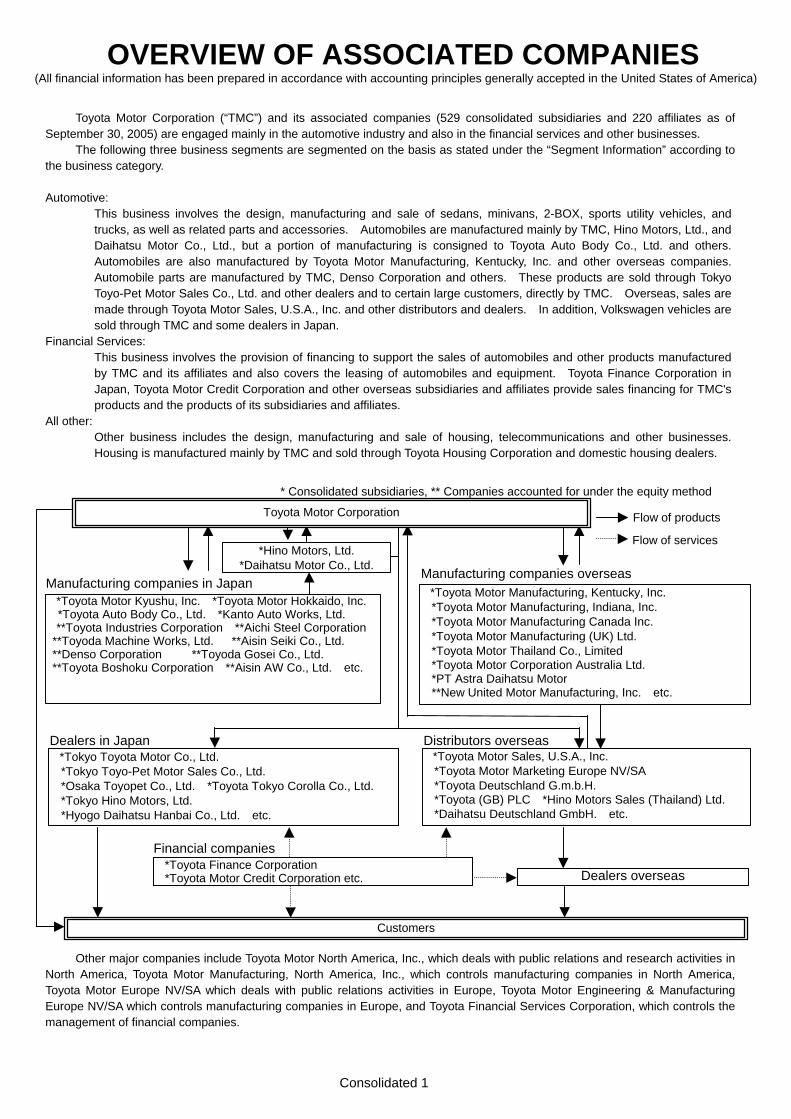
Toyota Motor Corporation (“TMC”) and its associated companies (529 consolidated subsidiaries and 220 affiliates as of
September 30, 2005) are engaged mainly in the automotive industry and also in the financial services and other businesses. The following three business segments are segmented on the basis as stated under the “Segment Information” according to
the business category.
Automotive: This business involves the design, manufacturing and sale of sedans, minivans, 2-BOX, sports utility vehicles, and trucks, as well as related parts and accessories. Automobiles are manufactured mainly by TMC, Hino Motors, Ltd., and Daihatsu Motor Co., Ltd., but a portion of manufacturing is consigned to Toyota Auto Body Co., Ltd. and others. Automobiles are also manufactured by Toyota Motor Manufacturing, Kentucky, Inc. and other overseas companies. Automobile parts are manufactured by TMC, Denso Corporation and others. These products are sold through Tokyo Toyo-Pet Motor Sales Co., Ltd. and other dealers and to certain large customers, directly by TMC. Overseas, sales are made through Toyota Motor Sales, U.S.A., Inc. and other distributors and dealers. In addition, Volkswagen vehicles are sold through TMC and some dealers in Japan.
Financial Services: This business involves the provision of financing to support the sales of automobiles and other products manufactured by TMC and its affiliates and also covers the leasing of automobiles and equipment. Toyota Finance Corporation in Japan, Toyota Motor Credit Corporation and other overseas subsidiaries and affiliates provide sales financing for TMC's products and the products of its subsidiaries and affiliates.
All other: Other business includes the design, manufacturing and sale of housing, telecommunications and other businesses. Housing is manufactured mainly by TMC and sold through Toyota Housing Corporation and domestic housing dealers.
Other major companies include Toyota Motor North America, Inc., which deals with public relations and research activities in
North America, Toyota Motor Manufacturing, North America, Inc., which controls manufacturing companies in North America, Toyota Motor Europe NV/SA which deals with public relations activities in Europe, Toyota Motor Engineering & Manufacturing Europe NV/SA which controls manufacturing companies in Europe, and Toyota Financial Services Corporation, which controls the management of financial companies.
Flow of services
Flow of products
*Hino Motors, Ltd. *Daihatsu Motor Co., Ltd.
Manufacturing companies in Japan *Toyota Motor Kyushu, Inc. *Toyota Motor Hokkaido, Inc. *Toyota Auto Body Co., Ltd. *Kanto Auto Works, Ltd. **Toyota Industries Corporation **Aichi Steel Corporation
**Toyoda Machine Works, Ltd. **Aisin Seiki Co., Ltd. **Denso Corporation **Toyoda Gosei Co., Ltd. **Toyota Boshoku Corporation **Aisin AW Co., Ltd. etc.
Manufacturing companies overseas *Toyota Motor Manufacturing, Kentucky, Inc. *Toyota Motor Manufacturing, Indiana, Inc. *Toyota Motor Manufacturing Canada Inc. *Toyota Motor Manufacturing (UK) Ltd. *Toyota Motor Thailand Co., Limited *Toyota Motor Corporation Australia Ltd. *PT Astra Daihatsu Motor **New United Motor Manufacturing, Inc. etc.
Dealers in Japan Distributors overseas*Tokyo Toyota Motor Co., Ltd. *Tokyo Toyo-Pet Motor Sales Co., Ltd. *Osaka Toyopet Co., Ltd. *Toyota Tokyo Corolla Co., Ltd. *Tokyo Hino Motors, Ltd. *Hyogo Daihatsu Hanbai Co., Ltd. etc.
*Toyota Motor Sales, U.S.A., Inc. *Toyota Motor Marketing Europe NV/SA *Toyota Deutschland G.m.b.H. *Toyota (GB) PLC *Hino Motors Sales (Thailand) Ltd. *Daihatsu Deutschland GmbH. etc.
Financial companies *Toyota Finance Corporation *Toyota Motor Credit Corporation etc. Dealers overseas
Toyota Motor Corporation * Consolidated subsidiaries, ** Companies accounted for under the equity method
Customers
Consolidated 2
(All financial information has been prepared in accordance with accounting principles generally accepted in the United States of America)
<Overview of Changes in Major Associated Companies>
For FY2006 semi-annual, there is no change in our major associated companies.
Toyota Motor Europe NV/SA and Toyota Motor Engineering & Manufacturing Europe NV/SA both of which were consolidated subsidiaries of TMC as of September 30, 2005, merged into Toyota Motor Marketing Europe NV/SA, which is also a consolidated subsidiary of TMC, as of October 1, 2005. Toyota Motor Marketing Europe NV/SA changed its trade name to Toyota Motor Europe NV/SA as of the effective day of the merger.
Consolidated 3
MANAGEMENT POLICY (All financial information has been prepared in accordance with accounting principles generally accepted in the United States of America)
1. Toyota’s Basic Management Policy
Toyota Motor Corporation (“TMC”) holds up the “Guiding Principles at Toyota Motor Corporation”
as its basic management policy and believes that efforts to achieve the goals set forth in the principles will lead to an increase in shareholder value. The “Guiding Principles at Toyota Motor Corporation” are as follows:
(1) Honor the language and spirit of the law of every nation and undertake open and fair corporate
activities to be a good corporate citizen of the world. (2) Respect the culture and customs of every nation and contribute to economic and social
development through corporate activities in the communities. (3) Dedicate ourselves to providing clean and safe products and to enhancing the quality of life
everywhere through all our activities. (4) Create and develop advanced technologies and provide outstanding products and services that
fulfill the needs of customers worldwide. (5) Foster a corporate culture that enhances individual creativity and teamwork value, while
honoring mutual trust and respect between labor and management. (6) Pursue growth in harmony with the global community through innovative management. (7) Work with business partners in research and creation to achieve stable, long-term growth and
mutual benefits, while keeping ourselves open to new partnerships.
2. Basic Policy on the Distribution of Profits TMC deems the benefit of its shareholders as one of its priority management policies and strives to
continuously increase per-share earnings, through promoting its business aggressively while improving and strengthening its corporate foundations.
With respect to the payment of dividends, TMC seeks to enhance the distribution of profits by striving to raise the consolidated dividend payout ratio to progressively higher levels, while giving due consideration to factors such as the business results of each term and new investment plans. Furthermore, we are acquiring treasury stock to improve capital efficiency and to be able to respond appropriately to changes in the business environment.
As we anticipate the continued growth in worldwide automotive markets, we will utilize our internal funds to invest in improvement of product performance and development of next-generation technologies to achieve future growth, to develop production and sales networks domestically and overseas for further expansion of our global business and to expand into new business areas, while securing solid management foundation.
3. Policy for the Granting of Stock Options and Other Incentive Plans
Currently, TMC maintains an incentive plan for granting stock options to our directors, managing
officers and senior managers, etc. Together with this plan, TMC also maintains an incentive plan for the executives of its overseas subsidiaries and affiliated companies.
TMC believes that these incentive plans will heighten their willingness and motivation to improve business performance in the medium- and long-term, enhance international competitiveness and profitability and contribute to increased shareholder value.
Consolidated 4
(All financial information has been prepared in accordance with accounting principles generally accepted in the United States of America)
4. Basic Policy on Corporate Governance and Status of Policy Implementation
TMC has positioned the stable long-term growth of shareholder value as a top-priority management issue. We believe that in carrying this out, it is essential that we achieve long-term and stable growth by building positive relationships with all stakeholders, including shareholders and customers as well as business partners, local communities and employees, and by supplying products that will satisfy our customers. This position is reflected in the “Guiding Principles at Toyota Motor Corporation”, which is a statement of Toyota’s fundamental business policies. To explain the Guiding Principles in greater detail, in January 2005, Toyota adopted and presented its statement, “Contribution towards Sustainable Development of the Society and The Earth” as the guideline to the “Guiding Principles at Toyota Motor Corporation”. We are working to enhance corporate governance through a variety of measures designed to further increase our competitiveness as a global company.
Specifically, TMC has introduced a new management system in June 2003, which features a streamlined board of directors with fewer members and the new position of managing officers who are responsible for specific operations. Under the new system, senior managing directors not only participate in the company’s overall management, but also serve as a link between management and operations by acting as the top managers of specific operations. TMC believes that the adoption of this system reflecting ideas of front-line operations, which has been one of the company’s strengths, will lead to a quick implementation of management decisions into operations, facilitate the incorporation of ideas from front-line operations within the company’s overall business strategies, and promote decision making that is close to front-line operations.
As a structure to ensure appropriate management, TMC holds a meeting of the International Advisory Board annually, which is comprised of experts outside Japan in order to receive advice concerning management issues from a global standpoint. Furthermore, councils and committees such as the “Labor-Management Council, Joint Labor-Management Round Table Conference”, “Corporate Philanthropy Committee” and “Stock Option Committee”, monitor and deliberate on management and corporate behavior from the viewpoint of various stakeholders.
In order to develop corporate ethics and to achieve thorough legal compliance, TMC has established “Corporate Ethics Committee” consisting of directors at the executive vice president level and above as well as representatives of corporate auditors, to review important issues relating to corporate ethics, legal compliance and risk management, and also to develop action plans concerning these issues. TMC has created a number of facilities for employees to make inquiries concerning compliance matters, including the Compliance Hotline, which enables them to consult with an outside attorney, and takes measures to ensure that TMC is aware of significant information concerning legal compliance as quickly as possible. TMC will continue to promote the “Code of Conduct for Toyota Employees” which is a guideline for employees’ behavior and conduct. TMC will work to advance corporate ethics through training and education at all levels and in all departments.
TMC has adopted a corporate auditor system, and four of the seven corporate auditors are outside auditors, to enhance the transparency of corporate conduct. Each auditor conducts audits in accordance with the audit policies and plans determined by the Board of Auditors, and plays an important role in corporate governance. With respect to internal audits, a specialized independent organization is working to enhance appropriate systems and verifies the effectiveness of internal controls over financial reporting. In order to enhance the reliability of the financial reporting of TMC, the three organizations performing these functions, namely, independent accountants, corporate auditors and internal auditors, have meetings periodically and as necessary to share information through discussion on audit plans and results that aids conducting an effective and efficient audits. The certified public accountants that conducted financial statement audits are Kazunori Tajima, Masaki Horie, Akihiko Nakamura, and Hitoshi Kiuchi of ChuoAoyama PricewaterhouseCoopers. Messrs. Tajima and Horie have each been auditing TMC’s financial statements for ten years, Mr. Nakamura for two years, and Mr. Kiuchi for one year. These periods of time include the period before the revisions to the Certified Public Accountant Law effective in June 2003. The number of assistants who worked in the financial statement audit for the current semi-annual period was 21 certified public accountants, 12 junior accountants, and one other.
To enhance accountability, Toyota established a Disclosure Committee in light of the U.S. Sarbanes-Oxley Act, and is working to further ensure the complete and fair disclosure of material information in the annual report on Form 20-F and securities reports.
TMC remains committed to the stable enhancement in shareholder value over the long-term by proposing and implementing its management strategies based on long-term perspectives.
Consolidated 5
(All financial information has been prepared in accordance with accounting principles generally accepted in the United States of America)
5. TMC’s Medium- and Long-term Management Strategy To continue its growth over the long-term, the Toyota Group will make combined efforts to address
the following agenda. TMC introduced the Lexus brand in Japan in August 2005, which is currently marketed in more
than 60 countries around the world. As an immediate agenda, we are currently working to establish Lexus as a global premium brand for the twenty-first century. Toyota has also started on a number of priority projects including the construction of new plants in the United States of America (Texas), Russia, and Thailand. In the rapidly growing Chinese market, where various auto manufactures are quickly expanding their operations, Toyota is developing integrated structures in conjunction with procurement, production, and sales.
Medium- to long-term strategies include, first of all, anticipating customer needs to continue providing appealing products that are highly advanced and innovative, and feature superior styling. Toyota also continues to focus on the development of vehicle safety technologies and their incorporation into products. Second, under the Fourth Toyota Environmental Action Plan, adopted as a medium- to long-term plan covering the period through 2010, Toyota is reinforcing and expanding on a global scale, its responses to issues including global warming, hazardous material management and recycling. Third, in addition to maintaining the world’s highest levels of quality and reinforcing cost competitiveness, Toyota is working to increase overall group capabilities, develop optimal global business structures and pursue compatibility between growth and efficiency. Finally, based on the idea that the source of corporate competitiveness is the development of talents of individuals, Toyota is promoting the development of highly creative personnel who can pass on Toyota’s technologies and skills to the next generation.
By addressing these agenda, Toyota will seek to increase shareholder value and work to become a company that can successfully compete on a global scale and continue to grow in the 21st century.
In addition we reaffirm our commitment to corporate ethics, including strict compliance with laws and regulations and seek to become a global corporation, that contributes to the development of a prosperous society with sincerity and humility, and which is trusted throughout the world.
Consolidated 6
BUSINESS RESULTS AND FINANCIAL POSITION (All financial information has been prepared in accordance with accounting principles generally accepted in the United States of America)
1. Summary of Consolidated Financial Results of FY2006 Semi-Annual
(1) Financial Results
During this semi-annual period, the Japanese economy made a moderate recovery as a result of improvements in corporate profits, and increase in capital expenditures and in consumer spending. Overseas, personal consumption in United States of America continues to grow steadily, despite concerns, including the effects of hurricanes and the rising price of crude oil. The economies in Europe and Asian countries also showed steady growth overall.
Under these conditions, total vehicle sales in Japan and overseas increased by 266 thousand units, or 7.5%, to 3,833 thousand units in FY2006 semi-annual results compared with FY2005 semi-annual results, marking a record high in semi-annual results. Vehicle sales in Japan decreased by 20 thousand units, or 1.8%, in FY2006 semi-annual results compared with FY2005 semi-annual results, but continued to maintain a high level of 1,086 thousand units due to the strong sales efforts of domestic dealers. Meanwhile, overseas vehicle sales increased substantially in all regions by 286 thousand units, or 11.6%, to 2,747 thousand units in FY2006 semi-annual results compared with FY2005 semi-annual results.
As for the results of operations for the FY2006 semi-annual period, net revenues increased by 927.5 billion yen, or 10.3%, to 9,953.1 billion yen in FY2006 semi-annual results compared with FY2005 semi-annual results, and operating income decreased by 56.8 billion yen, or 6.6%, to 809.4 billion yen in FY2006 semi-annual results compared with FY2005 semi-annual results. Among the factors contributing to the increase in operating income of 150.0 billion yen, marketing efforts accounted for 70.0 billion yen, cost reduction efforts for 60.0 billion yen, and the effects of changes in exchange rates for 20.0 billion yen. On the other hand, the factors resulting in the decrease in operating income mainly included a decrease in the gains recognized on transfer of the substitutional portion of the employee pension fund to the government of 9.1 billion yen and increases in expenses due to expansion of operations of 197.7 billion yen. Income before income taxes, minority interest and equity in earnings of affiliated companies was 855.9 billion yen and net income was 570.5 billion yen in FY2006 semi-annual results.
Consolidated 7
(All financial information has been prepared in accordance with accounting principles generally accepted in the United States of America)
(2) Cash Flows
Cash flows from operating activities resulted in an increase in cash by 1,339.4 billion yen in FY2006 semi-annual period, mainly due to net income of 570.5 billion yen. Net cash provided by operating activities decreased by 61.7 billion yen compared with an increase in cash by 1,401.1 billion yen in FY2005 semi-annual results. Cash flows from investing activities resulted in a decrease in cash by 1,650.7 billion yen in FY2006 semi-annual results, mainly due to the additions to finance receivables of 3,148.3 billion yen. Net cash used in investing activities in the FY2006 semi-annual results decreased by 142.7 billion yen compared with 1,793.4 billion yen of net cash used in investing activities in the FY 2005 semi-annual results. Cash flows from financing activities resulted in an increase in cash by 489.9 billion yen in FY2006 semi-annual results, mainly due to the proceeds from issuance of long-term debt of 875.7 billion yen. Net cash provided by financing activities increased by 338.4 billion yen compared with FY2005 semi-annual results. After consideration of the effect of exchange rate changes, cash and cash equivalents increased by 212.1 billion yen, or 14.3%, to 1,695.8 billion yen at the end of FY2006 semi-annual period compared with the end of FY2005.
Regarding the consolidated cash flows by segment for FY2006 semi-annual period, in non-financial services business, net cash provided by operating activities was 1,029.4 billion yen, net cash used in investing activities was 704.6 billion yen and net cash used in financing activities was 164.6 billion yen. Meanwhile, in the financial services business, net cash provided by operating activities was 253.2 billion yen, net cash used in investing activities was 898.6 billion yen and net cash provided by financing activities was 663.9 billion yen.
Cash flows from origination and collection activities of finance receivables relating to inventory-sales have been reclassified from investing activities to operating activities in our consolidated statements of cash flows from FY2005 annual period as well as our consolidated statements of cash flows of FY2006 semi-annual period, based on the concerns raised by the staff of the United States Securities and Exchange Commission. FY2005 semi-annual period amounts have been also reclassified to conform to the FY2005 annual and FY2006 semi-annual presentations. As a result of the reclassification made for FY2005 semi-annual, cash flows from operating activities in consolidated statements of cash flows increased by 33.2 billion yen and cash flows from investing activities decreased by the same amount compared with presentation before reclassification.
In consolidated statements of cash flows as classified into non-financial services business and financial services business, cash flows from origination and collection activities of finance receivables relating to inventory-sales continue to be reported in investing activities.
2. Consolidated Financial Results of FY2006 Semi-Annual by Segment
(1) Segment Operating Results
Automotive: Net revenues for the automotive operations increased by 804.9 billion yen, or 9.7%, to
9,144.5 billion yen in FY2006 semi-annual results compared with FY2005 semi-annual results, and operating income decreased by 35.5 billion yen, or 4.7%, to 721.3 billion yen in FY2006 semi-annual results compared with FY2005 semi-annual results. The decrease in operating income was mainly a result of an increase in expenses due to expansion of operations, partially offset by increases in vehicle units sold in each region, including North America and Asia and cost reduction efforts.
Consolidated 8
(All financial information has been prepared in accordance with accounting principles generally accepted in the United States of America) Financial services:
Net revenues for the financial services operations increased by 77.6 billion yen, or 20.2%, to 462.0 billion yen in FY2006 semi-annual results compared with FY2005 semi-annual results, while operating income decreased by 19.2 billion yen, or 18.6%, to 83.5 billion yen in FY2006 semi-annual results compared with FY2005 semi-annual results. The decrease in operating income was primarily because of the gain in FY2005 semi-annual to record prior-year adjustments relating to accounting for loan origination costs in accordance with the Statement of Financial Accounting Standards (“FAS”) No.91 by a sales finance subsidiary in the United States of America, as well as the decrease in valuation profits from marking interest rate swaps to market for FY2006 semi-annual in accordance with FAS No. 133 as amended by several guidance including FAS No.138, despite a steady increase in financing volumes.
All other: Net revenues for all other businesses increased by 69.1 billion yen, or 14.8%, to 535.9 billion
yen in FY2006 semi-annual results compared with FY2005 semi-annual results, while operating income decreased by 2.9 billion yen, or 22.9%, to 9.8 billion yen in FY2006 semi-annual results compared with FY2005 semi-annual results.
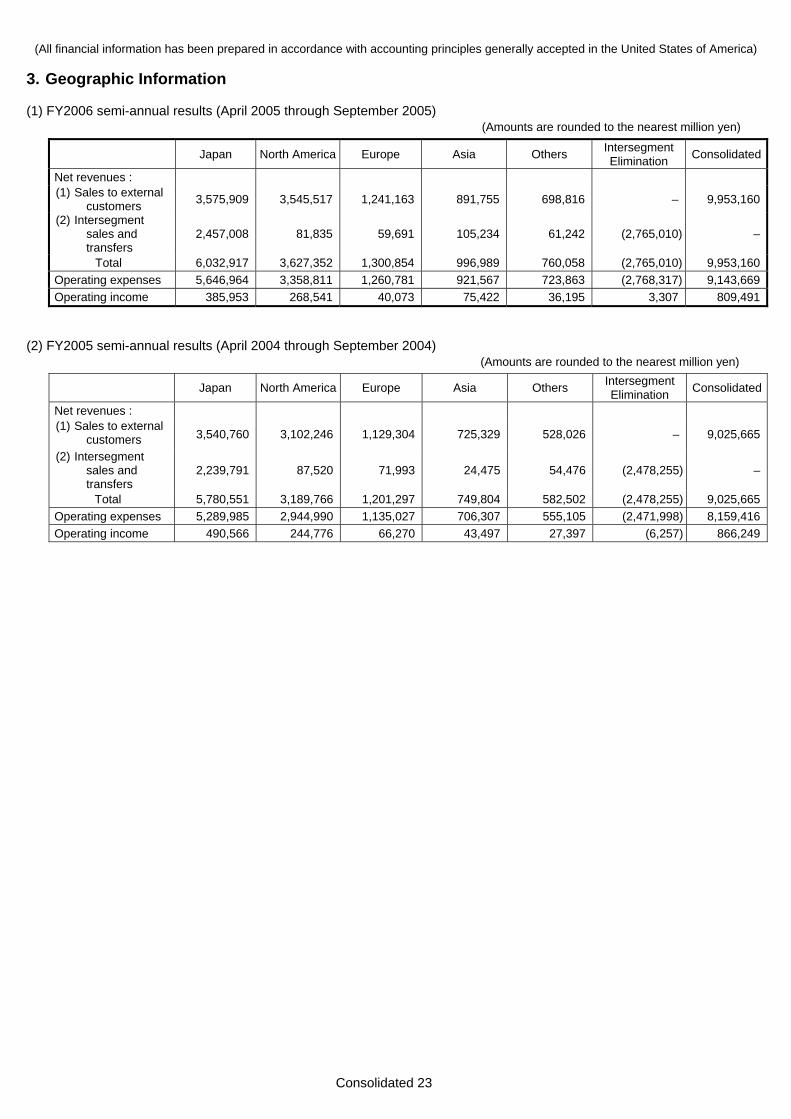
(2) Geographic Information
Japan:
Net revenues in Japan increased by 252.3 billion yen, or 4.4%, to 6,032.9 billion yen in FY2006 semi-annual results compared with FY2005 semi-annual results, while operating income decreased by 104.7 billion yen, or 21.3%, to 385.9 billion yen in FY2006 semi-annual-results compared with FY2005 semi-annual results. The decrease in operating income was mainly a result of an increase in expenses due to expansion of operations, partially offset by cost reduction efforts.
North America: Net revenues in North America increased by 437.6 billion yen, or 13.7%, to 3,627.3 billion
yen in FY2006 semi-annual results compared with FY2005 semi-annual results, and operating income increased by 23.8 billion yen, or 9.7%, to 268.5 billion yen in FY2006 semi-annual results compared with FY2005 semi-annual results. The increase in operating income was due to a solid performance resulting from increases in both local production volume and vehicle units sold, as well as cost reduction efforts.
Europe:
Net revenues in Europe increased by 99.5 billion yen, or 8.3%, to 1,300.8 billion yen in FY2006 semi-annual results compared with FY2005 semi-annual results, while operating income decreased by 26.2 billion yen, or 39.5%, to 40.1 billion yen in FY2006 semi-annual results compared with FY2005 semi-annual results. The decrease in operating income was mainly due to an increase in expenses, partially offset by increases in both local production volume and vehicle units sold.
Asia:
Net revenues in Asia increased by 247.2 billion yen, or 33.0%, to 997.0 billion yen in the FY2006 semi-annual results, compared with FY2005 semi-annual results, and operating income increased by 31.9 billion yen, or 73.4%, to 75.4 billion yen in the FY2006 semi-annual results, compared with FY2005 semi-annual results. The increase in operating income was mainly due to the favorable sales of IMV series vehicles which resulted in increases in both local production volume and vehicle units sold.
Others:
Net revenues in other markets increased by 177.6 billion yen, or 30.5 %, to 760.1 billion yen in FY2006 semi-annual results compared with FY2005 semi-annual results, and operating income increased by 8.8 billion yen, or 32.1%, to 36.2 billion yen in FY2006 semi-annual results compared with FY2005 semi-annual results. The increase in operating income was primarily due to increases in local production volumes as well as vehicle units sold, mainly IMV series vehicles.
Consolidated 9
(All financial information has been prepared in accordance with accounting principles generally accepted in the United States of America)
3. Distribution of Profits for FY2006 Semi-Annual
As for the dividends, TMC increased in interim dividends declared in November 2004 by 10 yen per share to 35 yen per share. Accordingly, the dividend payout ratio for FY2006 semi-annual period would be 40.2%, and the consolidated dividend payout ratio would be 20.0%. On the other hand, during FY2006 semi-annual period, TMC repurchased 16 million of its own shares in using, the aggregate of 61.7 billion yen from retained earnings.
4. Other
TMC receives common shares of the Mitsubishi UFJ Financial Group, Inc. because of the merger between Mitsubishi Tokyo Financial Group, Inc., and UFJ Holdings, Inc. on October 1, 2005 in exchange for shares of UFJ Holdings Inc., which TMC had held. As a result of this transaction, in accordance with accounting principles generally accepted in the United States of America, TMC will record a gain of approximately 140.0 billion yen in income before taxes, minority interest, and equity in earnings of affiliated companies in the third quarter of the FY2006 as a difference between acquisition costs of prior-merger shares and the fair market value of post-merger shares.
Consolidated 10
CONSOLIDATED PRODUCTION AND SALES (All financial information has been prepared in accordance with accounting principles generally accepted in the United States of America)
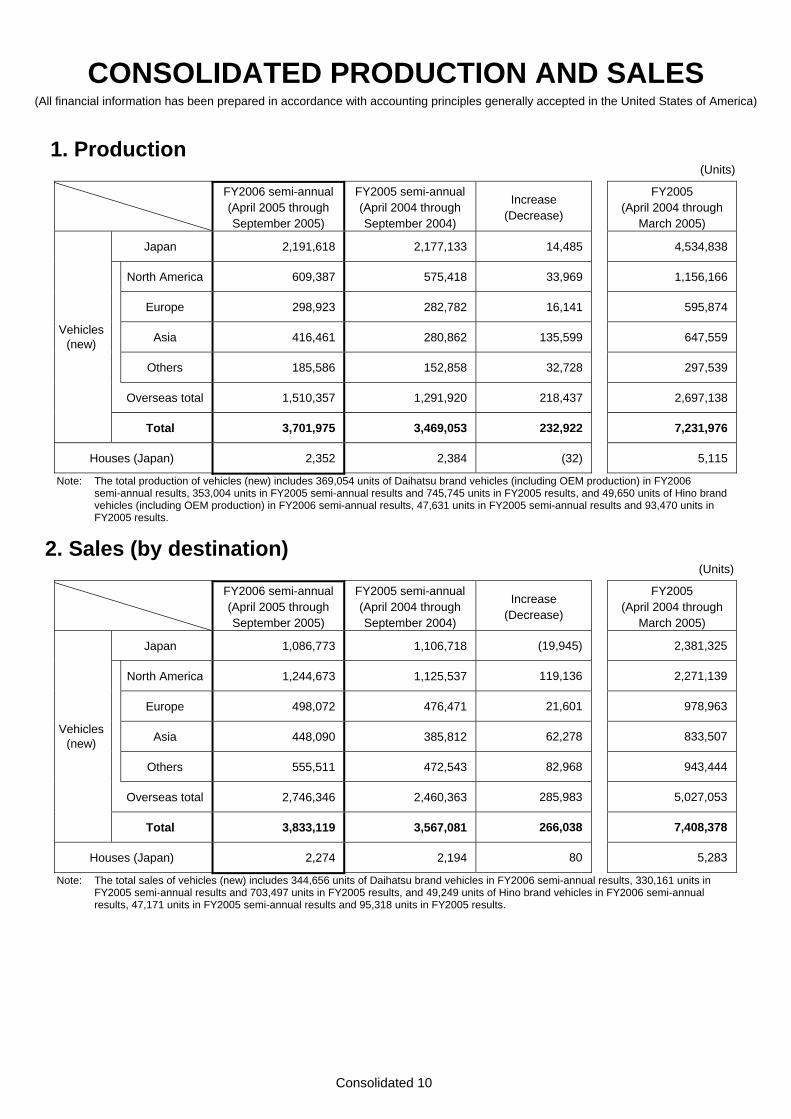
1. Production
(Units)
FY2006 semi-annual(April 2005 through September 2005)
FY2005 semi-annual(April 2004 through September 2004)
Increase (Decrease)
FY2005 (April 2004 through
March 2005)
Japan 2,191,618 2,177,133 14,485 4,534,838
North America 609,387 575,418 33,969 1,156,166
Europe 298,923 282,782 16,141 595,874
Asia 416,461 280,862 135,599 647,559
Others 185,586 152,858 32,728 297,539
Overseas total 1,510,357 1,291,920 218,437 2,697,138
Vehicles (new)
Total 3,701,975 3,469,053 232,922 7,231,976
Houses (Japan) 2,352 2,384 (32) 5,115
Note: The total production of vehicles (new) includes 369,054 units of Daihatsu brand vehicles (including OEM production) in FY2006 semi-annual results, 353,004 units in FY2005 semi-annual results and 745,745 units in FY2005 results, and 49,650 units of Hino brand vehicles (including OEM production) in FY2006 semi-annual results, 47,631 units in FY2005 semi-annual results and 93,470 units in FY2005 results.
2. Sales (by destination) (Units)
FY2006 semi-annual(April 2005 through September 2005)
FY2005 semi-annual(April 2004 through September 2004)
Increase (Decrease)
FY2005 (April 2004 through
March 2005)
Japan 1,086,773 1,106,718 (19,945) 2,381,325
North America 1,244,673 1,125,537 119,136 2,271,139
Europe 498,072 476,471 21,601 978,963
Asia 448,090 385,812 62,278 833,507
Others 555,511 472,543 82,968 943,444
Overseas total 2,746,346 2,460,363 285,983 5,027,053
Vehicles (new)
Total 3,833,119 3,567,081 266,038 7,408,378
Houses (Japan) 2,274 2,194 80 5,283
Note: The total sales of vehicles (new) includes 344,656 units of Daihatsu brand vehicles in FY2006 semi-annual results, 330,161 units in FY2005 semi-annual results and 703,497 units in FY2005 results, and 49,249 units of Hino brand vehicles in FY2006 semi-annual results, 47,171 units in FY2005 semi-annual results and 95,318 units in FY2005 results.
Consolidated 11
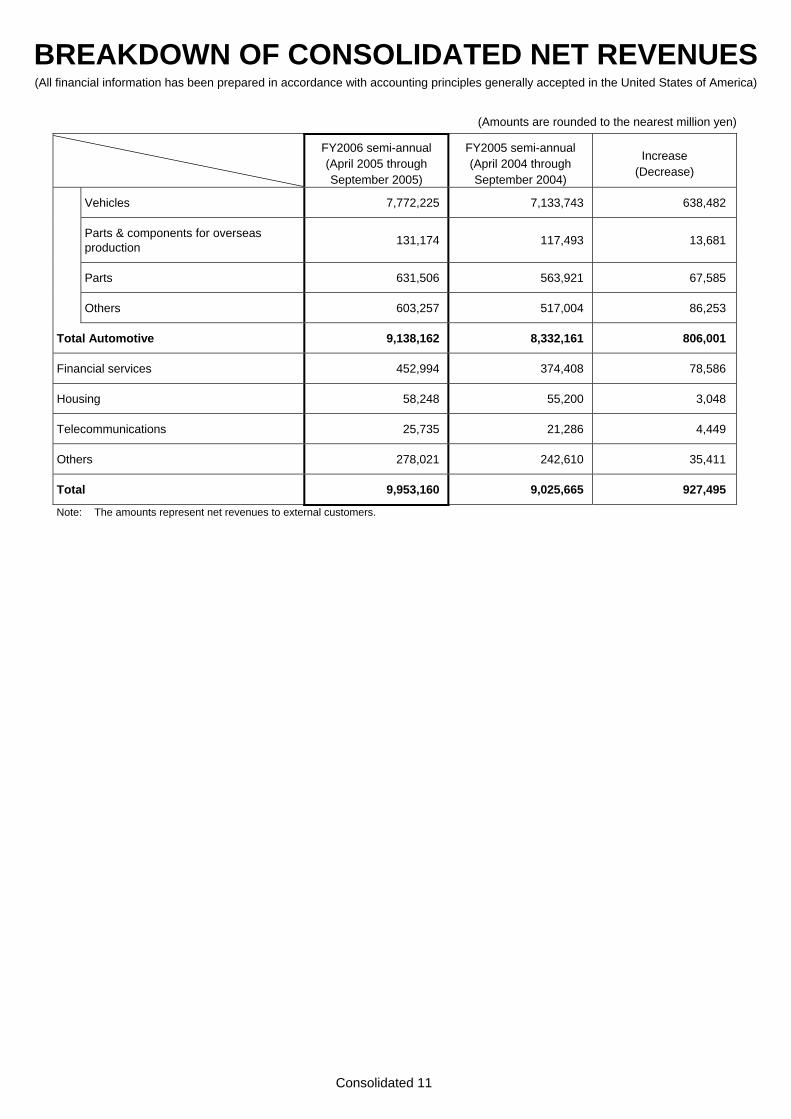
BREAKDOWN OF CONSOLIDATED NET REVENUES (All financial information has been prepared in accordance with accounting principles generally accepted in the United States of America)
(Amounts are rounded to the nearest million yen)
FY2006 semi-annual (April 2005 through September 2005)
FY2005 semi-annual (April 2004 through September 2004)
Increase (Decrease)
Vehicles 7,772,225 7,133,743 638,482
Parts & components for overseas production 131,174 117,493 13,681
Parts 631,506 563,921 67,585
Others 603,257 517,004 86,253
Total Automotive 9,138,162 8,332,161 806,001
Financial services 452,994 374,408 78,586
Housing 58,248 55,200 3,048
Telecommunications 25,735 21,286 4,449
Others 278,021 242,610 35,411
Total 9,953,160 9,025,665 927,495
Note: The amounts represent net revenues to external customers.
Consolidated 12
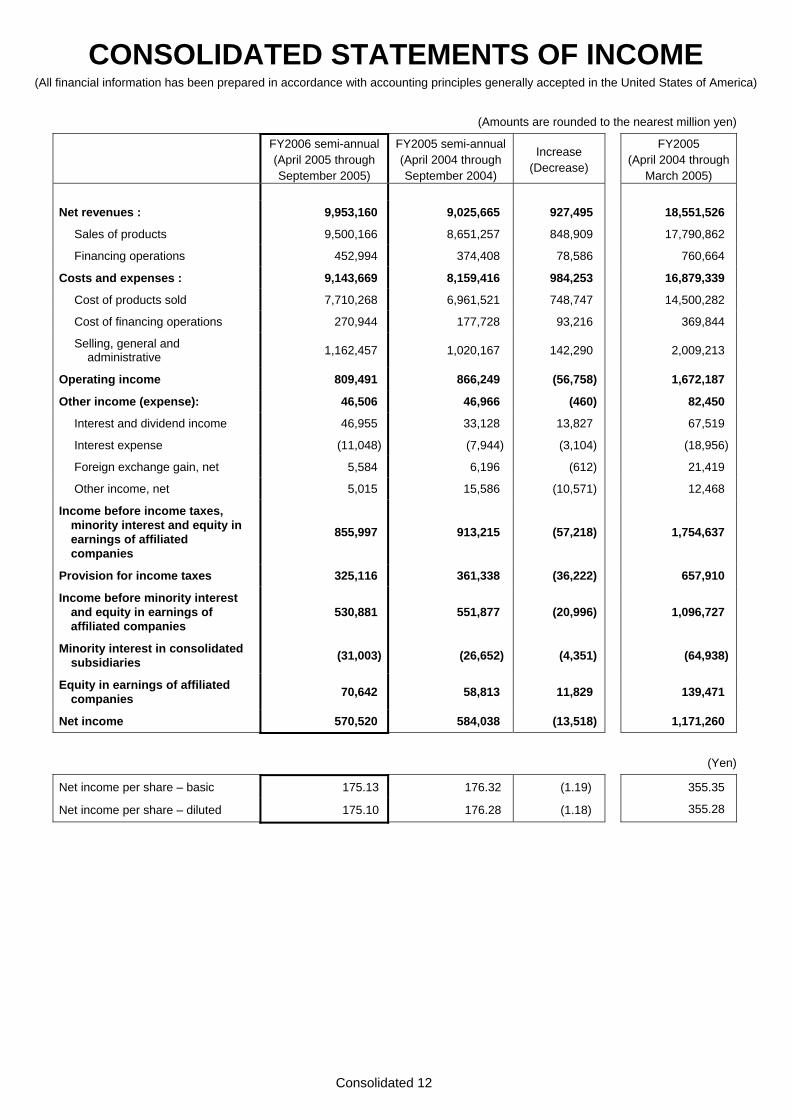
CONSOLIDATED STATEMENTS OF INCOME (All financial information has been prepared in accordance with accounting principles generally accepted in the United States of America)
(Amounts are rounded to the nearest million yen)
FY2006 semi-annual(April 2005 through September 2005)
FY2005 semi-annual(April 2004 through September 2004)
Increase (Decrease)
FY2005 (April 2004 through
March 2005)
Net revenues : 9,953,160 9,025,665 927,495 18,551,526
Sales of products 9,500,166 8,651,257 848,909 17,790,862
Financing operations 452,994 374,408 78,586 760,664
Costs and expenses : 9,143,669 8,159,416 984,253 16,879,339
Cost of products sold 7,710,268 6,961,521 748,747 14,500,282
Cost of financing operations 270,944 177,728 93,216 369,844
Selling, general and administrative 1,162,457 1,020,167 142,290
2,009,213
Operating income 809,491 866,249 (56,758) 1,672,187
Other income (expense): 46,506 46,966 (460) 82,450
Interest and dividend income 46,955 33,128 13,827 67,519
Interest expense (11,048) (7,944) (3,104) (18,956)
Foreign exchange gain, net 5,584 6,196 (612) 21,419
Other income, net 5,015 15,586 (10,571) 12,468
Income before income taxes, minority interest and equity in earnings of affiliated companies
855,997 913,215 (57,218)
1,754,637
Provision for income taxes 325,116 361,338 (36,222) 657,910
Income before minority interest and equity in earnings of affiliated companies
530,881 551,877 (20,996)
1,096,727
Minority interest in consolidated subsidiaries (31,003) (26,652) (4,351)
(64,938)
Equity in earnings of affiliated companies 70,642 58,813 11,829
139,471
Net income 570,520 584,038 (13,518) 1,171,260
(Yen)
Net income per share – basic 175.13 176.32 (1.19) 355.35
Net income per share – diluted 175.10 176.28 (1.18) 355.28
Consolidated 13
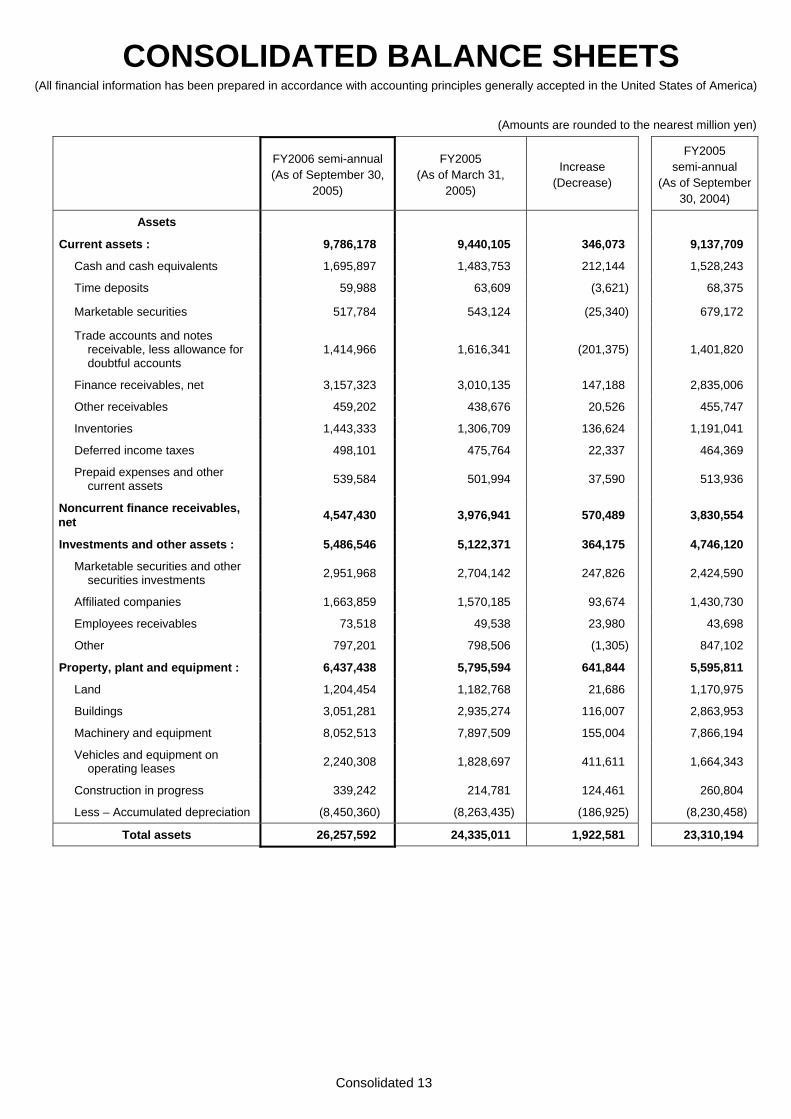
CONSOLIDATED BALANCE SHEETS (All financial information has been prepared in accordance with accounting principles generally accepted in the United States of America)
(Amounts are rounded to the nearest million yen)
FY2006 semi-annual(As of September 30,
2005)
FY2005 (As of March 31,
2005)
Increase (Decrease)
FY2005 semi-annual
(As of September 30, 2004)
Assets
Current assets : 9,786,178 9,440,105 346,073 9,137,709
Cash and cash equivalents 1,695,897 1,483,753 212,144 1,528,243
Time deposits 59,988 63,609 (3,621) 68,375
Marketable securities 517,784 543,124 (25,340) 679,172
Trade accounts and notes receivable, less allowance for doubtful accounts
1,414,966 1,616,341 (201,375)
1,401,820
Finance receivables, net 3,157,323 3,010,135 147,188 2,835,006
Other receivables 459,202 438,676 20,526 455,747
Inventories 1,443,333 1,306,709 136,624 1,191,041
Deferred income taxes 498,101 475,764 22,337 464,369
Prepaid expenses and other current assets 539,584 501,994 37,590 513,936
Noncurrent finance receivables, net 4,547,430 3,976,941 570,489 3,830,554
Investments and other assets : 5,486,546 5,122,371 364,175 4,746,120
Marketable securities and other securities investments 2,951,968 2,704,142 247,826 2,424,590
Affiliated companies 1,663,859 1,570,185 93,674 1,430,730
Employees receivables 73,518 49,538 23,980 43,698
Other 797,201 798,506 (1,305) 847,102
Property, plant and equipment : 6,437,438 5,795,594 641,844 5,595,811
Land 1,204,454 1,182,768 21,686 1,170,975
Buildings 3,051,281 2,935,274 116,007 2,863,953
Machinery and equipment 8,052,513 7,897,509 155,004 7,866,194
Vehicles and equipment on operating leases 2,240,308 1,828,697 411,611 1,664,343
Construction in progress 339,242 214,781 124,461 260,804
Less – Accumulated depreciation (8,450,360) (8,263,435) (186,925) (8,230,458)
Total assets 26,257,592 24,335,011 1,922,581 23,310,194
Consolidated 14
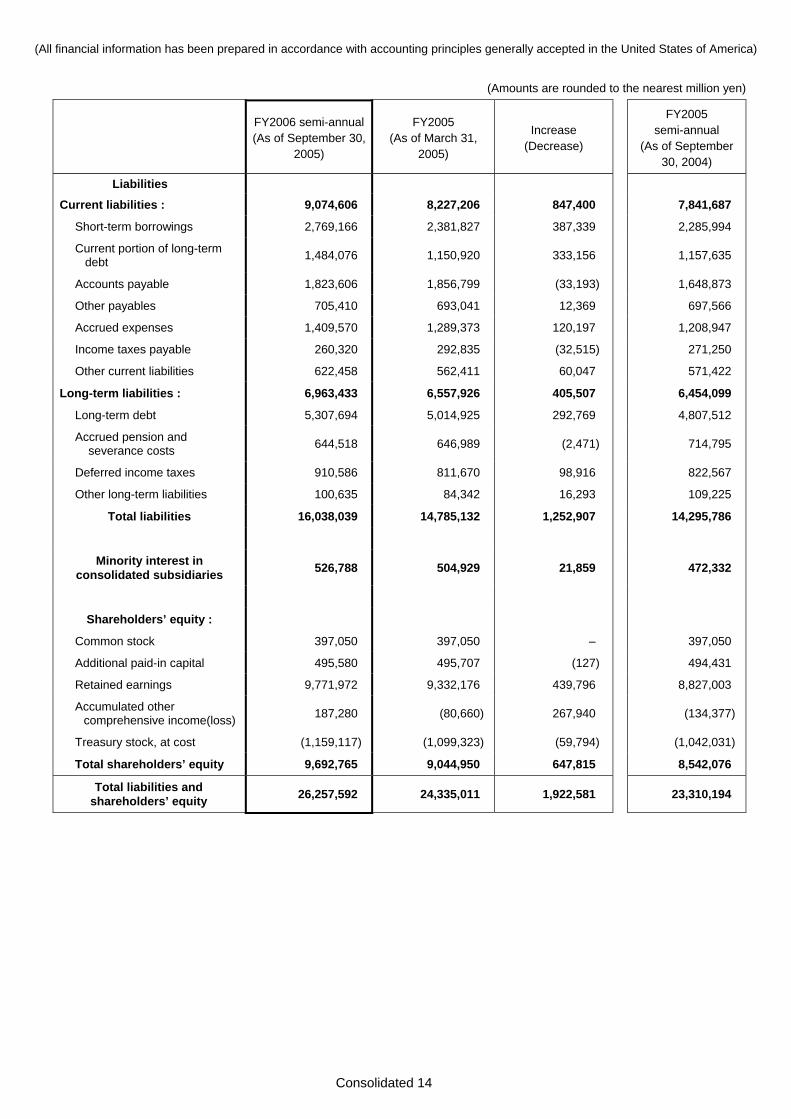
(All financial information has been prepared in accordance with accounting principles generally accepted in the United States of America)
(Amounts are rounded to the nearest million yen)
FY2006 semi-annual(As of September 30,
2005)
FY2005 (As of March 31,
2005)
Increase (Decrease)
FY2005 semi-annual
(As of September 30, 2004)
Liabilities
Current liabilities : 9,074,606 8,227,206 847,400 7,841,687
Short-term borrowings 2,769,166 2,381,827 387,339 2,285,994
Current portion of long-term debt 1,484,076 1,150,920 333,156
1,157,635
Accounts payable 1,823,606 1,856,799 (33,193) 1,648,873
Other payables 705,410 693,041 12,369 697,566
Accrued expenses 1,409,570 1,289,373 120,197 1,208,947
Income taxes payable 260,320 292,835 (32,515) 271,250
Other current liabilities 622,458 562,411 60,047 571,422
Long-term liabilities : 6,963,433 6,557,926 405,507 6,454,099
Long-term debt 5,307,694 5,014,925 292,769 4,807,512
Accrued pension and severance costs 644,518 646,989 (2,471)
714,795
Deferred income taxes 910,586 811,670 98,916 822,567
Other long-term liabilities 100,635 84,342 16,293 109,225
Total liabilities 16,038,039 14,785,132 1,252,907 14,295,786
Minority interest in consolidated subsidiaries 526,788 504,929 21,859
472,332
Shareholders’ equity :
Common stock 397,050 397,050 – 397,050
Additional paid-in capital 495,580 495,707 (127) 494,431
Retained earnings 9,771,972 9,332,176 439,796 8,827,003
Accumulated other comprehensive income(loss) 187,280 (80,660) 267,940
(134,377)
Treasury stock, at cost (1,159,117) (1,099,323) (59,794) (1,042,031)
Total shareholders’ equity 9,692,765 9,044,950 647,815 8,542,076
Total liabilities and shareholders’ equity 26,257,592 24,335,011 1,922,581
23,310,194
Consolidated 15
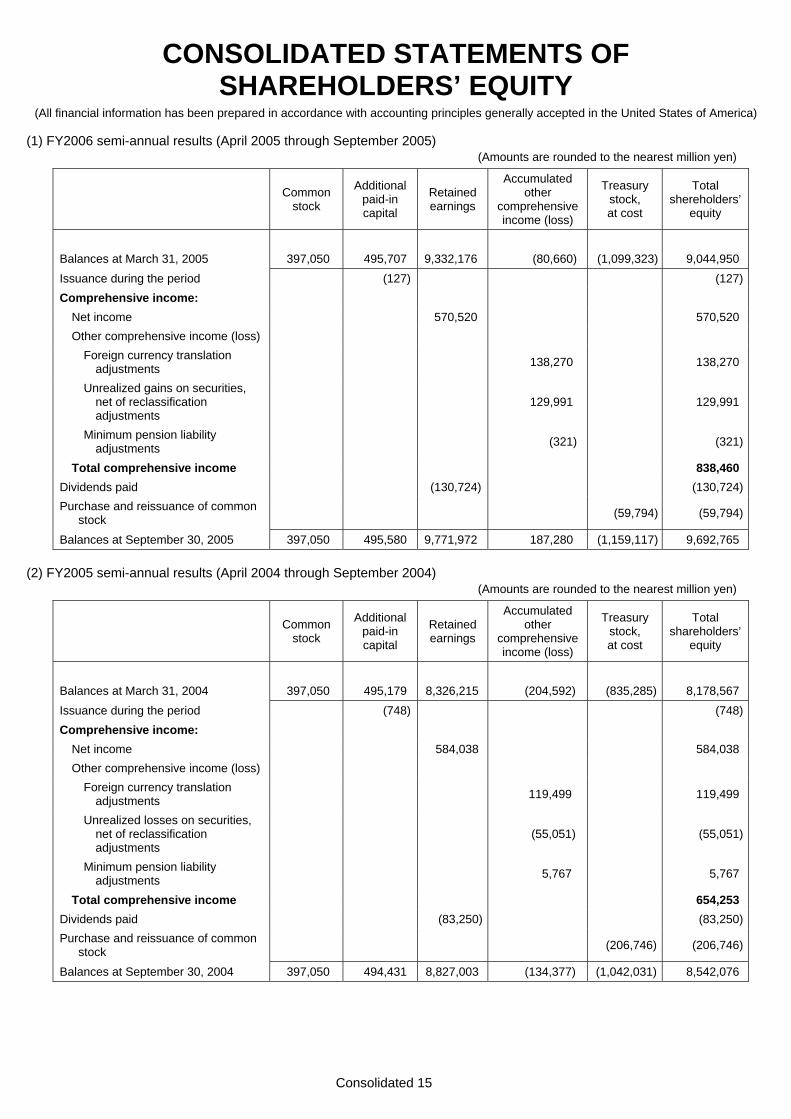
CONSOLIDATED STATEMENTS OF SHAREHOLDERS’ EQUITY
(All financial information has been prepared in accordance with accounting principles generally accepted in the United States of America)
(1) FY2006 semi-annual results (April 2005 through September 2005) (Amounts are rounded to the nearest million yen)
Common
stock
Additional paid-in capital
Retained earnings
Accumulated other
comprehensive income (loss)
Treasury stock, at cost
Total shereholders’
equity
Balances at March 31, 2005 397,050 495,707 9,332,176 (80,660) (1,099,323) 9,044,950Issuance during the period (127) (127)Comprehensive income: Net income 570,520 570,520 Other comprehensive income (loss) Foreign currency translation
adjustments 138,270 138,270
Unrealized gains on securities, net of reclassification adjustments
129,991 129,991
Minimum pension liability adjustments (321) (321)
Total comprehensive income 838,460Dividends paid (130,724) (130,724)Purchase and reissuance of common
stock (59,794) (59,794)
Balances at September 30, 2005 397,050 495,580 9,771,972 187,280 (1,159,117) 9,692,765 (2) FY2005 semi-annual results (April 2004 through September 2004)
(Amounts are rounded to the nearest million yen)
Common
stock
Additional paid-in capital
Retained earnings
Accumulated other
comprehensive income (loss)
Treasury stock, at cost
Total shareholders’
equity
Balances at March 31, 2004 397,050 495,179 8,326,215 (204,592) (835,285) 8,178,567Issuance during the period (748) (748)Comprehensive income: Net income 584,038 584,038 Other comprehensive income (loss) Foreign currency translation
adjustments 119,499 119,499
Unrealized losses on securities, net of reclassification adjustments
(55,051) (55,051)
Minimum pension liability adjustments 5,767 5,767
Total comprehensive income 654,253Dividends paid (83,250) (83,250)Purchase and reissuance of common
stock (206,746) (206,746)
Balances at September 30, 2004 397,050 494,431 8,827,003 (134,377) (1,042,031) 8,542,076
Consolidated 16
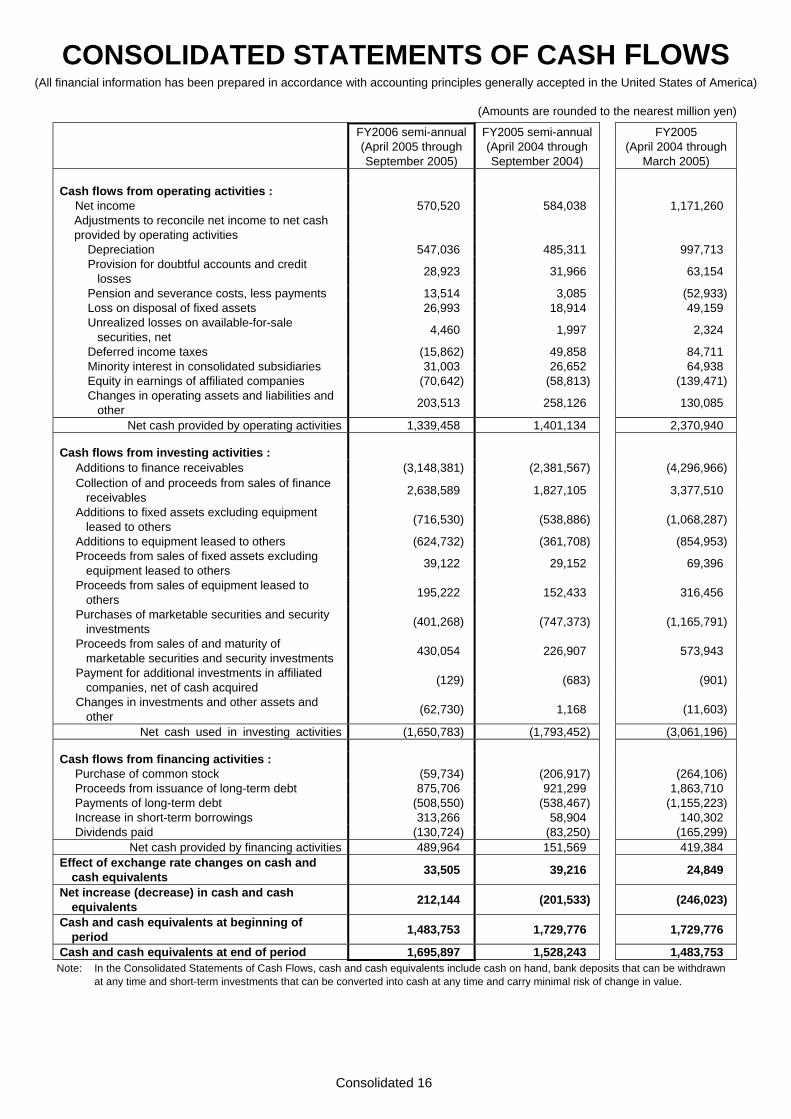
CONSOLIDATED STATEMENTS OF CASH FLOWS (All financial information has been prepared in accordance with accounting principles generally accepted in the United States of America)
(Amounts are rounded to the nearest million yen)
FY2006 semi-annual(April 2005 through September 2005)
FY2005 semi-annual (April 2004 through September 2004)
FY2005 (April 2004 through
March 2005) Cash flows from operating activities : Net income 570,520 584,038 1,171,260
Adjustments to reconcile net income to net cash provided by operating activities
Depreciation 547,036 485,311 997,713 Provision for doubtful accounts and credit
losses 28,923 31,966 63,154
Pension and severance costs, less payments 13,514 3,085 (52,933) Loss on disposal of fixed assets 26,993 18,914 49,159 Unrealized losses on available-for-sale
securities, net 4,460 1,997 2,324
Deferred income taxes (15,862) 49,858 84,711 Minority interest in consolidated subsidiaries 31,003 26,652 64,938 Equity in earnings of affiliated companies (70,642) (58,813) (139,471) Changes in operating assets and liabilities and
other 203,513 258,126 130,085
Net cash provided by operating activities 1,339,458 1,401,134 2,370,940 Cash flows from investing activities : Additions to finance receivables (3,148,381) (2,381,567) (4,296,966) Collection of and proceeds from sales of finance
receivables 2,638,589 1,827,105 3,377,510
Additions to fixed assets excluding equipment leased to others (716,530) (538,886) (1,068,287)
Additions to equipment leased to others (624,732) (361,708) (854,953) Proceeds from sales of fixed assets excluding
equipment leased to others 39,122 29,152 69,396
Proceeds from sales of equipment leased to others 195,222 152,433 316,456
Purchases of marketable securities and security investments (401,268) (747,373) (1,165,791)
Proceeds from sales of and maturity of marketable securities and security investments 430,054 226,907 573,943
Payment for additional investments in affiliated companies, net of cash acquired (129) (683) (901)
Changes in investments and other assets and other (62,730) 1,168 (11,603)
Net cash used in investing activities (1,650,783) (1,793,452) (3,061,196) Cash flows from financing activities : Purchase of common stock (59,734) (206,917) (264,106) Proceeds from issuance of long-term debt 875,706 921,299 1,863,710 Payments of long-term debt (508,550) (538,467) (1,155,223) Increase in short-term borrowings 313,266 58,904 140,302 Dividends paid (130,724) (83,250) (165,299)
Net cash provided by financing activities 489,964 151,569 419,384 Effect of exchange rate changes on cash and
cash equivalents 33,505 39,216 24,849
Net increase (decrease) in cash and cash equivalents 212,144 (201,533) (246,023)
Cash and cash equivalents at beginning of period 1,483,753 1,729,776 1,729,776
Cash and cash equivalents at end of period 1,695,897 1,528,243 1,483,753 Note: In the Consolidated Statements of Cash Flows, cash and cash equivalents include cash on hand, bank deposits that can be withdrawn
at any time and short-term investments that can be converted into cash at any time and carry minimal risk of change in value.
Consolidated 17
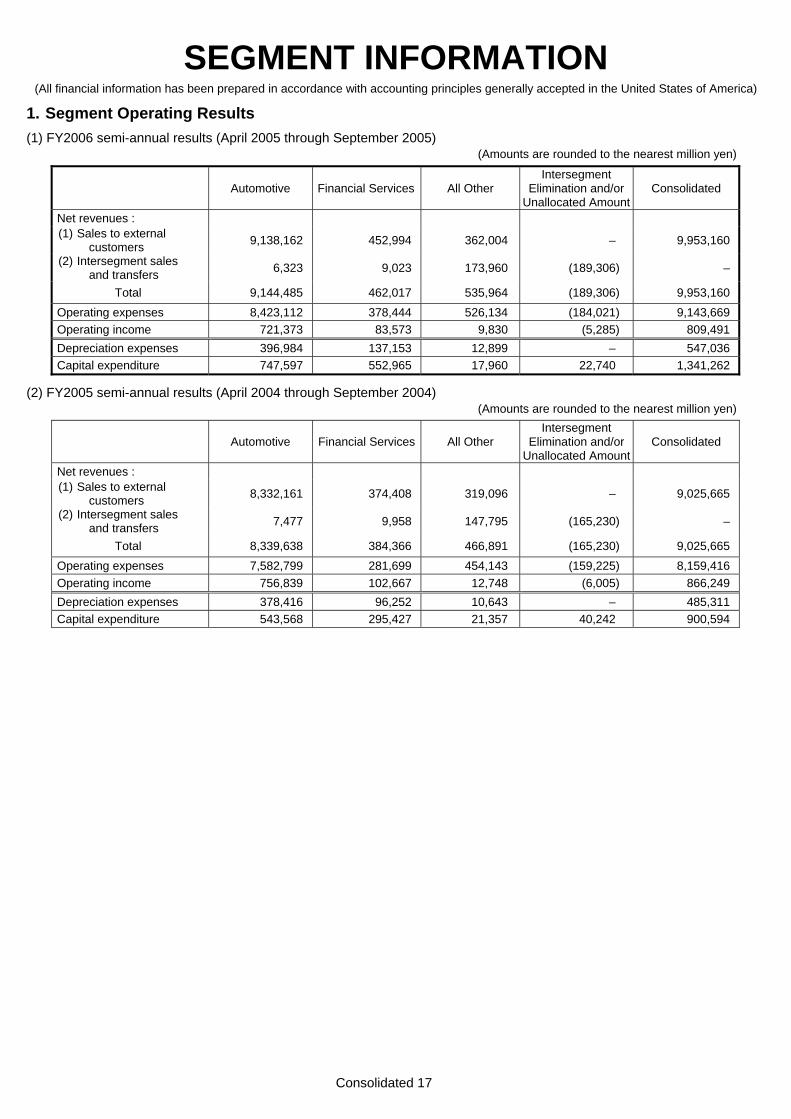
SEGMENT INFORMATION (All financial information has been prepared in accordance with accounting principles generally accepted in the United States of America)
1. Segment Operating Results (1) FY2006 semi-annual results (April 2005 through September 2005)
(Amounts are rounded to the nearest million yen)
Automotive Financial Services All Other
Intersegment Elimination and/or
Unallocated Amount Consolidated
Net revenues : (1) Sales to external
customers 9,138,162 452,994 362,004 – 9,953,160
(2) Intersegment sales and transfers 6,323 9,023 173,960 (189,306) –
Total 9,144,485 462,017 535,964 (189,306) 9,953,160Operating expenses 8,423,112 378,444 526,134 (184,021) 9,143,669Operating income 721,373 83,573 9,830 (5,285) 809,491Depreciation expenses 396,984 137,153 12,899 – 547,036Capital expenditure 747,597 552,965 17,960 22,740 1,341,262
(2) FY2005 semi-annual results (April 2004 through September 2004)
(Amounts are rounded to the nearest million yen)
Automotive Financial Services All Other Intersegment
Elimination and/or Unallocated Amount
Consolidated
Net revenues : (1) Sales to external
customers 8,332,161 374,408 319,096 – 9,025,665
(2) Intersegment sales and transfers 7,477 9,958 147,795 (165,230) –
Total 8,339,638 384,366 466,891 (165,230) 9,025,665Operating expenses 7,582,799 281,699 454,143 (159,225) 8,159,416Operating income 756,839 102,667 12,748 (6,005) 866,249Depreciation expenses 378,416 96,252 10,643 – 485,311Capital expenditure 543,568 295,427 21,357 40,242 900,594
Consolidated 18
(All financial information has been prepared in accordance with accounting principles generally accepted in the United States of America)
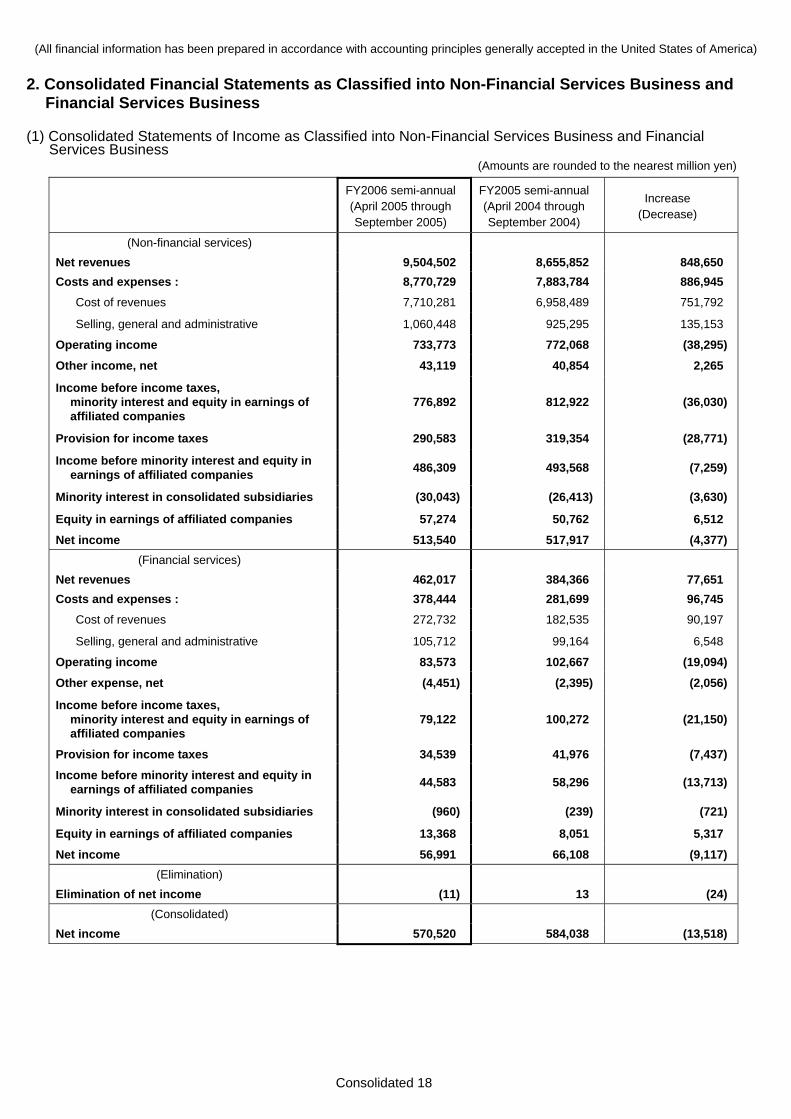
2. Consolidated Financial Statements as Classified into Non-Financial Services Business and Financial Services Business
(1) Consolidated Statements of Income as Classified into Non-Financial Services Business and Financial
Services Business (Amounts are rounded to the nearest million yen)
FY2006 semi-annual (April 2005 through September 2005)
FY2005 semi-annual (April 2004 through September 2004)
Increase (Decrease)
(Non-financial services) Net revenues 9,504,502 8,655,852 848,650 Costs and expenses : 8,770,729 7,883,784 886,945 Cost of revenues 7,710,281 6,958,489 751,792
Selling, general and administrative 1,060,448 925,295 135,153
Operating income 733,773 772,068 (38,295)
Other income, net 43,119 40,854 2,265
Income before income taxes, minority interest and equity in earnings of affiliated companies
776,892 812,922 (36,030)
Provision for income taxes 290,583 319,354 (28,771)
Income before minority interest and equity in earnings of affiliated companies 486,309 493,568 (7,259)
Minority interest in consolidated subsidiaries (30,043) (26,413) (3,630)
Equity in earnings of affiliated companies 57,274 50,762 6,512
Net income 513,540 517,917 (4,377)(Financial services)
Net revenues 462,017 384,366 77,651 Costs and expenses : 378,444 281,699 96,745 Cost of revenues 272,732 182,535 90,197
Selling, general and administrative 105,712 99,164 6,548
Operating income 83,573 102,667 (19,094)
Other expense, net (4,451) (2,395) (2,056)
Income before income taxes, minority interest and equity in earnings of affiliated companies
79,122 100,272 (21,150)
Provision for income taxes 34,539 41,976 (7,437)
Income before minority interest and equity in earnings of affiliated companies 44,583 58,296 (13,713)
Minority interest in consolidated subsidiaries (960) (239) (721)
Equity in earnings of affiliated companies 13,368 8,051 5,317
Net income 56,991 66,108 (9,117)(Elimination)
Elimination of net income (11) 13 (24)(Consolidated)
Net income 570,520 584,038 (13,518)
Consolidated 19
(All financial information has been prepared in accordance with accounting principles generally accepted in the United States of America)
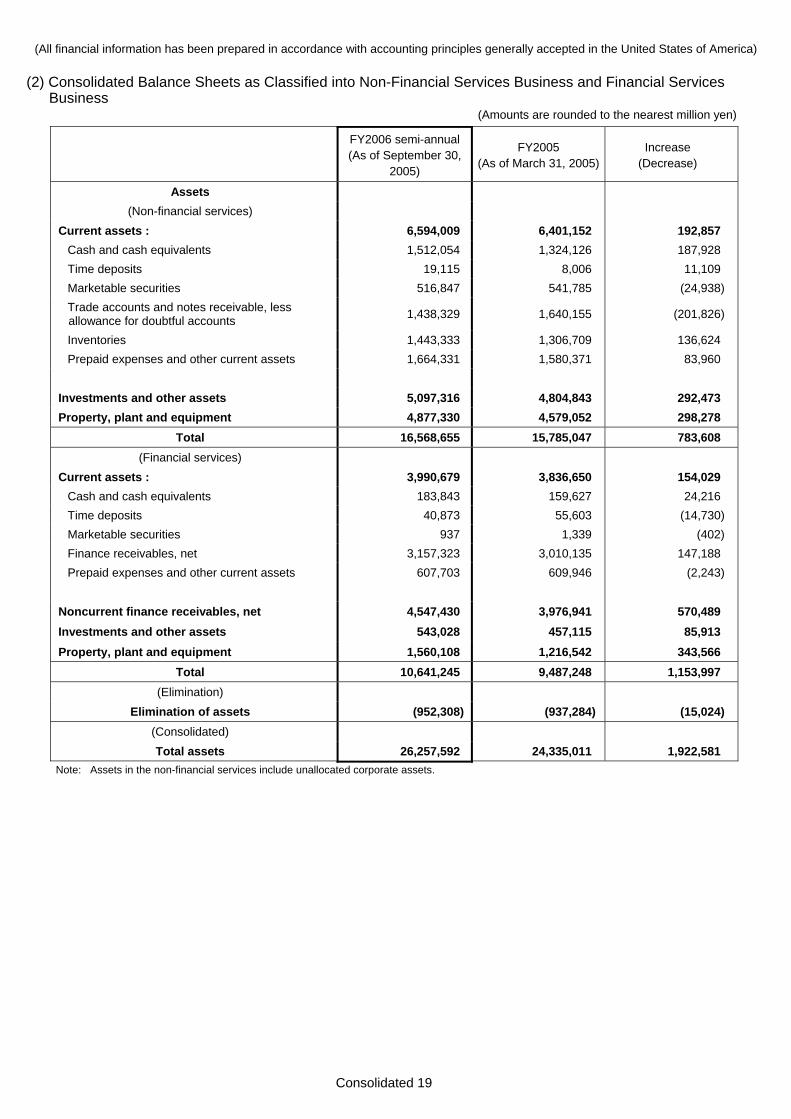
(2) Consolidated Balance Sheets as Classified into Non-Financial Services Business and Financial Services Business
(Amounts are rounded to the nearest million yen)
FY2006 semi-annual(As of September 30,
2005)
FY2005 (As of March 31, 2005)
Increase (Decrease)
Assets (Non-financial services)
Current assets : 6,594,009 6,401,152 192,857 Cash and cash equivalents 1,512,054 1,324,126 187,928 Time deposits 19,115 8,006 11,109 Marketable securities 516,847 541,785 (24,938) Trade accounts and notes receivable, less
allowance for doubtful accounts 1,438,329 1,640,155 (201,826)
Inventories 1,443,333 1,306,709 136,624 Prepaid expenses and other current assets 1,664,331 1,580,371 83,960 Investments and other assets 5,097,316 4,804,843 292,473 Property, plant and equipment 4,877,330 4,579,052 298,278
Total 16,568,655 15,785,047 783,608 (Financial services)
Current assets : 3,990,679 3,836,650 154,029 Cash and cash equivalents 183,843 159,627 24,216 Time deposits 40,873 55,603 (14,730) Marketable securities 937 1,339 (402) Finance receivables, net 3,157,323 3,010,135 147,188 Prepaid expenses and other current assets 607,703 609,946 (2,243) Noncurrent finance receivables, net 4,547,430 3,976,941 570,489 Investments and other assets 543,028 457,115 85,913 Property, plant and equipment 1,560,108 1,216,542 343,566
Total 10,641,245 9,487,248 1,153,997 (Elimination)
Elimination of assets (952,308) (937,284) (15,024) (Consolidated) Total assets 26,257,592 24,335,011 1,922,581
Note: Assets in the non-financial services include unallocated corporate assets.
Consolidated 20
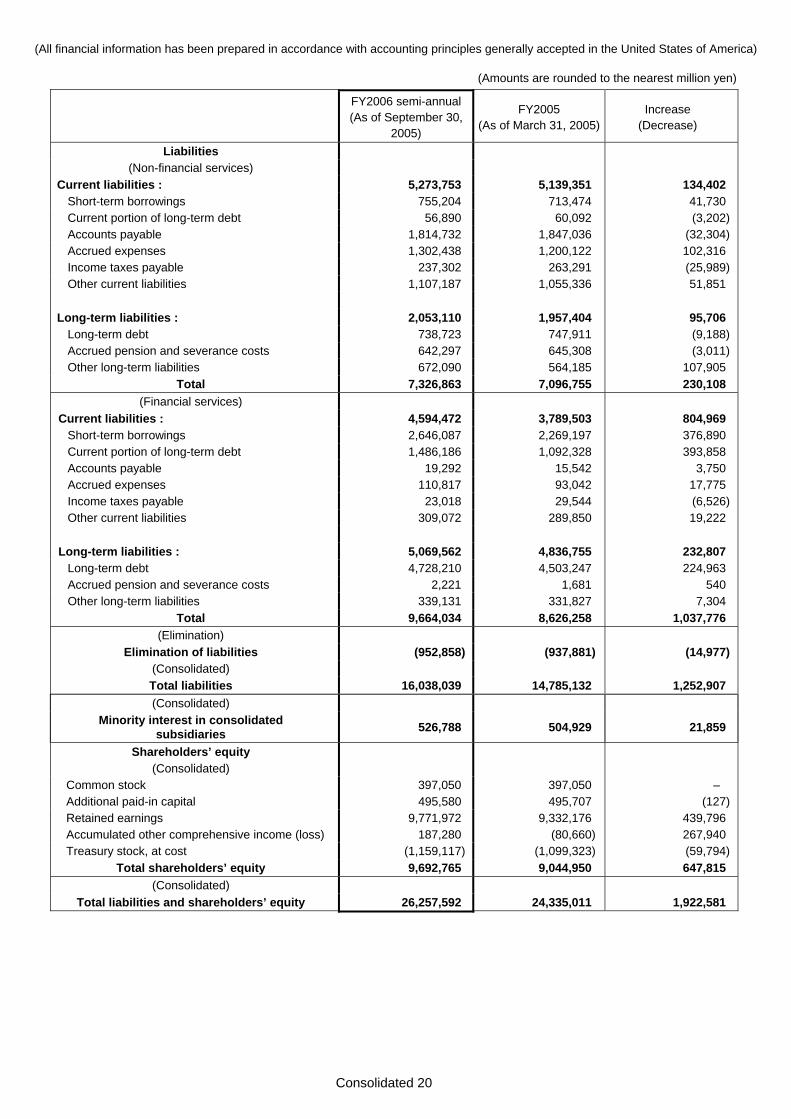
(All financial information has been prepared in accordance with accounting principles generally accepted in the United States of America)
(Amounts are rounded to the nearest million yen)
FY2006 semi-annual(As of September 30,
2005)
FY2005 (As of March 31, 2005)
Increase (Decrease)
Liabilities (Non-financial services)
Current liabilities : 5,273,753 5,139,351 134,402 Short-term borrowings 755,204 713,474 41,730 Current portion of long-term debt 56,890 60,092 (3,202) Accounts payable 1,814,732 1,847,036 (32,304) Accrued expenses 1,302,438 1,200,122 102,316 Income taxes payable 237,302 263,291 (25,989) Other current liabilities 1,107,187 1,055,336 51,851 Long-term liabilities : 2,053,110 1,957,404 95,706 Long-term debt 738,723 747,911 (9,188) Accrued pension and severance costs 642,297 645,308 (3,011) Other long-term liabilities 672,090 564,185 107,905
Total 7,326,863 7,096,755 230,108(Financial services)
Current liabilities : 4,594,472 3,789,503 804,969 Short-term borrowings 2,646,087 2,269,197 376,890 Current portion of long-term debt 1,486,186 1,092,328 393,858 Accounts payable 19,292 15,542 3,750 Accrued expenses 110,817 93,042 17,775 Income taxes payable 23,018 29,544 (6,526) Other current liabilities 309,072 289,850 19,222 Long-term liabilities : 5,069,562 4,836,755 232,807 Long-term debt 4,728,210 4,503,247 224,963 Accrued pension and severance costs 2,221 1,681 540 Other long-term liabilities 339,131 331,827 7,304
Total 9,664,034 8,626,258 1,037,776(Elimination)
Elimination of liabilities (952,858) (937,881) (14,977)(Consolidated) Total liabilities 16,038,039 14,785,132 1,252,907(Consolidated)
Minority interest in consolidated subsidiaries 526,788 504,929 21,859
Shareholders’ equity (Consolidated)
Common stock 397,050 397,050 – Additional paid-in capital 495,580 495,707 (127)Retained earnings 9,771,972 9,332,176 439,796Accumulated other comprehensive income (loss) 187,280 (80,660) 267,940Treasury stock, at cost (1,159,117) (1,099,323) (59,794)
Total shareholders’ equity 9,692,765 9,044,950 647,815(Consolidated)
Total liabilities and shareholders’ equity 26,257,592 24,335,011 1,922,581
Consolidated 21
(All financial information has been prepared in accordance with accounting principles generally accepted in the United States of America)
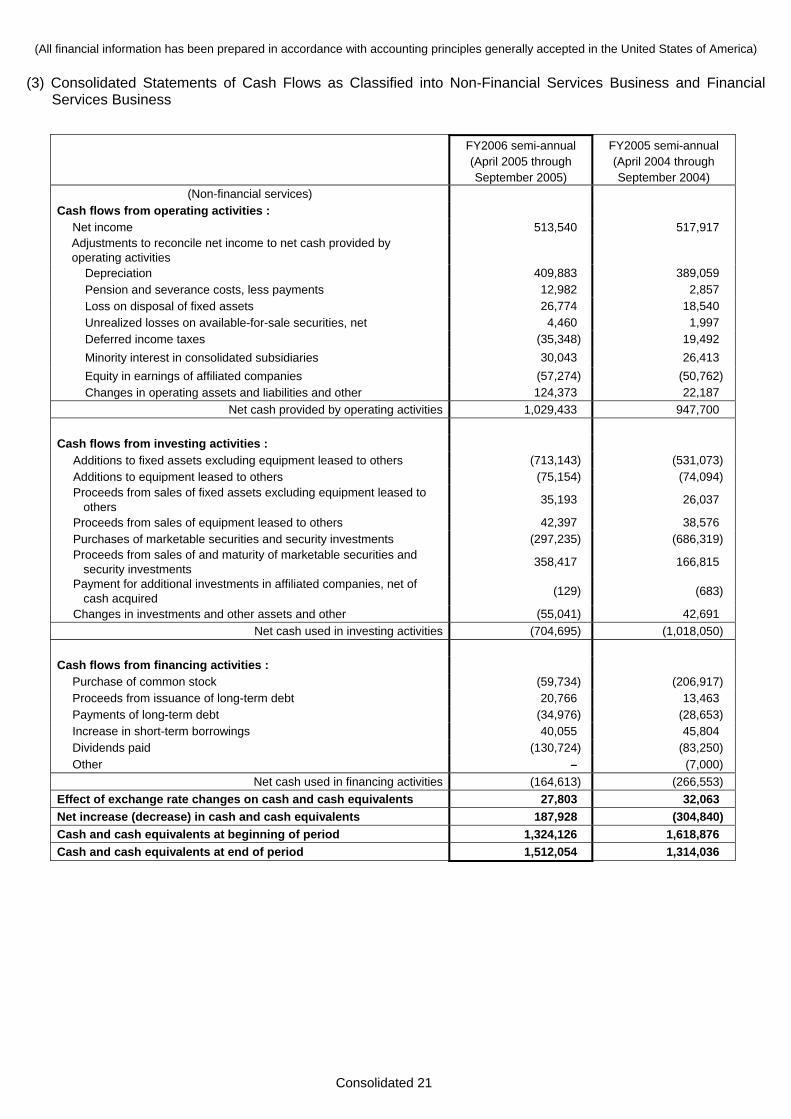
(3) Consolidated Statements of Cash Flows as Classified into Non-Financial Services Business and Financial Services Business
FY2006 semi-annual (April 2005 through September 2005)
FY2005 semi-annual (April 2004 through September 2004)
(Non-financial services) Cash flows from operating activities : Net income 513,540 517,917
Adjustments to reconcile net income to net cash provided by operating activities
Depreciation 409,883 389,059 Pension and severance costs, less payments 12,982 2,857 Loss on disposal of fixed assets 26,774 18,540 Unrealized losses on available-for-sale securities, net 4,460 1,997 Deferred income taxes (35,348) 19,492 Minority interest in consolidated subsidiaries 30,043 26,413 Equity in earnings of affiliated companies (57,274) (50,762) Changes in operating assets and liabilities and other 124,373 22,187
Net cash provided by operating activities 1,029,433 947,700 Cash flows from investing activities : Additions to fixed assets excluding equipment leased to others (713,143) (531,073) Additions to equipment leased to others (75,154) (74,094) Proceeds from sales of fixed assets excluding equipment leased to
others 35,193 26,037
Proceeds from sales of equipment leased to others 42,397 38,576 Purchases of marketable securities and security investments (297,235) (686,319) Proceeds from sales of and maturity of marketable securities and
security investments 358,417 166,815
Payment for additional investments in affiliated companies, net of cash acquired (129) (683)
Changes in investments and other assets and other (55,041) 42,691 Net cash used in investing activities (704,695) (1,018,050)
Cash flows from financing activities : Purchase of common stock (59,734) (206,917) Proceeds from issuance of long-term debt 20,766 13,463 Payments of long-term debt (34,976) (28,653) Increase in short-term borrowings 40,055 45,804 Dividends paid (130,724) (83,250) Other – (7,000)
Net cash used in financing activities (164,613) (266,553)Effect of exchange rate changes on cash and cash equivalents 27,803 32,063 Net increase (decrease) in cash and cash equivalents 187,928 (304,840)Cash and cash equivalents at beginning of period 1,324,126 1,618,876 Cash and cash equivalents at end of period 1,512,054 1,314,036
Consolidated 22
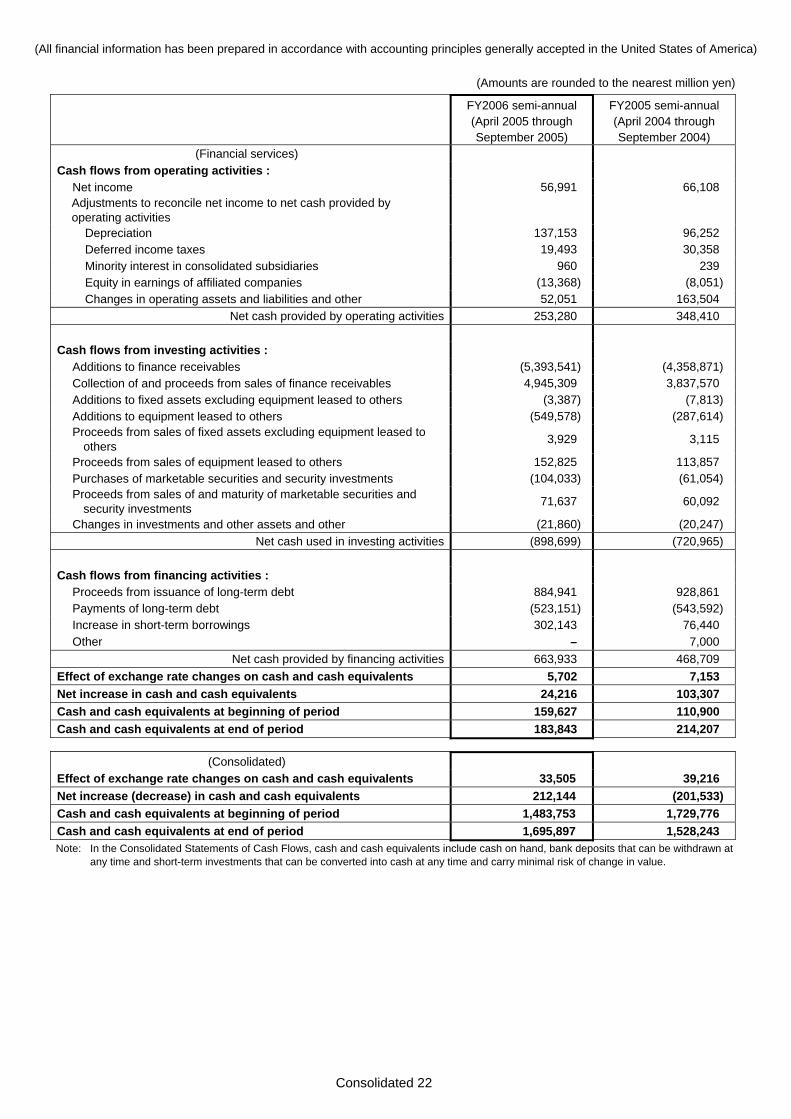
(All financial information has been prepared in accordance with accounting principles generally accepted in the United States of America)
(Amounts are rounded to the nearest million yen)
FY2006 semi-annual (April 2005 through September 2005)
FY2005 semi-annual (April 2004 through September 2004)
(Financial services) Cash flows from operating activities : Net income 56,991 66,108
Adjustments to reconcile net income to net cash provided by operating activities
Depreciation 137,153 96,252 Deferred income taxes 19,493 30,358 Minority interest in consolidated subsidiaries 960 239 Equity in earnings of affiliated companies (13,368) (8,051) Changes in operating assets and liabilities and other 52,051 163,504
Net cash provided by operating activities 253,280 348,410 Cash flows from investing activities : Additions to finance receivables (5,393,541) (4,358,871) Collection of and proceeds from sales of finance receivables 4,945,309 3,837,570 Additions to fixed assets excluding equipment leased to others (3,387) (7,813) Additions to equipment leased to others (549,578) (287,614) Proceeds from sales of fixed assets excluding equipment leased to
others 3,929 3,115
Proceeds from sales of equipment leased to others 152,825 113,857 Purchases of marketable securities and security investments (104,033) (61,054) Proceeds from sales of and maturity of marketable securities and
security investments 71,637 60,092
Changes in investments and other assets and other (21,860) (20,247)Net cash used in investing activities (898,699) (720,965)
Cash flows from financing activities : Proceeds from issuance of long-term debt 884,941 928,861 Payments of long-term debt (523,151) (543,592) Increase in short-term borrowings 302,143 76,440 Other – 7,000
Net cash provided by financing activities 663,933 468,709 Effect of exchange rate changes on cash and cash equivalents 5,702 7,153 Net increase in cash and cash equivalents 24,216 103,307 Cash and cash equivalents at beginning of period 159,627 110,900 Cash and cash equivalents at end of period 183,843 214,207
(Consolidated)
Effect of exchange rate changes on cash and cash equivalents 33,505 39,216 Net increase (decrease) in cash and cash equivalents 212,144 (201,533)Cash and cash equivalents at beginning of period 1,483,753 1,729,776 Cash and cash equivalents at end of period 1,695,897 1,528,243 Note: In the Consolidated Statements of Cash Flows, cash and cash equivalents include cash on hand, bank deposits that can be withdrawn at
any time and short-term investments that can be converted into cash at any time and carry minimal risk of change in value.
Consolidated 23
(All financial information has been prepared in accordance with accounting principles generally accepted in the United States of America)
3. Geographic Information (1) FY2006 semi-annual results (April 2005 through September 2005)
(Amounts are rounded to the nearest million yen)
Japan North America Europe Asia Others Intersegment Elimination Consolidated
Net revenues : (1) Sales to external
customers 3,575,909 3,545,517 1,241,163 891,755 698,816 – 9,953,160
(2) Intersegment sales and transfers
2,457,008 81,835 59,691 105,234 61,242 (2,765,010) –
Total 6,032,917 3,627,352 1,300,854 996,989 760,058 (2,765,010) 9,953,160Operating expenses 5,646,964 3,358,811 1,260,781 921,567 723,863 (2,768,317) 9,143,669Operating income 385,953 268,541 40,073 75,422 36,195 3,307 809,491
(2) FY2005 semi-annual results (April 2004 through September 2004)
(Amounts are rounded to the nearest million yen) Japan North America Europe Asia Others Intersegment
Elimination Consolidated
Net revenues : (1) Sales to external
customers 3,540,760 3,102,246 1,129,304 725,329 528,026 – 9,025,665
(2) Intersegment sales and transfers
2,239,791 87,520 71,993 24,475 54,476 (2,478,255) –
Total 5,780,551 3,189,766 1,201,297 749,804 582,502 (2,478,255) 9,025,665Operating expenses 5,289,985 2,944,990 1,135,027 706,307 555,105 (2,471,998) 8,159,416Operating income 490,566 244,776 66,270 43,497 27,397 (6,257) 866,249
Consolidated 24
(All financial information has been prepared in accordance with accounting principles generally accepted in the United States of America)
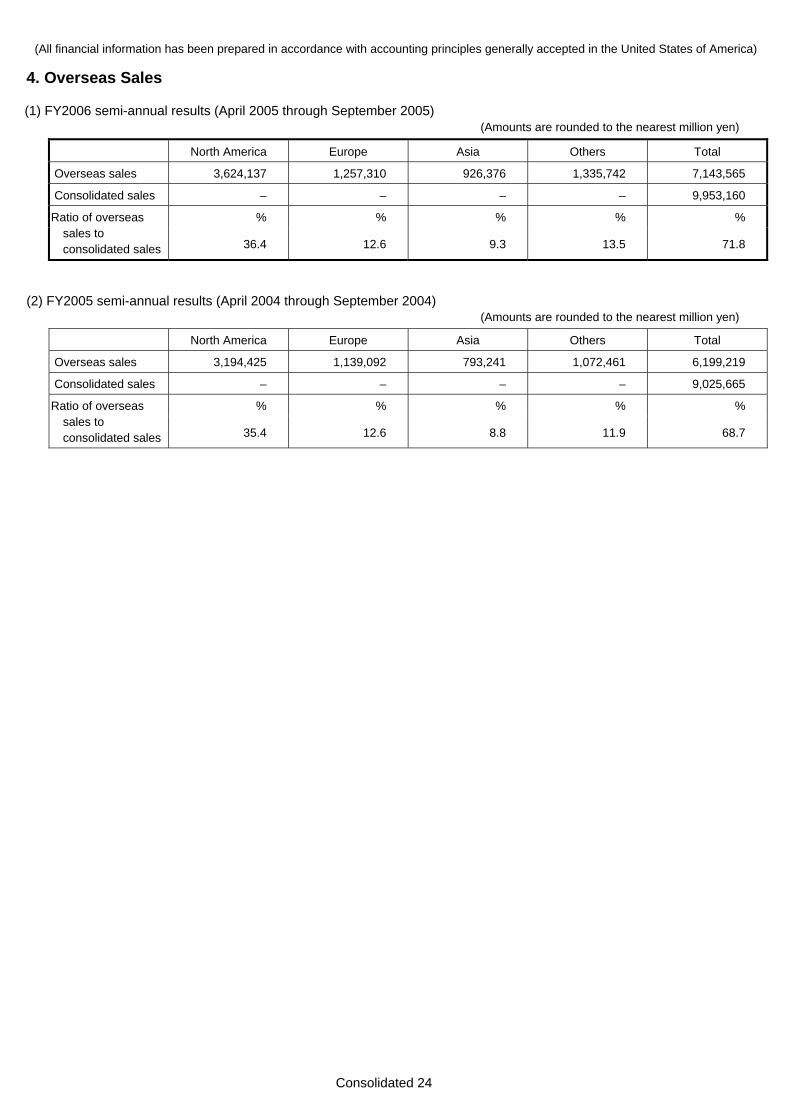
4. Overseas Sales (1) FY2006 semi-annual results (April 2005 through September 2005)
(Amounts are rounded to the nearest million yen)
North America Europe Asia Others Total
Overseas sales 3,624,137 1,257,310 926,376 1,335,742 7,143,565
Consolidated sales – – – – 9,953,160
% % % % % Ratio of overseas sales to consolidated sales 36.4 12.6 9.3 13.5 71.8
(2) FY2005 semi-annual results (April 2004 through September 2004)
(Amounts are rounded to the nearest million yen)
North America Europe Asia Others Total
Overseas sales 3,194,425 1,139,092 793,241 1,072,461 6,199,219
Consolidated sales – – – – 9,025,665
% % % % % Ratio of overseas sales to consolidated sales 35.4 12.6 8.8 11.9 68.7
Unconsolidated 1
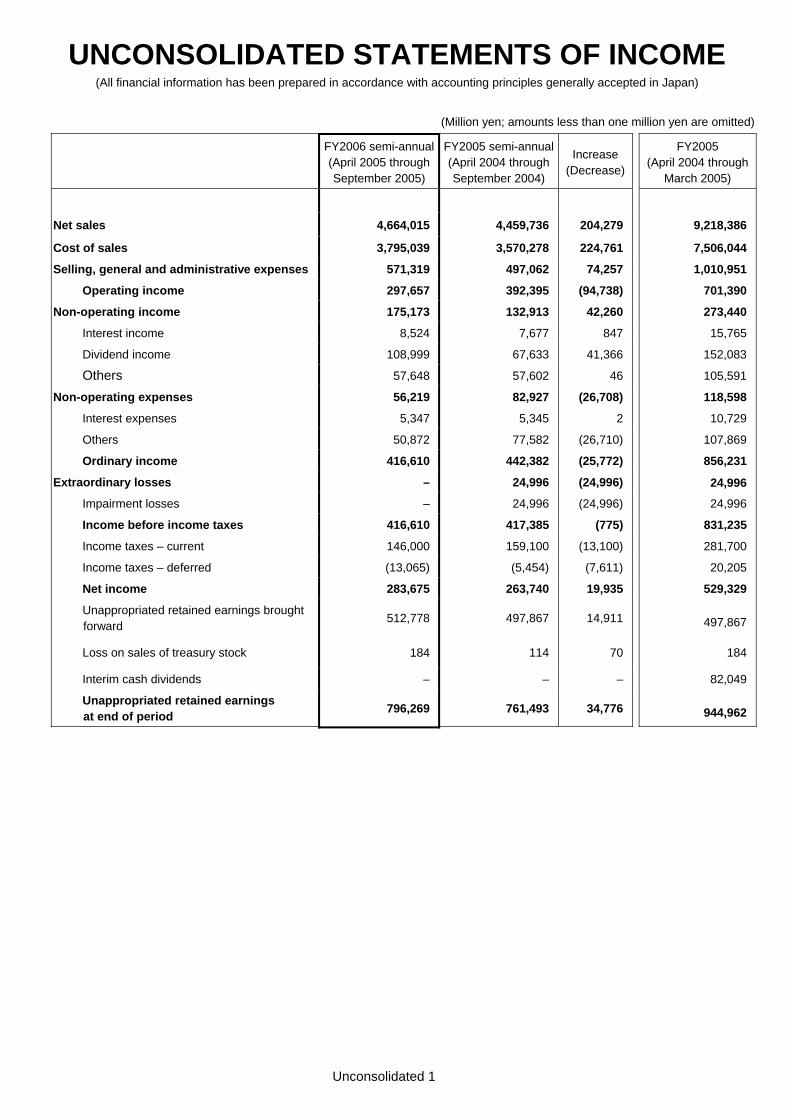
UNCONSOLIDATED STATEMENTS OF INCOME (All financial information has been prepared in accordance with accounting principles generally accepted in Japan)
(Million yen; amounts less than one million yen are omitted)
FY2006 semi-annual(April 2005 throughSeptember 2005)
FY2005 semi-annual(April 2004 throughSeptember 2004)
Increase (Decrease)
FY2005 (April 2004 through
March 2005)
Net sales 4,664,015 4,459,736 204,279 9,218,386
Cost of sales 3,795,039 3,570,278 224,761 7,506,044
Selling, general and administrative expenses 571,319 497,062 74,257 1,010,951
Operating income 297,657 392,395 (94,738) 701,390
Non-operating income 175,173 132,913 42,260 273,440
Interest income 8,524 7,677 847 15,765
Dividend income 108,999 67,633 41,366 152,083
Others 57,648 57,602 46 105,591
Non-operating expenses 56,219 82,927 (26,708) 118,598
Interest expenses 5,347 5,345 2 10,729
Others 50,872 77,582 (26,710) 107,869
Ordinary income 416,610 442,382 (25,772) 856,231
Extraordinary losses – 24,996 (24,996) 24,996
Impairment losses – 24,996 (24,996) 24,996
Income before income taxes 416,610 417,385 (775) 831,235
Income taxes – current 146,000 159,100 (13,100) 281,700
Income taxes – deferred (13,065) (5,454) (7,611) 20,205
Net income 283,675 263,740 19,935 529,329
Unappropriated retained earnings brought forward
512,778 497,867 14,911 497,867
Loss on sales of treasury stock 184 114 70 184
Interim cash dividends – – – 82,049
Unappropriated retained earnings at end of period 796,269 761,493 34,776 944,962
Unconsolidated 2
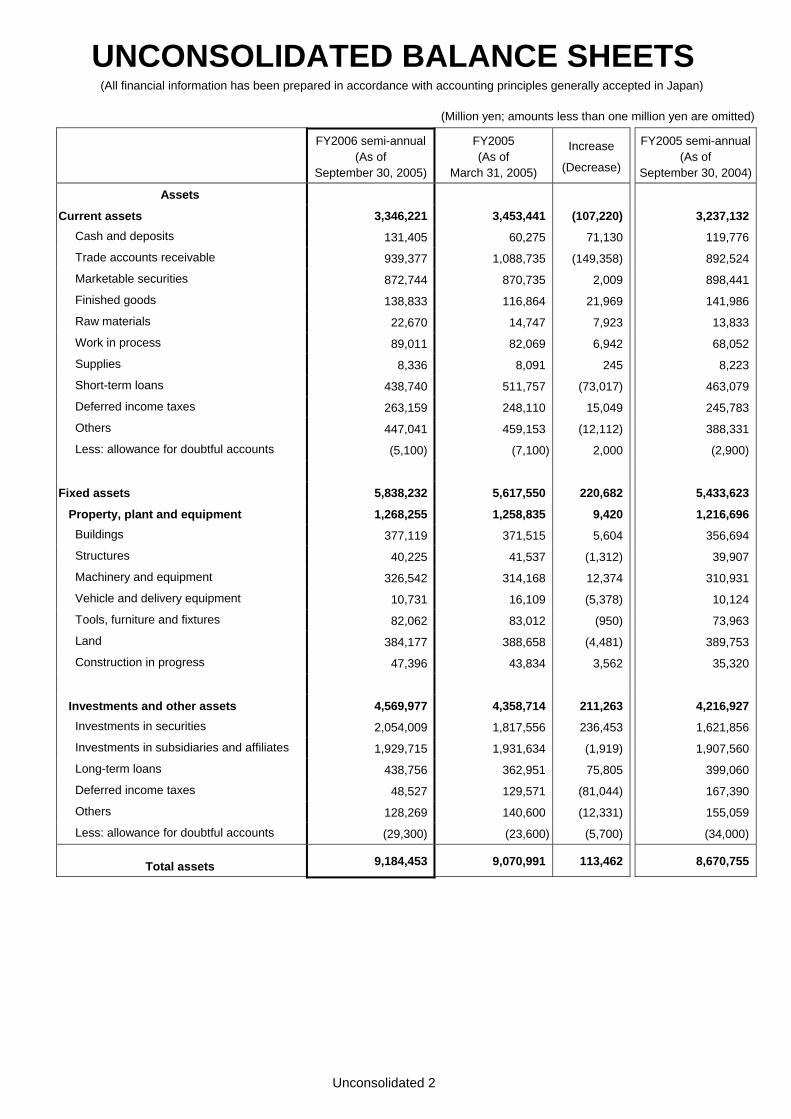
UNCONSOLIDATED BALANCE SHEETS (All financial information has been prepared in accordance with accounting principles generally accepted in Japan)
(Million yen; amounts less than one million yen are omitted)
FY2006 semi-annual
(As of September 30, 2005)
FY2005 (As of
March 31, 2005)
Increase
(Decrease)
FY2005 semi-annual(As of
September 30, 2004)
Assets
Current assets 3,346,221 3,453,441 (107,220) 3,237,132 Cash and deposits 131,405 60,275 71,130 119,776
Trade accounts receivable 939,377 1,088,735 (149,358) 892,524
Marketable securities 872,744 870,735 2,009 898,441
Finished goods 138,833 116,864 21,969 141,986
Raw materials 22,670 14,747 7,923 13,833
Work in process 89,011 82,069 6,942 68,052
Supplies 8,336 8,091 245 8,223
Short-term loans 438,740 511,757 (73,017) 463,079
Deferred income taxes 263,159 248,110 15,049 245,783
Others 447,041 459,153 (12,112) 388,331
Less: allowance for doubtful accounts (5,100) (7,100) 2,000 (2,900)
Fixed assets 5,838,232 5,617,550 220,682 5,433,623
Property, plant and equipment 1,268,255 1,258,835 9,420 1,216,696 Buildings 377,119 371,515 5,604 356,694
Structures 40,225 41,537 (1,312) 39,907
Machinery and equipment 326,542 314,168 12,374 310,931
Vehicle and delivery equipment 10,731 16,109 (5,378) 10,124
Tools, furniture and fixtures 82,062 83,012 (950) 73,963
Land 384,177 388,658 (4,481) 389,753
Construction in progress 47,396 43,834 3,562 35,320
Investments and other assets 4,569,977 4,358,714 211,263 4,216,927 Investments in securities 2,054,009 1,817,556 236,453 1,621,856
Investments in subsidiaries and affiliates 1,929,715 1,931,634 (1,919) 1,907,560
Long-term loans 438,756 362,951 75,805 399,060
Deferred income taxes 48,527 129,571 (81,044) 167,390
Others 128,269 140,600 (12,331) 155,059
Less: allowance for doubtful accounts (29,300) (23,600) (5,700) (34,000)
Total assets 9,184,453 9,070,991 113,462 8,670,755
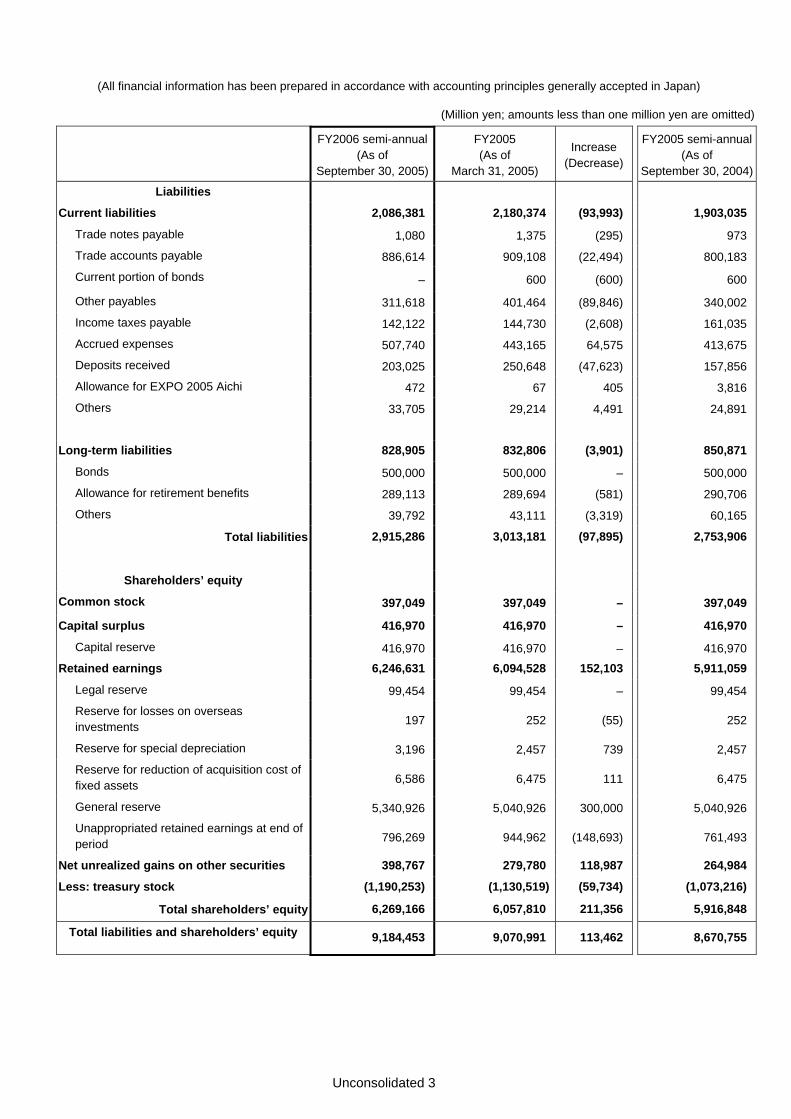
Unconsolidated 3
(All financial information has been prepared in accordance with accounting principles generally accepted in Japan)
(Million yen; amounts less than one million yen are omitted)
FY2006 semi-annual
(As of September 30, 2005)
FY2005 (As of
March 31, 2005)
Increase (Decrease)
FY2005 semi-annual(As of
September 30, 2004)
Liabilities
Current liabilities 2,086,381 2,180,374 (93,993) 1,903,035
Trade notes payable 1,080 1,375 (295) 973
Trade accounts payable 886,614 909,108 (22,494) 800,183
Current portion of bonds – 600 (600) 600
Other payables 311,618 401,464 (89,846) 340,002
Income taxes payable 142,122 144,730 (2,608) 161,035
Accrued expenses 507,740 443,165 64,575 413,675
Deposits received 203,025 250,648 (47,623) 157,856
Allowance for EXPO 2005 Aichi 472 67 405 3,816
Others 33,705 29,214 4,491 24,891
Long-term liabilities 828,905 832,806 (3,901) 850,871
Bonds 500,000 500,000 – 500,000
Allowance for retirement benefits 289,113 289,694 (581) 290,706
Others 39,792 43,111 (3,319) 60,165
Total liabilities 2,915,286 3,013,181 (97,895) 2,753,906
Shareholders’ equity
Common stock 397,049 397,049 – 397,049
Capital surplus 416,970 416,970 – 416,970
Capital reserve 416,970 416,970 – 416,970
Retained earnings 6,246,631 6,094,528 152,103 5,911,059
Legal reserve 99,454 99,454 – 99,454
Reserve for losses on overseas investments 197 252 (55)
252
Reserve for special depreciation 3,196 2,457 739 2,457
Reserve for reduction of acquisition cost of fixed assets 6,586 6,475 111
6,475
General reserve 5,340,926 5,040,926 300,000 5,040,926
Unappropriated retained earnings at end of period 796,269 944,962 (148,693)
761,493
Net unrealized gains on other securities 398,767 279,780 118,987 264,984
Less: treasury stock (1,190,253) (1,130,519) (59,734) (1,073,216)
Total shareholders’ equity 6,269,166 6,057,810 211,356 5,916,848
Total liabilities and shareholders’ equity 9,184,453 9,070,991 113,462 8,670,755