Embed Size (px)
Citation preview
© 2016 YASKAWA Electric Corporation
FY2015 Nine Months Financial Results
(Ended December 20, 2015)
FY2015 Full-year Financial Forecasts
(Ending March 20, 2016)
(TSE 6506)

© 2016 YASKAWA Electric Corporation
Contents
1
1. FY2015 Nine Months Financial Results
• FY2015 Nine Months Financial Results
(Highlights, By Business Segment)
• Sales Breakdown by Business Segment
(FY2014 Nine Months FY2015 Nine Months)
• Sales Breakdown by Destination
(FY2014 Nine Months FY2015 Nine Months)
• Breakdown of Changes in Operating Income
(FY2014 Nine Months FY2015 Nine Months)
• Measures for FY2015 3Q
2. FY2015 Full-year Forecasts
• FY2015 Full-year Financial Forecasts
(Highlights, By Business Segment)
•Breakdown of Changes in Operating Income
(FY2014 FY2015 Forecast)
3. Reference• Capital Expenditure,
R&D Investment, Forex Rates
• Financial Indices
• Net Sales/Operating Income
• Quarterly Sales Trends
• Major Production Bases
The information within this document is
made as of the date of writing. Any
forward-looking statements are made
according to the assumptions of
management and are subject to change
as a result of risks and uncertainties.
YASKAWA Electric Corporation
undertakes no obligation to update or
revise these forward-looking
statements, whether as a result of new
information, future events, or otherwise.

© 2016 YASKAWA Electric Corporation
Business Overview
2
Motion Control
(M)
System Engineering
(S)
Robotics
(R)
Other
[Core products]• AC servo motors and controllers• Linear servo motors• AC drives• PV inverters• Motor drive systems for EV, etc.
[Core products]• Industrial Robots
- Arc and spot welding robots, Painting robots
- FPD glass sheet transfer robots, New generation robots, Handling robots,
• Semiconductor wafer transfer robots• Biomedical robots, etc.
[Core products]• Electrical systems for steel plants• Electrical instrumentation systems for water supply plants and sewage treatment facilities
• Large-scale wind power generator and converter, etc.
AC servo drives
General purpose AC drive
PV inverter using GaN for photovoltaic power generation
Motor drive system for EV Delta robot
Robot system for preprocessing operations
Large-scale wind power generator and converter
Continuous-casting machine
Electric instrumentationsystems for water and sewerage
[Core products]• IT-related services• Logistics, etc.
New spot-welding robot with 7 axises

© 2016 YASKAWA Electric Corporation
1. FY2015 Nine Months Financial Results(Ended December 20, 2015)
3
© 2016 YASKAWA Electric Corporation 4
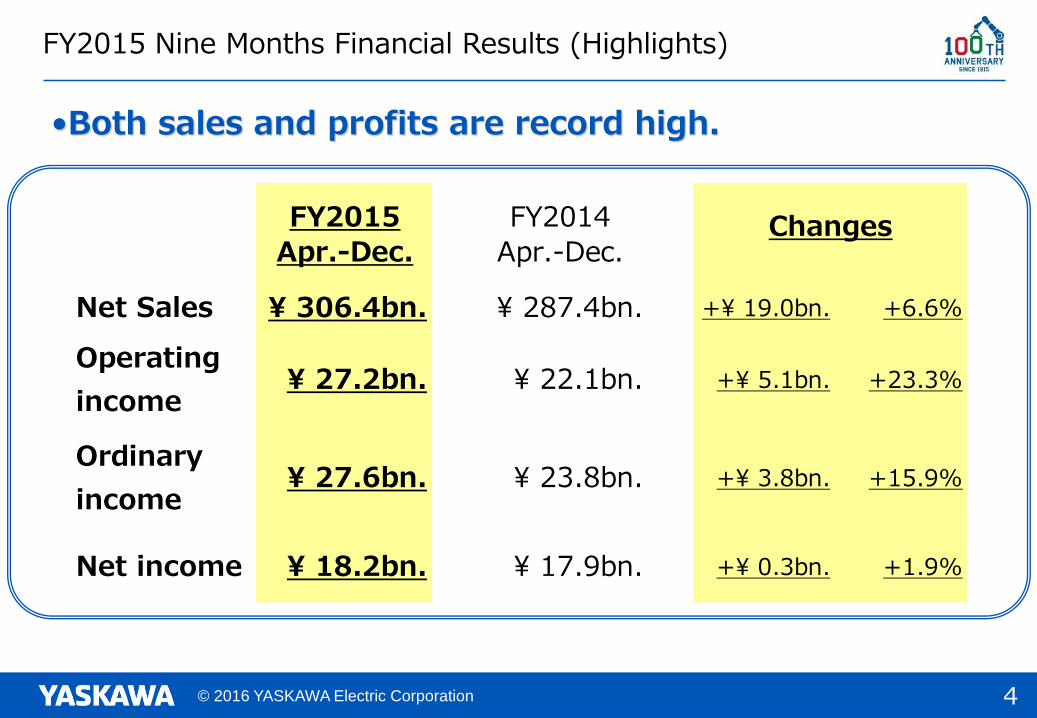
•Both sales and profits are record high.
FY2015 Nine Months Financial Results (Highlights)
FY2015 FY2014
Apr.-Dec. Apr.-Dec.
Net Sales \ 306.4bn. \ 287.4bn. +\ 19.0bn. +6.6%
Operating
income\ 27.2bn. \ 22.1bn. +\ 5.1bn. +23.3%
Ordinary
income\ 27.6bn. \ 23.8bn. +\ 3.8bn. +15.9%
Net income \ 18.2bn. \ 17.9bn. +\ 0.3bn. +1.9%
Changes

© 2016 YASKAWA Electric Corporation 5
• Growth in both sales and operating income was led by (M) and (R).
FY2015 Nine Months Financial Results by Business Segment (1)
Income
ratio
Income
ratioAmounts %
306.4 287.4 +19.0 +6.6%
(M) Motion Control 143.8 138.6 +5.3 +3.8%
(R) Robotics 114.3 98.2 +16.2 +16.5%
(S) System Engineering 27.4 23.9 +3.5 +14.5%
Other 20.9 26.8 -5.9 -22.1%
27.2 8.9% 22.1 7.7% +5.1 +23.3%
(M) Motion Control 17.4 12.1% 16.6 12.0% +0.8 +4.9%
(R) Robotics 12.2 10.7% 7.5 7.6% +4.8 +63.4%
(S) System Engineering -2.2 - -1.7 - -0.5 -
Other 0.6 2.9% 0.7 2.4% -0.0 -6.1%
Elimination or Corporate -0.9 - -1.0 - +0.1 -
27.6 9.0% 23.8 8.3% +3.8 +15.9%
18.2 6.0% 17.9 6.2% +0.3 +1.9%Net income
Operating income
FY2015 Apr.-Dec.
Ordinary income
Changes
Net sales
FY2014 Apr.-Dec.
(Billions of yen)

© 2016 YASKAWA Electric Corporation 6
FY2015 Nine Months Financial Results by Business Segment (2)
Motion Control
Robotics
System Engineering
• Steady AC servo sales were led by the semiconductor industry in the U.S., although smart phone- and automotive-related demand in China was relatively weak.The profitability improved as switch to the new product progressed.
• AC drive demand was sluggish in the U.S. oil/gas industry and the Chinese infrastructure markets. However, the overall sales were firm as the PV inverter sales of Solectia Renewables, LLC contributed.
• The global automotive related demand was strong especially in the U.S. while the demand in China deteriorated in the 2H of fiscal year.
• The sales for non-automotive general industries expanded by utilizing robot centers.
• The steel plant and social system businesses were solid.
• The large scale wind generation-related sales increased by the acquisition of The Switch Engineering Oy in Finland.
© 2016 YASKAWA Electric Corporation 77
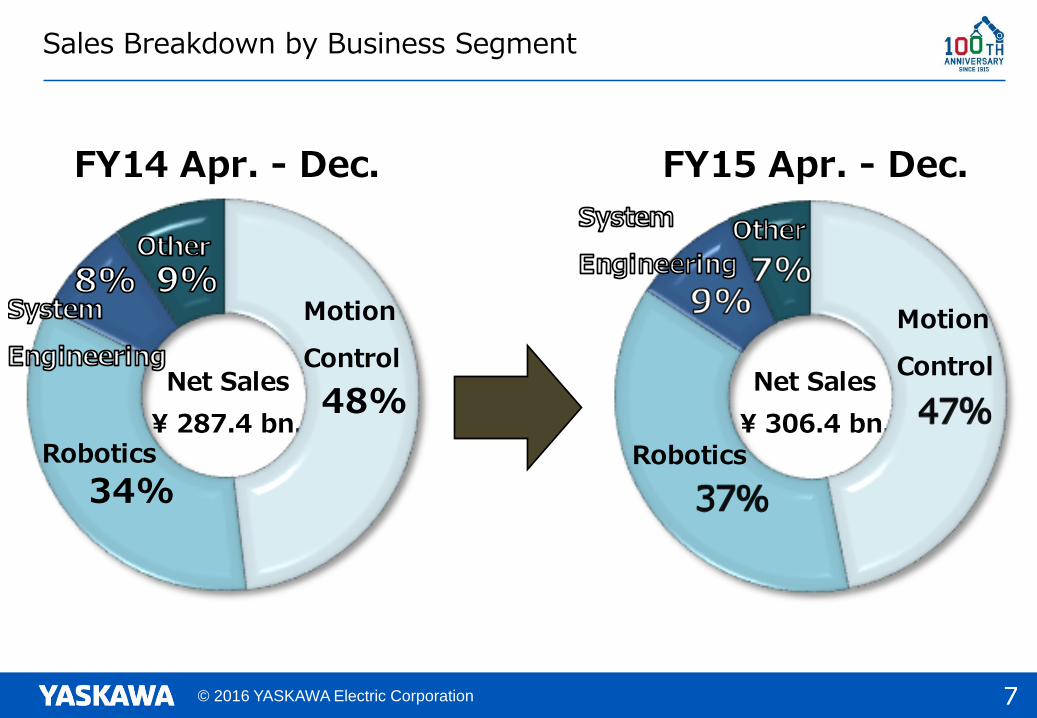
Sales Breakdown by Business Segment
FY14 Apr. - Dec. FY15 Apr. - Dec.
Net Sales Net Sales
\ 287.4 bn. \ 306.4 bn.48%
34%
Motion
Control
Motion
Control
RoboticsRobotics

© 2016 YASKAWA Electric Corporation
• Overseas sales expanded mainly in the Americas.
8
Sales Breakdown by Destination (1)
Note: “Other” include Australia and South Africa, etc.
(Billions of yen)
Amounts %
306.4 287.4 +19.0 +6.6%
Japan 93.4 102.5 -9.1 -8.9%
Overseas 213.0 184.9 +28.1 +15.2%
The Americas 64.5 51.8 +12.7 +24.5%
Europe 39.1 34.1 +4.9 +14.4%
China 65.6 61.8 +3.8 +6.2%
Asian Countries Except China 40.5 34.4 +6.1 +17.9%
Other 3.3 2.7 +0.5 +19.5%
Net sales
FY15
Apr. - Dec.
FY14
Apr. - Dec.
Changes

© 2016 YASKAWA Electric Corporation 9
Sales Breakdown by Destination (2)
FY14 Apr. - Dec. FY15 Apr. - Dec.
Net Sales Net Sales
\ 287.4 bn. \ 306.4 bn.22%
12%
1%
21%
13%
1%
China
Other
China
Other
Over-seas
Over-seas
Asian Countries
Except China
Asian Countries
Except China
• Overseas sales grew significantly mainly due to
strong sales in the Americas.

© 2016 YASKAWA Electric Corporation
Breakdown of Changes in Operating Income(FY14 Nine Months FY15 Nine Months)
-0.1
+4.6
+2.9 -2.2
+5.1
22.1
27.2
FY2014Apr.-Dec.
FY2015Apr.-Dec.
10
(Unit: Billions of yen)
Profitdecrease
due to sales decrease
Effects of changes in forex
rates
Increase in added value
Increase in expenses

© 2016 YASKAWA Electric Corporation
• Development of servo motor with built-in amplifier with GaN※ (Launch is scheduled by 2017)
Integrated conventional servo mortar and servo pack functions
Futher downsizing (volume ratio: ¼), higher efficiency (Electric loss redused by 12%)
* Compund of Ga (Gallium) and N (Nitrogen)
Servo motor with built-in amplifier
• Launch PV inverter with high-frequency insulating transformers “Enewell-SOL P2H” (Launch is scheduled in January,2016)
Adopted high-frequency insulating transformers to match the market trend
Realized downsizing, improved environmental performance and maintainability
Industrial AC drive “GA700” for general application
• Development of next generation AC drive “ Zero series” (Launch is scheduled in April, 2016)
Renovated conventional series and developed
new general-purpose AC drive “GA700”
Develop value-added products for different applications optimized
for regions and markets
11
Enewell-SOL P2H (9.9kW 200V class Three-phase)
Measures for FY2015 3Q (1)
Conventional servo motor
Conventionalservo pack
Servo motor with built-in amplifier
Servomotor
Amplifier

© 2016 YASKAWA Electric Corporation
• Development of robot “MOTOMAN-HC10” that collaborates with humans Realize coexistence with humans without safety fences based on International Standard
Promote its introduction with space saving and improved operability
• Development of “2016 model” robots(MOTOMAN-GP series)and new controller (Launch is scheduled in June, 2016)
Realize the fastest speed and slimmest shape in the world
Realize controller of the smallest size in the world
MOTOMAN-HC10
• Increase sales to the general industries through robot centers Foster and develop SIers in general industries
Newly estbalished in Korea (Taegu) (Oct. 2015) and China (Foshan) (Dec. 2015)
• Fortify product development in Humatronics fields Develop robot nursing care equipment “Indoor Movement Support Device”* Support the movement in hospitals, care houses, and homes* Initiative as a part of development and introduction promotion project for robot nursing care equipment Ministry of
Economy, Trade, and Industry Japan Agency for Medical Research and Development
Indoor Movement
Supporting Device
Korea Robot Center
12
Measures for FY2015 3Q (2)
MOTOMAN-GP8
New controller“YRC1000”
By 3Q/FY15 4Q/FY(Plan) End of FY15(Plan)
35 1 36
■The Number of Robot Centers in the world

© 2016 YASKAWA Electric Corporation
2. FY2015 Full-year Financial Forecasts (Ending March 20, 2016)
13

© 2016 YASKAWA Electric Corporation
• Both sales and profits are revised down mainly due to the
slowdown of Chinese economy.
• The projected sales and operating income are higher than the
results of previous year.
14
FY2015 Full-year Financial Forecasts (Highlights)
Notes: The figures of FY2015 Previous forecasts were announced on October 20, 2015
FY2015 FY2015
Forecast Previous forecast Amounts %
Net sales \ 410.0bn. \ 420.0bn. -\ 10.0bn. \ 400.2bn. +\ 9.8bn. +2.5%
Operating
income\ 35.5bn. \ 36.5bn. -\ 1.0bn. \ 31.5bn. +\ 4.0bn. +12.6%
Ordinary
income\ 35.5bn. \ 37.0bn. -\ 1.5bn. \ 33.9bn. +\ 1.6bn. +4.8%
Net
income\ 23.0bn. \ 24.0bn. -\ 1.0bn. \ 24.8bn. -\ 1.8bn. -7.3%
Changeschange from
Previous
forecast
FY2014
Results

© 2016 YASKAWA Electric Corporation 15
• Sales and profits in (M) and (R) are revised down due to slowdown of Chinese markets.
FY2015 Full-year Financial Forecasts (by Business Segment)
Current
forecast
Income
ratio
Previous
forecast
Income
ratio
Income
ratioAmounts %
410.0 420.0 -10.0 400.2 +9.8 +2.5%
(M) Motion Control 186.0 194.5 -8.5 188.1 -2.1 -1.1%
(R) Robotics 153.5 153.0 +0.5 136.0 +17.5 +12.9%
(S) System Engineering 42.0 43.0 -1.0 41.0 +1.0 +2.5%
Other 28.5 29.5 -1.0 35.1 -6.6 -18.8%
35.5 8.7% 36.5 8.7% -1.0 31.5 7.9% +4.0 +12.6%
(M) Motion Control 20.7 11.1% 22.4 11.5% -1.8 21.7 11.6% -1.1 -5.0%
(R) Robotics 16.2 10.6% 15.6 10.2% +0.6 10.6 7.8% +5.6 +53.4%
(S) System Engineering -1.1 - -1.3 - +0.2 -0.8 - -0.4 -
Other 0.9 3.3% 1.0 3.2% -0.0 1.3 3.6% -0.3 -27.2%
Elimination or Corporate -1.2 - -1.2 - +0.1 -1.3 - +0.1 -
35.5 8.7% 37.0 8.8% -1.5 33.9 8.5% +1.6 +4.8%
23.0 5.6% 24.0 5.7% -1.0 24.8 6.2% -1.8 -7.3%
Changes
Net sales
Change from
previous
forecast
FY2015 FY2015
Operating income
Ordinary income
Net income
FY2014
(Billions of yen)
Notes: The figures of FY2015 Previous forecasts were announced on October 20, 2015

© 2016 YASKAWA Electric Corporation
-2.1
+3.3
+3.7 -0.9
+4.0
35.5
FY2014
FY2015Forecast
31.5
16
Breakdown of Changes in Operating Income (FY2014 FY2015 Forecast)
(Billions of yen)
Profitdecrease
due to sales decrease
Effects of changes in forex
rates
Increase inadded value Increase
in expenses

© 2016 YASKAWA Electric Corporation
3. Reference
17

© 2016 YASKAWA Electric Corporation 18
Capital Expenditure, R&D Investment, Forex Rates
◆Capital expenditure (Unit: Billions of yen)
Capital Expenditure
Depreciation and Amortization
◆R&D investment (Unit: Billions of yen)
R&D investment
◆Forex rates (unit: Yen)
4-12 4Q 2H Full-year 4-12 4Q 2H Full-year4-12
(actual)
4Q
(Forecast)
2H
(Forecast)
Full-year
(Forecast)
U.S. dollar 98.4 102.9 101.0 99.6 104.8 118.4 114.2 108.2 121.6 115.0 118.0 119.9
Euro 130.2 140.3 136.9 132.7 139.5 140.0 139.9 139.7 134.2 125.0 129.4 131.9
Note: Average rate during the period
FY2013 FY2014 FY2015
14.0 15.3 15.0
FY2013 FY2014 FY2015 Plan
9.2 11.5 13.5
17.0 36.4 18.0
FY2013 FY2014 FY2015 Plan

© 2016 YASKAWA Electric Corporation
Financial Indices
(Billions of yen)
Shareholders’
equity ratio
(right scale)
Shareholders’ equity
(left scale)
Interest-bearing debt(left scale)
38 53
81 101 97
88 93 100 112 134
171
78
63 47 34 33
42 41 59 55 56 52
15.1%
20.7%
29.6%
34.9%
39.0%36.6% 35.2% 35.9% 37.1%
39.4%
44.1%
0%
10%
20%
30%
40%
0
50
100
150
200
FY2004 FY2005 FY2006 FY2007 FY2008 FY2009 FY2010 FY2011 FY2012 FY2013 FY2014(Billions of yen)
Shareholders’ equity ratio 44.1% Shareholders’ equity 171.4 billion yen
Interest-bearing debt 52.4 billion yen D/E ratio 0.31
(Net D/E ratio) 0.16
Inventory 85.5 billion yenTurnover 2.6 months
ROE 16.3%
As of March 20, 2015
Shareholders’ equity ratio 48.1% Shareholders’ equity 187.4 billion yen
Interest-bearing debt 49.0 billion yen D/E ratio 0.26
(Net D/E ratio) 0.12
Inventory 88.6 billion yenTurnover 2.6 months
As of December 20, 2015
Operating CF 5.8 18.7 15.0 17.7 12.5 4.0 2.5 6.4 24.6 24.0 29.0
Investment CF -2.2 -9.7 -6.1 -9.9 -10.7 -6.5 -6.7 -11.9 -18.1 -16.9 -27.9
Free CF 3.5 9.0 8.9 7.8 1.8 -2.4 -4.3 -5.5 6.6 7.0 1.1
19
*Interest-bearingdebt includes convertible bonds and lease obligations. *Inventoryat the end of the period is used for calculating turnover
months .*ROE= Net income / Shareholders’ equity (average of beginning and
end of fiscal year)

© 2016 YASKAWA Electric Corporation
400.2
31.5
7.9
Results
Realize 100
263.0
309.6322.9
350.2368.9
12.4
17.5
24.4
33.5
20.8
382.3
36.4
4.75.7
9.19.5
7.6
5.9
0806 07
-6.9
224.7
4.3
09050403
296.8
12.8
-3.1307.1
14.8
4.8
10 11
4.3
12
4.2
13
310.3
13.0
Net sales (billions of yen)
Operating income ratio (%)
Operating income (billions of yen)
Win21 Plus Dash 100
Mid-term Business Plans
Challenge100 (Four-year Plan)
FY2003-2015 Net Sales/Operating Income
Forecast
25.7
363.6
7.1
1514
410.0
35.5
8.7
20

© 2016 YASKAWA Electric Corporation
0
200
400
600
800
1,000
1,200
13/1Q 13/2Q 13/3Q 13/4Q 14/1Q 14/2Q 14/3Q 14/4Q 15/1Q 15/2Q 15/3Q
0
200
400
600
800
1,000
1,200
13/1Q 13/2Q 13/3Q 13/4Q 14/1Q 14/2Q 14/3Q 14/4Q 15/1Q 15/2Q 15/3Q
21
Quarterly Sales Trends (1)
Business Segment Destination( Billions of yen ) ( Billions of yen )
Notes: (M)=Motion Control (R)=Robotics (S)=System Engineering
The Americas
Japan
China
Europe
Other Asian
countries
(M)
(R)
Other
(S)

© 2016 YASKAWA Electric Corporation
0
50
100
150
200
250
300
350
400
13/1Q 13/2Q 13/3Q 13/4Q 14/1Q 14/2Q 14/3Q 14/4Q 15/1Q 15/2Q 15/3Q
0
50
100
150
200
250
300
350
400
450
500
13/1Q 13/2Q 13/3Q 13/4Q 14/1Q 14/2Q 14/3Q 14/4Q 15/1Q 15/2Q 15/3Q
22
Quarterly Sales Trends (2)
( Billions of yen ) ( Billions of yen )(R) Robotics(M) Motion Control
The Americas
Japan
China
Europe
Other Asian
countries
© 2016 YASKAWA Electric Corporation
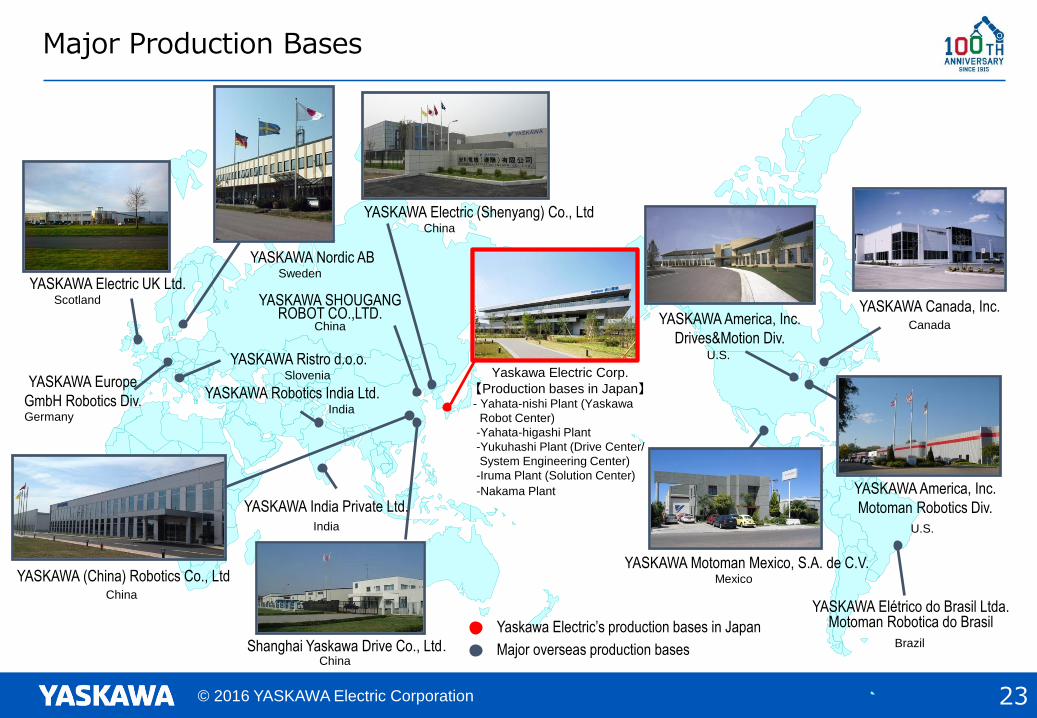
Major Production Bases
YASKAWA America, Inc.
Drives&Motion Div.
YASKAWA Electric UK Ltd.
YASKAWA Nordic AB
Shanghai Yaskawa Drive Co., Ltd.
Yaskawa Electric Corp.
【Production bases in Japan】- Yahata-nishi Plant (Yaskawa
Robot Center)
-Yahata-higashi Plant
-Yukuhashi Plant (Drive Center/
System Engineering Center)
-Iruma Plant (Solution Center)
-Nakama Plant
Major overseas production bases
Yaskawa Electric’s production bases in Japan
Scotland
Germany
Sweden
Canada
U.S.
YASKAWA America, Inc.
Motoman Robotics Div.
Mexico
YASKAWA Europe
GmbH Robotics Div.
YASKAWA Ristro d.o.o.Slovenia
China
YASKAWA Electric (Shenyang) Co., LtdChina
YASKAWA SHOUGANG ROBOT CO.,LTD.
China
U.S.
YASKAWA Canada, Inc.
YASKAWA Motoman Mexico, S.A. de C.V.
YASKAWA India Private Ltd.India
India
YASKAWA (China) Robotics Co., LtdChina
YASKAWA Elétrico do Brasil Ltda. Motoman Robotica do Brasil
YASKAWA Robotics India Ltd.
Brazil
23

© 2016 YASKAWA Electric Corporation