Embed Size (px)
Citation preview

FY2016 3Q Financial Results January 31, 2017 TOPCON CORPORATION Director and Executive Officer, CFO General Manager of Accounting & Finance Div. Haruhiko Akiyama

©2017 Topcon Corporation 1
FY2016 Full Year Plan
Ⅲ Appendix
Ⅰ FY2016 3Q Financial Results
Ⅱ
CONTENTS
FY2016 3Q Financial Results

©2017 Topcon Corporation 2
Ⅰ. FY2016 3Q Financial Results Ⅰ-1. FY2016 3Q Financial Results
Ⅰ-2. Overview of Each Business
©2017 Topcon Corporation 3
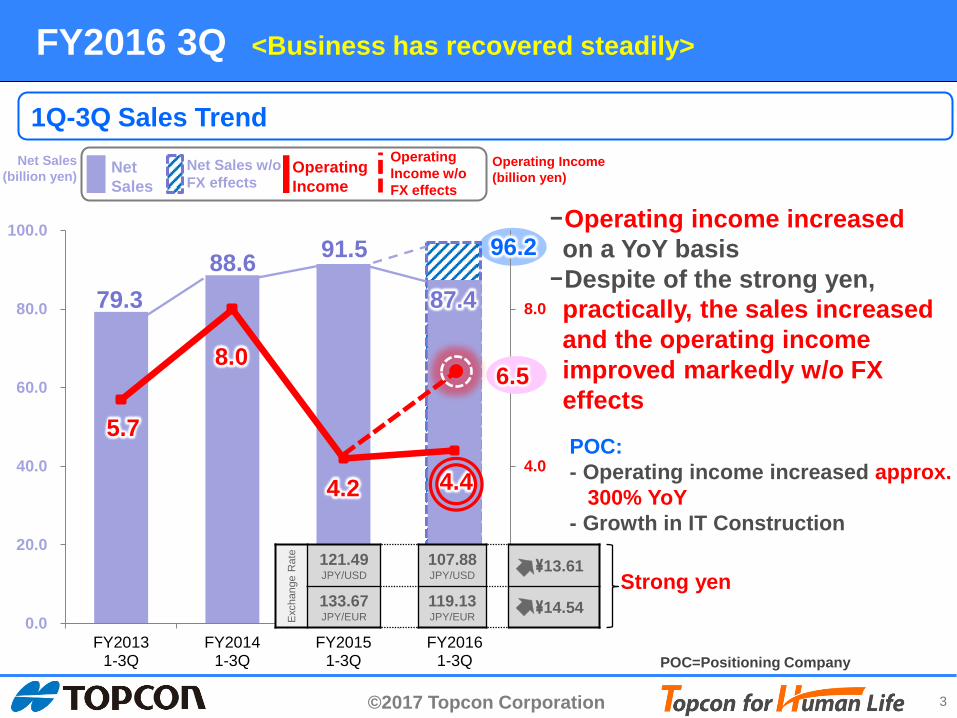
1Q-3Q Sales Trend
0.0
4.0
8.0
0.0
20.0
40.0
60.0
80.0
100.0
FY20131-3Q
FY20141-3Q
FY20151-3Q
FY20161-3Q
96.2
POC=Positioning Company
6.5 8.0
5.7
88.6
4.2
79.3
91.5
87.4
4.4
FY2016 3Q <Business has recovered steadily>
Net Sales
Operating Income
Net Sales w/o FX effects
Net Sales (billion yen)
Operating Income w/o FX effects
Operating Income (billion yen)
Strong yen
Exc
hang
e R
ate 121.49
JPY/USD 107.88 JPY/USD
¥13.61
133.67 JPY/EUR
119.13 JPY/EUR
¥14.54
POC: - Operating income increased approx. 300% YoY - Growth in IT Construction
-Operating income increased on a YoY basis -Despite of the strong yen, practically, the sales increased and the operating income improved markedly w/o FX effects

©2017 Topcon Corporation 4
FY2016 3Q累計実績 <営業利益は増益>
[Consolidated]
FY2015/1-3Q FY2016/1-3Q
Actual Actual YoY FY15 Exchange Rate Conversion
Conversion YoY YoY%
Net Sales 91,542 87,422 -4,119 96,230 4,688 105%
Gross Profit (Gross Profit Ratio)
46,716 (51.0%)
45,125 (51.6%)
-1,590
SGA 42,565 40,713 -1,852 Operating Income (Operating Income Ratio)
4,150 (4.5%)
4,412 (5.0%)
261
6,540 (6.8%)
2,390
158%
Non-Operating Income (Expenses) -956 -1,403 -447 -1,062 -106
Ordinary Income 3,194 3,009 -185 5,478 2,284 172% Extraordinary Income (Loss) -271 -174 96 Income Before Income Taxes and Minority Interests 2,923 2,834 -88
Net Income 1,098 878 -219 2,697 1,599 246%
Exchange Rate (Average)
USD ¥121.49 ¥107.88 ¥-13.61 ¥121.49
EUR ¥133.67 ¥119.13 ¥-14.54 ¥133.67
(unit: million yen)
FY2016 3Q Financial Results <Increased operating income on a YoY basis>
*The previously reported amount in FY2015 Q1 to Q3 is retrospectively adjusted by determining provisional accounting of business combination.

©2017 Topcon Corporation 5
[Consolidated] FY2015/1-3Q FY2016/1-3Q
Actual Actual YoY FY15 Exchange Rate Conversion
Conversion YoY YoY%
Net Sales
Positioning 44,711 40,734 -3,977 45,833 1,122 103% Smart Infrastructure 23,089 22,445 -644 24,117 1,028 104%
Eye Care 29,305 30,078 773 33,077 3,772 113% Others 4,285 2,596 -1,689 2,646 -1,639 62% Elimination -9,849 -8,431 1,417 -9,444 405 Total 91,542 87,422 -4,119 96,230 4,688 105%
Operating Income
(Operating Income Ratio)
Positioning 1,021 (2.3%)
3,010 (7.4%)
1,989 (295%)
3,387 (7.4%)
2,366
332%
Smart Infrastructure
2,436 (10.6%)
1,702 (7.6%)
-733
2,268 (9.4%)
-168
93%
Eye Care 2,571 (8.8%)
1,716 (5.7%)
-854
3,076 (9.3%)
505
120%
Others 79 (1.8%) -123 -202 -123 -202 -
Goodwill Amortization -1,957 -1,894 63 -2,066 -109
Total 4,150 (4.5%)
4,412 (5.0%)
261
6,540 (6.8%)
2,390
158%
(unit: million yen)
FY2016 3Q Financial Results by Business <Dynamic improvement in Positioning Business>

©2017 Topcon Corporation 6
FY2015/1-3Q
FY2015/1-3Q FY2015/1-3Q FY2016/1-3Q FY2016/1-3Q
FY2016/1-3Q
POC: Growing sales in IT Construction ECB: A successful launch of Maestro
24.8 27.0 25.3 24.6
6.2
107%
123%
5.0
SIB: Sales increase in i-Construction business
FY2015/1-3Q FY2016/1-3Q
Domestic and Overseas Sales (YoY, at constant currency)
POC=Positioning Company/ SIB=Smart Infrastructure Business/ ECB=Eye Care Business
Japan North America
Europe
China Asia/Oceania Others
(Billion yen) (Billion yen) (Billion yen)
(Billion yen) (Billion yen) (Billion yen)
FY2015/1-3Q FY2016/1-3Q 10.9 10.0
109%
101%
FY2015/1-3Q FY2016/1-3Q 17.7 15.8
112%
6.9
106%
6.5 POC/SIB: Strong sales
POC: Strong sales
POC/ECB: Strong sales SIB/ECB: Strong sales
* "i-Construction" is a registered trademark of National Institute for Land and Infrastructure Management, MLIT, JAPAN.

©2017 Topcon Corporation 7
4.2
1.1
1.2
6.5
-2.1
4.4
0.0
2.0
4.0
6.0
8.0
FY2015 1-3Q Sales increase anddecrease, Product
mix
Reduction of fixedcost/ Lowering
COGS
FX Effects FY2016 1-3Q
(unit: Billion yen)
Operating Income w/o FX effects
FY2016 1-3Q Operating Income Breakdown <Increased operating income on a YoY basis>

©2017 Topcon Corporation 8
Ⅰ. FY2016 3Q Financial Results Ⅰ-1. FY2016 3Q Financial Results
Ⅰ-2. Overview of Each Business
©2017 Topcon Corporation 9
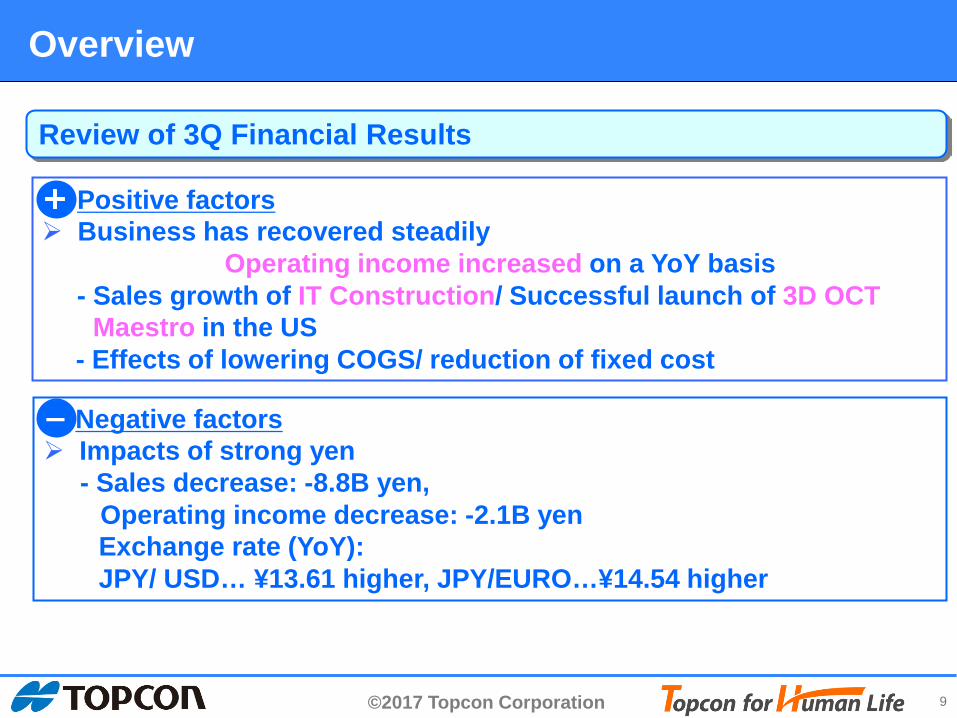
Overview Review of 3Q Financial Results
Positive factors Business has recovered steadily Operating income increased on a YoY basis - Sales growth of IT Construction/ Successful launch of 3D OCT Maestro in the US - Effects of lowering COGS/ reduction of fixed cost
ー Negative factors Impacts of strong yen - Sales decrease: -8.8B yen,
Operating income decrease: -2.1B yen Exchange rate (YoY): JPY/ USD… ¥13.61 higher, JPY/EURO…¥14.54 higher

©2017 Topcon Corporation 10
Positive factors Growing sales in IT Construction (YoY 115%) IT Agriculture showed 2 straight quarters of growth on a YoY basis Major operating income improvement (increased threefold from the
same term last year) New products, lowering COGS/ reduction of fixed cost have contributed
Topics
■ OEM agreement with SAME DEUTZ-FAHR* (Released: Nov. 17th, 2016)
- Enter into a long-term partnership for OEM supply of IT agriculture products and development of next-generation IoT Ag solutions * SAME DEUTZ-FAHR is the Italy’s leading manufacturer of tractors
Overview of Each Business Review of 3Q Financial Results

©2017 Topcon Corporation 11
Positive factors A sales increase in the i-Construction business in Japan (YoY150%) A sales increase in growing India’s market (YoY130%)
ー Negative factors Market stagnation in Middle East and South America
Topics
■ Established another i-Construction Training Center (Released: Dec. 22nd, 2016)
- Following those in Fukushima and Kobe, 3rd one was established in Kitakyushu to adapt to a demand increase for i-Construction in Japan.
■ Acquire software developing company Mirage Technologies S.L.. (Released: Dec 8th, 2016)
- Acquired Mirage Technologies S.L. in anticipation of the transition to cloud-based processing for 3D Mass data.
Overview of Each Business
* "i-Construction" is a registered trademark of National Institute for Land and Infrastructure Management, MLIT, JAPAN.
Review of 3Q Financial Results

©2017 Topcon Corporation 12
Positive factors A successful launch and a good reputation of 3D OCT Maestro in
US with positive feedback China: strong sales in optometry market, sales growth of OCT (YoY
130%)
■ Acquire leading distributor Mehra Eyetech in India (Released: Dec. 2nd, 2016)
- Strengthen direct selling system of OCT and IT solution products in India by acquiring the leading distributor
Topics
ー Negative factors European market: Declining price competitiveness by strong yen
Overview of Each Business Review of 3Q Financial Results

©2017 Topcon Corporation 13
Ⅱ. FY2016 Full Year Plan Ⅱ-1. FY2016 Full Year Plan Ⅱ-2. Summary

©2017 Topcon Corporation 14
00.0
5.0
10.0
1Q 1H 1-3Q FullYear
1Q 1H 1-3Q FullYear
8.8
0.7
9.5
0.7
3.7
Actual Plan
FY2015 FY2016
4.5
121.34 121.50 121.49 120.16 109.07 106.43 107.88 107.21 USD
133.86 134.60 133.67 132.36 122.47 119.12 119.13 118.18 EUR
Exch
ange
Rat
e
4.2 4.4
Dynamic improvement in Positioning Business Although operating income in 1H decreased, 3Q turned into positive in a YoY comparison Increased sense of uncertainty over the economic environment in Europe and the United States
Operating Income Operating Income (billion yen)
(JPY)
FY2015 Result Transition and FY2016 Full Year Plan

©2017 Topcon Corporation 15
[Consolidated] FY2015 FY2016 Full Year Full Year Announced on
Oct. 28th, 2016 Actual Plan YoY(%)
Net Sales 130,735 125,000 96% 125,000
Operating Income (Operating Income Ratio)
8,803 (6.7%)
9,500(7.6%) 108% 9,500 (7.6%)
Ordinary Income 7,366 7,500 102% 7,500
Net Income*1 4,197 4,200 100% 4,200
ROE 6.9% 7.5% 7.5%
Dividends ¥24 ¥16 ¥16
Exchange Rate*2 (Average)
US$ ¥120.16 ¥107.21 ¥105.77 EUR ¥132.36 ¥118.18 ¥117.22
*1 According to change in Japanese Accounting Standards, the former Net Income is shown as "Profit (loss) attributable to owners of parent" on financial statements.
(unit: million yen)
*2 Assumed exchange rate after January 2017 is ¥105/US$, ¥115/EUR
FY2016 Full Year Plan

©2017 Topcon Corporation 16
[Consolidated]
FY2015 FY2016
Full Year Full Year Announced on Oct. 28th, 2016 Actual Plan YoY (%)
Net Sales
Positioning 61,977 56,000 90% 56,000
Smart Infrastructure 32,989 33,000 100% 33,000
Eye Care 43,834 44,000 100% 44,000
Others 4,997 4,000 80% 4,000
Elimination -13,063 -12,000 -12,000
Total 130,735 125,000 96% 125,000
Operating Income
(Operating Income Ratio)
Positioning 2,385 (3.8%)
4,500 (8.0%) 189% 4,500
(8.0%)
Smart Infrastructure 3,909 (11.8%)
3,500 (10.6%) 90% 3,500
(10.6%)
Eye Care 4,850 (11.1%)
4,000 (9.1%) 82% 4,000
(9.1%)
Others 196 (3.9%)
0 (0.0%) - 0
(0.0%)
Goodwill Amortization -2,538 -2,500 -2,500
Total 8,803 (6.7%)
9,500 (7.6%) 108% 9,500
(7.6%)
Exchange Rate (Average)
USD ¥120.16 ¥107.21 ¥105.77
EUR ¥132.36 ¥118.18 ¥117.22
FY2016 Full Year Plan by Business (unit: million yen)

©2017 Topcon Corporation 17
Ⅱ. FY2016 Full Year Plan Ⅱ-1. FY2016 Full Year Plan Ⅱ-2. Summary

©2017 Topcon Corporation 18
Summary
0.0
5.0
10.0
15.0
20.0
0.0
40.0
80.0
120.0
FY2013 FY2014 FY2015 FY2016 Plan
16.0 128.6 130.7
8.8
116.7
11.7
125.0
9.5 (108%)
139.0
12.5 (142%)
Trends of Financial Results Annually Net Sales
(billion yen) Operating Income (billion yen) Net
Sales Operating Income
Net Sales w/o FX effects
Operating Income w/o FX effects
Exc
hang
e R
ate 120.16
JPY/USD 107.21 JPY/USD
¥12.95
132.36 JPY/EUR
118.18 JPY/EUR
¥14.18
Strong Yen

©2017 Topcon Corporation 19
Revision of “TOPCON WAY”
-Corporate Identity- Topcon contributes to enrich human life by solving the societal challenges
within healthcare, agriculture and infrastructure.
-Management Policy- Topcon focuses on leading-edge technology
to provide new value through innovation and manufacturing.
Topcon respects diversity and acts as a global company.
Topcon places the utmost priority on compliance and continues to be a trustworthy partner to all stakeholders.
Revised the “TOPCON WAY” established in April 2011, and implemented a new “TOPCON WAY” on January 1, 2017.

©2017 Topcon Corporation 20
Topcon for Human Life 医・食・住

©2017 Topcon Corporation 21
Appendix Ⅲ.

©2017 Topcon Corporation 22
9.1
6.9
9.9
6.6
8.4 7.5
1.5
0.6
1.5
0.3
1.1
0.3 0.0
1.0
2.0
3.0
0.0
5.0
10.0
FY15/2Q 3Q 4Q FY16/1Q 2Q 3Q
Net Sales Operating Income
Net Sales (billion yen) Operating Income (billion yen)
1. Consolidated
11.6 9.8
14.5
8.8 10.8 10.5
1.6
0.5
2.3
0.5 0.8
0.4 0.0
1.0
2.0
3.0
0.0
5.0
10.0
15.0
20.0
FY15/2Q 3Q 4Q FY16/1Q 2Q 3Q
Net SalesOperating Income
Net Sales (billion yen)
2. Positioning
3. Smart Infrastructure
17.0
13.3
17.3
12.8 14.3 13.6
1.1
-0.7
1.4
0.7
1.7
0.5
-1.0
0.0
1.0
2.0
3.0
0.0
5.0
10.0
15.0
20.0
25.0
FY15/2Q 3Q 4Q FY16/1Q 2Q 3Q
Net SalesOperating Income
Net Sales (billion yen) Operating Income (billion yen)
35.3
28.6
39.2
26.2 31.7 29.5
3.6
-0.3
4.7
0.7
3.0
0.7
-1.0
1.0
3.0
5.0
7.0
9.0
0.0
10.0
20.0
30.0
40.0
FY15/2Q 3Q 4Q FY16/1Q 2Q 3Q
Net Sales Operating Income
Net Sales (billion yen) Operating Income (billion yen)
4. Eye Care Operating Income (billion yen)
Financial Results (Quarterly)

©2017 Topcon Corporation 23
27.4 31.3 31.4 30.6
27.2 28.8
2.9 3.7
1.7
0.7
2.5 2.0
0.0
2.0
4.0
0.0
10.0
20.0
30.0
40.0
FY14/1H FY14/2H FY15/1H FY15/2H FY16/1H FY16/2H
Net Sales Operating Income
Net Sales (billion yen) Operating Income (billion yen)
59.4 69.2
62.9 67.8
57.9 67.1
5.9
10.1
4.5 4.3 3.8 5.7
0.0
5.0
10.0
15.0
0.0
20.0
40.0
60.0
80.0
100.0
FY14/1H FY14/2H FY15/1H FY15/2H FY16/1H FY16/2H
Net Sales Operating IncomeNet Sales (billion yen) Operating Income (billion yen)
15.6 18.3
16.2 16.8 15.0
18.0
2.2
3.7
1.9 2.0 1.4
2.1
0.0
2.0
4.0
0.0
10.0
20.0
FY14/1H FY14/2H FY15/1H FY15/2H FY16/1H FY16/2H
Net Sales Operating Income
Net Sales (billion yen) Operating Income (billion yen)
1. Consolidated
18.6 22.7
19.5
24.3
19.6
24.4
1.5
3.6
2.1 2.8
1.3
2.7
0.0
2.0
4.0
0.0
10.0
20.0
30.0
FY14/1H FY14/2H FY15/1H FY15/2H FY16/1H FY16/2H
Net Sales Operating Income
Net Sales (billion yen)
2. Positioning
3. Smart Infrastructure 4. Eye Care
Operating Income (billion yen)
Financial Results and Forecast (Semiannually)

These materials contain forward-looking statements, including projections of future operating performance. Such statements are based on management’s best judgment, given the materials available to them at the time these statements are made. However, please be aware that actual performance may differ from projected figures owing to unexpected changes in the economic environment in which we operate, as well as to market fluctuations. The original disclosure in Japanese was released on January 31, 2017 at 16:30(UTC+9).
Inquiries: Corporate Communication Div. Public, Investor Relations and Shareholder Relations Dept. TOPCON CORPORATION Tel: +81-3-3558-2532 E-mail: [email protected] URL: http://global.topcon.com/invest/
Cautionary Note regarding Forward-Looking Statements