Embed Size (px)
Citation preview

FY2019 Business Results(April 1, 2019 – March 31, 2020)
May 13, 2020
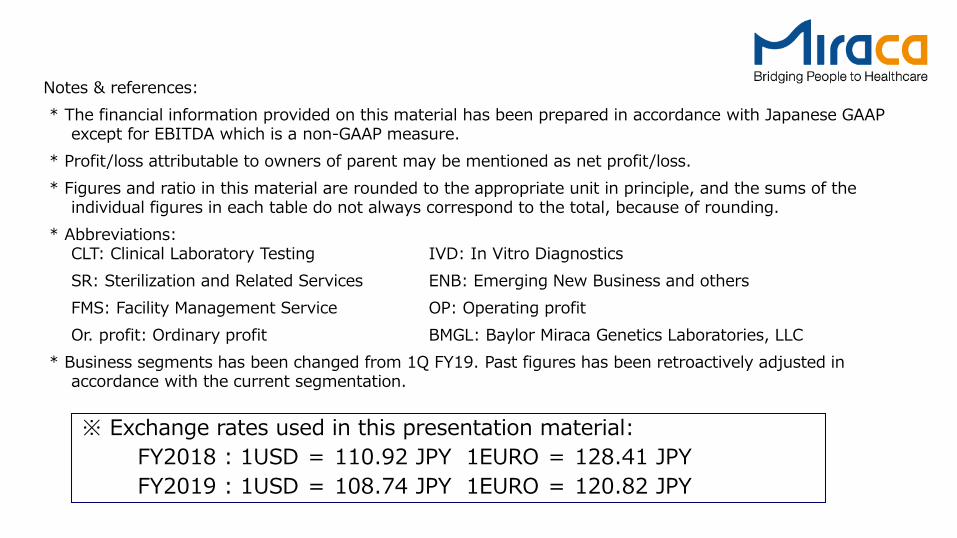
※ Exchange rates used in this presentation material:FY2018 : 1USD = 110.92 JPY 1EURO = 128.41 JPYFY2019 : 1USD = 108.74 JPY 1EURO = 120.82 JPY
Notes & references:* The financial information provided on this material has been prepared in accordance with Japanese GAAP
except for EBITDA which is a non-GAAP measure.* Profit/loss attributable to owners of parent may be mentioned as net profit/loss.* Figures and ratio in this material are rounded to the appropriate unit in principle, and the sums of the
individual figures in each table do not always correspond to the total, because of rounding.* Abbreviations:
CLT: Clinical Laboratory Testing IVD: In Vitro Diagnostics SR: Sterilization and Related Services ENB: Emerging New Business and others FMS: Facility Management Service OP: Operating profitOr. profit: Ordinary profit BMGL: Baylor Miraca Genetics Laboratories, LLC
* Business segments has been changed from 1Q FY19. Past figures has been retroactively adjusted in accordance with the current segmentation.
2
COVID-19 Impact during 4Q FY2019
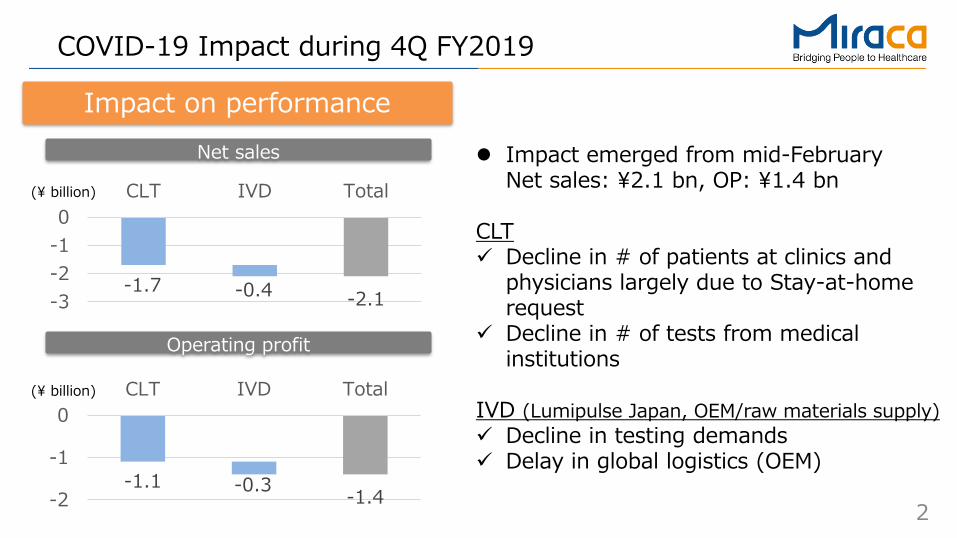
Impact on performanceNet sales Impact emerged from mid-February
Net sales: ¥2.1 bn, OP: ¥1.4 bn
CLT Decline in # of patients at clinics and
physicians largely due to Stay-at-home request
Decline in # of tests from medical institutions
IVD (Lumipulse Japan, OEM/raw materials supply) Decline in testing demands Delay in global logistics (OEM)
-1.7 -0.4 -2.1-3-2-10
CLT IVD Total
-1.1 -0.3 -1.4-2
-1
0CLT IVD Total
Operating profit
(¥ billion)
(¥ billion)
3
Our contribution against COVID-19
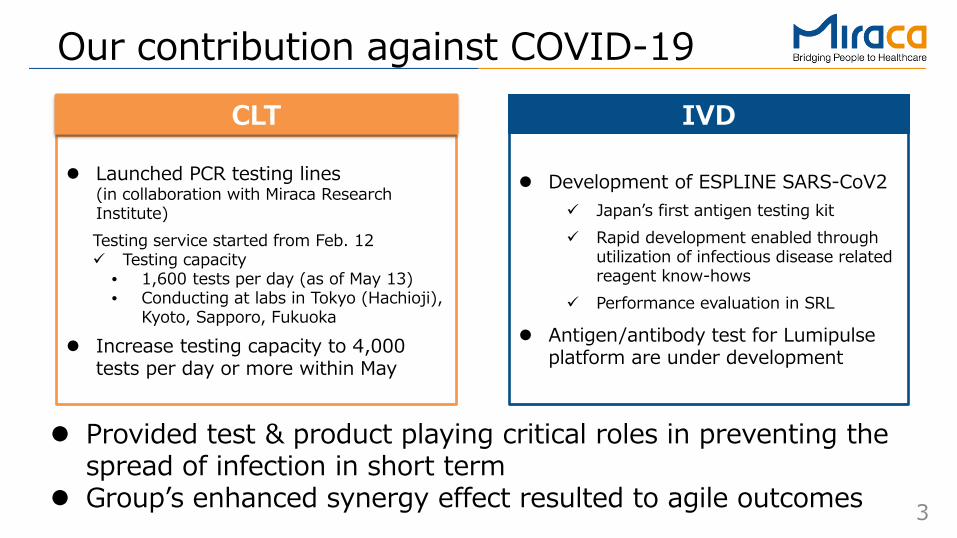
Launched PCR testing lines(in collaboration with Miraca Research Institute)Testing service started from Feb. 12 Testing capacity
• 1,600 tests per day (as of May 13)• Conducting at labs in Tokyo (Hachioji),
Kyoto, Sapporo, Fukuoka
Increase testing capacity to 4,000 tests per day or more within May
CLT IVD
Development of ESPLINE SARS-CoV2 Japan’s first antigen testing kit Rapid development enabled through
utilization of infectious disease related reagent know-hows
Performance evaluation in SRL
Antigen/antibody test for Lumipulse platform are under development
Provided test & product playing critical roles in preventing the spread of infection in short term
Group’s enhanced synergy effect resulted to agile outcomes
4
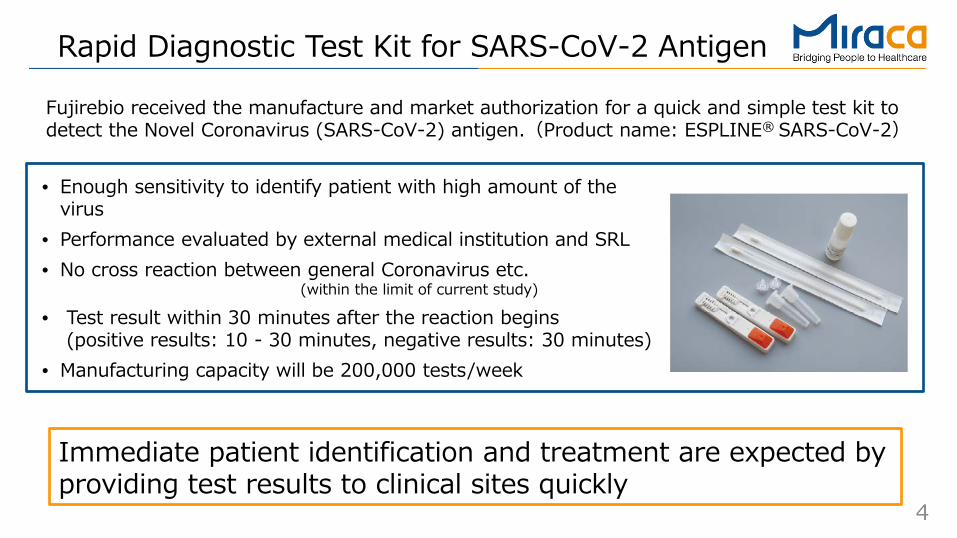
Rapid Diagnostic Test Kit for SARS-CoV-2 Antigen
Immediate patient identification and treatment are expected by providing test results to clinical sites quickly
Fujirebio received the manufacture and market authorization for a quick and simple test kit to detect the Novel Coronavirus (SARS-CoV-2) antigen.(Product name: ESPLINE® SARS-CoV-2)
• Enough sensitivity to identify patient with high amount of the virus
• Performance evaluated by external medical institution and SRL• No cross reaction between general Coronavirus etc.
(within the limit of current study)
• Test result within 30 minutes after the reaction begins(positive results: 10 - 30 minutes, negative results: 30 minutes)
• Manufacturing capacity will be 200,000 tests/week
5
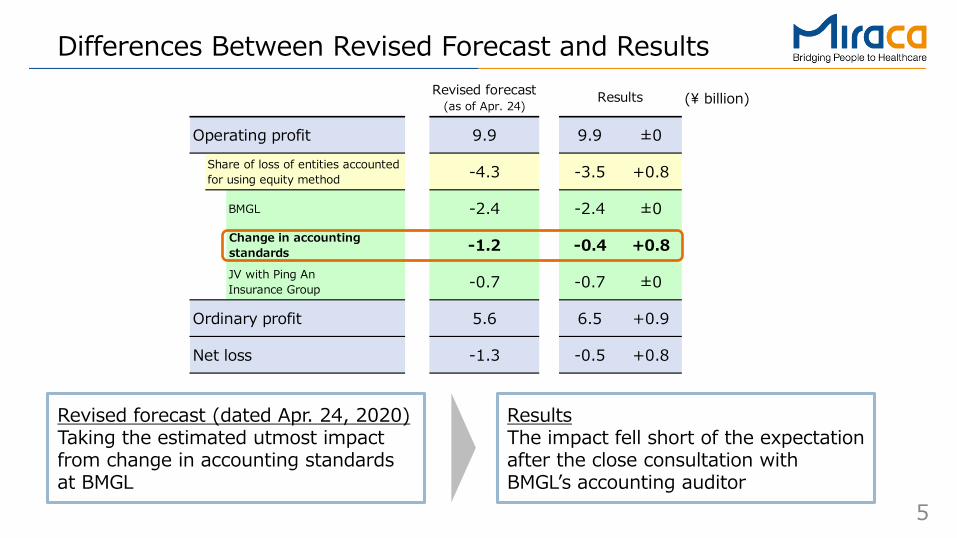
Revised forecast(as of Apr. 24)
Operating profit 9.9 9.9 ±0
-4.3 -3.5 +0.8
BMGL -2.4 -2.4 ±0Change in accountingstandards -1.2 -0.4 +0.8JV with Ping AnInsurance Group -0.7 -0.7 ±0
Ordinary profit 5.6 6.5 +0.9
Net loss -1.3 -0.5 +0.8
Results
Share of loss of entities accountedfor using equity method
Differences Between Revised Forecast and Results
Revised forecast (dated Apr. 24, 2020)Taking the estimated utmost impact from change in accounting standards at BMGL
ResultsThe impact fell short of the expectation after the close consultation with BMGL’s accounting auditor
(¥ billion)
6
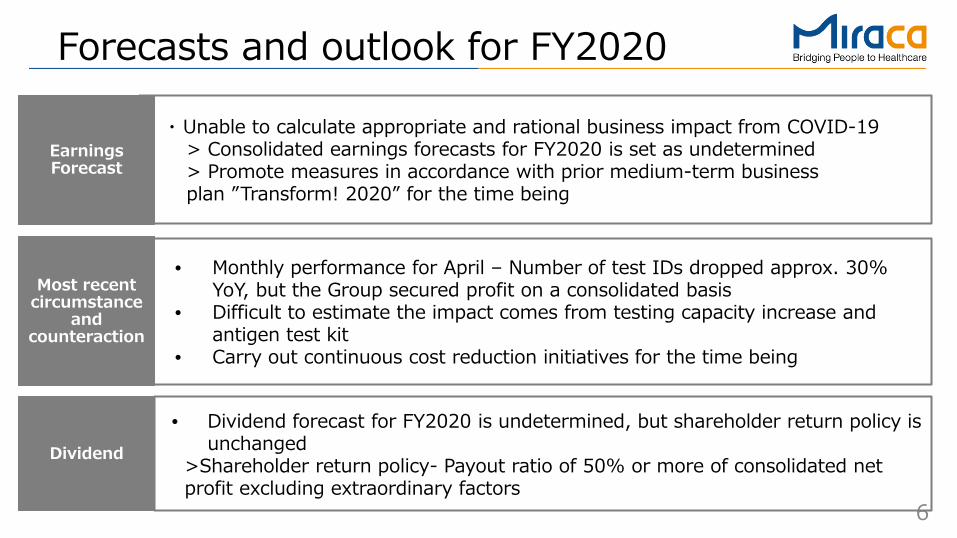
Forecasts and outlook for FY2020
Earnings Forecast
Dividend
・ Unable to calculate appropriate and rational business impact from COVID-19> Consolidated earnings forecasts for FY2020 is set as undetermined> Promote measures in accordance with prior medium-term business plan ”Transform! 2020” for the time being
• Dividend forecast for FY2020 is undetermined, but shareholder return policy is unchanged
>Shareholder return policy- Payout ratio of 50% or more of consolidated net profit excluding extraordinary factors
Most recent circumstance
and counteraction
• Monthly performance for April – Number of test IDs dropped approx. 30% YoY, but the Group secured profit on a consolidated basis
• Difficult to estimate the impact comes from testing capacity increase and antigen test kit
• Carry out continuous cost reduction initiatives for the time being

FY2019 Business Results
8
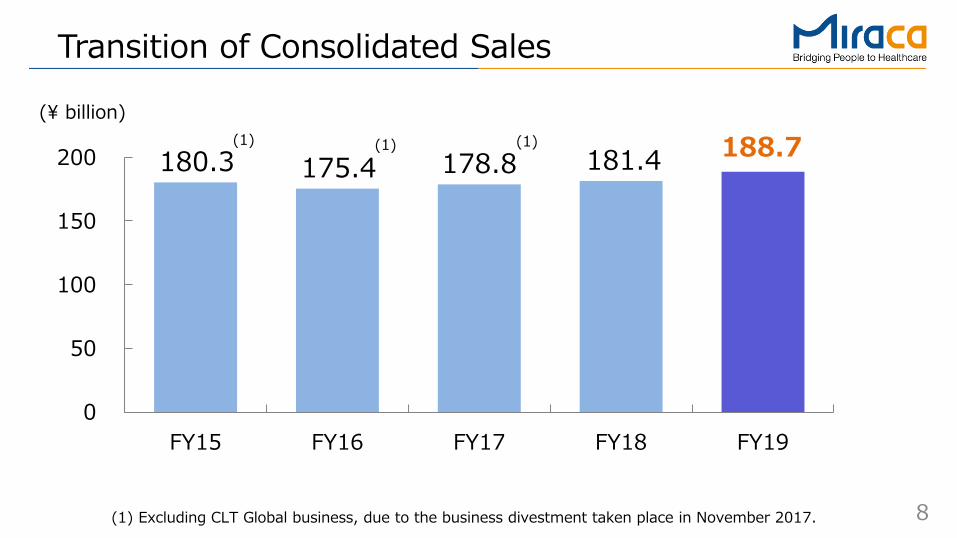
Transition of Consolidated Sales
(¥ billion)(1)
(1) Excluding CLT Global business, due to the business divestment taken place in November 2017.
(1) (1)180.3 175.4 178.8 181.4 188.7
0
50
100
150
200
FY15 FY16 FY17 FY18 FY19
9
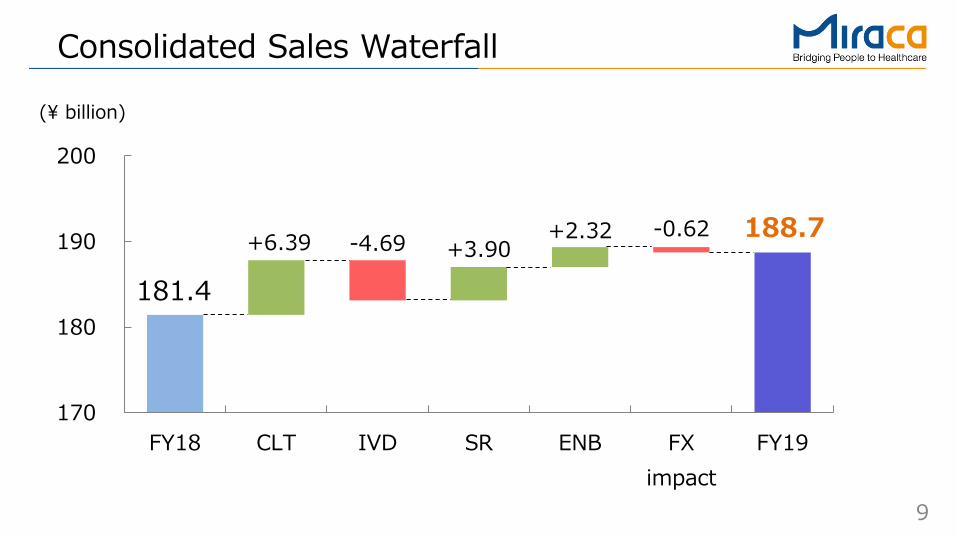
181.4
188.7+6.39 -4.69 +3.90 +2.32 -0.62
170
180
190
200
FY18 CLT IVD SR ENB FXimpact
FY19
Consolidated Sales Waterfall
(¥ billion)
10
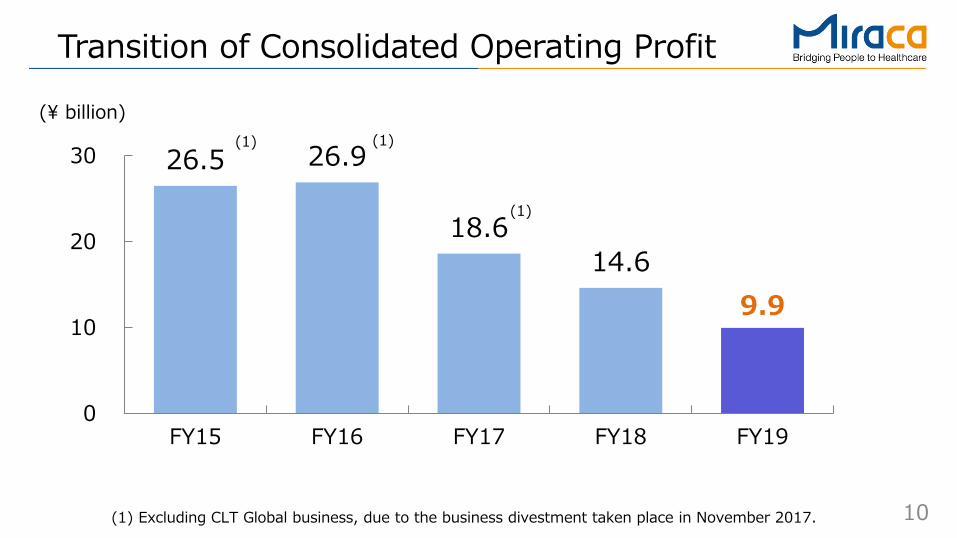
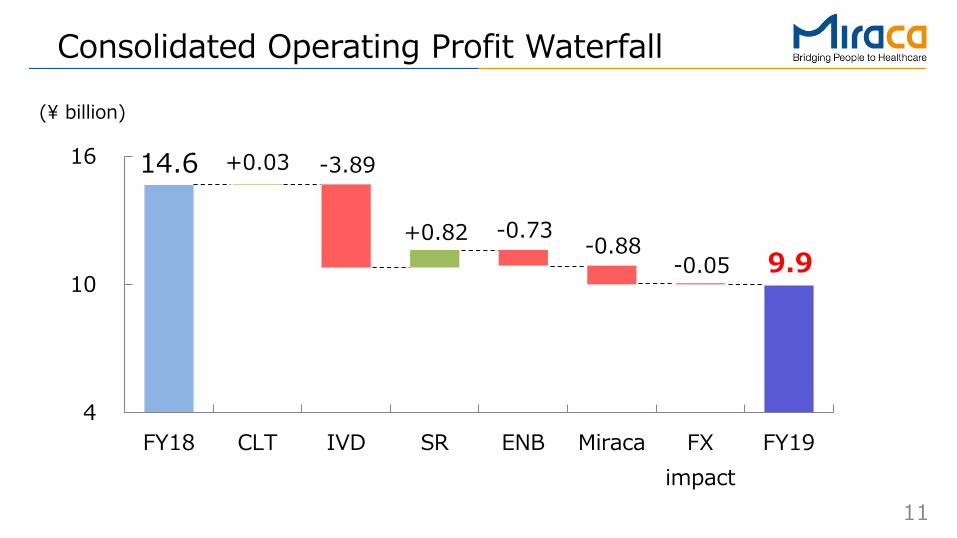
Transition of Consolidated Operating Profit
(¥ billion)(1)
(1)
(1) Excluding CLT Global business, due to the business divestment taken place in November 2017.
(1)26.5 26.9
18.614.6
9.9
0
10
20
30
FY15 FY16 FY17 FY18 FY19
11
14.6
9.9
+0.03 -3.89
+0.82 -0.73-0.88
-0.05
4
10
16
FY18 CLT IVD SR ENB Miraca FXimpact
FY19
Consolidated Operating Profit Waterfall
(¥ billion)
12
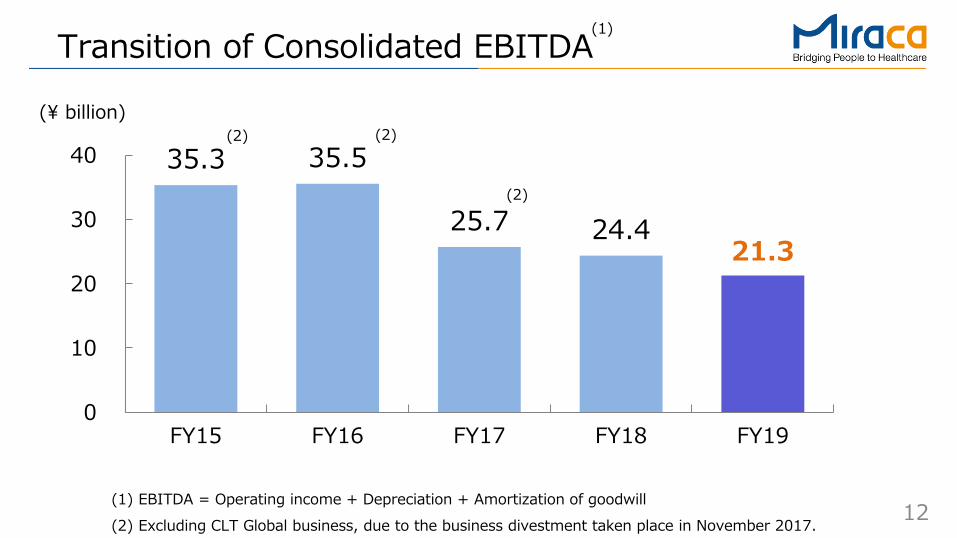
Transition of Consolidated EBITDA
(¥ billion)(2)
(2)
(1)
(1) EBITDA = Operating income + Depreciation + Amortization of goodwill(2) Excluding CLT Global business, due to the business divestment taken place in November 2017.
(2)
35.3 35.5
25.7 24.421.3
0
10
20
30
40
FY15 FY16 FY17 FY18 FY19
13
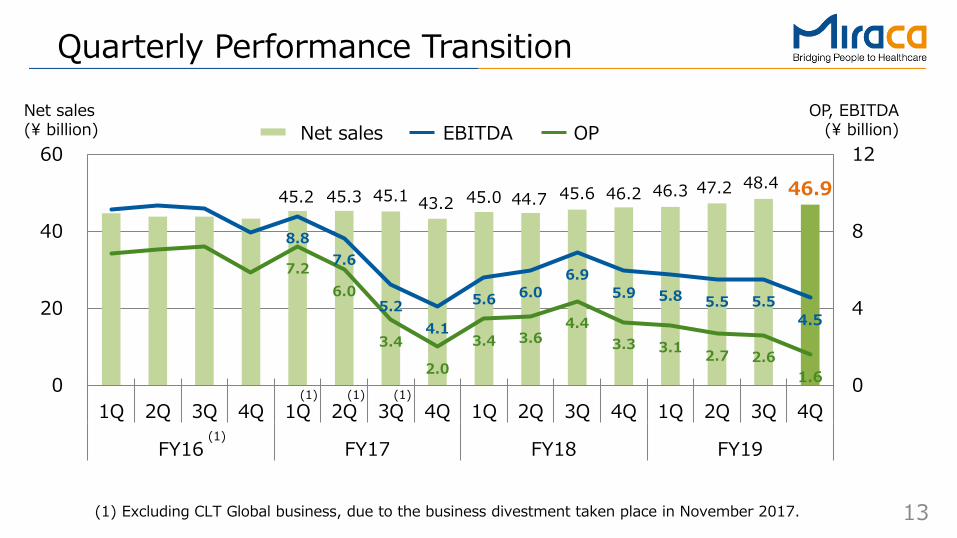
45.2 45.3 45.1 43.2 45.0 44.7 45.6 46.2 46.3 47.2 48.4 46.9
7.26.0
3.4
2.0
3.4 3.64.4
3.3 3.1 2.7 2.61.6
8.87.6
5.24.1
5.6 6.06.9
5.9 5.8 5.5 5.54.5
0
4
8
12
0
20
40
60
1Q 2Q 3Q 4Q 1Q 2Q 3Q 4Q 1Q 2Q 3Q 4Q 1Q 2Q 3Q 4Q
FY16 FY17 FY18 FY19
Quarterly Performance TransitionNet sales(¥ billion)
OP, EBITDA(¥ billion)
(1) (1) (1)
(1) Excluding CLT Global business, due to the business divestment taken place in November 2017.
(1)
Net sales OPEBITDA
14
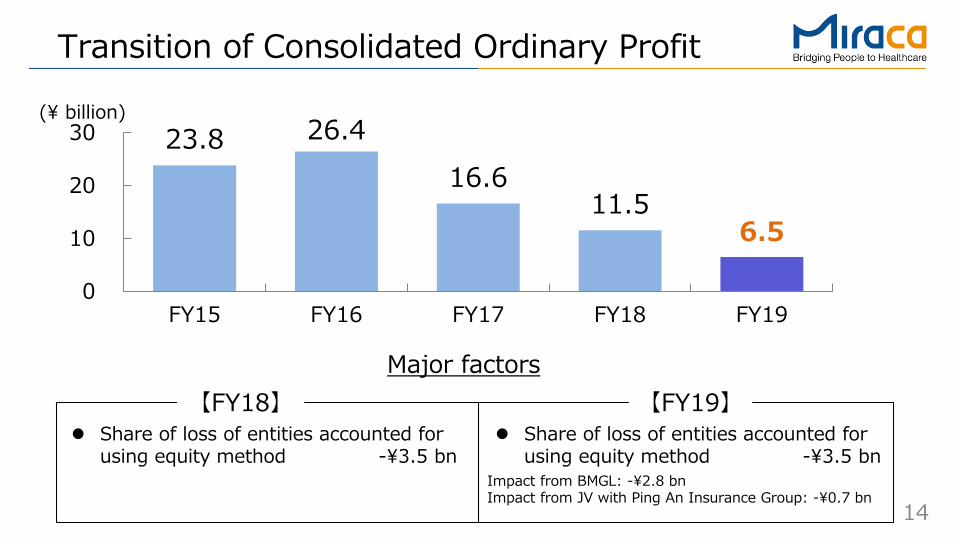
Transition of Consolidated Ordinary Profit
【FY18】 【FY19】 Share of loss of entities accounted for
using equity method -¥3.5 bn
Major factors
Share of loss of entities accounted for using equity method -¥3.5 bn
(¥ billion)
Impact from BMGL: -¥2.8 bn Impact from JV with Ping An Insurance Group: -¥0.7 bn
23.8 26.416.6
11.56.5
0
10
20
30
FY15 FY16 FY17 FY18 FY19
15
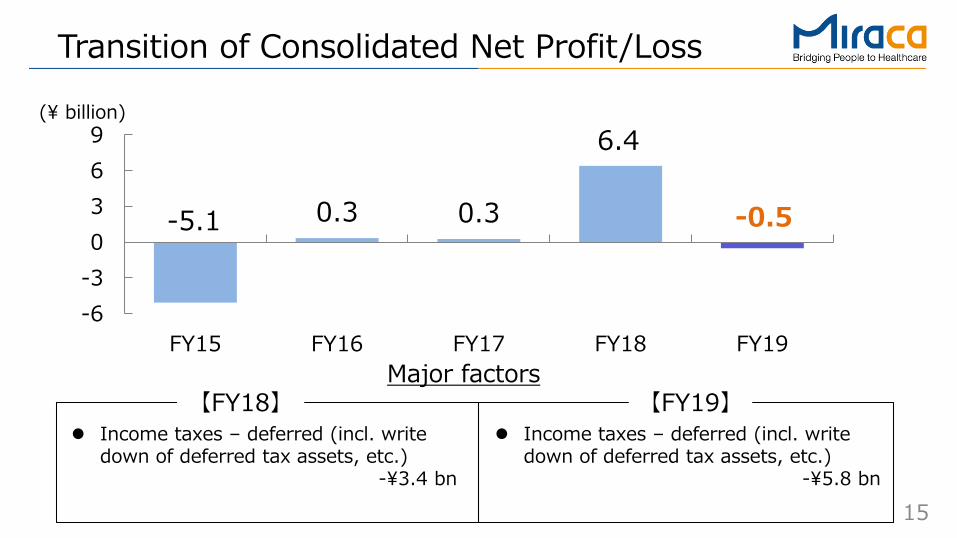
-5.1 0.3 0.3
6.4
-0.5
-6-30369
FY15 FY16 FY17 FY18 FY19
Transition of Consolidated Net Profit/Loss
【FY18】 【FY19】 Income taxes – deferred (incl. write
down of deferred tax assets, etc.) -¥3.4 bn
Major factors
(¥ billion)
Income taxes – deferred (incl. write down of deferred tax assets, etc.)
-¥5.8 bn
16
23.0 24.5 24.9 24.1 23.6
4.8 5.0 5.2 5.2 5.0
1.1 1.8
1.3 1.3 0.8
2.4
3.22.8 2.8
2.4
0
4
8
0
20
40
FY184Q
FY191Q
FY192Q
FY193Q
FY194Q
CLTYoY ComparisonQuarterly Transition
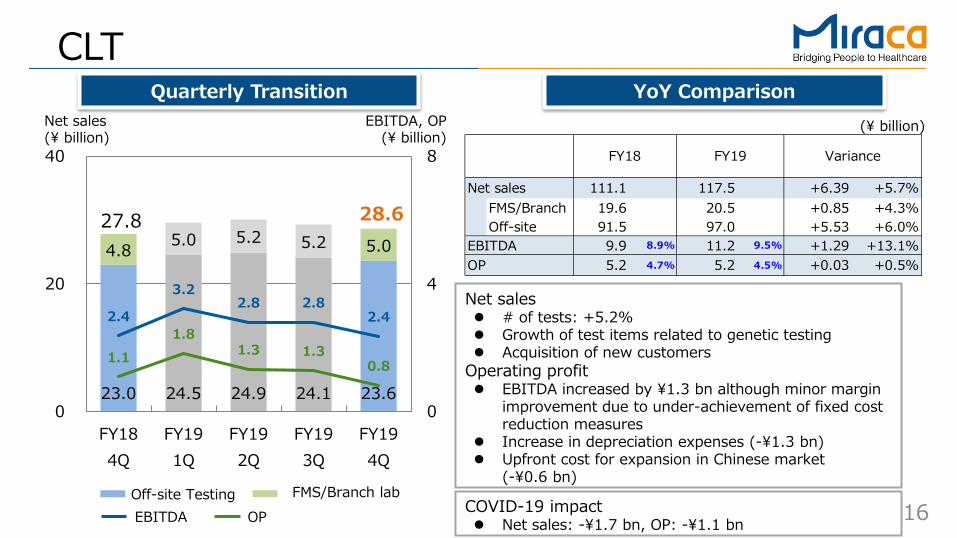
Net sales # of tests: +5.2% Growth of test items related to genetic testing Acquisition of new customers
Operating profit EBITDA increased by ¥1.3 bn although minor margin
improvement due to under-achievement of fixed cost reduction measures
Increase in depreciation expenses (-¥1.3 bn) Upfront cost for expansion in Chinese market
(-¥0.6 bn)
Net sales(¥ billion)
EBITDA, OP(¥ billion)
(¥ billion)
27.8 28.6
Off-site Testing FMS/Branch labOPEBITDA
Net sales 111.1 117.5 +6.39 +5.7%FMS/Branch 19.6 20.5 +0.85 +4.3%Off-site 91.5 97.0 +5.53 +6.0%
EBITDA 9.9 8.9% 11.2 9.5% +1.29 +13.1%OP 5.2 4.7% 5.2 4.5% +0.03 +0.5%
VarianceFY18 FY19
COVID-19 impact Net sales: -¥1.7 bn, OP: -¥1.1 bn
17
CLT: Key Strategy Achievements
FMS/Branch
GP
Net increase # of GP clients (cumulative) and market share
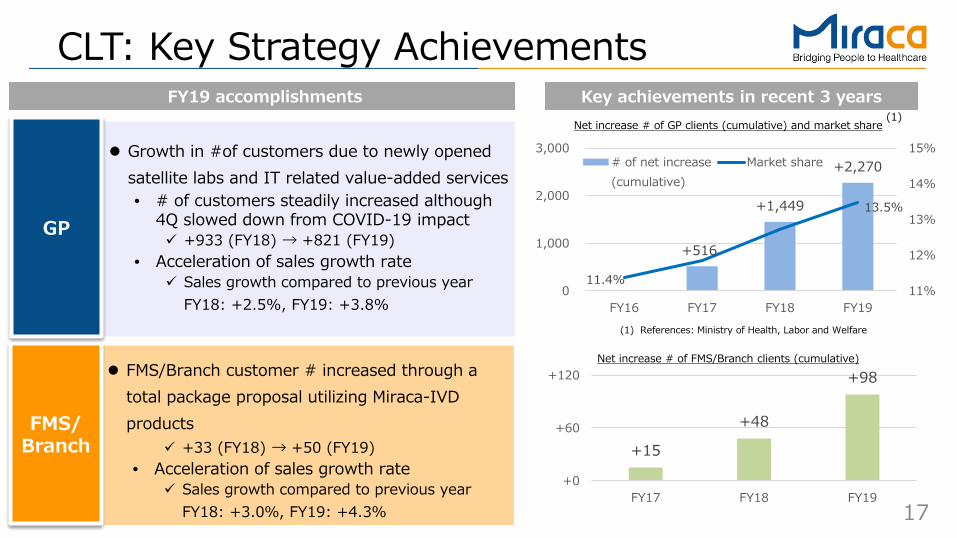
Growth in #of customers due to newly opened satellite labs and IT related value-added services• # of customers steadily increased although
4Q slowed down from COVID-19 impact +933 (FY18) → +821 (FY19)
• Acceleration of sales growth rate Sales growth compared to previous year
FY18: +2.5%, FY19: +3.8%
FMS/Branch customer # increased through a total package proposal utilizing Miraca-IVD products
+33 (FY18) → +50 (FY19)• Acceleration of sales growth rate
Sales growth compared to previous yearFY18: +3.0%, FY19: +4.3%
(1) References: Ministry of Health, Labor and Welfare
FY19 accomplishments Key achievements in recent 3 years
+15
+48
+98
+0
+60
+120
FY17 FY18 FY19
+516
+1,449
+2,270
11.4%
13.5%
11%
12%
13%
14%
15%
0
1,000
2,000
3,000
FY16 FY17 FY18 FY19
# of net increase(cumulative)
Market share
Net increase # of FMS/Branch clients (cumulative)
(1)
18
4.9 3.9 3.9 4.2 3.7
4.5
3.8 4.2 3.9 3.9
2.4
2.1 2.0 2.2 2.1
2.4
1.4 1.9 2.0
0.9
3.2
2.2 2.7 2.8
1.7
0
4
8
0
7
14
FY184Q
FY191Q
FY192Q
FY193Q
FY194Q
IVDQuarterly Transition
Net sales(¥ billion)
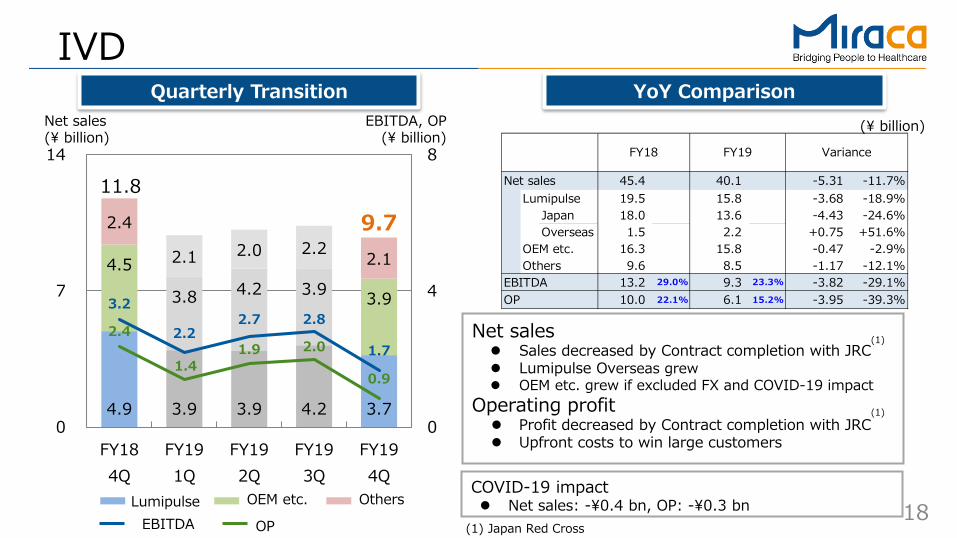
9.711.8
(¥ billion)
Lumipulse OEM etc. OthersEBITDA OP
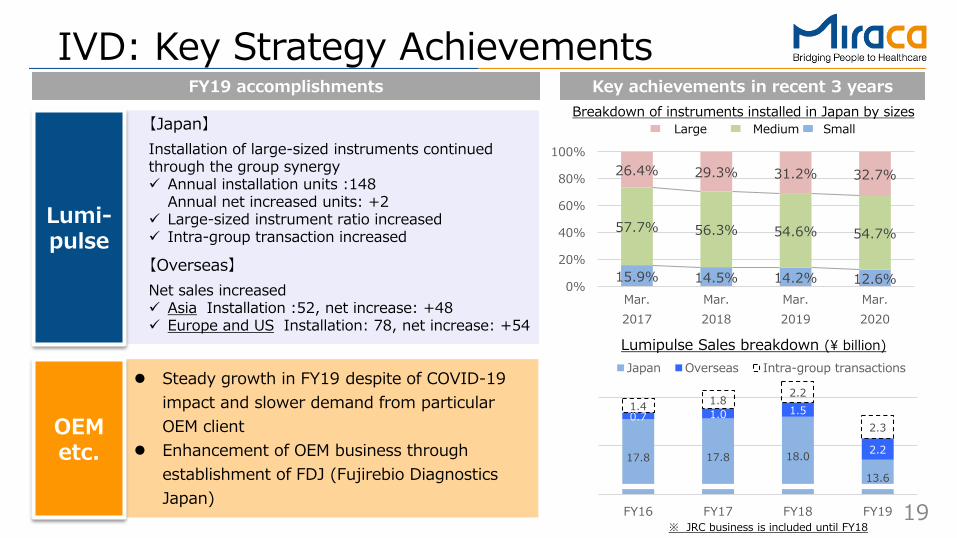
Net sales Sales decreased by Contract completion with JRC Lumipulse Overseas grew OEM etc. grew if excluded FX and COVID-19 impact
Operating profit Profit decreased by Contract completion with JRC Upfront costs to win large customers
YoY Comparison
(1) Japan Red Cross
(1)
EBITDA, OP(¥ billion)
Net sales 45.4 40.1 -5.31 -11.7%Lumipulse 19.5 15.8 -3.68 -18.9%
Japan 18.0 13.6 -4.43 -24.6%Overseas 1.5 2.2 +0.75 +51.6%
OEM etc. 16.3 15.8 -0.47 -2.9%Others 9.6 8.5 -1.17 -12.1%
EBITDA 13.2 29.0% 9.3 23.3% -3.82 -29.1%OP 10.0 22.1% 6.1 15.2% -3.95 -39.3%
VarianceFY18 FY19
COVID-19 impact Net sales: -¥0.4 bn, OP: -¥0.3 bn
(1)
19
17.8 17.8 18.0
13.6
0.7 1.0 1.5
2.2
1.4 1.8 2.2
2.3
FY16 FY17 FY18 FY19
Japan Overseas Intra-group transactions
IVD: Key Strategy Achievements
【Japan】Installation of large-sized instruments continued through the group synergy Annual installation units :148
Annual net increased units: +2 Large-sized instrument ratio increased Intra-group transaction increased
【Overseas】Net sales increased Asia Installation :52, net increase: +48 Europe and US Installation: 78, net increase: +54
OEMetc.
Lumi-pulse
Breakdown of instruments installed in Japan by sizesSmallMediumLarge
Lumipulse Sales breakdown (¥ billion)
Steady growth in FY19 despite of COVID-19 impact and slower demand from particular OEM client
Enhancement of OEM business through establishment of FDJ (Fujirebio Diagnostics Japan)
※ JRC business is included until FY18
FY19 accomplishments Key achievements in recent 3 years
15.9% 14.5% 14.2% 12.6%
57.7% 56.3% 54.6% 54.7%
26.4% 29.3% 31.2% 32.7%
0%
20%
40%
60%
80%
100%
Mar.2017
Mar.2018
Mar.2019
Mar.2020
20
SRQuarterly Transition
Net sales(¥ billion)
(¥ billion)EBITDA, OP(¥ billion)
Net sales OPEBITDA
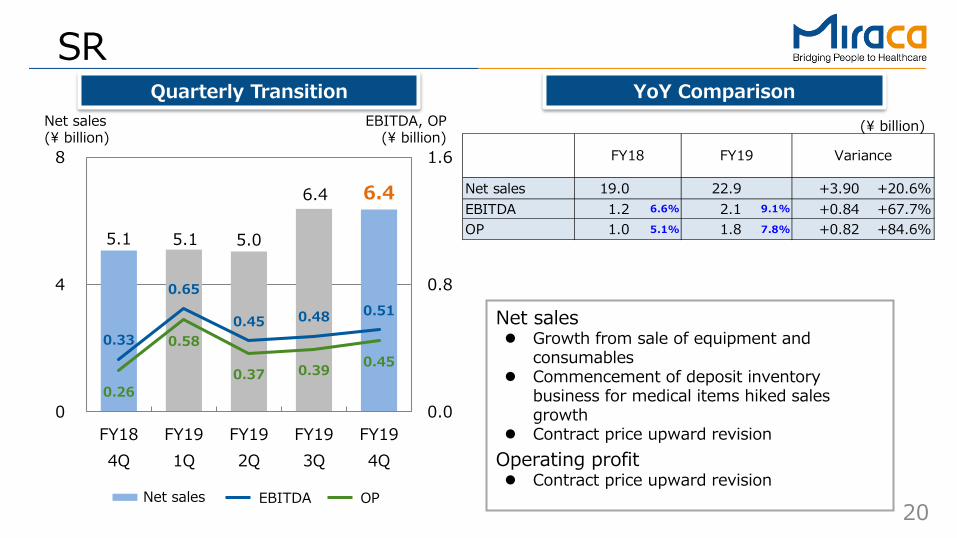
Net sales Growth from sale of equipment and
consumables Commencement of deposit inventory
business for medical items hiked sales growth
Contract price upward revisionOperating profit Contract price upward revision
YoY Comparison
Net sales 19.0 22.9 +3.90 +20.6%EBITDA 1.2 6.6% 2.1 9.1% +0.84 +67.7%OP 1.0 5.1% 1.8 7.8% +0.82 +84.6%
VarianceFY18 FY19
5.1 5.1 5.0
6.4 6.4
0.26
0.58
0.37 0.39 0.45 0.33
0.65
0.45 0.48 0.51
0.0
0.8
1.6
0
4
8
FY184Q
FY191Q
FY192Q
FY193Q
FY194Q
21
ENBQuarterly Transition
Net sales(¥ billion)
(¥ billion)EBITDA, OP(¥ billion)
Net sales OPEBITDA
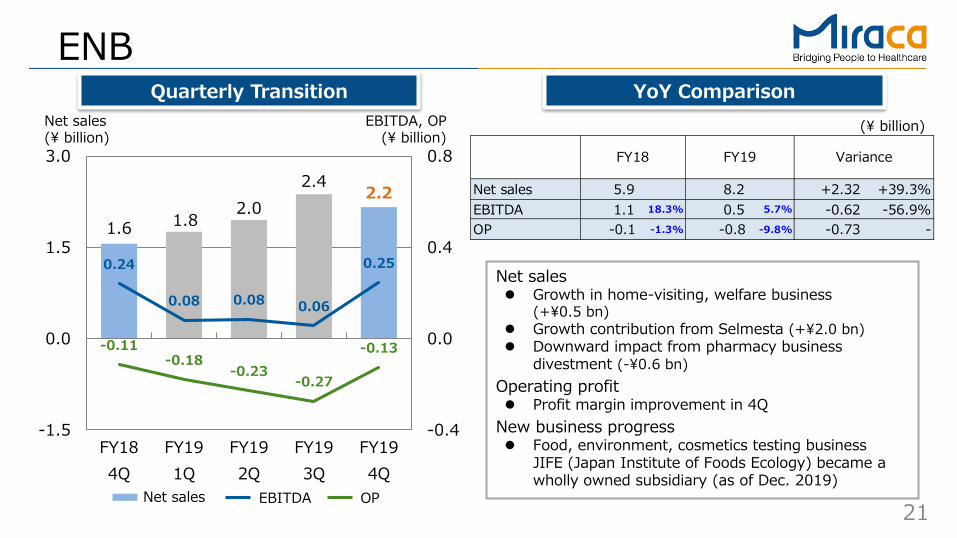
Net sales Growth in home-visiting, welfare business
(+¥0.5 bn) Growth contribution from Selmesta (+¥2.0 bn) Downward impact from pharmacy business
divestment (-¥0.6 bn)Operating profit Profit margin improvement in 4Q
New business progress Food, environment, cosmetics testing business
JIFE (Japan Institute of Foods Ecology) became a wholly owned subsidiary (as of Dec. 2019)
YoY Comparison
1.6 1.8 2.0
2.4 2.2
-0.11 -0.18
-0.23 -0.27
-0.13
0.24
0.08 0.08 0.06
0.25
-0.4
0.0
0.4
0.8
-1.5
0.0
1.5
3.0
FY184Q
FY191Q
FY192Q
FY193Q
FY194Q
Net sales 5.9 8.2 +2.32 +39.3%EBITDA 1.1 18.3% 0.5 5.7% -0.62 -56.9%OP -0.1 -1.3% -0.8 -9.8% -0.73 -
VarianceFY18 FY19
22
Consolidated results for FY19
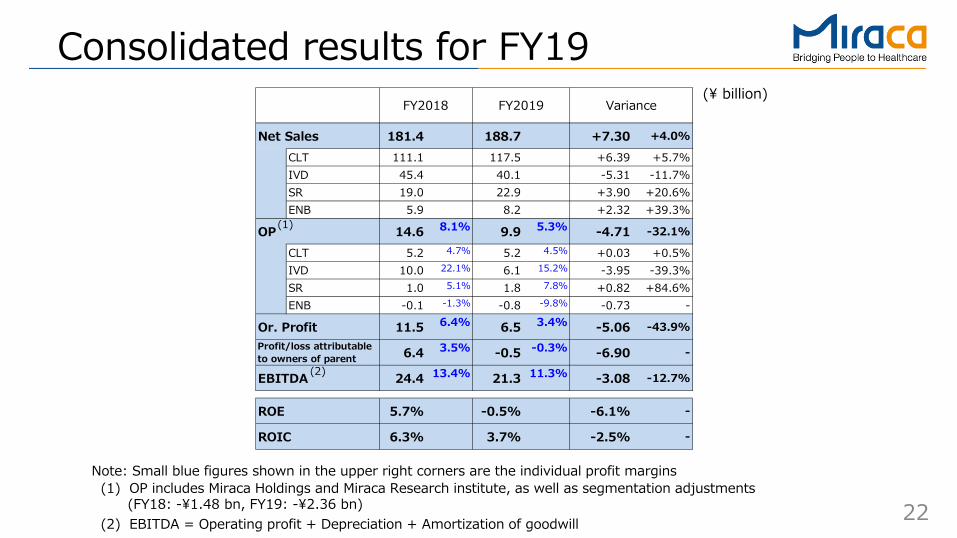
Net Sales 181.4 188.7 +7.30 +4.0%
CLT 111.1 117.5 +6.39 +5.7%IVD 45.4 40.1 -5.31 -11.7%SR 19.0 22.9 +3.90 +20.6%ENB 5.9 8.2 +2.32 +39.3%
OP 14.6 8.1% 9.9 5.3% -4.71 -32.1%
CLT 5.2 4.7% 5.2 4.5% +0.03 +0.5%IVD 10.0 22.1% 6.1 15.2% -3.95 -39.3%SR 1.0 5.1% 1.8 7.8% +0.82 +84.6%ENB -0.1 -1.3% -0.8 -9.8% -0.73 -
Or. Profit 11.5 6.4% 6.5 3.4% -5.06 -43.9%
6.4 3.5% -0.5 -0.3% -6.90 -
EBITDA 24.4 13.4% 21.3 11.3% -3.08 -12.7%
ROE 5.7% -0.5% -6.1% -
ROIC 6.3% 3.7% -2.5% -
Profit/loss attributableto owners of parent
FY2018 FY2019 Variance
Note: Small blue figures shown in the upper right corners are the individual profit margins(1) OP includes Miraca Holdings and Miraca Research institute, as well as segmentation adjustments
(FY18: -¥1.48 bn, FY19: -¥2.36 bn)(2) EBITDA = Operating profit + Depreciation + Amortization of goodwill
(2)
(1)
(¥ billion)
23
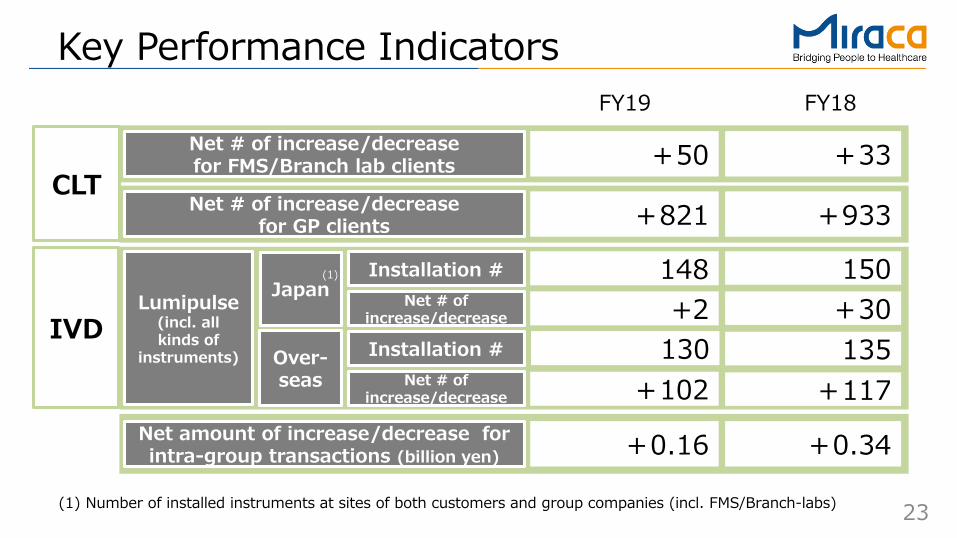
Key Performance Indicators
Net # of increase/decrease for FMS/Branch lab clients
CLT+50 +33
Net # of increase/decrease for GP clients +821 +933
IVDLumipulse
(incl. all kinds of
instruments)
Japan
Over-seas
148 150
130 135
Net amount of increase/decrease for intra-group transactions (billion yen) +0.16 +0.34
(1) Installation #Net # of
increase/decrease
Installation #
+2 +30
+102 +117Net # of increase/decrease
FY19 FY18
(1) Number of installed instruments at sites of both customers and group companies (incl. FMS/Branch-labs)
24
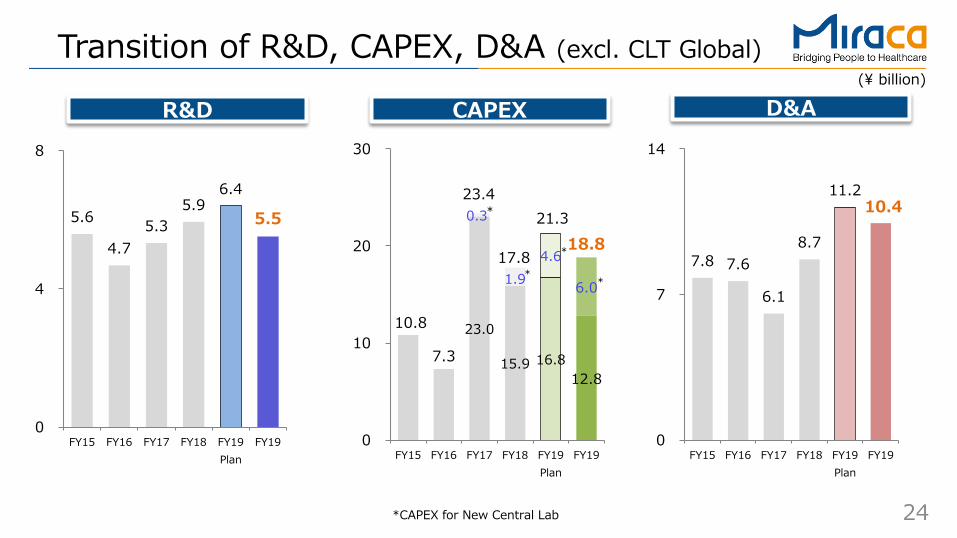
Transition of R&D, CAPEX, D&A (excl. CLT Global)(¥ billion)
R&D CAPEX D&A
*CAPEX for New Central Lab
5.6
4.7 5.3
5.9 6.4
5.5
0
4
8
FY15 FY16 FY17 FY18 FY19Plan
FY19
10.8
7.3
23.0
15.9 16.8 12.8
0.3
1.9 4.6
6.0
0
10
20
30
FY15 FY16 FY17 FY18 FY19Plan
FY19
7.8 7.6
6.1
8.7
11.2 10.4
0
7
14
FY15 FY16 FY17 FY18 FY19Plan
FY19
23.4
17.8
21.318.8
*
*
*
*
25
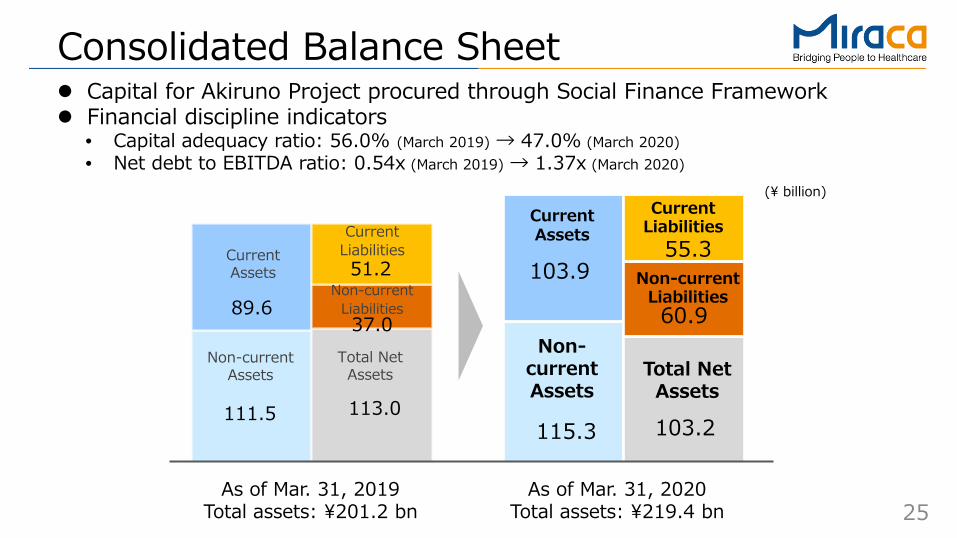
Consolidated Balance Sheet
(¥ billion)
111.5
89.6
113.0
37.0
51.2Current Assets
Non-current Assets
Total Net Assets
115.3
103.9
103.2
60.9
55.3Current Assets
Non-current Assets
Current Liabilities
Non-current LiabilitiesNon-current
Liabilities
Current Liabilities
Total Net Assets
Capital for Akiruno Project procured through Social Finance Framework Financial discipline indicators
• Capital adequacy ratio: 56.0% (March 2019) → 47.0% (March 2020)• Net debt to EBITDA ratio: 0.54x (March 2019) → 1.37x (March 2020)
As of Mar. 31, 2019Total assets: ¥201.2 bn
As of Mar. 31, 2020Total assets: ¥219.4 bn
26
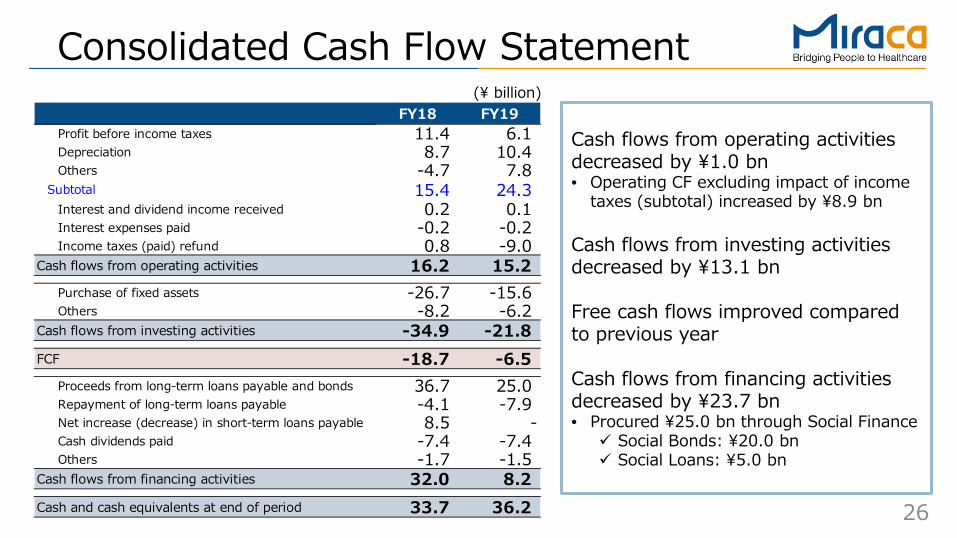
Consolidated Cash Flow Statement(¥ billion)
FY18 FY19Profit before income taxes 11.4 6.1Depreciation 8.7 10.4Others -4.7 7.8
Subtotal 15.4 24.3Interest and dividend income received 0.2 0.1Interest expenses paid -0.2 -0.2Income taxes (paid) refund 0.8 -9.0
Cash flows from operating activities 16.2 15.2Purchase of fixed assets -26.7 -15.6Others -8.2 -6.2
Cash flows from investing activities -34.9 -21.8FCF -18.7 -6.5
Proceeds from long-term loans payable and bonds 36.7 25.0Repayment of long-term loans payable -4.1 -7.9Net increase (decrease) in short-term loans payable 8.5 -Cash dividends paid -7.4 -7.4Others -1.7 -1.5
Cash flows from financing activities 32.0 8.2Cash and cash equivalents at end of period 33.7 36.2
Cash flows from operating activities decreased by ¥1.0 bn• Operating CF excluding impact of income
taxes (subtotal) increased by ¥8.9 bn
Cash flows from investing activities decreased by ¥13.1 bn
Free cash flows improved compared to previous year
Cash flows from financing activities decreased by ¥23.7 bn• Procured ¥25.0 bn through Social Finance Social Bonds: ¥20.0 bn Social Loans: ¥5.0 bn
27
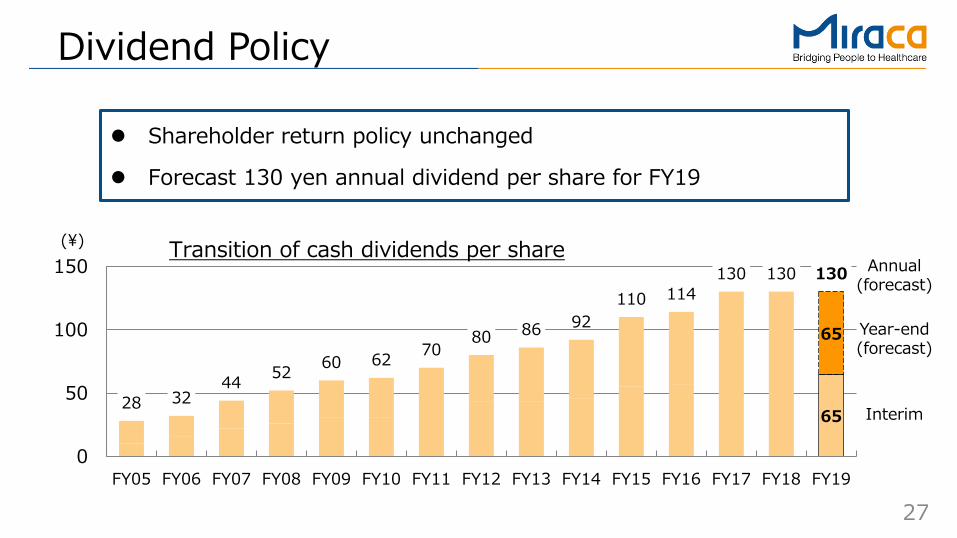
Dividend Policy
(¥)
Shareholder return policy unchanged
Forecast 130 yen annual dividend per share for FY19
Annual(forecast)
Transition of cash dividends per share
65
65
28 3244 52 60 62 70
80 86 92110 114
130 130 130
0
50
100
150
FY05 FY06 FY07 FY08 FY09 FY10 FY11 FY12 FY13 FY14 FY15 FY16 FY17 FY18 FY19
Year-end(forecast)
Interim

Update on Akiruno Project
29
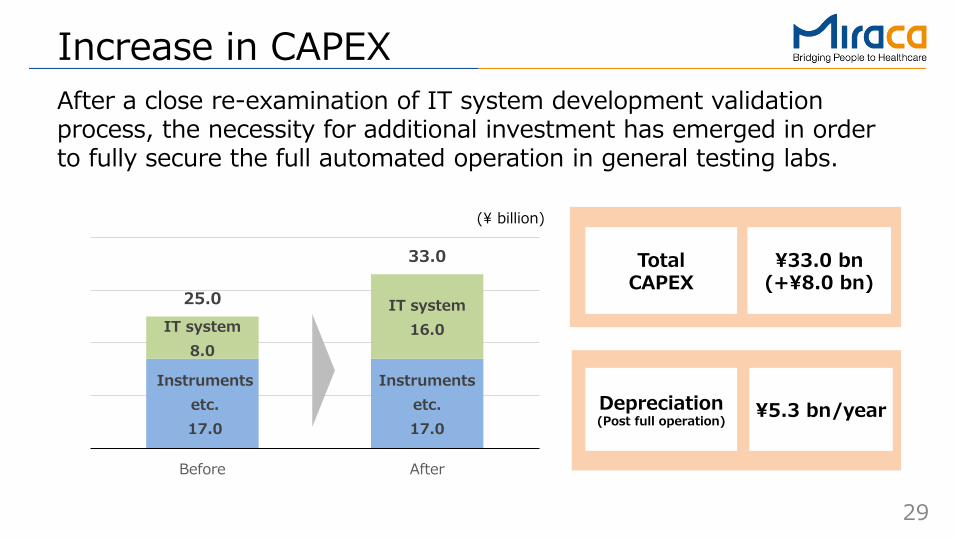
Instrumentsetc.17.0
Instrumentsetc.17.0
IT system8.0
IT system16.0
25.0
33.0
Before After
Increase in CAPEXAfter a close re-examination of IT system development validation process, the necessity for additional investment has emerged in order to fully secure the full automated operation in general testing labs.
TotalCAPEX
Depreciation(Post full operation)
¥33.0 bn(+¥8.0 bn)
¥5.3 bn/year
(¥ billion)
30
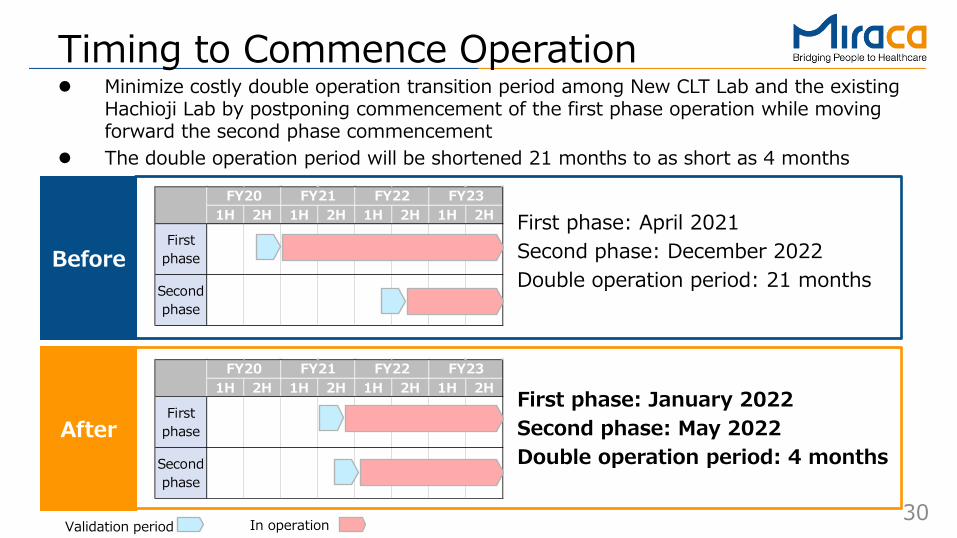
1H 2H 1H 2H 1H 2H 1H 2H
Firstphase
Secondphase
FY20 FY21 FY22 FY23
1H 2H 1H 2H 1H 2H 1H 2H
Firstphase
Secondphase
FY20 FY21 FY22 FY23
Timing to Commence Operation
First phase: April 2021Second phase: December 2022Double operation period: 21 months
After
Before
Validation period In operation
First phase: January 2022Second phase: May 2022Double operation period: 4 months
Minimize costly double operation transition period among New CLT Lab and the existing Hachioji Lab by postponing commencement of the first phase operation while moving forward the second phase commencement
The double operation period will be shortened 21 months to as short as 4 months
31
-5
0
5
10
15
コスト削減
合理化施策
既存ラボ閉鎖
増加運営費
一次費用
減価償却費 -5
0
5
10
15
コスト削減
合理化施策
既存ラボ閉鎖
増加運営費
減価償却費
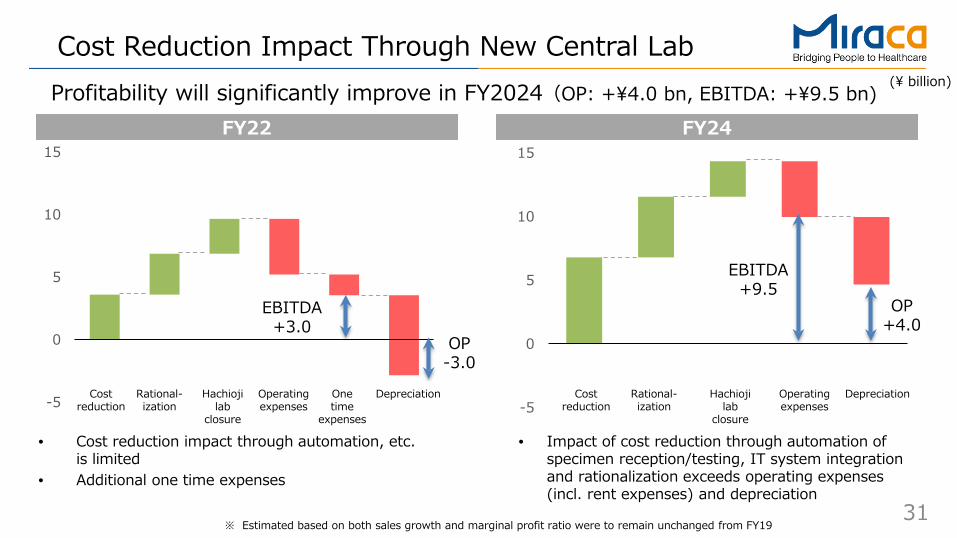
Cost Reduction Impact Through New Central Lab
FY22 FY24
(¥ billion)
• Impact of cost reduction through automation of specimen reception/testing, IT system integration and rationalization exceeds operating expenses (incl. rent expenses) and depreciation
• Cost reduction impact through automation, etc. is limited
• Additional one time expenses
※ Estimated based on both sales growth and marginal profit ratio were to remain unchanged from FY19
OP-3.0
EBITDA+3.0
OP+4.0
EBITDA+9.5
Profitability will significantly improve in FY2024(OP: +¥4.0 bn, EBITDA: +¥9.5 bn)
Costreduction
Rational-ization
Hachiojilab
closure
Operatingexpenses
Onetime
expenses
Depreciation Costreduction
Rational-ization
Hachiojilab
closure
Operatingexpenses
Depreciation
32
0
1,500
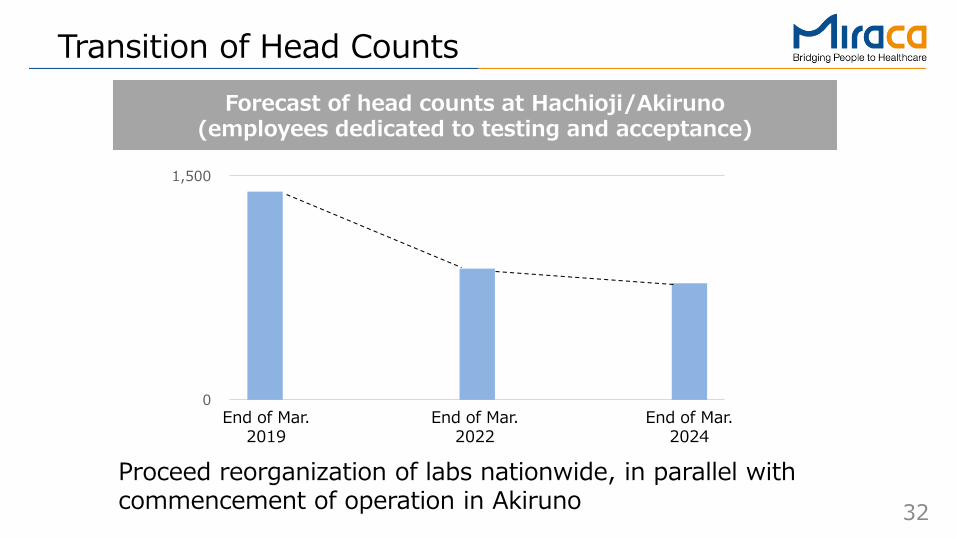
Transition of Head CountsForecast of head counts at Hachioji/Akiruno
(employees dedicated to testing and acceptance)
Proceed reorganization of labs nationwide, in parallel with commencement of operation in Akiruno
End of Mar. 2019
End of Mar. 2022
End of Mar. 2024
33
Reorganization of Labs
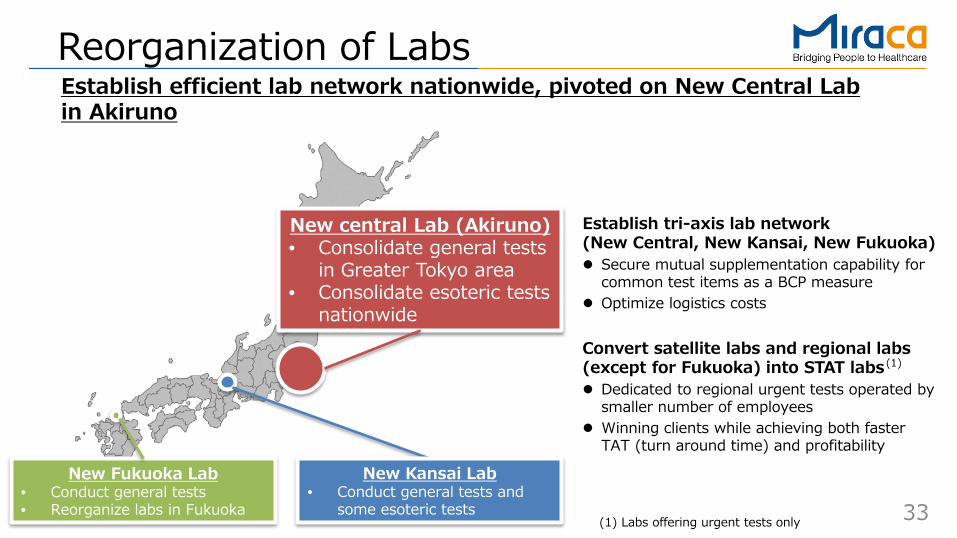
Establish tri-axis lab network(New Central, New Kansai, New Fukuoka) Secure mutual supplementation capability for
common test items as a BCP measure Optimize logistics costs
Convert satellite labs and regional labs (except for Fukuoka) into STAT labs Dedicated to regional urgent tests operated by
smaller number of employees Winning clients while achieving both faster
TAT (turn around time) and profitability
New Fukuoka Lab• Conduct general tests• Reorganize labs in Fukuoka
New central Lab (Akiruno)• Consolidate general tests
in Greater Tokyo area• Consolidate esoteric tests
nationwide
New Kansai Lab• Conduct general tests and
some esoteric tests
Establish efficient lab network nationwide, pivoted on New Central Lab in Akiruno
(1) Labs offering urgent tests only
(1)

Corporate Name Change
35
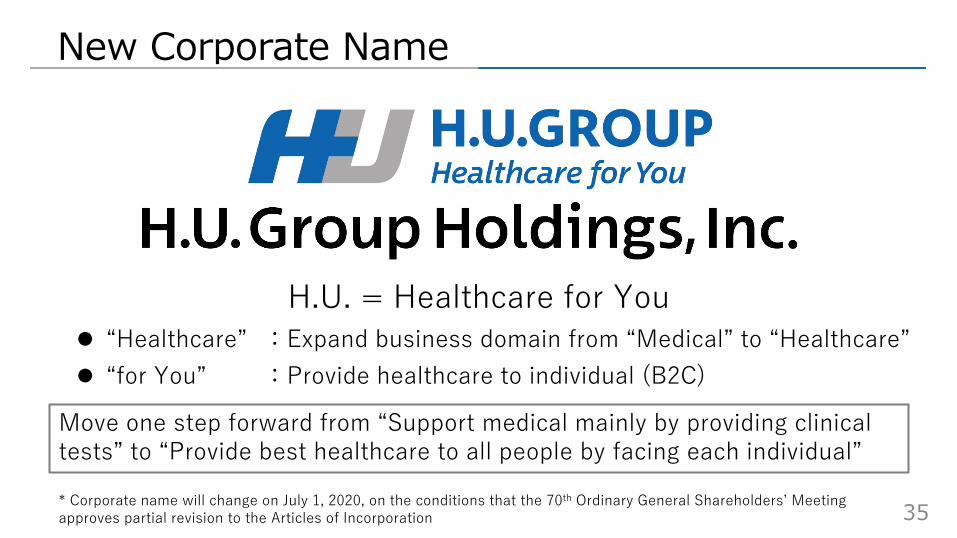
Move one step forward from “Support medical mainly by providing clinical tests” to “Provide best healthcare to all people by facing each individual”
New Corporate Name
H.U. = Healthcare for You “Healthcare” :Expand business domain from “Medical” to “Healthcare” “for You” :Provide healthcare to individual (B2C)
* Corporate name will change on July 1, 2020, on the conditions that the 70th Ordinary General Shareholders’ Meeting approves partial revision to the Articles of Incorporation

Appendix
37
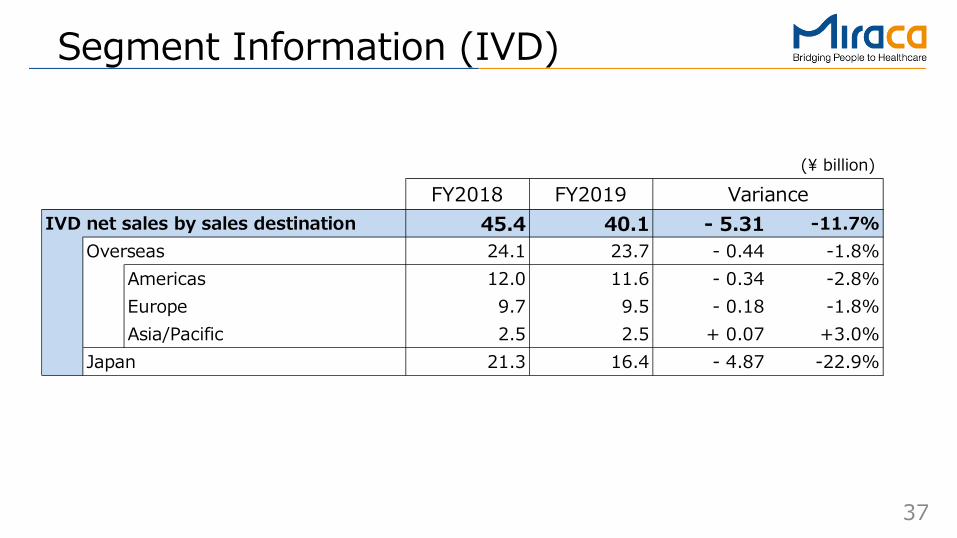
Segment Information (IVD)
(¥ billion)
FY2018 FY201945.4 40.1 - 5.31 -11.7%
Overseas 24.1 23.7 - 0.44 -1.8%Americas 12.0 11.6 - 0.34 -2.8%Europe 9.7 9.5 - 0.18 -1.8%Asia/Pacific 2.5 2.5 + 0.07 +3.0%
Japan 21.3 16.4 - 4.87 -22.9%
IVD net sales by sales destinationVariance
38
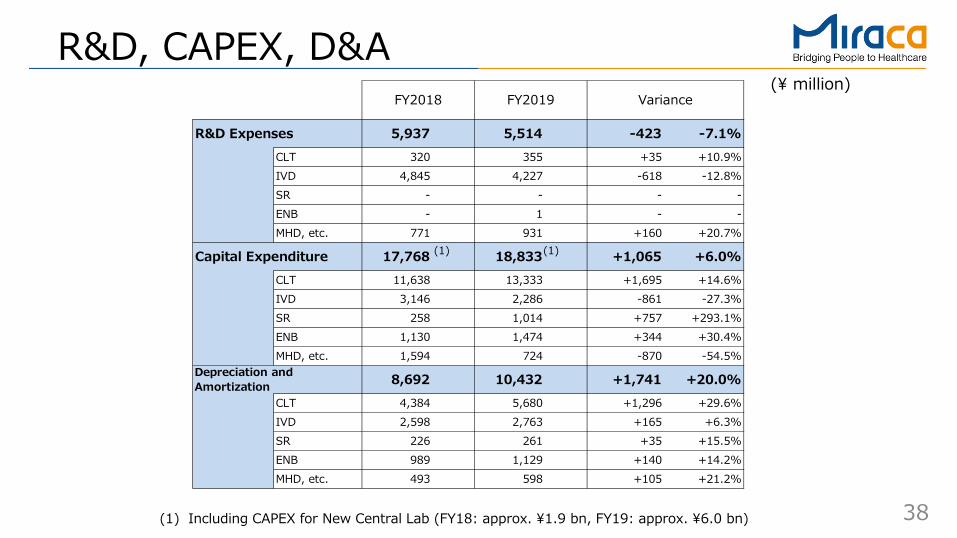
R&D Expenses 5,937 5,514 -423 -7.1%CLT 320 355 +35 +10.9%IVD 4,845 4,227 -618 -12.8%SR - - - -ENB - 1 - -MHD, etc. 771 931 +160 +20.7%
Capital Expenditure 17,768 18,833 +1,065 +6.0%CLT 11,638 13,333 +1,695 +14.6%IVD 3,146 2,286 -861 -27.3%SR 258 1,014 +757 +293.1%ENB 1,130 1,474 +344 +30.4%MHD, etc. 1,594 724 -870 -54.5%
8,692 10,432 +1,741 +20.0%CLT 4,384 5,680 +1,296 +29.6%IVD 2,598 2,763 +165 +6.3%SR 226 261 +35 +15.5%ENB 989 1,129 +140 +14.2%MHD, etc. 493 598 +105 +21.2%
FY2018 Variance
Depreciation andAmortization
FY2019
R&D, CAPEX, D&A(¥ million)
(1) Including CAPEX for New Central Lab (FY18: approx. ¥1.9 bn, FY19: approx. ¥6.0 bn)
(1) (1)
39
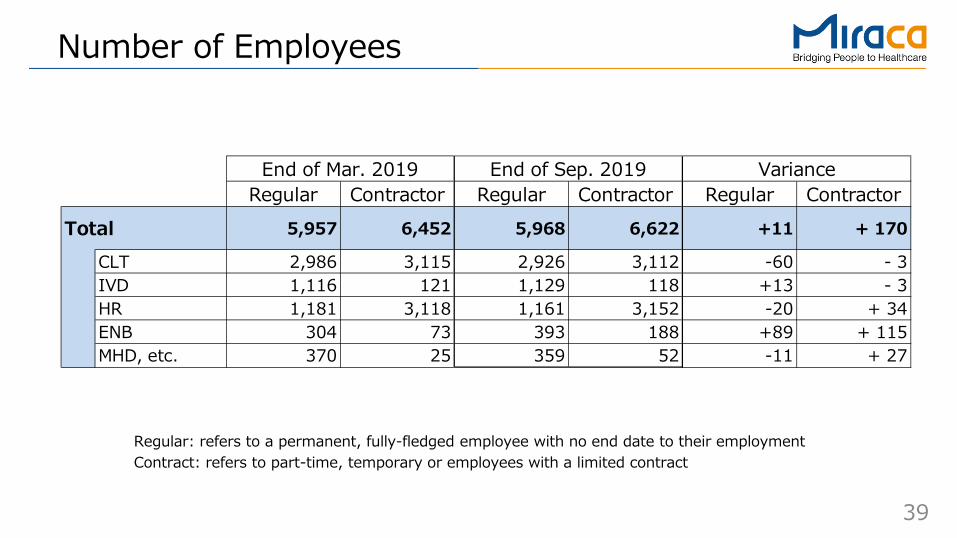
Number of Employees
Regular: refers to a permanent, fully-fledged employee with no end date to their employmentContract: refers to part-time, temporary or employees with a limited contract
Regular Contractor Regular Contractor Regular ContractorTotal 5,957 6,452 5,968 6,622 +11 + 170
CLT 2,986 3,115 2,926 3,112 -60 - 3IVD 1,116 121 1,129 118 +13 - 3HR 1,181 3,118 1,161 3,152 -20 + 34ENB 304 73 393 188 +89 + 115MHD, etc. 370 25 359 52 -11 + 27
End of Mar. 2019 End of Sep. 2019 Variance
Disclaimer regarding forward-looking statement:The performance forecast provided in this document is prepared by the management based on currently available information and various hypotheses and ideas including significant risks or uncertainties. Please be aware that the actual performance may turn out to be different from the forecast as a result of various contributing factors.Factors affecting the performance include, among others, aggravation of the economic situation, fluctuation of the exchange rate, change of regulatory, statutory, and administrative requirements, delayed launch of new products, pressures from the product strategies of competitive companies, and decline of the sales potential of existing products.
【Contact information】
IR/SR Section, Corporate Communications Department
Email : [email protected]