Embed Size (px)
Citation preview

FY2020
Results Presentation
May 13,2021
TSE 4182
©MITSUBISHI GAS CHEMICAL COMPANY, INC. 1

INDEX
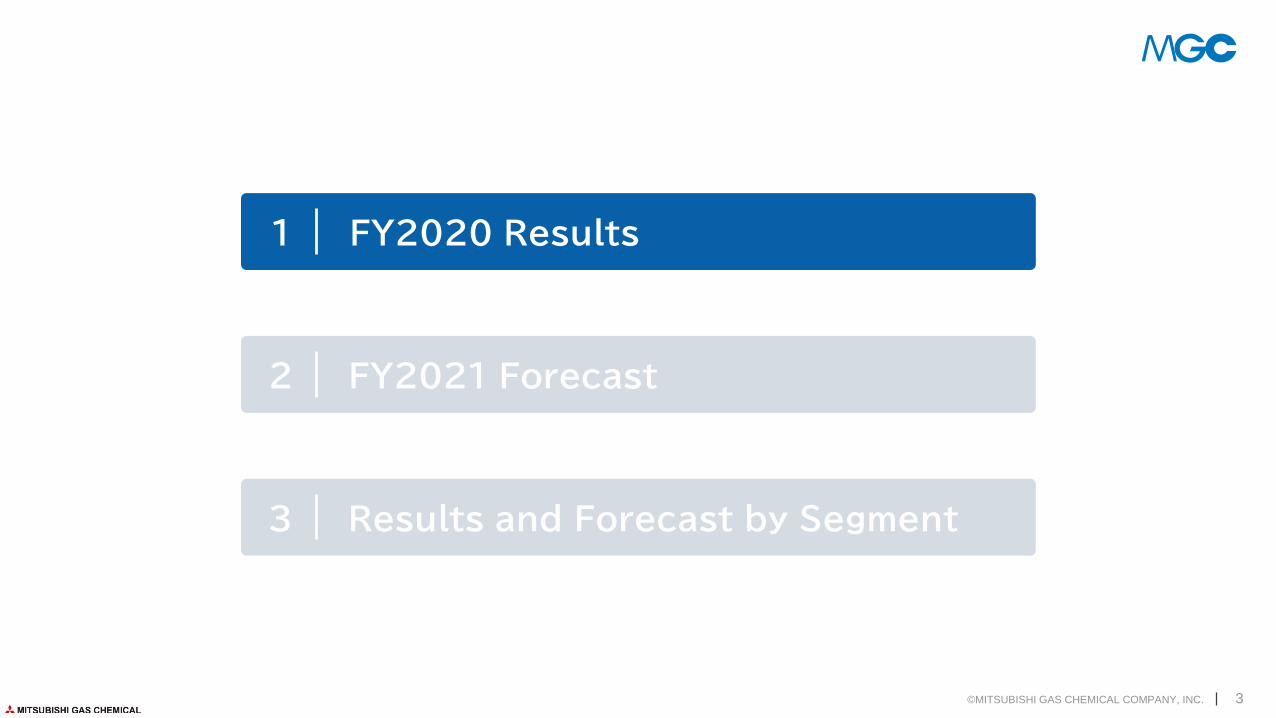
Results and Forecast by Segment3
2 FY2021 Forecast
1 FY2020 Results
©MITSUBISHI GAS CHEMICAL COMPANY, INC. 2
Results and Forecast by Segment3
2 FY2021 Forecast
1 FY2020 Results
©MITSUBISHI GAS CHEMICAL COMPANY, INC. 3

FY2020 Earnings
Profits grew, driven largely by buoyant demand for semiconductor-related products and optical resin
polymers, despite H1 headwinds from pandemic
ー Net sales: Down YoY, largely due to decreased unit sales of general-purpose aromatic chemicals and foamed
plastics
ー Operating profit: (+) Growth in unit sales of semiconductor-related products and optical resin polymers
(+) Lower feedstock/fuel prices than in FY2019
(+) ~¥3bn of incremental profit* booked in “other” segment in Q4
(-) Pandemic impacts (-¥5bn YoY in H1), increase in fixed expenses (e.g., repairs)
ー Equity-method income: Profit growth due largely to nonrecurrence of Saudi Arabian JV’s FY2019 one-time
expenses (¥7.8bn)
ー Actual vs. forecast: Several businesses, including energy resources and engineering plastics, outperformed their
forecasts
ー DPS: ¥70 (¥35 interim + ¥35 year-end dividend*), unchanged YoY and in line with forecast
*Scheduled to be formally authorized by Board of Directors on May 26, 2021
©MITSUBISHI GAS CHEMICAL COMPANY, INC. 4
*Profit growth in energy resources business due to increased wholesale electricity prices

FY2020 FY2019
Changes FY2020PreviousForecast*Amount %
Net Sales 595.7 613.3 ▲17.6 ▲2.9% 590.0
Operating Income 44.5 34.2 10.2 29.9% 36.0
(Equity in earnings of affiliates) (5.1) (▲1.2) (6.4) - (5.4)
Ordinary Income 50.2 31.1 19.1 61.5% 40.0
Net income before taxes
48.9 34.3 14.6 42.5% 38.0
Net income attributable to owners of the parent 36.0 21.1 14.9 70.5% 30.0
E P S(JPY) 173.41 100.50
R O E (%) 7.1 4.3
R O I C※ (%) 7.7 4.9
FX(JPY/USD) 106 109
FY2020 Results
*Announced on Feb4,2021
©MITSUBISHI GAS CHEMICAL COMPANY, INC. 5
※ROIC=Ordinary income/invested capital
Figures shown on this and the following pages are rounded down to the closest 0.1 billion. Percentages are rounded off to the closest whole number.
【JPY in billions】

FY2020 Increase and decrease factors of Operating Income
FY2019
342
Fixed Cost・SGA and others ▲3.3
Quantity
Factor
+6.5
Price Factor
+7.1
FY2020
©MITSUBISHI GAS CHEMICAL COMPANY, INC. 6
OP
+10.2
44.5
(+)BT materials,Optical Polymers, etc.(-)Foamed plastics, General-purpose aromatic chemical, etc.
Repair expenses , etc.
(+) Energy-related businessesBT materials (yield improvement)etc.
(-)MMA 等
34.2
【JPY in billions】

FY2020 Increase and decrease factors of Operating Income
FY2020Previous Forecast
36.0
Quantity
Factors +3.8
Price Factors+4.7
FY2020Results
©MITSUBISHI GAS CHEMICAL COMPANY, INC. 7
OP
+8.5
44.5
Increase in overall sales volume・Specialty aromatic chemical・Methanol and ammonia-based chemicals・Engineering plastics etc.
・Energy-related businesses+3.0・methanol etc.
【JPY in billions】

FY2020 Non-Operating & Extraordinary Items
Equity in earnings of
affiliates
Basic Chemicals +6.8
Specialty Chemicals ▲0.5
©MITSUBISHI GAS CHEMICAL COMPANY, INC. 8
FY2020 FY2019 Changes
Non-Operating items 5.7 ▲ 3.1 8.8
Equity in earnings of affiliates 5.1 ▲ 1.2 6.4
Financial income or losses 1.9 1.8 0.1
Foreign exchange gains or losses 0.8 ▲ 1.3 2.2
Others ▲ 2.2 ▲ 2.3 0.0
Extraordinary income 2.3 13.4 ▲ 11.0
Gains on sales of investment securities
1.8 2.6 ▲ 0.8
Gain on sales of non-current assets 0.2 0.8 ▲ 0.6
Subsidy income 0.1 6.7 ▲ 6.6
Reversal of provision for loss on guarantees
- 1.0 ▲ 1.0
Gain on step acquisitions - 1.0 ▲ 1.0
Others 0.1 1.0 ▲ 0.9
Extraordinary losses ▲ 3.6 ▲ 10.2 6.5
Impairment losses ▲ 1.6 ▲ 0.3 ▲ 1.3
Loss on tax purpose reduction entry of non-current assets
- ▲ 5.6 5.6
Provision for loss on liquidation of subsidiaries and associates
- ▲ 1.0 1.0
Others ▲ 1.9 ▲ 3.0 1.1
【JPY in billions】

FY2020 Balance Sheets
©MITSUBISHI GAS CHEMICAL COMPANY, INC. 9
Mar31,2021 Mar31,2020 Change
Current Assets 402.1 358.6 43.4
Cash and deposits 101.7 78.2 23.5
Trade notes and Accounts receivable
159.0 141.2 17.7
Inventories 121.2 114.7 6.4
Others 20.0 24.3 ▲ 4.3
Non-current Assets
434.2 413.0 21.1
Tangible assets 249.9 239.8 10.0
Intangible assets 10.4 10.5 ▲ 0.0
Investments and otherassets
173.7 162.6 11.1
Total Assets 836.3 771.7 64.6
Mar31,2021 Mar31,2020 Change
Liabilities 254.9 223.5 31.3
Trade note and accounts Payable
75.3 70.7 4.5
Interest-bearing debt 98.4 74.7 23.7
Others 81.1 78.1 3.0
Net Assets 581.4 548.1 33.2
Shareholders’ equity 514.4 494.3 20.1
Accumulated other comprehensive income
9.7 ▲ 1.7 11.5
Non controlling interest
57.1 55.6 1.5
Total liabilities and net assets
836.3 771.7 64.6
Equity Ratio 62.7% 63.8%
【JPY in billions】

FY2020 Cash Flows
©MITSUBISHI GAS CHEMICAL COMPANY, INC. 10
FY2020 FY2019 Changes
Operating activity cash flow 55.4 74.2 ▲ 18.7
Investing activity cash flows ▲ 40.3 ▲ 33.9 ▲ 6.4
Free cash flows 15.0 40.3 ▲ 25.2
Financing activity cash flows 5.1 ▲ 49.5 54.7
Effect of exchange rate change on cash and cash equivalents
0.6 ▲ 1.3 2.0
Net increase (decrease) in cash and cash equivalents
20.9 ▲ 10.5 31.5
Cash and cash equivalents at beginning of period
70.0 80.3 ▲10.3
Increase in cash and cash equivalents resulting from inclusion of subsidiaries in consolidation
0.0 0.2 ▲ 0.1
Cash and cash equivalents at end of period
91.0 70.0 21.0
【JPY in billions】

Results and Forecast by Segment3
2 FY2021 Forecast
1 FY2020 Results
©MITSUBISHI GAS CHEMICAL COMPANY, INC. 11

FY2021 Earnings Forecast
Forecasting top-line and profit growth driven largely by recovery in product demand depressed by
pandemic, but profit growth will be dampened by feedstock/fuel cost inflation
ー Net sales: (+) Unit sales growth driven by global economic recovery/growth and continued
semiconductor demand boom
(+) Higher market prices
(-) Adoption of new accounting standard for revenue recognition (estimated impact: -¥38bn)
ー Operating profit: (+) Unit sales growth
(+) Decreased nonconsolidated repair expenses (nonrecurrence of FY2020’s major
maintenance at Mizushima and Niigata Plants): +¥2.5bn
(-) Growth in R&D expenses and increased depreciation due to aggressive investments in
growth: -¥5bn
(-) Higher feedstock/fuel prices: -¥3bn
(-) Nonrecurrence of energy resources business’s FY2020 Q4 profit: -¥3bn
ー Equity-method income: Profit growth driven largely by higher methanol prices
ー DPS: ¥70, unchanged from FY2020
©MITSUBISHI GAS CHEMICAL COMPANY, INC. 12

FY2021 Forecast
13©MITSUBISHI GAS CHEMICAL COMPANY, INC.
FY2021Forecast
FY2020Results
Change
Amount %
Net Sales 640.0 595.7 -※ -※
Operating Income 48.0 44.5 3.4 7.8%
(Equity in earnings of affiliates) (9.4) (5.1) (4.3) -
Ordinary Income 56.0 50.2 5.7 11.5%
Net income before taxes 55.0 48.9 6.0 12.4%
Net income attributable to owners of the parent 41.0 36.0 4.9 13.7%
E P S(JPY) 197.10 173.41
R O E (%) 7.7 7.1
R O I C※ (%) 8.1 7.7
FX(JPY/USD) 105 106
※From the start of the fiscal year ending March 31, 2022, the Company will be applying “Accounting Standard for Revenue Recognition” (ASBJ Statement No. 29) and its accompanying guidance. Accordingly, the Net sales for the consolidated business forecasts for the fiscal year ending March 31, 2022 reflect the aforementioned application, and year on-year changes are not presented.

12.6 14.9 14.8 14.5 14.5
7.08.7
2017 2018 2019 2020 2021
Annual dividend
(Yen/share)
Net incomeJPY in billions
(FY)
【JPY in billions】
ー The MGC Group places topmost management priority on enhancing corporate value.
ー The Company will continuously provide stable dividends, while taking operating performance and other factors into account when
determining the distribution amount.
ー The Company’s basic policy is to improve capital efficiency and enhance shareholder returns by flexibly purchasing treasury stock
while considering the levels of internal reserves and returns to shareholders.
ー Total payout ratio of 40% as a target for medium-term shareholder returns.
Shareholder return policy / Shareholder return
©MITSUBISHI GAS CHEMICAL COMPANY, INC. 14
60.5
59
55.0 21.1 36.0
70 70 70 70
41.0
Forecast
Full-year dividends for FY2021 expected to total ¥70 per share

Results and Forecast by Segment3
2 FY2021 Forecast
1 FY2020 Results
©MITSUBISHI GAS CHEMICAL COMPANY, INC. 15

Results and Forecast by Segment
©MITSUBISHI GAS CHEMICAL COMPANY, INC. 16
FY2019 FY2020 FY2021 forecast
1H 2H FY 1H 2H FY 1H 2H FY
Net sales 303.3 309.9 613.3 266.6 329.0 595.7 310.0 330.0 640.0
Basic Chemicals 181.4 182.3 363.8 141.2 181.5 322.8 181.2 196.1 377.4
Specialty Chemicals 125.0 130.8 255.9 124.0 143.7 267.8 131.3 136.3 267.6
Other andAdjustment
▲ 3.1 ▲ 3.2 ▲ 6.4 1.3 3.7 5.0 ▲2.5 ▲2.5 ▲5.1
Operatingincome
16.0 18.2 34.2 14.3 30.1 44.5 22.0 26.0 48.0
Basic Chemicals 7.1 4.0 11.2 0.4 9.1 9.6 8.7 9.2 17.9
Specialty Chemicals 10.0 15.4 25.5 15.3 19.4 34.8 15.5 18.7 34.2
Other andAdjustment
▲ 1.2 ▲ 1.3 ▲ 2.5 ▲1.4 1.5 0.0 ▲2.2 ▲1.9 ▲4.2
Ordinaryincome
11.6 19.4 31.1 16.5 33.6 50.2 26.0 30.0 56.0
Basic Chemicals 0.9 3.8 4.7 1.5 9.4 11.0 11.3 12.4 23.8
Specialty Chemicals 11.7 16.4 28.1 15.9 21.6 37.5 16.5 19.5 36.0
Other andAdjustment
▲ 1.0 ▲ 0.7 ▲ 1.8 ▲0.9 2.6 1.6 ▲1.9 ▲1.9 ▲3.8
【 JPY in billions 】
Basic Chemicals
©MITSUBISHI GAS CHEMICAL COMPANY, INC. 17
11.29.6
17.9
4.7
11.0
23.8
363.8
322.8
377.4
0
50
100
150
200
250
300
350
400
0
500
1,000
1,500
2,000
2,500
3,000
3,500
4,000
4,500
Fiscal 2019 results
Fiscal 2020 results
Fiscal 2021 forecast
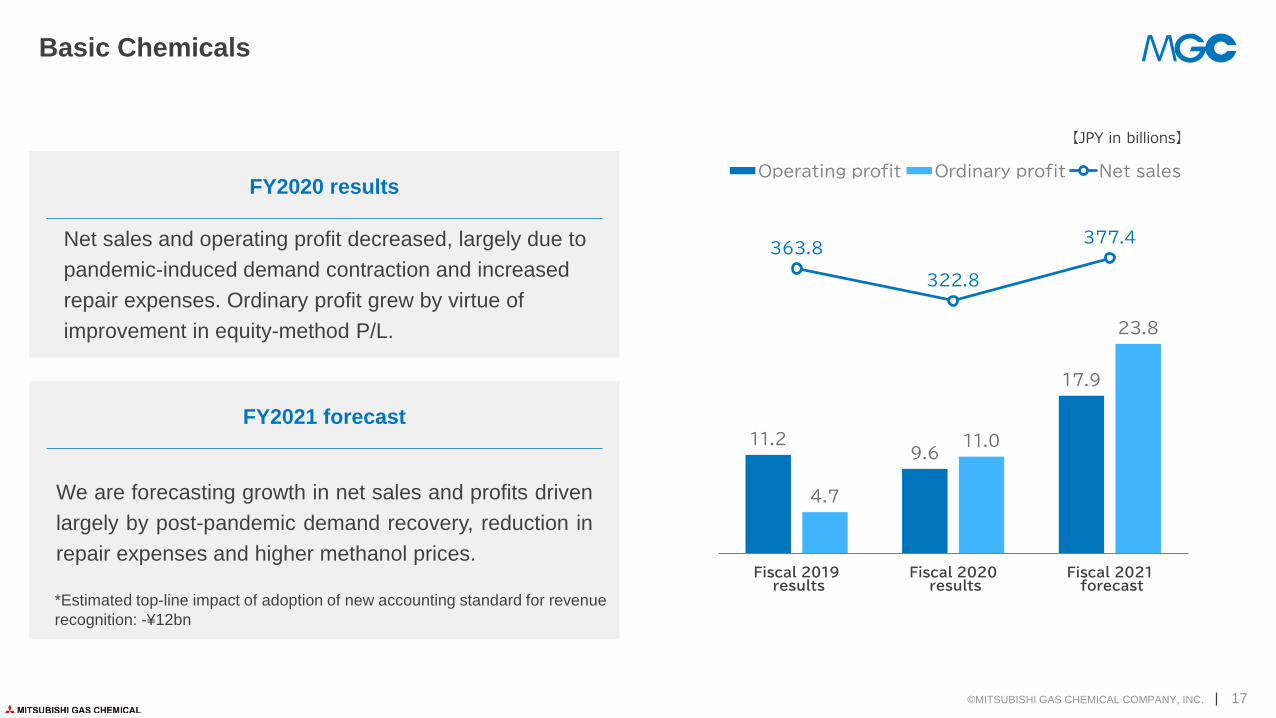
Operating profit Ordinary profit Net salesFY2020 results
Net sales and operating profit decreased, largely due to
pandemic-induced demand contraction and increased
repair expenses. Ordinary profit grew by virtue of
improvement in equity-method P/L.
FY2021 forecast
We are forecasting growth in net sales and profits driven
largely by post-pandemic demand recovery, reduction in
repair expenses and higher methanol prices.
*Estimated top-line impact of adoption of new accounting standard for revenue
recognition: -¥12bn
【JPY in billions】

ーMethanol: ASP was down in H1, up in H2, roughly flat on full-year basis (FY2019: US$261/t FY2020: US$256/t).
Equity-method investees’ P/L improved, largely by virtue of Saudi Arabian JV’s ~¥1.8bn* tax refund and nonrecurrence of its ¥7.8bn of one-time
expenses booked in FY2019.
ーMethanol/ammonia-based chemicals: Profits reduced by increased feedstock prices and repair expenses.
ー Specialty aromatic chemicals: Aromatic aldehyde unit-sales increased. MXDA unit-sales rebounded sharply in H2 following pandemic-induced
demand contraction in H1, leaving P/L unchanged YoY.
ーGeneral-purpose aromatic chemicals: Sales and profits were down due to declines in MX and PIA unit-sales and ASPs.
ー Foamed plastics (JSP): Benefited from growth in demand from food and civil engineering sectors and H2 recovery in automotive demand.
Basic Chemicals: Performance by Business
*Includes reduction in income tax expense due to change in ownership percentage in addition to tax refund related to sale of equity holdings
ーMethanol: Although maintenance at Brunei and nonrecurrence of the FY2020 tax refund will weigh on profits on a YoY basis, we are forecasting profit
growth driven by equity-method investees, largely by virtue of higher methanol price (FY2020: US$256/t FY2021: US$320/t).
ーMethanol/ammonia-based chemicals: We are forecasting profit growth driven largely by MMA-based product unit-sales growth/margin expansion
and reduction in repair expenses.
ー High-performance products*: We are forecasting MXDA unit-sales growth against a backdrop of buoyant demand. We expect aromatic aldehyde
unit-sales to be down YoY, largely due to customer inventory destocking. We are working on increasing sales of supply-constrained products in line
with production capacity.
ー Xylene separators/derivatives*: We expect to improve P/L through fixed-cost cutting and post-pandemic recovery in unit sales.
ー JSP: We anticipate recovery in automotive unit-sales but expect P/L to remain unchanged YoY, largely because of increased feedstock/fuel costs.
©MITSUBISHI GAS CHEMICAL COMPANY, INC. 18
FY2020 results
FY2021 forecast
*Previously specialty aromatic chemicals (MXDA, MX nylon, aromatic aldehyde, etc.)
*Previously general-purpose
aromatic chemicals (MX, PIA, etc.)

Specialty Chemicals
©MITSUBISHI GAS CHEMICAL COMPANY, INC. 19
25.5
34.8 34.2
28.1
37.536.0
255.9267.8 267.6
0
50
100
150
200
250
300
350
400
450
500
0
500
1,000
1,500
2,000
2,500
3,000
Fiscal 2019results
Fiscal 2020results
Fiscal 2021forecast
Operating profit Ordinary profit Net salesFY2020 results
Net sales and profits grew, boosted by growth in unit sales
of semiconductor-related products and optical resin
polymers.
FY2021 forecast
While we anticipate recovery in product demand depressed
by the pandemic and growth in semiconductor-related
product unit-sales, we expect profits to be down modestly
YoY, largely because of margin compression due to higher
feedstock/fuel prices in addition to growth in SG&A and fixed
expenses.
*Estimated top-line impact of adoption of new accounting standard for
revenue recognition: -¥26bn
【JPY in billions】
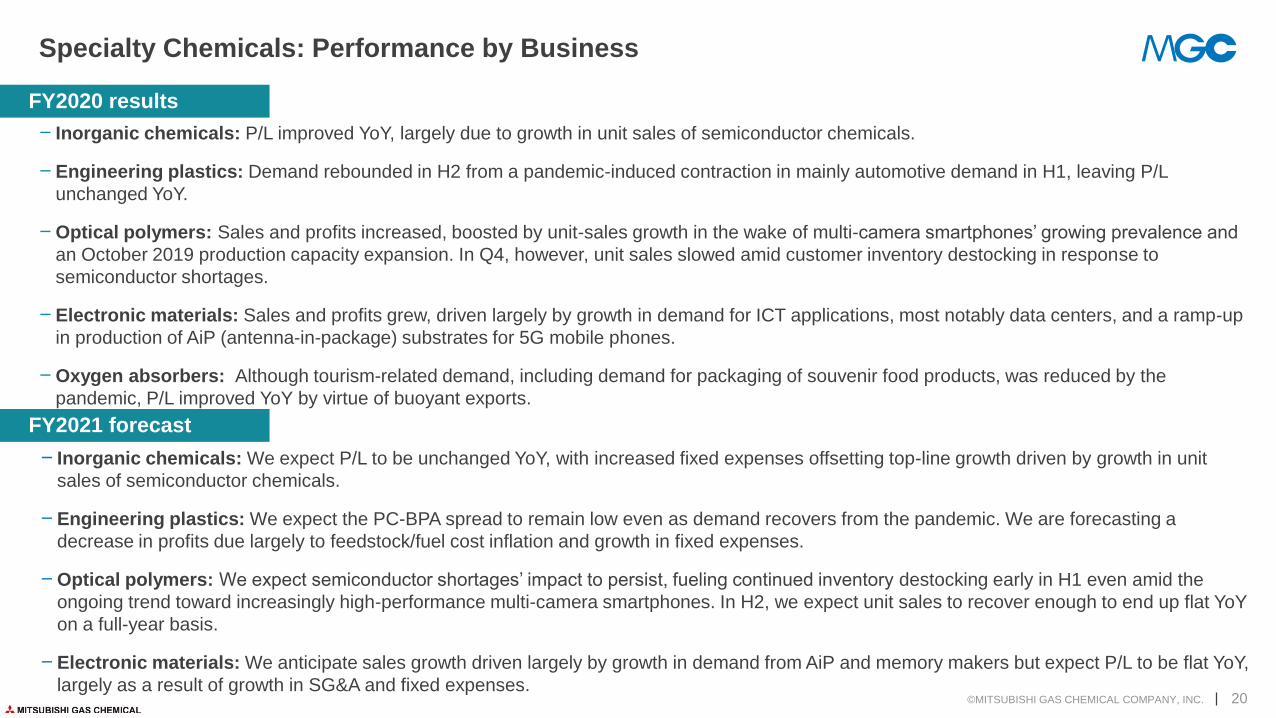
ー Inorganic chemicals: P/L improved YoY, largely due to growth in unit sales of semiconductor chemicals.
ー Engineering plastics: Demand rebounded in H2 from a pandemic-induced contraction in mainly automotive demand in H1, leaving P/L
unchanged YoY.
ーOptical polymers: Sales and profits increased, boosted by unit-sales growth in the wake of multi-camera smartphones’ growing prevalence and
an October 2019 production capacity expansion. In Q4, however, unit sales slowed amid customer inventory destocking in response to
semiconductor shortages.
ー Electronic materials: Sales and profits grew, driven largely by growth in demand for ICT applications, most notably data centers, and a ramp-up
in production of AiP (antenna-in-package) substrates for 5G mobile phones.
ーOxygen absorbers: Although tourism-related demand, including demand for packaging of souvenir food products, was reduced by the
pandemic, P/L improved YoY by virtue of buoyant exports.
Specialty Chemicals: Performance by Business
ー Inorganic chemicals: We expect P/L to be unchanged YoY, with increased fixed expenses offsetting top-line growth driven by growth in unit
sales of semiconductor chemicals.
ー Engineering plastics: We expect the PC-BPA spread to remain low even as demand recovers from the pandemic. We are forecasting a
decrease in profits due largely to feedstock/fuel cost inflation and growth in fixed expenses.
ーOptical polymers: We expect semiconductor shortages’ impact to persist, fueling continued inventory destocking early in H1 even amid the
ongoing trend toward increasingly high-performance multi-camera smartphones. In H2, we expect unit sales to recover enough to end up flat YoY
on a full-year basis.
ー Electronic materials: We anticipate sales growth driven largely by growth in demand from AiP and memory makers but expect P/L to be flat YoY,
largely as a result of growth in SG&A and fixed expenses.©MITSUBISHI GAS CHEMICAL COMPANY, INC. 20
FY2020 results
FY2021 forecast

セグメント別 業績概要3
Appendix
1 2020年度決算概要
©MITSUBISHI GAS CHEMICAL COMPANY, INC. 21

Appendix: Key Indicators (1)
©MITSUBISHI GAS CHEMICAL COMPANY, INC. 22
2012 2013 2014 2015 2016 2017 2018 2019 2020 2021(F)
Capital expenditure
(H1)
30.9[17.7]
25.4[13.8]
22.2[10.3]
30.5[14.9]
35.0[13.7]
30.9[13.9]
39.2[18.6]
42.3[22.4]
40.2[15.8]
70.0[37.0]
Depreciation&
Amortization
(H1)
23.0[10.7]
23.5[11.4]
23.7[11.5]
26.7[13.1]
25.6[12.2]
27.0[13.1]
27.4[13.5]
29.5[14.4]
30.6[15.1]
33.0[16.0]
R&D expenditure
(H1)
15.1[7.2]
16.1[8.0]
16.8[8.0]
18.9[9.2]
19.2[9.6]
18.9[9.5]
18.6[9.1]
19.6[9.4]
19.9[9.8]
22.5[11.5]
Employees(as of
Mar 31)5,323 5,445 8,254 8,176 8,034 8,009 8,276 8,954 8,998 10,033
EPS(Yen)* ▲35 66 192 154 222 281 257 101 173 197
ROA(%) 4.6 4.8 5.8 5.9 8.4 10.6 8.7 3.9 6.2 6.6
ROE (%) ▲2.8 5.0 12.6 9.0 12.0 13.6 11.3 4.3 7.1 7.7
ROIC(%) 5.8 6.1 7.2 7.3 10.4 13.2 10.9 4.9 7.7 8.1
Dividend(yen)*
(of which,
Interim dividend)
24.0[12.0]
24.0[12.0]
28.0[14.0]
32.0[16.0]
38.0[16.0]
59.0[24.0]
70.0[35.0]
70.0[35.0]
70.0[35.0]
70.0[35.0]
【 JPY in billions 】
*The Company conducted a consolidation of shares at a ratio of one share for every two shares effective October1,2016. EPS and dividends have been calculated by retroactive adjustment applying the above share consolidation to preceding periods as well.

Appendix:Key Indicator (2) Capex, depreciation and amortization by segment
©MITSUBISHI GAS CHEMICAL COMPANY, INC. 23
2012 2013 2014 2015 2016 2017 2018 2019 2020 2021(F)
Cap
ex
Natural Gas 6.3 4.5 5.7 5.3 9.0 6.0 5.7 7.2Basic
Chemicals19.4 24.0
Aromatic 5.7 2.3 4.0 10.6 10.5 11.3 14.6 15.0
Specialty 15.0 11.2 7.6 9.9 8.1 11.0 14.4 14.6Specialty
Chemicals18.6 42.0
Information & Advanced Materials 3.3 6.6 4.3 3.8 6.6 1.9 2.3 2.6
Other 0.3 0.5 0.3 0.7 0.5 0.6 2.1 2.7 Other 2.1 4.0
Total 30.9 25.4 22.2 30.5 35.0 30.9 39.2 42.3 Total 40.2 70.0
De
pre
cia
tion
Natural Gas 6.2 6.3 6.9 6.1 5.0 5.1 5.5 6.3Basic
Chemicals16.3 17.0
Aromatic 5.8 4.1 3.9 8.2 8.5 8.5 8.7 9.5
Specialty 7.7 9.5 9.2 8.8 8.6 9.1 8.7 8.7Specialty
Chemicals13.0 14.0
Information & Advanced Materials 2.7 3.1 3.3 3.0 3.0 3.5 3.6 3.8
Other 0.3 0.3 0.3 0.3 0.3 0.5 0.8 1.0 Other 1.2 2.0
Total 23.0 23.5 23.7 26.7 25.6 27.0 27.4 29.5 Total 30.6 33.0
【 JPY in billions 】

Appendix: Key Indicator (3)
©MITSUBISHI GAS CHEMICAL COMPANY, INC. 24
FY2017 FY2018 FY2019 FY2020 FY2021
H1 H2 H1 H2 H1 H2 H1 H2 (F)
FX(JPY/USD) 111 111 110 112 109 109 107 105 105
FX(JPY/EUR) 126 133 130 127 121 120 121 126 130
Crude Oil(Dubai)
(US$/BBL)50 62 73 65 64 56 37 52 65
Methanol (US$/MT) 296 381 408 335 277 245 194 319 320
Mixed Xylene(US$/MT) 650 725 845 730 705 640 420 560 690
Bisphenol A (US$/MT)*
1,100
~1,300
1,200
~1,700
1,600
~1,900
1,200
~1,800
1,000
~1,450
1,050
~1,350
900~1,450
1,400~3,300
1,200~3,800
Polycarbonate
(US$/MT)*
2,500
~2,900
2,900
~3,900
2,700
~3,800
2,100
~2,800
1,900
~2,250
1,650
~2,000
1,500~2,150
2,100~4,000
1,900~4,300
FX(USD) :with an appreciation(depreciation) of 1 yen against the USD, annual operating income falls (increase) by 0.6 billion yen, while annual ordinary income falls(increases) by 0.5 billion yen.
FX(EUR):with an appreciation(depreciation) of 1 yen against the USD, annual operating income falls (increase) by 0.1 billion yen, while annual ordinary income falls(increases) by 0.1 billion yen.
Crude oil(Dubai):A 1 dollar/BBL increase(drop) in crude oil reduces(raises) income by 0.15 billion yen. (exclude methanol affect)
Methanol : A 1 dollar/MT increase (drop) in market price raises (reduces) equity in earnings of affiliates by 0.1 billion yen.
Sensitivity(Rough estimates)
*Describe the minimum and maximum values during the period
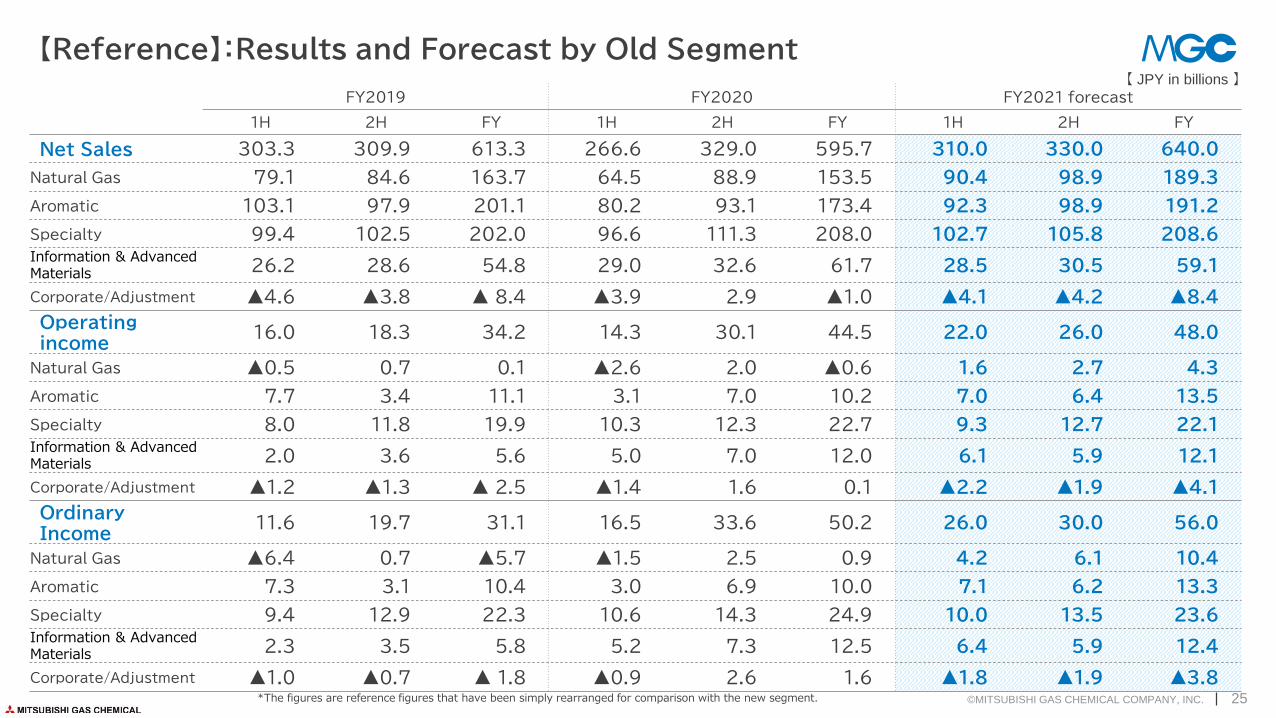
【Reference】:Results and Forecast by Old Segment
©MITSUBISHI GAS CHEMICAL COMPANY, INC. 25
FY2019 FY2020 FY2021 forecast
1H 2H FY 1H 2H FY 1H 2H FY
Net Sales 303.3 309.9 613.3 266.6 329.0 595.7 310.0 330.0 640.0
Natural Gas 79.1 84.6 163.7 64.5 88.9 153.5 90.4 98.9 189.3
Aromatic 103.1 97.9 201.1 80.2 93.1 173.4 92.3 98.9 191.2
Specialty 99.4 102.5 202.0 96.6 111.3 208.0 102.7 105.8 208.6Information & Advanced Materials 26.2 28.6 54.8 29.0 32.6 61.7 28.5 30.5 59.1
Corporate/Adjustment ▲4.6 ▲3.8 ▲ 8.4 ▲3.9 2.9 ▲1.0 ▲4.1 ▲4.2 ▲8.4
Operating income
16.0 18.3 34.2 14.3 30.1 44.5 22.0 26.0 48.0
Natural Gas ▲0.5 0.7 0.1 ▲2.6 2.0 ▲0.6 1.6 2.7 4.3
Aromatic 7.7 3.4 11.1 3.1 7.0 10.2 7.0 6.4 13.5
Specialty 8.0 11.8 19.9 10.3 12.3 22.7 9.3 12.7 22.1Information & Advanced Materials 2.0 3.6 5.6 5.0 7.0 12.0 6.1 5.9 12.1
Corporate/Adjustment ▲1.2 ▲1.3 ▲ 2.5 ▲1.4 1.6 0.1 ▲2.2 ▲1.9 ▲4.1
Ordinary Income
11.6 19.7 31.1 16.5 33.6 50.2 26.0 30.0 56.0
Natural Gas ▲6.4 0.7 ▲5.7 ▲1.5 2.5 0.9 4.2 6.1 10.4
Aromatic 7.3 3.1 10.4 3.0 6.9 10.0 7.1 6.2 13.3
Specialty 9.4 12.9 22.3 10.6 14.3 24.9 10.0 13.5 23.6Information & Advanced Materials 2.3 3.5 5.8 5.2 7.3 12.5 6.4 5.9 12.4
Corporate/Adjustment ▲1.0 ▲0.7 ▲ 1.8 ▲0.9 2.6 1.6 ▲1.8 ▲1.9 ▲3.8
【 JPY in billions 】
*The figures are reference figures that have been simply rearranged for comparison with the new segment.
Disclaimer
26
These materials contain performance forecasts and other statements concerning the future.
These forward-looking statements are based on information available at the time.
These materials were prepared and on certain premises judged to be reasonable.
None of these forward-looking statements are intended to be guarantees of future performance.
Various factors may cause actual performance to differ significantly from forecasts.