Embed Size (px)
Citation preview

8/3/2019 Fyp-importance-Aspects-overall Satisfaction_ Buying Behavior and Loyalty
http://slidepdf.com/reader/full/fyp-importance-aspects-overall-satisfaction-buying-behavior-and-loyalty 1/98
PROJECT REPORT
ON
HOW DOES ONE DECIDE THE IMPORTANCEOF ASPECTS IN OVERALL SATISFACTION,
BUYING BEHAVIOR AND LOYALTY
FOR
METRIC CONSULTANCY LTD
SUBMITTED IN PARTIAL FULFILMENT FOR THE
DEGREE OF MASTER OF BUSINESS ADMINISTRATION
AFFLIATED TO
THE UNIVERSITY OF PUNE
BY
MAHESH V. SANDBHOR MBA-2nd YEAR
2005-2006
OF
VISHWAKARMA INSTITUTE OF MANAGEMENT
www.final-yearprojects.co.cc | www.troubleshoot4free.com/fyp/
8/3/2019 Fyp-importance-Aspects-overall Satisfaction_ Buying Behavior and Loyalty
http://slidepdf.com/reader/full/fyp-importance-aspects-overall-satisfaction-buying-behavior-and-loyalty 2/98
ACKNOWLEDGEMENT
Summer training project is the foundation on which the career of MBA
student develops. My two months project at METRIC Consultancy has been
high lightening in the professional environment of the organization. This report
is the mirror of my sincere efforts.
I would like to express my heartfelt gratitude to DR. Arvind .Karandikar
of METRIC Consultancy for giving me opportunity as summer trainee in their
esteemed organization. I am also highly grateful to all my research officers at
METRIC Consultancy. Their timely Inquiries about the progress of the project,
critical appraisal, suggestions & motivational words continued to come
throughout the course of the project for its betterment. This served to spiral
my ambition to greater heights.
I, take this opportunity to convey my sincere thanks to Prof. Avinash
Nene, my project guide and Dr. Sharad Joshi, our mentor for providing me
resourceful guidance. Last but not the least, I express my gratitude to all the
members of Metric consultancy & my college who guided me in carrying out
this project successfully.
www.final-yearprojects.co.cc | www.troubleshoot4free.com/fyp/
8/3/2019 Fyp-importance-Aspects-overall Satisfaction_ Buying Behavior and Loyalty
http://slidepdf.com/reader/full/fyp-importance-aspects-overall-satisfaction-buying-behavior-and-loyalty 3/98
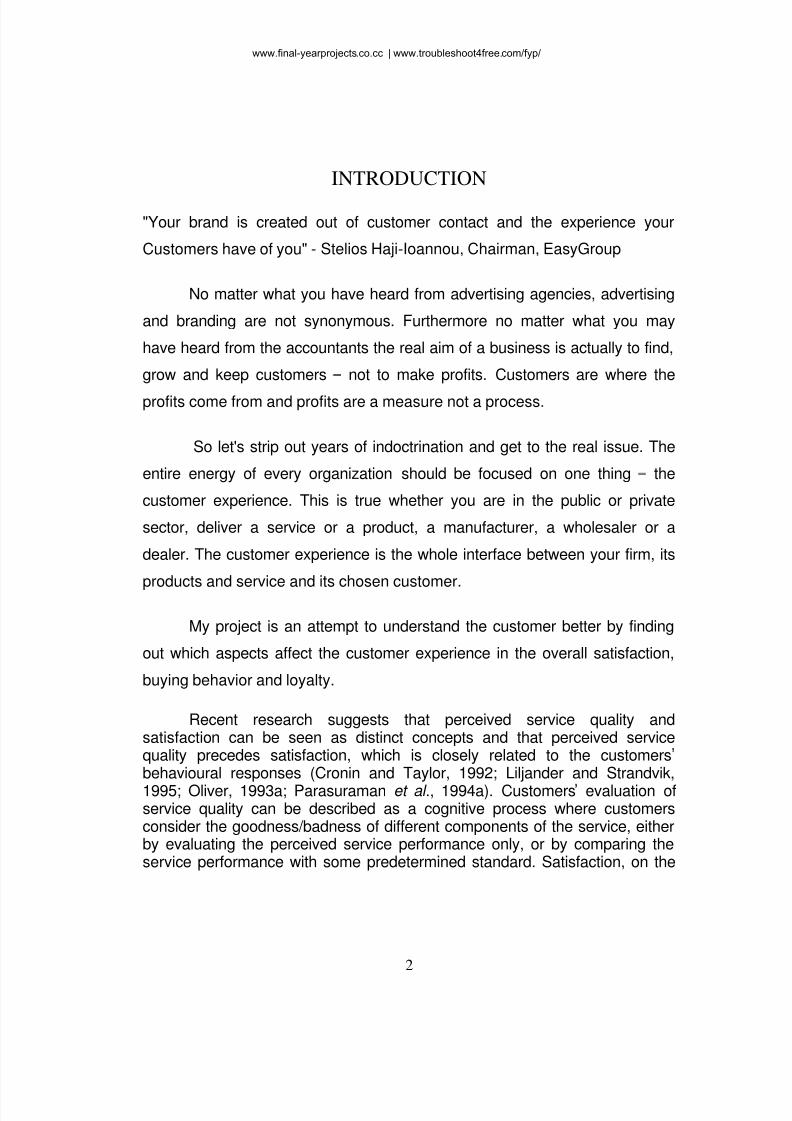
Mahesh V. Sandbhor
CONTENTS
Sr. no Title Page No.
1 Introduction
Why I chose this topic
Objectives of project
3
5
2 Company profile 6
3 Overview of MOSTER 13
4 Baxter s Model 23
5 Gaps Model of Service Quality 40
6 Observations and Calculations 58
7 Charts and Interpretation 74
8 Limitations and scope for study 82
9 Relationship between gaps model and Baxter s
model 84
10 Summary 88
11 Bibliography 90
12 Annexure 92
www.final-yearprojects.co.cc | www.troubleshoot4free.com/fyp/

8/3/2019 Fyp-importance-Aspects-overall Satisfaction_ Buying Behavior and Loyalty
http://slidepdf.com/reader/full/fyp-importance-aspects-overall-satisfaction-buying-behavior-and-loyalty 4/98
INTRODUCTION
www.final-yearprojects.co.cc | www.troubleshoot4free.com/fyp/
8/3/2019 Fyp-importance-Aspects-overall Satisfaction_ Buying Behavior and Loyalty
http://slidepdf.com/reader/full/fyp-importance-aspects-overall-satisfaction-buying-behavior-and-loyalty 5/98
2
INTRODUCTION
"Your brand is created out of customer contact and the experience your
Customers have of you" - Stelios Haji-Ioannou, Chairman, EasyGroup
No matter what you have heard from advertising agencies, advertising
and branding are not synonymous. Furthermore no matter what you may
have heard from the accountants the real aim of a business is actually to find,
grow and keep customers not to make profits. Customers are where the
profits come from and profits are a measure not a process.
So let's strip out years of indoctrination and get to the real issue. The
entire energy of every organization should be focused on one thing the
customer experience. This is true whether you are in the public or private
sector, deliver a service or a product, a manufacturer, a wholesaler or a
dealer. The customer experience is the whole interface between your firm, its
products and service and its chosen customer.
My project is an attempt to understand the customer better by finding
out which aspects affect the customer experience in the overall satisfaction,
buying behavior and loyalty.
Recent research suggests that perceived service quality andsatisfaction can be seen as distinct concepts and that perceived servicequality precedes satisfaction, which is closely related to the customersbehavioural responses (Cronin and Taylor, 1992; Liljander and Strandvik,
1995; Oliver, 1993a; Parasuraman et al ., 1994a). Customers evaluation ofservice quality can be described as a cognitive process where customersconsider the goodness/badness of different components of the service, eitherby evaluating the perceived service performance only, or by comparing theservice performance with some predetermined standard. Satisfaction, on the
www.final-yearprojects.co.cc | www.troubleshoot4free.com/fyp/

8/3/2019 Fyp-importance-Aspects-overall Satisfaction_ Buying Behavior and Loyalty
http://slidepdf.com/reader/full/fyp-importance-aspects-overall-satisfaction-buying-behavior-and-loyalty 6/98
3
other hand, is believed to contain an affective dimension too, without which customers responses cannot be fully accounted for.
www.final-yearprojects.co.cc | www.troubleshoot4free.com/fyp/
8/3/2019 Fyp-importance-Aspects-overall Satisfaction_ Buying Behavior and Loyalty
http://slidepdf.com/reader/full/fyp-importance-aspects-overall-satisfaction-buying-behavior-and-loyalty 7/98
4
Why I chose this topic?
A friend of mine, who is a prominent professional athlete, teaches a
class of four-year-old children. He takes a special interest in them and takes
time to greet them. He affirms their value and worth. As a result, they wouldn't
miss his class for anything. They want to climb all over him and sit in his lap.
Our customers are no different than these children. They want to becalled by name. They want to feel that the company representative really
cares about them. It makes a huge difference. In fact, it's often what makes orbreaks the deal.
Father of nation Mahatma Gandhi has said Customers are like a God.It takes years to make a customer & takes only a second to break them. Intoday s growing competitive market when customers have got lot of choice ofthe products in the market it becomes prime important for the companies toattract the customers by offering best products, reasonable prices, good aftersales service, value addition. Company has to do lot of research & survey oncustomer Satisfaction, dissatisfaction. The company which can fulfill theabove criteria s can survive in the market for a longer time as a leader.
As a customer, I can usually tell if frontline service providers are "totallypresent" during the few seconds we interact as they take my order or dealwith my request. If they're totally present, I sense that they really care. This isone of the aspects which are of outmost importance to me. But my fascinationprompted me to analyze this process further. Metric Consultancy provided methis opportunity.
At Metric Consultancy they already had a model to measure customersatisfaction index known as MOSTER (MOnitoring Satisfaction To EnsureRetention). They were in a process of testing the feasibility and upgrading
their existing model by finding out whether there were other models betterthan MOSTER and if so how they could improve MOSTER. One of the faceton which wanted to work was the way importance of aspects in overallsatisfaction, buying behavior and loyalty are measured and how this processcan be made better.
www.final-yearprojects.co.cc | www.troubleshoot4free.com/fyp/

8/3/2019 Fyp-importance-Aspects-overall Satisfaction_ Buying Behavior and Loyalty
http://slidepdf.com/reader/full/fyp-importance-aspects-overall-satisfaction-buying-behavior-and-loyalty 8/98
5
www.final-yearprojects.co.cc | www.troubleshoot4free.com/fyp/

8/3/2019 Fyp-importance-Aspects-overall Satisfaction_ Buying Behavior and Loyalty
http://slidepdf.com/reader/full/fyp-importance-aspects-overall-satisfaction-buying-behavior-and-loyalty 9/98
6
Why I chose this organization?
Metric Consultancy Ltd is an independent professional marketresearch, training and consultancy organization. It is one of the variousorganizations who work on the consumer satisfaction index study. It has aglobal presence by the way global partners who markets their consumersatisfaction index product in their respective countries. They have developedvarious models for the measurement of consumer satisfaction index.
www.final-yearprojects.co.cc | www.troubleshoot4free.com/fyp/

8/3/2019 Fyp-importance-Aspects-overall Satisfaction_ Buying Behavior and Loyalty
http://slidepdf.com/reader/full/fyp-importance-aspects-overall-satisfaction-buying-behavior-and-loyalty 10/98
7
Objectives of the project
There project ob jectives were as follows
To find importance of aspects in overall satisfaction, buying behaviorand loyalty.
To find existing model which could be used to measure these aspects.
www.final-yearprojects.co.cc | www.troubleshoot4free.com/fyp/

8/3/2019 Fyp-importance-Aspects-overall Satisfaction_ Buying Behavior and Loyalty
http://slidepdf.com/reader/full/fyp-importance-aspects-overall-satisfaction-buying-behavior-and-loyalty 11/98
8
COMPAN Y PROFILE
www.final-yearprojects.co.cc | www.troubleshoot4free.com/fyp/
8/3/2019 Fyp-importance-Aspects-overall Satisfaction_ Buying Behavior and Loyalty
http://slidepdf.com/reader/full/fyp-importance-aspects-overall-satisfaction-buying-behavior-and-loyalty 12/98
9
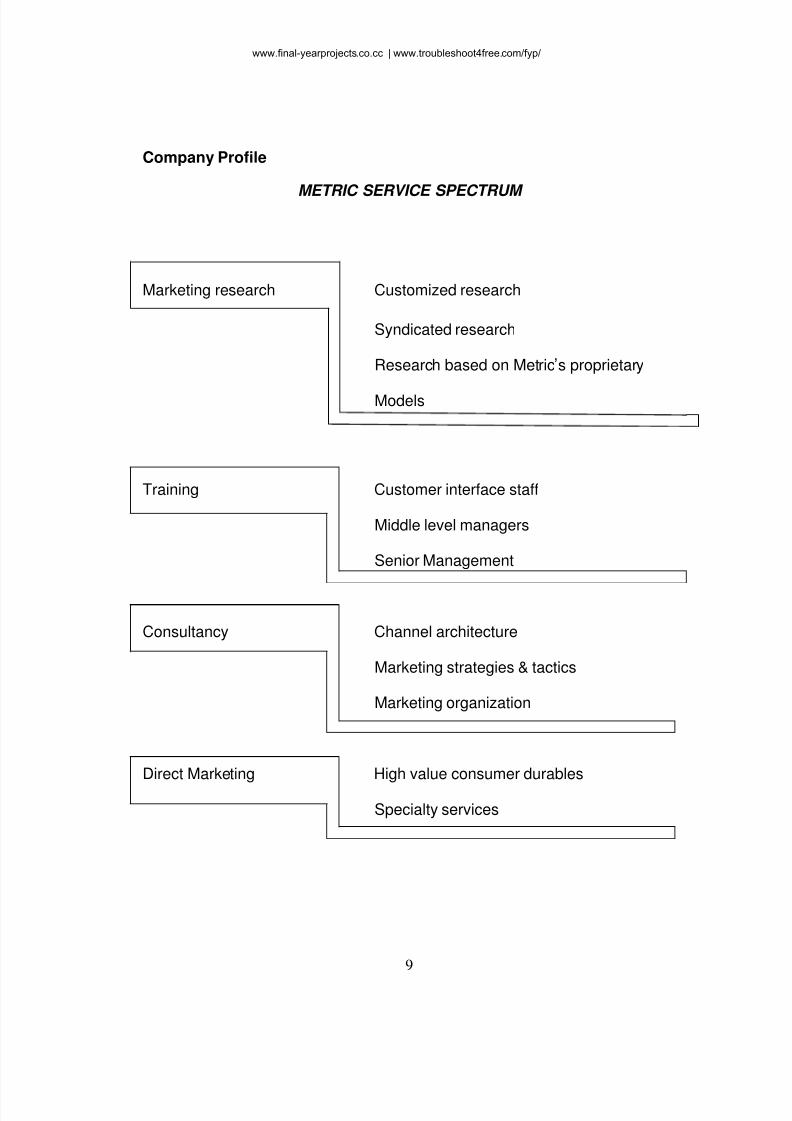
Company Profile
METRIC SERVICE SPECTRUM
Marketing research Customized research
Syndicated research
Research based on Metric s proprietary
Models
Training Customer interface staff
Middle level managers
Senior Management
Consultancy Channel architecture
Marketing strategies & tactics
Marketing organization
Direct Marketing High value consumer durables
Specialty services
www.final-yearprojects.co.cc | www.troubleshoot4free.com/fyp/
8/3/2019 Fyp-importance-Aspects-overall Satisfaction_ Buying Behavior and Loyalty
http://slidepdf.com/reader/full/fyp-importance-aspects-overall-satisfaction-buying-behavior-and-loyalty 13/98
10
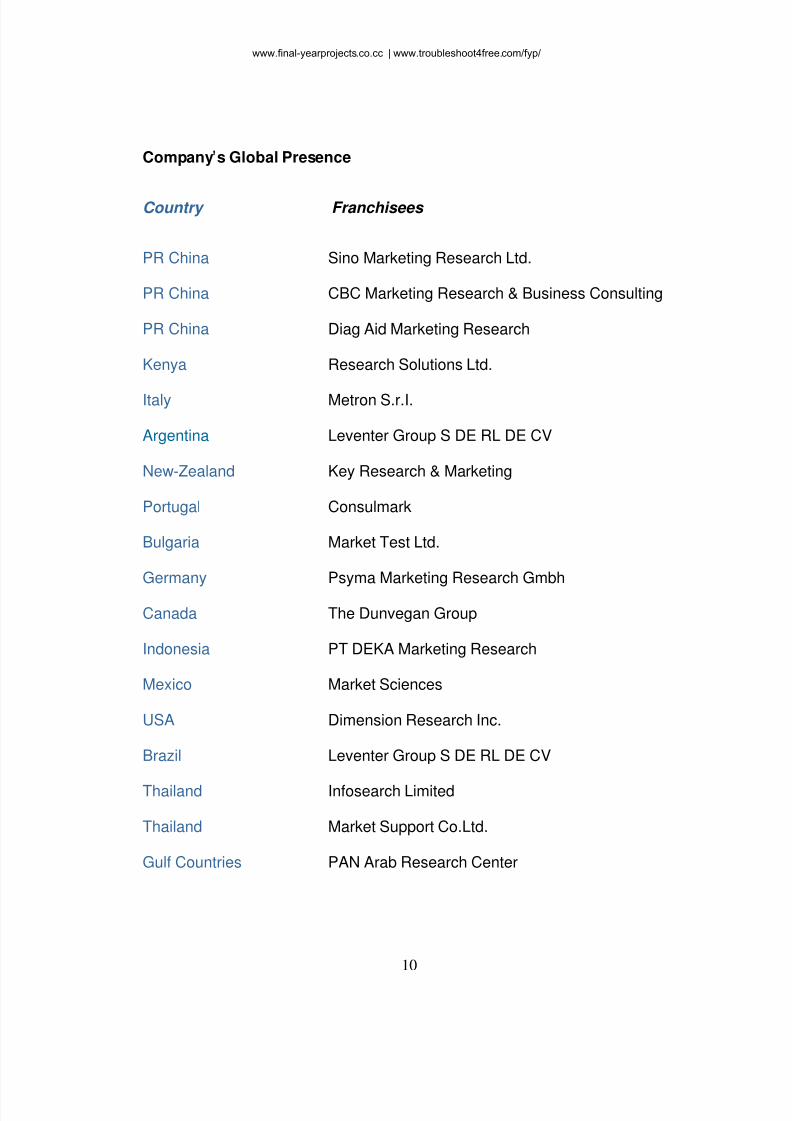
Company s Global Presence
Country Franchisees
PR China Sino Marketing Research Ltd.
PR China CBC Marketing Research & Business Consulting
PR China Diag Aid Marketing Research
Kenya Research Solutions Ltd.
Italy Metron S.r.I.
Argentina Leventer Group S DE RL DE CV
New-Zealand Key Research & Marketing
Portugal Consulmark
Bulgaria Market Test Ltd.
Germany Psyma Marketing Research Gmbh
Canada The Dunvegan Group
Indonesia PT DEKA Marketing Research
Mexico Market Sciences
USA Dimension Research Inc.
Brazil Leventer Group S DE RL DE CV
Thailand Infosearch Limited
Thailand Market Support Co.Ltd.
Gulf Countries PAN Arab Research Center
www.final-yearprojects.co.cc | www.troubleshoot4free.com/fyp/
8/3/2019 Fyp-importance-Aspects-overall Satisfaction_ Buying Behavior and Loyalty
http://slidepdf.com/reader/full/fyp-importance-aspects-overall-satisfaction-buying-behavior-and-loyalty 14/98
11
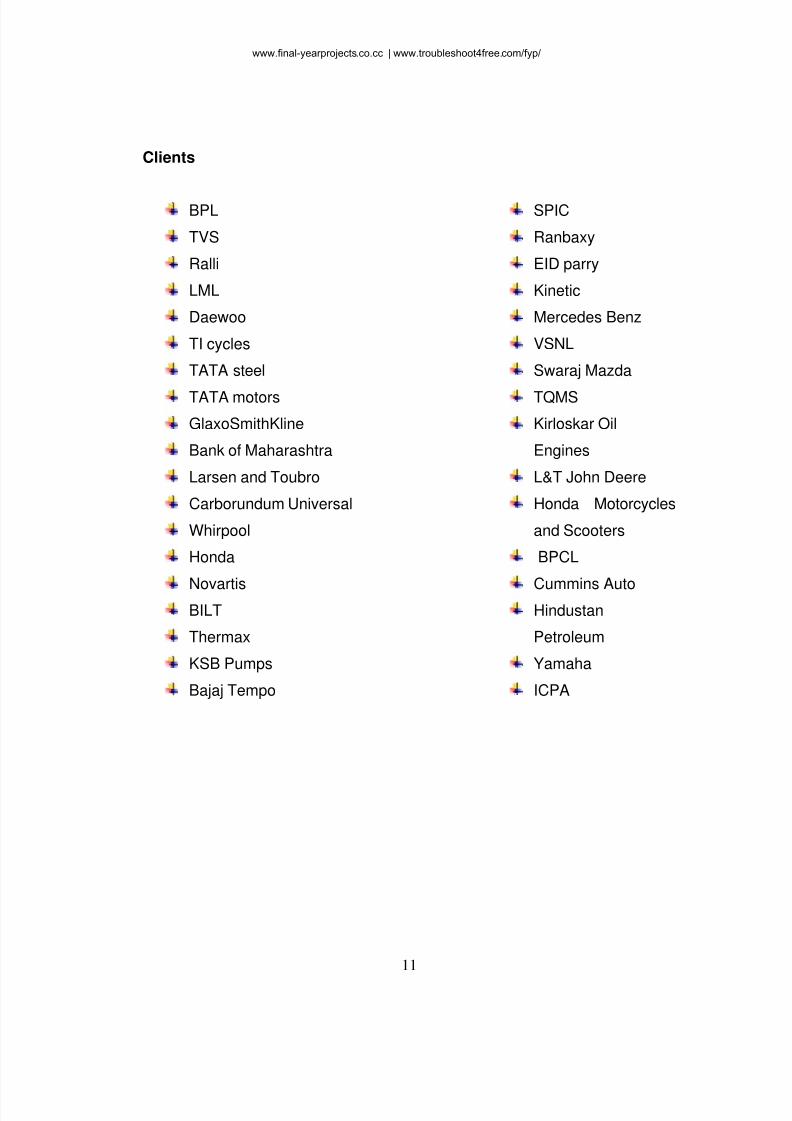
Clients
BPL
TVS
Ralli
LML
Daewoo
TI cycles
TATA steel
TATA motors
GlaxoSmithKline
Bank of Maharashtra
Larsen and Toubro
Carborundum Universal
Whirpool
Honda
Novartis BILT
Thermax
KSB Pumps
Bajaj Tempo
SPIC
Ranbaxy
EID parry
Kinetic
Mercedes Benz
VSNL
Swaraj Mazda
TQMS
Kirloskar Oil
Engines
L&T John Deere
Honda Motorcycles
and Scooters
BPCL
Cummins Auto Hindustan
Petroleum
Yamaha
ICPA
www.final-yearprojects.co.cc | www.troubleshoot4free.com/fyp/
8/3/2019 Fyp-importance-Aspects-overall Satisfaction_ Buying Behavior and Loyalty
http://slidepdf.com/reader/full/fyp-importance-aspects-overall-satisfaction-buying-behavior-and-loyalty 15/98
12
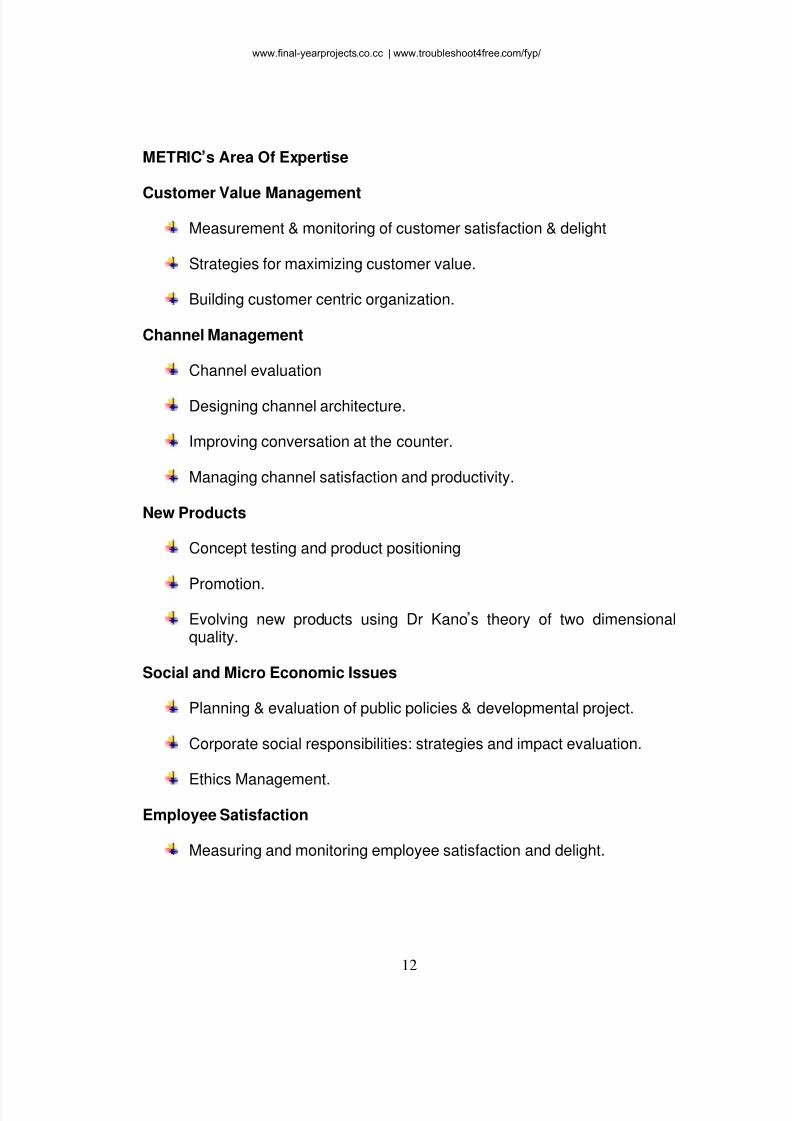
METRIC s Area Of Expertise
Customer Value Management
Measurement & monitoring of customer satisfaction & delight
Strategies for maximizing customer value.
Building customer centric organization.
Channel Management
Channel evaluation
Designing channel architecture.
Improving conversation at the counter.
Managing channel satisfaction and productivity.
New Products
Concept testing and product positioning
Promotion.
Evolving new products using Dr Kano s theory of two dimensionalquality.
Social and Micro Economic Issues
Planning & evaluation of public policies & developmental project.
Corporate social responsibilities: strategies and impact evaluation.
Ethics Management.
Employee Satisfaction
Measuring and monitoring employee satisfaction and delight.
www.final-yearprojects.co.cc | www.troubleshoot4free.com/fyp/
8/3/2019 Fyp-importance-Aspects-overall Satisfaction_ Buying Behavior and Loyalty
http://slidepdf.com/reader/full/fyp-importance-aspects-overall-satisfaction-buying-behavior-and-loyalty 16/98
13
Benchmarking with other industries.
Identifying action areas.
Sales Management
We make it happen.
Rural marketing
Quantify risk aversion behavior of rural investors and consumers.
Sales promotion strategies and tactics to overcome aversion.
Training to avoid urban bias.
Product concepts and market development methods.\
www.final-yearprojects.co.cc | www.troubleshoot4free.com/fyp/
8/3/2019 Fyp-importance-Aspects-overall Satisfaction_ Buying Behavior and Loyalty
http://slidepdf.com/reader/full/fyp-importance-aspects-overall-satisfaction-buying-behavior-and-loyalty 17/98
14
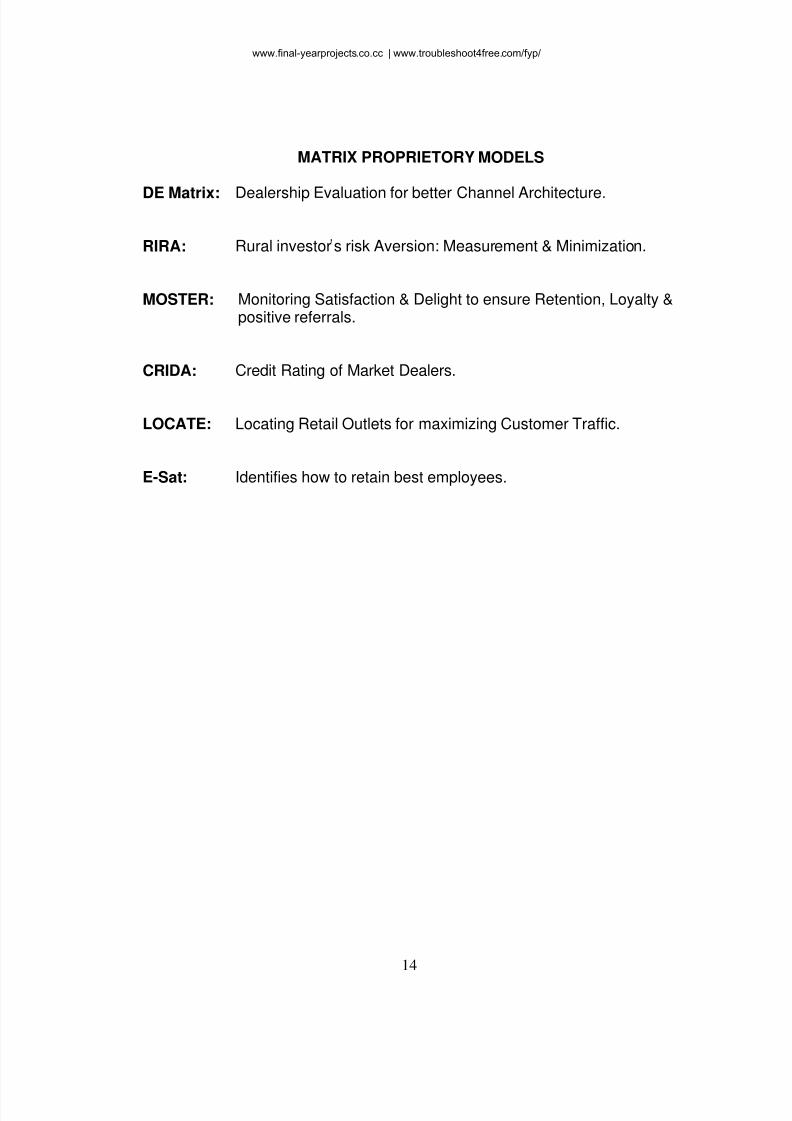
MATRIX PROPRIETORY MODELS
DE Matrix: Dealership Evaluation for better Channel Architecture.
RIRA: Rural investor s risk Aversion: Measurement & Minimization.
MOSTER: Monitoring Satisfaction & Delight to ensure Retention, Loyalty &positive referrals.
CRIDA: Credit Rating of Market Dealers.
LOCATE: Locating Retail Outlets for maximizing Customer Traffic.
E-Sat: Identifies how to retain best employees.
www.final-yearprojects.co.cc | www.troubleshoot4free.com/fyp/
8/3/2019 Fyp-importance-Aspects-overall Satisfaction_ Buying Behavior and Loyalty
http://slidepdf.com/reader/full/fyp-importance-aspects-overall-satisfaction-buying-behavior-and-loyalty 18/98
15
BRIEF OVERVIEW OF MOSTER
www.final-yearprojects.co.cc | www.troubleshoot4free.com/fyp/
8/3/2019 Fyp-importance-Aspects-overall Satisfaction_ Buying Behavior and Loyalty
http://slidepdf.com/reader/full/fyp-importance-aspects-overall-satisfaction-buying-behavior-and-loyalty 19/98
16
Brief Overview of MOSTER
MOnitoring Satisfaction To Ensure Retention
Delight your customers
MOSTER is a robust research methodology to diagnose and quantify the pathto customer delight.
Based on the models of Herzberg and Noriaki Kano, MOSTER is being usedin 22 countries around the world.
MOSTER classifies attributes of your product or service into those that createdelight and those that if not provided will create dissatisfaction and calculates
The ability of an attribute to create satisfaction or delight How well the attribute is rated on a product or brand Sensitivity of each attribute to effect change in customer perception
MOSTER - gives actionable results, which guarantees delight.
Customer Satisfaction Measurement
The process of formal satisfaction measurement Identify the aspects responsible for Customer satisfaction.
Split each aspect into relevant and measurable sub aspects orattributes.
Sample selection and identification of respondents.
Respondents evaluate the company performance for attribute on ascale.
Process and analyze the data and present the finding.
Limitations of the Traditional approach
www.final-yearprojects.co.cc | www.troubleshoot4free.com/fyp/
8/3/2019 Fyp-importance-Aspects-overall Satisfaction_ Buying Behavior and Loyalty
http://slidepdf.com/reader/full/fyp-importance-aspects-overall-satisfaction-buying-behavior-and-loyalty 20/98
17
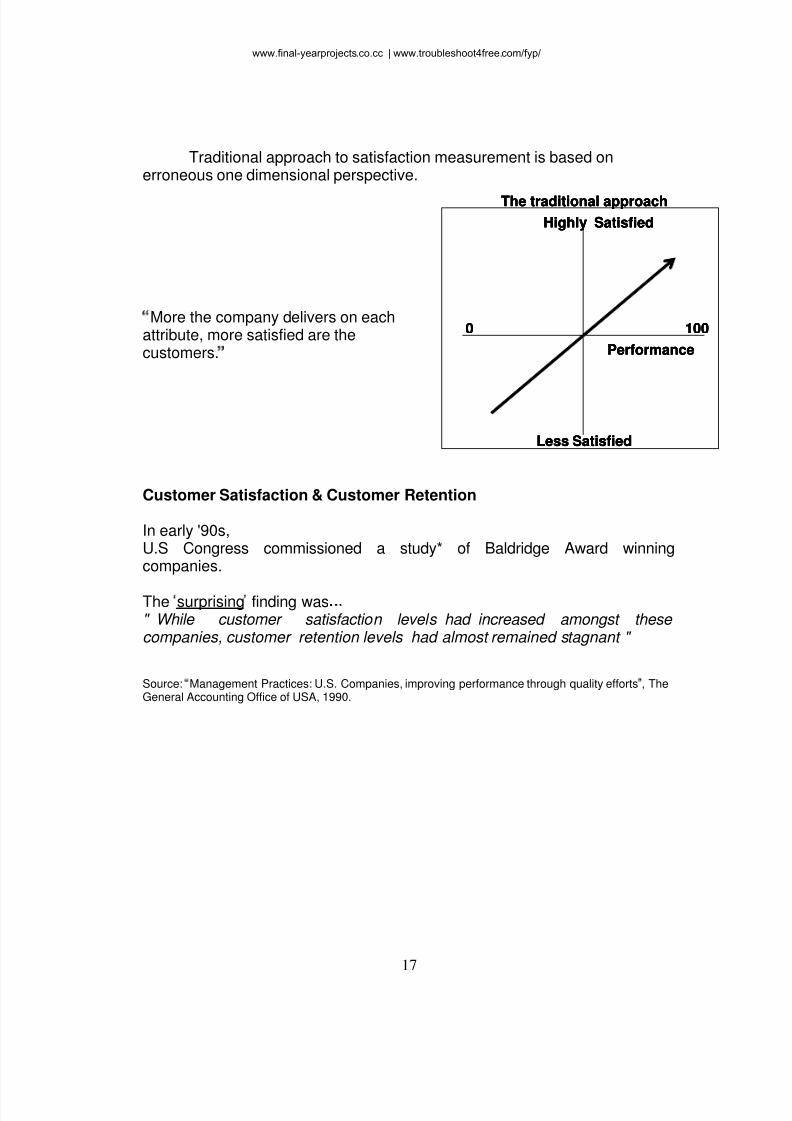
Traditional approach to satisfaction measurement is based onerroneous one dimensional perspective.
More the company delivers on eachattribute, more satisfied are thecustomers.
Customer Satisfaction & Customer Retention
In early '90s,U.S Congress commissioned a study* of Baldridge Award winningcompanies.
The surprising finding was" While customer satisfaction levels had increased amongst these companies, customer retention levels had almost remained stagnant "
Source: Management Practices: U.S. Companies, improving performance through quality efforts , TheGeneral Accounting Office of USA, 1990.
The traditional approach
Highly Satisfied
0 100
Performance
Less Satisfied
The traditional approach
Highly Satisfied
0 100
Performance
Less Satisfied
The traditional approach
Highly Satisfied
0 100
Performance
Less Satisfied
www.final-yearprojects.co.cc | www.troubleshoot4free.com/fyp/
8/3/2019 Fyp-importance-Aspects-overall Satisfaction_ Buying Behavior and Loyalty
http://slidepdf.com/reader/full/fyp-importance-aspects-overall-satisfaction-buying-behavior-and-loyalty 21/98
18
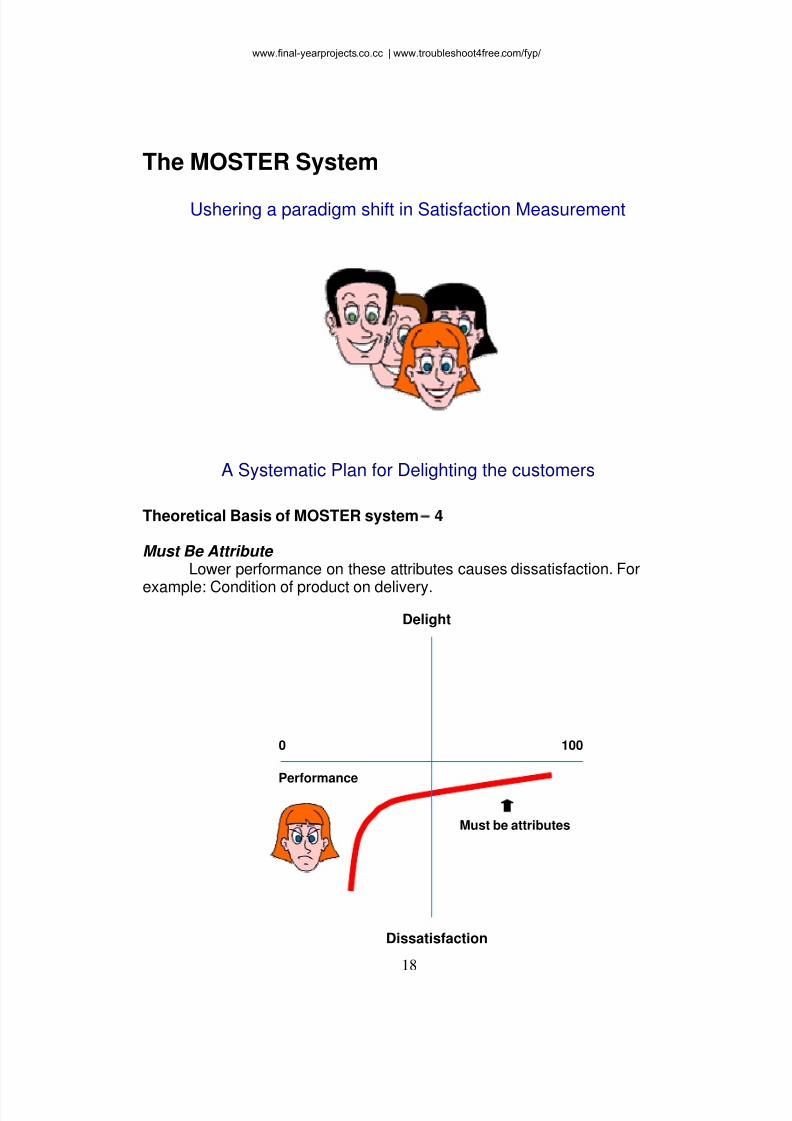
The MOSTER System
Ushering a paradigm shift in Satisfaction Measurement
A Systematic Plan for Delighting the customers
Theoretical Basis of MOSTER system 4
Must Be Attribute Lower performance on these attributes causes dissatisfaction. For
example: Condition of product on delivery.
Delight
0 100
Performance
Must be attributes
Dissatisfaction
www.final-yearprojects.co.cc | www.troubleshoot4free.com/fyp/
8/3/2019 Fyp-importance-Aspects-overall Satisfaction_ Buying Behavior and Loyalty
http://slidepdf.com/reader/full/fyp-importance-aspects-overall-satisfaction-buying-behavior-and-loyalty 22/98
19
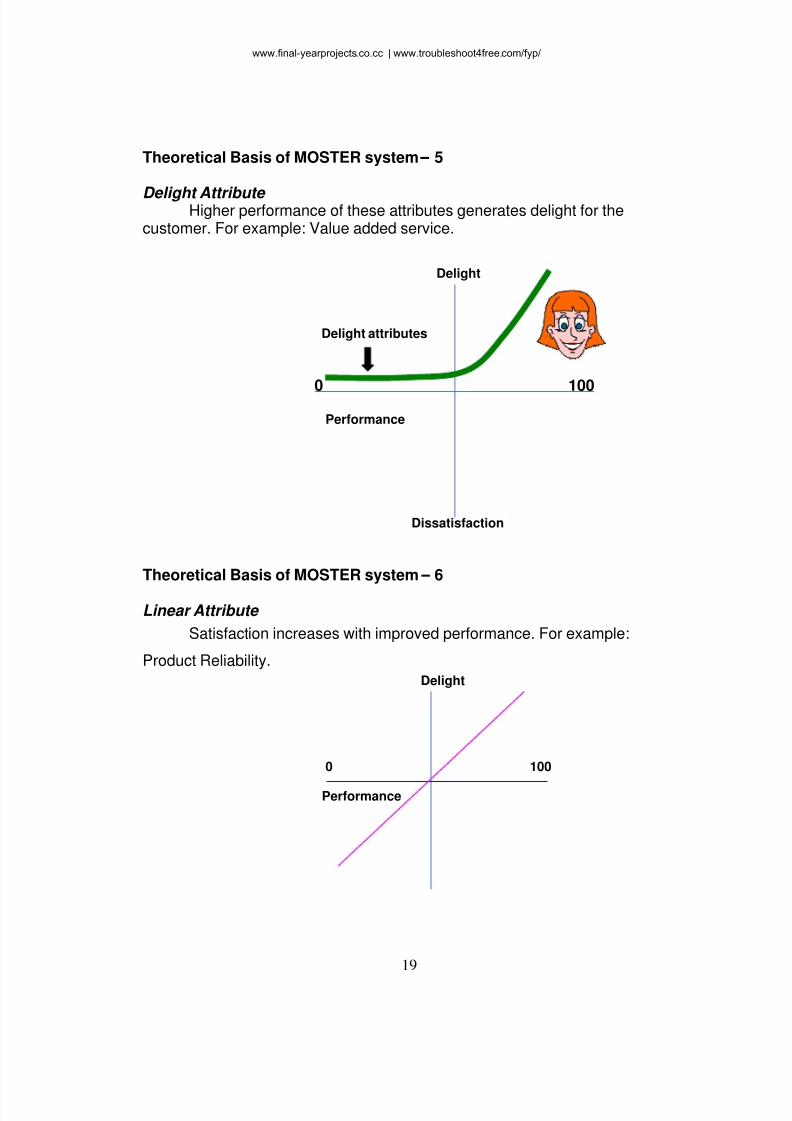
Theoretical Basis of MOSTER system 5
Delight Attribute Higher performance of these attributes generates delight for the
customer. For example: Value added service.
Delight attributes
0 100
Performance
Dissatisfaction
Theoretical Basis of MOSTER system 6
Linear Attribute
Satisfaction increases with improved performance. For example:
Product Reliability. Delight
0 100
Performance
Delight
www.final-yearprojects.co.cc | www.troubleshoot4free.com/fyp/
8/3/2019 Fyp-importance-Aspects-overall Satisfaction_ Buying Behavior and Loyalty
http://slidepdf.com/reader/full/fyp-importance-aspects-overall-satisfaction-buying-behavior-and-loyalty 23/98
20
Clarifying the core concepts - 1
The class of attributes changes from one person to another. Considerdifferent users of internet and their transmission speed:
Another user who has an ordinary file, may be a research paper tosend, speed may be an delight attribute. When you want to send a one liner greeting, speed is really not anissue. You are indifferent to it.
The class of attribute depends on ones need and his/her expectations.
Clarifying the core concepts - 2
The class of attributes changes from one market segment to another.It is important to note that the dissatisfaction and delight causing attributesare different for different market segments.
A high resolution monitor is a must be attribute for graphic designers.Low resolution will cause dissatisfaction. But for others it may be adelight attribute.
It is important to note that the dissatisfaction and delight causing attribute aredifferent for different market segments.
Condition of a product on delivery is a must be attribute for customers
buying a new car. But for a customer who is buying a second hand carit can be a delight attribute.
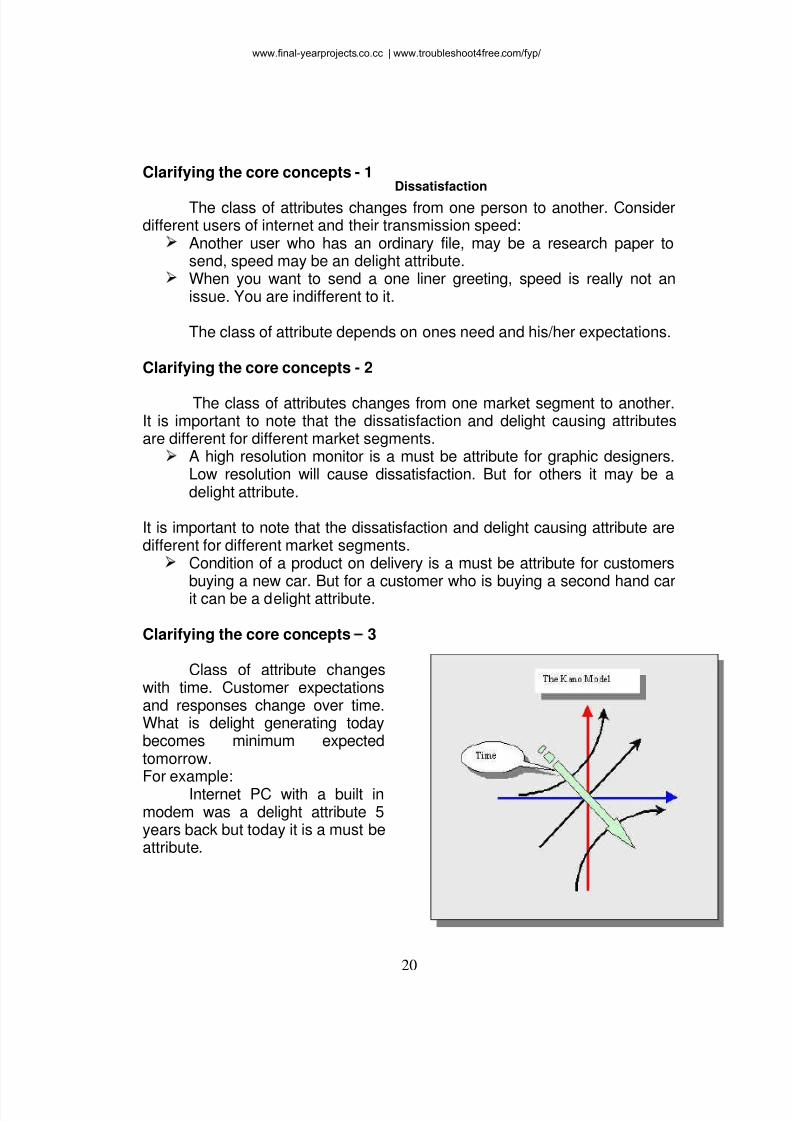
Clarifying the core concepts 3
Class of attribute changeswith time. Customer expectationsand responses change over time.What is delight generating todaybecomes minimum expectedtomorrow. For example:
Internet PC with a built inmodem was a delight attribute 5years back but today it is a must beattribute.
Dissatisfaction
www.final-yearprojects.co.cc | www.troubleshoot4free.com/fyp/
8/3/2019 Fyp-importance-Aspects-overall Satisfaction_ Buying Behavior and Loyalty
http://slidepdf.com/reader/full/fyp-importance-aspects-overall-satisfaction-buying-behavior-and-loyalty 24/98
21
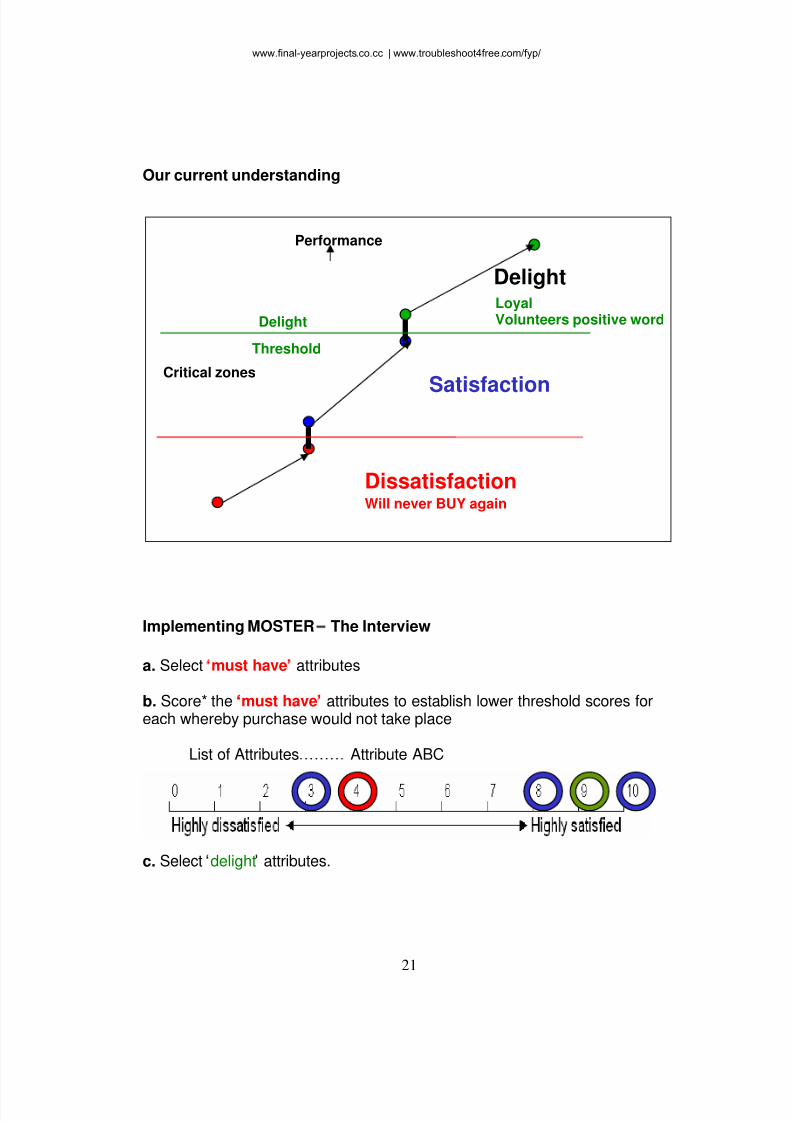
Our current understanding
Implementing MOSTER The Interview
a. Select must have attributes
b. Score* the must have attributes to establish lower threshold scores foreach whereby purchase would not take place
List of Attributes Attribute ABC
c. Select delight attributes.
Delight
Threshold
Performance
Delight
Will never BUY again
Satisfaction
LoyalVolunteers positive word
Critical zones
Dissatisfaction
www.final-yearprojects.co.cc | www.troubleshoot4free.com/fyp/
8/3/2019 Fyp-importance-Aspects-overall Satisfaction_ Buying Behavior and Loyalty
http://slidepdf.com/reader/full/fyp-importance-aspects-overall-satisfaction-buying-behavior-and-loyalty 25/98
22
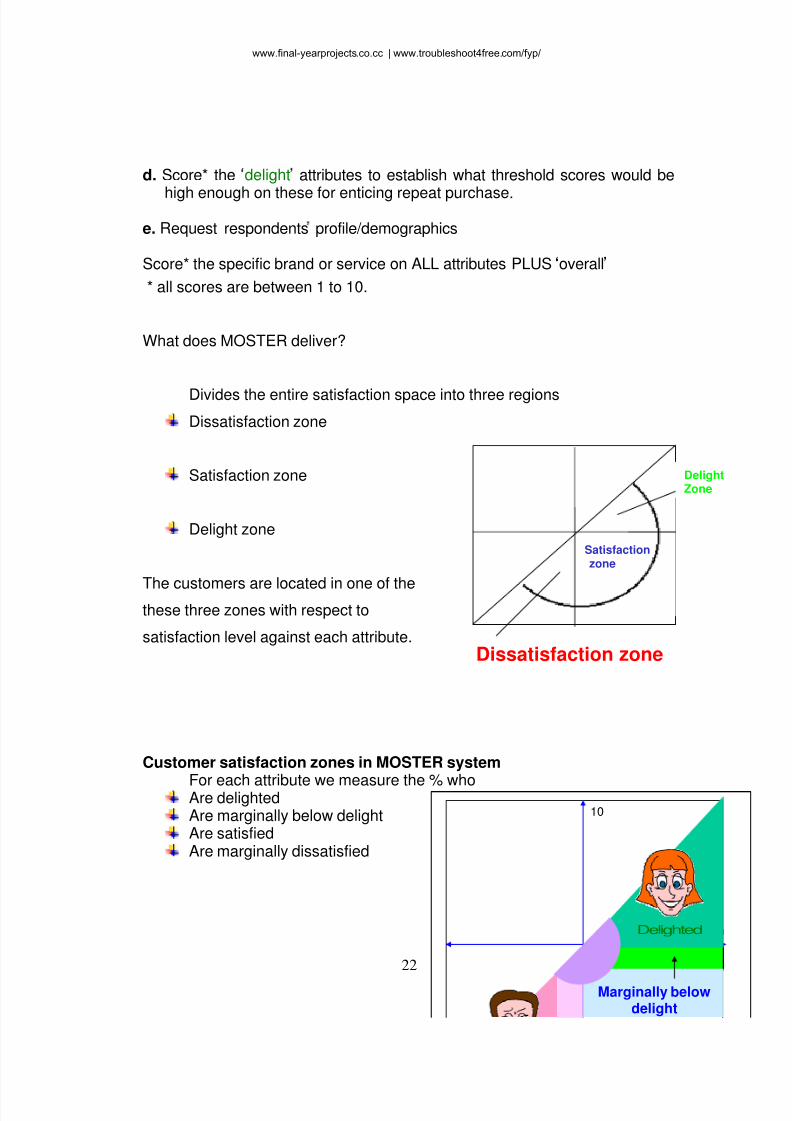
d. Score* the delight attributes to establish what threshold scores would be
high enough on these for enticing repeat purchase.
e. Request respondents profile/demographics
Score* the specific brand or service on ALL attributes PLUS overall
* all scores are between 1 to 10.
What does MOSTER deliver?
Divides the entire satisfaction space into three regions
Dissatisfaction zone
Satisfaction zone
Delight zone
The customers are located in one of thethese three zones with respect to
satisfaction level against each attribute.
Customer satisfaction zones in MOSTER system
For each attribute we measure the % whoAre delighted Are marginally below delightAre satisfied Are marginally dissatisfied
DelightZone
Dissatisfaction zone
Satisfactionzone
Distance fromDissatisfaction
Threshold
Delighted
10
Marginally belowdelight
www.final-yearprojects.co.cc | www.troubleshoot4free.com/fyp/
8/3/2019 Fyp-importance-Aspects-overall Satisfaction_ Buying Behavior and Loyalty
http://slidepdf.com/reader/full/fyp-importance-aspects-overall-satisfaction-buying-behavior-and-loyalty 26/98
23
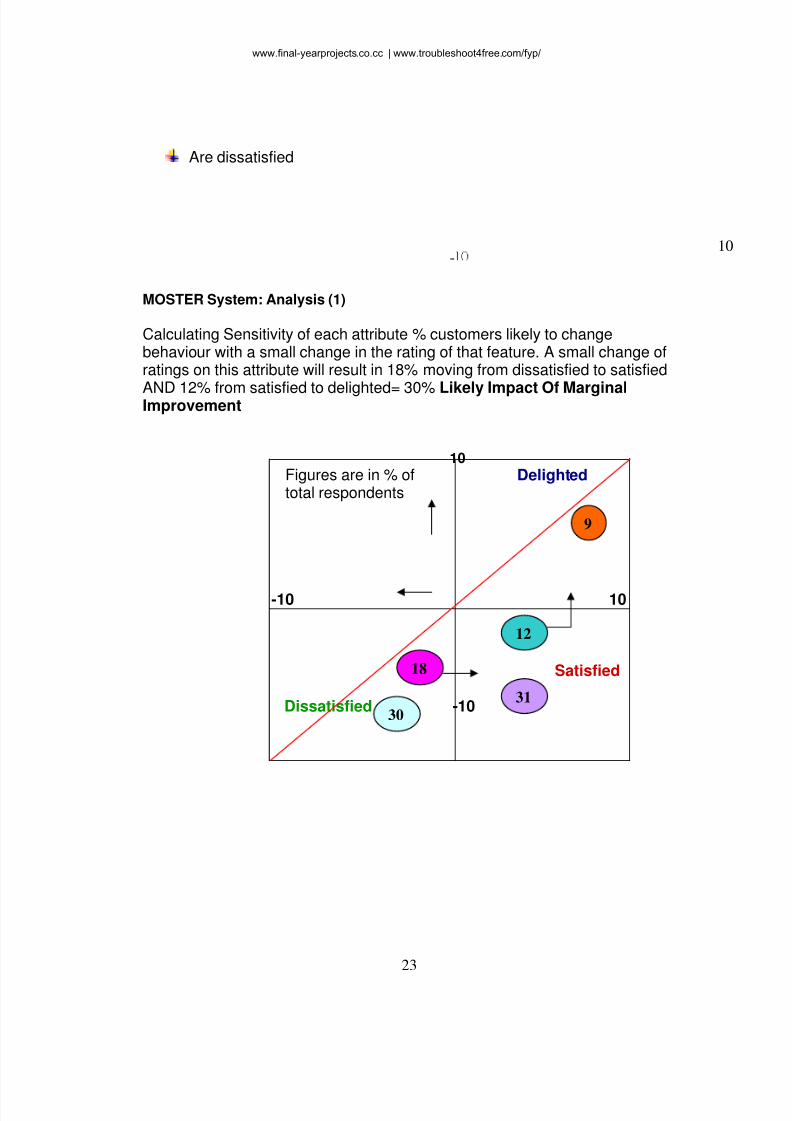
Are dissatisfied
MOSTER System: Analysis (1)
Calculating Sensitivity of each attribute % customers likely to changebehaviour with a small change in the rating of that feature. A small change ofratings on this attribute will result in 18% moving from dissatisfied to satisfied
AND 12% from satisfied to delighted= 30% Likely Impact Of Marginal Improvement
10 Figures are in % of Delighted total respondents
-10 10
Satisfied
Dissatisfied -10
10-
9
12
18
3130
www.final-yearprojects.co.cc | www.troubleshoot4free.com/fyp/
8/3/2019 Fyp-importance-Aspects-overall Satisfaction_ Buying Behavior and Loyalty
http://slidepdf.com/reader/full/fyp-importance-aspects-overall-satisfaction-buying-behavior-and-loyalty 27/98
24
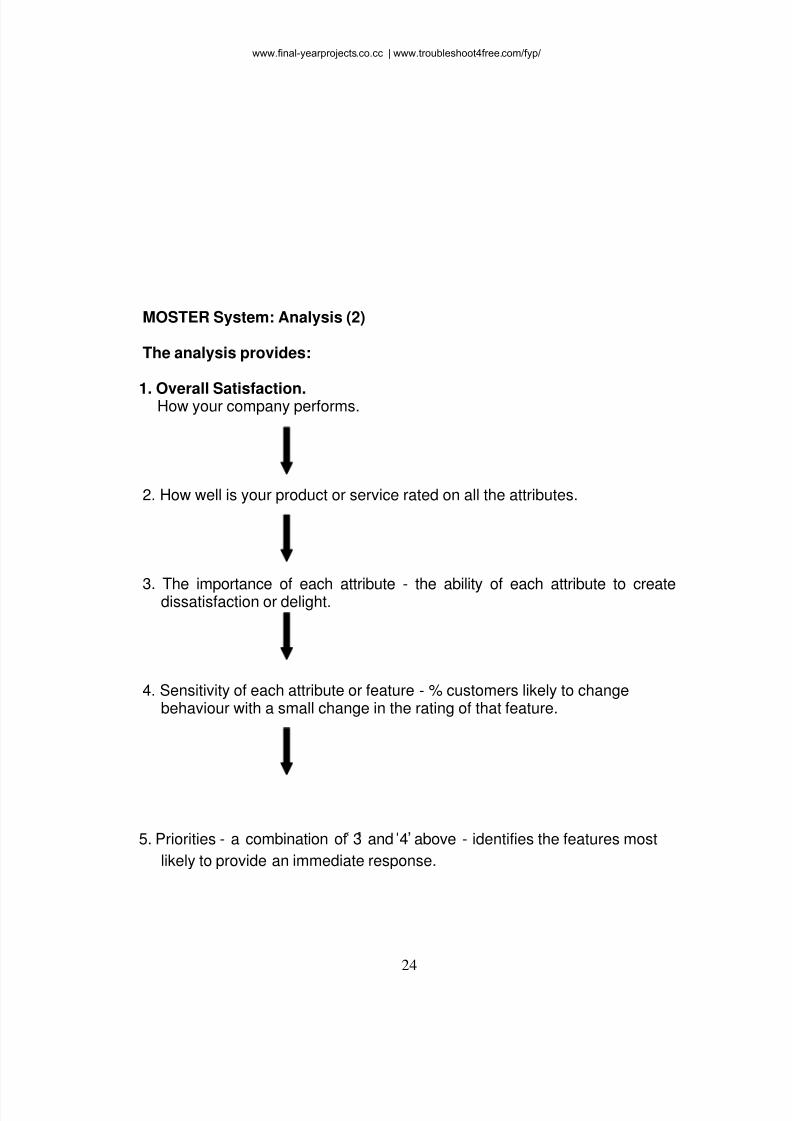
MOSTER System: Analysis (2)
The analysis provides:
1. Overall Satisfaction. How your company performs.
2. How well is your product or service rated on all the attributes.
3. The importance of each attribute - the ability of each attribute to createdissatisfaction or delight.
4. Sensitivity of each attribute or feature - % customers likely to change behaviour with a small change in the rating of that feature.
5. Priorities - a combination of 3 and 4 above - identifies the features most
likely to provide an immediate response.
www.final-yearprojects.co.cc | www.troubleshoot4free.com/fyp/
8/3/2019 Fyp-importance-Aspects-overall Satisfaction_ Buying Behavior and Loyalty
http://slidepdf.com/reader/full/fyp-importance-aspects-overall-satisfaction-buying-behavior-and-loyalty 28/98
25
BAXTERS MODEL
www.final-yearprojects.co.cc | www.troubleshoot4free.com/fyp/
8/3/2019 Fyp-importance-Aspects-overall Satisfaction_ Buying Behavior and Loyalty
http://slidepdf.com/reader/full/fyp-importance-aspects-overall-satisfaction-buying-behavior-and-loyalty 29/98
26
What do our customers want?
Not all of our customers base their satisfaction levels on the samecriteria. If they did, we would determine how to satisfy all of them all the time,and then we could focus on something else. We would know what emphasiswe should place on our service excellence.
Our challenge, however, is determining not only what each of ourcustomers expects of our relationship, but keep up with the dynamics of thesechanging expectations. For most of the part if we are running a successfulbusiness, we can fairly accurately presume that we are doing a good job ofmatching products and services to the needs of our customers. Unfortunately,this does not necessarily mean that we are fully satisfying their requirements.
We also have to identify which customers are not fully satisfied, which arefairly satisfied, and which are very satisfied. The ones we must be veryconcerned about are those in the first two categories. They are the ones whowill get angry over something and leave us. They are the ones who will switchsuppliers on a whim. And they are the ones who have been looking for ourreplacement but haven t told us. The customers who are very satisfied mustbe kept the way through ongoing efforts. We need these satisfied customersto help our companies thrive and grow.
Satisfaction and Perceptions
Mounting evidence tells that satisfying customers all the time andbeing perceived as a quality leader in a market carry significant advantages. Unfortunately, it has been very difficult to determine what features,
services, innovations (or combination of these and other product and serviceattributes) will lead to being perceived as the quality leader. It is even difficultto answer the following question: Which of the myriad things we could do toimprove our product, or the sales, service, and support activities that go withit, will lead to increase in perceived quality?
The answer to this question contains important strategic informationbecause it also reveals where a company s product and services are mostvulnerable to quality improvements by its competitors. And inversely, it
reveals where a company s competitors may be most vulnerable to qualityimprovements that it might undertake.
www.final-yearprojects.co.cc | www.troubleshoot4free.com/fyp/
8/3/2019 Fyp-importance-Aspects-overall Satisfaction_ Buying Behavior and Loyalty
http://slidepdf.com/reader/full/fyp-importance-aspects-overall-satisfaction-buying-behavior-and-loyalty 30/98
27
Dimensions of Quality
One reason it has so difficult to define quality from the customer sperspective is that there has not been a sufficient framework from which tolaunch a investigation. In practice, we could simply ask purchasers in a givenmarket what they consider to be the attributes of a quality product or service.
Experience has shown, however, that responses to such questionsvary too widely to lead to an effective quality management strategy.
David Garvin of Harvard Business School has been one of the first toaddress the challenge. The framework proposed by Dr. Garvin in his bookManaging Quality is called the dimensions of quality. The dimensions functionas a negotiating device, providing intermediate ground between the languageof customers (that is, nice looking, easy to use, or solid feel ) and the
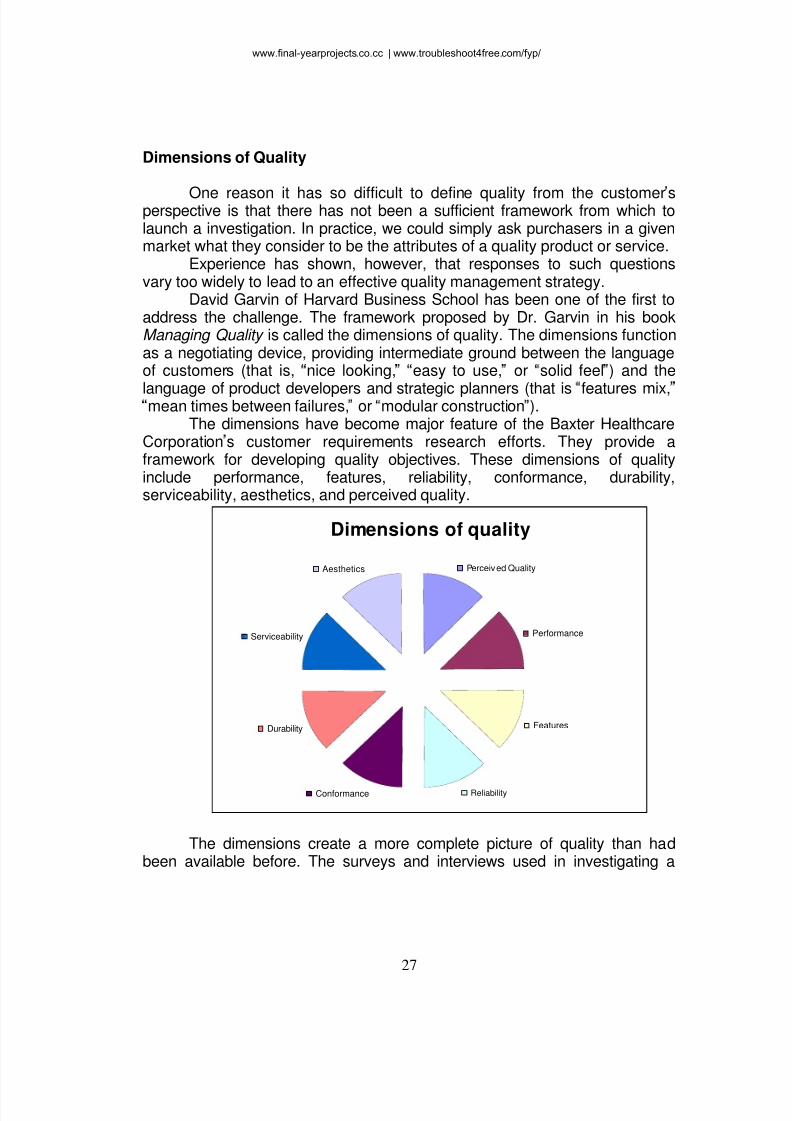
language of product developers and strategic planners (that is features mix,mean times between failures, or modular construction ).The dimensions have become major feature of the Baxter Healthcare
Corporation s customer requirements research efforts. They provide aframework for developing quality objectives. These dimensions of qualityinclude performance, features, reliability, conformance, durability,serviceability, aesthetics, and perceived quality.
The dimensions create a more complete picture of quality than hadbeen available before. The surveys and interviews used in investigating a
Dimensions of quality
Performance
Features
ReliabilityConformance
Durability
Serviceability
Aesthetics Perceived Quality
www.final-yearprojects.co.cc | www.troubleshoot4free.com/fyp/
8/3/2019 Fyp-importance-Aspects-overall Satisfaction_ Buying Behavior and Loyalty
http://slidepdf.com/reader/full/fyp-importance-aspects-overall-satisfaction-buying-behavior-and-loyalty 31/98
28
product s or service s market focus first on overall quality perceptions, thenproceed to the dimensions, and then lastly discuss specific product and
service attributes. The dimensions remove the confusion caused by the many definitionto the word quality and the hundreds of product and service attributes thatconstitute the perceived quality of a specific product or service in the market.The difficulty with seeking data only from one of the dimensions is thatresponses often cannot be compared, since language differs from companyto company. Furthermore, few responses are capable of responding to all ofthe hundred questions of specific product and service attributes.
Seeking data from the dimensions overcomes these difficulties. Thedimensions refer to more specific criteria than does the term quality , therebyforcing respondents to provide information that is more precise and
comparable. At the same time, the dimensions can be used to representgroups of product and service attributes without necessitating a familiaritywith each.
Quality evaluation based on dimensions is more useful with two groupsof people: customer suppliers and senior managers. Customer supplierquality perceptions based on the dimensions become more specific andcomparable and can be used to create a more complete picture of the idealrelationship. Senior managers gain a way of setting strategic, companywidequality objectives. For example, saying We must improve quality can beinterpreted in various ways across a company, while a mandate to improvereliability carries more specific implications.
Dr. Garvin notes that just as the customer s perceptions of qualityguide their purchasing behavior in the market, management s internal qualityperceptions influence strategic direction. This is why customer s requirementsresearch activities include interviews with managers and product developersand ask questions very similar to those asked of customers.
Customer requirement research
Baxter Healthcare Corporation QLP group created customerrequirement research (CRR) as a means of beginning a dialogue andidentifying issues with customers and suppliers. This research activity
delineates what customers in Baxter market mean when they say This iswhat I all a high quality service. The research method, which is applied on aproduct by product or service by service basis, determines whichrequirements and requirement
www.final-yearprojects.co.cc | www.troubleshoot4free.com/fyp/
8/3/2019 Fyp-importance-Aspects-overall Satisfaction_ Buying Behavior and Loyalty
http://slidepdf.com/reader/full/fyp-importance-aspects-overall-satisfaction-buying-behavior-and-loyalty 32/98
29
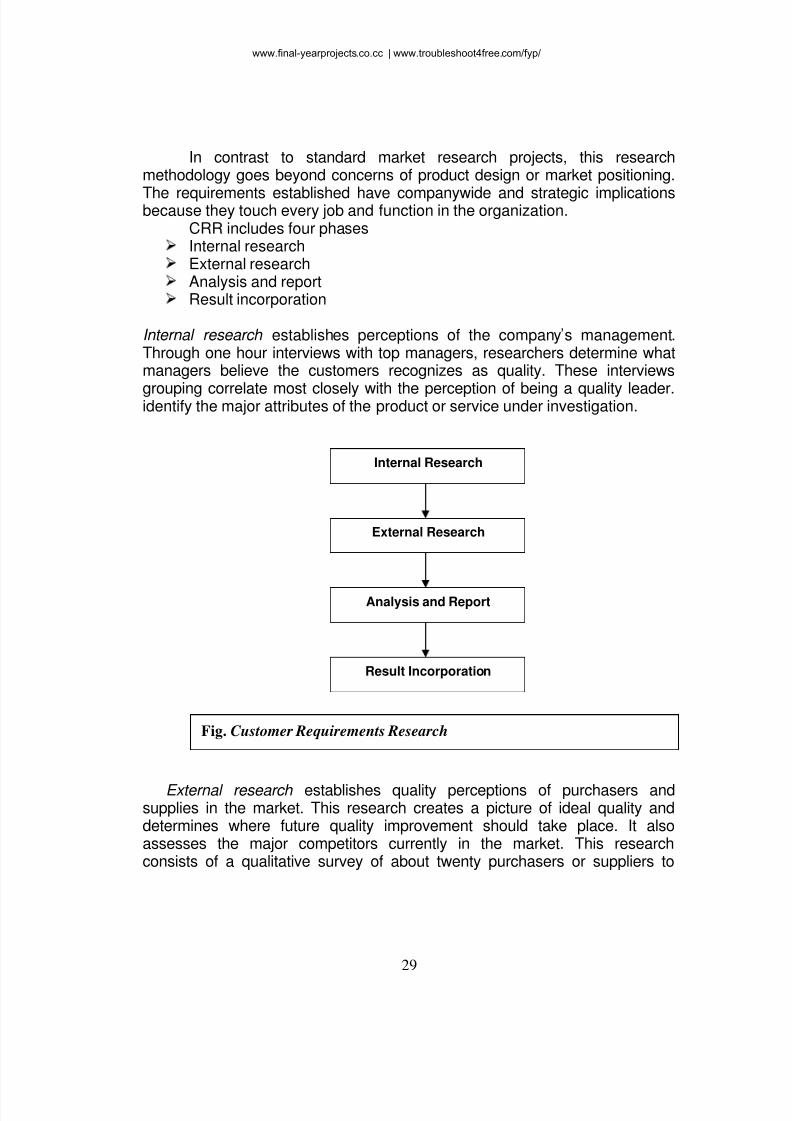
In contrast to standard market research projects, this researchmethodology goes beyond concerns of product design or market positioning.
The requirements established have companywide and strategic implicationsbecause they touch every job and function in the organization. CRR includes four phases Internal researchExternal researchAnalysis and report Result incorporation
Internal research establishes perceptions of the company s management.Through one hour interviews with top managers, researchers determine whatmanagers believe the customers recognizes as quality. These interviews
grouping correlate most closely with the perception of being a quality leader.identify the major attributes of the product or service under investigation.
External research establishes quality perceptions of purchasers andsupplies in the market. This research creates a picture of ideal quality anddetermines where future quality improvement should take place. It alsoassesses the major competitors currently in the market. This researchconsists of a qualitative survey of about twenty purchasers or suppliers to
Internal Research
External Research
Analysis and Report
Result Incorporation
Fig. Customer Requirements Research
www.final-yearprojects.co.cc | www.troubleshoot4free.com/fyp/
8/3/2019 Fyp-importance-Aspects-overall Satisfaction_ Buying Behavior and Loyalty
http://slidepdf.com/reader/full/fyp-importance-aspects-overall-satisfaction-buying-behavior-and-loyalty 33/98
30
establish the attributes that correlate with each quality dimension. It alsoincludes a mail survey involving statistically significant samples of purchasers.
The analysis and report phase examines the data collected in internal andexternal research and explores three potential quality gaps:
1. A gap between manager s perceptions of how customers and suppliersrecognize quality and how customers and suppliers actually perceive it.
2. A gap between quality as defined by the company s currentconfiguration of its product or service and that expressed as ideal bypurchasers and suppliers.
3. A gap between the company s current offering and the quality offeredby competitors.
Incorporating results has two implications for the company: planning andongoing implementation of the Quality Leadership Process. The CRRconsultant works with the company s planners and sets up additional strategicquality measurements, as required.
The CRR project also achieves the following objectives:
1. Helps direct activities to excel as a quality leader.
2. Creates a more strategic and competitive picture of quality, highlightingthree potential gaps.
3. Defines a more active and appropriate role for senior managers inQLP.
4. Builds a launch point for quality function deployment (QFD) activities.
The Bentley Pilot Experience
In late 1988, Bentley Laboratories became one of the first Baxter divisions to
undertake a CRR project. The primary objective of that project was tospecifically delineate what quality means to purchasers. Bentley sinvestigation focused on the membrane oxygenator, one of its primaryproduct lines. The membrane oxygenator is a disposable (that is, single use)medical device used to replenish oxygen to the blood during open heart
www.final-yearprojects.co.cc | www.troubleshoot4free.com/fyp/
8/3/2019 Fyp-importance-Aspects-overall Satisfaction_ Buying Behavior and Loyalty
http://slidepdf.com/reader/full/fyp-importance-aspects-overall-satisfaction-buying-behavior-and-loyalty 34/98
31
surgery. This is a expensive (approximately $350) plastic device about thesize of a large household blender. More than half a million of them were sold
wordwide in1988, and Bentley had the second largest market share. Theproject helped to define the customer s perception of quality in terms of themembrane oxygenator by identifying the elements that created thatperception.
The study investigated quality at three levels: Overall perceptions of qualityDimensions of quality Specific product and service attributes
David Garvin consulted extensively on the project design, and Walker:Customer Satisfaction Measurements of Indianapolis conducted the external
research. As a pilot, one objective was to establish a capable and repeatablemethodology. With this objective in mind, the investigation in mind, theinvestigation was limited to membrane oxgenators.
In addition, the external research was limited to U.S market, eventhough international sales comprised a significant portion of the total. Marketdata were sought from perfusionists, even though cardiovascular surgeonsand, to a small extent, purchasing agents also impact the purchase decision.
The findings contained in the report provide reliable and valuableinsights into this particular market because the survey was sent to nearlyevery practicing purfusionist in the U.S and the return rate was well in excess
of 30 percent. Over 50 percent of the respondents claimed to make the finaldecision regarding the purchase of membrane oxygenators, and nearly 90percent said they influenced that decision.
It is important to note, though that the influence on the purchasedecision does not perfect equate with influence on the perception of qualityleader. Qualitative decisions with Bentley marketing professionals andperfusionists themselves indicated that since perfusionists have hands oncontact with oxygenators, their influence on the perception of quality leader isfairly high.
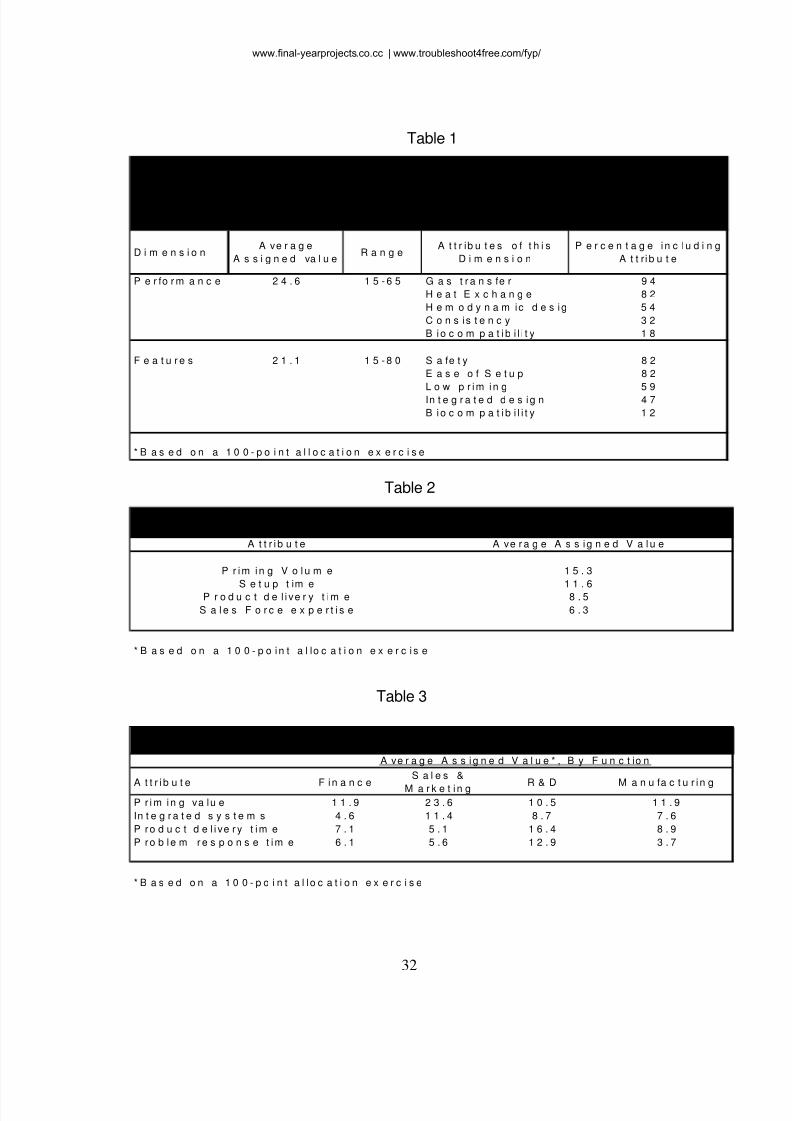
The final results of the Bentley study are confidential. However, thefollowing tables provide a look mat the type of finding that a CRR project such
as this can generate.
www.final-yearprojects.co.cc | www.troubleshoot4free.com/fyp/
8/3/2019 Fyp-importance-Aspects-overall Satisfaction_ Buying Behavior and Loyalty
http://slidepdf.com/reader/full/fyp-importance-aspects-overall-satisfaction-buying-behavior-and-loyalty 35/98
32
D i m e n s i o nA ve r a g e
A s s i g n e d va l u eR a n g e
A t t r ib u t e s o f t h i s
D i m e n s i o n
P e r c e n t a g e i n c l u d i n g
A t t ri b u t e
P e r fo r m a n c e 2 4 . 6 1 5 - 6 5 G a s t r a n s fe r 9 4
H e a t E x c h a n g e 8 2
H e m o d y n a m ic d e s i g 5 4
C o n s is t e n c y 3 2
B i o c o m p a t i b i l i t y 1 8
F e a t u r e s 2 1 . 1 1 5 - 8 0 S a fe t y 8 2
E a s e o f S e t u p 8 2
L o w p r i m i n g 5 9
In t e g r a t e d d e s i g n 4 7
B i o c o m p a t i b i l i t y 1 2
A ve r a g e V a l u e A s s i g n e d b y B e n t le y M a n a g e r s o f t h e E i g h t D i m e n s i o n s a n d t h e
P r o d u c t a n d S e r vi c e A t t r i b u t e A s s o c i a t e d w i t h e a c h D i m e n s i o n
* B a s e d o n a 1 0 0 - p o i n t a l l o c a t i o n e x e r c i s e
Table 1
* B a s e d o n a 1 0 0 - p o i n t a l lo c a t i o n e x e r c i s e
B e n t le y M a n a g e m e n t A s s e s s m e n t o f t h e R e l a t ive Im p o r t a n c e o f V a r io u s P r o d u c t s
a n d S e r v i c e A t t r ib u t e s t o T h e i r C u s t o m e r s
A t t r i b u t e A ve r a g e A s s i g n e d V a l u e
S a l e s F o r c e e x p e r t i s e 6 . 3
1 5 . 3
1 1 . 68 . 5
P r i m i n g V o l u m e
S e t u p t im eP r o d u c t d e l i ve r y t im e
A t t r i b u t e F i n a n c e
S a l e s &
M a r k e t i n g R & D M a n u fa c t u r i n gP r i m i n g va lu e 1 1 . 9 2 3 . 6 1 0 . 5 1 1 . 9
In t e g r a t e d s y s t e m s 4 . 6 1 1 . 4 8 . 7 7 . 6
P ro d u c t d e l i ve r y t i m e 7 . 1 5 . 1 1 6 . 4 8 . 9
P ro b l e m r e s p o n s e t i m e 6 . 1 5 . 6 1 2 . 9 3 . 7
* B a s e d o n a 1 0 0 - p o i n t a l l o c a t i o n e x e r c i s e
A ve r a g e A s s i g n e d V a l u e * , B y F u n c t io n
B e n t le y M a n a g e m e n t A s s e s s m e n t o f t h e R e l a t ive Im p o r ta n c e o f V a r io u s P r o d u c t s
a n d S e r vi c e A t t r i b u t e s t o T h e i r C u s t o m e r s
Table 2
Table 3
www.final-yearprojects.co.cc | www.troubleshoot4free.com/fyp/
8/3/2019 Fyp-importance-Aspects-overall Satisfaction_ Buying Behavior and Loyalty
http://slidepdf.com/reader/full/fyp-importance-aspects-overall-satisfaction-buying-behavior-and-loyalty 36/98
33
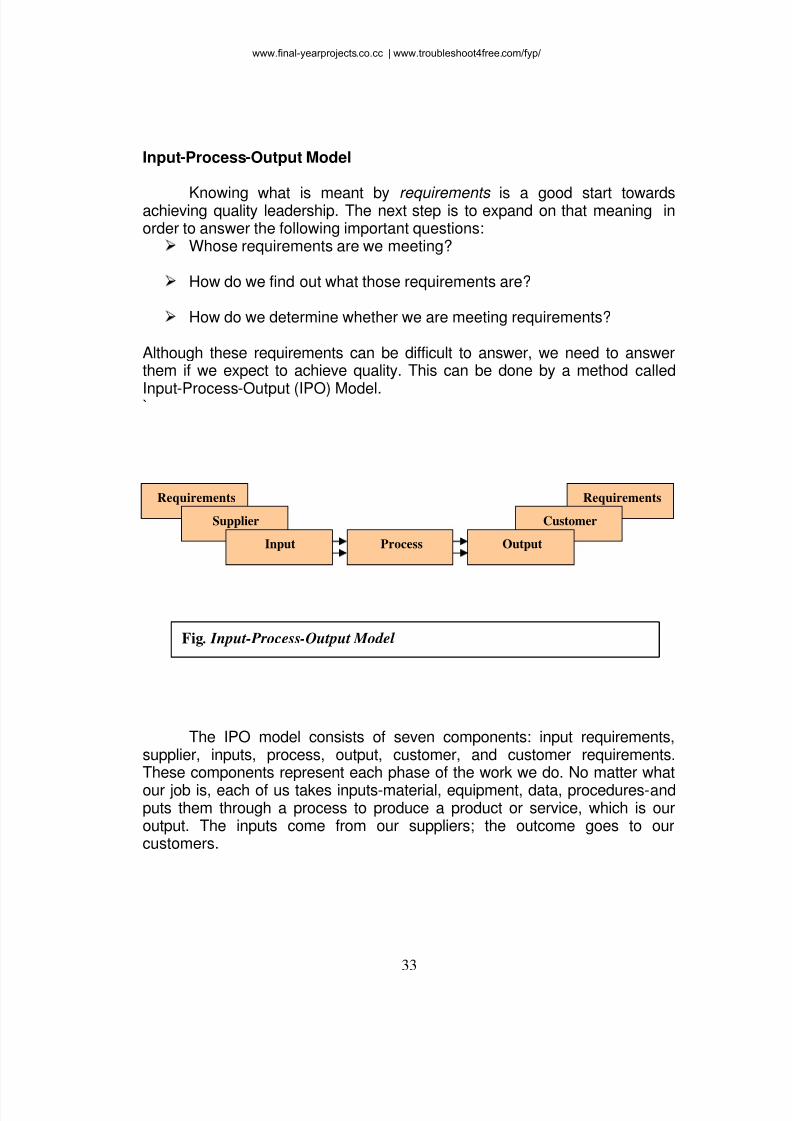
Input-Process-Output Model
Knowing what is meant by requirements is a good start towardsachieving quality leadership. The next step is to expand on that meaning inorder to answer the following important questions:
Whose requirements are we meeting?
How do we find out what those requirements are?
How do we determine whether we are meeting requirements?
Although these requirements can be difficult to answer, we need to answerthem if we expect to achieve quality. This can be done by a method called
Input-Process-Output (IPO) Model. `
The IPO model consists of seven components: input requirements,supplier, inputs, process, output, customer, and customer requirements.These components represent each phase of the work we do. No matter what
our job is, each of us takes inputs-material, equipment, data, procedures-andputs them through a process to produce a product or service, which is ouroutput. The inputs come from our suppliers; the outcome goes to ourcustomers.
Process
Requirements
Supplier
Input
Requirements
Customer
Output
Fig . Input- Process-Output Model
www.final-yearprojects.co.cc | www.troubleshoot4free.com/fyp/
8/3/2019 Fyp-importance-Aspects-overall Satisfaction_ Buying Behavior and Loyalty
http://slidepdf.com/reader/full/fyp-importance-aspects-overall-satisfaction-buying-behavior-and-loyalty 37/98
34
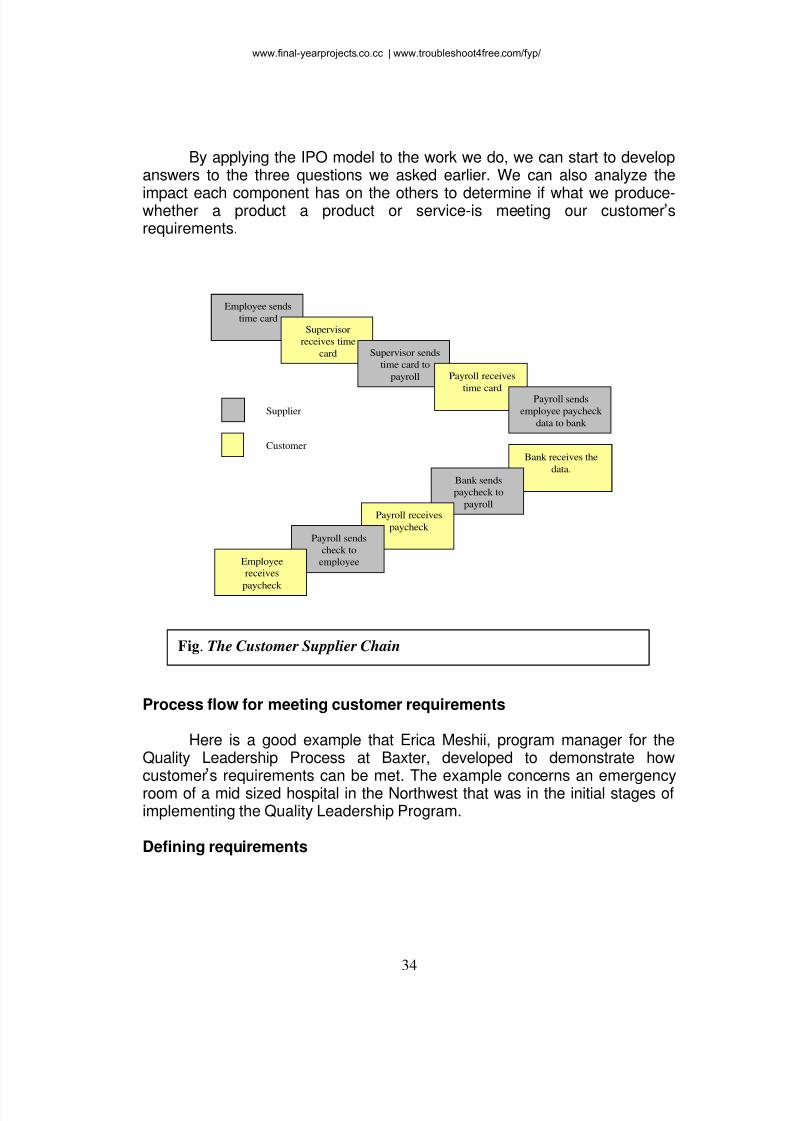
By applying the IPO model to the work we do, we can start to developanswers to the three questions we asked earlier. We can also analyze the
impact each component has on the others to determine if what we produce-whether a product a product or service-is meeting our customer srequirements.
Process flow for meeting customer requirements
Here is a good example that Erica Meshii, program manager for theQuality Leadership Process at Baxter, developed to demonstrate howcustomer s requirements can be met. The example concerns an emergencyroom of a mid sized hospital in the Northwest that was in the initial stages ofimplementing the Quality Leadership Program.
Defining requirements
Employee sends
time card Supervisor
receives time
card Supervisor sends
time card to
payroll Payroll receives
time card Payroll sends
employee paycheck
data to bank
Bank receives the
data. Bank sends
paycheck to
payroll Payroll receives
paycheck Payroll sends
check to
employee Employee
receives
paycheck
Fig. The Customer Supplier Chain
Supplier
Customer
www.final-yearprojects.co.cc | www.troubleshoot4free.com/fyp/
8/3/2019 Fyp-importance-Aspects-overall Satisfaction_ Buying Behavior and Loyalty
http://slidepdf.com/reader/full/fyp-importance-aspects-overall-satisfaction-buying-behavior-and-loyalty 38/98
35
Before beginning any improvement projects in the emergency room, ateam was formed to determine what services the emergency room provided,
who the customers were of these services, and who the suppliers were.Having identified the customers, they began conducting selected interviews ofboth the internal and external customers, using a set of requirementsdimensions. As a result of their interviews, they discovered that theiradmitting procedure was failing to meet many of their customer srequirements. They decided to start their improvement efforts by reviewing, indetail, what their admitting procedure was. They also decided that they wouldlook at their admitting procedure for critical and non critical patientsseparately.
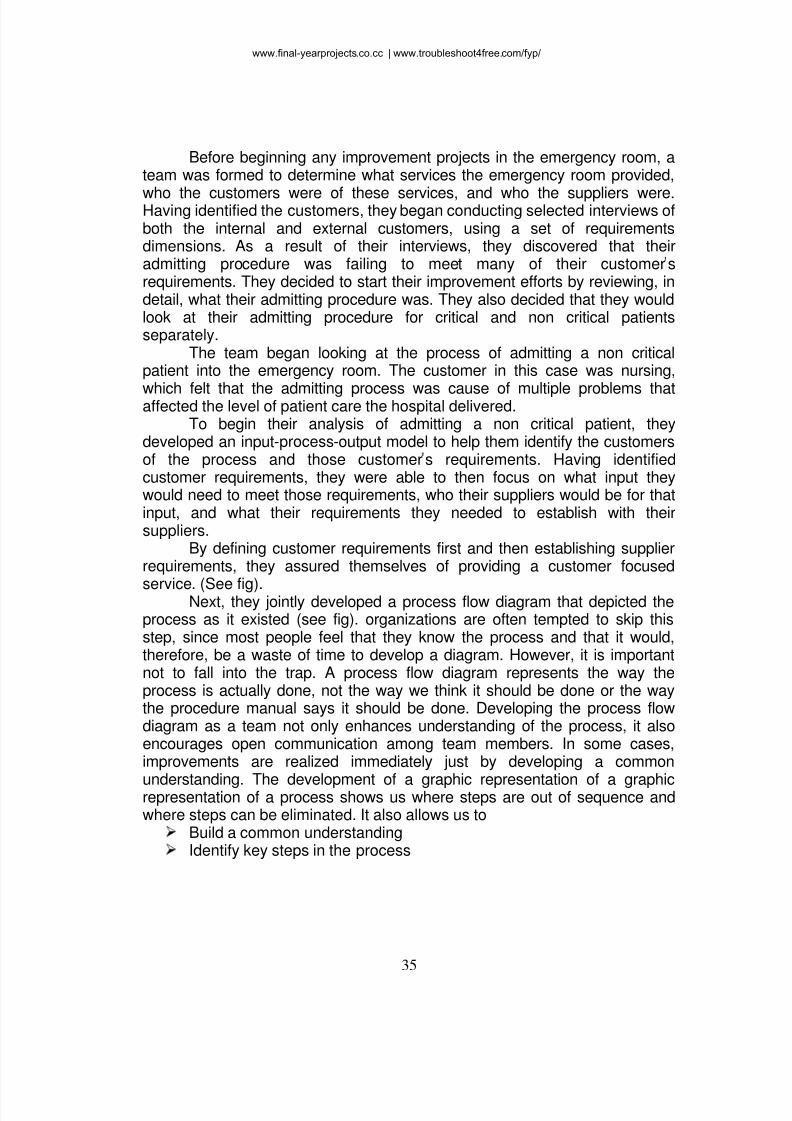
The team began looking at the process of admitting a non criticalpatient into the emergency room. The customer in this case was nursing,
which felt that the admitting process was cause of multiple problems thataffected the level of patient care the hospital delivered. To begin their analysis of admitting a non critical patient, they
developed an input-process-output model to help them identify the customersof the process and those customer s requirements. Having identifiedcustomer requirements, they were able to then focus on what input theywould need to meet those requirements, who their suppliers would be for thatinput, and what their requirements they needed to establish with theirsuppliers.
By defining customer requirements first and then establishing supplierrequirements, they assured themselves of providing a customer focused
service. (See fig). Next, they jointly developed a process flow diagram that depicted theprocess as it existed (see fig). organizations are often tempted to skip thisstep, since most people feel that they know the process and that it would,therefore, be a waste of time to develop a diagram. However, it is importantnot to fall into the trap. A process flow diagram represents the way theprocess is actually done, not the way we think it should be done or the waythe procedure manual says it should be done. Developing the process flowdiagram as a team not only enhances understanding of the process, it alsoencourages open communication among team members. In some cases,improvements are realized immediately just by developing a common
understanding. The development of a graphic representation of a graphicrepresentation of a process shows us where steps are out of sequence andwhere steps can be eliminated. It also allows us to
Build a common understanding Identify key steps in the process
www.final-yearprojects.co.cc | www.troubleshoot4free.com/fyp/
8/3/2019 Fyp-importance-Aspects-overall Satisfaction_ Buying Behavior and Loyalty
http://slidepdf.com/reader/full/fyp-importance-aspects-overall-satisfaction-buying-behavior-and-loyalty 39/98
36
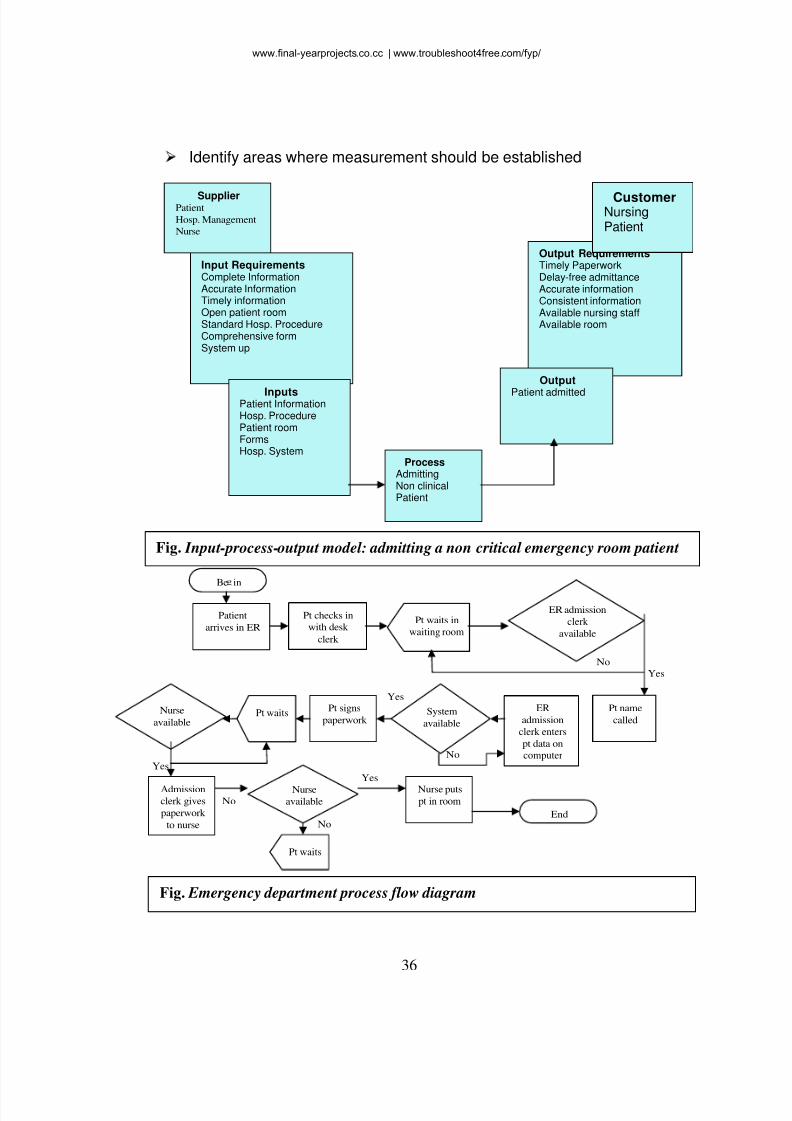
Identify areas where measurement should be established
Supplier Patient Hosp. Management Nurse
Input Requirements Complete Information Accurate Information Timely information Open patient room Standard Hosp. Procedure Comprehensive form System up
Output Requirements Timely Paperwork Delay-free admittance Accurate information Consistent information Available nursing staff Available room
Output
Patient admitted
Process Admitting Non clinicalPatient
Inputs Patient Information Hosp. Procedure Patient room Forms Hosp. System
No
No
No Yes
Yes
Yes
Yes No
Be in
Patient
arrives in ER
Pt checks in
with desk
clerk
Pt waits in
waiting room
ER admission
clerk available
Pt name
called
ERadmission
clerk enterspt data on
computer
System
available
Pt signs
paperwork Pt waits
Admission
clerk gives
paperwork
to nurse
Nurse
available
Nurse puts
pt in room
End
Customer Nursing Patient
Fig. Input-process- output model: admitting a non critical emergency room patient
Nurse
available
Pt waits
Fig. Emergency department process flow diagram
www.final-yearprojects.co.cc | www.troubleshoot4free.com/fyp/
8/3/2019 Fyp-importance-Aspects-overall Satisfaction_ Buying Behavior and Loyalty
http://slidepdf.com/reader/full/fyp-importance-aspects-overall-satisfaction-buying-behavior-and-loyalty 40/98
37
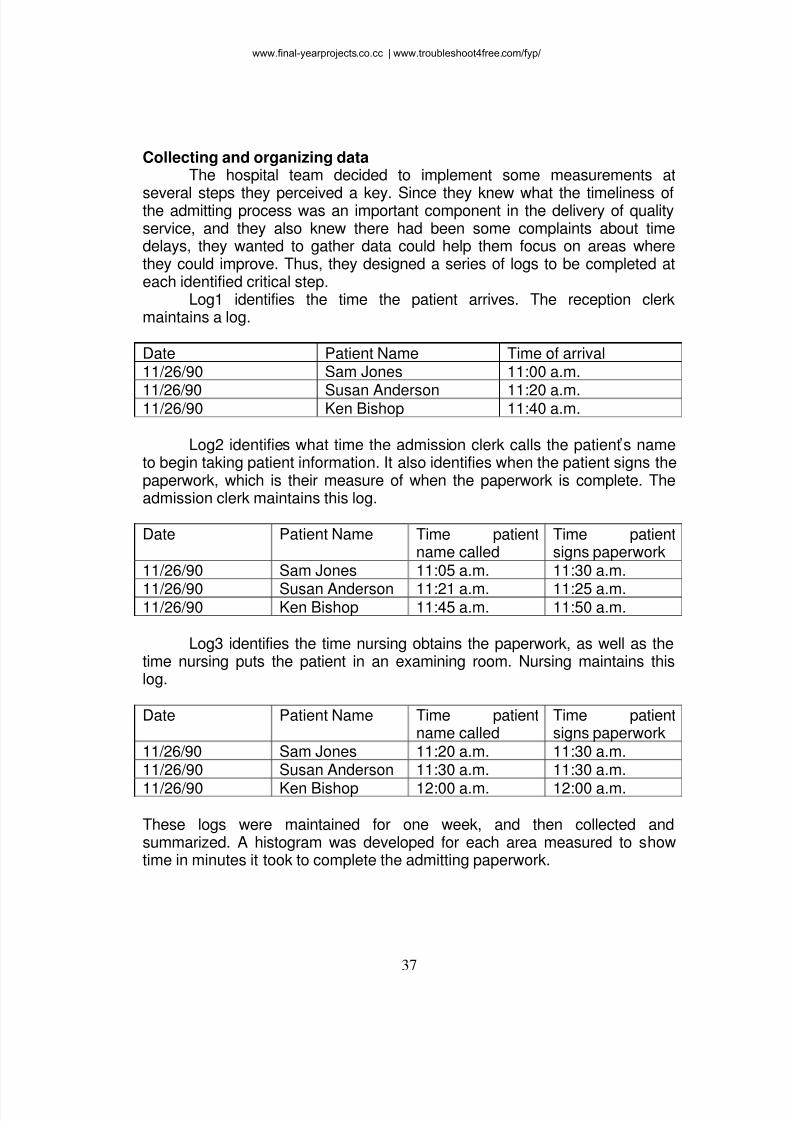
Collecting and organizing data The hospital team decided to implement some measurements at
several steps they perceived a key. Since they knew what the timeliness ofthe admitting process was an important component in the delivery of qualityservice, and they also knew there had been some complaints about timedelays, they wanted to gather data could help them focus on areas wherethey could improve. Thus, they designed a series of logs to be completed ateach identified critical step.
Log1 identifies the time the patient arrives. The reception clerkmaintains a log.
Date Patient Name Time of arrival 11/26/90 Sam Jones 11:00 a.m.
11/26/90 Susan Anderson 11:20 a.m. 11/26/90 Ken Bishop 11:40 a.m.
Log2 identifies what time the admission clerk calls the patient s nameto begin taking patient information. It also identifies when the patient signs thepaperwork, which is their measure of when the paperwork is complete. Theadmission clerk maintains this log.
Date Patient Name Time patientname called
Time patientsigns paperwork
11/26/90 Sam Jones 11:05 a.m. 11:30 a.m.
11/26/90 Susan Anderson 11:21 a.m. 11:25 a.m. 11/26/90 Ken Bishop 11:45 a.m. 11:50 a.m.
Log3 identifies the time nursing obtains the paperwork, as well as thetime nursing puts the patient in an examining room. Nursing maintains thislog.
Date Patient Name Time patientname called
Time patientsigns paperwork
11/26/90 Sam Jones 11:20 a.m. 11:30 a.m. 11/26/90 Susan Anderson 11:30 a.m. 11:30 a.m.
11/26/90 Ken Bishop 12:00 a.m. 12:00 a.m.
These logs were maintained for one week, and then collected andsummarized. A histogram was developed for each area measured to showtime in minutes it took to complete the admitting paperwork.
www.final-yearprojects.co.cc | www.troubleshoot4free.com/fyp/
8/3/2019 Fyp-importance-Aspects-overall Satisfaction_ Buying Behavior and Loyalty
http://slidepdf.com/reader/full/fyp-importance-aspects-overall-satisfaction-buying-behavior-and-loyalty 41/98
38
The histogram measured the time it took to complete admittingpaperwork. However, this information could be interpreted in more than one
way. Each would produce a different picture of the admitting process.
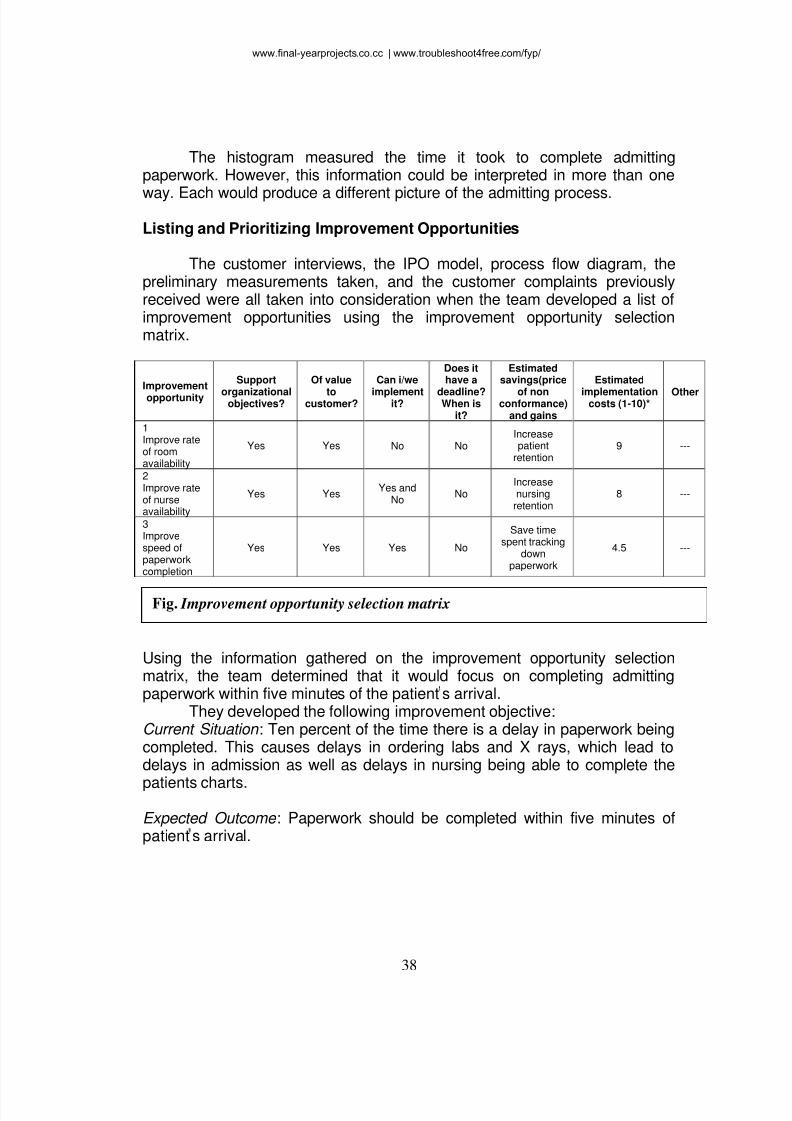
Listing and Prioritizing Improvement Opportunities
The customer interviews, the IPO model, process flow diagram, thepreliminary measurements taken, and the customer complaints previouslyreceived were all taken into consideration when the team developed a list ofimprovement opportunities using the improvement opportunity selectionmatrix.
Improvementopportunity
Support
organizationalobjectives?
Of value
tocustomer?
Can i/we
implementit?
Does ithave a
deadline?When is
it?
Estimatedsavings(price
of nonconformance)
and gains
Estimated
implementationcosts (1-10)*
Other
1Improve rateof roomavailability
Yes Yes No No Increasepatient
retention 9 ---
2Improve rateof nurseavailability
Yes Yes Yes and
No No
Increasenursing
retention 8 ---
3Improvespeed ofpaperworkcompletion
Yes Yes Yes No
Save timespent tracking
downpaperwork
4.5 ---
Using the information gathered on the improvement opportunity selectionmatrix, the team determined that it would focus on completing admittingpaperwork within five minutes of the patient s arrival.
They developed the following improvement objective:Current Situation : Ten percent of the time there is a delay in paperwork beingcompleted. This causes delays in ordering labs and X rays, which lead todelays in admission as well as delays in nursing being able to complete the
patients charts.
Expected Outcome : Paperwork should be completed within five minutes ofpatient s arrival.
Fig. Improvement opportunity selection matrix
www.final-yearprojects.co.cc | www.troubleshoot4free.com/fyp/
8/3/2019 Fyp-importance-Aspects-overall Satisfaction_ Buying Behavior and Loyalty
http://slidepdf.com/reader/full/fyp-importance-aspects-overall-satisfaction-buying-behavior-and-loyalty 42/98
39
Measurements : Logs will be maintained by emergency room staff that willshow time elapsed from the arrival to paperwork completion.
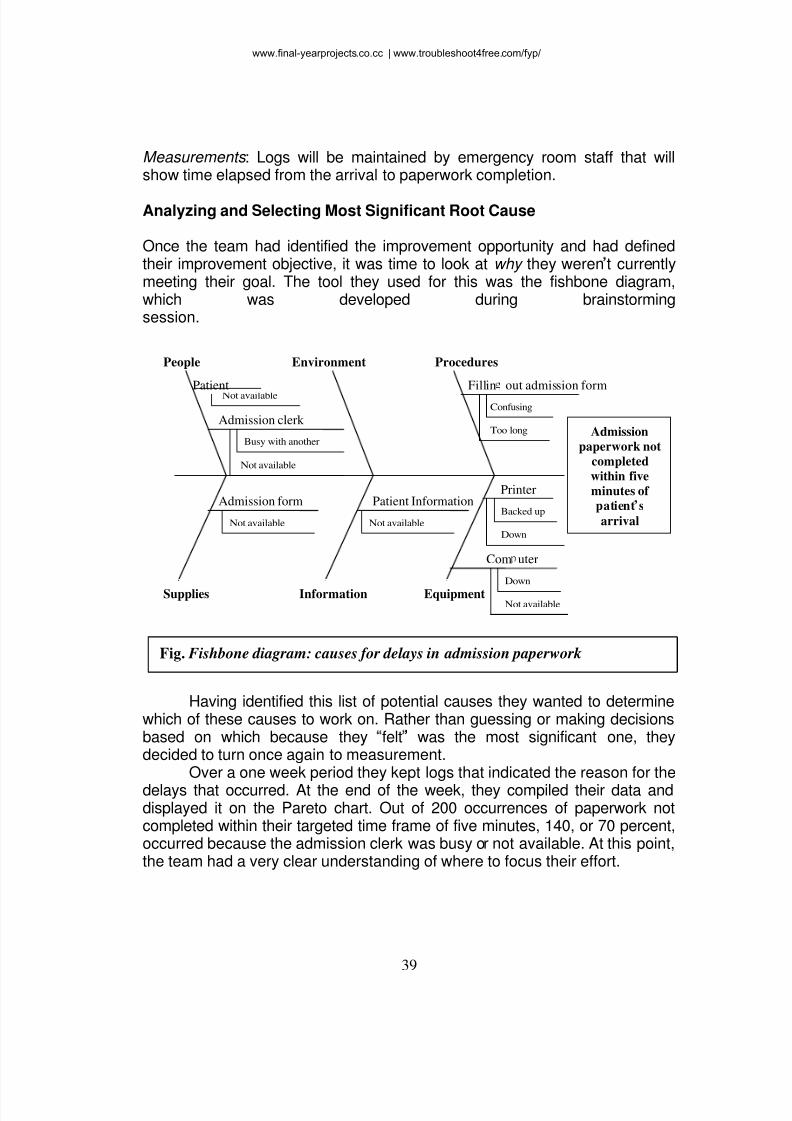
Analyzing and Selecting Most Significant Root Cause
Once the team had identified the improvement opportunity and had definedtheir improvement objective, it was time to look at why they weren t currentlymeeting their goal. The tool they used for this was the fishbone diagram,which was developed during brainstormingsession.
Having identified this list of potential causes they wanted to determinewhich of these causes to work on. Rather than guessing or making decisionsbased on which because they felt was the most significant one, theydecided to turn once again to measurement.
Over a one week period they kept logs that indicated the reason for the
delays that occurred. At the end of the week, they compiled their data anddisplayed it on the Pareto chart. Out of 200 occurrences of paperwork notcompleted within their targeted time frame of five minutes, 140, or 70 percent,occurred because the admission clerk was busy or not available. At this point,the team had a very clear understanding of where to focus their effort.
Com uter
Down
Backed up
Printer
Too long
Confusing
Fillin out admission form
Admission form
Not available Not available
Patient Information
Not available
Busy with another
Not available
Admission clerk
Patient
People Procedures Environment
Admissionpaperwork not
completedwithin fiveminutes of patient s
arrival
Supplies Information Equipment Not available
Down
Fig. Fishbone diagram: causes for delays in admission paperwork
www.final-yearprojects.co.cc | www.troubleshoot4free.com/fyp/
8/3/2019 Fyp-importance-Aspects-overall Satisfaction_ Buying Behavior and Loyalty
http://slidepdf.com/reader/full/fyp-importance-aspects-overall-satisfaction-buying-behavior-and-loyalty 43/98
40
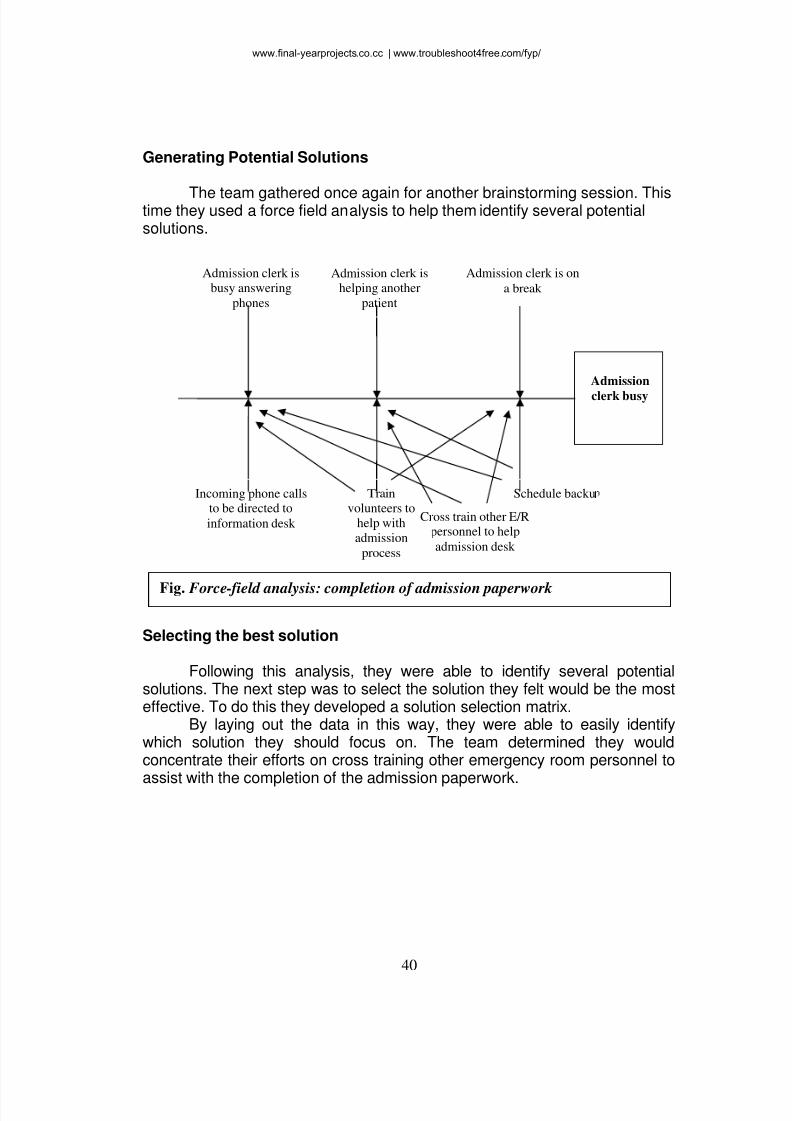
Generating Potential Solutions
The team gathered once again for another brainstorming session. Thistime they used a force field analysis to help them identify several potentialsolutions.
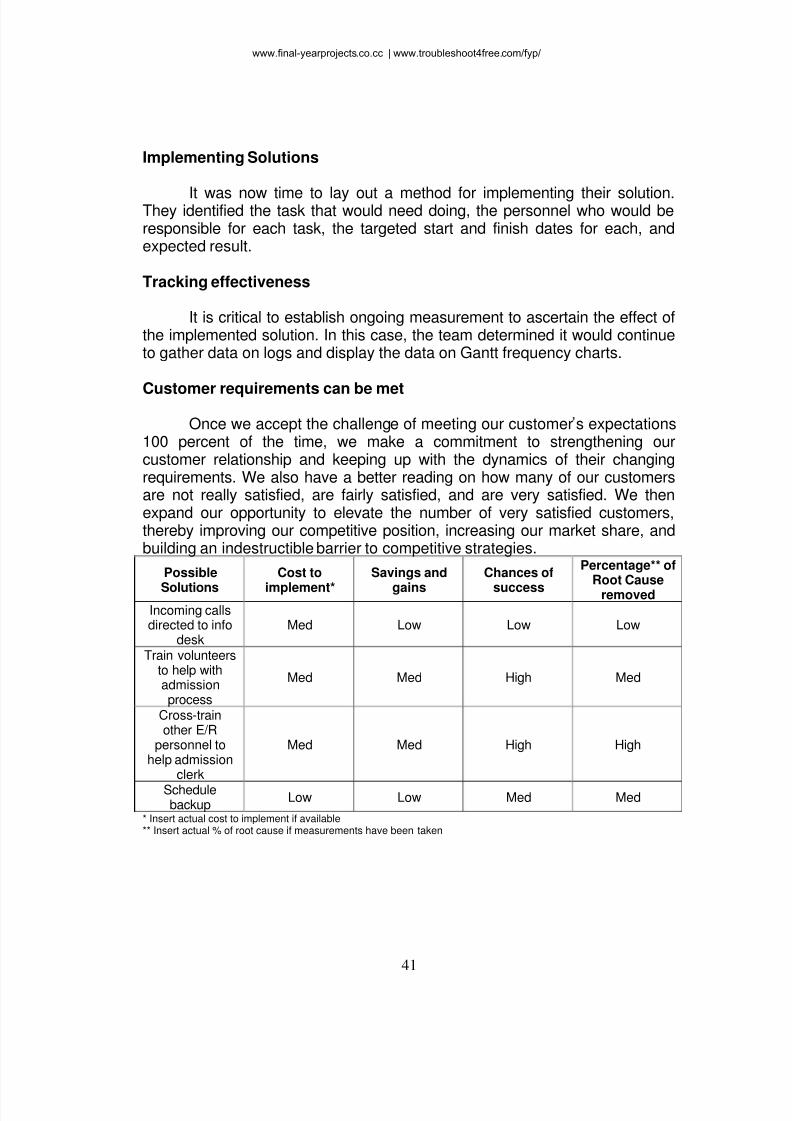
Selecting the best solution
Following this analysis, they were able to identify several potentialsolutions. The next step was to select the solution they felt would be the mosteffective. To do this they developed a solution selection matrix.
By laying out the data in this way, they were able to easily identifywhich solution they should focus on. The team determined they wouldconcentrate their efforts on cross training other emergency room personnel to
assist with the completion of the admission paperwork.
Cross train other E/Rpersonnel to help
admission desk
Admission clerk is
busy answering
phones
Admission
clerk busy
Admission clerk is
helping another
patient
Admission clerk is on
a break
Incoming phone callsto be directed to
information desk
Train
volunteers to
help with
admission
process
Schedule backu
Fig. Force- field analysis: completion of admission paperwork
www.final-yearprojects.co.cc | www.troubleshoot4free.com/fyp/
8/3/2019 Fyp-importance-Aspects-overall Satisfaction_ Buying Behavior and Loyalty
http://slidepdf.com/reader/full/fyp-importance-aspects-overall-satisfaction-buying-behavior-and-loyalty 44/98
41
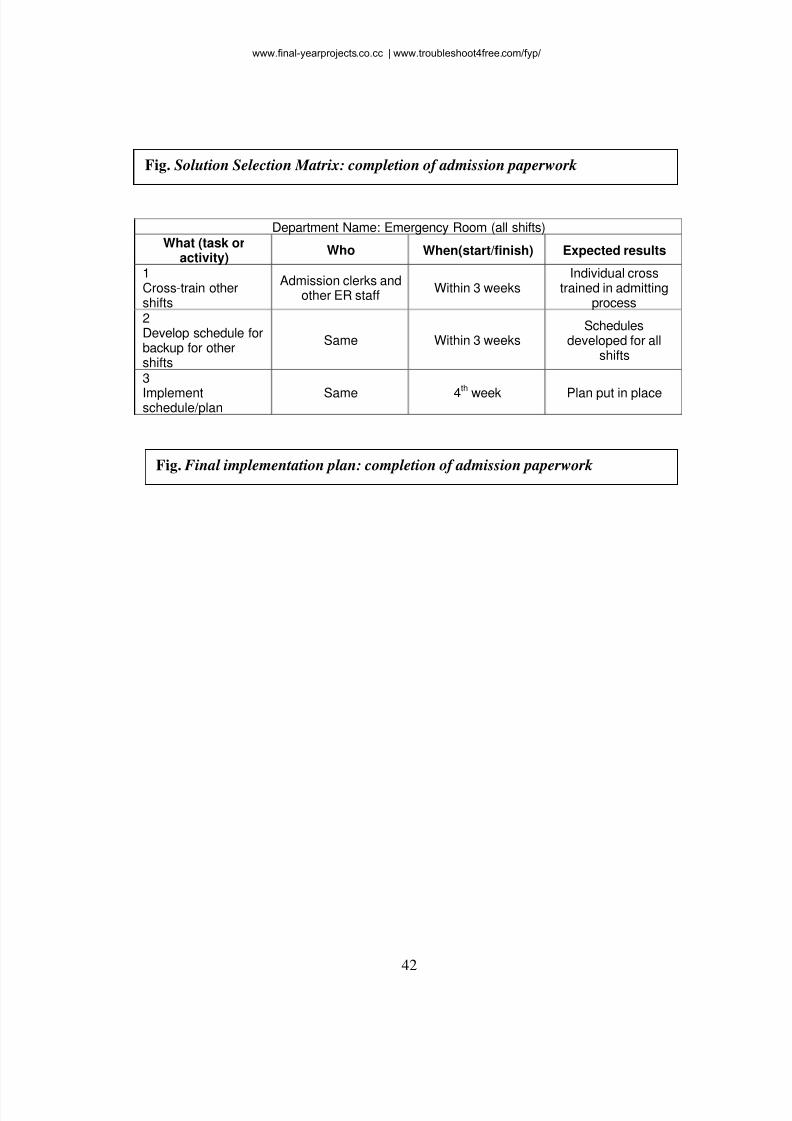
Implementing Solutions
It was now time to lay out a method for implementing their solution.They identified the task that would need doing, the personnel who would beresponsible for each task, the targeted start and finish dates for each, andexpected result.
Tracking effectiveness
It is critical to establish ongoing measurement to ascertain the effect ofthe implemented solution. In this case, the team determined it would continueto gather data on logs and display the data on Gantt frequency charts.
Customer requirements can be met
Once we accept the challenge of meeting our customer s expectations100 percent of the time, we make a commitment to strengthening ourcustomer relationship and keeping up with the dynamics of their changingrequirements. We also have a better reading on how many of our customersare not really satisfied, are fairly satisfied, and are very satisfied. We thenexpand our opportunity to elevate the number of very satisfied customers,thereby improving our competitive position, increasing our market share, andbuilding an indestructible barrier to competitive strategies.
Possible
Solutions
Cost to
implement*
Savings and
gains
Chances of
success
Percentage** ofRoot Cause
removed Incoming callsdirected to info
desk Med Low Low Low
Train volunteersto help withadmissionprocess
Med Med High Med
Cross-trainother E/R
personnel tohelp admission
clerk
Med Med High High
Schedulebackup
Low Low Med Med
* Insert actual cost to implement if available ** Insert actual % of root cause if measurements have been taken
www.final-yearprojects.co.cc | www.troubleshoot4free.com/fyp/
8/3/2019 Fyp-importance-Aspects-overall Satisfaction_ Buying Behavior and Loyalty
http://slidepdf.com/reader/full/fyp-importance-aspects-overall-satisfaction-buying-behavior-and-loyalty 45/98
42
Department Name: Emergency Room (all shifts) What (task or
activity) Who When(start/finish) Expected results
1Cross-train othershifts
Admission clerks andother ER staff
Within 3 weeks Individual cross
trained in admittingprocess
2Develop schedule forbackup for othershifts
Same Within 3 weeks Schedules
developed for allshifts
3
Implementschedule/plan
Same 4th
week Plan put in place
Fig. Solution Selection Matrix: completion of admission paperwork
Fig. Final implementation plan: completion of admission paperwork
www.final-yearprojects.co.cc | www.troubleshoot4free.com/fyp/
8/3/2019 Fyp-importance-Aspects-overall Satisfaction_ Buying Behavior and Loyalty
http://slidepdf.com/reader/full/fyp-importance-aspects-overall-satisfaction-buying-behavior-and-loyalty 46/98
43
GAPS MODEL OF SERVICE
QUALITY
www.final-yearprojects.co.cc | www.troubleshoot4free.com/fyp/
8/3/2019 Fyp-importance-Aspects-overall Satisfaction_ Buying Behavior and Loyalty
http://slidepdf.com/reader/full/fyp-importance-aspects-overall-satisfaction-buying-behavior-and-loyalty 47/98
44
GAPS MODEL OF SERVICE QUALITY
THE CUSTOMER GAP
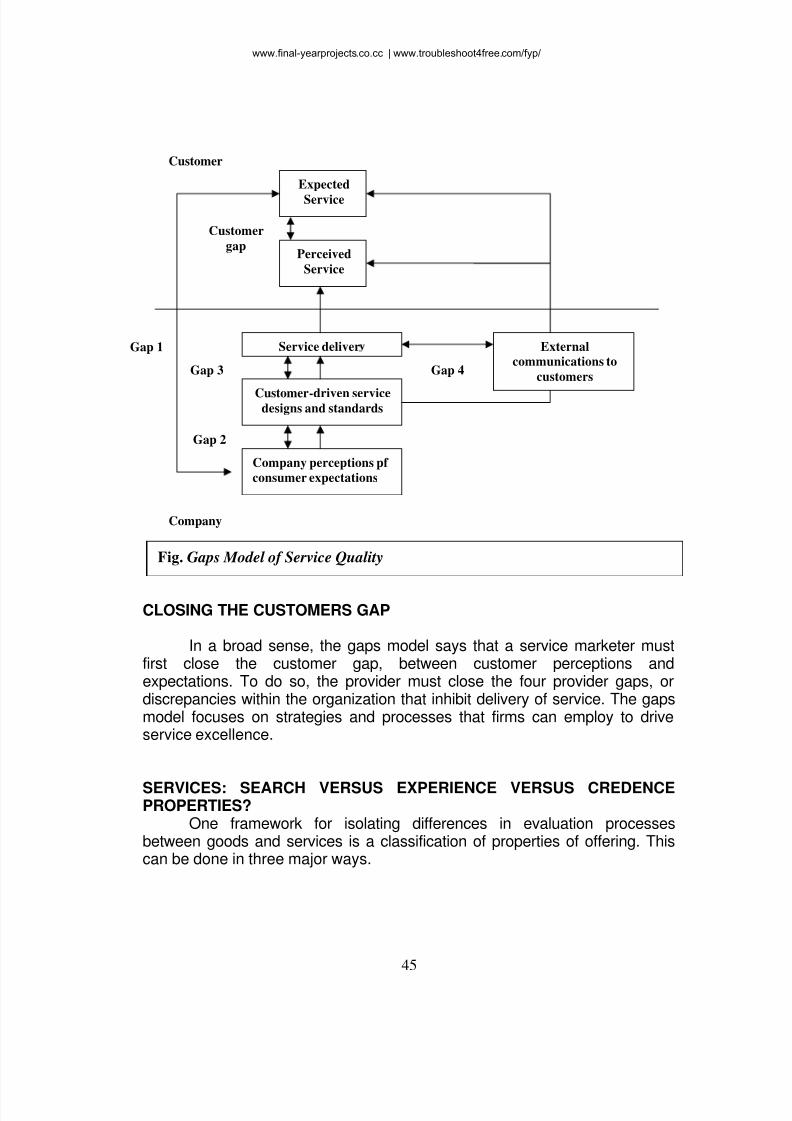
The central focus of the gaps model is the customer gap , thedifference between customer expectations and perceptions. Expectations arethe reference point s customers have coming in to a service experience;perceptions reflect the service as actually received. The idea is that firms willwant to close this gap-between what is expected and what is received-tosatisfy their customers and build long-term relationships with them. To closethis all-important customer gap, the model suggests that four other gaps-theprovider gaps-need to be closed.
THE PROVIDER GAPS
The provider gaps are the underlying causes behind the customer gap:Gap 1 - Not knowing what customers expect. Gap 2 - Not selecting the right service designs and standards. Gap 3 - Not delivering to the service standards. Gap 4 - Not matching performance to promises.
The primary cause in many firms for not meeting customer sexpectations is that the firm lacks accurate understanding of exactly whatthose expectations are. A gap exists (gap1) between company perceptions of
customer expectations and customers actually expect.Even if the firm does not clearly understand its customer sexpectations, there still may be problem if that understanding is not translatedinto customer driven service design and standards (gap2 ).
Once service designs and standards are in place, it would seem thefirm is well on its way to delivering high quality services. This is true, but stillnot enough. There must be systems, processes, and people in place toensure that service delivery actually matches (or is even better than) thedesigns and standards in place (gap3 ).
Finally, with everything in place to effectively meet or exceed customerexpectations, the firm must ensure that what is promised to customers
matches what is delivered (gap4 ).
www.final-yearprojects.co.cc | www.troubleshoot4free.com/fyp/
8/3/2019 Fyp-importance-Aspects-overall Satisfaction_ Buying Behavior and Loyalty
http://slidepdf.com/reader/full/fyp-importance-aspects-overall-satisfaction-buying-behavior-and-loyalty 48/98
45
CLOSING THE CUSTOMERS GAP
In a broad sense, the gaps model says that a service marketer mustfirst close the customer gap, between customer perceptions andexpectations. To do so, the provider must close the four provider gaps, ordiscrepancies within the organization that inhibit delivery of service. The gapsmodel focuses on strategies and processes that firms can employ to driveservice excellence.
SERVICES: SEARCH VERSUS EXPERIENCE VERSUS CREDENCEPROPERTIES?
One framework for isolating differences in evaluation processesbetween goods and services is a classification of properties of offering. Thiscan be done in three major ways.
Expected
Service
Perceived
Service
Service deliver
Customer-driven servicedesigns and standards
Company perceptions pf consumer expectations
Externalcommunications to
customers
Customer
gap
Gap 3
Gap 2
Gap 4
Customer
Company
Gap 1
Fig. Gaps Model of Service Quality
www.final-yearprojects.co.cc | www.troubleshoot4free.com/fyp/
8/3/2019 Fyp-importance-Aspects-overall Satisfaction_ Buying Behavior and Loyalty
http://slidepdf.com/reader/full/fyp-importance-aspects-overall-satisfaction-buying-behavior-and-loyalty 49/98
46
Search qualities Experience qualities
Credence qualities
Search qualities , attributes that a customer can determine beforepurchasing a product. These include color, style, price, fit, feel, hardness, andsmell. Goods such as automobiles, clothing and furniture, and jewelry arehigh in search qualities because attributes can be completely determined andevaluated before purchase.
Experience qualities , attributes that a consumer can discerned only afterpurchase or during consumption. These include taste and wearability. Goodsand services such as vacations and restaurant meals are high in experience
qualities because their attributes cannot be known or assessed until theyhave been purchased and are being consumed.
Credence qualities, includes characteristics that the consumer may findimpossible to evaluate even after purchase and consumption. Examples ofoffering high in credence qualities are appendix operations and brake reliningon automobiles. Few consumers possess medical or mechanical skillssufficient to evaluate whether these services are necessary or are performedproperly, even after have been prescribed and produced by the seller.
www.final-yearprojects.co.cc | www.troubleshoot4free.com/fyp/
8/3/2019 Fyp-importance-Aspects-overall Satisfaction_ Buying Behavior and Loyalty
http://slidepdf.com/reader/full/fyp-importance-aspects-overall-satisfaction-buying-behavior-and-loyalty 50/98
47
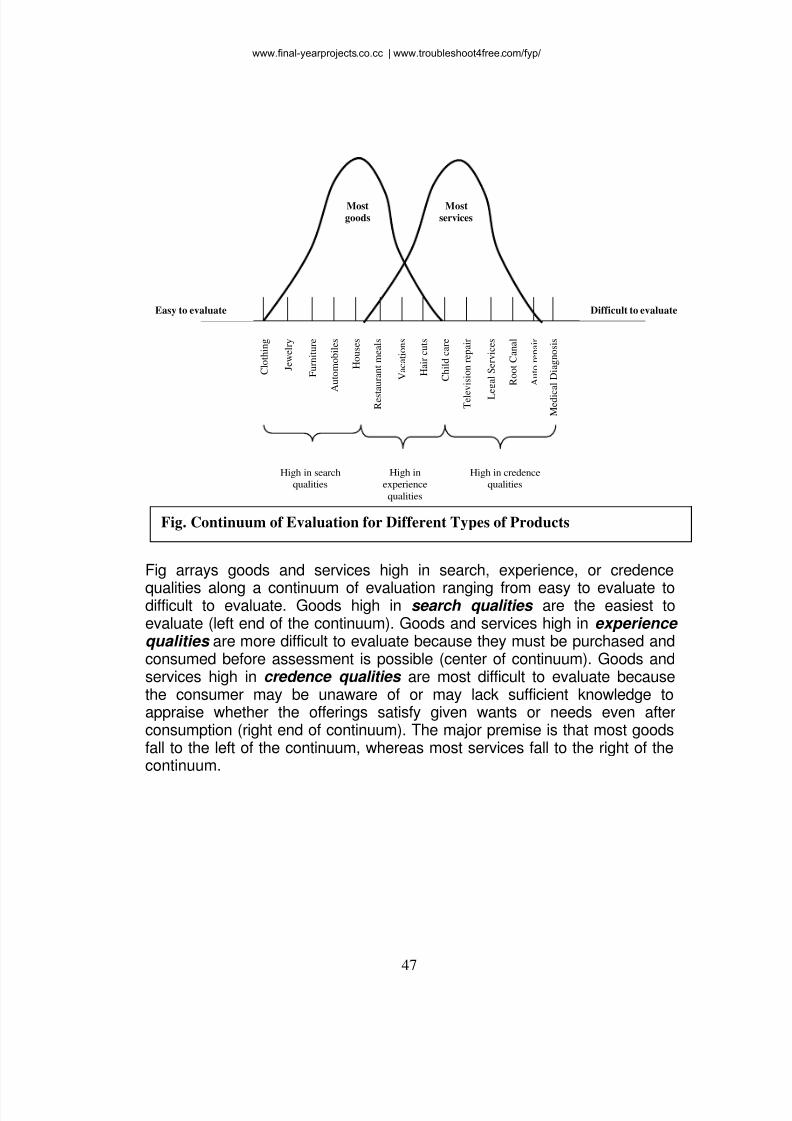
Fig arrays goods and services high in search, experience, or credence
qualities along a continuum of evaluation ranging from easy to evaluate todifficult to evaluate. Goods high in search qualities are the easiest toevaluate (left end of the continuum). Goods and services high in experience qualities are more difficult to evaluate because they must be purchased andconsumed before assessment is possible (center of continuum). Goods andservices high in credence qualities are most difficult to evaluate becausethe consumer may be unaware of or may lack sufficient knowledge toappraise whether the offerings satisfy given wants or needs even afterconsumption (right end of continuum). The major premise is that most goodsfall to the left of the continuum, whereas most services fall to the right of thecontinuum.
Mostgoods
Mostservices
C l o t h i n g
J e w e l r y
F u r n i t u r e
A u t o m o b i l e s
H o u s e s
R e s t a u r a n t m e a l s
V a c a t i o n s
H a i r c u t s
C h i l d c a r e
T e l e
v i s i o n r e p a i r
L e
g a l S e r v i c e s
R o o t C a n a l
A u t o r e p a i r
M e d i c
a l D i a g n o s i s
Difficult to evaluate Easy to evaluate
High in search
qualities
High in credence
qualities
High in
experience
qualities
Fig. Continuum of Evaluation for Different Types of Products
www.final-yearprojects.co.cc | www.troubleshoot4free.com/fyp/
8/3/2019 Fyp-importance-Aspects-overall Satisfaction_ Buying Behavior and Loyalty
http://slidepdf.com/reader/full/fyp-importance-aspects-overall-satisfaction-buying-behavior-and-loyalty 51/98
48
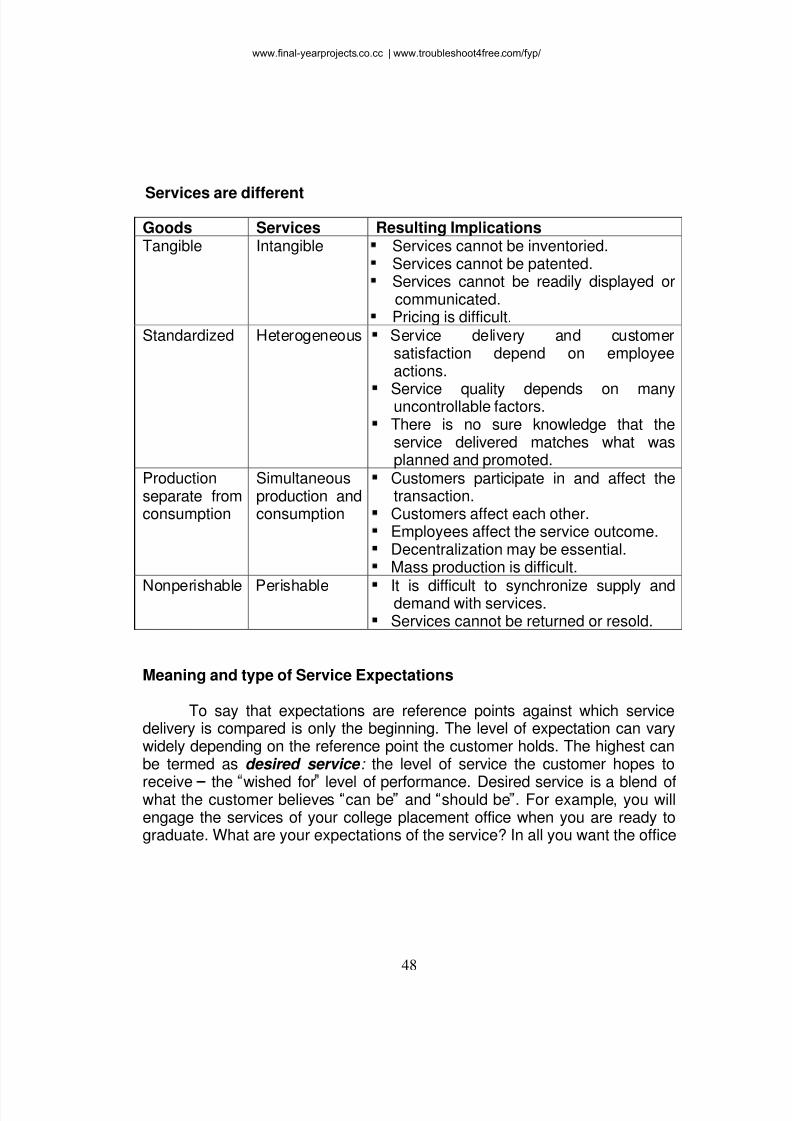
Services are different
Meaning and type of Service Expectations
To say that expectations are reference points against which servicedelivery is compared is only the beginning. The level of expectation can varywidely depending on the reference point the customer holds. The highest canbe termed as desired service : the level of service the customer hopes to
receive the wished for level of performance. Desired service is a blend ofwhat the customer believes can be and should be . For example, you willengage the services of your college placement office when you are ready tograduate. What are your expectations of the service? In all you want the office
Goods Services Resulting Implications Tangible Intangible Services cannot be inventoried.
Services cannot be patented. Services cannot be readily displayed orcommunicated. Pricing is difficult.
Standardized Heterogeneous Service delivery and customersatisfaction depend on employeeactions.
Service quality depends on manyuncontrollable factors. There is no sure knowledge that theservice delivered matches what wasplanned and promoted.
Productionseparate fromconsumption
Simultaneousproduction andconsumption
Customers participate in and affect thetransaction. Customers affect each other. Employees affect the service outcome.Decentralization may be essential. Mass production is difficult.
Nonperishable Perishable It is difficult to synchronize supply anddemand with services.Services cannot be returned or resold.
www.final-yearprojects.co.cc | www.troubleshoot4free.com/fyp/
8/3/2019 Fyp-importance-Aspects-overall Satisfaction_ Buying Behavior and Loyalty
http://slidepdf.com/reader/full/fyp-importance-aspects-overall-satisfaction-buying-behavior-and-loyalty 52/98
49
to find you a job the right job in the right place for the right salary becausethat is what you hope and wish for.
However, you probably also see that the economy may constrain theavailability of ideal job openings in companies and not all companies you maybe interested in have a relationship with your placement office. In thissituation and in general, customers hope to achieve their services desires butrecognize that this is not always possible. We call the threshold level ofacceptable service adequate service the level of service the customer willaccept.
Customers typically hold similar desired expectations acrosscategories of service, but these categories are not as broad as wholeindustries. Among subcategories of restaurants are expensive restaurants,ethnic restaurants, fast food restaurants and airport restaurants. A customer s
desired service expectation for fast food restaurants is quick, convenient,tasty food in a clean sitting. The desired service expectation for an expensiverestaurant, on the other hand, usually involves elegant surroundings, graciousemployees, candlelight, and fine food. In essence, desired serviceexpectations seem to be the same for service providers within industrycategories or subcategories that are viewed as similar by customers.
The adequate service expectation level, on the other hand, may varyfor different firms within a category or subcategory. Within fast foodrestaurants, a customer may hold a higher expectation for McDonald s thanfor Burger King, having experienced consistent service at McDonald s overtime and somewhat inconsistent service at Burger King.
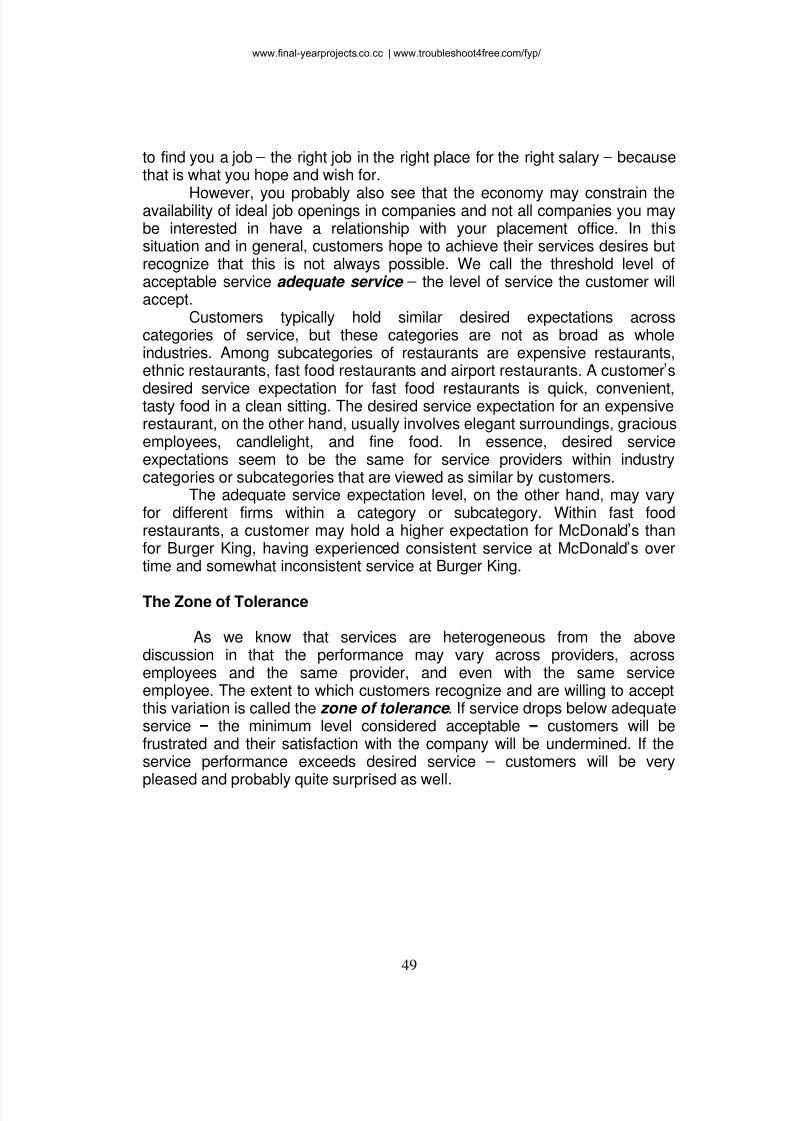
The Zone of Tolerance
As we know that services are heterogeneous from the abovediscussion in that the performance may vary across providers, acrossemployees and the same provider, and even with the same serviceemployee. The extent to which customers recognize and are willing to acceptthis variation is called the zone of tolerance . If service drops below adequateservice the minimum level considered acceptable customers will befrustrated and their satisfaction with the company will be undermined. If theservice performance exceeds desired service customers will be very
pleased and probably quite surprised as well.
www.final-yearprojects.co.cc | www.troubleshoot4free.com/fyp/
8/3/2019 Fyp-importance-Aspects-overall Satisfaction_ Buying Behavior and Loyalty
http://slidepdf.com/reader/full/fyp-importance-aspects-overall-satisfaction-buying-behavior-and-loyalty 53/98
50
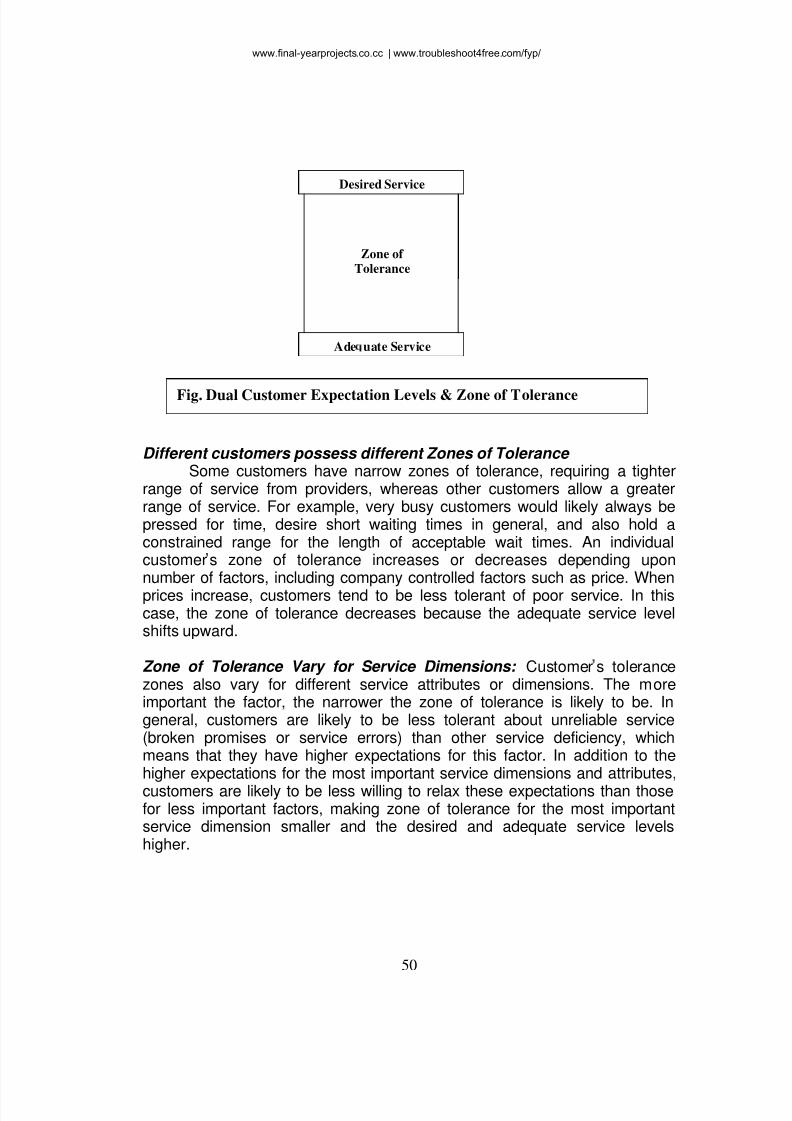
Different customers possess different Zones of Tolerance Some customers have narrow zones of tolerance, requiring a tighter
range of service from providers, whereas other customers allow a greaterrange of service. For example, very busy customers would likely always bepressed for time, desire short waiting times in general, and also hold aconstrained range for the length of acceptable wait times. An individualcustomer s zone of tolerance increases or decreases depending uponnumber of factors, including company controlled factors such as price. Whenprices increase, customers tend to be less tolerant of poor service. In thiscase, the zone of tolerance decreases because the adequate service levelshifts upward.
Zone of Tolerance Vary for Service Dimensions: Customer s tolerancezones also vary for different service attributes or dimensions. The moreimportant the factor, the narrower the zone of tolerance is likely to be. Ingeneral, customers are likely to be less tolerant about unreliable service(broken promises or service errors) than other service deficiency, whichmeans that they have higher expectations for this factor. In addition to thehigher expectations for the most important service dimensions and attributes,
customers are likely to be less willing to relax these expectations than thosefor less important factors, making zone of tolerance for the most importantservice dimension smaller and the desired and adequate service levelshigher.
Desired Service
Ade uate Service
Zone of Tolerance
Fig. Dual Customer Expectation Levels & Zone of Tolerance
www.final-yearprojects.co.cc | www.troubleshoot4free.com/fyp/
8/3/2019 Fyp-importance-Aspects-overall Satisfaction_ Buying Behavior and Loyalty
http://slidepdf.com/reader/full/fyp-importance-aspects-overall-satisfaction-buying-behavior-and-loyalty 54/98
51
FACTORS THAT INFLUENCE CUSTOMER EXPECTATIONS OF SERVICE
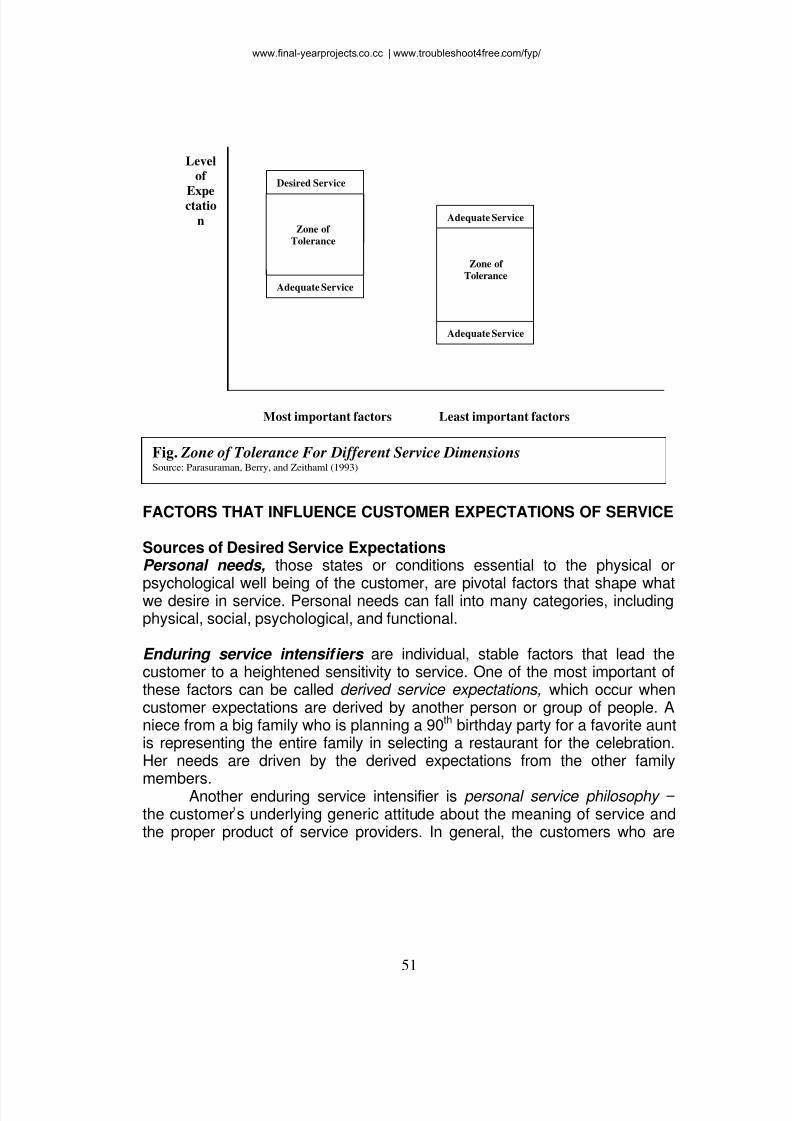
Sources of Desired Service Expectations Personal needs, those states or conditions essential to the physical or
psychological well being of the customer, are pivotal factors that shape whatwe desire in service. Personal needs can fall into many categories, includingphysical, social, psychological, and functional.
Enduring service intensif iers are individual, stable factors that lead thecustomer to a heightened sensitivity to service. One of the most important ofthese factors can be called derived service expectations, which occur whencustomer expectations are derived by another person or group of people. Aniece from a big family who is planning a 90th birthday party for a favorite auntis representing the entire family in selecting a restaurant for the celebration.Her needs are driven by the derived expectations from the other family
members. Another enduring service intensifier is personal service philosophy the customer s underlying generic attitude about the meaning of service andthe proper product of service providers. In general, the customers who are
Desired Service
Adequate Service
Adequate Service
Adequate Service
Zone of Tolerance
Zone of Tolerance
Levelof
Expectation
Most important factors Least important factors
Fig. Zone of Tolerance For Different Service Dimensions Source: Parasuraman, Berry, and Zeithaml (1993)
www.final-yearprojects.co.cc | www.troubleshoot4free.com/fyp/
8/3/2019 Fyp-importance-Aspects-overall Satisfaction_ Buying Behavior and Loyalty
http://slidepdf.com/reader/full/fyp-importance-aspects-overall-satisfaction-buying-behavior-and-loyalty 55/98
52
themselves in service businesses or have worked for them in the past seemto have especially strong service philosophies.
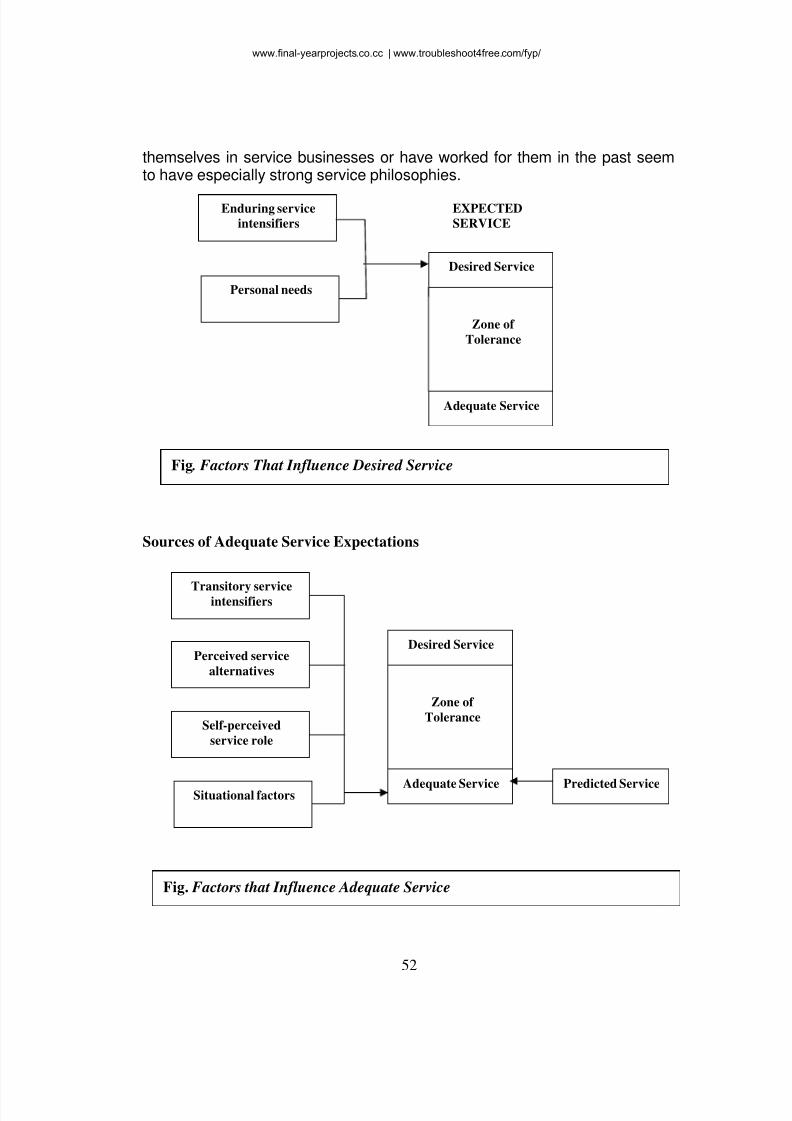
Sources of Adequate Service Expectations
Desired Service
Adequate Service Predicted Service
Transitory serviceintensifiers
Perceived service
alternatives
Self -perceived
service role
Situational factors
Zone of
Tolerance
Desired Service
Adequate Service
Zone of
Tolerance
Enduring serviceintensifiers
Personal needs
EXPECTEDSERVICE
Fig . Factors That Influence Desired Service
Fig. Factors that Influence Adequate Service
www.final-yearprojects.co.cc | www.troubleshoot4free.com/fyp/
8/3/2019 Fyp-importance-Aspects-overall Satisfaction_ Buying Behavior and Loyalty
http://slidepdf.com/reader/full/fyp-importance-aspects-overall-satisfaction-buying-behavior-and-loyalty 56/98
53
Transitory service intensifiers, consists of temporary, usually short-term,
individual factors that make a customer more aware of the need for service.Personal emergency situations in which service is urgently needed (such as aaccident and the need of the automobile insurance or a breakdown in officeequipment during a busy period) raise the level of responsiveness requiredand considered acceptable.
Perceived service alternatives are other providers from whom the customercan obtain service. If customers have multiple service providers to choosefrom, or if they can provide the service for themselves (such as lawn care orpersonal grooming), their levels of adequate service are higher than those ofcustomers who believe it is not possible to get better service elsewhere.
Customer s self-perceived service role are the customers perceptions ofthe degree to which customers exert an influence on the level of service theyreceive. A customer who is very explicit with a waiter about how rare hewants his steak cooked in a restaurant will probably be more dissatisfied ifthe meat comes to the table overcooked than a customer who does notarticulate the degree of doneness expected.
Situational factors are service performance conditions that customers viewas beyond the control of the service provider. For example, where personalemergencies such as serious automobile accidents would likely intensify
customer service expectations of insurance companies, catastrophes thataffect a large number of people at one time(tornadoes or earthquakes) maylower service expectations because customers might realize that insurers areinundated with demands for their services.
Predicted service, is the level of service customers believe they are likely toget. Predicted service performance implies some objective calculation of theprobability of performance or estimate of anticipated service performancelevel. For example, your predicted service expectations about the length oftime you will spend in the waiting room the next time you visit your doctor willlikely be expressed in terms of the number of minutes or hours you have
spent in the waiting room this time.
www.final-yearprojects.co.cc | www.troubleshoot4free.com/fyp/
8/3/2019 Fyp-importance-Aspects-overall Satisfaction_ Buying Behavior and Loyalty
http://slidepdf.com/reader/full/fyp-importance-aspects-overall-satisfaction-buying-behavior-and-loyalty 57/98
54
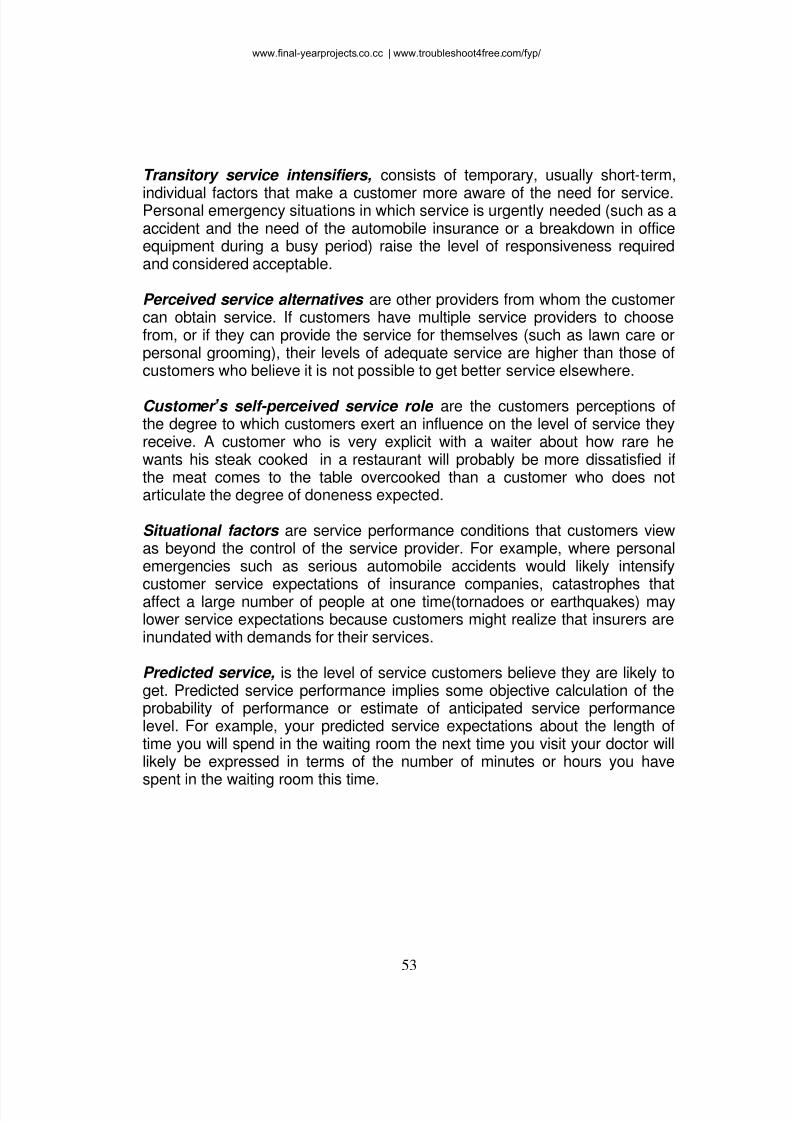
Sources of both Desired and Predicted Service Expectations
Explicit service promises are personal and non personal statements aboutthe service made by the organization to the customers. The statements arepersonal when they are communicated by salespeople or service or repairpersonnel; they are non personal when they come from advertising,brochures, and other written publications. Explicit promises are one of the fewinfluences on expectations that are completely in the control of the serviceprovider.
Implicit service promises are service related cues other than explicit
promises that lead to inferences about what the service should and will belike. These quality cues are dominated by price and the tangibles associatedwith the service. In general, higher the price and the more impressive thetangibles, the more a customer will expect from the service.
Desired Service
Adequate Service
Zone of
Tolerance
Perceived servicealternatives
Perceived service
alternatives
Perceived service
alternatives
Perceived service
alternatives
Perceived service
alternatives
Fig. Factors that Influence Desired and Predicted Service
www.final-yearprojects.co.cc | www.troubleshoot4free.com/fyp/
8/3/2019 Fyp-importance-Aspects-overall Satisfaction_ Buying Behavior and Loyalty
http://slidepdf.com/reader/full/fyp-importance-aspects-overall-satisfaction-buying-behavior-and-loyalty 58/98
55
Word of mouth communication in shaping expectations of service is welldocumented. These personal and sometimes non personal statements made
by the parties other than the organization convey to customers what theservice will be like and influence both predicted and desired service. Word ofmouth tends to be more important in services that are difficult to evaluatebefore purchase and direct experience of them. Experts (including ConsumerReports, friends family) are word of mouth sources that can affect the levelsof desired and predicted service.
Past experience , the customer s previous exposure to service that is relevantto the focal service, is another force in shaping predictions and desires. Forexample, you probably compare each stay in a particular hotel with allprevious stays in that hotel.
Practical implementation of GAPS MODEL
Implementation of the Gaps Model was done by selecting a prominentservice industry like the coffee industry. We assume that there are two majorplayers in the coffee industry viz. Café Coffee Day and Barista.
A survey was carried to measure three service dimensions
Process
Physicalevidence
People
Café Staff
Café
Service
Café
Fig. Evidence of Service (from customer point of view)
www.final-yearprojects.co.cc | www.troubleshoot4free.com/fyp/
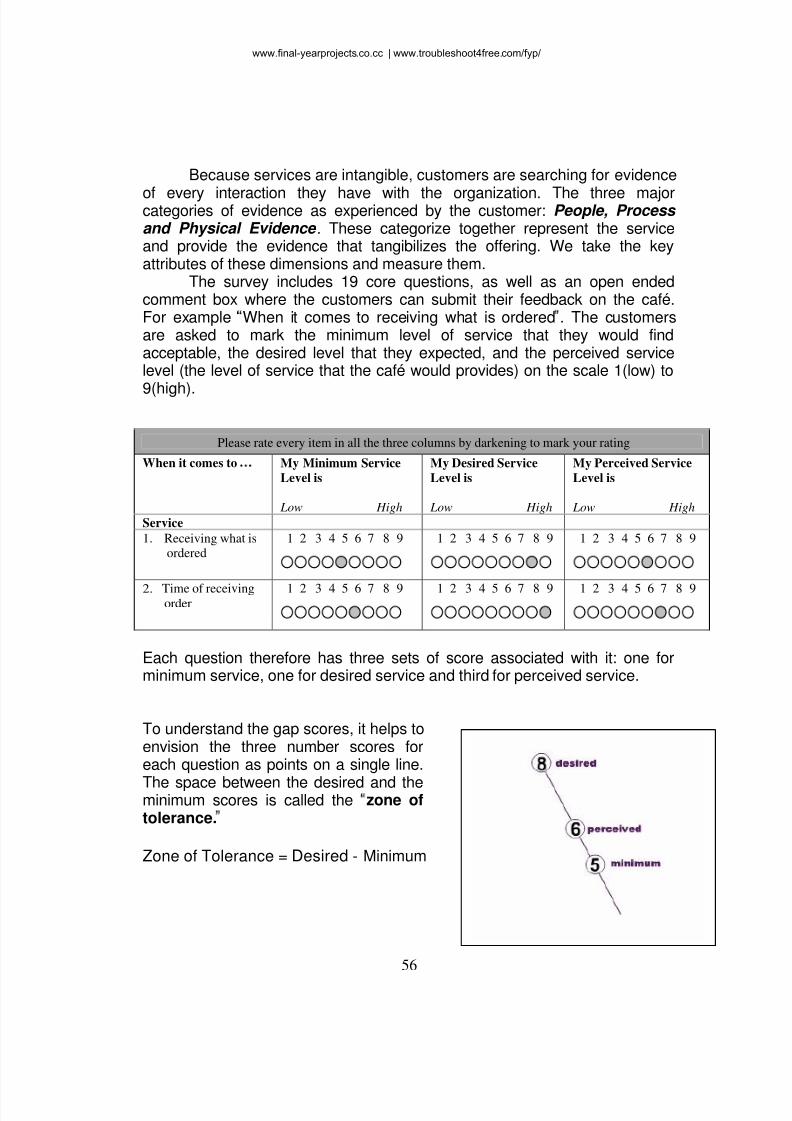
8/3/2019 Fyp-importance-Aspects-overall Satisfaction_ Buying Behavior and Loyalty
http://slidepdf.com/reader/full/fyp-importance-aspects-overall-satisfaction-buying-behavior-and-loyalty 59/98
56
Because services are intangible, customers are searching for evidence
of every interaction they have with the organization. The three majorcategories of evidence as experienced by the customer: People, Process and Physical Evidence . These categorize together represent the serviceand provide the evidence that tangibilizes the offering. We take the keyattributes of these dimensions and measure them.
The survey includes 19 core questions, as well as an open endedcomment box where the customers can submit their feedback on the café.For example When it comes to receiving what is ordered . The customersare asked to mark the minimum level of service that they would findacceptable, the desired level that they expected, and the perceived servicelevel (the level of service that the café would provides) on the scale 1(low) to
9(high).
Please rate every item in all the three columns by darkening to mark your rating
When it comes to My Minimum ServiceLevel is
Low High
My Desired ServiceLevel is
Low High
My Perceived ServiceLevel is
Low High
Service
1. Receiving what isordered
1 2 3 4 5 6 7 8 9 1 2 3 4 5 6 7 8 9 1 2 3 4 5 6 7 8 9
2. Time of receivingorder
1 2 3 4 5 6 7 8 9 1 2 3 4 5 6 7 8 9 1 2 3 4 5 6 7 8 9
Each question therefore has three sets of score associated with it: one forminimum service, one for desired service and third for perceived service.
To understand the gap scores, it helps toenvision the three number scores foreach question as points on a single line.
The space between the desired and theminimum scores is called the zone oftolerance.
Zone of Tolerance = Desired - Minimum
www.final-yearprojects.co.cc | www.troubleshoot4free.com/fyp/
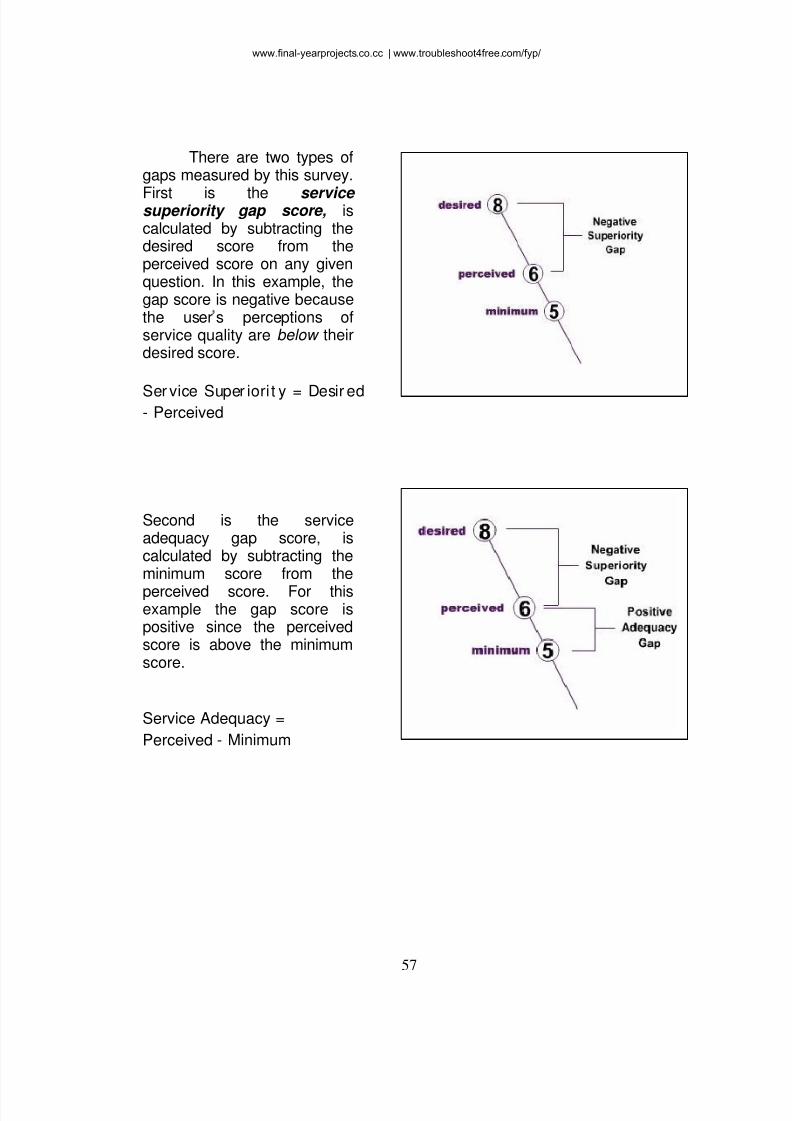
8/3/2019 Fyp-importance-Aspects-overall Satisfaction_ Buying Behavior and Loyalty
http://slidepdf.com/reader/full/fyp-importance-aspects-overall-satisfaction-buying-behavior-and-loyalty 60/98
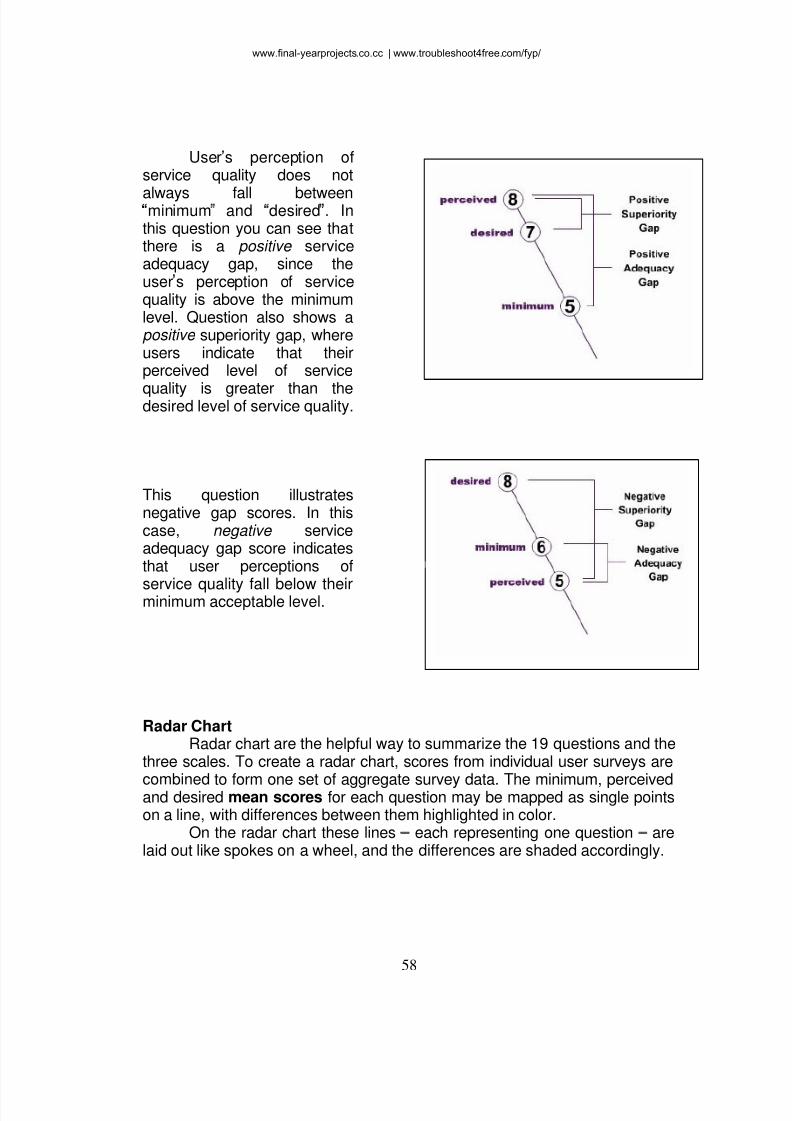
8/3/2019 Fyp-importance-Aspects-overall Satisfaction_ Buying Behavior and Loyalty
http://slidepdf.com/reader/full/fyp-importance-aspects-overall-satisfaction-buying-behavior-and-loyalty 61/98
58
User s perception ofservice quality does not
always fall betweenminimum and desired . Inthis question you can see thatthere is a positive serviceadequacy gap, since theuser s perception of servicequality is above the minimumlevel. Question also shows apositive superiority gap, whereusers indicate that theirperceived level of service
quality is greater than thedesired level of service quality.
This question illustratesnegative gap scores. In thiscase, negative serviceadequacy gap score indicatesthat user perceptions of
service quality fall below theirminimum acceptable level.
Radar Chart Radar chart are the helpful way to summarize the 19 questions and the
three scales. To create a radar chart, scores from individual user surveys are
combined to form one set of aggregate survey data. The minimum, perceivedand desired mean scores for each question may be mapped as single pointson a line, with differences between them highlighted in color.
On the radar chart these lines each representing one question arelaid out like spokes on a wheel, and the differences are shaded accordingly.
www.final-yearprojects.co.cc | www.troubleshoot4free.com/fyp/
8/3/2019 Fyp-importance-Aspects-overall Satisfaction_ Buying Behavior and Loyalty
http://slidepdf.com/reader/full/fyp-importance-aspects-overall-satisfaction-buying-behavior-and-loyalty 62/98
59
For each survey question, the chart has the minimum, desired and theperceived scores, as well as mean scores for the service adequacy and
service superiority gaps. Areas between each of the mean scores on theradar chart are color coded to highlight the differences. This process isrepeated for each individual item. Mean scores are mapped as points on asingle line and the areas between scores are highlighted. On the Radar chart,differences are highlighted in color: red indicates areas where the perceivedscores is less than the minimum score; blue is where perceived scores aregreater than minimum scores;
By looking at the radar chart as the whole, for Café Coffee Day andBarista you can have overall understanding between the service quality of thetwo coffee shops. Also the total radar chart comprising of the both the CaféCoffee Day and Barista will show what is the users perception of service
quality of the total coffee service industry (our assumption which states thatCafé Coffee Day and Barista cover the total coffee service industry).
www.final-yearprojects.co.cc | www.troubleshoot4free.com/fyp/

8/3/2019 Fyp-importance-Aspects-overall Satisfaction_ Buying Behavior and Loyalty
http://slidepdf.com/reader/full/fyp-importance-aspects-overall-satisfaction-buying-behavior-and-loyalty 63/98
60
OBSERVATIONS AN D
CALCULATIONS
www.final-yearprojects.co.cc | www.troubleshoot4free.com/fyp/
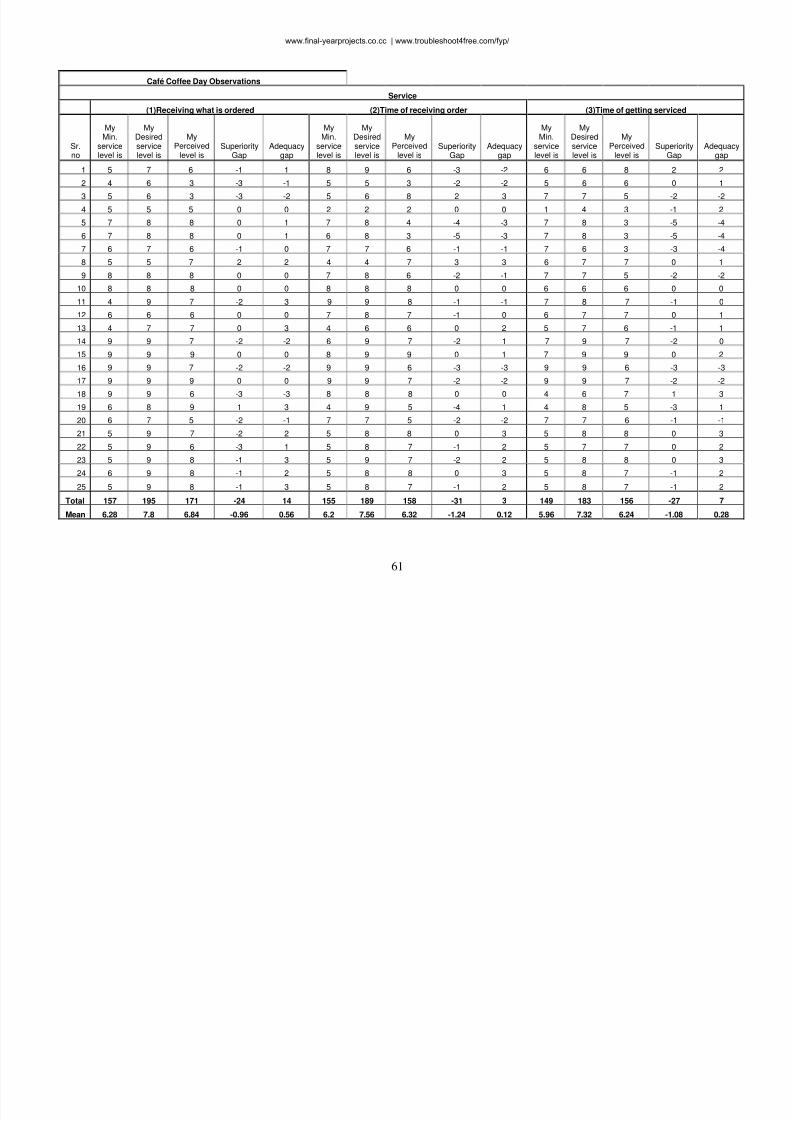
8/3/2019 Fyp-importance-Aspects-overall Satisfaction_ Buying Behavior and Loyalty
http://slidepdf.com/reader/full/fyp-importance-aspects-overall-satisfaction-buying-behavior-and-loyalty 64/98
61
Café Coffee Day Observations
Service
(1)Receiving what is ordered (2)Time of receiving order (3)Time of getting serviced
Sr.no
MyMin.
servicelevel is
MyDesiredservicelevel is
MyPerceived
level is Superiority
Gap Adequacy
gap
MyMin.
servicelevel is
MyDesiredservicelevel is
MyPerceived
level is Superiority
Gap Adequacy
gap
MyMin.
servicelevel is
MyDesiredservicelevel is
MyPerceived
level is Superiority
Gap Adequacy
gap
1 5 7 6 -1 1 8 9 6 -3 -2 6 6 8 2 2
2 4 6 3 -3 -1 5 5 3 -2 -2 5 6 6 0 1
3 5 6 3 -3 -2 5 6 8 2 3 7 7 5 -2 -2
4 5 5 5 0 0 2 2 2 0 0 1 4 3 -1 2
5 7 8 8 0 1 7 8 4 -4 -3 7 8 3 -5 -4
6 7 8 8 0 1 6 8 3 -5 -3 7 8 3 -5 -4
7 6 7 6 -1 0 7 7 6 -1 -1 7 6 3 -3 -4
8 5 5 7 2 2 4 4 7 3 3 6 7 7 0 1
9 8 8 8 0 0 7 8 6 -2 -1 7 7 5 -2 -2
10 8 8 8 0 0 8 8 8 0 0 6 6 6 0 0
11 4 9 7 -2 3 9 9 8 -1 -1 7 8 7 -1 0
12 6 6 6 0 0 7 8 7 -1 0 6 7 7 0 1
13 4 7 7 0 3 4 6 6 0 2 5 7 6 -1 1
14 9 9 7 -2 -2 6 9 7 -2 1 7 9 7 -2 0
15 9 9 9 0 0 8 9 9 0 1 7 9 9 0 2
16 9 9 7 -2 -2 9 9 6 -3 -3 9 9 6 -3 -3
17 9 9 9 0 0 9 9 7 -2 -2 9 9 7 -2 -2
18 9 9 6 -3 -3 8 8 8 0 0 4 6 7 1 3
19 6 8 9 1 3 4 9 5 -4 1 4 8 5 -3 1
20 6 7 5 -2 -1 7 7 5 -2 -2 7 7 6 -1 -1
21 5 9 7 -2 2 5 8 8 0 3 5 8 8 0 3
22 5 9 6 -3 1 5 8 7 -1 2 5 7 7 0 2
23 5 9 8 -1 3 5 9 7 -2 2 5 8 8 0 3
24 6 9 8 -1 2 5 8 8 0 3 5 8 7 -1 2
25 5 9 8 -1 3 5 8 7 -1 2 5 8 7 -1 2
Total 157 195 171 -24 14 155 189 158 -31 3 149 183 156 -27 7
Mean 6.28 7.8 6.84 -0.96 0.56 6.2 7.56 6.32 -1.24 0.12 5.96 7.32 6.24 -1.08 0.28
www.final-yearprojects.co.cc | www.troubleshoot4free.com/fyp/
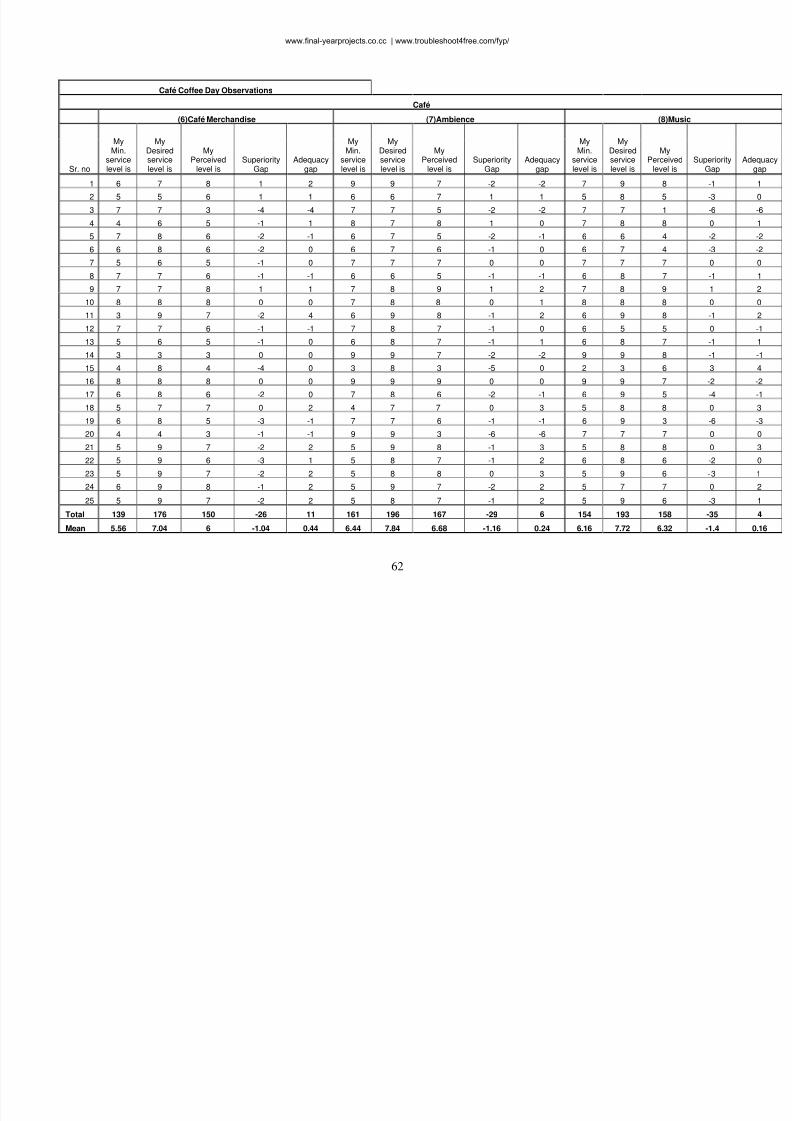
8/3/2019 Fyp-importance-Aspects-overall Satisfaction_ Buying Behavior and Loyalty
http://slidepdf.com/reader/full/fyp-importance-aspects-overall-satisfaction-buying-behavior-and-loyalty 65/98
62
Café Coffee Day Observations
Café
(6)Café Merchandise (7)Ambience (8)Music
Sr. no
MyMin.
servicelevel is
MyDesiredservicelevel is
MyPerceived
level is Superiority
Gap Adequacy
gap
MyMin.
servicelevel is
MyDesiredservicelevel is
MyPerceived
level is Superiority
Gap Adequacy
gap
MyMin.
servicelevel is
MyDesiredservicelevel is
MyPerceived
level is Superiority
Gap
1 6 7 8 1 2 9 9 7 -2 -2 7 9 8 -1
2 5 5 6 1 1 6 6 7 1 1 5 8 5 -3
3 7 7 3 -4 -4 7 7 5 -2 -2 7 7 1 -6
4 4 6 5 -1 1 8 7 8 1 0 7 8 8 0
5 7 8 6 -2 -1 6 7 5 -2 -1 6 6 4 -2
6 6 8 6 -2 0 6 7 6 -1 0 6 7 4 -3
7 5 6 5 -1 0 7 7 7 0 0 7 7 7 0
8 7 7 6 -1 -1 6 6 5 -1 -1 6 8 7 -1
9 7 7 8 1 1 7 8 9 1 2 7 8 9 1
10 8 8 8 0 0 7 8 8 0 1 8 8 8 0
11 3 9 7 -2 4 6 9 8 -1 2 6 9 8 -1
12 7 7 6 -1 -1 7 8 7 -1 0 6 5 5 0
13 5 6 5 -1 0 6 8 7 -1 1 6 8 7 -1
14 3 3 3 0 0 9 9 7 -2 -2 9 9 8 -1
15 4 8 4 -4 0 3 8 3 -5 0 2 3 6 3
16 8 8 8 0 0 9 9 9 0 0 9 9 7 -2
17 6 8 6 -2 0 7 8 6 -2 -1 6 9 5 -4
18 5 7 7 0 2 4 7 7 0 3 5 8 8 0
19 6 8 5 -3 -1 7 7 6 -1 -1 6 9 3 -6
20 4 4 3 -1 -1 9 9 3 -6 -6 7 7 7 0
21 5 9 7 -2 2 5 9 8 -1 3 5 8 8 0
22 5 9 6 -3 1 5 8 7 -1 2 6 8 6 -2
23 5 9 7 -2 2 5 8 8 0 3 5 9 6 -3
24 6 9 8 -1 2 5 9 7 -2 2 5 7 7 0
25 5 9 7 -2 2 5 8 7 -1 2 5 9 6 -3
Total 139 176 150 -26 11 161 196 167 -29 6 154 193 158 -35
Mean 5.56 7.04 6 -1.04 0.44 6.44 7.84 6.68 -1.16 0.24 6.16 7.72 6.32 -1.4
www.final-yearprojects.co.cc | www.troubleshoot4free.com/fyp/
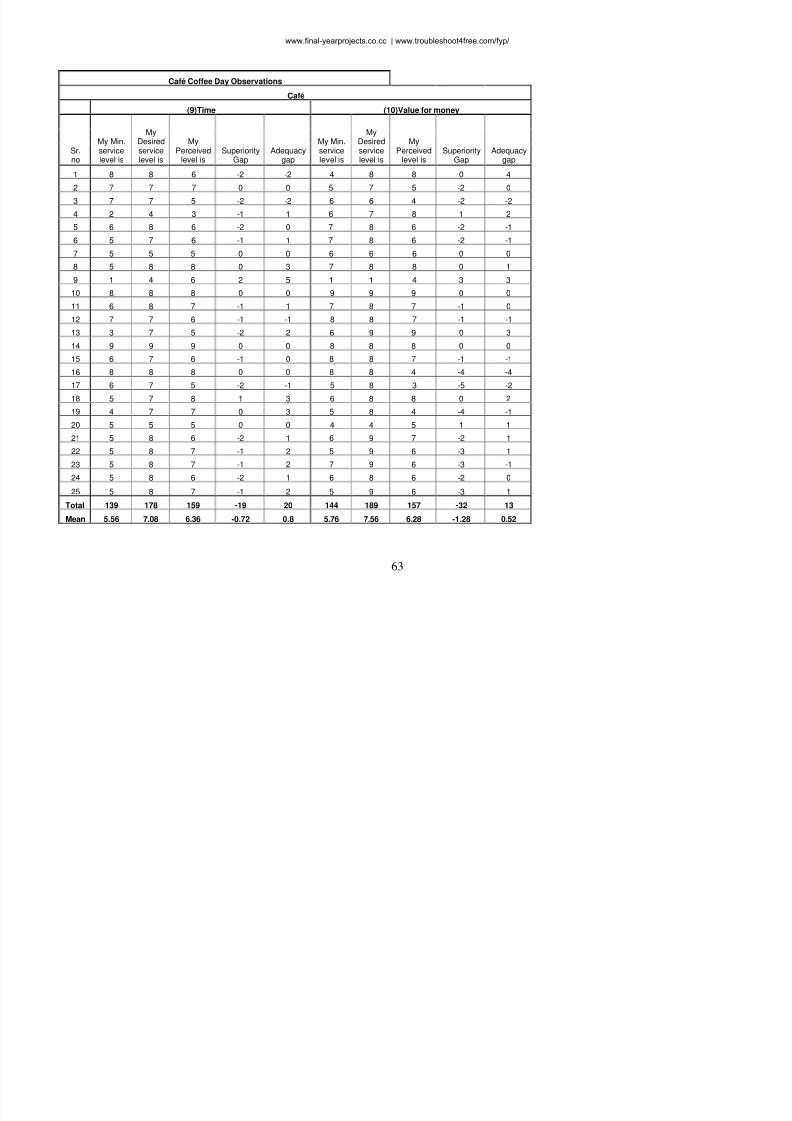
8/3/2019 Fyp-importance-Aspects-overall Satisfaction_ Buying Behavior and Loyalty
http://slidepdf.com/reader/full/fyp-importance-aspects-overall-satisfaction-buying-behavior-and-loyalty 66/98
63
Café Coffee Day Observations
Café
(9)Time (10)Value for money
Sr.no
My Min.servicelevel is
MyDesiredservicelevel is
MyPerceived
level is Superiority
Gap Adequacy
gap
My Min.servicelevel is
MyDesiredservicelevel is
MyPerceived
level is Superiority
Gap Adequacy
gap
1 8 8 6 -2 -2 4 8 8 0 4
2 7 7 7 0 0 5 7 5 -2 0
3 7 7 5 -2 -2 6 6 4 -2 -2
4 2 4 3 -1 1 6 7 8 1 2
5 6 8 6 -2 0 7 8 6 -2 -1
6 5 7 6 -1 1 7 8 6 -2 -1
7 5 5 5 0 0 6 6 6 0 0
8 5 8 8 0 3 7 8 8 0 1
9 1 4 6 2 5 1 1 4 3 3
10 8 8 8 0 0 9 9 9 0 0
11 6 8 7 -1 1 7 8 7 -1 0
12 7 7 6 -1 -1 8 8 7 -1 -1
13 3 7 5 -2 2 6 9 9 0 3
14 9 9 9 0 0 8 8 8 0 0
15 6 7 6 -1 0 8 8 7 -1 -1
16 8 8 8 0 0 8 8 4 -4 -4
17 6 7 5 -2 -1 5 8 3 -5 -2
18 5 7 8 1 3 6 8 8 0 2
19 4 7 7 0 3 5 8 4 -4 -1
20 5 5 5 0 0 4 4 5 1 1
21 5 8 6 -2 1 6 9 7 -2 1
22 5 8 7 -1 2 5 9 6 -3 1
23 5 8 7 -1 2 7 9 6 -3 -1
24 5 8 6 -2 1 6 8 6 -2 0
25 5 8 7 -1 2 5 9 6 -3 1
Total 139 178 159 -19 20 144 189 157 -32 13
Mean 5.56 7.08 6.36 -0.72 0.8 5.76 7.56 6.28 -1.28 0.52
www.final-yearprojects.co.cc | www.troubleshoot4free.com/fyp/
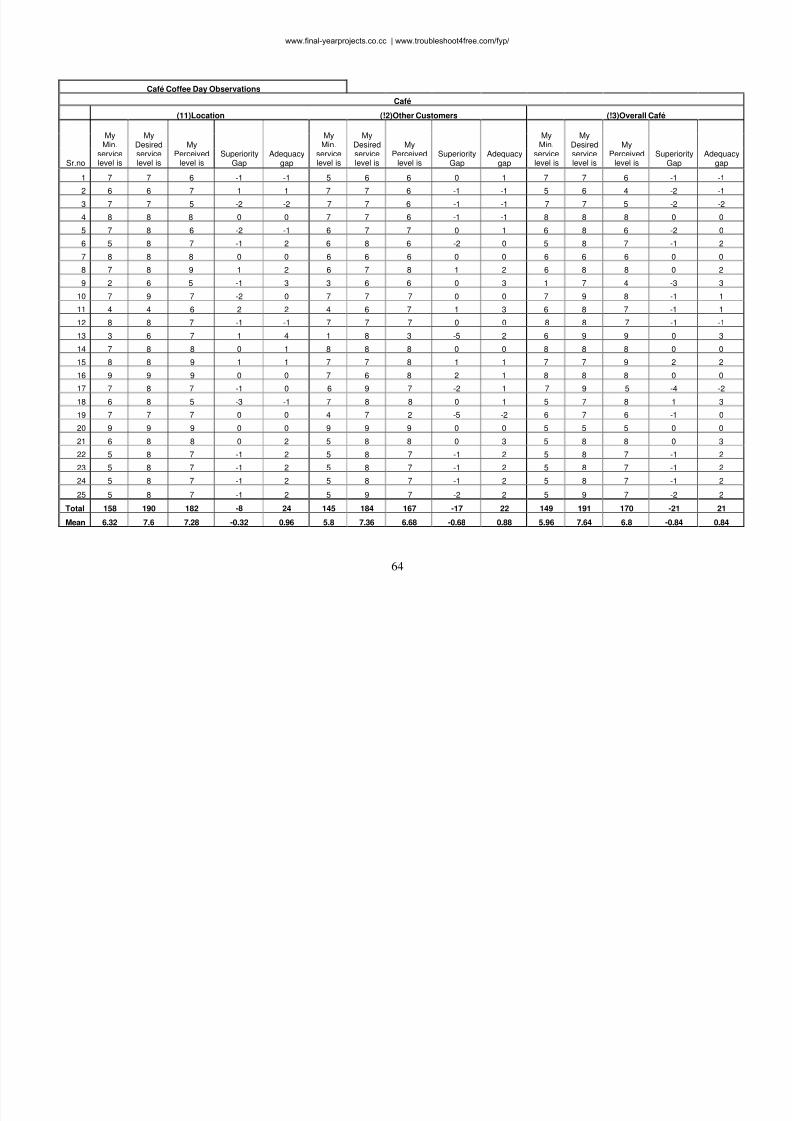
8/3/2019 Fyp-importance-Aspects-overall Satisfaction_ Buying Behavior and Loyalty
http://slidepdf.com/reader/full/fyp-importance-aspects-overall-satisfaction-buying-behavior-and-loyalty 67/98
64
Café Coffee Day Observations
Café
(11)Location (!2)Other Customers (!3)Overall Café
Sr.no
MyMin.
servicelevel is
MyDesiredservicelevel is
MyPerceived
level is Superiority
Gap Adequacy
gap
MyMin.
servicelevel is
MyDesiredservicelevel is
MyPerceived
level is Superiority
Gap Adequacy
gap
MyMin.
servicelevel is
MyDesiredservicelevel is
MyPerceived
level is Superiority
Gap Adequacy
gap
1 7 7 6 -1 -1 5 6 6 0 1 7 7 6 -1 -1
2 6 6 7 1 1 7 7 6 -1 -1 5 6 4 -2 -1
3 7 7 5 -2 -2 7 7 6 -1 -1 7 7 5 -2 -2
4 8 8 8 0 0 7 7 6 -1 -1 8 8 8 0 0
5 7 8 6 -2 -1 6 7 7 0 1 6 8 6 -2 0
6 5 8 7 -1 2 6 8 6 -2 0 5 8 7 -1 2
7 8 8 8 0 0 6 6 6 0 0 6 6 6 0 0
8 7 8 9 1 2 6 7 8 1 2 6 8 8 0 2
9 2 6 5 -1 3 3 6 6 0 3 1 7 4 -3 3
10 7 9 7 -2 0 7 7 7 0 0 7 9 8 -1 1
11 4 4 6 2 2 4 6 7 1 3 6 8 7 -1 1
12 8 8 7 -1 -1 7 7 7 0 0 8 8 7 -1 -1
13 3 6 7 1 4 1 8 3 -5 2 6 9 9 0 3
14 7 8 8 0 1 8 8 8 0 0 8 8 8 0 0
15 8 8 9 1 1 7 7 8 1 1 7 7 9 2 2
16 9 9 9 0 0 7 6 8 2 1 8 8 8 0 0
17 7 8 7 -1 0 6 9 7 -2 1 7 9 5 -4 -218 6 8 5 -3 -1 7 8 8 0 1 5 7 8 1 3
19 7 7 7 0 0 4 7 2 -5 -2 6 7 6 -1 0
20 9 9 9 0 0 9 9 9 0 0 5 5 5 0 0
21 6 8 8 0 2 5 8 8 0 3 5 8 8 0 3
22 5 8 7 -1 2 5 8 7 -1 2 5 8 7 -1 2
23 5 8 7 -1 2 5 8 7 -1 2 5 8 7 -1 2
24 5 8 7 -1 2 5 8 7 -1 2 5 8 7 -1 2
25 5 8 7 -1 2 5 9 7 -2 2 5 9 7 -2 2
Total 158 190 182 -8 24 145 184 167 -17 22 149 191 170 -21 21
Mean 6.32 7.6 7.28 -0.32 0.96 5.8 7.36 6.68 -0.68 0.88 5.96 7.64 6.8 -0.84 0.84
www.final-yearprojects.co.cc | www.troubleshoot4free.com/fyp/
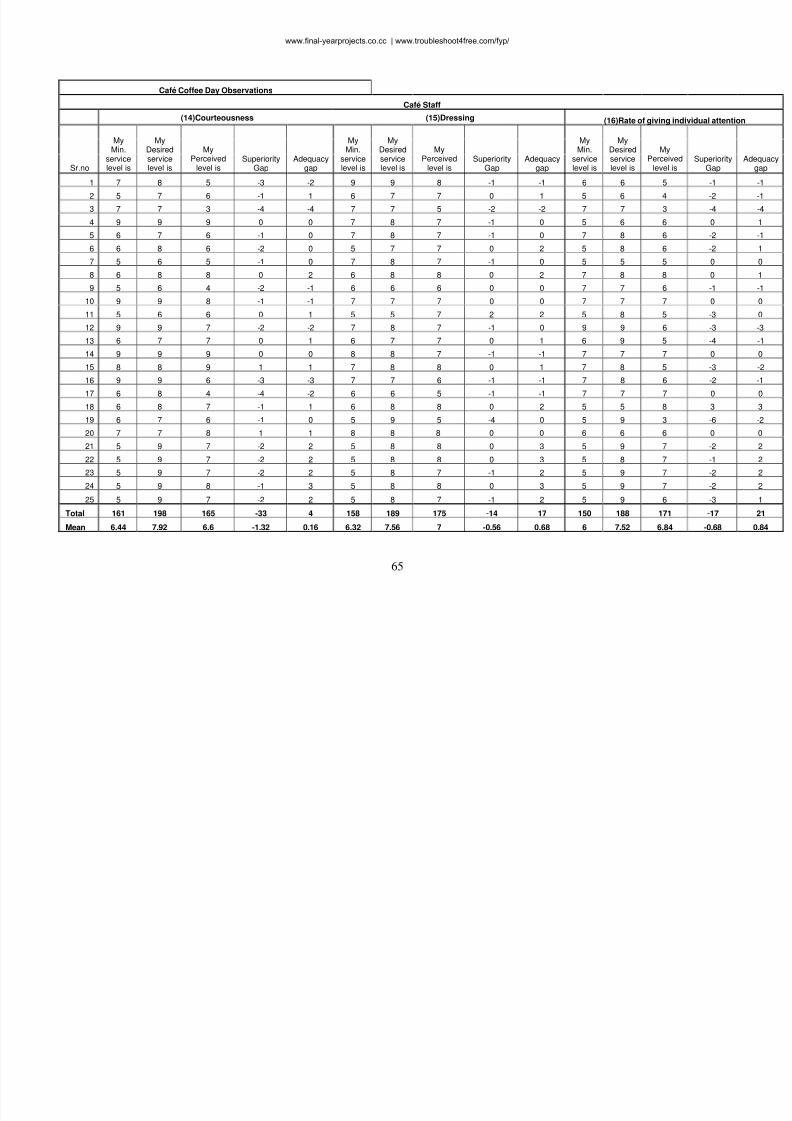
8/3/2019 Fyp-importance-Aspects-overall Satisfaction_ Buying Behavior and Loyalty
http://slidepdf.com/reader/full/fyp-importance-aspects-overall-satisfaction-buying-behavior-and-loyalty 68/98
65
Café Coffee Day Observations
Café Staff
(14)Courteousness (15)Dressing (16)Rate of giving individual attentio
Sr.no
MyMin.
servicelevel is
MyDesiredservicelevel is
MyPerceived
level is Superiority
Gap Adequacy
gap
MyMin.
servicelevel is
MyDesiredservicelevel is
MyPerceived
level is Superiority
Gap Adequacy
gap
MyMin.
servicelevel is
MyDesiredservicelevel is
MyPerceived
level is Superiority
Gap
1 7 8 5 -3 -2 9 9 8 -1 -1 6 6 5 -1
2 5 7 6 -1 1 6 7 7 0 1 5 6 4 -2 3 7 7 3 -4 -4 7 7 5 -2 -2 7 7 3 -4
4 9 9 9 0 0 7 8 7 -1 0 5 6 6 0
5 6 7 6 -1 0 7 8 7 -1 0 7 8 6 -2
6 6 8 6 -2 0 5 7 7 0 2 5 8 6 -2
7 5 6 5 -1 0 7 8 7 -1 0 5 5 5 0
8 6 8 8 0 2 6 8 8 0 2 7 8 8 0
9 5 6 4 -2 -1 6 6 6 0 0 7 7 6 -1
10 9 9 8 -1 -1 7 7 7 0 0 7 7 7 0
11 5 6 6 0 1 5 5 7 2 2 5 8 5 -3
12 9 9 7 -2 -2 7 8 7 -1 0 9 9 6 -3
13 6 7 7 0 1 6 7 7 0 1 6 9 5 -4
14 9 9 9 0 0 8 8 7 -1 -1 7 7 7 0
15 8 8 9 1 1 7 8 8 0 1 7 8 5 -3
16 9 9 6 -3 -3 7 7 6 -1 -1 7 8 6 -2
17 6 8 4 -4 -2 6 6 5 -1 -1 7 7 7 0
18 6 8 7 -1 1 6 8 8 0 2 5 5 8 3
19 6 7 6 -1 0 5 9 5 -4 0 5 9 3 -6
20 7 7 8 1 1 8 8 8 0 0 6 6 6 0
21 5 9 7 -2 2 5 8 8 0 3 5 9 7 -2
22 5 9 7 -2 2 5 8 8 0 3 5 8 7 -1
23 5 9 7 -2 2 5 8 7 -1 2 5 9 7 -2
24 5 9 8 -1 3 5 8 8 0 3 5 9 7 -2
25 5 9 7 -2 2 5 8 7 -1 2 5 9 6 -3
Total 161 198 165 -33 4 158 189 175 -14 17 150 188 171 -17
Mean 6.44 7.92 6.6 -1.32 0.16 6.32 7.56 7 -0.56 0.68 6 7.52 6.84 -0.68
www.final-yearprojects.co.cc | www.troubleshoot4free.com/fyp/
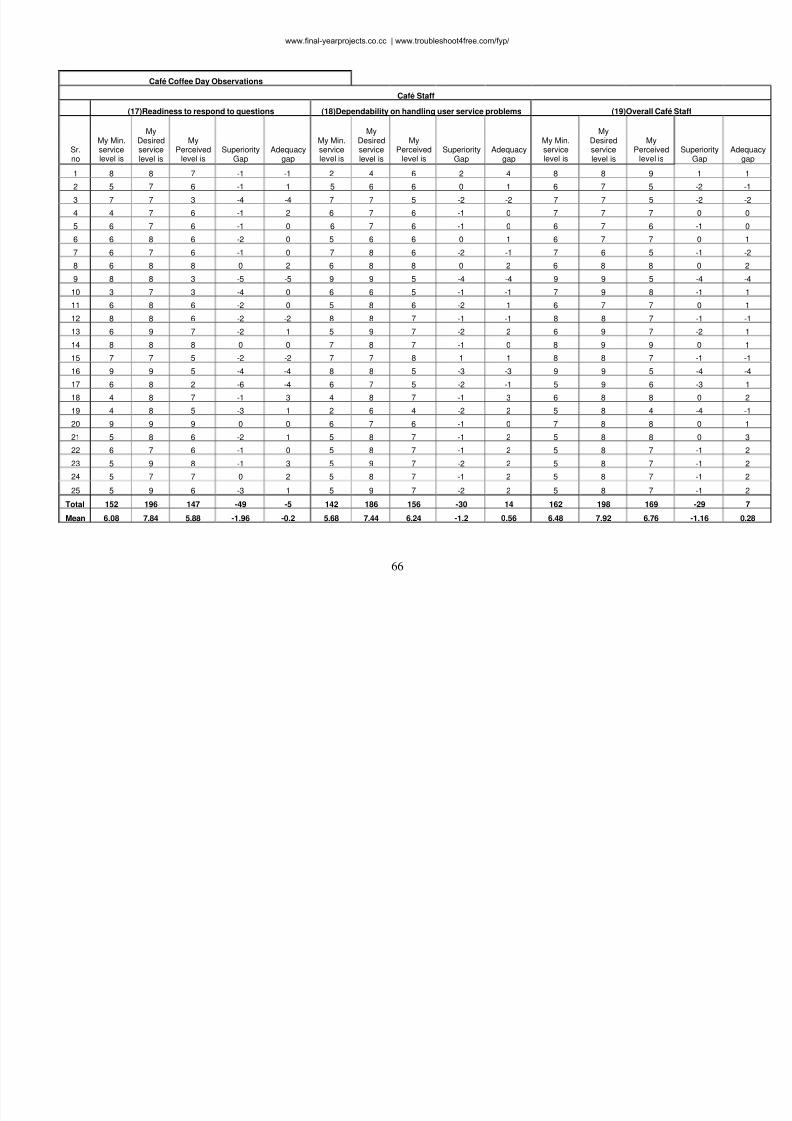
8/3/2019 Fyp-importance-Aspects-overall Satisfaction_ Buying Behavior and Loyalty
http://slidepdf.com/reader/full/fyp-importance-aspects-overall-satisfaction-buying-behavior-and-loyalty 69/98
66
Café Coffee Day Observations
Café Staff
(17)Readiness to respond to questions (18)Dependability on handling user service problems (19)Overall Café Staff
Sr.no
My Min.servicelevel is
MyDesiredservicelevel is
MyPerceived
level is Superiority
Gap Adequacy
gap
My Min.servicelevel is
MyDesiredservicelevel is
MyPerceived
level is Superiority
Gap Adequacy
gap
My Min.servicelevel is
MyDesiredservicelevel is
MyPerceived
level is Superiority
Gap Ade
1 8 8 7 -1 -1 2 4 6 2 4 8 8 9 1
2 5 7 6 -1 1 5 6 6 0 1 6 7 5 -2
3 7 7 3 -4 -4 7 7 5 -2 -2 7 7 5 -2
4 4 7 6 -1 2 6 7 6 -1 0 7 7 7 0
5 6 7 6 -1 0 6 7 6 -1 0 6 7 6 -1
6 6 8 6 -2 0 5 6 6 0 1 6 7 7 0
7 6 7 6 -1 0 7 8 6 -2 -1 7 6 5 -1
8 6 8 8 0 2 6 8 8 0 2 6 8 8 0
9 8 8 3 -5 -5 9 9 5 -4 -4 9 9 5 -4
10 3 7 3 -4 0 6 6 5 -1 -1 7 9 8 -1
11 6 8 6 -2 0 5 8 6 -2 1 6 7 7 0
12 8 8 6 -2 -2 8 8 7 -1 -1 8 8 7 -1
13 6 9 7 -2 1 5 9 7 -2 2 6 9 7 -2
14 8 8 8 0 0 7 8 7 -1 0 8 9 9 0
15 7 7 5 -2 -2 7 7 8 1 1 8 8 7 -1
16 9 9 5 -4 -4 8 8 5 -3 -3 9 9 5 -4
17 6 8 2 -6 -4 6 7 5 -2 -1 5 9 6 -3
18 4 8 7 -1 3 4 8 7 -1 3 6 8 8 0
19 4 8 5 -3 1 2 6 4 -2 2 5 8 4 -4
20 9 9 9 0 0 6 7 6 -1 0 7 8 8 0
21 5 8 6 -2 1 5 8 7 -1 2 5 8 8 0
22 6 7 6 -1 0 5 8 7 -1 2 5 8 7 -1
23 5 9 8 -1 3 5 9 7 -2 2 5 8 7 -1
24 5 7 7 0 2 5 8 7 -1 2 5 8 7 -1
25 5 9 6 -3 1 5 9 7 -2 2 5 8 7 -1
Total 152 196 147 -49 -5 142 186 156 -30 14 162 198 169 -29
Mean 6.08 7.84 5.88 -1.96 -0.2 5.68 7.44 6.24 -1.2 0.56 6.48 7.92 6.76 -1.16 0
www.final-yearprojects.co.cc | www.troubleshoot4free.com/fyp/
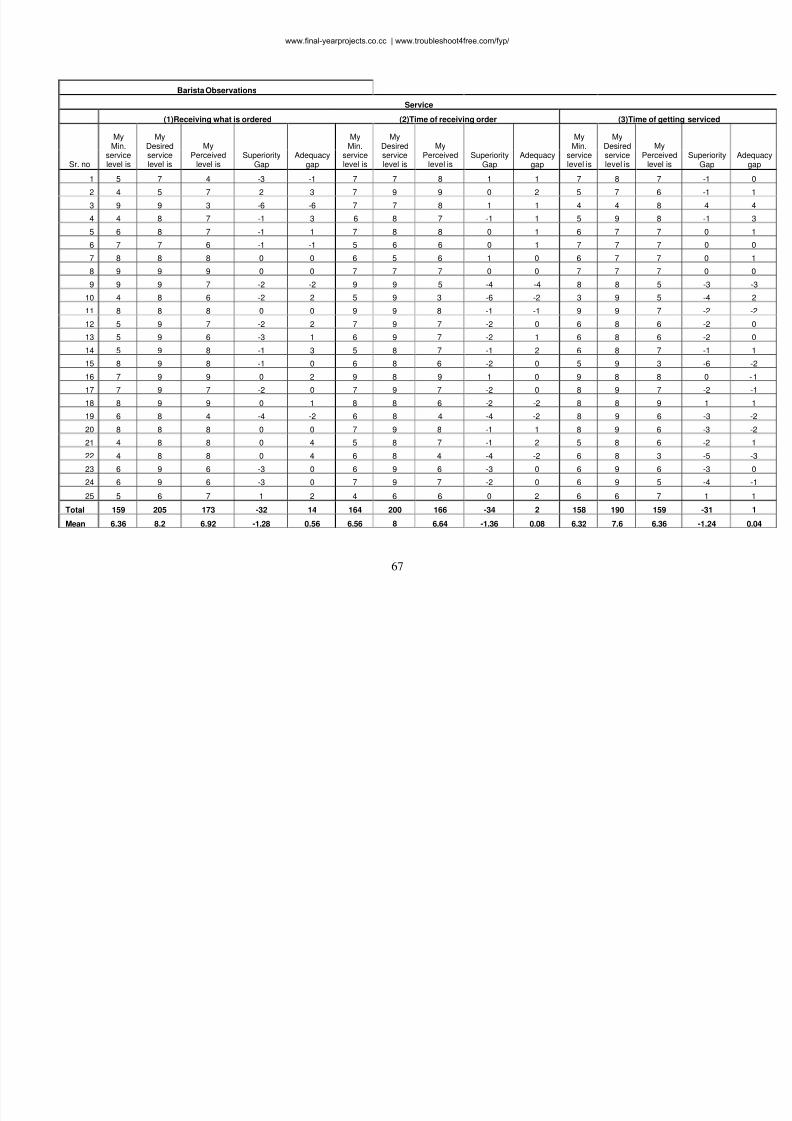
8/3/2019 Fyp-importance-Aspects-overall Satisfaction_ Buying Behavior and Loyalty
http://slidepdf.com/reader/full/fyp-importance-aspects-overall-satisfaction-buying-behavior-and-loyalty 70/98
67
Barista Observations
Service
(1)Receiving what is ordered (2)Time of receiving order (3)Time of getting serviced
Sr. no
MyMin.
servicelevel is
MyDesiredservicelevel is
MyPerceived
level is Superiority
Gap Adequacy
gap
MyMin.
servicelevel is
MyDesiredservicelevel is
MyPerceived
level is Superiority
Gap Adequacy
gap
MyMin.
servicelevel is
MyDesiredservicelevel is
MyPerceived
level is Superiority
Gap A
1 5 7 4 -3 -1 7 7 8 1 1 7 8 7 -1
2 4 5 7 2 3 7 9 9 0 2 5 7 6 -1 3 9 9 3 -6 -6 7 7 8 1 1 4 4 8 4
4 4 8 7 -1 3 6 8 7 -1 1 5 9 8 -1
5 6 8 7 -1 1 7 8 8 0 1 6 7 7 0
6 7 7 6 -1 -1 5 6 6 0 1 7 7 7 0
7 8 8 8 0 0 6 5 6 1 0 6 7 7 0
8 9 9 9 0 0 7 7 7 0 0 7 7 7 0
9 9 9 7 -2 -2 9 9 5 -4 -4 8 8 5 -3
10 4 8 6 -2 2 5 9 3 -6 -2 3 9 5 -4
11 8 8 8 0 0 9 9 8 -1 -1 9 9 7 -2
12 5 9 7 -2 2 7 9 7 -2 0 6 8 6 -2
13 5 9 6 -3 1 6 9 7 -2 1 6 8 6 -2
14 5 9 8 -1 3 5 8 7 -1 2 6 8 7 -1
15 8 9 8 -1 0 6 8 6 -2 0 5 9 3 -6
16 7 9 9 0 2 9 8 9 1 0 9 8 8 0
17 7 9 7 -2 0 7 9 7 -2 0 8 9 7 -2 18 8 9 9 0 1 8 8 6 -2 -2 8 8 9 1
19 6 8 4 -4 -2 6 8 4 -4 -2 8 9 6 -3
20 8 8 8 0 0 7 9 8 -1 1 8 9 6 -3
21 4 8 8 0 4 5 8 7 -1 2 5 8 6 -2
22 4 8 8 0 4 6 8 4 -4 -2 6 8 3 -5
23 6 9 6 -3 0 6 9 6 -3 0 6 9 6 -3
24 6 9 6 -3 0 7 9 7 -2 0 6 9 5 -4
25 5 6 7 1 2 4 6 6 0 2 6 6 7 1
Total 159 205 173 -32 14 164 200 166 -34 2 158 190 159 -31
Mean 6.36 8.2 6.92 -1.28 0.56 6.56 8 6.64 -1.36 0.08 6.32 7.6 6.36 -1.24
www.final-yearprojects.co.cc | www.troubleshoot4free.com/fyp/
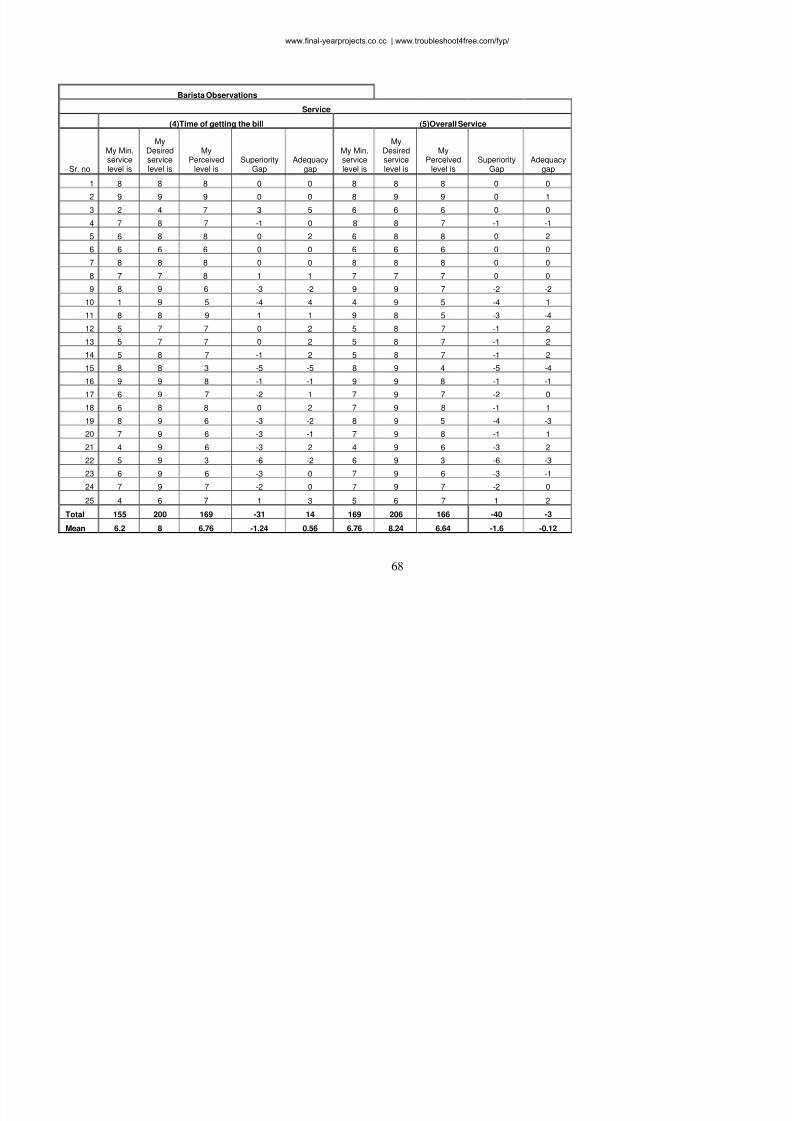
8/3/2019 Fyp-importance-Aspects-overall Satisfaction_ Buying Behavior and Loyalty
http://slidepdf.com/reader/full/fyp-importance-aspects-overall-satisfaction-buying-behavior-and-loyalty 71/98
68
Barista Observations
Service
(4)Time of getting the bill (5)Overall Service
Sr. no
My Min.servicelevel is
MyDesiredservicelevel is
MyPerceived
level is Superiority
Gap Adequacy
gap
My Min.servicelevel is
MyDesiredservicelevel is
MyPerceived
level is Superiority
Gap Adequacy
gap
1 8 8 8 0 0 8 8 8 0 0
2 9 9 9 0 0 8 9 9 0 1
3 2 4 7 3 5 6 6 6 0 0
4 7 8 7 -1 0 8 8 7 -1 -1
5 6 8 8 0 2 6 8 8 0 2
6 6 6 6 0 0 6 6 6 0 0
7 8 8 8 0 0 8 8 8 0 0
8 7 7 8 1 1 7 7 7 0 0
9 8 9 6 -3 -2 9 9 7 -2 -2
10 1 9 5 -4 4 4 9 5 -4 1
11 8 8 9 1 1 9 8 5 -3 -4
12 5 7 7 0 2 5 8 7 -1 2
13 5 7 7 0 2 5 8 7 -1 2
14 5 8 7 -1 2 5 8 7 -1 2
15 8 8 3 -5 -5 8 9 4 -5 -4
16 9 9 8 -1 -1 9 9 8 -1 -1
17 6 9 7 -2 1 7 9 7 -2 0
18 6 8 8 0 2 7 9 8 -1 1
19 8 9 6 -3 -2 8 9 5 -4 -3
20 7 9 6 -3 -1 7 9 8 -1 1
21 4 9 6 -3 2 4 9 6 -3 2
22 5 9 3 -6 -2 6 9 3 -6 -3
23 6 9 6 -3 0 7 9 6 -3 -1
24 7 9 7 -2 0 7 9 7 -2 0
25 4 6 7 1 3 5 6 7 1 2
Total 155 200 169 -31 14 169 206 166 -40 -3
Mean 6.2 8 6.76 -1.24 0.56 6.76 8.24 6.64 -1.6 -0.12
www.final-yearprojects.co.cc | www.troubleshoot4free.com/fyp/
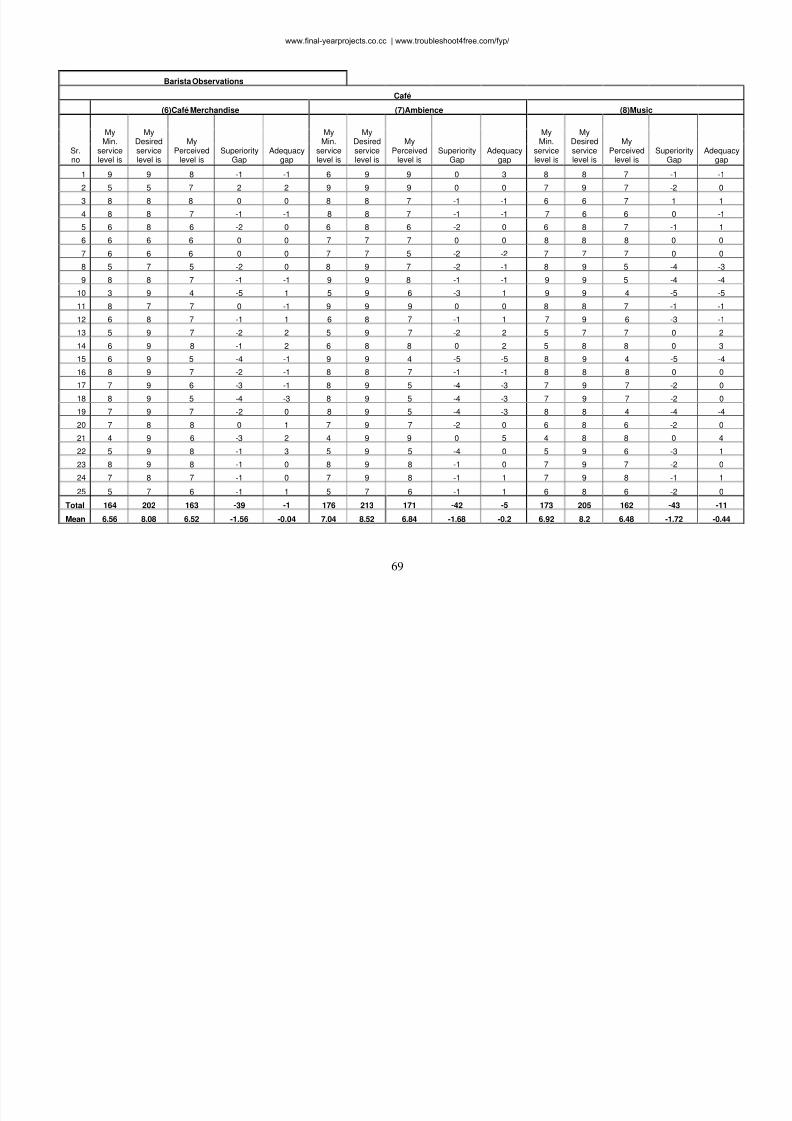
8/3/2019 Fyp-importance-Aspects-overall Satisfaction_ Buying Behavior and Loyalty
http://slidepdf.com/reader/full/fyp-importance-aspects-overall-satisfaction-buying-behavior-and-loyalty 72/98
69
Barista Observations
Café
(6)Café Merchandise (7)Ambience (8)Music
Sr.no
MyMin.
servicelevel is
MyDesiredservicelevel is
MyPerceived
level is Superiority
Gap Adequacy
gap
MyMin.
servicelevel is
MyDesiredservicelevel is
MyPerceived
level is Superiority
Gap Adequacy
gap
MyMin.
servicelevel is
MyDesiredservicelevel is
MyPerceived
level is Superiority
Gap Adequacy
gap
1 9 9 8 -1 -1 6 9 9 0 3 8 8 7 -1 -1
2 5 5 7 2 2 9 9 9 0 0 7 9 7 -2 0
3 8 8 8 0 0 8 8 7 -1 -1 6 6 7 1 1
4 8 8 7 -1 -1 8 8 7 -1 -1 7 6 6 0 -1
5 6 8 6 -2 0 6 8 6 -2 0 6 8 7 -1 1
6 6 6 6 0 0 7 7 7 0 0 8 8 8 0 0
7 6 6 6 0 0 7 7 5 -2 -2 7 7 7 0 0
8 5 7 5 -2 0 8 9 7 -2 -1 8 9 5 -4 -3
9 8 8 7 -1 -1 9 9 8 -1 -1 9 9 5 -4 -4
10 3 9 4 -5 1 5 9 6 -3 1 9 9 4 -5 -5
11 8 7 7 0 -1 9 9 9 0 0 8 8 7 -1 -1
12 6 8 7 -1 1 6 8 7 -1 1 7 9 6 -3 -1
13 5 9 7 -2 2 5 9 7 -2 2 5 7 7 0 2
14 6 9 8 -1 2 6 8 8 0 2 5 8 8 0 3
15 6 9 5 -4 -1 9 9 4 -5 -5 8 9 4 -5 -4
16 8 9 7 -2 -1 8 8 7 -1 -1 8 8 8 0 0
17 7 9 6 -3 -1 8 9 5 -4 -3 7 9 7 -2 0
18 8 9 5 -4 -3 8 9 5 -4 -3 7 9 7 -2 0
19 7 9 7 -2 0 8 9 5 -4 -3 8 8 4 -4 -4
20 7 8 8 0 1 7 9 7 -2 0 6 8 6 -2 0
21 4 9 6 -3 2 4 9 9 0 5 4 8 8 0 4
22 5 9 8 -1 3 5 9 5 -4 0 5 9 6 -3 1
23 8 9 8 -1 0 8 9 8 -1 0 7 9 7 -2 0
24 7 8 7 -1 0 7 9 8 -1 1 7 9 8 -1 1
25 5 7 6 -1 1 5 7 6 -1 1 6 8 6 -2 0
Total 164 202 163 -39 -1 176 213 171 -42 -5 173 205 162 -43 -11
Mean 6.56 8.08 6.52 -1.56 -0.04 7.04 8.52 6.84 -1.68 -0.2 6.92 8.2 6.48 -1.72 -0.44
www.final-yearprojects.co.cc | www.troubleshoot4free.com/fyp/
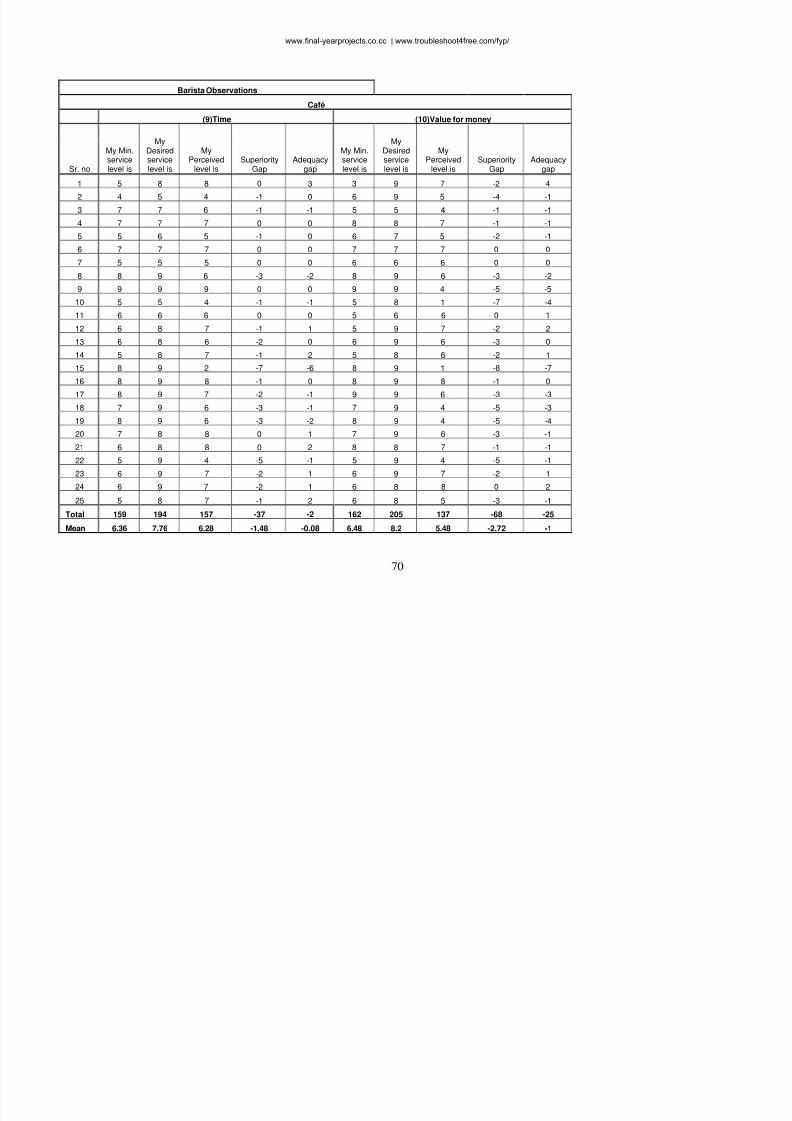
8/3/2019 Fyp-importance-Aspects-overall Satisfaction_ Buying Behavior and Loyalty
http://slidepdf.com/reader/full/fyp-importance-aspects-overall-satisfaction-buying-behavior-and-loyalty 73/98
70
Barista Observations
Café
(9)Time (10)Value for money
Sr. no
My Min.servicelevel is
MyDesiredservicelevel is
MyPerceived
level is Superiority
Gap Adequacy
gap
My Min.servicelevel is
MyDesiredservicelevel is
MyPerceived
level is Superiority
Gap Adequacy
gap
1 5 8 8 0 3 3 9 7 -2 4
2 4 5 4 -1 0 6 9 5 -4 -1
3 7 7 6 -1 -1 5 5 4 -1 -1
4 7 7 7 0 0 8 8 7 -1 -1
5 5 6 5 -1 0 6 7 5 -2 -1
6 7 7 7 0 0 7 7 7 0 0
7 5 5 5 0 0 6 6 6 0 0
8 8 9 6 -3 -2 8 9 6 -3 -2
9 9 9 9 0 0 9 9 4 -5 -5
10 5 5 4 -1 -1 5 8 1 -7 -4
11 6 6 6 0 0 5 6 6 0 1
12 6 8 7 -1 1 5 9 7 -2 2
13 6 8 6 -2 0 6 9 6 -3 0
14 5 8 7 -1 2 5 8 6 -2 1
15 8 9 2 -7 -6 8 9 1 -8 -7
16 8 9 8 -1 0 8 9 8 -1 0
17 8 9 7 -2 -1 9 9 6 -3 -3
18 7 9 6 -3 -1 7 9 4 -5 -3
19 8 9 6 -3 -2 8 9 4 -5 -4
20 7 8 8 0 1 7 9 6 -3 -1
21 6 8 8 0 2 8 8 7 -1 -1
22 5 9 4 -5 -1 5 9 4 -5 -1
23 6 9 7 -2 1 6 9 7 -2 1
24 6 9 7 -2 1 6 8 8 0 2
25 5 8 7 -1 2 6 8 5 -3 -1
Total 159 194 157 -37 -2 162 205 137 -68 -25
Mean 6.36 7.76 6.28 -1.48 -0.08 6.48 8.2 5.48 -2.72 -1
www.final-yearprojects.co.cc | www.troubleshoot4free.com/fyp/
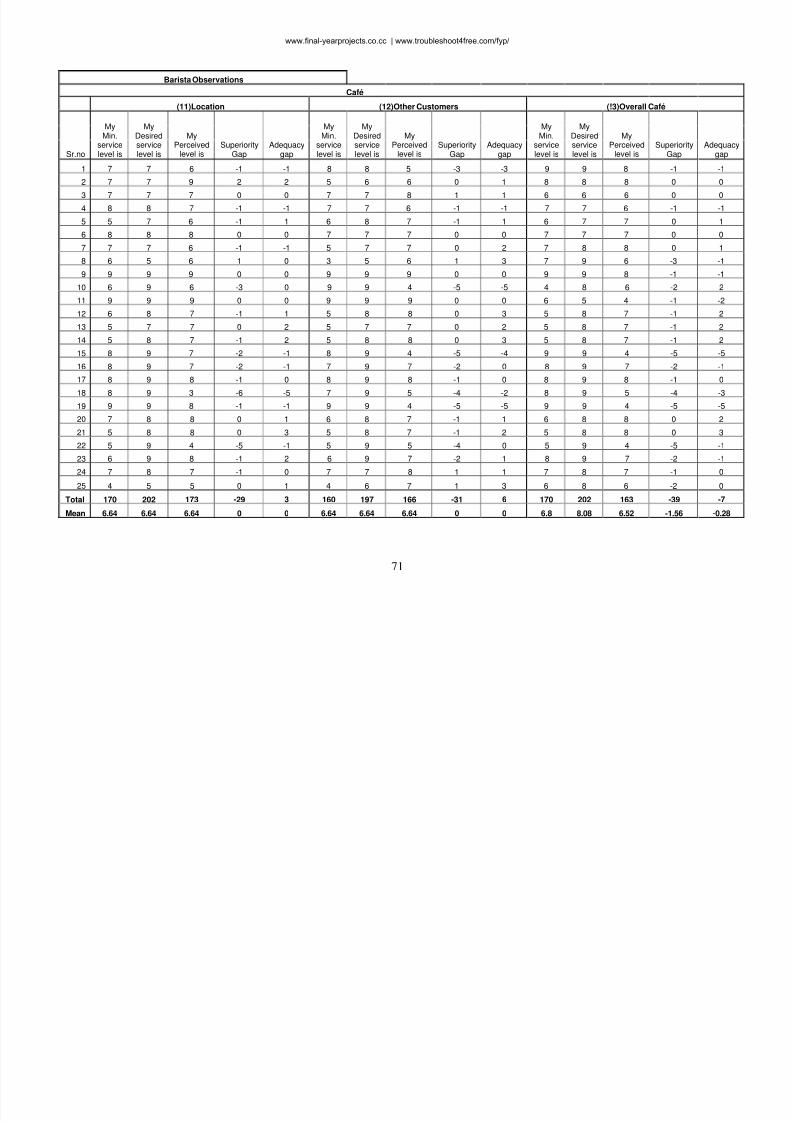
8/3/2019 Fyp-importance-Aspects-overall Satisfaction_ Buying Behavior and Loyalty
http://slidepdf.com/reader/full/fyp-importance-aspects-overall-satisfaction-buying-behavior-and-loyalty 74/98
71
Barista Observations
Café
(11)Location (12)Other Customers (!3)Overall Café
Sr.no
MyMin.
servicelevel is
MyDesiredservicelevel is
MyPerceived
level is Superiority
Gap Adequacy
gap
MyMin.
servicelevel is
MyDesiredservicelevel is
MyPerceived
level is Superiority
Gap Adequacy
gap
MyMin.
servicelevel is
MyDesiredservicelevel is
MyPerceived
level is Superiority
Gap Adequacy
gap
1 7 7 6 -1 -1 8 8 5 -3 -3 9 9 8 -1 -1
2 7 7 9 2 2 5 6 6 0 1 8 8 8 0 0
3 7 7 7 0 0 7 7 8 1 1 6 6 6 0 04 8 8 7 -1 -1 7 7 6 -1 -1 7 7 6 -1 -1
5 5 7 6 -1 1 6 8 7 -1 1 6 7 7 0 1
6 8 8 8 0 0 7 7 7 0 0 7 7 7 0 0
7 7 7 6 -1 -1 5 7 7 0 2 7 8 8 0 1
8 6 5 6 1 0 3 5 6 1 3 7 9 6 -3 -1
9 9 9 9 0 0 9 9 9 0 0 9 9 8 -1 -1
10 6 9 6 -3 0 9 9 4 -5 -5 4 8 6 -2 2
11 9 9 9 0 0 9 9 9 0 0 6 5 4 -1 -2
12 6 8 7 -1 1 5 8 8 0 3 5 8 7 -1 2
13 5 7 7 0 2 5 7 7 0 2 5 8 7 -1 2
14 5 8 7 -1 2 5 8 8 0 3 5 8 7 -1 2
15 8 9 7 -2 -1 8 9 4 -5 -4 9 9 4 -5 -5
16 8 9 7 -2 -1 7 9 7 -2 0 8 9 7 -2 -1
17 8 9 8 -1 0 8 9 8 -1 0 8 9 8 -1 0
18 8 9 3 -6 -5 7 9 5 -4 -2 8 9 5 -4 -3
19 9 9 8 -1 -1 9 9 4 -5 -5 9 9 4 -5 -5
20 7 8 8 0 1 6 8 7 -1 1 6 8 8 0 2
21 5 8 8 0 3 5 8 7 -1 2 5 8 8 0 3
22 5 9 4 -5 -1 5 9 5 -4 0 5 9 4 -5 -1
23 6 9 8 -1 2 6 9 7 -2 1 8 9 7 -2 -1
24 7 8 7 -1 0 7 7 8 1 1 7 8 7 -1 0
25 4 5 5 0 1 4 6 7 1 3 6 8 6 -2 0
Total 170 202 173 -29 3 160 197 166 -31 6 170 202 163 -39 -7
Mean 6.64 6.64 6.64 0 0 6.64 6.64 6.64 0 0 6.8 8.08 6.52 -1.56 -0.28
www.final-yearprojects.co.cc | www.troubleshoot4free.com/fyp/
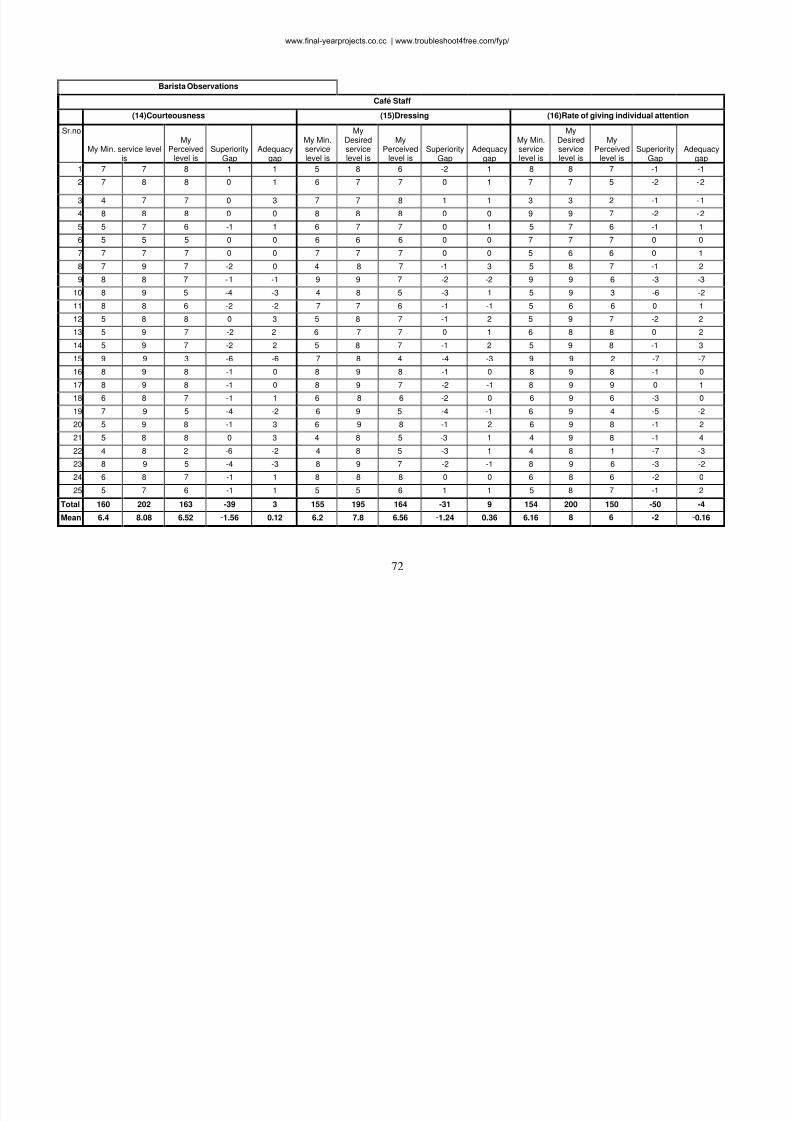
8/3/2019 Fyp-importance-Aspects-overall Satisfaction_ Buying Behavior and Loyalty
http://slidepdf.com/reader/full/fyp-importance-aspects-overall-satisfaction-buying-behavior-and-loyalty 75/98
72
Barista Observations
Café Staff
(14)Courteousness (15)Dressing (16)Rate of giving individual attention
Sr.no
My Min. service levelis
MyPerceived
level is Superiority
Gap Adequacy
gap
My Min.servicelevel is
MyDesiredservicelevel is
MyPerceived
level is Superiority
Gap Adequacy
gap
My Min.servicelevel is
MyDesiredservicelevel is
MyPerceived
level is Superiority
Gap Adequacy
gap
1 7 7 8 1 1 5 8 6 -2 1 8 8 7 -1 -1
2 7 8 8 0 1 6 7 7 0 1 7 7 5 -2 -2
3 4 7 7 0 3 7 7 8 1 1 3 3 2 -1 -1
4 8 8 8 0 0 8 8 8 0 0 9 9 7 -2 -2
5 5 7 6 -1 1 6 7 7 0 1 5 7 6 -1 1
6 5 5 5 0 0 6 6 6 0 0 7 7 7 0 0
7 7 7 7 0 0 7 7 7 0 0 5 6 6 0 1
8 7 9 7 -2 0 4 8 7 -1 3 5 8 7 -1 2
9 8 8 7 -1 -1 9 9 7 -2 -2 9 9 6 -3 -3
10 8 9 5 -4 -3 4 8 5 -3 1 5 9 3 -6 -2
11 8 8 6 -2 -2 7 7 6 -1 -1 5 6 6 0 1
12 5 8 8 0 3 5 8 7 -1 2 5 9 7 -2 2
13 5 9 7 -2 2 6 7 7 0 1 6 8 8 0 2
14 5 9 7 -2 2 5 8 7 -1 2 5 9 8 -1 3
15 9 9 3 -6 -6 7 8 4 -4 -3 9 9 2 -7 -7
16 8 9 8 -1 0 8 9 8 -1 0 8 9 8 -1 0
17 8 9 8 -1 0 8 9 7 -2 -1 8 9 9 0 1
18 6 8 7 -1 1 6 8 6 -2 0 6 9 6 -3 0
19 7 9 5 -4 -2 6 9 5 -4 -1 6 9 4 -5 -2
20 5 9 8 -1 3 6 9 8 -1 2 6 9 8 -1 2
21 5 8 8 0 3 4 8 5 -3 1 4 9 8 -1 4
22 4 8 2 -6 -2 4 8 5 -3 1 4 8 1 -7 -3
23 8 9 5 -4 -3 8 9 7 -2 -1 8 9 6 -3 -2
24 6 8 7 -1 1 8 8 8 0 0 6 8 6 -2 0
25 5 7 6 -1 1 5 5 6 1 1 5 8 7 -1 2
Total 160 202 163 -39 3 155 195 164 -31 9 154 200 150 -50 -4
Mean 6.4 8.08 6.52 -1.56 0.12 6.2 7.8 6.56 -1.24 0.36 6.16 8 6 -2 -0.16
www.final-yearprojects.co.cc | www.troubleshoot4free.com/fyp/
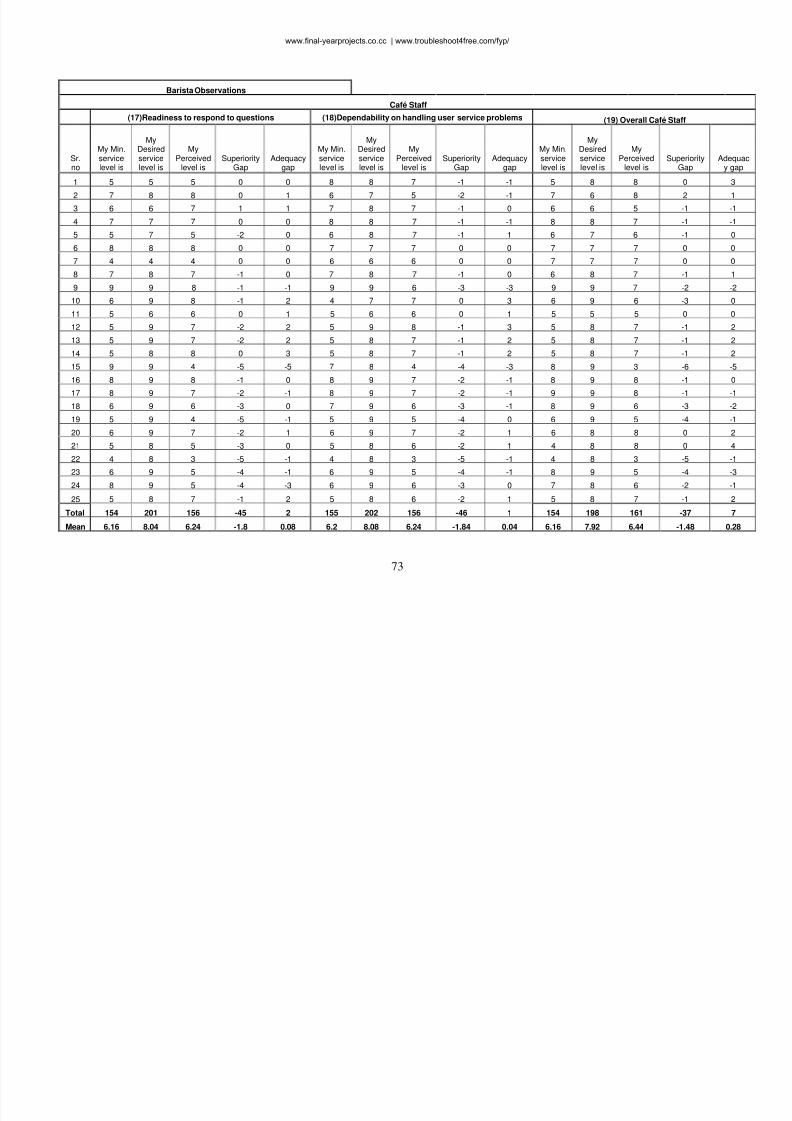
8/3/2019 Fyp-importance-Aspects-overall Satisfaction_ Buying Behavior and Loyalty
http://slidepdf.com/reader/full/fyp-importance-aspects-overall-satisfaction-buying-behavior-and-loyalty 76/98
73
Barista Observations
Café Staff
(17)Readiness to respond to questions (18)Dependability on handling user service problems (19) Overall Café Staff
Sr.no
My Min.servicelevel is
MyDesiredservicelevel is
MyPerceived
level is Superiority
Gap Adequacy
gap
My Min.servicelevel is
MyDesiredservicelevel is
MyPerceived
level is Superiority
Gap Adequacy
gap
My Min.servicelevel is
MyDesiredservicelevel is
MyPerceived
level is Superiority
Gap Adequ
y gap
1 5 5 5 0 0 8 8 7 -1 -1 5 8 8 0 3
2 7 8 8 0 1 6 7 5 -2 -1 7 6 8 2 13 6 6 7 1 1 7 8 7 -1 0 6 6 5 -1 -1
4 7 7 7 0 0 8 8 7 -1 -1 8 8 7 -1 -1
5 5 7 5 -2 0 6 8 7 -1 1 6 7 6 -1 0
6 8 8 8 0 0 7 7 7 0 0 7 7 7 0 0
7 4 4 4 0 0 6 6 6 0 0 7 7 7 0 0
8 7 8 7 -1 0 7 8 7 -1 0 6 8 7 -1 1
9 9 9 8 -1 -1 9 9 6 -3 -3 9 9 7 -2 -2
10 6 9 8 -1 2 4 7 7 0 3 6 9 6 -3 0
11 5 6 6 0 1 5 6 6 0 1 5 5 5 0 0
12 5 9 7 -2 2 5 9 8 -1 3 5 8 7 -1 2
13 5 9 7 -2 2 5 8 7 -1 2 5 8 7 -1 2
14 5 8 8 0 3 5 8 7 -1 2 5 8 7 -1 2
15 9 9 4 -5 -5 7 8 4 -4 -3 8 9 3 -6 -5
16 8 9 8 -1 0 8 9 7 -2 -1 8 9 8 -1 0
17 8 9 7 -2 -1 8 9 7 -2 -1 9 9 8 -1 -1
18 6 9 6 -3 0 7 9 6 -3 -1 8 9 6 -3 -2
19 5 9 4 -5 -1 5 9 5 -4 0 6 9 5 -4 -1
20 6 9 7 -2 1 6 9 7 -2 1 6 8 8 0 2
21 5 8 5 -3 0 5 8 6 -2 1 4 8 8 0 4
22 4 8 3 -5 -1 4 8 3 -5 -1 4 8 3 -5 -1
23 6 9 5 -4 -1 6 9 5 -4 -1 8 9 5 -4 -3
24 8 9 5 -4 -3 6 9 6 -3 0 7 8 6 -2 -1
25 5 8 7 -1 2 5 8 6 -2 1 5 8 7 -1 2
Total 154 201 156 -45 2 155 202 156 -46 1 154 198 161 -37 7
Mean 6.16 8.04 6.24 -1.8 0.08 6.2 8.08 6.24 -1.84 0.04 6.16 7.92 6.44 -1.48 0.28
www.final-yearprojects.co.cc | www.troubleshoot4free.com/fyp/
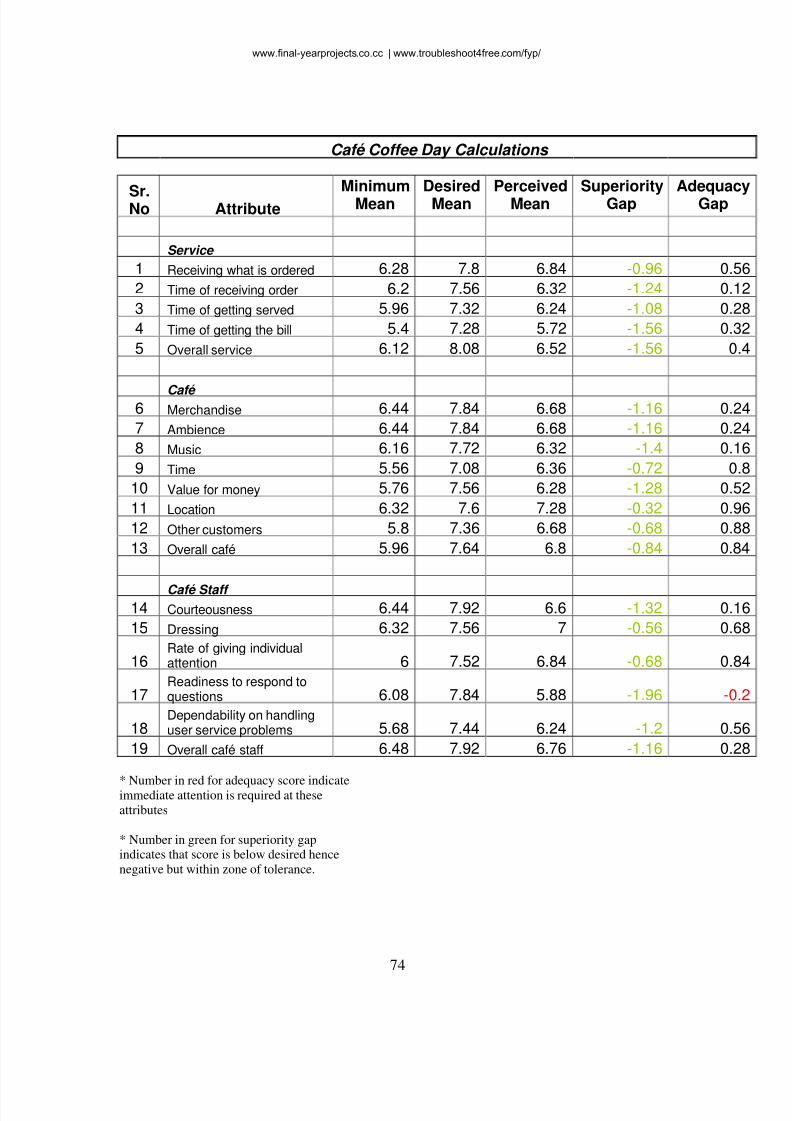
8/3/2019 Fyp-importance-Aspects-overall Satisfaction_ Buying Behavior and Loyalty
http://slidepdf.com/reader/full/fyp-importance-aspects-overall-satisfaction-buying-behavior-and-loyalty 77/98
74
Café Coffee Day Calculations
Sr.No Attribute
MinimumMean
DesiredMean
PerceivedMean
SuperiorityGap
AdequacGap
Service
1 Receiving what is ordered 6.28 7.8 6.84 -0.96 0.5
2 Time of receiving order 6.2 7.56 6.32 -1.24 0.1
3 Time of getting served 5.96 7.32 6.24 -1.08 0.2
4 Time of getting the bill 5.4 7.28 5.72 -1.56 0.3
5 Overall service 6.12 8.08 6.52 -1.56 0.
Café 6 Merchandise 6.44 7.84 6.68 -1.16 0.2
7 Ambience 6.44 7.84 6.68 -1.16 0.2
8 Music 6.16 7.72 6.32 -1.4 0.1
9 Time 5.56 7.08 6.36 -0.72 0.
10 Value for money 5.76 7.56 6.28 -1.28 0.5
11 Location 6.32 7.6 7.28 -0.32 0.9
12 Other customers 5.8 7.36 6.68 -0.68 0.8
13 Overall café 5.96 7.64 6.8 -0.84 0.8
Café Staff 14 Courteousness 6.44 7.92 6.6 -1.32 0.1
15 Dressing 6.32 7.56 7 -0.56 0.6
16 Rate of giving individualattention 6 7.52 6.84 -0.68 0.8
17 Readiness to respond toquestions 6.08 7.84 5.88 -1.96 -0.
18 Dependability on handlinguser service problems 5.68 7.44 6.24 -1.2 0.5
19 Overall café staff 6.48 7.92 6.76 -1.16 0.2
* Number in red for adequacy score indicateimmediate attention is required at these
attributes
* Number in green for superiority gapindicates that score is below desired hence
negative but within zone of tolerance.
www.final-yearprojects.co.cc | www.troubleshoot4free.com/fyp/
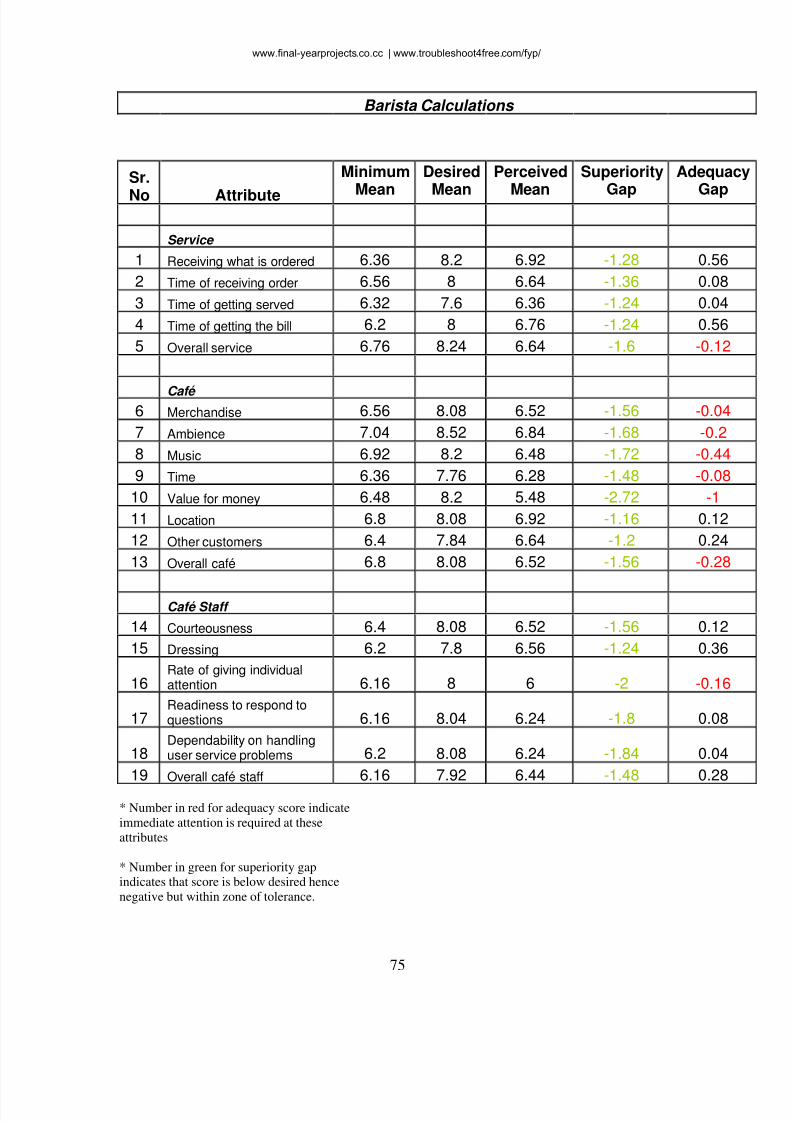
8/3/2019 Fyp-importance-Aspects-overall Satisfaction_ Buying Behavior and Loyalty
http://slidepdf.com/reader/full/fyp-importance-aspects-overall-satisfaction-buying-behavior-and-loyalty 78/98
75
Barista Calculations
Sr.
No Attribute
Minimum
Mean
Desired
Mean
Perceived
Mean
Superiority
Gap
Adequac
Gap
Service
1 Receiving what is ordered 6.36 8.2 6.92 -1.28 0.56
2 Time of receiving order 6.56 8 6.64 -1.36 0.08
3 Time of getting served 6.32 7.6 6.36 -1.24 0.04
4 Time of getting the bill 6.2 8 6.76 -1.24 0.56
5 Overall service 6.76 8.24 6.64 -1.6 -0.12
Café 6 Merchandise 6.56 8.08 6.52 -1.56 -0.04
7 Ambience 7.04 8.52 6.84 -1.68 -0.2
8 Music 6.92 8.2 6.48 -1.72 -0.44
9 Time 6.36 7.76 6.28 -1.48 -0.08
10 Value for money 6.48 8.2 5.48 -2.72 -1
11 Location 6.8 8.08 6.92 -1.16 0.12
12 Other customers 6.4 7.84 6.64 -1.2 0.24
13 Overall café 6.8 8.08 6.52 -1.56 -0.28
Café Staff
14 Courteousness 6.4 8.08 6.52 -1.56 0.12
15 Dressing 6.2 7.8 6.56 -1.24 0.36
16 Rate of giving individualattention 6.16 8 6 -2 -0.16
17 Readiness to respond toquestions 6.16 8.04 6.24 -1.8 0.08
18 Dependability on handlinguser service problems 6.2 8.08 6.24 -1.84 0.04
19 Overall café staff 6.16 7.92 6.44 -1.48 0.28
* Number in red for adequacy score indicate
immediate attention is required at these
attributes
* Number in green for superiority gapindicates that score is below desired hence
negative but within zone of tolerance.
www.final-yearprojects.co.cc | www.troubleshoot4free.com/fyp/
8/3/2019 Fyp-importance-Aspects-overall Satisfaction_ Buying Behavior and Loyalty
http://slidepdf.com/reader/full/fyp-importance-aspects-overall-satisfaction-buying-behavior-and-loyalty 79/98
76
CHARTS AND
INTERPRETATION
www.final-yearprojects.co.cc | www.troubleshoot4free.com/fyp/
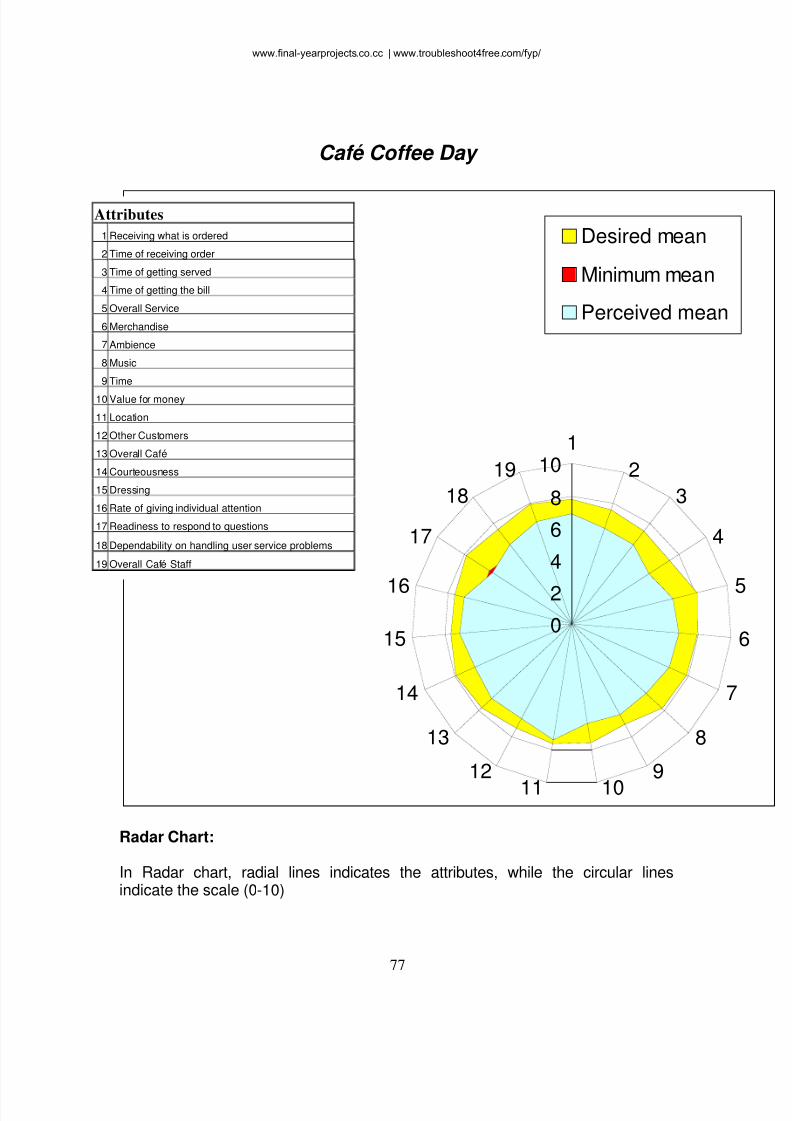
8/3/2019 Fyp-importance-Aspects-overall Satisfaction_ Buying Behavior and Loyalty
http://slidepdf.com/reader/full/fyp-importance-aspects-overall-satisfaction-buying-behavior-and-loyalty 80/98
77
Café Coffee Day
0
2
4
6
8
101
2
3
4
5
6
7
8
91011
12
13
14
15
16
17
18
19
Desired mean
Minimum mean
Perceived mean
Radar Chart:
In Radar chart, radial lines indicates the attributes, while the circular linesindicate the scale (0-10)
Attributes
1 Receiving what is ordered
2 Time of receiving order
3 Time of getting served
4 Time of getting the bill
5 Overall Service
6 Merchandise
7 Ambience
8 Music
9 Time
10 Value for money
11 Location
12 Other Customers
13 Overall Café
14 Courteousness
15 Dressing
16 Rate of giving individual attention
17 Readiness to respond to questions
18 Dependability on handling user service problems
19 Overall Café Staff
www.final-yearprojects.co.cc | www.troubleshoot4free.com/fyp/
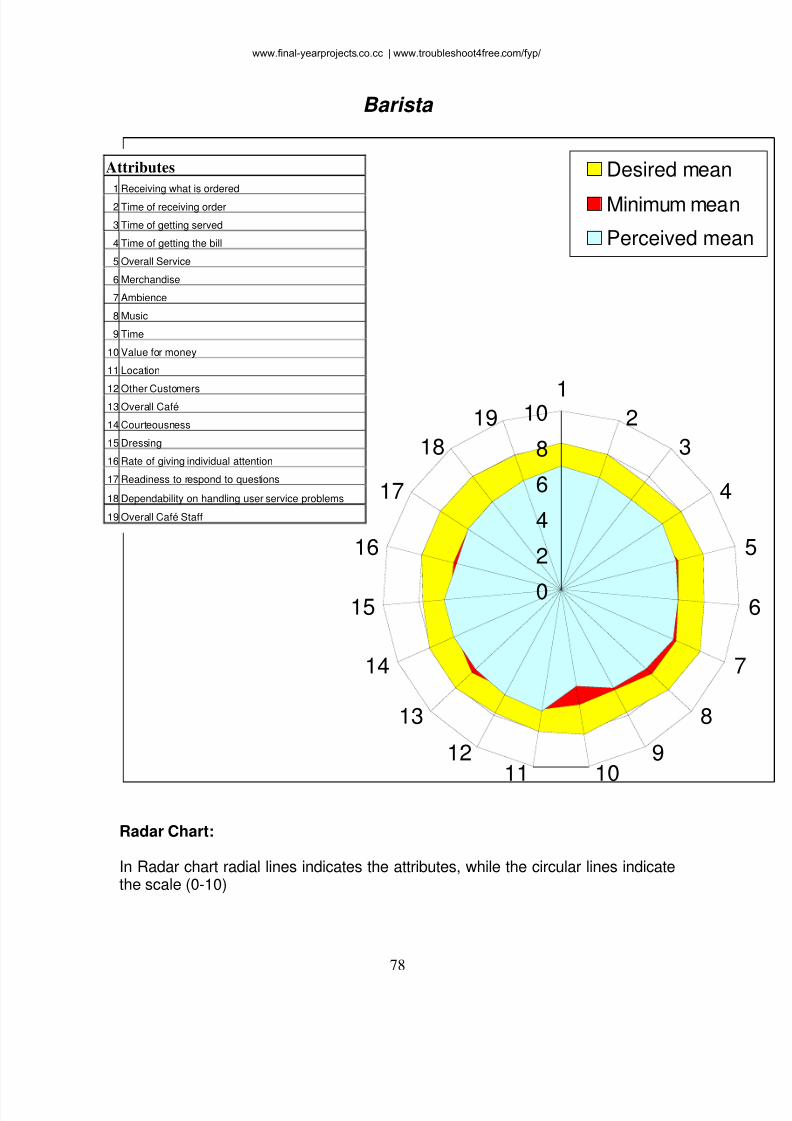
8/3/2019 Fyp-importance-Aspects-overall Satisfaction_ Buying Behavior and Loyalty
http://slidepdf.com/reader/full/fyp-importance-aspects-overall-satisfaction-buying-behavior-and-loyalty 81/98
78
Barista
0
2
4
6
8
10 12
3
4
7
8
91011
12
13
14
15
16
17
18
19
Desired mean
Minimum mean
Perceived mea
Radar Chart:
In Radar chart radial lines indicates the attributes, while the circular lines indicatethe scale (0-10)
Attributes
1 Receiving what is ordered
2 Time of receiving order
3 Time of getting served
4 Time of getting the bill
5 Overall Service
6 Merchandise
7 Ambience
8 Music
9 Time
10 Value for money
11 Location
12 Other Customers 13 Overall Café
14 Courteousness
15 Dressing
16 Rate of giving individual attention
17 Readiness to respond to questions
18 Dependability on handling user service problems
19 Overall Café Staff
www.final-yearprojects.co.cc | www.troubleshoot4free.com/fyp/
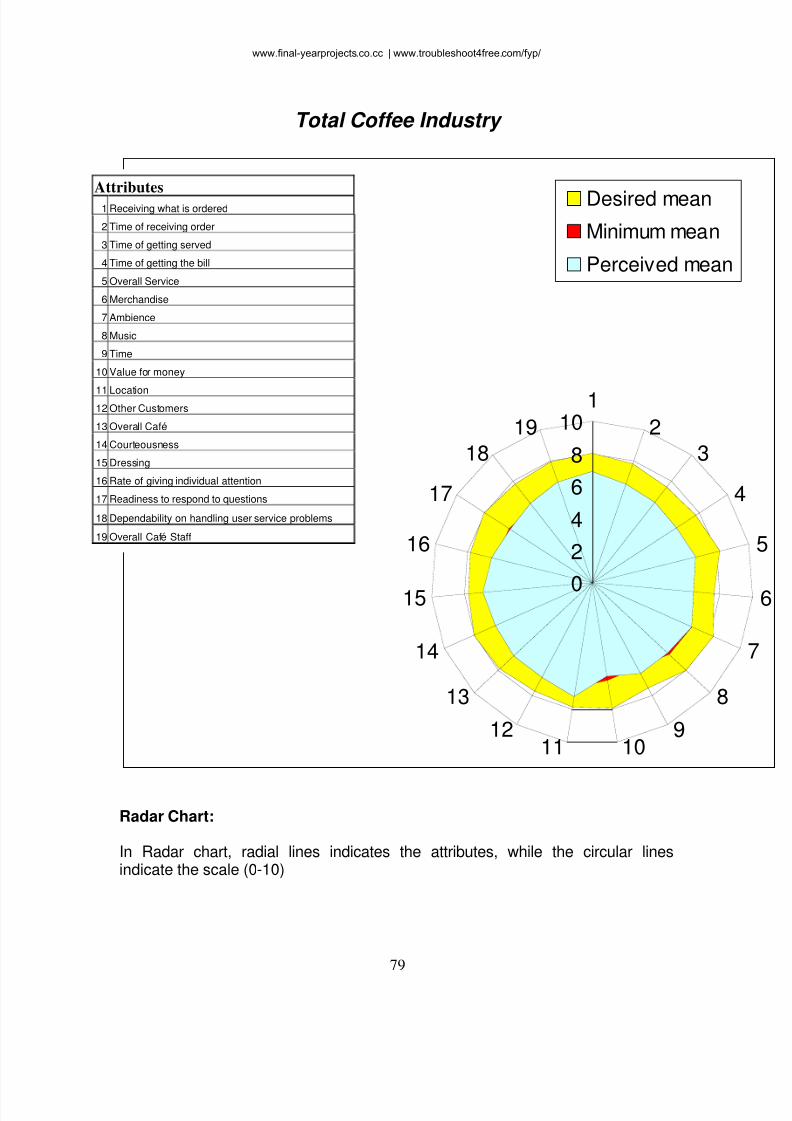
8/3/2019 Fyp-importance-Aspects-overall Satisfaction_ Buying Behavior and Loyalty
http://slidepdf.com/reader/full/fyp-importance-aspects-overall-satisfaction-buying-behavior-and-loyalty 82/98
79
Total Coffee Industry
0
2
4
6
8
101
23
4
8
91011
12
13
14
15
16
17
18
19
Desired mean
Minimum mean
Perceived mean
Radar Chart:
In Radar chart, radial lines indicates the attributes, while the circular linesindicate the scale (0-10)
Attributes
1 Receiving what is ordered
2 Time of receiving order
3 Time of getting served
4 Time of getting the bill
5 Overall Service
6 Merchandise
7 Ambience
8 Music
9 Time
10 Value for money
11 Location 12 Other Customers
13 Overall Café
14 Courteousness
15 Dressing
16 Rate of giving individual attention
17 Readiness to respond to questions
18 Dependability on handling user service problems
19 Overall Café Staff
www.final-yearprojects.co.cc | www.troubleshoot4free.com/fyp/
8/3/2019 Fyp-importance-Aspects-overall Satisfaction_ Buying Behavior and Loyalty
http://slidepdf.com/reader/full/fyp-importance-aspects-overall-satisfaction-buying-behavior-and-loyalty 83/98
8/3/2019 Fyp-importance-Aspects-overall Satisfaction_ Buying Behavior and Loyalty
http://slidepdf.com/reader/full/fyp-importance-aspects-overall-satisfaction-buying-behavior-and-loyalty 84/98
81
For Barista
From the Radar chart it is clear that the mean perceived score forattribute number 5 (Overall Service), 7(Ambience), 8(Music), 9(Time),10(Value for money), 13(Overall cafe) and16 (Rate of giving individualattention) is below the mean minimum score this means that thisattribute needs immediate attention from the café staff since thisattribute may be cause of dissatisfaction and hence should be takencare of.
Also if you have look at the radar chart it is found that the meanperceived score for none of the attribute has crossed the mean desiredscore, this means that there is a scope for improvement for the café to
improve the service quality on all the three dimensions. This can bedone by having a look at open ended questions (comment box) anddesigning the service (service blueprinting) so as to plug the gaps.
The attributes for which the mean perceived score falls in betweenmean desired and mean minimum are in fact not a reason to worrysince the customers can tolerate the amount of service quality receivedbut if efforts are made to increase the service quality above the meandesired score along with consistency in service may cause delight inthe customers and hence be loyal customers spreading positive wordof mouth.
The attributes like attribute no 5, 7, 8, 9, 10, 13 and16 should be takenextra care off since it may be cause of dissatisfaction for somecustomers which would not mind to switch to the café s competitors. Ifthe attributes for which the mean perceived scores are below the meanminimum scores can be improved then there is a greater chance for thecafé to at least retain these customers.
Some comments from customers regarding
FOR CAFÉ COFFEE DAY
People More attention should be paid to older age people Staff should be ready to face dissatisfied customers.
Process
www.final-yearprojects.co.cc | www.troubleshoot4free.com/fyp/
8/3/2019 Fyp-importance-Aspects-overall Satisfaction_ Buying Behavior and Loyalty
http://slidepdf.com/reader/full/fyp-importance-aspects-overall-satisfaction-buying-behavior-and-loyalty 85/98
82
Bill should be received faster. Service should be made more prompt.
Physical Evidence More sitting arrangements should be made. Music should not be too loud. More sitting arrangements should be provided. Air conditioning equipment should be in working condition.Should have smoking and non smoking zones. Problem of parking should be solved.
Price Prices should be reduced.
FOR BARISTA People
Need to give more personal attention to the customers. Staff should welcome the customers by a smile.
Process Late service. Self service should not be there.
Physical Evidence
Parking must be provided. Should have smoking and non smoking areas.Books should be made available.Music too loud. More variety of music should be there.
Price Reasonable pricing should be adopted.
www.final-yearprojects.co.cc | www.troubleshoot4free.com/fyp/
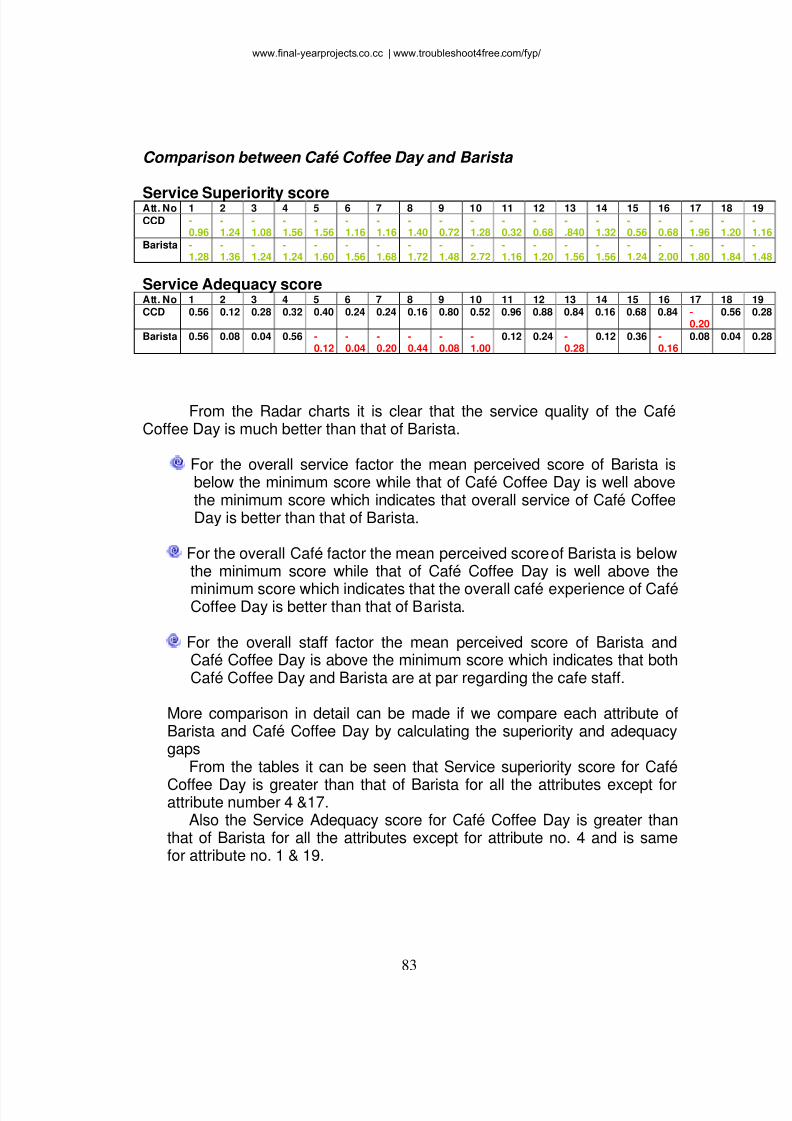
8/3/2019 Fyp-importance-Aspects-overall Satisfaction_ Buying Behavior and Loyalty
http://slidepdf.com/reader/full/fyp-importance-aspects-overall-satisfaction-buying-behavior-and-loyalty 86/98
83
Comparison between Café Coffee Day and Barista
Service Superiority score Att. No 1 2 3 4 5 6 7 8 9 10 11 12 13 14 15 16 17 18
CCD -0.96
-1.24
-1.08
-1.56
-1.56
-1.16
-1.16
-1.40
-0.72
-1.28
-0.32
-0.68
-.840
-1.32
-0.56
-0.68
-1.96
-1.20
Barista -1.28
-1.36
-1.24
-1.24
-1.60
-1.56
-1.68
-1.72
-1.48
-2.72
-1.16
-1.20
-1.56
-1.56
-1.24
-2.00
-1.80
-1.84
Service Adequacy score Att. No 1 2 3 4 5 6 7 8 9 10 11 12 13 14 15 16 17 18 CCD 0.56 0.12 0.28 0.32 0.40 0.24 0.24 0.16 0.80 0.52 0.96 0.88 0.84 0.16 0.68 0.84 -
0.200.56
Barista 0.56 0.08 0.04 0.56 -0.12
-0.04
-0.20
-0.44
-0.08
-1.00
0.12 0.24 -0.28
0.12 0.36 -0.16
0.08 0.04
From the Radar charts it is clear that the service quality of the CaféCoffee Day is much better than that of Barista.
For the overall service factor the mean perceived score of Barista isbelow the minimum score while that of Café Coffee Day is well abovethe minimum score which indicates that overall service of Café CoffeeDay is better than that of Barista.
For the overall Café factor the mean perceived score of Barista is belowthe minimum score while that of Café Coffee Day is well above the
minimum score which indicates that the overall café experience of CaféCoffee Day is better than that of Barista.
For the overall staff factor the mean perceived score of Barista andCafé Coffee Day is above the minimum score which indicates that bothCafé Coffee Day and Barista are at par regarding the cafe staff.
More comparison in detail can be made if we compare each attribute ofBarista and Café Coffee Day by calculating the superiority and adequacygaps
From the tables it can be seen that Service superiority score for Café
Coffee Day is greater than that of Barista for all the attributes except forattribute number 4 &17.
Also the Service Adequacy score for Café Coffee Day is greater thanthat of Barista for all the attributes except for attribute no. 4 and is samefor attribute no. 1 & 19.
www.final-yearprojects.co.cc | www.troubleshoot4free.com/fyp/

8/3/2019 Fyp-importance-Aspects-overall Satisfaction_ Buying Behavior and Loyalty
http://slidepdf.com/reader/full/fyp-importance-aspects-overall-satisfaction-buying-behavior-and-loyalty 87/98
84
LIMITATIONS AND SCOPE FOR
FURTHER STUDY
www.final-yearprojects.co.cc | www.troubleshoot4free.com/fyp/
8/3/2019 Fyp-importance-Aspects-overall Satisfaction_ Buying Behavior and Loyalty
http://slidepdf.com/reader/full/fyp-importance-aspects-overall-satisfaction-buying-behavior-and-loyalty 88/98
85
Limitations of the survey
This survey was conducted only for the external customers hence theexact between the perceptions of the internal customers (provider) andthe external customers which should be bridged cannot be established.
The perceptions of the service quality of the internal customers(provider and employees) should also be measured by modifying thequestionnaire.
The sample size is selected by the method of
The project was done for the Pune city only.
Sample size of the survey was 25. More accuracy could be there if it isincreased.
Scope for further study
The survey for internal customers can be carried out by slightlymodifying the questionnaire.
Gap between the external customers and internal customers shouldideally be zero (the perception of the external customer matches withthat of the internal customer) but if a gap exists then those aspects arethe ones that required to be studied and steps to be taken to reducethe gap.
Consumer buying behavior needs to be studied while implementing thechange.
www.final-yearprojects.co.cc | www.troubleshoot4free.com/fyp/
8/3/2019 Fyp-importance-Aspects-overall Satisfaction_ Buying Behavior and Loyalty
http://slidepdf.com/reader/full/fyp-importance-aspects-overall-satisfaction-buying-behavior-and-loyalty 89/98
86
RELATIONSHIP BETWEEN
GAPS MODEL AND BAXTER S
MODEL
www.final-yearprojects.co.cc | www.troubleshoot4free.com/fyp/
8/3/2019 Fyp-importance-Aspects-overall Satisfaction_ Buying Behavior and Loyalty
http://slidepdf.com/reader/full/fyp-importance-aspects-overall-satisfaction-buying-behavior-and-loyalty 90/98
87
Relation between Gaps model and Baxter s model
Both GAPS model and Baxter s model are used to provide the basicframework for improving the service delivery and maintaining the quality ofservice delivered required for satisfying the consumers.
Gaps model gives the basic framework while the Baxter s model tellsus how to improve the service with the help of Quality function deploymentand by service blueprinting.
Both models also say that the service quality is one of the importantfactor which affect the customer satisfaction apart from product quality, price,personal factors and situational factors.
In fact, Baxter s model is itself a useful tool for reducing the Gapbetween the customer and the provider on which the gaps model of servicequality focuses.
Baxter s model offers some unique advantages1. Errors due to oversimplication are reduced.
For example: to say that portfolio management means buyingand selling stocks is like describing the space shuttle as somethingthat flies. Words are simply inadequate to describe a whole complexservice system.
2. Errors due to incompleteness are reduced. In describing service, people (employees, managers, customers)
tend to omit details of the service with which they are not familiar. Forexample: A person might do a fairly incredible job of describing how adiscount stock brokerage service takes orders from customers. Butwould that person be able to describe how the monthly statements arecreated, how interactive system works, and how these two statementsare integrated into the order taking process?
3. Errors due to subjectivity are reduced.
Any one person describing a service in words will be biased bypersonal experiences and degree of exposure to service. There isnatural (and mistaken) tendency to assume that because all peoplehave gone to a fast food restaurant, they all understand what thatservice is.
www.final-yearprojects.co.cc | www.troubleshoot4free.com/fyp/
8/3/2019 Fyp-importance-Aspects-overall Satisfaction_ Buying Behavior and Loyalty
http://slidepdf.com/reader/full/fyp-importance-aspects-overall-satisfaction-buying-behavior-and-loyalty 91/98
88
4. Errors due to biased interpretation are reduced.
No two people will define responsive, quick, or flexible in exactlythe same way. For example: a supervisor or manager may suggest to afrontline service employee that the employee should try to be more flexible inproviding service to the customer. Unless flexibility is further defined, theemployee is likely to interpret the word differently from the manager.
All these risks become very apparent in the new service developmentprocess, when the organization may be attempting to design services neverbefore experienced by the customer. It is critical that all involved (managers,front line employees, and behind scenes support staff i.e internal customers)be working on customer (external customer) needs and expectations. For a
service that already exists, any attempt to improve it will also suffer unlesseveryone has a shared vision of the service and associated issues.
Apart from the advantages of the Baxter s model, Gaps model also helps in1. Providing what the customers expect.
2. Providing the right service quality designs and standards.
3. Helps in delivering according to service standards.
4. Helps in matching performances with promises.
Both make an attempt to satisfy the internal customers (employees) andthe external customers. Hence, it can be said that
Employee satisfaction + Customer satisfaction = Sustained profitability.
We categorize some services where these models could be applied frommajor innovations to minor style changes.
Major innovations are new services for market as yet undefined.
Start up businesses consists of new services for a market that isalready served by existing products that meet the same generic needs.
www.final-yearprojects.co.cc | www.troubleshoot4free.com/fyp/
8/3/2019 Fyp-importance-Aspects-overall Satisfaction_ Buying Behavior and Loyalty
http://slidepdf.com/reader/full/fyp-importance-aspects-overall-satisfaction-buying-behavior-and-loyalty 92/98
89
New services for the currently served market represent attempt to offerexisting customers of the organization a service not previously
available from the company (may be available from other companies).
Service line extensions represents augmentations for the existingservice line, such as a restaurant adding new menu items, an airlineoffering new routes etc.
Service improvements represents perhaps the most common type ofservice innovation. For example, faster execution of service processetc.
Style changes represent the most modest innovations, although they
are highly visible. For example, changing the color scheme of arestaurant, website redesign etc.
www.final-yearprojects.co.cc | www.troubleshoot4free.com/fyp/

8/3/2019 Fyp-importance-Aspects-overall Satisfaction_ Buying Behavior and Loyalty
http://slidepdf.com/reader/full/fyp-importance-aspects-overall-satisfaction-buying-behavior-and-loyalty 93/98
90
SUMMARY
www.final-yearprojects.co.cc | www.troubleshoot4free.com/fyp/
8/3/2019 Fyp-importance-Aspects-overall Satisfaction_ Buying Behavior and Loyalty
http://slidepdf.com/reader/full/fyp-importance-aspects-overall-satisfaction-buying-behavior-and-loyalty 94/98
91
Summary
Baxter s Model gives the systematic procedure of how to determine theimportant aspects of the service and it also gives the method how todetermine these aspects and improve the service quality. It also says thatimprovement in quality is the most important in the service delivery process.This quality can be achieved if various aspects of quality (Dimensions ofquality) are attained. These in turn could be achieved by involving externaland internal customers and by the way of continuous improvement.
Gaps Model of Service Quality gives a insight in understanding thecustomer expectations and perceptions. It says that there are basically twotypes of gaps one is on the customer side and other on the provider side (4
gaps). For closing the gaps on the customer side it is necessary to plug the 4gaps on the provider side. For plugging the gaps the aspects which are ratedbelow the minimum service level are given more importance so that thecustomer from the dissatisfied zone moves to the zone of tolerance and he isat least retained. For the aspects which are rated between the zone oftolerance, these aspects should also be improved so that the perception of thecustomer about service quality moves above the desired service level and thecustomer feels more satisfied and becomes loyal spreading positive word ofmouth.
www.final-yearprojects.co.cc | www.troubleshoot4free.com/fyp/

8/3/2019 Fyp-importance-Aspects-overall Satisfaction_ Buying Behavior and Loyalty
http://slidepdf.com/reader/full/fyp-importance-aspects-overall-satisfaction-buying-behavior-and-loyalty 95/98
92
BIBLIOGRAPHY
www.final-yearprojects.co.cc | www.troubleshoot4free.com/fyp/
8/3/2019 Fyp-importance-Aspects-overall Satisfaction_ Buying Behavior and Loyalty
http://slidepdf.com/reader/full/fyp-importance-aspects-overall-satisfaction-buying-behavior-and-loyalty 96/98
93
Bibliography
Literature
1. Customer Retention Through Quality Leadership: The Baxter Approach By Deborah G. Fliehman
David D. Auld
2. Services Marketing (3rd edition) By Valarie A. Ziethaml
Mary Jo Bitner
3. Metric Consultancy Data Base
4. http://www.arl.org/libqual/
5. http://www.metricconsultancy.com
www.final-yearprojects.co.cc | www.troubleshoot4free.com/fyp/

8/3/2019 Fyp-importance-Aspects-overall Satisfaction_ Buying Behavior and Loyalty
http://slidepdf.com/reader/full/fyp-importance-aspects-overall-satisfaction-buying-behavior-and-loyalty 97/98
94
ANNEXURE
www.final-yearprojects.co.cc | www.troubleshoot4free.com/fyp/
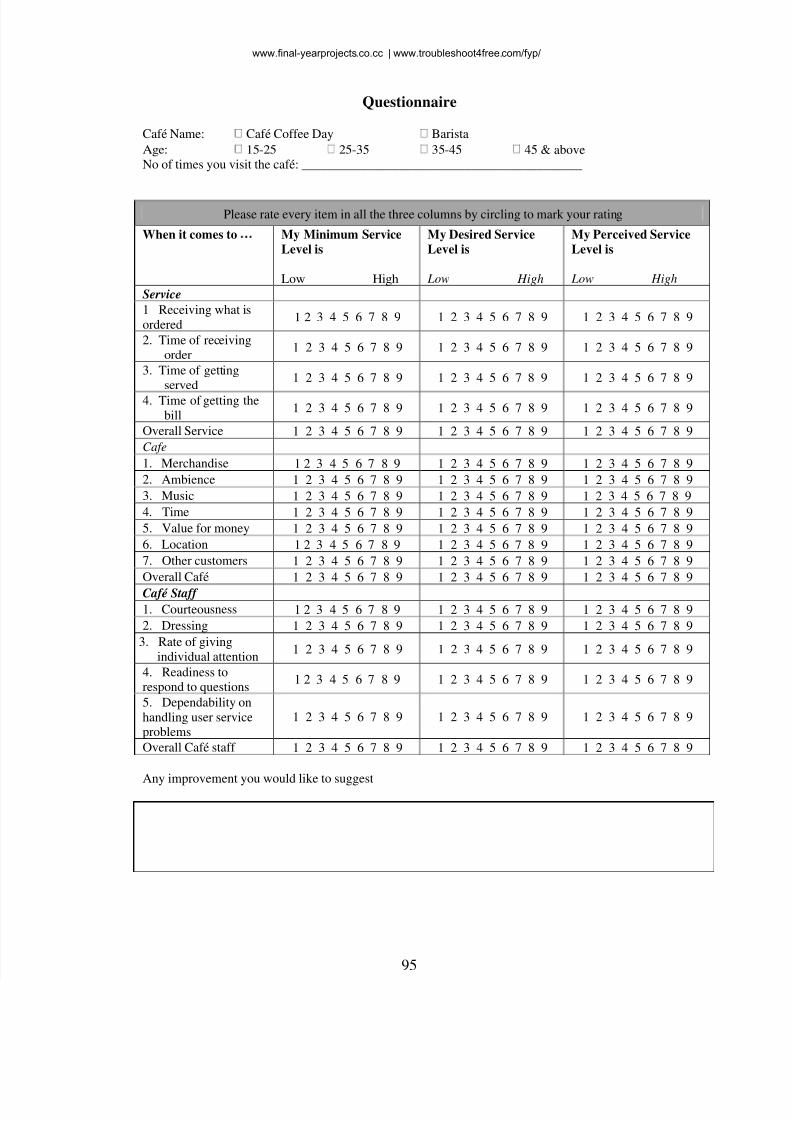
8/3/2019 Fyp-importance-Aspects-overall Satisfaction_ Buying Behavior and Loyalty
http://slidepdf.com/reader/full/fyp-importance-aspects-overall-satisfaction-buying-behavior-and-loyalty 98/98
Questionnaire
Café Name: Café Coffee Day Barista
Age: 15-25 25-35 35-45 45 & above No of times you visit the café: ___________________________________________
Please rate every item in all the three columns by circling to mark your rating
When it comes to My Minimum ServiceLevel is
Low High
My Desired ServiceLevel is
Low High
My Perceived ServiceLevel is
Low High
Service
1 Receiving what is
ordered 1 2 3 4 5 6 7 8 9 1 2 3 4 5 6 7 8 9 1 2 3 4 5 6 7 8 9
2. Time of receivingorder
1 2 3 4 5 6 7 8 9 1 2 3 4 5 6 7 8 9 1 2 3 4 5 6 7 8 9
3. Time of gettingserved
1 2 3 4 5 6 7 8 9 1 2 3 4 5 6 7 8 9 1 2 3 4 5 6 7 8 9
4. Time of getting the
bill 1 2 3 4 5 6 7 8 9 1 2 3 4 5 6 7 8 9 1 2 3 4 5 6 7 8 9
Overall Service 1 2 3 4 5 6 7 8 9 1 2 3 4 5 6 7 8 9 1 2 3 4 5 6 7 8 9
Cafe 1. Merchandise 1 2 3 4 5 6 7 8 9 1 2 3 4 5 6 7 8 9 1 2 3 4 5 6 7 8 9
2. Ambience 1 2 3 4 5 6 7 8 9 1 2 3 4 5 6 7 8 9 1 2 3 4 5 6 7 8 9
3. Music 1 2 3 4 5 6 7 8 9 1 2 3 4 5 6 7 8 9 1 2 3 4 5 6 7 8 9
4. Time 1 2 3 4 5 6 7 8 9 1 2 3 4 5 6 7 8 9 1 2 3 4 5 6 7 8 9
5. Value for money 1 2 3 4 5 6 7 8 9 1 2 3 4 5 6 7 8 9 1 2 3 4 5 6 7 8 9
6. Location 1 2 3 4 5 6 7 8 9 1 2 3 4 5 6 7 8 9 1 2 3 4 5 6 7 8 9
7. Other customers 1 2 3 4 5 6 7 8 9 1 2 3 4 5 6 7 8 9 1 2 3 4 5 6 7 8 9
Overall Café 1 2 3 4 5 6 7 8 9 1 2 3 4 5 6 7 8 9 1 2 3 4 5 6 7 8 9
Café Staff
1. Courteousness 1 2 3 4 5 6 7 8 9 1 2 3 4 5 6 7 8 9 1 2 3 4 5 6 7 8 9
2. Dressing 1 2 3 4 5 6 7 8 9 1 2 3 4 5 6 7 8 9 1 2 3 4 5 6 7 8 9
3. Rate of giving
individual attention 1 2 3 4 5 6 7 8 9 1 2 3 4 5 6 7 8 9 1 2 3 4 5 6 7 8 9
4. Readiness torespond to questions
1 2 3 4 5 6 7 8 9 1 2 3 4 5 6 7 8 9 1 2 3 4 5 6 7 8 9
5. Dependability on
www.final-yearprojects.co.cc | www.troubleshoot4free.com/fyp/