Embed Size (px)
DESCRIPTION
mba project
Citation preview
www.final-yearproject.com | www.finalyearthesis.com
A
PROJECT REPORT
ON
“SENSEX BELOW 10000”
SUBMITTED TO TILAK MAHARASHTRA UNIVERSITY IN PARTIAL FULFILLMENT OF 2 YEARS FULL TIME COURSE
MASTER OF BUSINESS ADMINISTRATION
(MBA)
Submitted By:
SAMIR .F. BAGATHARIA
(Batch 2008-10)
Guided By:
Prof.R.GANESAN
MAHARASHTRA COSMOPOLITAN EDUCATION SOCIETY’S
PAI INTERNATIONAL CENTRE FOR MANAGEMENTEXCELLENCE
CAMP PUNE-411001
1

www.final-yearproject.com | www.finalyearthesis.com
CERTIFICATE
This is to certify that SAMIR F.BAGATHARIA student of PAI INTERNATIONAL CENTRE FOR MANAGEMENT EXCELLENCE, Maharashtra Cosmopolitan Education Society, Pune has completed his field work at ―SENSEX BELOW 10000‖ and has submitted the field work report in partial fulfilment of 2 years full time course MASTER IN BUSINESS ADMINISTRATION of college for the academic year 2008-2010
He has worked under our guidance and direction. The said report is based on bonafide information.
Project Guide Name Prof. R Ganesan
Designation Director
Pai InternationalCentre for
ManagementExcellence
Date:-
Place
2
www.final-yearproject.com | www.finalyearthesis.com
PAI INTERNATIONAL CENTRE
FOR
MANAGEMENT EXCELLENCE
Maharashtra Cosmopolitan Education Society
DECLARATION
I hereby declare that the project titled ―SENSEX BELOW10,000‖ is an original piece of research work carried out by me under the guidance and supervision of Prof.R.GANESHAN. The information has been collected from genuine & authentic sources. The work has been submitted in partial fulfillment of the requirement of MASTER OF BUSINESS ADMINISTRATION (MBA).
Place: Signature:
Date: SAMIR F. BAGATHARIA
3

www.final-yearproject.com | www.finalyearthesis.com
ACKNOWLEDGEMENT
This project work has been made possible through the direct and indirect cooperation of various people for whom I wish to express my appreciation and gratitude.
First and foremost, all praises for GOD, the most benevolent and the most merciful, for giving me the opportunity, strength and making me the person I am today and making me capable of completing this project.
I would also like to extend a deep sense of heart felt gratitude towards my parents for giving me and making me the person I am today and also enabling me to realize ambitious of my life by their enumerable immense sacrifices.
My sincere thanks to Prof R.Ganesan,director,P.I.C.M.E for giving me an opportunity to complete this project.
I would specially like to mention about my project guide and my mentor, Somiya madam, whom I owe a profound sense of obligation and respect for guding me and playing a pivotal role right from the start till the completion of this project. I also thank him for motivating and encouraging me to be better human being
Last but not the least; my grateful appreciation is also extended to Mrs.Sikha (Administrative Head) Madam and our administration officer Mr. Atik sir and my cordial thanks to all my faculty members and friends. However, I accept the sole responsibility for any possible errors of omission and would be extremely grateful to the readers of this project report if they bring such mistakes to my notice.
SAMIR.F.BAGATHARIA
4

www.final-yearproject.com | www.finalyearthesis.com
TABLE OF CONTENTS
SR.NO CONTENT PAGE NO.
1 EXECUTIVE SUMMARY 6
2 INTRODUCTION 8
3 OBJECTIVES 17
4 RESEARCH METHODOLOGY 19
5 LITERATURE SURVEY 21
6 PROFILE 26
7 DATA COLLECTION 34
8 CONCLUSION 40
9 FUTURE SCOPE 42
10 BOBLIOGRAPHY 44
5

www.final-yearproject.com | www.finalyearthesis.com
1.
EXECUTIVE
SUMMARY
6

www.final-yearproject.com | www.finalyearthesis.com
Executive summary
PROJECT TITLE: ―SENSEX BELOW 10000‖
NAME OF THE ORGANISATION: Pai international centre for management and excellence.
NAME OF PROJECT GUIDE: Prof. R ganesan.
NAME OF RESEACHER: Samir F Bagatharia
The project deals in following details:
This chapter deals with an overview of the research project, stating the problem of the research objectives, about Sensex and how the Sensex crash below 10000 and also give the detail about the BSE and information about the calculation of the opening and closing of Sensex.
This chapter gives us an outlook of the Sensex. This chapter contains brief overview of Sensex. And also shares the ideas of CEO‘s, Directors & Chairman‘s of different companies regarding the fall of Sensex below 10000. And give the timeline on the rise and rise of the Sensex through Indian stock market history. This chapter also contains the ideas shared by my Indian as well as foreigner friends about why the Sensex went below 10000.
This project is also highlight the fall of satym‘s share price after the fraud. The Sensex pack comprised 27 losers with Reliance Energy, L&T, Hindalco, HLL, Dr Reddy‘s Labs, NTPC, Bhel, ITC, Bharti Tele-Ventures, Infosys Technologies and ACC all closing in the red.
7

www.final-yearproject.com | www.finalyearthesis.com
2.
INTRODUCTION
8
www.final-yearproject.com | www.finalyearthesis.com
INTRODUCTION
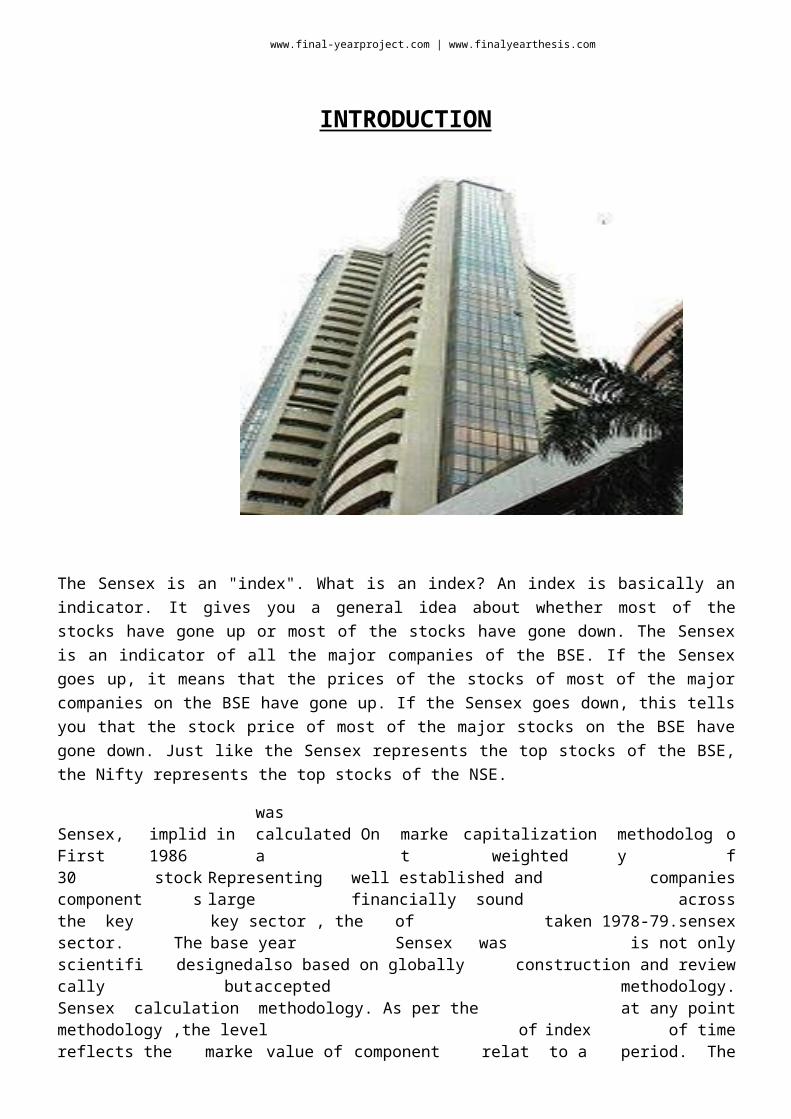
The Sensex is an "index". What is an index? An index is basically an indicator. It gives you a general idea about whether most of the stocks have gone up or most of the stocks have gone down. The Sensex is an indicator of all the major companies of the BSE. If the Sensex goes up, it means that the prices of the stocks of most of the major companies on the BSE have gone up. If the Sensex goes down, this tells you that the stock price of most of the major stocks on the BSE have gone down. Just like the Sensex represents the top stocks of the BSE, the Nifty represents the top stocks of the NSE.
Sensex, First implid in 1986 was calculated On a market capitalization weighted methodology of30 component stocks Representing large well established and financially sound companies acrossthe key sector. The key sector , the base year of Sensex was taken 1978-79.sensex is not onlyscientifically designed butalso based on globally accepted construction and review methodology.Sensex calculation methodology. As per the methodology ,the level of index at any point of timereflects the free-float market value of 30 component Stocks relative to a base period. The marketcapitalization of a company is determined by multiplying the price of its stock by the number ofshare issued by the company.
9
www.final-yearproject.com | www.finalyearthesis.com
The base period of Sensex is 1978-79, and the base value is 100 points. This is often indicted bythe notation 1978-99=100.the calculation of sensex involves Dividing free-float market factor todetermine the free-float market capitalization. The divisor is the only link to the original baseperiod value of sensex. It keeps the index comparable over time and is the aduustment point forall index adjustment arising out of corporate actions, replacement of scrips etc.during market hours,prices of the index scrips, at which latest trades are executed, are used by the trading system tocalculate the sensex every 15 seconds and the value of sensex is to distribute in real time.
The SENSEX, short form of the BSE-Sensitive Index, is a "Market Capitalization-Weighted" index of 30 stocks representing a sample of large, well-established and financially sound companies. It is the oldest index in India and has acquired a unique place in the collective consciousness of investors. The index is widely used to measure the performance of the Indian stock markets. SENSEX is considered to be the pulse of the Indian stock markets as it represents the underlying universe of listed stocks at The Stock Exchage, Mumbai. Further, as the oldest index of the Indian Stock market, it provides time series data over a fairly long period of time (since 1978-79).
The SENSEX is the benchmark index of the Indian Capital Markets with wide acceptance among individual investors, institutional investors, foreign investors and fund managers. The objectives of the index are:
To measure market movements
Given its long history and its wide acceptance, no other index matches the SENSEX in reflecting market movements and sentiments. SENSEX is widely used to describe the mood in the Indian Stock markets.
Benchmark for funds performance
The inclusion of blue chip companies and the wide and balanced industry representation in the SENSEX makes it the ideal benchmark for fund managers to compare the performance of their funds.
For index based derivative products Institutional investors, money managers and small investors all refer to the SENSEX for their specific purposes The SENSEX is in effect the proxy for the Indian stock markets. The country's first derivative product i.e. Index-Futures was launched on SENSEX.
Beta measures the sensitivity of a scrip movement relative to movement in the benchmark index i.e. SENSEX. A Beta of one means that for every change of 1% in index, the scrip moves by 1%. Statistically Beta is defined as: Covariance (SENSEX, Stock )/ Variance(SENSEX)
Note: Covariance and variance are calculated from the Daily Returns data of the SENSEX and SENSEX scrips.
The arithmetic calculation involved in calculating SENSEX is simple, but problem arises when one of the component stocks pays a bonus or issues rights shares. If no adjustments were made, a discontinuity would arise between the current value of the index and its previous value. The Index Cell of the Exchange
10

www.final-yearproject.com | www.finalyearthesis.com
periodically adjusts the base value to take care of such corporate announcements. Adjustments for Rights Issues:
When a company, included in the compilation of the index, issues right shares, the market capitalisation of that company is increased by the number of additional shares issued based on the theoretical (ex-right) price. An offsetting or proportionate adjustment is then made to the Base Market Capitalisation (see ' Base Market Capitalisation Adjustment' below).Adjustments for Bonus Issue:When a company, included in the compilation of the index, issues bonus shares, the market capitalisation
of that company does not undergo any change. Therefore, there is no change in the Base Market Capitalisation, only the 'number of shares' in the formula is updated.
Other Issues: Base Market Capitalisation Adjustment is required when new shares are issued by way of conversion of debentures, mergers, spin-offs etc. or when equity is reduced by way of buy-back of shares, corporate restructuring etc.
ABOUT BSE
Bombay Stock Exchange Limited is the oldest stock exchange in Asia with a rich heritage. Popularly known as "BSE", it was established as "The Native Share & Stock Brokers Association" in 1875. It is the first stock exchange in the country to obtain permanent recognition in 1956 from the Government of India under the Securities Contracts (Regulation) Act, 1956.The Exchange's pivotal and pre-eminent role in the development of the Indian capital market is widely recognized and its index, SENSEX, is tracked worldwide. Earlier an Association of Persons (AOP), the Exchange is now a demutualised and corporatised entity incorporated under the provisions of the Companies Act, 1956, pursuant to the BSE(Corporatisation and Demutualisation) Scheme, 2005 notified by the Securities and Exchange Board of India (SEBI).
The BSE Sensex or Bombay Stock Exchange Sensitive Index is a value-weighted index composed of over 4000 stocks with the base April 1979 = 100. It consists of the 30 largest and most actively traded stocks, representative of various sectors, on the Bombay Stock Exchange. These companies account for around one-fifth of the market capitalization of the BSE.The base value of the Sensex is 100 on April 1, 1979 and the base year of BSE-SENSEX is 1978-79.
At irregular intervals, the Bombay Stock Exchange (BSE) authorities review and modify its composition to make sure it reflects current market conditions.
11
www.final-yearproject.com | www.finalyearthesis.com
The abbreviated form "Sensex" was coined by Deepak Mohoni around 1990 while writing market analysis columns for some of the business newspapers and magazines. It gained popularity over the next year or two.
The stock market has grown by over ten times from June 1990 to today. Using information from April 1979 onwards, the long-run rate of return on the BSE Sensex can be estimated to be 0.52% per week (continuously compounded) with a standard deviation of 3.67%. This translates to 27% per annum, which translates to roughly 18% per annum after compensating for inflation.
CLOSING:-
The closing SENSEX is computed taking the weighted average of all the trades on SENSEX constituents in the last 15 minutes of trading session. If a SENSEX constituent has not traded in the last 15 minutes, the last traded price is taken for computation of the Index closure. If a SENSEX constituent has not traded at all in a day, then its last day's closing price is taken for computation of Index closure. The use of Index Closure Algorithm prevents any intentional manipulation of the closing index value.
12

www.final-yearproject.com | www.finalyearthesis.com
Sensex dips below 10,000
Mumbai, June 6: Markets across the globe went in a free-fall mode on Tuesday as reports related to a further hike in the US Fed rates started pouring in. While the overnight Dow Jones lost nearly 200 points, almost all the Asian bourses also ended the day deep in the red. The US Federal Reserve will be meeting on June 28-29 to mull a further increase in the interest rates.
In India, both the benchmark indices closed below yet-another crucial support level amidst very volatile trading session, taking a cue from the global bourses. The turnover also remained in doldrums, with the BSE barely managing to cross the Rs 3,000-crore mark.
The benchmark Sensex opened the day on a weak note, falling by over 300 points during the first few minutes of trade as none of the 30 stocks managed to stay in positive territory during the initial session.
At the close of the session, the index was down by 256.16 points to end at 9,957.32 — its lowest close since February 17, 2006. The S&P CNX Nifty of the National Stock Exchange (NSE) ended the day at 2,937.30, shedding 79.35 points.
Experts were quoting Federal Reserve chairman Ben S Bernanke‘s reported statement related to a further hike in the US Fed rates, which dampened the already bearish sentiments on the bourses as investors expect a further outflow of foreign funds from emerging markets, including India.
In a similar context, Naresh Kothari, head (institutional equities), Edelweiss, said, ―It seems that the technicals are overpowering fundamentals. FIIs are selling and some amount of domestic redemptions are also being witnessed.‖
Incidentally, according to the provisional figures, FIIs have again resumed selling in the cash market after taking a two-day break. On Tuesday, FIIs were net sellers at Rs 212.08 crore. In May, FIIs have been net sellers at Rs 8,257.40 crore.
The Sensex pack comprised 27 losers with Reliance Energy, L&T, Hindalco, HLL, Dr Reddy‘sLabs, NTPC, Bhel, ITC, Bharti Tele-Ventures, Infosys Technologies and ACC all closing in the red.
On the other hand, Hero Honda Motors, SBI and ICICI Bank managed to buck the trend and gain ground.

13

www.final-yearproject.com | www.finalyearthesis.com
Sensex at 2-yr low, ends below 10,000Mumbai, October 17: The Bombay Stock Exchange benchmark Sensex on Friday sank to more than two-year lows under 10,000 points on panic selling by funds and general investors.
After a promising start, the Sensex dropped by 606.14 points, or 5.73 per cent, to 9,975.35, a level last seen in June 2006. The key-index dipped to 9,911.32 during the day and a high of 10,786.93.
Similarly, the wide-based National Stock Exchange index Nifty tumbled by 194.95, or 5.96 per cent, to 3074.35 after touching the day's low of 3046.60 and a high of 3335.95 points.
Market men said the Sensex dipped to the lowest level in over two years on concerns of a sharp global economic slowdown and sluggish corporate earnings.
They said a series of measures announced by the government and the Reserve Bank of India failed to check rising capital outflow by foreign funds.
The market barometer turned significantly down as market major Reliance Industries dropped by 6.58 percent, DLF Ltd. By 10.34 per cent, Bharti Airtel by 7.47 per cent, ICICI Bank by 5.61 per cent and State Bank of India by 8.42 per cent.
Sector-wise, Realty stocks suffered the most as segment index meltdown by 10.25 per cent at 2,524.89 followed by Power sector index by 8.09 per cent at 1,712.27.
14
www.final-yearproject.com | www.finalyearthesis.com
BSE Sensex drops below 10,000, Rupee slips to 48.88 against Dolla r
The BSE Sensex dropped 606.14 points to close at 9,975.35. This is the first time since July 2006 that BSE Sensex fell below 10k. The Sensex lost 5.73% during the day's trade. The Nifty too dropped 194.95 or 6 percent to close at 3,074.35. Other Asian market including that of Japan, Singapore and Hong Kong too crashed heavily.
The Indian Rupee continued its downward trend by falling to a 6-year-low of 48.88 against the US Dollar. The RBI measures failed to bail out the Rupee from falling further against the Greenback.
According to an official estimate, India's economy is expected to expand at 7.1 per cent in fiscal 2008-09, the slowest in six years and below the previous year's 9.0 per cent, due to global slowdown cutting back demand and hurting key sectors. Thought the estimate is higher than what some private analysts have forecast, the market, which had moved up sharply after a positive start this morning, has turned a bit listless now.
Global meltdown and stock marke t
Metal, consumer durables, bank, realty, PSU and capital goods stocks are among the prominent gainers. Pharma stocks have edged up after a rather subdued start. Select auto, oil and power stocks have posted notable gains. Information technology stocks remain subdued. FMCG stocks have come off their lower levels.
15

www.final-yearproject.com | www.finalyearthesis.com
At 9371.49, the Sensex is up 70.63 points or 0.76% over its previous closing mark. The Nifty is up 0.53% or 15 points at 2858.10. Earlier, the Sensex and Nifty had touched 9431.81 and 2871.40 respectively in mid morning trade today.
Stock commentar y
Several stocks from midcap and smallcap segments have posted impressive gains. The market breadth continues to remain strong. On BSE, out of 2115 stocks traded now, 1265 stocks are up in the positive territory. 763 stocks have posted losses and 87 stocks trade flat.
Stock tips for investor s
Jaiprakash Associates, Tata Steel, HDFC, Sterlite Industries, Hindalco, ONGC, Reliance Infrastructure, Larsen & Toubro, Tata Motors, Ranbaxy Laboratories, HDFC Bank, ICICI Bank, Reliance Industries, State Bank of India and BHEL are up by 1% - 5% now. Tata Power, DLF, Infosys Technologies, Maruti Suzuki and ACC have posted modest gains.
Stockometer
Educomp Solutions rules firm with a hefty gain of 12% at Rs 1566. United Spirits is up by around 7% at Rs 658.75. IVRCL Infrastructure has rallied 6.65% to Rs 112.90. NMDC has notched up a gain of 6.35% at Rs 169.10. Financial Technologies, Voltas, JSW Steel, Glenmark Pharmaceuticals, Opto Circuit, Nagarjuna Construction Company, Divi's Laboratories, Piramal Healthcare, Welspun Gujarat, SAIL, Alstom Projects, Praj Industries and Century Textiles have gained 3.5% - 6%..
16
www.final-yearproject.com | www.finalyearthesis.com
3.
OBJECTIVES
17
www.final-yearproject.com | www.finalyearthesis.com
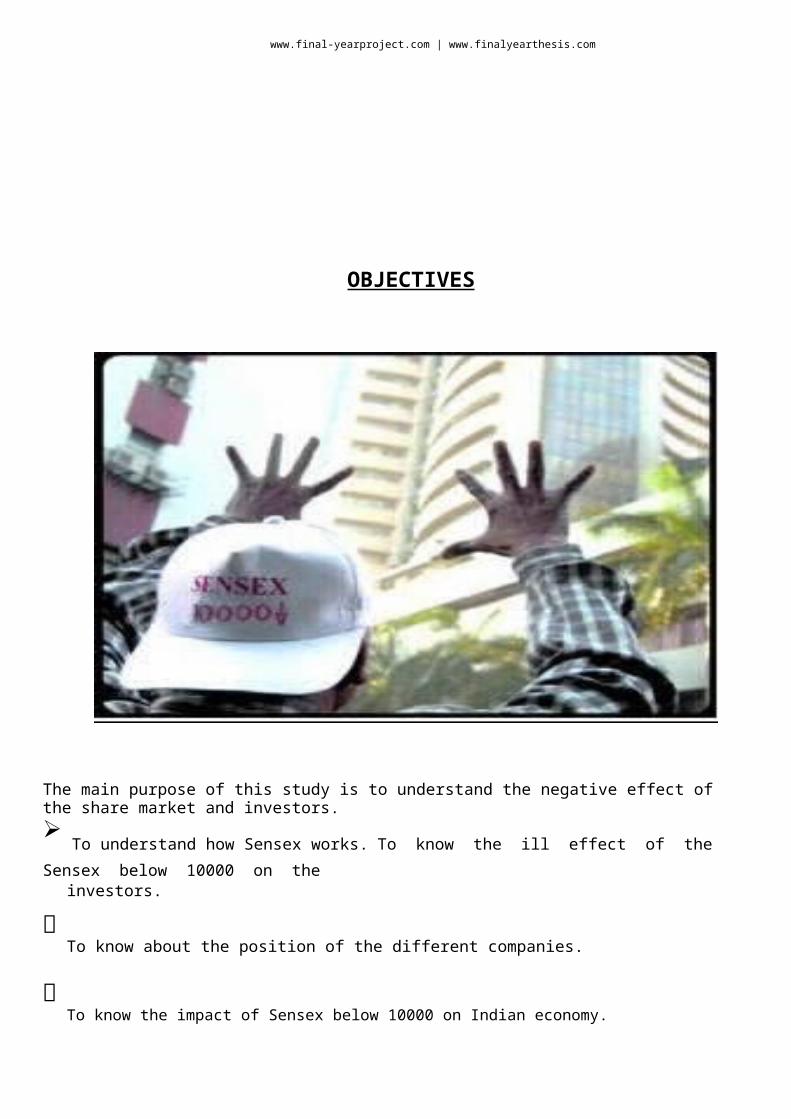
OBJECTIVES
The main purpose of this study is to understand the negative effect of the share market and investors.
To understand how Sensex works. To know the ill effect of the Sensex below 10000 on the
investors.
To know about the position of the different companies.
To know the impact of Sensex below 10000 on Indian economy.
18
www.final-yearproject.com | www.finalyearthesis.com
1.
4. RESEARCH
METHODOLOGY
19
www.final-yearproject.com | www.finalyearthesis.com
RESEARCH METHODOLOGY
Research in common parlance refers to search for knowledge. In broader sense it is a process of
scientific and systematic search for pertinent information on a specific topic and thus is an art of
scientific investigation.
Clifford Woody defines research as defining and redefining problems, formulating hypothesis or
suggested solution; collecting, organizing and evaluating data; making deduction and reaching
conclusion; and at last carefully testing the conclusions to determine whether they fit the hypothesis.
PRIMARY DATA
Primary data was collected through face to face conversation with my friend. He is share broker in
my village.
SECONDARY DATA
Secondary data has been collected from Google and sensex web site. The main advantage of
secondary data is the easiness collection and get fastly.
Secondary data is collected through reference books on economy, magazines and articles etc.
20
www.final-yearproject.com | www.finalyearthesis.com
5.
LITERATURE
SURVEY
21

www.final-yearproject.com | www.finalyearthesis.com
LITERATURE SURVEY
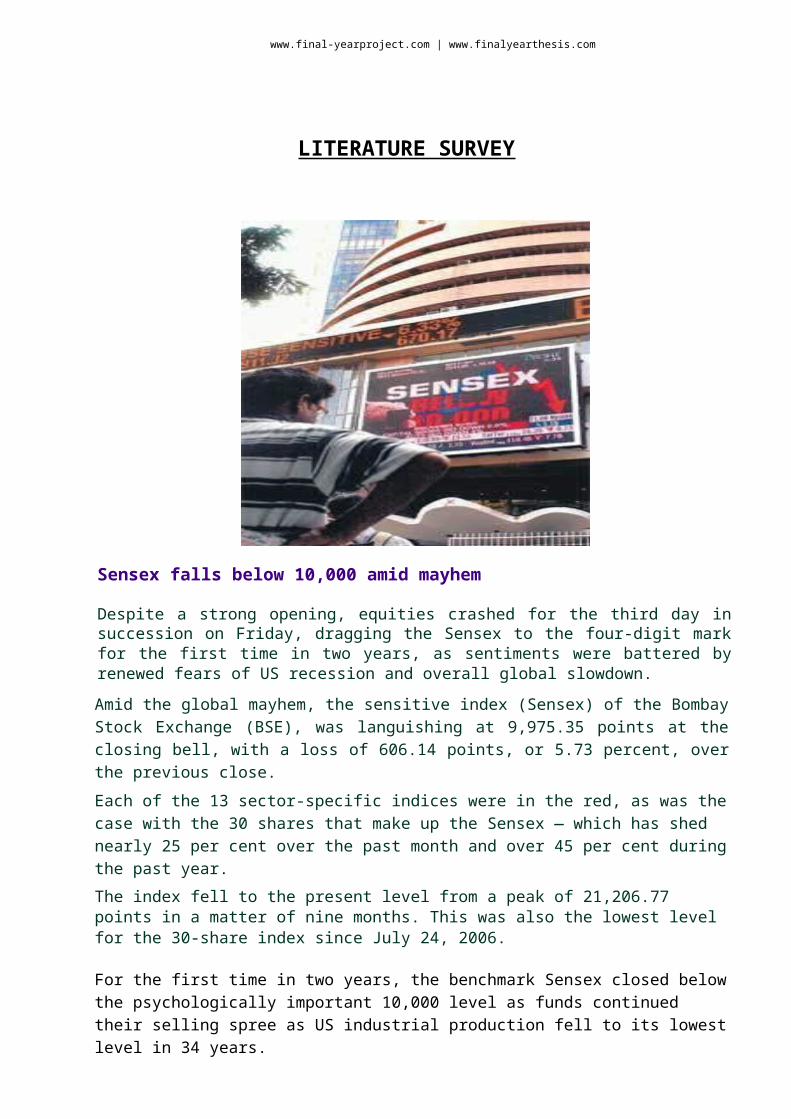
Sensex falls below 10,000 amid mayhem
Despite a strong opening, equities crashed for the third day in succession on Friday, dragging the Sensex to the four-digit mark for the first time in two years, as sentiments were battered by renewed fears of US recession and overall global slowdown.
Amid the global mayhem, the sensitive index (Sensex) of the Bombay Stock Exchange (BSE), was languishing at 9,975.35 points at the closing bell, with a loss of 606.14 points, or 5.73 percent, over the previous close.
Each of the 13 sector-specific indices were in the red, as was the case with the 30 shares that make up the Sensex — which has shed nearly 25 per cent over the past month and over 45 per cent during the past year.
The index fell to the present level from a peak of 21,206.77 points in a matter of nine months. This was also the lowest level for the 30-share index since July 24, 2006.
For the first time in two years, the benchmark Sensex closed below the psychologically important 10,000 level as funds continued their selling spree as US industrial production fell to its lowest level in 34 years.
After opening Friday‘s trade sharply higher, the 30-share barometer on the Bombay Stock Exchange shed 606.14 points, or 5.73 per cent, to end the day at 9,975.35 – a closing level last seen on June 20, 2006.
The 50-share Nifty index of the National Stock Exchange also fell by 194.95 points, or 5.96 per cent, to close at 3,074.35.
22
www.final-yearproject.com | www.finalyearthesis.com
Marketmen said fears of the ongoing global recession becoming a reality took a severe toll on the bourses. At the same time, they added, foreign institutional investors (FIIs) continued their selling spree in view of the dim picture in the global financial markets. During Friday‘s trade itself, FIIs sold holdings worth Rs 915 crore, according to provisional data on BSE‘s Web site.
FEBRUARY 2009BSE SENEX closed today Friday 30th January'09 at 9424 down 2.31% from close of 9647 as of 31st
December‘08. The intra month low and high were 8632 and 10470 respectively. I was bearish for the SENSEX for the month of January‘09 but SENSEX did not breach S3 8310 level. India‘s fourth largest IT company – SATYAM COMPUTER‘s Chairman, wrote a letter to the SEBI on 7th Jan‘09 morning that it had ‗siphoned off‘ Rs. 7000.00 Crores ( US $ 1.43 billion ) in cash over the past few years. This was a ‗bomb shell‘ for corporate India. SENSEX tanked 7.25 % on close at BSE to 9587. Govt. of India and SEBI quickly moved into action to rescue this tainted company. The damage control was done swiftly by SEBI and the entire management was changed at SATYAM. Their auditors – PWC also were sacked. The hunt is on by the new Board of Directors of SATYAM to appoint a new CEO and CFO. This is the first time in history of corporate India that the promoters of a company have admitted in black and white that they ‗siphoned off‘ money from the company. This is the biggest corporate fraud till date in the history of corporate India.
Q3 results for the current fiscal were dismal from corporate India and hence the equity markets were bearish in Jan‘09. Also global cues were weak but SENSEX outperformed ^DJI as per details as under. Only a few blue chip stocks in the Pharma and FMCG Sectors declared good results forQ3 current fiscal in the Indian equity markets. FIIs were net sellers of Indian equities in Jan‘09 to the tune of approx. Rs. 5146.00 Crores ( US $ 1.05 billion ). DIIs were active buyers of Indian equities. M/s. Life Insurance Company of India ( LIC for all future reference ) was a large buyer ofIndian equities in the month of Jan‘09. Hence the SENSEX did not correct in a direct co-relation as ^DJI as has been the case in the past one year or so.
LIC is the largest life insurance company in India and is State owned. LIC was a buyer of equities under a ―dictat‖ from Govt. of India to protect the slide of the Indian Stock Markets. This was on account of the forthcoming General Elections in India in April and May 2009. Govt. of India decided in the month of Dec‘08 that LIC should invest additional Rs. 17000 Crores ( US $ 3.47 billion ) in the Indian equities in January thru March‘09 so that the sentiment should not be ‗gloomy‘ during election times. This is a sham. Playing with taxpayer‘s money ! But that is what
India is all about. The current UPA coalition Govt. in New Delhi wishes to be back in power again after the General Elections.
So tell LIC to invest additional US $ 3.47 billions in Indian equities in three months and keep theSENSEX afloat. Stinks of sleaze ! But this is happening all over the world thru ‗Economic Stimuli‘ programs to save banks, financial institutions etc. I think India is the only country where the State is directly buying equities in the open market and this news is now in public domain. If FIIs press 'sell button' in Feb‘09 as I suppose they will – LIC will make losses on its PMS Portfolio. But then who bothers in India about taxpayer‘s money ?^DJI closed today at 8001 down 8.83% from close of 8776 as of 31st December‘08. The intra month low and high were 7909 and 9035. SENSEX outperformed ^DJI in Jan‘09 as Govt. of India thru

LIC was directly involved in buying of equities.There are all kinds of predictions in the world markets regarding ^DJI testing 7000 to 6000 to even 4000 in calendar 2009. Same is true for the SENSEX. Analysts are predicting levels of 8100 to
23
www.final-yearproject.com | www.finalyearthesis.com
7000 to 6000 to even 5000 in 2009. But now this news regarding LIC is in public domain and henceI am revising my ‗extra bearish‘ views on the SENSEX for February 2009.
Global markets are also gloomy on the back of ^DJI. Russia‘s benchmark Index - ^RTSI tested a new two year low of 493 on 23rd Jan‘09. France‘s benchmark Index ^CAC 40 also tested a new two year low of 2770 on the same date. There are talks about ―Sovereign Defaults‖ of Debts of –Greece, Portugal, Spain, Ireland and Norway. This is bad news about the equity markets in Europe. Economic indicators are weak from USA. News from the world‘s largest economy continues to be gloomy as from Japan, Germany, and UK. There are concerns of a massive slowdown in the Chinese economy. CITIBANK is being re-structured in USA after massive losses for Q4 2008.Bank of America needs ‗more‘ financial aid from the American Govt. RBS in UK announced the largest yearly loss by any company so far in the history of England. HSBC Bank needs fresh capital. DEUTSCHE Bank in Germany and MITSUBISHI UFJ Bank in Japan also reported losses for Q4 2008 and record losses for the calendar 2008. The whole world is grappling with the financial crisis which shows no sign of ‗tapering off‘. One hears one bad news after the other in some part of the world or the other in the media.On 8th Jan‘09 – Bank of England lowered its ‗short term‘ key interest rate by 50 bpts to only 1.50%, lowest rate since the Bank was set up in the late 17th century. On 15th
Jan‘09 – ECB cut its ‗short term‘ key interest rate by 50 bpts to 2.00 % in response to the global economic crisis which is casting a fresh doubt on the ability of the top Banks to survive. There is a very strong rumour going around in Wall Street that one big Bank in USA will go down under in Feb‘09. As per a leading US analyst – a sum of US $ 1.50 trillion is needed to save the Banks in USA. The situation is worse than in 1929. The current global crisis is ‗structural‘. It reflects a serious misallocation of money in the recent years. This had created many ―bubbles‖ that have now gone burst. Pumping in more money will not solve the problem, since it will amount to ‗reflate‘ the old bubbles. Instead a painful ‗structural change‘ is needed. This could take a few years. I feel American economy will go downhill till 2012.I am bearish for the SENSEX for the month of February 2009. But I am revising my support levels on the back of LIC‘s investment plans. The levels to watch are :R1 9860 R2 10200 R3 10600 R4 11000S1 9160 S2 9000 S3 8310 S4 8100
I feel ^DJI will test a level of 7000 in Feb‘09 and this for the time being will be the low for this Index for 2009. On the back of this global markets will also test their yearly lows in Feb‘09.Crude Oil closed today at NYMEX at US $ 41.75 pbbl down 6.40% from the close of US $ 44.60 pbbl as of 31st Dec‘08. As I have mentioned in the last month‘s update that Crude will only be bullish above US $ 57.00 pbbl. Below this Crude can test any level as low as US $ 30.00 pbbl.
Global analysts predict an average price of Crude Oil to be in the range of US $ 50.00 to 75.00 pbbl for 2009. I still hold my view that the fair price of Crude Oil is US $ 60.00 to 75.00 pbbl. I still stick to my long term target price of Crude to be US $ 180.00 to 300.00 pbbl in 2010 and 2012 respectively.At prices below US $ 55.00 to 60.00 pbbl the Russian economy ‗goes for a toss‘. Hence the crash of their benchmark Stock Market Index ^RTSI in Moscow to a new two year low of 493 as against 550 earlier.Gold Spot NY closed today at US $ 927.00 pto up 5.34% from the close of US $ 880.80 pto as of 31st Dec‘08. I expect Gold to correct in Feb‘09 when ^DJI corrects as predicted above. Gold might test US $ 820.00 pto in Feb‘09. This is a golden opportunity for an investor who so far has no Gold holdings. Buy physical Gold when the prices correct in Feb‘09.

February will be the toughest month in 2009 for the global equity markets. Stay away from the equity markets in February !
24
www.final-yearproject.com | www.finalyearthesis.com
India‘s Economic Stimuli - Friday 2 nd January 2009
Government of India announced it‘s first economic stimulus package on 5th
December 2008 but I did not cover this on my January 2009 forecast as I was waiting for the second bigger stimulus package. I wanted to cover the combined impact of both the stimulus packages on the Indian financial markets – especially the Equity Markets. The second stimulus package was announced by Government of India on Friday 2nd January 2009. As the investors are aware – almost all the economies in the world have announced fiscal and monetary stimuli packages in the month of
December 2008 to fight ‗slowing down‘ of their respective economies as a result of the onset of a ‗deep recession‘ in the biggest economy of the world – United States of America. I am not listing the details of the specific stimuli packages announced by various countries in the world as the details are now in public domain. So are the details of Indian stimulus but I am getting a lot of e mails from my associates, friends and a few clients regarding my opinion and views on the impact of the various policy measures announced. As if my opinion matters !

25
www.final-yearproject.com | www.finalyearthesis.com
6. PROFILE
26

www.final-yearproject.com | www.finalyearthesis.com
PROFILE
One of my friend who is a stock broker met me in the early part of this year and we were discussing the details of the previous bull run and corrections. The post harshad mehta and also the ketan parekh period were discussed. Both the times the market had corrected more than half. Without going into cumbersome details I would get into the facts. The market touched 21,000 and the correction will stop only if the market reaches 8,000. As such market will touch well below 10,000 before December 2009.
Many people were angry and astonished about the predictions simply because it was hitting the wildest expectation. Certain criterion of Indian stock market needs to be understood. Earlier times when the sensex market went up it went up slowly and there was minimum level of correction followed by gains. Now the Indian stock market will go down very fastly as much as it goes up fastly. As such the correction will be twice the speed of the up wards moment.
Therefore when the stock market reached 21,000 points at a fast speed, it is not a wonder when the market touched 12,000 points within nine months. Many people use the technical chart and fundamental chart. Most of the markets has become the momentum market which replicates the global market more or less.
27
www.final-yearproject.com | www.finalyearthesis.com
Here is a timeline on the rise and rise of the Sensex through Indian stock market history.
The first time and closed at 1,001 in the wake of a good monsoon and excellent corporate results.
2000, January 15, 1992 - On January 15, 1992, the Sensex crossed the 2,000-mark and closed at 2,020 followed by the liberal economic policy initiatives undertaken by the then finance minister and current Prime Minister Dr Manmohan Singh .
3000, February 29, 1992 - On February 29, 1992, the Sensex surged past the 3000 mark in the wake of the market-friendly Budget announced by Manmohan Singh.
4000, March 30, 1992 - On March 30, 1992, the Sensex crossed the 4,000-mark and closed at 4,091 on the expectations of a liberal export-import policy. It was then that the Harsha d Mehta scam hit the markets and Sensex witnessed unabated selling.
5000, October 11, 1999 - On October 8, 1999, the Sensex crossed the 5,000-mark as the Bharatiya Janata Part y -led coalition won the majority in the 13th Lok Sabha election.
6000, February 11, 2000 - On February 11, 2000, the information technology boom helped the Sensex to cross the 6,000-mark and hit and all time high of 6,006.
7000, June 21, 2005 - On June 20, 2005, the news of the settlement between the Amban i brothers boosted investor sentiments and the scrips of RIL , Reliance Energ y , Relianc e Capital and IPCL made huge gains. This helped the Sensex crossed 7,000 points for the first time.
8000, September 8, 2005 - On September 8, 2005, the Bombay Stock Exchange's benchmark 30-share index – the Sensex - crossed the 8000 level following brisk buying by foreign and domestic funds in early trading.
9000, December 9, 2005 - The Sensex on November 28, 2005 crossed 9000 to touch 9000.32 points during mid-session at the Bombay Stock Exchange on the back of frantic buying spree by foreign institutional investors and well supported by local operators as well as retail investors.
10,000, February 7, 2006 - The Sensex on February 6, 2006 touched 10,003 points during mid-session. The Sensex finally closed above the 10,000-mark on February 7, 2006.
11,000, March 27, 2006 - The Sensex on March 21, 2006 crossed 11,000 and touched a peak of 11,001 points during mid-session at the Bombay Stock Exchange for the first time. However, it was on March 27, 2006 that the Sensex first closed at over 11,000 points.
12,000, April 20, 2006 - The Sensex on April 20, 2006 crossed 12,000 and touched a peak of 12,004 points during mid-session at the Bombay Stock Exchange for the first time.
13,000, October 30, 2006 - The Sensex on October 30, 2006 crossed 13,000 for the first time. It touched a peak of 13,039.36 and finally closed at 13,024.26.
28

www.final-yearproject.com | www.finalyearthesis.com
14,000, December 5, 2006 - The Sensex on December 5, 2006 crossed 14,000.
15,000, July 6, 2007 - The Sensex on July 6, 2007 crossed 15,000 mark.
16,000, September 19, 2007 - The Sensex on September 19, 2007 crossed the 16,000 mark.
17,000, September 26, 2007 - The Sensex on September 26, 2007 crossed the 17,000 mark for the first time.
18,000, October 9, 2007 - The Sensex on October 09, 2007 crossed the 18,000 mark for the first time.
19,000, October 15, 2007 - The Sensex on October 15, 2007 crossed the 19,000 mark for the first time.
20,000, October 29, 2007 - The Sensex on October 29, 2007 crossed the 20,000 mark for the first time.
21,000, Jan 08, 2008 - The Sensex on January 08, 2008 touched all time peak of 21078 before
closing at 20873. [
January 2008
In the third week of January 2008, the Sensex experienced huge falls along with other markets around the world. On January 21, 2008, the Sensex saw its highest ever loss of 1,408 points at the end of the session. The Sensex recovered to close at 17,605.40 after it tumbled to the day's low of 16,963.96, on high volatility as investors panicked following weak global cues amid fears of a recession in the US.
The next day, the BSE Sensex index went into a free fall. The index hit the lower circuit breaker in barely a minute after the markets opened at 10 AM. Trading was suspended for an hour. On reopening at 10.55 AM IST , the market saw its biggest intra-day fall when it hit a low of 15,332, down 2,273 points. However, after reassurance from the Finance Minister of India , the market bounced back to close at 16,730 with a loss of 875 points.
Over the course of two days, the BSE Sensex in India dropped from 19,013 on Monday morning to 16,730 by Tuesday evening or a two day fall of 13.9%.
9,975, October 17, 2008 - Sensex crashes below the psychological 5 figure mark of 10K, following extremely negative global financial indications in US and other countries. Exactly one year back in October 2007, Sensex had gone past the 20K mark.
8701.07, October 24 , 2008 lost 10.96% of its value on the intra day trade, the 3rd highest loss for a one day period in its history.
JANUARYThe year 2008 will be remembered for a long time by equity investors as a terrible year as most of the investors have not seen this kind of carnage in their life time. This type of global correction in
29
www.final-yearproject.com | www.finalyearthesis.com
equities and commodities was only witnessed in 1929 to 1931 in USA during the Great Depression of 1929. The American economy is slipping into ‗deflation‘ and this has an effect on the whole world. All major economies of the world are in a fire fighting mode and are ‗pumping money‘ into their respective economies. They are resorting to ‗fiscal stimuli‘ to tide over this financial crisis not witnessed since 1929. The collapse of Lehman Brothers in USA has triggered a ‗systemic failure ‘ of the financial markets in USA and has led to a global financial crisis of unparallel dimensions.
BSE SENSEX closed today Wednesday 31st Dec‘08 at 9647 up 6.09 % from 28th Nov‘08 close of 9093. The intra-month low and high for BSE SENSEX for Dec‘08 were 8601 and 10189 respectively. I was bullish for the SENSEX for Nov‘08. SENSEX and ^DJI were both in ‗oversold territory‘ in Nov‘08 and a ‗bear rally‘ was expected in Dec‘08. Bear market rallies can be very severe and punters put ‗stop losses‘ or hedge their ‗shorts‘ by buying respective ‗calls‘. The rally in BSE SENSEX from the low of 7697 as of 27th Oct‘08 to 10189 as of 19th Dec‘08 was very sharp – up by 32.38 % from the 7697 level.
^DJI closed today at 8776 down marginally 0.60 % from 28th Nov‘08 close of 8829. The intra month low and high for ^DJI for the month of Dec‘08 were 8149 and 8924. The bear rally for ^DJI was equally severe – 20.73 % up from low of 7392 till 8924.
I have mentioned in my last update that for the year 2009 – BSE SENSEX will take cues from ^DJI.Hence the details for ^DJI are being posted. I have no choice till BSE SENSEX is ‗decoupled‘ from ^DJI. Both ^DJI and BSE SENSEX are still in a ‗long term‘ bear phase. For the ‗short term‘ both ^DJI and SENSEX are in an ‗uptrend‘ but they will find a very stiff resistance at 10000 and 11000 levels respectively. The support level for ^DJI is 8270. If ^DJI closes for three consecutive days below 8270 – then the journey towards its 52 week low of 7392 will resume. The support level for BSE SENSEX is 9630. It will start its journey towards its 52 week low of 7697 if BSE SENSEX closes below 9630 for three consecutive days. I predict this may not happen in the month of January 2009 but can happen within Q1 2009. I am bearish on Indian equities for January 2009.The levels to watch for ^DJI for Jan‘09 are :R1 9000 R2 9300 R3 9600 R4 10000 R5 10500S1 8670 S2 8400 S3 8270 S4 8000 S5 7390 S6 7000 The levels to watch for BSE SENSEX for Jan‘09 are :R1 9860 R2 10200 R3 10600 R4 11000 R5 11800S1 9630 S2 9000 S3 8310 S4 7650 S5 7500 S6 7000
The sensex plunged below 10000, falling to its lowest level since June 2006 as fears of a global economic downturn increased, prompting investors to hammer front-line stocks.
The index shed 5.7 per cent, or 606 points, to close at 9975.35. The fall snuffed out Rs 1,63,346 crore of paper wealth.
The scary ride from irrational exuberance to chilling gloom in just nine months opened up one question: how many more peaks will the sensex topple from before the close of what has been a

horrific year for investors?
30
www.final-yearproject.com | www.finalyearthesis.com
Eleven 1000-point peaks have crumbed since early January — some have fallen within a day, others in less than two months. The prophets of doom predict the sensex could sink below 9000 long before December — and perhaps head lower.
The index had opened strong with a gain of nearly 182 points over Thursday‘s close. But it soon crumbled under the weight of heavy selling by foreign funds. A string of weak second-quarter earnings numbers and a cut in revenue guidance by Satyam Computer Services added to the gloomy outlook. By noon, there were reports that US index futures had fallen, precipitated by a report that new housing construction in America had fallen to its lowest level in 17 years.
Reliance Industries — the highest-weighted stock in the sensex—tumbled over 6 per cent to Rs 1305.25, its lowest level since March 16 last year. Infosys sank 4.8 per cent to a three-year low.
The deeper worry for the investors was the wild swing in the index: today, the difference between the index high and the low was over 875 points — the sharpest single-day oscillation this month.
Between March and June, the index took 67 days to lose a thousand points; but the past two 1000-point drops have come in just three and five trading sessions, respectively.
The index fell to the present level from a peak of 21,206.77 points in a matter of nine months. This was also the lowest level for the 30-share index since July 24, 2006.
The key index had opened on a positive note after two successive days of losses, but was ruling flat post-noon amid some volatile trading, as sentiments remained nervous over possible recession in the US. Then onward there was a steady and steep decline, during
which the index touched the day's low of 9,911.32 points.
Apart from the global crisis, the crash has been caused by redemption pressures of mutual funds which are forced to sell at cheaper prices in order to honour their commitments.
“People are scared," said Bijay Murmuria, director with Sumedha Fiscal Services and President of the Association of National Exchanges Members of India.
“No one is willing to invest and this fear factor is having a chain effect on everybody," Murmuria said in Kolkata.The shadow of US recession and the global economic slowdown
weighed so heavily on the mood that investors chose to ignore the steps by the government and the Reserve bank to infuse more liquidity into the system.
Market regulator Securities & Exchange Board of India's (SEBI) decision to raise margins in the derivatives segment also weighed on investor sentiment. A sharp fall in Reliance Industries, an index heavyweight, on concerns of fall in refinery margins weighed on the market. Aggressive cut in cash reserve ratio (CRR) by the Reserve Bank of India (RBI) and pledges by policymakers around the world to pour cash into troubled banks had boosted markets at the beginning of the week. The BSE Mid-Cap index fell 3.57 pc at 3,544.84 and the BSE Small-Cap index fell 4.31 pc at
4,167.86. Both the indices outperformed the Sensex.
31

www.final-yearproject.com | www.finalyearthesis.com
The Sensex was down to 10,311.64 points, or 50.82 pc, in the calendar year 2008 so far from its close of 20,286.99 on December 31, 2007. It is 11,231.42 points, or 52.96 pc, below its all-time high of 21,206.77 struck on January 10.
BSE Bankex was down 4.27 pc to 5,546.69, BSE Realty eased 0.07 pc to 2,524.89, BSE Healthcare index came down 0.13 pc to 3,209.02, BSE IT eased 1.82 pc to 2,537.27, BSE Consumer Durables index dropped 2.53 pc to 2,085.28 and BSE Auto index eased 4.79 pc to 3,099.60.
The other sectoral indices, besidex FMCG index, outperformed the Sensex in the week ended yesterday.
BSE Metal eased 11.32 pc to 5,801.71, BSE Oil & Gas declined 10.90 pc to 6,479.56, BSE Capital Goods dropped 9.29 pc to 7,241.36, BSE Power eased 7.70 pc to 1,712.27 and BSE PSU plunged 5.43 pc to 5,235.48. These sectoral indices underperformed the Sensex in the week.
SEBI tightened margins in the derivatives segment to ward defaults and curb volatility. The exposure margin for gross open positions in single stock futures and gross open positions in stock options will now be higher of 10 pc or 1.5 times the standard deviation in the notional value of the positions.
Market regulator Securities & Exchange Board of India's (SEBI) decision to raise margins in the derivatives segment also weighed on investor sentiment. A sharp fall in Reliance Industries, an index heavyweight, on concerns of fall in refinery margins weighed on the market. Aggressive cut in cash reserve ratio (CRR) by the Reserve Bank of India (RBI) and pledges by policymakers around the world to pour cash into troubled banks had boosted markets at the beginning of the week. The BSE Mid-Cap index fell 3.57 pc at 3,544.84 and the BSE Small-Cap index fell 4.31 pc at 4,167.86. Both the indices outperformed the Sensex.
The Sensex was down to 10,311.64 points, or 50.82 pc, in the calendar year 2008 so far from its close of 20,286.99 on December 31, 2007. It is 11,231.42 points, or 52.96 pc, below its all-time high of 21,206.77 struck on January 10.
BSE Bankex was down 4.27 pc to 5,546.69, BSE Realty eased 0.07 pc to 2,524.89, BSE Healthcare index came down 0.13 pc to 3,209.02, BSE IT eased 1.82 pc to 2,537.27, BSE Consumer Durables index dropped 2.53 pc to 2,085.28 and BSE Auto index eased 4.79 pc to 3,099.60.
The other sectoral indices, besidex FMCG index, outperformed the Sensex in the week ended yesterday.
BSE Metal eased 11.32 pc to 5,801.71, BSE Oil & Gas declined 10.90 pc to 6,479.56, BSE Capital Goods dropped 9.29 pc to 7,241.36, BSE Power eased 7.70 pc to 1,712.27 and BSE PSU plunged 5.43 pc to 5,235.48. These sectoral indices underperformed the Sensex in the week.
SEBI tightened margins in the derivatives segment to ward defaults and curb volatility. The exposure margin for gross open positions in single stock futures and gross open positions in stock options will now be higher of 10 pc or 1.5 times the standard deviation in the notional value of the positions.
32

www.final-yearproject.com | www.finalyearthesis.com
Mumbai: The Bombay Stock Exchange 30-share Sensex ended 180 points lower amid high volatility as easing inflationary pressure helped markets recover part of the early losses while scandal-hit Satyam plunged for the second day in succession.
India's fourth-largest software exporter Satyam hit its all-time low of Rs 11.50 per share on the BSE, a fall of 94 per cent from its closing level of January 6, after the company confessed to its manipulating accounts.
Satyam shares also hit their record low of Rs 6.30 per share from Tuesday's close of Rs 178.95 on the NSE.
A strong recovery on selective buying support alternated with sustained selling pressure in shares.
The BSE bellwether settled the day at 9,406.47, netting a fall of 180.41 points or 1.88 percent from its last close. It is the last day for Satyam in the Sensex family as it would be replaced by Sun Pharma with effect from January 12. It will also be replaced by Reliance Capital in the Nifty.
Satyam Computer is also being removed from other indices such as the BSE IT, BSE-100, BSE-
200, BSE-500 and BSE Teck. The broader 50-share Nifty of the National Stock Exchange tumbled
by 47.40 points or 1.62 per cent to close at 2,873.00 from its previous close. Brokers said the market
recovered smartly from the day's low of 9,250.82 as inflation fell below 6 per cent for the first time
in 10 months, prompting a surge in bank stocks.
They said weak global cues as well as fears of capital outflow and a widespread impact of the worst scandal in corporate history, however, kept the markets under pressure.
33

www.final-yearproject.com | www.finalyearthesis.com
7.DATA COLLECTION
&DATA ANALYSIS
34

www.final-yearproject.com | www.finalyearthesis.com
DATA COLLECTION & ANALYSIS
According to Shankar Sharma of First Global the trend in stock market is still down and the rally from 12,500-15,000 is over and done with.
He thinks that India is going to benefit when the oil prices correct and the correction will be sharp. According to him, India will benefit from fund reallocation in Emerging Markets, or EMs if crude cracks.
He feels that the stock markets may slip to 10,000 levels this year or early next year and may then start moving up gradually over next three years. He sees the Sensex bottom within the 10,000-12,500 range. He believes that the market could double from lows but that may be short-lived.
In infrastructure stocks he thinks valuations of BHEL, L&T is still expensive. He doubts further high returns from SBI and feels that the rally is over. RIL may drive the next leg of fall in the market and could test levels substantially below Rs 2,000 per share, he said. He doesn't see much downside for IT from current levels.
Sharma said, "Nothing has really changed. The GDP numbers have come in confirming our fears but this is just a recent set of numbers. We don't know what lies ahead.
Overall the trend is down punctuated by the rallies we keep seeing. When I say bull market, I mean taking out the highs and continuing to the path of 25000 and beyond. Markets could reach 18000-19000 - that rally is still to be played out. So, markets can double from lows but that still won't be a bull market.
It will coincide with crude having come off, some talk of political certainty because inflation has cooled off. That rally will propel stock markets close to 20,000 but I doubt if that will be so quick. Crude has to come off substantially at USD 80-85 per barrel. Our case is it will and may take 12 months to get to the USD 50 per barrel levels. Crude may rally 10-20% from its lows. When it hits USD 50 per barrel, you will see India begin to come back on its own."
The interest rates are on their way down and back to the levels of two years ago. Inflation is down to nearly 6.5%. The rupee is at an all time low of 50 against the dollar. The crude prices are below $50abarrel.
With the new pay commission for the central government employees and significant pay hike just announced for the PSUs, the urban purchasing power should be strengthening. The year has had its standard quota of monsoon. The last quarter ended fairly well, at 7.5% growth.
Nearing elections, the government has been bending backward, easing up on an array of policies. The government has already announced its continuing commitment to invest heavily in infrastructure.
Real estate prices are down to more realistic levels and home loans are headed southwards as well. The worst hit suffered by an Indian bank by the subprime crisis is the ICICI Bank, according to which the hit is a mere $32 million that has been accounted for by the bank. Our foreign exchange reserves remain a healthy $260 odd billion. The Mumbai terror attack has unified the country like never before. Mumbai is on the move again.
35

www.final-yearproject.com | www.finalyearthesis.com
But Sensex is not at 30,000. It is closer to 10,000. Not counting the Mumbai terror attacks, which were a later phenomenon, our gloom about the financial crisis is all about the Sensex plummeting below 10,000. So our financial crisis is really a crisis of Sensex rather than any real effect of the subprimerelatedcrisis.
36
www.final-yearproject.com | www.finalyearthesis.com
Some companies CEOs, directors &chairman’s asked their idea:-
Krishnamurthy VijayanCEO, JM Mutual Fund
In the run-up to the elections, some amount of volatility is expected. But the underlying fundamentals are strong. Retail investors should keep in mind three things: First, stay away from little-known, little-researched companies with rosy results. Second, if buying stocks of a top company, set a target and don‘t get nervous over intra-day drops. And finally, if you don‘t have the wherewithal to play the market, go in for a mutual fund with a dividend option.
Motilal OswalChairman, Motilal Oswal Securities
AT any extreme point, volatility will come. With time the definition of volatility keeps changing. Earlier it was a movement of 50-100 points, now it is between 100-200 points. One hundred points on a 3000 index is 3 per cent and even 200 points on 6000 is 3 per cent. With such a large number of players, huge amount of money and high index levels, this movement is not a cause of concern. Investors need not worry about the ups and downs of the market. Instead, they must take the opportunity to invest in good quality stocks.
Anup BagchiCOO, ICICI Direct
THE volatility is mainly because of the large open positions in the derivative market which have come down in the last few days. The rumour on foreign funds not being able to participate in the market is not playing such a large role in market sentiment. It‘s the arbitrage position between cash and futures which is playing a large rol
NK SharmaCEO, IL&FS Mutual Fund
FROM 2500 to 6000 is quite a journey. In fact each point that the market covered during its climb was a journey in itself. So, although volatility is an issue, it is all very momentary. The market will consolidate at the 6200 level, and will remain there for the next 12 months. All the fundamentals — the corporate results, government decisions — are moving in the right direction, so I don‘t see the markets falling anytime soon. I‘d advise investors to look at a 12-15 month horizon now.
S K MitraMD, Birla Sunlife Mutual Fund
WELL, this is pre-election time, new sops are being announced everyday, corporate results are out, more results are expected... as a result of all this, the market is behaving erratically. But once the elections are over and we have a stable government, this will stop... the market will settle down to more realistic levels. For the average investor, I will always advise investment through mutual funds. Don‘t put all your money in equities. There should be a 80:20 break, 80 in fixed and 20 in equities. Book profit and then recycle it back to the 80:20 formula.
37

www.final-yearproject.com | www.finalyearthesis.com
Shailendra BhandariCEO, Centurion Bank
international markets. Once the market is able to come to terms with the gains, we will see more stability. The misunderstanding about the entire PN issue had also added to the choppiness. But I foresee the market maintaining the same (high) levels, simply because our economy is doing well. As far as investors are concerned, the next three years are looking great. But, yes, equity will outperform any other investment tool.
SEBI NOTES
Sebi relaxing the norms on p notes or on the crr hike can only hold the market temporarily. With the mighty dasa of Venus coming to end and sun bhukthi beginning not only political and also economics of this country is in for major changes.
Global market will continue in the turmoil phase till end of December 2008. When Jupiter enters the tenth house in kalapurhsha chart situation can cool down.
As such till July 2009 this problem in the global market will persist.
Someone spoke about tsunami which will hit 2012. This financial problem is bigger in magnitude and calamity which is rewriting the world financial order for ever.
38
www.final-yearproject.com | www.finalyearthesis.com
The Sensex reflects the price movements of shares. If the Sensex rises, it indicates the market isdoing well.
The price of every stock price rises or falls for two possible reasons:
News about the company, Great earnings, great annual or quarterly results, product launch, closure of a factory, the government providing tax or duty exemptions to the sector so more profits expected, a feud among the company's top bosses, etc. This will be stock specific news.
News about the country Testing a nuclear bomb, a terrorist attack, the Budget announcement, new tax regime, declaration of war, change of government, good monsoons and hence a good agricultural crop, etc. This will be called index news.
The job of an index is mainly to capture the news about the country. This will reflect the movement of the stock market as a whole. It could also reflect the sentiment of the market as a whole. If corporate India is largely doing well, then it will get reflected here.
A good index will only capture news that is common to all stocks in India. This is what the Sensex does. In order to present a broad picture, the stocks selected are from different sectors.
5. The value of each of the stocks in the Sensex is not equal.The market cap method Each of the 30 stocks in the Sensex has a weight attached to it. This weight depends on the market capitalization of the stock.
Market capitalization refers to the number of shares of a company multiplied by its market value (the price of each share). For instance, if a company has 10 million shares whose value is Rs 30 per share on July 1, 2006, it will have a market cap of Rs 300 million on July 1, 2004.
Let's assume the market cap of the 30 Sensex stocks is Rs 3,00,000 crore. Let us also assume the market cap of ITC (which is one of the 30 shares that make up the Sensex) is Rs 20,000 crore, thenITC's weight in the Sensex is 6.66%.
The rise or fall in the price of ITC's shares will impact the Sensex to that extent.This is referred to as the full market capitalization methodology.
Free-float weight age Here, a company's entire lot of shares are not taken into account (which means we are not looking at the entire market capitalization) . Only the shares readily available for trading are considered.
In every company, a certain amount of shares are not available for trading on the stock exchange. These shares could be held by the government or the promoters of the company. Under the free-float weightage method, they are not taken into account. How does the stock exchange arrive at this weightage? In this case, the market cap is multiplied by the free float factor (which is the proportion of a company's shares that can be readily bought andsold).The Sensex uses the free-float weightage method.The Sensex's free-float market cap at close of business on December 3, 2005, was Rs 3,66,124 crore.
Unlike the Sensex, the 50 stocks in Nifty -- the index of the National Stock Exchange -- is based on the market cap method and not the free-float method.
39
www.final-yearproject.com | www.finalyearthesis.com
8.
CONCLUSIONS
40
www.final-yearproject.com | www.finalyearthesis.com
Conclusion
Throughout my project work I realized that India is not suffering from this Economic Meltdown because we know that this Economic meltdown is due to the Bankruptcy of the U.S. Economy or we can say it is due to the bankruptcy of some financial organisations that is why Indian Sensex gone down to the level of 10000 and also to the level of 7000 to 8000. The decline in Sensex is due the withdrawal of investment by the Foreign Institutional Investor (FII). Due to the bankruptcy of U.S. Economy all Foreign Direct Investments have been withdrew by foreign investors form the Indian market and according to my opinion this can be the most important cause of Sensex decline as well as Economic Meltdown.
41
www.final-yearproject.com | www.finalyearthesis.com
9.
Future Scope
42
www.final-yearproject.com | www.finalyearthesis.com
FUTURE SCOPE
1. The study of this subject that is Sensex is very vast Subject. It cannot be completed by making only a single project. It requires lot of time, knowledge and professional skills to completely understand the Sensex below 10000 and I request reader to make a deep analysis of the Sensex as it will be helpful.
2. There are also chances of upward shift in Indian Sensex if the global economic condition will improve.
3. Indian Economic conditions can be improved if the SEBI and Government of India ease the FDI norms further more.
43

www.final-yearproject.com | www.finalyearthesis.com
10.
BIBLIOGRAPHY
44

www.final-yearproject.com | www.finalyearthesis.com
BIBLIOGRAPHY
News papers.
Magazines.
www.google.co m.
www.yahoo.com.
45