Embed Size (px)
Citation preview

G D A R GULF DATA, ASSESSMENT, AND REVIEW
GDAR 02
Gulf Menhaden Stock Assessment
2016 Update
October 2016
Prepared by Dr. Amy Schueller NOAA Fisheries
Beaufort Laboratory Beaufort, NC
GSMFC Number 254
Gulf Data, Assessment, and Review Gulf States Marine Fisheries Commission
2404 Government Street Ocean Springs, MS 39564

Gulf States Marine Fisheries Commission Commissioners and Proxies
ALABAMA N. Gunter Guy Jr., Commissioner Alabama Department of Conservation and Natural Resources 64 North Union Street Montgomery, AL 36130-1901
Proxy: Chris Blankenship, Director ADCNR, Marine Resources Division P.O. Drawer 458 Gulf Shores, AL 36547
Representative Steve McMillan P.O. Box 337 Bay Minette, AL 36507 Chris Nelson Bon Secour Fisheries, Inc. P.O. Box 60 Bon Secour, AL 36511 FLORIDA Nick Wiley, Executive Director FL Fish and Wildlife Conservation Commission 620 South Meridian Street Tallahassee, FL 32399-1600
Proxy: Dan Ellinor FL Fish and Wildlife Conservation Commission 620 South Meridian Box 4B2 Tallahassee, FL 32399-1600
Senator Thad Altman State Senator, District 24 6767 North Wickham Road, Suite 211 Melbourne, FL 32940 Michael Hansen 393 Cooperwood Road Crawfordville, FL 32327 LOUISIANA Charles Melancon, Secretary Louisiana Department of Wildlife and Fisheries P.O. Box 98000 Baton Rouge, LA 70898-9000
Proxy: Patrick Banks Louisiana Dept. of Wildlife and Fisheries P.O. Box 98000 Baton Rouge, LA 70898-9000
Senator R.L. “Bret” Allain, II State of Louisiana District 21 600 Main Street, Suite 1 Franklin, LA 70538 John Roussel 7072 Wayne Floyd Road Gonzales, LA 70737 MISSISSIPPI Jamie Miller, Executive Director Mississippi Department of Marine Resources 1141 Bayview Avenue Biloxi, MS 39530
Proxy: Kelly Lucas Mississippi Department of Marine Resources 1141 Bayview Avenue Biloxi, MS 39530
Senator Brice Wiggins 1501 Roswell St Pascagoula, MS 39581 Joe Gill, Jr. Joe Gill Consulting, LLC P.O. Box 535 Ocean Springs, MS 39566-0535 TEXAS Carter Smith, Executive Director Texas Parks and Wildlife Department 4200 Smith School Road Austin, TX 78744 Proxy Robin Riechers and Mark Lingo Coastal Fisheries Division Texas Parks and Wildlife Department 4200 Smith School Road Austin, TX 78744 Troy Bello Williamson, II P.O. 967 Corpus Christi, TX 78403 Representative Wayne Faircloth Texas House of Representatives 2121 Market Street, Suite 205 Galveston, TX 77550

GDAR02 Stock Assessment Update October 2016
Gulf States Marine Fisheries Commission
GDAR 02 - Gulf Menhaden Stock Assessment Update
Submitted to the Gulf States Marine Fisheries Commission
October 2016
Prepared by the GSMFC State-Federal Fisheries Management Committee’s
Menhaden Advisory Committee
A publication of the Gulf States Marine Fisheries Commission pursuant to National Oceanic and Atmospheric Administration Award Number NA10NMF4070006. This publication is funded by a grant from the National Oceanic and Atmospheric Administration. The views expressed herein are those of the author(s) and do not necessarily reflect the views of NOAA or any of its sub-agencies.

GDAR02 Stock Assessment Update October 2016
This page intentionally left blank
GDAR02 Stock Assessment Update Report October 2016
ii
Table of Contents 1 GDAR Participants .................................................................................................................... 1
2 Executive Summary .................................................................................................................. 2
3 Data Review and Updates ........................................................................................................ 3
3.1 Life History ....................................................................................................................... 3
3.2 Landings ........................................................................................................................... 3
3.3 Indices of abundance ...................................................................................................... 4
3.4 Length Composition ........................................................................................................ 5
3.5 Age Composition ............................................................................................................. 5
4 Stock Assessment Model and Results ..................................................................................... 6
4.1 Model Methods ............................................................................................................... 6
4.1.1 Overview ................................................................................................................. 6
4.1.2 Data Sources ........................................................................................................... 6
4.1.3 Base Model Configuration ..................................................................................... 6
4.1.4 Per Recruit and Equilibrium Analyses ................................................................... 8
4.1.5 Biological Reference Points ................................................................................... 8
4.1.6 Sensitivity and Retrospective Analyses ................................................................. 9
4.1.7 Uncertainty and Measures of Precision .............................................................. 10
4.2 Model Results ................................................................................................................ 11
4.2.1 Base Run Results .................................................................................................. 11
4.2.2 Per Recruit and Equilibrium Analyses ................................................................. 12
4.2.3 Benchmarks/Reference Points ............................................................................ 12
4.2.4 Status of the Stock and Fishery ........................................................................... 12
4.2.5 Sensitivity and Retrospective Analyses ............................................................... 13
4.2.6 Comparison with Previous Assessment .............................................................. 13
5 Discussion ............................................................................................................................... 13
5.1 Recommendations for the Next Benchmark Assessment ........................................... 13
6 References .............................................................................................................................. 15

GDAR02 Stock Assessment Update Report October 2016
iii
7 Tables ...................................................................................................................................... 16
8 Figures ..................................................................................................................................... 28
Appendices ................................................................................................................................... 66
A Parameter estimates and negative log-likelihood values .................................................... 66

GDAR02 Stock Assessment Update Report October 2016
iv
List of Tables 1 Life history characteristics at age of Gulf menhaden, including maturity, natural
mortality (M), fecundity, and weight (g) at spawning ...................................................... 16 2 Observed total landings in 1,000s of mt by year for the Gulf menhaden fishery.
Landings include reduction landings, bait landings, and recreational landings ............... 17 3 Observed indices of abundance and coefficient of variation (CV) from the seine
survey and the gillnet survey ............................................................................................ 18 4 Sample sizes (number of sets) for length (len) and age (age) compositions by
fleet and survey. Data sources include the commercial reduction fishery (cR) and the gillnet survey........................................................................................................ 19
5 Annual proportion at age from the commercial reduction fishery input to the Gulf menhaden model ...................................................................................................... 20
6 Annual proportion at length from the gillnet survey input to the Gulf menhaden model. Each column is indicated by the mid-point of the length bin ........... 21
7 Estimated total abundance at age (in billions of fish) at the start of the year ................. 22 8 Estimated biomass at age (1,000s mt) at start of year. At the start of the year,
age-0 biomass is zero as spawning hasn’t occurred yet ................................................... 23 9 Estimated time series of status indicators, fishing mortality, and spawning
stock biomass (fecundity). Fishing mortality rate is full F. Spawning biomass (SSB, fecundity) is at the start of the year (time of peak spawning) ................................ 24
10 Estimated instantaneous fishing mortality rate (per year) at age.................................... 25 11 Estimated status indicators, benchmarks, and related quantities from the
Beaufort catch-age model conditional on estimated current selectivity. Rate estimates (F) are in units of y-1, and status indicators are dimensionless. Spawning stock biomass is measured in total fecundity in billions of eggs ..................... 26
12 Estimated status indicators, benchmarks, and related quantities from the Beaufort catch-age model for each sensitivity run completed and for the retrospective analysis. Rate estimates (F) are in units of y-1, and status indicators are dimensionless. Spawning stock biomass is measured in total fecundity in billions of eggs .............................................................................................. 27
GDAR02 Stock Assessment Update Report October 2016
v
List of Figures 1 The seine survey index standardized to include LA, MS, and AL (labeled with LA);
MS and AL only (labeled without LA); and from the last benchmark assessment. Dashed lines are the 95% confidence intervals for the indices ........................................ 28
2 The gillnet index from the benchmark SEDAR 32A assessment (labeled Gillnet) and updated for the current assessment (labeled Updated gillnet) ................................ 29
3 Comparison of length sample sizes annually from the LA gillnet survey. These data were used to calculate the length compositions for the adult gillnet index ............ 30
4 Comparison of annual length composition data from the benchmark assessment (left) and for the update assessment (right)..................................................................... 31
5 Observed (open circles) and estimated (line, solid circles) commercial reduction, commercial bait, and recreational landings (1,000s mt) .................................................. 32
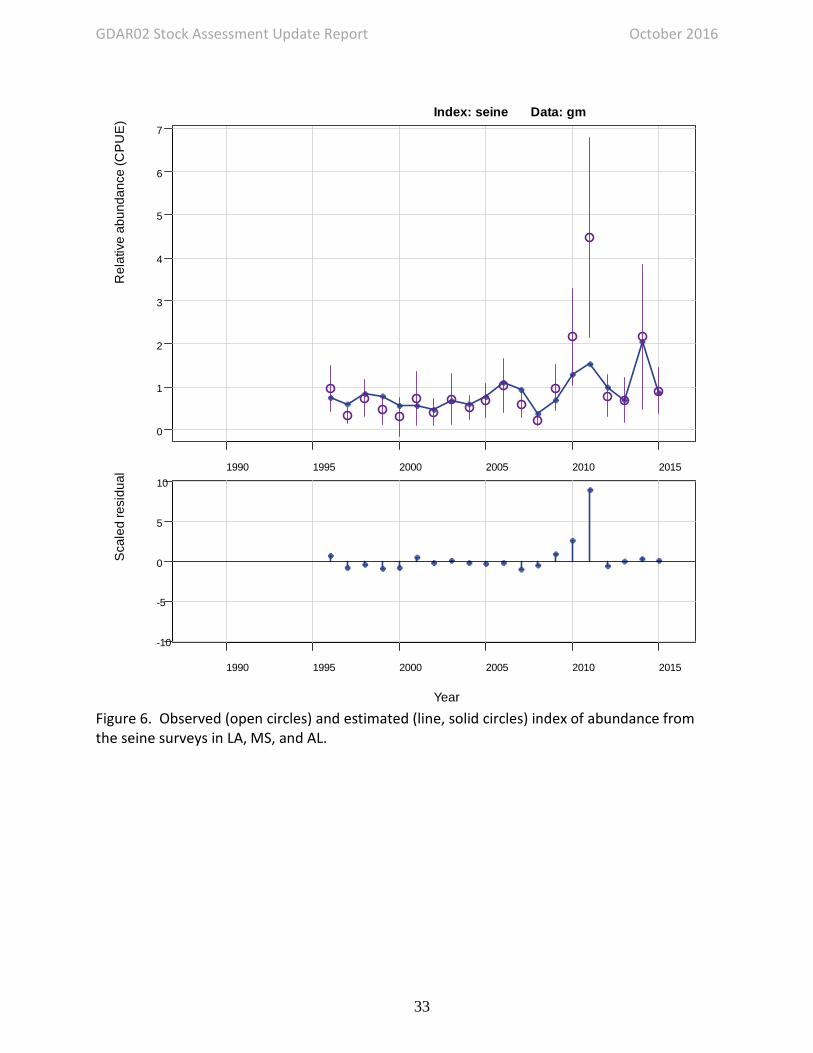
6 Observed (open circles) and estimated (line, solid circles) index of abundance from the seine surveys in LA, MS, and AL ......................................................................... 33
7 Observed (open circles) and estimated (line, solid circles) index of abundance from the LA gillnet survey ................................................................................................. 34
8 Observed (open circles) and estimated (solid line) annual length and age compositions by fleet or survey. In panels indicating the data set, lcomp refers to length compositions, acomp to age compositions, cR to commercial reduction, and gill to the gillnet survey. N indicates the number of trips from which individual fish samples were taken ................................................................... 35-39
9 Bubble plot of the gillnet index length compositions for 1988 – 2015. The correlation on the bottom of the figure indicates the correlation between the observed and predicted data ............................................................................................ 40
10 Bubble plot of the commercial reduction fishery age compositions for 1977 – 2015. The correlation on the bottom of the figure indicates the correlation between the observed and predicted data ...................................................................... 41
11 Estimated abundance at age at the start of the year ....................................................... 42 12 Estimated recruitment of age-0 fish in billions ................................................................. 43 13 Estimated biomass at age at start of year ........................................................................ 44 14 Estimated total biomass (1,000s mt) at start of year ....................................................... 45 15 Estimated spawning stock biomass (fecundity in billions of eggs) at time of peak
spawning ........................................................................................................................... 46 16 Selectivity of the commercial reduction fleet, 1977 – 2015 ............................................. 47 17 Selectivity of the LA gillnet survey, 1988 – 2015 .............................................................. 48 18 Estimated fully selected fishing mortality rate (per year) for the commercial
reduction fishery ............................................................................................................... 49 19 Beverton-Holt spawner-recruit curves, with and without lognormal bias
correction. Years within panel indicate year recruitment was generated from spawning biomass in that same year ................................................................................ 50
20 Spawning biomass per recruit relative to that at the unfished level), from which the 30% and 35% levels provide F30% and F35% ................................................................. 51

GDAR02 Stock Assessment Update Report October 2016
vi
21 Estimated time series relative to threshold benchmarks. Solid line indicates estimates from base run of the Beaufort Assessment Model; gray error bands indicate 5th and 95th percentiles of the MCB trials. Top panel: F relative to F30%. Bottom panel: spawning stock biomass, measured as fecundity, relative to SSB30% .............................................................................................................................. 52
22 Probability densities of terminal status estimates from MCB analysis of the Beaufort Assessment Model. Vertical lines represent point estimates from the base run ............................................................................................................................ 53
23 Phase plot of terminal status estimates from MCB analysis of the Beaufort Assessment Model. The red point indicates estimates from the base run; the black points are individual MCB trials............................................................................... 54
24 Phase plot of annual estimates of fishing mortality (F) and spawning stock biomass (SSB) or fecundity from the base BAM model. Dashed vertical and horizontal lines indicate the reference point thresholds at F30% and SSB30%. A year in the green zone indicates that the population is not overfished and that overfishing is not occurring. Placement in the yellow zones would indicate that one of the stock indicator thresholds had been exceeded and red would indicate that both thresholds had been exceeded ......................................................................... 55
25 Time series of F/F30% for the sensitivity runs with the solid black line with open circles being the base run ................................................................................................. 56
26 Time series of SSB/SSB30% for sensitivity runs. The solid black line with open circles is the base run ........................................................................................................ 57
27 Retrospective analyses. Sensitivity to terminal year of data on the estimation of fishing mortality rate ........................................................................................................ 58
28 Retrospective analyses. Sensitivity to terminal year of data on the estimation of biomass ............................................................................................................................. 59
29 Retrospective analyses. Sensitivity to terminal year of data on the estimation of fecundity ........................................................................................................................... 60
30 Retrospective analyses. Sensitivity to terminal year of data on the estimation of recruitment ....................................................................................................................... 60
31 Retrospective analyses. Sensitivity to terminal year of data on the estimation of F/F30% ................................................................................................................................. 62
32 Retrospective analyses. Sensitivity to terminal year of data on the estimation of SSB/SSB30% ......................................................................................................................... 63
33 Spawning stock biomass estimates in billions of eggs for the benchmark assessment from SEDAR 32A in blue and for the update assessment in black with points ................................................................................................................................ 64
34 Recruitment time series for the benchmark assessment from SEDAR 32A in blue and for the update assessment in black with points ........................................................ 65

GDAR02 Stock Assessment Update Report October 2016
1
1 Contributors
Dr. Amy Schueller – NOAA Beaufort Lab, Beaufort, NC
Mr. John Mareska – ADCNR/MRD, Dauphin Island, AL
Mr. Jerry Mambretti – TPWD, Port Arthur, TX
Mr. Fernando Martinez-Andrade – TPWD, Corpus Christi, TX
Mr. Borden Wallace, Westbank Fishing, Empire, LA
Mr. Rick Schillaci, Menhaden Advisory Council for the Gulf of Mexico
Mr. Ray Mroch, NOAA Beaufort Lab, Beaufort, NC
Mr. Scott Herbert – Daybrook Fisheries, Empire, LA
Dr. Robert Leaf – GCRL/USM, Ocean Springs, MS
Ms. Nancy Brown-Peterson - GCRL/USM, Ocean Springs, MS
Mr. Peter Himchak, Omega Protein Inc.
Mr. Matt Hill – MDMR, Biloxi, MS
Mr. Harry Blanchet – LDWF, Baton Rouge, LA
Mr. Jason Adriance – LDWF, New Orleans, LA
Mr. Steve VanderKooy – GSMFC, Ocean Springs, MS
Ms. Debbie McIntyre – GSMFC, Ocean Springs, MS

GDAR02 Stock Assessment Update Report October 2016
2
2 Executive Summary This assessment provides an update to the 2013 Gulf menhaden (Brevoortia patronus) benchmark for the Gulf of Mexico. The assessment was updated with recent data from 2012-2015. No changes in structure or parameterization were made to the base model run. Corrections made to data inputs were minor and are described in the body of this report. The assessment period was 1977-2015. Updated data included commercial reduction, commercial bait, and recreational landings; age compositions from the commercial reduction landings; the coastwide juvenile abundance index based on seine surveys; the adult abundance index based on a gillnet survey; and the biological parameters for the assessment such as mean weight at age and natural mortality. The primary model, updated here, was the Beaufort Assessment Model (BAM), a statistical catch-age formulation. Additional sensitivity analyses and Monte Carlo bootstraps (MCBs) were also conducted. Stock status was evaluated by measuring the 2015 spawning stock biomass (measured as fecundity) and the 2015 fishing mortality rate against the respective threshold benchmarks of SSB30% and F30%. For the base run configuration of BAM, the fishing mortality rate decreased during the 1990s and has remained at a low level since. Additionally, spawning stock biomass (measured as fecundity) has increased steadily since the 1990s and has remained at a high level since. The base run configuration of BAM indicates that the Gulf of Mexico Gulf menhaden stock is not experiencing overfishing and is not overfished. The sensitivity runs and MCBs indicate that the stock status is highly likely to be as indicated by the base run. The stock status for the updated assessment remained the same as the stock status from the benchmark assessment completed during SEDAR 32A. The update assessment has a greater increase in population biomass and spawning stock biomass than the benchmark assessment did; however, this is likely due to increasing indices for both the juvenile abundance index and the adult gillnet index. In addition, the estimate of R0 increased with the additional years of data; however, the parameter was well estimated based on a likelihood profile. The Menhaden Advisory Committee (MAC) recommends that the next benchmark assessment occur in two years (2018), that new data be further explored and considered, and that data currently being used be re-evaluated.

GDAR02 Stock Assessment Update Report October 2016
3
3 Data Review and Updates In the SEDAR 32A benchmark, the assessment period was 1977–2011. In this update, the terminal year was extended to 2015; making the assessment period 1977-2015. Many of the data sources for the stock assessment remained static, while others were simply updated with the additional four years of data. Bait landings were modified slightly, as described below. In this update assessment, the Beaufort Assessment Model (BAM) was fitted to the same data sources as in SEDAR 32A:
• Landings: commercial reduction, commercial bait, and recreational • Indices of abundance: juvenile abundance index based on seine surveys and
adult abundance index based on a gillnet survey • Age compositions of landings: commercial reduction • Length compositions of indices: gillnet adult survey
3.1 Life History Some life history inputs from SEDAR 32A remained the same in this assessment including the length-length conversions, the ageing error matrix, the age-length key, and the maturity vector. Other life history inputs were updated to include samples from additional years of data. The overall weight-length relationship and von Bertalanffy growth relationship were updated to include new biological data from 2012 to 2015. These relationships were determined using the same methods as the benchmark assessment with the overall differences in the relationships being small. Changes to these relationships impacted the overall mean weight at age during spawning, the mean weight at age during the middle of the fishing year, the mean fecundity at age, and the natural mortality at age. The mean weight at age during spawning changed less than 1% per age, while the mean weight at age during the middle of the fishing year also changed less than 1% per age. Mean fecundity at age changed 3% or less by age. Finally, natural mortality was updated using the overall mean weights at age using the same methods as used in the last benchmark assessment (Table 1). 3.2 Landings Estimates of landings were updated with 2012-2015 data using the methods outlined in SEDAR 32A (Table 2). Commercial reduction landings and recreational landings were strictly updated using the same methods as during the benchmark assessment. Commercial bait landings were also updated with 2012-2015 data; however, a decision made during the benchmark assessment was reversed. As a consequence, the entire bait landings time series was adjusted. In the previous assessment, gear codes 100 and 125 from the Accumulated Landings System (ALS) database were censored as those landings were thought to be part of the reduction landings time series because the gears indicate purse seine gears. However, a bait boat is currently operating in the Gulf of Mexico and unloading their catches as bait, which are being

GDAR02 Stock Assessment Update Report October 2016
4
recorded under those two censored gear codes. Therefore, the MAC made the decision to keep codes 100 and 125 as bait landings. The resultant coastwide catches increased only slightly (less than 2% annually). 3.3 Indices of abundance Both the juvenile abundance index based on seine surveys from LA, AL, and MS, and the adult abundance index based on a gillnet survey from LA were updated with data from 2012-2015. Each index was standardized using the methods from the benchmark assessment. The terminal year of the seine index in the last benchmark assessment was 2010, because the state of LA had made changes to their survey at the end of 2010. It was unclear to the MAC how the survey changes would impact standardization of the abundance index. So the MAC decided to censor the data point. For this update assessment, the index was updated to include 2011 to 2015. The state of LA has made several changes to sampling over that time period as summarized here:
• Prior to October of 2010 all sites were sampled monthly from January to August and twice monthly from September to December;
• In October of 2010, Louisiana Department of Wildlife and Fisheries (LDWF) expanded the number of survey sites and began sampling all sites monthly;
• In January of 2011, all seine sites began being sampled quarterly (using standard quarters beginning in January, April, July, and October) with all samples due by the end of each quarter;
• Beginning in February of 2013, seine samples were conducted quarterly, during the first month of LDWF selected quarters only (sampling occurred in February, May, August, and November); and
• In July of 2014, seine sampling went to a monthly schedule with all sites sampled monthly.
The MAC discussed these changes over the past five years. The MAC requested seeing the index with and without LA (Figure 1) to see the impact the inclusion of LA would have on the overall trend of the index. Based on these versions of the index, the MAC determined that the state of LA was adequately sampling for index determination, regardless of the survey changes. The addition of LA resulted in the same trend over time but seemed to diminish the variability associated with the index given the larger sample sizes for each year. Thus, the index was updated to include all years through the terminal year of 2015 (Table 3). The gillnet survey for the adult abundance index has also experienced some changes over the past few years. Prior to October of 2010, all historic gillnet sites (fixed stations) were sampled monthly from October through March and twice monthly from April through September. In October of 2010, additional fixed sampling sites were added to increase the spatial coverage of the survey in all basins. All historic and new sites were sampled on the same schedule as described above. In April of 2013, the survey design was modified to be a random draw of a set number of fixed stations (including both old and new) within each basin each month. The number of samples taken from each basin each month was based on a statistical review and

GDAR02 Stock Assessment Update Report October 2016
5
analysis completed by LDWF. Random stations are sampled at the same frequency as described above. During months with two rounds of sampling, random stations are drawn with replacement during each round. In addition to the survey changes in the state of LA, station identification numbers changed in the state database for each survey since the last assessment. Because of that, data for station codes used in the last assessment needed to be matched up to station codes from the current database using a key provided by the state of LA. This led to slightly different sample sizes for the length compositions associated with the gillnet index and to slightly different data from the state of LA for the seine index. However, the overall indices did not change in trend and the various versions of the index were contained within the confidence intervals of each other (Figures 1 and 2; Table 3). 3.4 Length Composition Length compositions were developed from the gillnet survey. Sample sizes for the gillnet length compositions increased slightly compared to the benchmark assessment due to the matching of station codes between the new and old databases (see section above for a description; Figure 3; Table 4; Table 6). However, the overall proportions of lengths per bin did not change significantly (Figure 4). The gillnet length compositions were updated to include 2012 to 2015 using the same methods as used in the benchmark assessment. 3.5 Age Composition Age data were available from the commercial reduction fishery. Ages greater than four were pooled to create a plus group. Fishery age compositions were updated to include 2012 to 2015 using the same methods as in the last benchmark assessment (Table 5).

GDAR02 Stock Assessment Update Report October 2016
6
4 Stock Assessment Model and Results 4.1 Model Methods 4.1.1 Overview The Beaufort Assessment Model (BAM) that was developed for the Gulf menhaden benchmark during SEDAR 32A was updated in this assessment. The BAM applies a statistical catch-age formulation (Williams and Shertzer 2015) and was implemented with the AD Model Builder software (ADMB Foundation 2011). 4.1.2 Data Sources The catch-age model included data from two sets of fishery-independent surveys and one fleet consisting of the commercial reduction landings, commercial bait landings, and recreational landings. The data sources used for this assessment were the same as those used for the benchmark assessment. The model was fitted to annual landings, annual age compositions of landings, two indices of abundance (seine juvenile abundance index and gillnet adult abundance index), and annual length compositions of the gillnet adult abundance index. Data used in the model are described and tabulated in Section 3 of this report. 4.1.3 Base Model Configuration Base model configuration was identical to the base model configuration during the SEDAR 32A benchmark assessment. A general description of the base run configuration follows. Stock Dynamics: In the assessment model, new biomass was acquired through growth and recruitment, while abundance of existing cohorts experienced exponential decay from fishing and natural mortality. The population was assumed closed to immigration and emigration. The model included age classes 0 to 4+, where the oldest age class 4+ allowed for the accumulation of fish (i.e., plus group). Initialization: Initial (1977) abundance at age was assumed equal to the equilibrium age structure given initial fishing mortality estimated in the model. The equilibrium age structure was computed for ages 0 to 4 based on natural and fishing mortality, where F was set equal to the initial fishing mortality rate estimated in the model based on fitting to the available data. Natural Mortality Rate: The natural mortality rate (M) was assumed constant over time, but decreasing with age. The form of M as a function of age was based on Lorenzen (1996). The Lorenzen estimates at age, Ma, were rescaled such that the age-2 M was equal to the natural mortality estimated from a tagging study (Ahrenholz 1981), as was done in the benchmark assessment.

GDAR02 Stock Assessment Update Report October 2016
7
Growth: Mean size at age of the population (fork length, FL) was modeled with the von Bertalanffy growth equation where the parameters were estimated in the model. Weight at age was fixed and an input into the model, as was done for the benchmark assessment. For fitting length composition data, the distribution of size at age was assumed normal with the coefficient of variation (CV) estimated by the assessment model. Female Maturity: Females were modeled to be fully mature at age-2, while the proportion mature at ages 0 and 1 were fixed at 0.0. Spawning Stock: Spawning stock was modeled using fecundity, which is a product of the number of females, the proportion mature, and the mean fecundity at age. For Gulf menhaden, spawning was considered to occur on January 1, the same date at which the fish turned a year older. Recruitment: Expected recruitment of age-0 fish was predicted from the spawning stock using the Beverton-Holt spawner-recruit model with the steepness parameter fixed at 0.75. Annual variation in recruitment was assumed to occur with lognormal deviations for the years 1977 –2015. Annual recruitment variation was informed by annual age composition data during 1977 – 2015 and an index of abundance for recruitment during 1996 – 2015. Autocorrelation in recruitment deviations was assumed to be zero. Landings: The model included a time series of landings that was a combination of landings from the commercial reduction purse seine fleet, commercial bait landings, and recreational landings for 1977 – 2015. A large portion of the landings, ~99%, are from the commercial reduction fleet. Landings were modeled with the Baranov catch equation (Baranov 1918) and were fitted in units of 1,000s of metric tons (mt). Fishing Mortality: The assessment model estimated an annual full fishing mortality rate (F) for each year of the landings time series. Age specific rates were then computed as the product of full F and selectivity at age. Selectivities: The selectivity curve applied to landings was age-specific, dome-shaped, and fixed for most ages. Age-0 selectivity was fixed at 0.0, age-2 selectivity was fixed at 1.0, ages-3 and -4 selectivities were fixed at 0.35, and age-1 selectivity was estimated, as was done during the benchmark assessment. Selectivity for the recruitment index (seine index) was 1.0 for age-0 and 0.0 for all other ages. Finally, selectivity for the gillnet index was estimated as a logistic or flat-topped function with two parameters being estimated. Indices of Abundance: The model was fitted to two indices of relative abundance: a seine index (1996 – 2015) and a gillnet index (1988 – 2015). The seine index was considered to represent relative changes in recruitment over time, and the gillnet index was considered to represent relative changes in adult abundance over time. Predicted indices were conditional on the selectivity specified or estimated and were computed from abundance at the beginning of the year for the seine index and the mid-point of the year for the gillnet index.

GDAR02 Stock Assessment Update Report October 2016
8
Catchability: In the BAM, catchability scales indices of relative abundance to estimated exploitable abundance at large. Following the methodology used in the SEDAR 32A base run, the update assessment assumed time-invariant catchability for both the seine index and the gillnet index. Fitting Criterion: The fitting criterion was a penalized likelihood approach in which observed landings were fitted closely, and observed composition data and abundance indices were fitted to the degree that they were compatible. Landings and index data were fitted using lognormal likelihoods. Composition data were fitted using robust multinomial likelihoods (Francis 2011). For the robust multinomial likelihood for the age compositions, the number of purse seine sets sampled was used as the measure of effective sample size. For the robust multinomial likelihood for the length compositions, the number of gillnet sets sampled was used as the measure of effective sample size. The model includes the capability for each component of the likelihood to be weighted by user-supplied values. For data components, these weights were applied by either adjusting CVs (lognormal components) or adjusting effective samples sizes (multinomial components). In this application to Gulf menhaden, CVs of landings (in arithmetic space) were assumed equal to 0.04. Weights on other data components (indices, age and length compositions) were adjusted iteratively until the standard deviation of the normalized residuals (SDNR) were near 1.0, as was done in the last assessment. The SDNR for the age compositions was near 0.5, as in the last assessment. Parameters Estimated: The model estimated annual fishing mortality rates, selectivity parameters, catchability coefficients for each index, parameters of the spawner-recruit model, annual recruitment deviations, and growth parameters. All parameters were estimated as described in SEDAR 32A. 4.1.4 Per Recruit and Equilibrium Analyses Spawning potential ratio was computed as a function of F, as were equilibrium landings and spawning biomass. Equilibrium analyses applied the most recent selectivity pattern. 4.1.5 Biological Reference Points The biological reference points (benchmarks) of interest for this assessment are spawning potential ratio (SPR) based. Given the uncertainty with the spawner-recruit curve and the fact that steepness was fixed, the MAC decided to use SPR-based reference points. The fishing mortality reference points are F30% for the threshold and F35% for the target. The spawning stock is measured in total population fecundity and is the fecundity associated with the fishing mortality rate benchmarks, SSB30% and SSB35%. The benchmarks are conditional on the estimated selectivity function. Therefore, overfishing is defined as F > F30%, and overfished is defined as SSB < SSB30%. Current status of the stock is represented by SSB in the latest

GDAR02 Stock Assessment Update Report October 2016
9
assessment year (2015), and current status of the fishery is represented by the F from the terminal year (2015). The calculation of reference points was done exactly as it was done in the SEDAR 32A benchmark assessment. 4.1.6 Sensitivity and Retrospective Analyses Three sets of sensitivity runs were completed in order to explore different parameterizations of the model, new or different data inputs, or if a retrospective pattern exists. First, sensitivity runs were completed with different parameterizations of the base run of the stock assessment. A sensitivity run was completed allowing steepness (h) of the stock-recruitment curve to be estimated freely, as opposed to being fixed at 0.75, as in the base run. This sensitivity run allowed exploring estimability of the steepness parameter, which might be possible given that there is more contrast in the data during recent years. A sensitivity run was also completed allowing the selectivity for ages-3 and -4 for the commercial reduction fishery to be estimated freely, as opposed to being fixed at 0.35, as in the base run. This sensitivity allowed for the exploration of the estimability of the selectivity curve for the fishery given the additional contrast in the input data. Second, sensitivity runs were completed considering different options for data that were input in the benchmark stock assessment. A sensitivity run was completed with bait landings treated as they were in the benchmark assessment. Specifically, gear codes 100 and 125 were censored from the bait landings. This allowed the MAC to determine the influence of the bait landings from those codes on the outcomes of the assessment. The censoring of those landings was expected to have very little influence on the overall outcomes of the stock assessment. A sensitivity run was also completed using the seine index from the last benchmark assessment. Given the changes in the seine survey over time in the state of LA, the MAC wanted to see the impact of the decision to include the 2011-2015 data into the seine index. Third, sensitivity runs were completed to consider the new life history information available from Brown-Peterson et al. (In review). Specifically, the interest was in seeing the response to changes in the updated maturity ogive and the updated mean age specific fecundity vector. The MAC was interested to determine how the updates to these data would impact assessment outcomes both as standalone changes and as changes in tandem. As a result, five sensitivity runs were completed. The first run increased age-1 maturity from 0.0 to 0.68 indicating that a large proportion of fish that are age-1 on January 1 are mature. The second run changed the fecundity vector to the lower end fecundity estimated from Brown-Peterson et al. (In review) based on the lowest number of spawns per season by age. The third run changed the fecundity vector to the higher end fecundity estimated from Brown-Peterson et al. (In review) based on the highest number of spawns per season by age. The fourth run changed the fecundity vector to the lower estimate and changed the maturity at age-1 to 0.68. The fifth run changed the fecundity vector to the higher estimate and changed the maturity at age-1 to 0.68.

GDAR02 Stock Assessment Update Report October 2016
10
Finally, a retrospective analysis was completed by sequentially removing the last year of data from the assessment such that the terminal year was 2014, 2013, 2012, and 2011. This analysis was completed to see how influential additional years of data are on the outcomes of the stock assessment and is a common diagnostic of stock assessments. List of sensitivity runs:
1. Steepness freely estimating 2. Freely estimating ages-3 and -4 selectivity for the commercial reduction fishery 3. Using seine index from last benchmark assessment 4. Excluding gears 100 and 125 from the bait landings 5. Retrospecitve with the terminal year of 2014 6. Retrospecitve with the terminal year of 2013 7. Retrospecitve with the terminal year of 2012 8. Retrospecitve with the terminal year of 2011 9. Maturity at age-1 = 0.68 10. Fecundity vector changed to low values from Brown-Peterson 11. Fecundity vector changed to high values from Brown-Peterson 12. Fecundity vector changed to low values from Brown-Peterson, maturity at age-1 = 0.68 13. Fecundity vector changed to high values from Brown-Peterson, maturity at age-1 = 0.68
4.1.7 Uncertainty and Measures of Precision Uncertainty was explored using the sensitivity runs described above and a mixed Monte Carlo and bootstrap procedure (MCBs) described here. MCBs were configured as they were configured during the benchmark stock assessment. The MCBs captured the full expectation of uncertainty given the input data, fixed parameters, and life history data. In this update assessment, the BAM was successively refit to n = 5,000 trials that differed from the original inputs by bootstrapping on data sources and by Monte Carlo sampling of several key input parameters. Runs with extremely large values for R0 were trimmed from the final uncertainty characterization (these runs also had other parameters that were considered unrealistic). The set-up of the MCB runs for this update was the same as the specifications described in SEDAR 32A. The MCB analysis should be interpreted as providing an approximation to the uncertainty associated with each output. The results are approximate for two related reasons. First, not all combinations of Monte Carlo parameter inputs are equally likely, as biological parameters might be correlated. Second, all runs are given equal weight in the results, yet some might provide better fits to data than others.

GDAR02 Stock Assessment Update Report October 2016
11
4.2 Model Results 4.2.1 Base Run Results Measures of Overall Model Fit: Generally, the BAM fit the available data well. The model was configured to fit observed commercial landings closely (Figure 5). The model was configured to fit the observed seine and gillnet indices as closely as possible (Figures 6 and 7). Since the late 2000s and early 2010s, the general trend in the gillnet index has been increasing, while at the same time the seine index has indicated several large year classes of recruits occurring in 2010, 2011, and 2014. Predicted length compositions from the gillnet index and predicted age compositions from the reduction fishery were both reasonably close to observed data in most years (Figures 8, 9, and 10). Parameter Estimates: Estimates of all parameters from the catch-age model are shown in Appendix A. Estimates of management quantities and some key parameters are reported in sections below. Stock Abundance and Recruitment: Estimated abundance was relatively stable from 1977 until the mid-2000s, then estimated abundance increased until 2015 yet was more variable (Figure 11). Older ages appear to be more prevalent in the most recent time period. (Table 7). Annual estimated number of recruits is shown to increase in recent years in Table 7 (age-0 column) and in Figure 12. The model has identified the 2010, 2011, and 2014 year classes as being strong. The benchmark assessment during SEDAR 32A also identified 2010 and 2011 as being likely to be strong year classes. Total and Spawning Biomass (Fecundity): Estimated biomass and biomass at age exhibited a largely similar pattern to that of abundance (Figures 13 and 14; Table 8). Total biomass was stable from 1977 until the mid-2000s, when the biomass started to increase. Estimated fecundity was stable from 1977 to the mid-1990s after which fecundity has increased until 2015 (Figure 15). Selectivity: The selectivity estimate for age-1 fish captured in the commercial reduction fishery was similar to the estimate during the last benchmark assessment (Figure 16). The selectivity for all of the other ages was fixed and resulted in dome-shaped selectivity, as was done in the benchmark assessment. The gillnet index selectivity was logistic or flat-topped and was fully selected at age-3 and nearly fully selected at age-2 (Figure 17). Fishing Mortality: Estimated fishing mortality rates (F) were high from 1977 to the mid-1990s with the highest fishing mortality rates occurring in the mid- to late-1980s (Figure 18; Tables 9 and 10). After the mid-1990s, the fishing mortality rate has continued to decline, but at a slower rate. Figure 5 shows total predicted landings in weight. Commercial harvest exceeded 800,000 mt during much of the 1980s, but declined afterwards to stabilize between 400,000 and 500,000 mt for much of the past decade (Figure 5).

GDAR02 Stock Assessment Update Report October 2016
12
Spawner-Recruitment Parameters: The estimated Beverton-Holt spawner-recruit curve is shown in Figure 19. Values of recruitment-related parameters were as follows: assumed steepness, h = 0.75; unfished age-0 recruitment, R0 = 126.81; unfished spawning biomass per recruit, ɸ0 = 1090.26; and assumed standard deviation of recruitment residuals in log space, σ = 0.60 (which resulted in a bias correction, ϛ = 1.20). Uncertainty in these quantities was estimated through the MCB analysis. 4.2.2 Per Recruit and Equilibrium Analyses Yield per recruit and spawning potential ratio were computed as functions of F (Figure 20). These analyses applied the most recent selectivity pattern. The Fs that provide 30% and 35% SPR are 5.98 and 4.28, respectively (Table 11). As in per recruit analyses, equilibrium landings and spawning biomass were computed as functions of F (Figure 20). Equilibrium landings for SPR values of 30% and 35% were 862,361 mt and 829,737 mt, respectively. Equilibrium spawning biomass for SPR values of 30% and 35% were 41,605 and 50,635 billions of eggs, respectively. 4.2.3 Benchmarks/Reference Points Biological reference points (benchmarks) were derived analytically assuming equilibrium dynamics. The Gulf menhaden fishery is managed using spawning potential ratio (SPR) benchmarks, as outlined in the Fishery Management Plan (FMP; VanderKooy and Smith 2015). The current threshold for fishing mortality is F30%, and the current threshold for spawning stock biomass, measured as fecundity, is SSB30%. The current target for fishing mortality is F35%, and the current target for spawning stock biomass, measured as fecundity, is SSB35%. Standard errors of benchmarks were approximated as those from the MCB analysis. Estimates of benchmarks are summarized in Table 11. Point estimates of the benchmarks were F30% = 5.98, F35% = 4.28, SSB30% = 41,605, and SSB35% = 50,635. 4.2.4 Status of the Stock and Fishery Base run estimates of spawning stock biomass showed stability near the threshold during 1977 until the mid-1990s after which the SSB increased (Figure 15; Table 9). Current stock status in the base run was estimated to be SSB2015/SSB30% = 3.51 (Table 11). MCB analysis suggests that the stock status determination of being not overfished (i.e., SSB > SSB30%) has a low degree of uncertainty (Figures 21, 22, and 23). Over 99% of MCB runs were greater than SSB30% in the terminal year. The estimated time series of F/F30% suggests that overfishing has occurred historically, but only prior to 1990 (Figure 21; Table 9). Current fishery status in the terminal year is estimated in the base run to be F2015/F30% = 0.11 (Table 11). This estimate indicates that overfishing is not occurring and appears robust across MCB trials (Figures 22 and 23). Across all MCB runs, 99% of runs were less than F30% in the terminal year.

GDAR02 Stock Assessment Update Report October 2016
13
The Gulf of Mexico Gulf menhaden population is not overfished and overfishing is not occurring. The base run and all sensitivity runs indicate the same stock status. In addition, most of the MCB trials indicated the same stock status. In general, there is very little risk of overfishing or of being overfished (Figure 24). 4.2.5 Sensitivity and Retrospective Analyses Sensitivity runs, described above, are useful to evaluate the implications of decisions that were made during the benchmark assessment and to determine if new data inform the model better for some parameter estimates. All of the sensitivity analyses indicated similar stock status to the base run (Figures 25 and 26; Table 12). For the sensitivity run that estimated steepness freely, the estimated value was 0.59, while steepness was fixed at 0.75 in the base run. Retrospective analysis generally indicated no pattern in overestimation or underestimation. The fully selected fishing mortality rate looks very well-estimated regardless of how many years of data are peeled off (Figure 27). The biomass, spawning stock biomass, and recruitment show little retrospective pattern (Figures 28, 29, and 30) with differences attributable to high variability in terminal year data. For example, recruitment is variable as the BAM is trying to fit the terminal year seine index, which is highly variable with large year classes in the last several years. Finally, the reference point time series do not seem to indicate a pattern in overestimation or underestimation of stock status (Figures 31 and 32). 4.2.6 Comparison with Previous Assessment Spawning stock biomass (fecundity) and recruitment estimated by this assessment show trends similar to those from SEDAR 32A in the earliest years of the assessments (Figures 33 and 34). However, in the most recent years, the estimated stock trajectory in the update assessment is increasing at a greater rate. This is likely due to a number of factors including increased recruitment as indicated by the seine index, which then shows up as an increased level of adults in the gillnet index. The estimated R0 was much larger for the update of the stock assessment than for the benchmark assessment during SEDAR 32A. A likelihood profile was run on the estimate of R0 to make sure that the data were informative, and the result were that R0 was well defined by the data. 5 Discussion 5.1 Recommendations for the Next Benchmark Assessment The MAC recommends that the next peer-reviewed assessment occur during 2018. Gulf menhaden are a short-lived species and would benefit from a shorter time between assessments such as 2-3 years.

GDAR02 Stock Assessment Update Report October 2016
14
During the next benchmark assessment four data items should warrant further consideration or are recommended by the MAC. First, bait landings should be more fully investigated in order to elucidate the magnitude and trajectory of landings over time. In particular, codes 100 and 125 should be investigated further to more clearly delineate the extent of bait landings versus landing offloaded at the reduction facility. While the magnitude of the landings is low in comparison to the commercial reduction landings, it is nonetheless important to provide as accurate of a picture of landings as possible. Therefore, the MAC also recommends that biological samples (length, weight, and a scale sample) be collected from the bait boat in LA in order to characterize the composition of the catch. Second, investigation and consideration of the new maturity and fecundity data provided by Brown-Peterson et al. (In review) should be undertaken. Preliminary sensitivity runs indicate that the changes in maturity and fecundity at age will lead to differences in the scale of the population spawning stock biomass. Third, the MAC recommends that biological samples (length, weight, and a scale sample) be collected from the state surveys being used to provide the indices of abundance. The biological samples will provide information to the assessment on the ages of fish captured during the surveys and that are represented in the indices of abundance. Fourth, the MAC recommends further consideration of the genetic data currently available. Genetic data can be used to inform the species range for the assessment. However, the main interest from the MAC regarding the genetic data is whether or not data need to be censored east of the 88-degree longitude line for the surveys comprising the abundance indices.
GDAR02 Stock Assessment Update Report October 2016
15
6 References Ahrenholz, DW. 1981. Recruitment and exploitation of gulf menhaden, Brevoortia patronus.
Fishery Bulletin 79: 325-335. ADMB Foundation. 2015. AD Model Builder: automatic differentiation model builder.
Available: http://www.admb-project.org. Brown-Peterson, NJ, RT Leaf, AM Schueller, and MJ Andres. In review. Contemporary analysis
of the reproductive biology of Gulf menhaden, Brevoortia patronus in the northern Gulf of Mexico: impacts on stock dynamics.
Francis, R. 2011. Data weighting in statistical fisheries stock assessment models. Canadian
Journal of Fisheries and Aquatic Sciences 68: 1124-1138. Lorenzen, K. 1996. The relationship between body weight and natural mortality in juvenile and
adult fish: a comparison of natural ecosystems and aquaculture. Journal of Fish Biology 49: 627-647.
SEDAR 32A. 2013. SEDAR 32A Stock Assessment Report: Gulf of Mexico menhaden. VanderKooy, SJ, and JW Smith. 2015. The menhaden fishery of the Gulf of Mexico, United
States: a regional management plan. Published by Gulf States Marine Fisheries Commission.
Williams, EH, and KW Shertzer. 2015. Technical documentation of the Beaufort Assessment
Model (BAM). U.S. Department of Commerce NOAA Technical Memorandum NMFS-SEFSC-671. 43p.

GDAR02 Stock Assessment Update Report October 2016
16
7 Tables Table 1. Life history characteristics at age of Gulf menhaden, including maturity, natural mortality (M), fecundity, and weight (g) at spawning.
Age Maturity M Fecundity Weight at spawning 0 0.0 1.66 0 0.0 1 0.0 1.30 9423 50.7 2 1.0 1.10 21100 97.6 3 1.0 1.01 34680 146.1
4+ 1.0 0.96 48028 190.3

GDAR02 Stock Assessment Update Report October 2016
17
Table 2. Observed total landings in 1,000s of mt by year for the Gulf menhaden fishery. Landings include reduction landings, bait landings, and recreational landings.
Year Landings 1977 447.60 1978 820.60 1979 779.83 1980 702.50 1981 553.73 1982 855.53 1983 925.26 1984 985.12 1985 884.53 1986 830.88 1987 911.66 1988 640.19 1989 583.53 1990 539.52 1991 552.83 1992 432.73 1993 551.29 1994 774.92 1995 472.02 1996 491.75 1997 623.48 1998 495.66 1999 694.16 2000 590.78 2001 528.56 2002 582.62 2003 524.27 2004 473.74 2005 438.18 2006 467.65 2007 457.38 2008 425.57 2009 457.69 2010 379.93 2011 613.95 2012 579.77 2013 498.74 2014 400.67 2015 540.29

GDAR02 Stock Assessment Update Report October 2016
18
Table 3. Observed indices of abundance and coefficient of variation (CV) from the seine survey and the gillnet survey.
Year Gillnet Gillnet CV Seine Seine CV 1988 0.21 0.09 1989 0.17 0.09 1990 0.19 0.10 1991 0.20 0.11 1992 0.18 0.13 1993 0.31 0.15 1994 0.68 0.15 1995 0.42 0.15 1996 0.56 0.13 0.97 0.27 1997 1.01 0.13 0.34 0.27 1998 0.71 0.13 0.74 0.28 1999 0.63 0.13 0.48 0.35 2000 0.79 0.12 0.31 0.73 2001 1.24 0.12 0.73 0.43 2002 0.82 0.12 0.42 0.38 2003 0.85 0.12 0.71 0.42 2004 0.69 0.13 0.53 0.27 2005 1.00 0.12 0.69 0.29 2006 0.99 0.11 1.04 0.30 2007 0.77 0.12 0.61 0.27 2008 3.10 0.11 0.24 0.30 2009 2.15 0.10 0.98 0.27 2010 0.57 0.13 2.16 0.26 2011 1.71 0.10 4.47 0.26 2012 1.80 0.10 0.80 0.31 2013 2.05 0.15 0.70 0.37 2014 2.69 0.14 2.16 0.39 2015 1.49 0.15 0.91 0.29

GDAR02 Stock Assessment Update Report October 2016
19
Table 4. Sample sizes (number of sets) for length (len) and age (age) compositions by fleet and survey. Data sources include the commercial reduction fishery (cR) and the gillnet survey.
Year cR Gillnet 1977 1492 1978 1300 1979 1163 1980 1014 1981 1042 1982 1076 1983 1485 1984 1599 1985 1324 1986 1652 1987 1647 1988 1240 1989 1392 1990 1152 1991 1164 1992 1524 1993 1537 1994 1680 1995 1470 1996 1506 225 1997 1124 247 1998 1073 264 1999 1183 245 2000 969 300 2001 740 262 2002 836 277 2003 1066 283 2004 942 250 2005 899 258 2006 594 336 2007 657 286 2008 594 316 2009 748 351 2010 461 218 2011 835 397 2012 1087 447 2013 852 199 2014 878 195 2015 1145 177

GDAR02 Stock Assessment Update Report October 2016
20
Table 5. Annual proportion at age from the commercial reduction fishery input to the Gulf menhaden model.
Year Age-0 Age-1 Age-2 Age-3 Age-4+ 1977 0.000 0.763 0.218 0.018 0.001 1978 0.000 0.708 0.286 0.005 0.001 1979 0.000 0.593 0.363 0.043 0.001 1980 0.009 0.472 0.452 0.060 0.007 1981 0.000 0.763 0.189 0.044 0.005 1982 0.000 0.571 0.366 0.056 0.007 1983 0.000 0.526 0.428 0.043 0.003 1984 0.000 0.697 0.259 0.039 0.004 1985 0.000 0.758 0.218 0.020 0.003 1986 0.000 0.456 0.522 0.019 0.003 1987 0.000 0.603 0.358 0.038 0.001 1988 0.000 0.660 0.319 0.019 0.002 1989 0.000 0.766 0.224 0.009 0.000 1990 0.000 0.668 0.306 0.023 0.002 1991 0.000 0.462 0.487 0.045 0.006 1992 0.000 0.559 0.384 0.050 0.007 1993 0.001 0.666 0.292 0.037 0.004 1994 0.000 0.496 0.437 0.060 0.007 1995 0.000 0.351 0.622 0.026 0.001 1996 0.000 0.391 0.550 0.055 0.004 1997 0.000 0.544 0.403 0.046 0.007 1998 0.000 0.392 0.563 0.041 0.004 1999 0.000 0.544 0.386 0.067 0.003 2000 0.000 0.362 0.564 0.062 0.012 2001 0.000 0.250 0.672 0.074 0.005 2002 0.000 0.317 0.573 0.107 0.003 2003 0.000 0.362 0.571 0.064 0.003 2004 0.000 0.560 0.353 0.080 0.008 2005 0.019 0.394 0.541 0.043 0.003 2006 0.000 0.459 0.470 0.065 0.006 2007 0.000 0.463 0.510 0.024 0.004 2008 0.000 0.266 0.683 0.044 0.006 2009 0.000 0.126 0.731 0.129 0.013 2010 0.000 0.529 0.404 0.061 0.006 2011 0.007 0.632 0.317 0.037 0.007 2012 0.003 0.309 0.658 0.029 0.001 2013 0.002 0.245 0.727 0.025 0.001 2014 0.006 0.258 0.596 0.134 0.006 2015 0.000 0.625 0.309 0.062 0.005

GDAR02 Stock Assessment Update Report October 2016
21
Table 6. Annual proportion at length from the gillnet survey input to the Gulf menhaden model. Each column is indicated by the mid-point of the length bin.
Year 85 95 105 115 125 135 145 155 165 175 185 195 205 215 225 1996 0.01 0.02 0.01 0.02 0.07 0.16 0.16 0.09 0.11 0.11 0.07 0.05 0.04 0.04 0.03 1997 0.00 0.01 0.00 0.02 0.06 0.14 0.14 0.11 0.11 0.12 0.09 0.07 0.06 0.03 0.03 1998 0.00 0.01 0.01 0.02 0.07 0.18 0.19 0.11 0.11 0.12 0.07 0.04 0.03 0.02 0.02 1999 0.00 0.01 0.01 0.03 0.07 0.16 0.14 0.09 0.11 0.12 0.09 0.06 0.06 0.03 0.02 2000 0.00 0.01 0.01 0.02 0.06 0.14 0.11 0.07 0.07 0.12 0.12 0.09 0.08 0.06 0.04 2001 0.00 0.01 0.01 0.01 0.06 0.11 0.10 0.08 0.12 0.13 0.09 0.08 0.08 0.05 0.07 2002 0.00 0.01 0.01 0.03 0.06 0.14 0.14 0.09 0.09 0.10 0.09 0.06 0.07 0.06 0.05 2003 0.00 0.01 0.01 0.03 0.09 0.19 0.19 0.10 0.10 0.13 0.07 0.02 0.02 0.02 0.01 2004 0.00 0.01 0.02 0.04 0.11 0.18 0.17 0.11 0.10 0.08 0.07 0.04 0.04 0.02 0.01 2005 0.00 0.01 0.01 0.03 0.06 0.15 0.18 0.12 0.12 0.12 0.08 0.04 0.04 0.02 0.01 2006 0.01 0.01 0.01 0.02 0.08 0.16 0.15 0.15 0.10 0.11 0.08 0.05 0.04 0.02 0.01 2007 0.01 0.01 0.01 0.01 0.04 0.13 0.17 0.15 0.14 0.13 0.08 0.04 0.03 0.02 0.01 2008 0.00 0.01 0.01 0.02 0.04 0.12 0.14 0.10 0.12 0.15 0.10 0.08 0.06 0.04 0.02 2009 0.00 0.01 0.01 0.02 0.04 0.08 0.14 0.11 0.11 0.12 0.12 0.08 0.08 0.05 0.03 2010 0.00 0.01 0.01 0.03 0.07 0.14 0.12 0.08 0.09 0.11 0.10 0.08 0.06 0.06 0.03 2011 0.00 0.01 0.02 0.03 0.08 0.16 0.15 0.08 0.08 0.10 0.10 0.06 0.07 0.04 0.02 2012 0.00 0.00 0.01 0.02 0.07 0.17 0.18 0.10 0.11 0.12 0.08 0.05 0.05 0.03 0.01 2013 0.00 0.02 0.01 0.02 0.06 0.12 0.14 0.11 0.14 0.14 0.10 0.06 0.06 0.03 0.01 2014 0.00 0.00 0.02 0.01 0.04 0.13 0.17 0.09 0.09 0.12 0.13 0.09 0.05 0.03 0.01 2015 0.01 0.01 0.01 0.03 0.09 0.18 0.16 0.06 0.06 0.11 0.10 0.07 0.07 0.04 0.01

GDAR02 Stock Assessment Update Report October 2016
22
Table 7. Estimated total abundance at age (in billions of fish) at the start of the year. Year Age-0 Age-1 Age-2 Age-3 Age-4+ 1977 139.41 18.84 1.63 0.00 0.01 1978 126.31 26.49 3.43 0.00 0.00 1979 69.07 24.00 4.45 0.00 0.00 1980 143.36 13.13 4.53 0.02 0.00 1981 151.06 27.24 2.26 0.01 0.00 1982 116.37 28.71 5.36 0.02 0.00 1983 125.17 22.12 5.76 0.05 0.00 1984 185.12 23.79 4.05 0.02 0.00 1985 116.94 35.16 3.33 0.00 0.00 1986 101.42 22.22 6.27 0.01 0.00 1987 79.17 19.28 4.60 0.08 0.00 1988 86.20 15.04 2.89 0.00 0.00 1989 101.60 16.38 2.19 0.00 0.00 1990 72.42 19.30 2.40 0.00 0.00 1991 74.48 13.76 3.48 0.01 0.00 1992 142.27 14.15 2.57 0.01 0.00 1993 144.33 27.04 2.77 0.02 0.00 1994 111.87 27.43 5.58 0.04 0.00 1995 120.72 21.26 5.85 0.11 0.01 1996 151.27 22.95 5.19 0.54 0.03 1997 122.43 28.76 5.53 0.41 0.12 1998 173.63 23.27 6.73 0.31 0.11 1999 159.12 33.01 5.77 0.74 0.10 2000 116.24 30.25 7.69 0.31 0.16 2001 115.97 22.10 7.48 0.83 0.12 2002 97.54 22.05 5.51 0.89 0.24 2003 138.86 18.54 5.22 0.36 0.23 2004 122.61 26.40 4.37 0.32 0.12 2005 157.53 23.31 6.28 0.30 0.09 2006 223.30 29.95 5.82 0.76 0.10 2007 191.27 42.45 7.45 0.67 0.22 2008 79.19 36.37 10.86 1.19 0.25 2009 141.05 15.06 9.51 2.25 0.45 2010 261.26 26.82 3.89 1.71 0.80 2011 312.79 49.67 6.73 0.50 0.66 2012 201.64 59.47 12.34 0.76 0.30 2013 142.84 38.34 15.44 2.33 0.32 2014 416.90 27.16 10.10 3.47 0.85 2015 175.17 79.27 7.13 2.18 1.37

GDAR02 Stock Assessment Update Report October 2016
23
Table 8. Estimated biomass at age (1,000s mt) at start of year. Year Age-1 Age-2 Age-3 Age-4+ 1977 955.41 158.75 0.63 2.05 1978 1343.10 334.32 0.71 0.21 1979 1216.81 434.45 0.60 0.06 1980 665.45 442.12 3.02 0.07 1981 1381.07 220.43 1.05 0.22 1982 1455.54 523.45 2.50 0.16 1983 1121.37 562.66 7.47 0.36 1984 1205.94 395.69 2.78 0.73 1985 1782.85 324.53 0.08 0.11 1986 1126.67 612.38 1.17 0.01 1987 977.29 448.69 12.36 0.18 1988 762.57 282.39 0.22 0.52 1989 830.25 213.48 0.09 0.02 1990 978.53 233.99 0.08 0.00 1991 697.68 339.86 0.96 0.01 1992 717.58 251.00 2.10 0.10 1993 1370.86 270.66 2.69 0.27 1994 1390.80 544.74 5.32 0.45 1995 1078.02 571.08 15.69 0.99 1996 1163.53 506.17 78.28 4.98 1997 1458.03 539.42 59.84 23.60 1998 1179.99 656.47 45.38 20.08 1999 1673.53 562.68 107.71 19.80 2000 1533.54 750.99 45.53 31.06 2001 1120.36 730.11 120.95 22.56 2002 1117.77 537.91 129.70 46.01 2003 940.11 509.25 51.92 44.56 2004 1338.35 426.47 46.76 23.07 2005 1181.77 613.23 43.98 17.87 2006 1518.43 568.44 111.30 19.46 2007 2152.38 727.46 98.47 41.63 2008 1843.71 1060.42 174.47 48.51 2009 763.33 928.48 328.21 85.78 2010 1359.66 379.74 249.28 151.86 2011 2518.23 656.88 72.52 126.11 2012 3014.89 1204.27 111.43 56.71 2013 1943.71 1506.60 340.71 61.17 2014 1376.90 985.94 507.19 161.33 2015 4018.74 696.06 319.08 259.99

GDAR02 Stock Assessment Update Report October 2016
24
Table 9. Estimated time series of status indicators, fishing mortality, and spawning stock biomass (fecundity). Fishing mortality rate is full F. Spawning biomass (SSB, fecundity) is at the start of the year (time of peak spawning).
Year F F/F30% SSB SSB/SSB30% 1977 4.71 0.79 17494 0.42 1978 5.63 0.94 36249 0.87 1979 4.27 0.71 47040 1.13 1980 5.35 0.89 48157 1.16 1981 3.78 0.63 23980 0.58 1982 3.55 0.59 56898 1.37 1983 4.61 0.77 61752 1.48 1984 7.77 1.30 43195 1.04 1985 4.93 0.82 35103 0.84 1986 3.21 0.54 66336 1.59 1987 6.94 1.16 49991 1.20 1988 7.31 1.22 30616 0.74 1989 7.23 1.21 23090 0.55 1990 4.80 0.80 25303 0.61 1991 4.39 0.73 36852 0.89 1992 3.84 0.64 27394 0.66 1993 3.23 0.54 29611 0.71 1994 2.85 0.48 59572 1.43 1995 1.29 0.22 63719 1.53 1996 1.44 0.24 64633 1.55 1997 1.78 0.30 68387 1.64 1998 1.11 0.19 78880 1.90 1999 1.82 0.30 76105 1.83 2000 1.13 0.19 90501 2.18 2001 1.03 0.17 96122 2.31 2002 1.64 0.27 79346 1.91 2003 1.69 0.28 66833 1.61 2004 1.58 0.26 54559 1.31 2005 1.01 0.17 73761 1.77 2006 1.06 0.18 77110 1.85 2007 0.73 0.12 95574 2.30 2008 0.48 0.08 141453 3.40 2009 0.62 0.10 150143 3.61 2010 0.96 0.16 89797 2.16 2011 1.08 0.18 95525 2.30 2012 0.57 0.09 150556 3.62 2013 0.39 0.07 211012 5.07 2014 0.43 0.07 187129 4.50 2015 0.63 0.11 145920 3.51
GDAR02 Stock Assessment Update Report October 2016
25
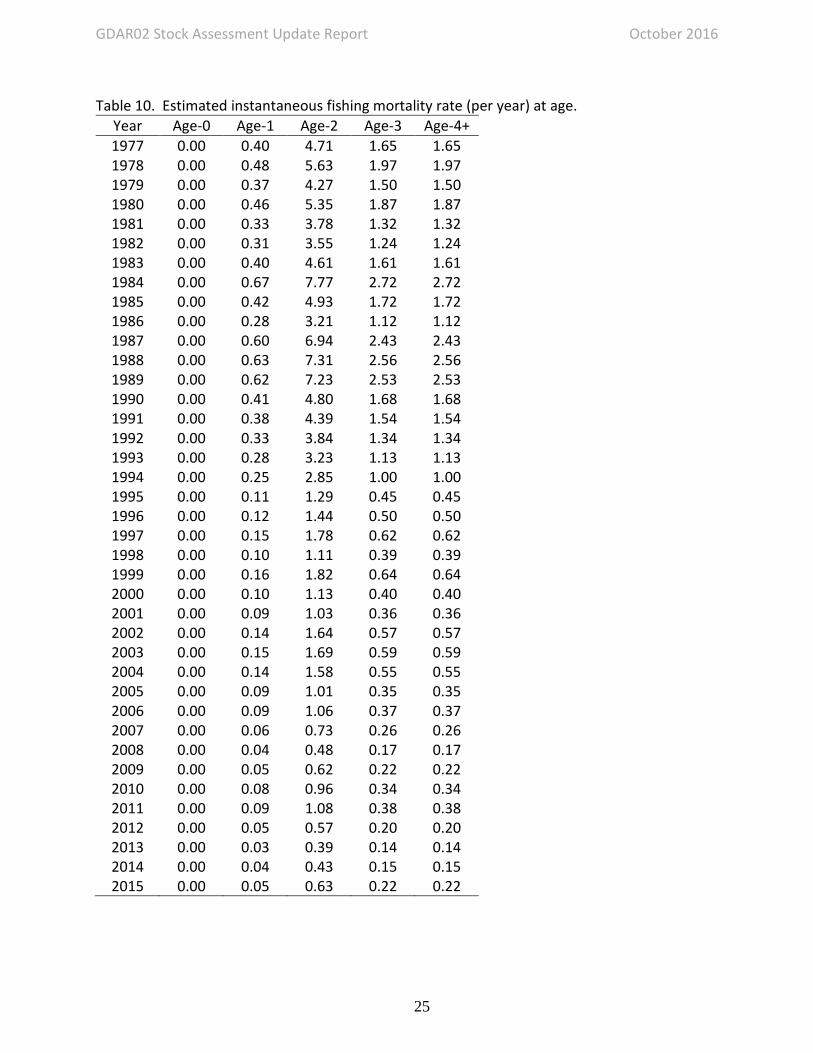
Table 10. Estimated instantaneous fishing mortality rate (per year) at age. Year Age-0 Age-1 Age-2 Age-3 Age-4+ 1977 0.00 0.40 4.71 1.65 1.65 1978 0.00 0.48 5.63 1.97 1.97 1979 0.00 0.37 4.27 1.50 1.50 1980 0.00 0.46 5.35 1.87 1.87 1981 0.00 0.33 3.78 1.32 1.32 1982 0.00 0.31 3.55 1.24 1.24 1983 0.00 0.40 4.61 1.61 1.61 1984 0.00 0.67 7.77 2.72 2.72 1985 0.00 0.42 4.93 1.72 1.72 1986 0.00 0.28 3.21 1.12 1.12 1987 0.00 0.60 6.94 2.43 2.43 1988 0.00 0.63 7.31 2.56 2.56 1989 0.00 0.62 7.23 2.53 2.53 1990 0.00 0.41 4.80 1.68 1.68 1991 0.00 0.38 4.39 1.54 1.54 1992 0.00 0.33 3.84 1.34 1.34 1993 0.00 0.28 3.23 1.13 1.13 1994 0.00 0.25 2.85 1.00 1.00 1995 0.00 0.11 1.29 0.45 0.45 1996 0.00 0.12 1.44 0.50 0.50 1997 0.00 0.15 1.78 0.62 0.62 1998 0.00 0.10 1.11 0.39 0.39 1999 0.00 0.16 1.82 0.64 0.64 2000 0.00 0.10 1.13 0.40 0.40 2001 0.00 0.09 1.03 0.36 0.36 2002 0.00 0.14 1.64 0.57 0.57 2003 0.00 0.15 1.69 0.59 0.59 2004 0.00 0.14 1.58 0.55 0.55 2005 0.00 0.09 1.01 0.35 0.35 2006 0.00 0.09 1.06 0.37 0.37 2007 0.00 0.06 0.73 0.26 0.26 2008 0.00 0.04 0.48 0.17 0.17 2009 0.00 0.05 0.62 0.22 0.22 2010 0.00 0.08 0.96 0.34 0.34 2011 0.00 0.09 1.08 0.38 0.38 2012 0.00 0.05 0.57 0.20 0.20 2013 0.00 0.03 0.39 0.14 0.14 2014 0.00 0.04 0.43 0.15 0.15 2015 0.00 0.05 0.63 0.22 0.22

GDAR02 Stock Assessment Update Report October 2016
26
Table 11. Estimated status indicators, benchmarks, and related quantities from the Beaufort catch-age model conditional on estimated current selectivity. Rate estimates (F) are in units of y-1, and status indicators are dimensionless. Spawning stock biomass is measured in total fecundity in billions of eggs.
Quantities Units Estimates F30% y-1 5.98 F35% y-1 4.28
SSB30% Billions of eggs 41,605 SSB35% Billions of eggs 50,635
F2015/F30% - 0.11 F2015/F35% - 0.15
SSB2015/SSB30% - 3.51 SSB2015/SSB35% - 2.88

GDAR02 Stock Assessment Update Report October 2016
27
Table 12. Estimated status indicators, benchmarks, and related quantities from the Beaufort catch-age model for each sensitivity run completed and for the retrospective analysis. Rate estimates (F) are in units of y-1, and status indicators are dimensionless. Spawning stock biomass is measured in total fecundity in billions of eggs.
Run F30% F35% SSB30% SSB35% F2015/F30% F2015/F35% SSB2015/SSB30% SSB2015/SSB35% Base run 5.98 4.28 41605 50635 0.11 0.15 3.51 2.88 h estimating 5.71 4.09 38133 50432 0.09 0.13 4.47 3.38 cR age3&4 select est. 5.59 4.07 47622 57957 0.12 0.16 4.18 3.44 seine index from 32A 5.65 4.05 43032 52372 0.11 0.15 3.58 2.94 Bait landings from 32A 5.99 4.28 41384 50362 0.11 0.15 3.5 2.88 Age-1 mat 10 10 106519 106519 0.08 0.08 3.29 3.29 low fec 5.17 3.58 620649 755326 0.12 0.18 3.49 2.86 high fec 5.17 3.58 1290297 1570282 0.12 0.18 3.49 2.86 low fec, mat 10 10 1231096 1231096 0.07 0.07 3.71 3.71 high fec, mat 10 10 2515881 2515881 0.07 0.07 3.73 3.73 Base run 5.98 4.28 41605 50635 0.11 0.15 3.51 2.88 Retrospective 2014 6.26 4.46 41588 50613 0.06 0.08 5.14 4.22 Retrospective 2013 6.17 4.4 40583 49391 0.05 0.07 6.28 5.16 Retrospective 2012 6.35 4.52 40063 48758 0.07 0.1 4.45 3.66 Retrospective 2011 6.68 4.74 39250 47767 0.15 0.21 2.37 1.95

GDAR02 Stock Assessment Update Report October 2016
28
8 Figures
Figure 1. The seine survey index standardized to include LA, MS, and AL (labeled with LA); MS
and AL only (labeled without LA); and from the last benchmark assessment. Dashed lines are
the 95% confidence intervals for the indices.

GDAR02 Stock Assessment Update Report October 2016
29
Figure 2. The gillnet index from the benchmark SEDAR 32A assessment (labeled Gillnet) and
updated for the current assessment (labeled Updated gillnet).
0.00
0.50
1.00
1.50
2.00
2.50
3.00
3.50
4.00
1988
1989
1990
1991
1992
1993
1994
1995
1996
1997
1998
1999
2000
2001
2002
2003
2004
2005
2006
2007
2008
2009
2010
2011
2012
2013
2014
2015
Inde
x
Year
Gillnet Updated gillnet

GDAR02 Stock Assessment Update Report October 2016
30
Figure 3. Comparison of length sample sizes annually from the LA gillnet survey. These data
were used to calculate the length compositions for the adult gillnet index.
0
50
100
150
200
250
300
350
400
450
50019
96
1997
1998
1999
2000
2001
2002
2003
2004
2005
2006
2007
2008
2009
2010
2011
2012
2013
2014
2015
Sam
ple
size
Year
Comparison of sample size
Update Benchmark

GDAR02 Stock Assessment Update Report October 2016
31
Figure 4. Comparison of annual length composition data from the benchmark assessment (left)
and for the update assessment (right).
0.000.020.040.060.080.100.120.140.160.180.20
benchmark
0.000.020.040.060.080.100.120.140.160.180.20
update

GDAR02 Stock Assessment Update Report October 2016
32
Figure 5. Observed (open circles) and estimated (line, solid circles) commercial reduction, commercial bait, and recreational landings (1,000s mt).
1980 1990 2000 2010
0
200
400
600
800
1000
Fishery: L.cR Data: gm
Year
Land
ings
(100
0s m
t)
GDAR02 Stock Assessment Update Report October 2016
33
Figure 6. Observed (open circles) and estimated (line, solid circles) index of abundance from the seine surveys in LA, MS, and AL.
1990 1995 2000 2005 2010 2015
0
1
2
3
4
5
6
7Index: seine Data: gm
Rel
ativ
e ab
unda
nce
(CP
UE
)
1990 1995 2000 2005 2010 2015
-10
-5
0
5
10
Year
Sca
led
resi
dual

GDAR02 Stock Assessment Update Report October 2016
34
Figure 7. Observed (open circles) and estimated (line, solid circles) index of abundance from the LA gillnet survey.
1990 1995 2000 2005 2010 2015
0
1
2
3
Index: gill Data: gmR
elat
ive
abun
danc
e (C
PU
E)
1990 1995 2000 2005 2010 2015
-4
-2
0
2
4
Year
Sca
led
resi
dual

GDAR02 Stock Assessment Update Report October 2016
35
Figure 8. Observed (open circles) and estimated (solid line) annual length and age compositions by fleet or survey. In panels indicating the data set, lcomp refers to length compositions, acomp to age compositions, cR to commercial reduction, and gill to the gillnet survey. N indicates the number of trips from which individual fish samples were taken.
lcomp.gill
80 100 120 140 160 180 200 220
0.0
0.1
Length bin (mm)
Prop
ortio
n N 22519
80 100 120 140 160 180 200 220
0.0
0.1
Length bin (mm)
Prop
ortio
n N 24719
80 100 120 140 160 180 200 220
0.0
0.1
Length bin (mm)
Prop
ortio
n N 26419
80 100 120 140 160 180 200 220
0.0
0.1
Length bin (mm)
Prop
ortio
n N 24519
80 100 120 140 160 180 200 220
0.0
0.1
Length bin (mm)
Prop
ortio
n N 30020
80 100 120 140 160 180 200 2200.
00.
1Length bin (mm)
Prop
ortio
n N 26220
80 100 120 140 160 180 200 220
0.0
0.1
Length bin (mm)
Prop
ortio
n N 27720
80 100 120 140 160 180 200 220
0.0
0.1
Length bin (mm)
Prop
ortio
n N 28320
80 100 120 140 160 180 200 220
0.0
0.1
Length bin (mm)
Prop
ortio
n N 25020
80 100 120 140 160 180 200 220
0.0
0.1
Length bin (mm)
Prop
ortio
n N 25820
80 100 120 140 160 180 200 220
0.0
0.1
Length bin (mm)
Prop
ortio
n N 33620
80 100 120 140 160 180 200 220
0.0
0.1
Length bin (mm)
Prop
ortio
n N 28620
80 100 120 140 160 180 200 220
0.0
0.1
Length bin (mm)
Prop
ortio
n N 31620
80 100 120 140 160 180 200 220
0.0
0.1
Length bin (mm)
Prop
ortio
n N 35120

GDAR02 Stock Assessment Update Report October 2016
36
Figure 8. (Continued) Observed (open circles) and estimated (solid line) annual length and age compositions by fleet or survey. In panels indicating the data set, lcomp refers to length compositions, acomp to age compositions, cR to commercial reduction, and gill to the gillnet survey. N indicates the number of trips from which individual fish samples were taken.
80 100 120 140 160 180 200 220
0.0
0.1
Length bin (mm)
Prop
ortio
n N 21820
80 100 120 140 160 180 200 220
0.0
0.1
Length bin (mm)
Prop
ortio
n N 39720
80 100 120 140 160 180 200 220
0.0
0.1
Length bin (mm)
Prop
ortio
n N 44720
80 100 120 140 160 180 200 220
0.0
0.1
Length bin (mm)
Prop
ortio
n N 19920
80 100 120 140 160 180 200 220
0.0
0.1
Length bin (mm)
Prop
ortio
n N 19520
80 100 120 140 160 180 200 220
0.0
0.1
Length bin (mm)
Prop
ortio
n N 17720
acomp.cR
0 1 2 3 4
0.0
0.5
Age class
Prop
ortio
n N 149219
0 1 2 3 4
0.0
0.5
Age class
Prop
ortio
n N 130019
0 1 2 3 4
0.0
0.5
Age class
Prop
ortio
n N 116319
0 1 2 3 4
0.0
0.5
Age class
Prop
ortio
n N 101419
0 1 2 3 4
0.0
0.5
Age class
Prop
ortio
n N 104219
0 1 2 3 4
0.0
0.5
Age class
Prop
ortio
n N 107619
0 1 2 3 4
0.0
0.5
Age class
Prop
ortio
n N 148519
0 1 2 3 4
0.0
0.5
Age class
Prop
ortio
n N 159919

GDAR02 Stock Assessment Update Report October 2016
37
Figure 8. (Continued) Observed (open circles) and estimated (solid line) annual length and age compositions by fleet or survey. In panels indicating the data set, lcomp refers to length compositions, acomp to age compositions, cR to commercial reduction, and gill to the gillnet survey. N indicates the number of trips from which individual fish samples were taken.
0 1 2 3 4
0.0
0.5
Age class
Prop
ortio
n N 132419
0 1 2 3 4
0.0
0.5
Age class
Prop
ortio
n N 165219
0 1 2 3 4
0.0
0.5
Age class
Prop
ortio
n N 164719
0 1 2 3 4
0.0
0.5
Age class
Prop
ortio
n N 124019
0 1 2 3 4
0.0
0.5
Age class
Prop
ortio
n N 139219
0 1 2 3 4
0.0
0.5
Age class
Prop
ortio
n N 115219
0 1 2 3 40.
00.
5Age class
Prop
ortio
n N 116419
0 1 2 3 4
0.0
0.5
Age class
Prop
ortio
n N 152419
0 1 2 3 4
0.0
0.5
Age class
Prop
ortio
n N 153719
0 1 2 3 4
0.0
0.5
Age class
Prop
ortio
n N 168019
0 1 2 3 4
0.0
0.5
Age class
Prop
ortio
n N 147019
0 1 2 3 4
0.0
0.5
Age class
Prop
ortio
n N 150619
0 1 2 3 4
0.0
0.5
Age class
Prop
ortio
n N 112419
0 1 2 3 4
0.0
0.5
Age class
Prop
ortio
n N 107319
0 1 2 3 4
0.0
0.5
Age class
Prop
ortio
n N 118319

GDAR02 Stock Assessment Update Report October 2016
38
Figure 8. (Continued) Observed (open circles) and estimated (solid line) annual length and age compositions by fleet or survey. In panels indicating the data set, lcomp refers to length compositions, acomp to age compositions, cR to commercial reduction, and gill to the gillnet survey. N indicates the number of trips from which individual fish samples were taken.
0 1 2 3 4
0.0
0.5
Age class
Prop
ortio
n N 96920
0 1 2 3 4
0.0
0.5
Age class
Prop
ortio
n N 74020
0 1 2 3 4
0.0
0.5
Age class
Prop
ortio
n N 83620
0 1 2 3 4
0.0
0.5
Age class
Prop
ortio
n N 106620
0 1 2 3 4
0.0
0.5
Age class
Prop
ortio
n N 94220
0 1 2 3 4
0.0
0.5
Age class
Prop
ortio
n N 89920
0 1 2 3 40.
00.
5Age class
Prop
ortio
n N 59420
0 1 2 3 4
0.0
0.5
Age class
Prop
ortio
n N 65720
0 1 2 3 4
0.0
0.5
Age class
Prop
ortio
n N 59420
0 1 2 3 4
0.0
0.5
Age class
Prop
ortio
n N 74820
0 1 2 3 4
0.0
0.5
Age class
Prop
ortio
n N 46120
0 1 2 3 4
0.0
0.5
Age class
Prop
ortio
n N 83520
0 1 2 3 4
0.0
0.5
Age class
Prop
ortio
n N 108720
0 1 2 3 4
0.0
0.5
Age class
Prop
ortio
n N 85220
0 1 2 3 4
0.0
0.5
Age class
Prop
ortio
n N 87820

GDAR02 Stock Assessment Update Report October 2016
39
Figure 8. (Continued) Observed (open circles) and estimated (solid line) annual length and age compositions by fleet or survey. In panels indicating the data set, lcomp refers to length compositions, acomp to age compositions, cR to commercial reduction, and gill to the gillnet survey. N indicates the number of trips from which individual fish samples were taken.
0 1 2 3 4
0.0
0.5
Age class
Prop
ortio
n N 114520

GDAR02 Stock Assessment Update Report October 2016
40
Figure 9. Bubble plot of the gillnet index length compositions for 1988 – 2015. The correlation on the bottom of the figure indicates the correlation between the observed and predicted data.
0.08 0.06 0.04 0.02 0.010.08
Fishery: lcomp.gill Orange: underestimate
80
100
120
140
160
180
200
220
Leng
th b
in (m
m)
2000 2005 2010 2015
0.20.40.60.81.0
Cor
r.

GDAR02 Stock Assessment Update Report October 2016
41
Figure 10. Bubble plot of the commercial reduction fishery age compositions for 1977 – 2015. The correlation on the bottom of the figure indicates the correlation between the observed and predicted data.
0.14 0.1 0.07 0.03 0.010.14
Fishery: acomp.cR Orange: underestimate
0
1
2
3
4
Age
cla
ss
1980 1990 2000 2010
0.20.40.60.81.0
Cor
r.

GDAR02 Stock Assessment Update Report October 2016
42
Figure 11. Estimated abundance at age at the start of the year.
Year
Num
bers
(bill
ion
fish)
0
100
200
300
400
N at age Data: gm
1980 1985 1990 1995 2000 2005 2010 2015
Age43210

GDAR02 Stock Assessment Update Report October 2016
43
Figure 12. Estimated recruitment of age-0 fish in billions.
1980 1990 2000 2010
0
100
200
300
400
Recruitment Data: gm
Year
Rec
ruitm
ent (
billi
on fi
sh)

GDAR02 Stock Assessment Update Report October 2016
44
Figure 13. Estimated biomass at age at start of year.
Year
Bio
mas
s (1
000s
mt)
0
1000
2000
3000
4000
5000
Biomass at age Data: gm
1980 1985 1990 1995 2000 2005 2010 2015
Age43210
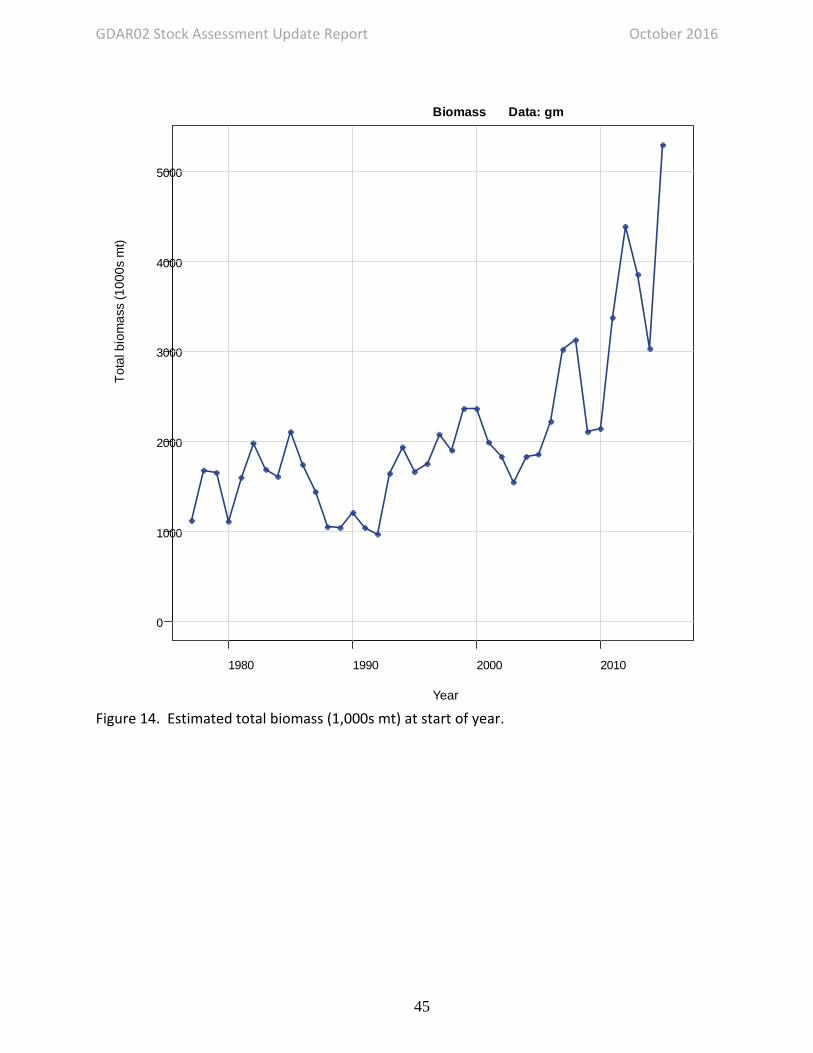
GDAR02 Stock Assessment Update Report October 2016
45
Figure 14. Estimated total biomass (1,000s mt) at start of year.
1980 1990 2000 2010
0
1000
2000
3000
4000
5000
Biomass Data: gm
Year
Tota
l bio
mas
s (1
000s
mt)

GDAR02 Stock Assessment Update Report October 2016
46
Figure 15. Estimated spawning stock biomass (fecundity in billions of eggs) at time of peak spawning.
1980 1990 2000 2010
050
000
1000
0015
0000
2000
00
Year
Spa
wni
ng s
tock
(bill
ions
of e
ggs)

GDAR02 Stock Assessment Update Report October 2016
47
Figure 16. Selectivity of the commercial reduction fleet, 1977 – 2015.
0 1 2 3 4
0.0
0.2
0.4
0.6
0.8
1.0
Selectivity in: cR Data: gm Year: 1977
Age
Sel
ectiv
ity a
t age

GDAR02 Stock Assessment Update Report October 2016
48
Figure 17. Selectivity of the LA gillnet survey, 1988 – 2015.
0 1 2 3 4
0.0
0.2
0.4
0.6
0.8
1.0
Selectivity in: gill Data: gm Year: 1988
Age
Sel
ectiv
ity a
t age
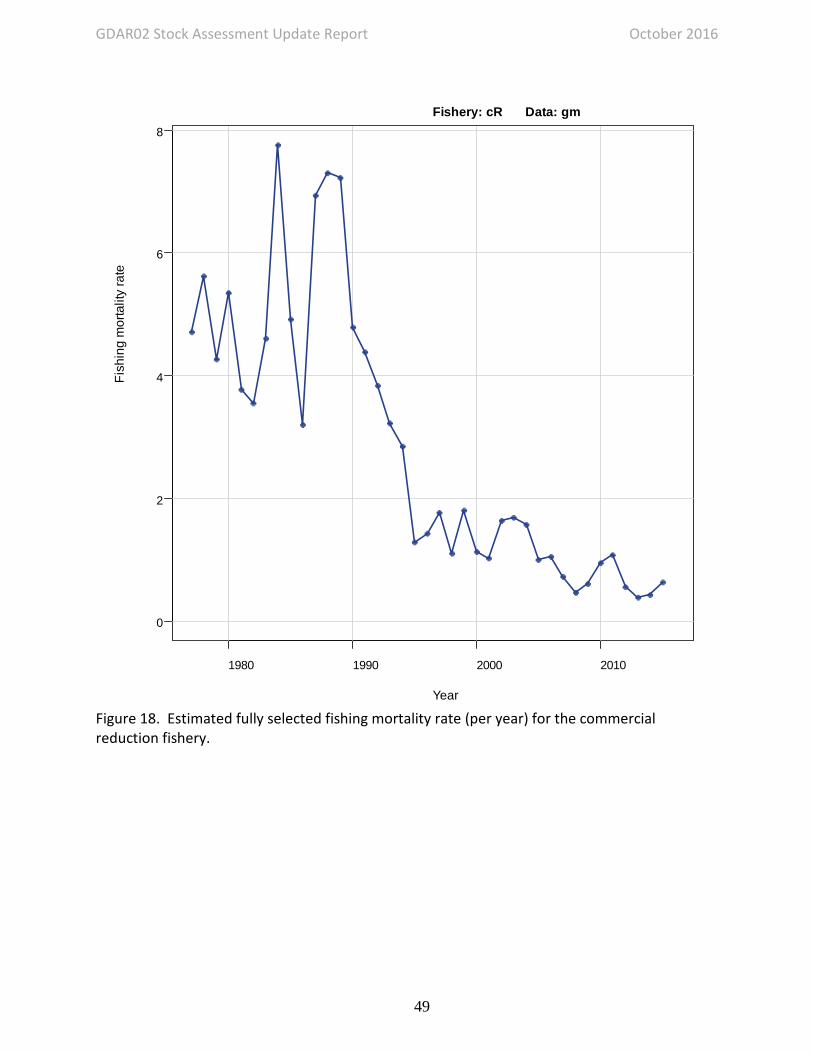
GDAR02 Stock Assessment Update Report October 2016
49
Figure 18. Estimated fully selected fishing mortality rate (per year) for the commercial reduction fishery.
1980 1990 2000 2010
0
2
4
6
8Fishery: cR Data: gm
Year
Fish
ing
mor
talit
y ra
te
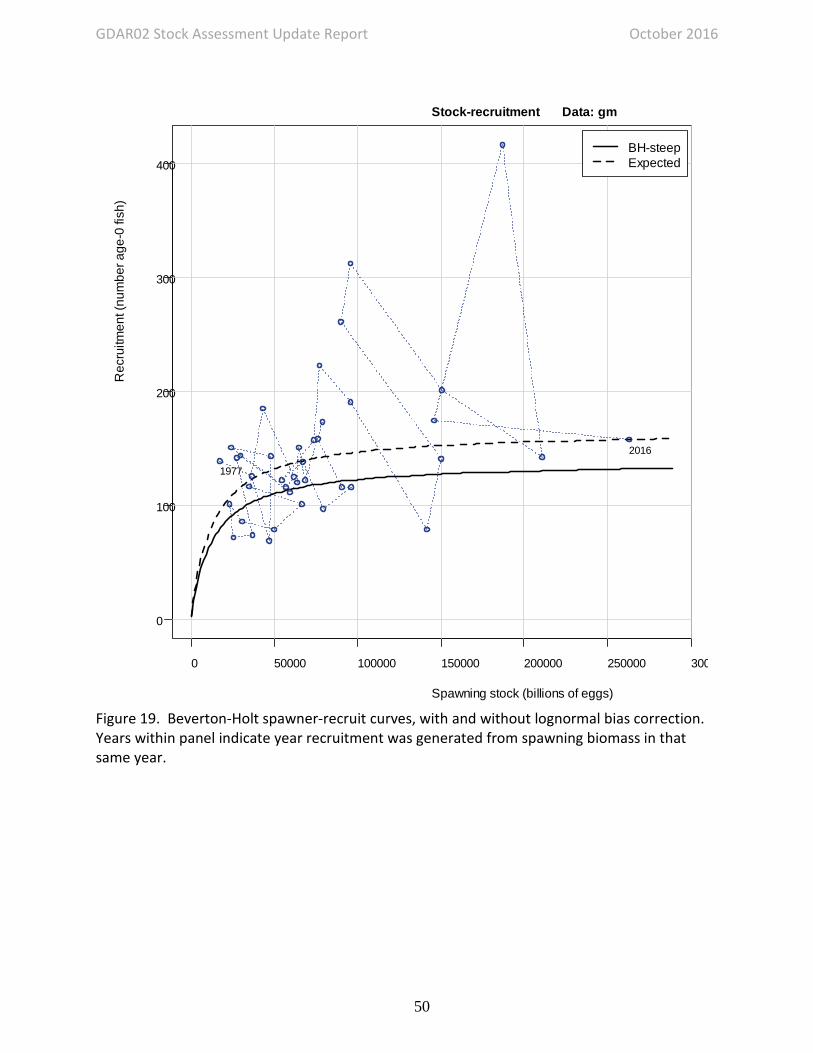
GDAR02 Stock Assessment Update Report October 2016
50
Figure 19. Beverton-Holt spawner-recruit curves, with and without lognormal bias correction. Years within panel indicate year recruitment was generated from spawning biomass in that same year.
0 50000 100000 150000 200000 250000 300
0
100
200
300
400
Stock-recruitment Data: gm
Spawning stock (billions of eggs)
Rec
ruitm
ent (
num
ber a
ge-0
fish
)
1977
2016
BH-steepExpected

GDAR02 Stock Assessment Update Report October 2016
51
Figure 20. Spawning biomass per recruit relative to that at the unfished level, from which the 30% and 35% levels provide F30% and F35%.
0 2 4 6 8 10
050
000
1000
0015
0000
EqSSB Data: gm
Fishing mortality rate
Equ
ilibr
ium
spa
wni
ng b
iom
ass
(bill
ions
of e
ggs)
F30F35

GDAR02 Stock Assessment Update Report October 2016
52
Figure 21. Estimated time series relative to threshold benchmarks. Solid line indicates estimates from base run of the Beaufort Assessment Model; gray error bands indicate 5th and 95th percentiles of the MCB trials. Top panel: F relative to F30%. Bottom panel: spawning stock biomass, measured as fecundity, relative to SSB30%.
1980 1990 2000 2010
01
23
4
F/F3
0%
1980 1990 2000 2010
01
23
45
6
SS
B/S
SB
30%

GDAR02 Stock Assessment Update Report October 2016
53
Figure 22. Probability densities of terminal status estimates from MCB analysis of the Beaufort Assessment Model. Vertical lines represent point estimates from the base run.
0.0 0.2 0.4 0.6 0.8 1.0
02
46
F(2015) / F30%
Den
sity
of B
oots
trap
Run
s
Base Run
0 2 4 6 8 10
0.00
0.05
0.10
0.15
0.20
0.25
0.30
SSB(2015) / SSB30%
Den
sity
of B
oots
trap
Run
s
Base Run

GDAR02 Stock Assessment Update Report October 2016
54
Figure 23. Phase plot of terminal status estimates from MCB analysis of the Beaufort Assessment Model. The red point indicates estimates from the base run; the black points are individual MCB trials.
0.0 0.5 1.0 1.5
02
46
810
F(2015) / F30%
SS
B(2
015)
/ S
SB
30%
Base RunBootstrap Runs

GDAR02 Stock Assessment Update Report October 2016
55
Figure 24. Phase plot of annual estimates of fishing mortality (F) and spawning stock biomass (SSB) or fecundity from the base BAM model. Dashed vertical and horizontal lines indicate the reference point thresholds at F30% and SSB30%. A year in the green zone indicates that the population is not overfished and that overfishing is not occurring. Placement in the yellow zones would indicate that one of the stock indicator thresholds had been exceeded and red would indicate that both thresholds had been exceeded.

GDAR02 Stock Assessment Update Report October 2016
56
Figure 25. Time series of F/F30% for the sensitivity runs with the solid black line with open circles being the base run.
1980 1990 2000 2010
0.0
0.5
1.0
1.5
Year
F/F3
0%
Base runh estimatingcR age3&4 select est.seine index from benchmarkBait landing - 100 and 125Age-1 matlow fechigh feclow fec, mathigh fec, mat
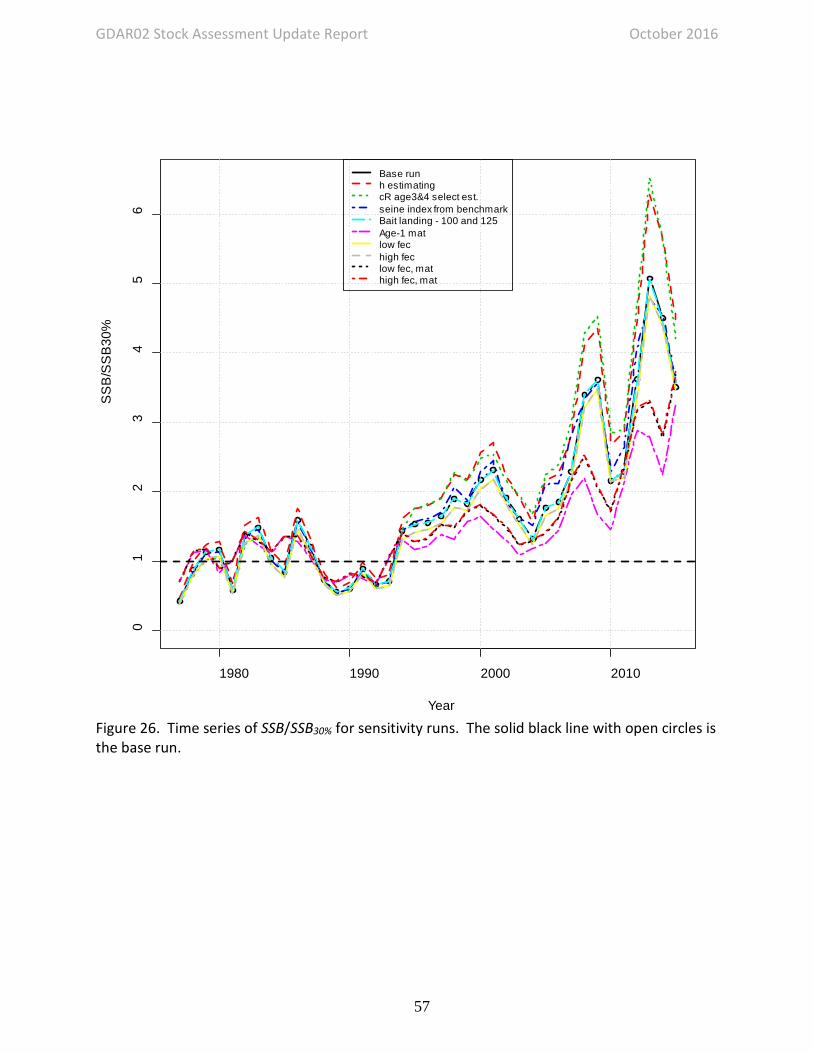
GDAR02 Stock Assessment Update Report October 2016
57
Figure 26. Time series of SSB/SSB30% for sensitivity runs. The solid black line with open circles is the base run.
1980 1990 2000 2010
01
23
45
6
Year
SS
B/S
SB
30%
Base runh estimatingcR age3&4 select est.seine index from benchmarkBait landing - 100 and 125Age-1 matlow fechigh feclow fec, mathigh fec, mat

GDAR02 Stock Assessment Update Report October 2016
58
Figure 27. Retrospective analyses. Sensitivity to terminal year of data on the estimation of fishing mortality rate.
1980 1990 2000 2010
02
46
8
Year
Full
F
Base runRetrospective 2014Retrospective 2013Retrospective 2012Retrospective 2011

GDAR02 Stock Assessment Update Report October 2016
59
Figure 28. Retrospective analyses. Sensitivity to terminal year of data on the estimation of biomass.
1980 1990 2000 2010
010
0020
0030
0040
0050
00
Year
Bio
mas
s (1
000
mt)
Base runRetrospective 2014Retrospective 2013Retrospective 2012Retrospective 2011

GDAR02 Stock Assessment Update Report October 2016
60
Figure 29. Retrospective analyses. Sensitivity to terminal year of data on the estimation of fecundity.
1980 1990 2000 2010
050
000
1000
0015
0000
2000
0025
0000
Year
Fecu
ndity
(ova
)
Base runRetrospective 2014Retrospective 2013Retrospective 2012Retrospective 2011

GDAR02 Stock Assessment Update Report October 2016
61
Figure 30. Retrospective analyses. Sensitivity to terminal year of data on the estimation of recruitment.
1980 1990 2000 2010
010
020
030
040
050
0
Year
Rec
ruits
(bill
ions
)
Base runRetrospective 2014Retrospective 2013Retrospective 2012Retrospective 2011

GDAR02 Stock Assessment Update Report October 2016
62
Figure 31. Retrospective analyses. Sensitivity to terminal year of data on the estimation of F/F30%.
1980 1990 2000 2010
0.0
0.2
0.4
0.6
0.8
1.0
1.2
Year
F/F3
0%
Base runRetrospective 2014Retrospective 2013Retrospective 2012Retrospective 2011

GDAR02 Stock Assessment Update Report October 2016
63
Figure 32. Retrospective analyses. Sensitivity to terminal year of data on the estimation of SSB/SSB30%.
1980 1990 2000 2010
01
23
45
6
Year
SS
B/S
SB
30%
Base runRetrospective 2014Retrospective 2013Retrospective 2012Retrospective 2011

GDAR02 Stock Assessment Update Report October 2016
64
Figure 33. Spawning stock biomass estimates in billions of eggs for the benchmark assessment from SEDAR 32A in blue and for the update assessment in black with points.
1980 1990 2000 2010
050
000
1000
0015
0000
2000
00
Year
Spa
wni
ng s
tock
(bill
ions
of e
ggs)

GDAR02 Stock Assessment Update Report October 2016
65
Figure 34. Recruitment time series for the benchmark assessment from SEDAR 32A in blue and for the update assessment in black with points.
1980 1990 2000 2010
010
020
030
040
0
Year
Rec
ruitm
ent (
billi
ons
of fi
sh)

GDAR02 Stock Assessment Update Report October 2016
66