Embed Size (px)
Citation preview
Multi-component kinetics and late gas potential of selected Cooper Basin source rocksGEOSCIENCE AUSTRALIARECORD 2015/19
Mahlstedt, N.1, di Primio, R.1, Horsfield, B.1 and Boreham, C.J.2
1. GEOS4 GmbH, Peter-Huchel-Chaussee 88, 14552 Michendorf, Germany2. Geoscience Australia

Department of Industry and ScienceMinister for Industry and Science: The Hon Ian Macfarlane MPParliamentary Secretary: The Hon Karen Andrews MPSecretary: Ms Glenys Beauchamp PSM
Geoscience AustraliaChief Executive Officer: Dr Chris PigramThis paper is published with the permission of the CEO, Geoscience Australia
© Commonwealth of Australia (Geoscience Australia) 2015
With the exception of the Commonwealth Coat of Arms and where otherwise noted, this product is provided under a Creative Commons Attribution 4.0 International Licence. (http://creativecommons.org/licenses/by/4.0/legalcode)
Geoscience Australia has tried to make the information in this product as accurate as possible. However, it does not guarantee that the information is totally accurate or complete. Therefore, you should not solely rely on this information when making a commercial decision.
Geoscience Australia is committed to providing web accessible content wherever possible. If you are having difficulties with accessing this document please email [email protected].
ISSN 2201-702X (PDF)
ISBN 978-1-925124-78-1 (PDF)
GeoCat 83891
Bibliographic reference: Mahlstedt, N., di Primio, R., Horsfield, B. and Boreham, C.J. 2015. Multi-component kinetics and late gas potential of selected Cooper Basin source rocks. Record 2015/19. Geoscience Australia, Canberra. http://dx.doi.org/10.11636/Record.2015.019
This study was jointly funded by Geoscience Australia and the Department of State Development, South Australia.
Introduction, technical edit and formatting by Lisa Hall, Junhong Chen and Tehani Palu.
Top right cover photo: aerial view of sand dunes, Cooper Basin. Photo by Ian Oswald-Jacobs, 1996. Image reproduction courtesy of Energy Resources Division, Department of State Development, South Australia.
Contents
Abstract.................................................................................................................................................. 1
1 Introduction.......................................................................................................................................... 41.1 Cooper Basin geology.................................................................................................................... 4
1.1.1 Stratigraphy.............................................................................................................................. 71.1.2 Regional petroleum systems....................................................................................................7
1.2 Methology overview....................................................................................................................... 81.2.1 The PhaseKinetics approach....................................................................................................81.2.2 Late gas potential evaluation....................................................................................................81.2.3 Secondary cracking kinetics/GORFit - model...........................................................................9
1.3 Sample selection and analyses......................................................................................................9
2 Experimental programme.................................................................................................................. 152.1 Rock Eval analysis – classical screening.....................................................................................152.2 Thermovaporisation – free hydrocarbons.....................................................................................152.3 Pyrolysis gas chromatography – petroleum types........................................................................152.4 Kinetics determination – thermal response..................................................................................162.5 MSSV pyrolysis – compositional evolution...................................................................................16
3 Results............................................................................................................................................... 173.1 Screening analyses...................................................................................................................... 173.2 Free hydocarbons........................................................................................................................183.3 Petroleum type organofacies........................................................................................................183.4 Bulk kinetics................................................................................................................................. 223.5 MSSV-pyrolysis: PhaseKinetics...................................................................................................28
3.5.1 Primary cracking products......................................................................................................283.5.2 Secondary cracking products..................................................................................................32
3.6 MSSV-pyrolysis: late gas potentials.............................................................................................323.7 MSSV-pyrolysis: secondary cracking kinetics..............................................................................36
3.7.1 GORFit-model.........................................................................................................................46
4 Conclusions....................................................................................................................................... 53
5 References........................................................................................................................................ 56
Appendix A - PhaseKinetics approach..................................................................................................59A.1 Methodology and background information on the PhaseKinetics approach.................................59
Appendix B - Tables............................................................................................................................. 61
Appendix C – Figures.........................................................................................................................132
Multi-component kinetics and late gas potential of selected Cooper Basin source rocks iii

iv Multi-component kinetics and late gas potential of selected Cooper Basin source rocks

Abstract
Twenty-seven powdered whole rock samples and eleven solvent- extracted samples or kerogen concentrates were used to investigate the multi-component kinetics and late gas potential of selected potential Permian source rocks within the Cooper Basin of Australia. Source rocks sampled include the Patchawarra Formation (coal), Epsilon Formation (coal), Toolachee Formation (coals and shales) and the Murteree and Roseneath shales. Eleven samples were analysed for their petroleum generation characterisation and six samples were analysed for multi-component (1-, 2-, 4-, 14 component) kinetic characterisation, following the approach of di Primio and Horsfield (2006).
Organofacies Type definition was performed for twenty-seven samples and characterisation of free hydrocarbons for fifteen samples. The evolution of late gas potentials as a function of organofacies and maturity were determined for fifteen samples, following the approach of Mahlstedt (2012) and Mahlstedt and Horsfield (2012a). In addition, kinetic parameters of primary and secondary gas formation were determined from one sample using a modified GORFit - model (Mahlstedt et al., 2013; Mahlstedt, in prep). The thermal maturity of the Patchawarra Formation samples is broad (0.5–5.5% VR) offering insights into the variation in gas generation potential with maturity.
Based on screening data, the investigated samples, mainly humic coals, can be described as organic-rich with Total Organic Carbon (TOC) contents up to 88%. All shale samples exhibit TOC contents exceeding 2%. For the Patchawarra Formation maturity series, the generative potential extends from 453 to 1 mg HC/g TOC. For samples exhibiting VRcalc >1% (or Tmax >450°C), Hydrogen Index (HI) gradually decreases as a function of increasing maturity and related petroleum generation, from ~300 mg HC/g TOC to 1 mg HC/g TOC. At immature stages three types of coals and shales can be observed as follows:
volatile-rich coals and shales (Type II kerogen) with HIs >400 mg HC/g TOC (5 samples);
“average” humic coals (Type III – II/III kerogens) with HIs between 200–350 mg HC/g TOC (6 samples) and;
hydrogen poor organic matter (Type III) with HIs <150 mg HC/g TOC (4 samples).
The three shale samples from the Patchawarra Formation and the Murteree and Roseneath shales fall into the last group.
Free hydrocarbons are characterised at lower maturity levels (<1.3% VRcalc) for fifteen natural maturity series Patchawarra Formation whole rock samples and one overmature Roseneath Shale sample. Thermal extracts are rich in light hydrocarbons, intermediate to high molecular weight paraffins and mainly aromatic compounds dominated by toluene, m,p-xylene and various alkyl-naphthalenes, suggesting the presence of tree resins as precursor structure. Thermal extracts of samples exhibiting maturity levels above 1.3% VRcalc mainly consist of aromatic compounds, whereas gaseous compounds dominate those from samples with maturity levels exceeding 2.5% VRcalc.
Upon pyrolysis, all overmature samples (VRcalc >1.3%) yield mainly gas and aromatic compounds and their petroleum type organofacies is predicted as gas and condensate. The inferred petroleum type for immature to oil window mature samples (VRcalc <1.3%) is either gas and condensate or paraffinic-napthenic-aromatic (P-N-A) low wax. These pyrolysate compositions are diagnostic of fluviodeltaic
Multi-component kinetics and late gas potential of selected Cooper Basin source rocks 1

depositional environments with high gas compounds contents, high but varying aromatic and phenolic compounds contents (depending on individual maceral composition again depending on the exact depositional position in the fluviodeltaic environment), very low sulphur compound contents, and abundance of normal hydrocarbon doublets of n-alkenes and n-alkanes extending to long chain lengths (waxes).
Kerogen conversion of all eleven investigated samples is characterised by broad activation energy (Ea) distributions, as is typically observed for terrestrial derived organic matter. This translates to a broad maturity interval of >60°C over which hydrocarbons are generated. High thermal stabilities are indicated by onset temperatures of hydrocarbon generation (10% transformation ratio (TR) and assuming a geological heating rate of 3oC / Ma) >125°C for the least mature sample, a feature most likely related to the sulphur-poor state of the organic matter. Kerogen conversion ends (90% TR) at temperatures exceeding 200°C (in all but one case), also suggesting a very stable organic matter structure, or at least indicating the presence of refractory organic matter.
Activation energies of the five Patchawarra Formation samples span over ~23 potentials.These range from 52 kcal to 53 kcal for the least mature samples (VRcalc = 0.57%); from 57 kcal to 58 kcal at 0.73% VRcalc and from 59 kcal to 63 kcal for the most mature samples (VRcalc = 0.77%). The resulting geologic onset and Tpeak temperatures range as follows:
~130°C to ~148°C for the least mature samples (VRcalc = 0.57%);
~147°C to ~160°C at 0.73% VRcalc;
~151°C to ~170°C for the most mature samples (VRcalc = 0.77%).
Samples of the first sub-group generate petroleum over a slightly smaller temperature interval (60–65°C) than samples from the second sub-group (75–90°C).
Samples from the other formations (VRcalc ~0.7%) can be grouped into three sub-types according to thermal stability. The main activation energy ranges a follows: 54 kcal for the Murteree Shale, from 56 kcal to 57 kcal for the Roseneath Shale and Epsilon Formation coals, and 65 kcal for the Toolachee Formation. Geologic onset and Tpeak temperatures range are as follows:
~132°C to ~143°C for the Murteree Shale;
~146°C to ~160°C for the Roseneath Shale and Epsilon Formation coals;
~165°C to ~180°C for the Toolachee Formation.
The fluids generated from the five main Permian source rock samples in the Cooper Basin fall within the volatile oil class. All reach saturation pressures of over 150 bar by a TR of 30%, and over 200 bars by a TR of over 70%. At the highest maturity levels (90% TR), saturation pressures generally range above 400 bar with Gas Oil Ratios (GORs) exceeding 1000 Sm³/Sm³. In concordance with the broad range of activation energies, the distribution of GORs, saturation pressures and formation volume factors all show a high degree of variability. Only the most immature Patchawarra Formation sample (VRcalc ~0.57%) generates a volatile oil with GORs of ~200 Sm³/Sm³ and saturation pressures of ~200 bar over the entire primary kerogen conversion range. Generally, the physical properties of generated fluids observed here reflect the behaviour of naturally occurring petroleum (i.e. volatile oil) very well and are not unusual for fluids formed from terrestrial derived organic matter. Compositional kinetic models were developed for each of these source rocks, which may be used to calculate petroleum phase behaviour under the subsurface conditions of hydrocarbon migration and entrapment.
2 Multi-component kinetics and late gas potential of selective Cooper Basin source rocks

The Patchawarra Formation samples, along with one Roseneath Shale sample, show late gas generating potentials which fall on the recently demonstrated late gas potential evolution trend (Mahlstedt and Horsfield, 2012b; Mahlstedt and Horsfield, in prep) at all maturities. Nevertheless, the maximum amounts of late gas generation encountered prior to metagenesis (Ro ~2.0%) exceed previously encountered potentials (~40 mg/g TOC) by ~10 mg/g TOC. As a result, a late gas potential of ca.50 mg/g TOC should be considered in any Gas-In-Place calculations related to these Permian source rocks. This is applicable at maturity stages over ~2.0% Ro, and is most likely to be realised between 2.5 and 3.5% Ro.
Distinct kinetic parameters for primary C6+ and gas generation, as well as secondary gas generations, were determined for one Patchawarra Formation sample using a modified GORFit- model. This indicated that the onset of secondary cracking occurred at ~194°C, assuming a geologic heating rate of 3°C per million years. For this specific sample it could be shown that primary and secondary cracking processes largely overlap.
Multi-component kinetics and late gas potential of selected Cooper Basin source rocks 3

1 Introduction
The Cooper Basin is an Upper Carboniferous - Middle Triassic intracratonic basin in north-eastern South Australia and south-western Queensland. In conjunction with the overlying Eromanga Basin, the basin is Australia’s largest onshore producer of conventional gas and oil. Exploration activity in the region has recently expanded with explorers pursuing a range of newly identified unconventional hydrocarbon plays. These include the extensive basin-centred and tight gas accumulations in the Gidgealpa Group, deep dry coal seam gas associated with the Patchawarra and Toolachee formations, as well as the less extensive shale gas plays in the Roseneath and Murteree shales (Goldstein et al., 2012, Menpes et al., 2013).
Numerous oil and gas fields in the Cooper Basin indicate that the Permian succession contains the most effective source rocks for conventional hydrocarbons; these source rocks are coals and, to a lesser extent, non-marine carbonaceous shales (Boreham and Hill, 1998). A detailed understanding of the petroleum generation potential of these source rocks, and the resulting fluid composition, is critical for understanding of both the conventional and unconventional hydrocarbon prospectivity of the basin.
Whole rock samples and extracted samples or kerogen concentrates from five potential Permian sources within the Cooper Basin were analysed for petroleum generation potential and PhaseKinetic characterisation, following the approach of di Primio and Horsfield (2006). Source rocks sampled include the Patchawarra Formation (coal), Epsilon Formation (coal), Toolachee Formation (coals and shales) and the Murteree and Roseneath shales.
The evolution of late gas potentials as a function of organofacies and maturity were determined following the approach of Mahlstedt (2012) and Mahlstedt and Horsfield (2012a), along with the kinetics of primary and secondary gas formation in the Patchawarra Formation coal using a modified GORFit - model (Mahlstedt et al., 2013; Mahlstedt, in prep). The thermal maturity of the samples is broad (0.5–5.5% VR) offering insights into the variation in gas generation potential with maturity.
1.1 Cooper Basin geologyThe Cooper Basin covers an area of approximately 130,000 km2 (Stewart et al., 2013). The unconformity at its upper surface varies in present-day depth from 970 m to 2800 m, whereas the base of its deepest trough reaches over 4400 m below sea level. The basin represents a Pennsylvanian to Triassic depositional episode, which was terminated at the end of the Middle Triassic by widespread contractional deformation, regional uplift and erosion.
The Cooper Basin unconformably overlies early Paleozoic sediments of the Warburton Basin to the southwest and Devonian sediments associated with the Adavale Basin in the northeast (Gravestock and Jensen-Schmidt, 1998; Draper, 2002; Radke, 2009; Stewart et al., 2013). The Cooper Basin is entirely and disconformably overlain by the Jurassic-Cretaceous Eromanga Basin, which in turn is unconformably overlain by the Cenozoic Eyre Basin (Stewart et al., 2013).
4 Multi-component kinetics and late gas potential of selective Cooper Basin source rocks

Figure 1: Cooper Basin structural elements from Carr et al. (2015) and Hall et al. (in prep).
The Cooper Basin is divided into northern and southern areas, which show different structural and sedimentary histories (Figure 1). The three major troughs in the southwest (Patchawarra, Nappamerri and Tenappera) are separated by the Gidgealpa-Merrimelia-Innamincka (GMI) and Murteree ridges, which approximately align northeast-southwest (Gravestock and Jensen-Schmidt, 1998). In the northern Cooper Basin, the Permian succession is thinner than in the south, and the major depocentres, including the Windorah Trough and Ullenbury Depression, are generally less well defined (Draper, 2002; McKellar, 2013).
Multi-component kinetics and late gas potential of selected Cooper Basin source rocks 5

Figure 2: Cooper Basin stratigraphy chart from Carr et al. (2015) and Hall et al. (in prep).
6 Multi-component kinetics and late gas potential of selective Cooper Basin source rocks

1.1.1 Stratigraphy
The stratigraphy of the Cooper Basin is divided into two groups: the Pennsylvanian to upper Permian Gidgealpa Group and the Early to Middle Triassic Nappamerri Group (Figure 2). The Gidgealpa Group comprises initial glacial deposits transitioning to coal swamp, fluvial and lacustrine deposits. This group contains the majority of the source rocks of the basin and hence is the focus of this study. Samples analysed have been collected from the Patchawarra, Epsilon and Toolachee formations, and the Murteree and Roseneath shales, all of which are described in more detail below.
The Patchawarra Formation comprises interbedded sandstone, siltstone, shale and coal. The formation is present across the entire basin and is the thickest unit of the Gidgeapla Group, reaching to 680 m in the Nappamerri Trough. Lithofacies distribution patterns are consistent with a high sinuosity fluvial systems flowing over a floodplain with peat swamps, lakes and gentle uplands.
The Murteree Shale comprises black to dark grey-brown argillaceous siltstone with minor fine-grained sandstone and was deposited in a deep lake environment with restricted circulation. The Epsilon Formation comprises fine to medium-grained sandstone interbedded with carbonaceous siltstone and shale, and occasional coals. It consists of an aggradational lacustrine delta sequence, deposited in response to differential subsidence rates. The Roseneath Shale comprises light to dark brown-grey siltstone, mudstone and minor fine-grained sandstone and was desposited in a lacustrine environment similar to the Murteree Shale (Hill and Gravestock, 1995). The extent of the Epsilon Formation and the Roseneath and Murteree shales are restricted to the southern Cooper Basin.
The Toolachee Formation comprises interbedded fine- to coarse-grained quartzose sandstone, mudstone, carbonaceous shale with thin coal seams and conglomerates (Nakanishi and Lang, 2001). The formation is widespread across the basin, with the exception of the Weena Trough in the southwest corner of the basin, and reaches over 200 m thick at its deepest (Gray and McKellar, 2002; Gravestock and Jensen-Schmidt, 1998). Toolachee Formation was deposited in a fluvial environment during an interval of renewed basin subsidence.
The overlying Triassic Nappamerri Group has initially lean and comparatively oxidised fluvial deposits and has not been sampled for this study.
1.1.2 Regional petroleum systems
Gas and dry gas are predominantly reservoired in the Cooper Basin sequence and oil is reservoired mainly in the sandstone reservoirs of the overlying Eromanga Basin. Many reservoirs have been multi-charged (McKirdy et al., 2001; Michaelsen and McKirdy, 2001; Arouri et al., 2004; Underschultz and Boult, 2004) and as a result, the phases of petroleum generation and migration are highly complex.
Geochemical data has shown clear evidence in carbon isotopic compositions of individual n-alkanes for different source-reservoir couplets within the stacked basins (Boreham and Summons, 1999). The main couplets involve Cooper Basin source and reservoir, and Cooper Basin source-Eromanga Basin reservoir. A subordinate couplet involves Eromanga Basin source and Eromanga Basin reservoir, however oils derived from this system are predominantly mixed with upward migrating oils from the Cooper Basin. There may also be a minor input from pre-Permian sources to both Cooper and Eromanga basin reservoirs.
Coal and carbonaceous shale of the Permian Gidgepalpa Group represent the principal source rocks of the Cooper Basin in source richness, quality, and overall thickness (Boreham and Hill, 1998). Permian source rocks, excluding coal, have average total organic carbon (TOC) of 3.9% with S2
Multi-component kinetics and late gas potential of selected Cooper Basin source rocks 7

pyrolysis yields of 6.9 kg of hydrocarbon per tonne (Boreham and Hill, 1998). The coals and shales of the Toolachee and Patchawarra formations are the richest and most extensive source rocks, however additional source rocks include coals and shales of the Epsilon and Daralingie formations and the Roseneath and Murteree shales.
The Cooper Basin contains both light oil-condensate and waxy oil with depleted light hydrocarbon content. The source of the oil is Permian coal and associated terrestrial organic matter. The oil is characterised by low-saturated biomarker contents, a lack of conifer-derived biomarkers and an n-alkane isoptope profile that becomes isotopically lighter with increasing carbon number (Boreham and Hill, 1998).
1.2 Methology overviewA range of different analytical approaches may be used to characterise source rock petroleum generation potential and the resulting fluid composition. The methods used in this study are summarisied below.
1.2.1 The PhaseKinetics approach
The PhaseKinetics approach allows chemical maturation and physical fractionation to be modelled. Parameters are measured which enable the explorationist to link source rock organic facies to the petroleum type it generates and the effect of changing P,T on that petroleum. Using a combination of open and closed system pyrolysis techniques, bulk kinetic and compositional information are obtained, gas compositions are corrected empirically based on a correlation of gas wetness and GOR and corrected compositions integrated into a compositional kinetic model. The end result is the ability to predict key hydrocarbon physical properties, including GOR, saturation pressure and formation volume factor. The calculation of petroleum phase behaviour under the subsurface conditions of hydrocarbon migration and entrapment is possible when these compositional models are used in combination with modern basin modelling software.
1.2.2 Late gas potential evaluation
A second late dry gas charge (subsequent to secondary cracking of oil) of ~40 mg/g TOC has been recently recognised in a great variety of gas shales and source rocks (Mahlstedt, 2012; Mahlstedt and Horsfield, 2012a, 2012b). The methane forming reaction is realised between 2.5 and 3.5% Ro and can be kinetically described by a single activation energy of ~56 kcal/mol and a frequency factor of ~5.00E+09 1/s. The existence of such a late gas potential has profound implications for conventional and especially unconventional gas prospects, in that significant additional charges of methane can be expected to be formed from a thermally stable moiety which is not expelled from the source rock over the oil window.
As late gas generation goes largely unnoticed when evaluation of source rocks is based on routinely used open-system pyrolysis screening-methods alone, a rapid closed-system pyrolysis method is used. This consists of heating crushed whole rock samples in MSSV-tubes from 200°C to 2 different end temperatures (560°C; 700°C) at 2°C/min, marking the main stage of late gas generation under laboratory conditions.
8 Multi-component kinetics and late gas potential of selective Cooper Basin source rocks

1.2.3 Secondary cracking kinetics/GORFit - model
A new pyrolysis based approach, called the “GORFit” model, is used to predict the generation of primary and secondary gas from source rocks, in which overlapping liquid generation and destruction reactions occur, in an easy but specific way on the basis of simple stoichiometric relationships. This model is unique due to its forward rather than inverse gas component calculation.
With “GOR-Fit” primary and secondary conversion processes are studied by closed-system MSSV-pyrolysis at three different heating rates (usually 0.7, 2.0 and 5.0°C/min) in the temperature range 300-600°C. In a first step C1+ MSSV-yields, as well as the C1-5 and C6+ boiling fractions, are normalised to the maximum MSSV-yield and plotted in comparison to directly measured open-system bulk-pyrolysis SRA-Transformation Ratio curves. As an excellent correlation between open-system bulk-yields and C1+ closed-system yields exists, at least for most Type II and Type I source rocks, the SRA-TR curves can be directly multiplied by factors ranging between 0 and 1 (derived from an uniform open-system pyrolysis-GC GOR) to infer cumulative primary gas and C6+ splines. The spline curves have to be temperature shifted to fit measured MSSV values until a best solution for all three heating rates is reached, with negative shifts for C6+ compounds and positive shifts for primary gas.
Secondary gas amounts are calculated by subtracting fitted primary gas yields from measured MSSV C1-5 yields at corresponding temperatures. A secondary gas spline is again approximated by “factorising” the SRA-curve which is then temperature shifted to match calculated secondary gas yields. Kinetic parameters describing primary oil, primary gas, and secondary gas generation can now be deduced and used for the extrapolation of hydrocarbon generation reactions to a geological context.
1.3 Sample selection and analysesThis report provides the following data for twenty-seven whole rock samples and eleven extracted samples or kerogen concentrates (Table 1.1 and Table 1.2):
TOC/Rock-Eval parameters for 38 samples (Table 1.3)
Free hydrocarbons characterisation for 15 samples (thermovaporisation)
Organofacies Type definition (open-system pyrolysis GC-FID) for 27 samples
Bulk-kinetic modelling parameters for 11 samples
Compositional-and PhaseKinetic modelling parameters for 6 samples (MSSV - P)
Late Gas Potential determination for 15 samples (MSSV - L)
Kinetics of primary and secondary gas formation for 1 sample (MSSV - S)
The six samples used for PhaseKinetics characterisation were chosen based on Petroleum Type Organofacies (Pyrolysis-GC) and bulk kinetic parameters (using a Source Rock Analayzer (SRA)) and covered the five source rocks under investigation. Here, extracted sample material or kerogen concentrate was used to minimise the influence of free, high molecular weight oil compounds or inorganic matrix components, respectively. Fifteen samples, mainly from the Patchawarra Formation, were chosen for late gas potential determination. These cover a complete maturation interval for which hydrocarbon generation including late gas generation can be expected.
Multi-component kinetics and late gas potential of selected Cooper Basin source rocks 9

The samples were sourced from 17 wells located in the southern Cooper Basin, in South Australia. (Figure 3;Table 1.2).
Table 1.1: Summary of analyses and procedures performed.
Analysis type Number of analyses
TOC/Rock Eval 38
Thermovaporisation 15
Pyrolysis GC 27
Bulk kinetics 11
MSSV preparation and heating
P – PhaseKinetics 25
L – Late Gas 44
S – Secondary Cracking 39
MSSV pyrolysis GC 108
10 Multi-component kinetics and late gas potential of selective Cooper Basin source rocks

Figure 3: Location map of petroleum wells sampled for this study.
Multi-component kinetics and late gas potential of selected Cooper Basin source rocks 11

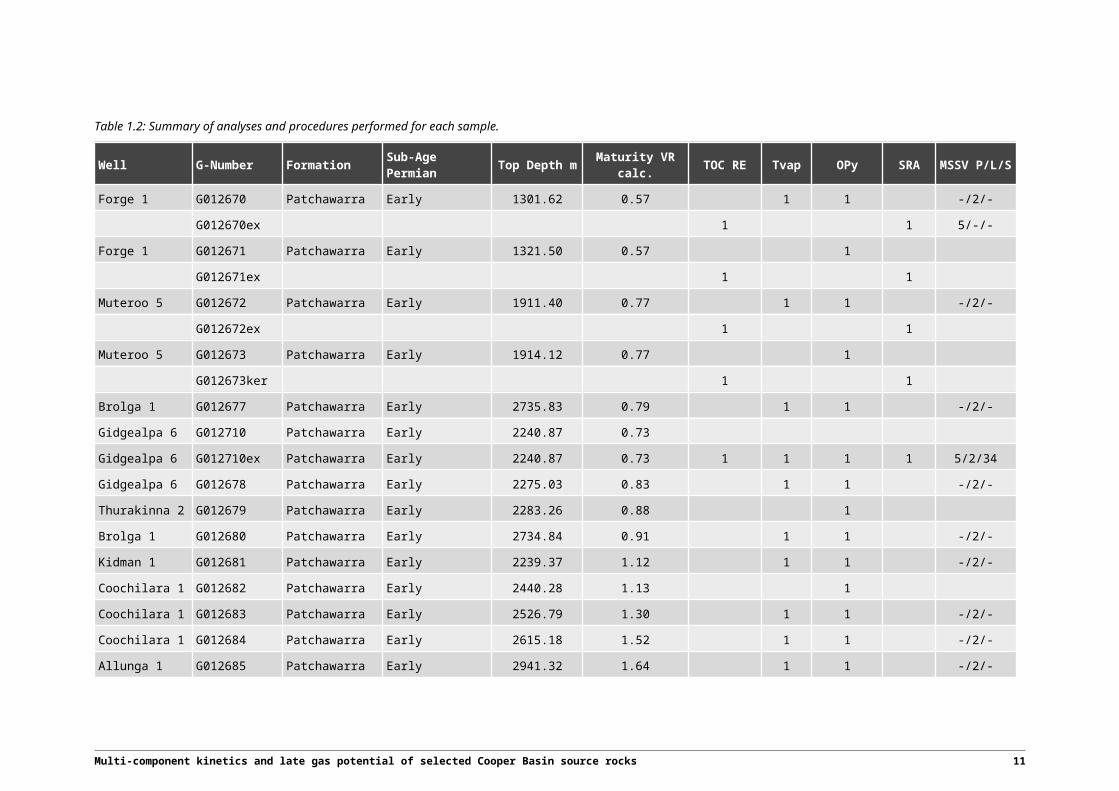
Table 1.2: Summary of analyses and procedures performed for each sample.
Well G-Number Formation Sub-Age Permian Top Depth m Maturity VR calc. TOC RE Tvap OPy SRA MSSV P/L/S
Forge 1 G012670 Patchawarra Early 1301.62 0.57 1 1 -/2/-
G012670ex 1 1 5/-/-
Forge 1 G012671 Patchawarra Early 1321.50 0.57 1
G012671ex 1 1
Muteroo 5 G012672 Patchawarra Early 1911.40 0.77 1 1 -/2/-
G012672ex 1 1
Muteroo 5 G012673 Patchawarra Early 1914.12 0.77 1
G012673ker 1 1
Brolga 1 G012677 Patchawarra Early 2735.83 0.79 1 1 -/2/-
Gidgealpa 6 G012710 Patchawarra Early 2240.87 0.73
Gidgealpa 6 G012710ex Patchawarra Early 2240.87 0.73 1 1 1 1 5/2/34
Gidgealpa 6 G012678 Patchawarra Early 2275.03 0.83 1 1 -/2/-
Thurakinna 2 G012679 Patchawarra Early 2283.26 0.88 1
Brolga 1 G012680 Patchawarra Early 2734.84 0.91 1 1 -/2/-
Kidman 1 G012681 Patchawarra Early 2239.37 1.12 1 1 -/2/-
Coochilara 1 G012682 Patchawarra Early 2440.28 1.13 1
Coochilara 1 G012683 Patchawarra Early 2526.79 1.30 1 1 -/2/-
Coochilara 1 G012684 Patchawarra Early 2615.18 1.52 1 1 -/2/-
Allunga 1 G012685 Patchawarra Early 2941.32 1.64 1 1 -/2/-
Allunga 1 G012686 Patchawarra Early 2980.94 1.77 1
Allunga 1 G012687 Patchawarra Early 3063.24 1.92 1 1 -/2/-
Moomba 27 G012688 Patchawarra Early 2962.05 2.47 1 1 -/2/-
Multi-component kinetics and late gas potential of selected Cooper Basin source rocks 11

Well G-Number Formation Sub-Age Permian Top Depth m Maturity VR calc. TOC RE Tvap OPy SRA MSSV P/L/S
Burley 2 G012689 Patchawarra Early 3470.45 5.69 1
Burley 2 G012690 Patchawarra Early 3470.76 5.51 1 1 -/2/-
Kirby 1 G012692 Patchawarra Early 3313.18 3.05 1 1 -/2/-
Kirby 1 G012691 Patchawarra Early 3560.06 3.33 1 1
Moomba 175 G012693 Roseneath Early 2743.81 2.50 1 1 -/2/-
Pando 2 G012667 Epsilon Early 1774.85 0.70 1
G012667ex 1 1 5/-/-
Wancoocha 1 G012668 Epsilon Early 1859.20 0.72 1
G012668ex 1 1
Wancoocha 1 G012669 Murteree Early 1873.85 0.72 1
G012669ker 1 1 5/-/-
Battunga 1 G012674 Roseneath Early 1959.86 0.72 1
G012674ex 1 1 5/-/-
Vintage Crop 1 G012675 Toolachee Late 1776.45 0.68 1
G012675ex 1 1 5/-/-
Vintage Crop 1 G012676 Toolachee Late 1782.68 0.70 1
G012676ker 1 1
12 Multi-component kinetics and late gas potential of selective Cooper Basin source rocks

Table 1.3: TOC and Rock Eval analyses results by sample.
G-Number S1 S2 S3 Tmax PI HI OI TOC VRcalc.
mg/g sample °C wt ratio mg/g TOC % %
G012670 1.48 61.97 6.24 421 0.02 193 19 32.07 0.57
G012670ex 1.18 51.78 3.08 428 0.02 161 10 32.10
G012671 1.80 123.86 13.16 421 0.01 179 19 69.17 0.57
G012671ex 4.07 120.52 4.63 432 0.03 191 7 63.10
G012672 8.74 179.87 1.98 436 0.05 403 4 44.59 0.77
G012672ex 1.31 113.37 0.28 444 0.01 283 1 40.10
G012673 0.28 1.40 0.17 436 0.17 67 8 2.09 0.77
G012673ker 1.59 41.69 0.00 439 0.04 56 75.10
G012677 7.45 274.75 3.02 438 0.03 447 5 61.42 0.79
G012710 20.43 189.69 4.93 444 0.10 268 7 70.70 0.73
G012710ex 1.25 163.79 3.27 444 0.01 309 6 53.00 0.73
G012678 13.08 365.34 5.07 441 0.03 453 6 80.60 0.83
G012679 9.09 265.49 1.85 445 0.03 322 2 82.38 0.88
G012680 2.44 57.77 0.28 447 0.04 404 2 14.29 0.91
G012681 6.60 126.70 2.05 463 0.05 199 3 63.60 1.12
G012682 8.95 238.28 1.28 464 0.04 275 1 86.69 1.13
G012683 3.95 92.15 0.77 477 0.04 213 2 43.35 1.3
G012684 2.85 82.37 1.04 494 0.03 116 1 70.75 1.52
G012685 2.46 27.85 3.16 504 0.08 60 7 46.08 1.64
G012686 2.12 26.01 3.39 514 0.08 50 7 51.95 1.77
G012687 1.76 20.57 2.48 525 0.08 36 4 56.88 1.92
G012688 0.46 10.31 0.50 573 0.04 12 1 87.62 2.47
G012689 0.10 0.35 0.26 610 0.22 5 4 6.90 5.69
G012690 0.12 0.51 1.62 610 0.19 1 2 83.75 5.51
G012692 0.31 4.06 1.01 607 0.07 6 2 63.99 3.05
G012691 0.24 0.78 0.66 609 0.24 9 8 8.78 3.33
G012693 0.09 0.42 0.49 608 0.18 13 16 3.13 2.5
G012667 12.51 358.64 4.65 431 0.03 464 6 77.21 0.7
G012667ex 2.45 232.94 0.04 437 0.01 334 0 69.70
G012668 3.46 66.63 4.98 432 0.05 118 9 56.67 0.72
G012668ex 1.46 58.03 0.00 435 0.02 102 56.70
G012669 0.12 1.64 0.82 432 0.07 71 35 2.32 0.72
G012669ker 1.09 36.61 0.05 431 0.03 54 0 67.80
G012674 1.05 31.77 4.32 432 0.03 142 19 22.36 0.72
Multi-component kinetics and late gas potential of selected Cooper Basin source rocks 13
G-Number S1 S2 S3 Tmax PI HI OI TOC VRcalc.
mg/g sample °C wt ratio mg/g TOC % %
G012674ex 0.43 13.59 0.68 435 0.03 60 3 22.70
G012675 5.58 228.02 3.78 429 0.02 332 6 68.70 0.68
G012675ex 1.48 153.88 0.20 441 0.01 241 0 63.80
G012676 0.26 8.51 0.20 431 0.03 214 5 3.98 0.70
G012676ker 0.90 109.27 0.02 434 0.01 147 0 74.30
14 Multi-component kinetics and late gas potential of selective Cooper Basin source rocks

2 Experimental programme
2.1 Rock Eval analysis – classical screeningRock Eval analysis was performed using a Rock-Eval 6 instrument. The analysis was performed in two steps, pyrolysis (conventional Rock Eval measurement) and oxidation (TOC determination). Jet Rock 1 was run as a standard and checked against the acceptable range given in the Norwegian Industry Guide to Organic Geochemical Analyses (NIGOGA; Weiss et al., 2000).
The following temperature programme was applied:
Pyrolysis: 300°C for 3 minutes then at 25°C/min. to 650°C (0 min.)
Oxidation: 400°C (3 min.) at 25°C/min. to 850°C (5 min.)
The Rock-Eval parameters and TOC values of reported samples are summarised in Table 1.3 and plotted in Figure 4.
2.2 Thermovaporisation – free hydrocarbons
Thermovaporisation was used to analyse free hydrocarbons in selected unheated samples and performed using the Quantum MSSV-2 Thermal Analysis System©. Milligram quantities of each sample were sealed in a glass capillary and heated to 300°C in the injector unit for 5 minutes. The tube was then cracked open using a piston device coupled with the injector, and the released volatile hydrocarbons analysed by gas chromatography (see next sub-chapter).
The thermovaporisation results of selected samples are reported in Table B1a-B1c (Appendix B) and the chromatograms are shown in Figure C1 (Appendix C).
2.3 Pyrolysis gas chromatography – petroleum typesPyrolysis gas chromatography was performed using the Quantum MSSV-2 Thermal Analysis System®. Thermally extracted (300°C 10 minutes) whole rock samples were heated in a flow of helium, and products released over the temperature range 300-600°C (40 K/min) were focussed using a liquid N2 cryogenic trap, and then analysed using a 50 m x 0.32 mm BP-1 capillary column equipped with a flame ionisation detector. The GC oven temperature was programmed from 40°C to 320°C at 8°C/minute. Boiling ranges (C1, C2-C5, C6-C14, C15+) and individual compounds (n-alkenes, n-alkanes, alkylaromatic hydrocarbons and alkylthiophenes) were quantified by external standardisation using n-butane. Response factors for all compounds were assumed the same, except for methane whose response factor was 1.1.
Pyrolysis gas chromatography results are summarised in Table B2a-B2c. The chromatograms are shown in Figure C2. Ternary diagrams for assessing petroleum type organofacies (Horsfield, 1989) phenol abundance (Larter, 1984), and sulphur abundance (Eglinton et al., 1990) are given in Figure 5. Figure 6 and Figure 7.
Multi-component kinetics and late gas potential of selected Cooper Basin source rocks 15

2.4 Kinetics determination – thermal responseThe sample were analysed by non-isothermal open system pyrolysis at four different laboratory heating rates (0.7, 2.0, 5.0 and 15 K/min) using a Source Rock Analyzer®. The generated bulk petroleum formation curves serve as input for the bulk kinetic models consisting of an activation energy distribution and a single frequency factor.
The kinetic parameters are given in Table B3. The energy distributions are shown in Figure 8 and Figure 10. The application of the calculated kinetic models to a geologic heating rate of 3°C per million years is shown in Figure 9 and Figure 11.
2.5 MSSV pyrolysis – compositional evolution
MSSV pyrolysis, or microscale sealed vessel pyrolysis (Horsfield et al., 1989), was performed using the Quantum MSSV-2 Thermal Analysis System®.
Milligram quantities of each sample were sealed in glass capillaries and artificially matured at 0.7 K/min using a special MSSV prep-oven for the PhaseKinetics approach. For the late gas potential determination a heating rate of 2 K/min was chosen and two end temperatures, 560°C and 700°C. For the determination of kinetic parameters of primary and secondary gas generation three heating rates were used (0.7; 2.0; 5.0 K/min) as well as 39 end temperatures (13 for each heating rate) between 300 and 600°C.
The tubes were then cracked open using a piston device coupled with the injector, and the released products were swept into the GC using a flow of helium. A HP5890 II instrument was used for GC analysis (column: HP-1, 50 m length, i.d. 0.32 mm, film thickness 0.52 µm) with flame ionisation detection.
Individual compounds in the gas range (C1-C5), coarse boiling ranges (C1, C2-C5, C6-C14, C15+) and 25 pseudo-boiling ranges for each carbon number at and above C6 were quantified for the PhaseKinetics approach. Boiling ranges (C1, C2-C5, C6-C14, C15+) and individual compounds (n-alkenes, n-alkanes, alkylaromatic hydrocarbons and alkylthiophenes) were quantified for kinetic modelling and late gas potential evaluation. Quantification was performed by external standardisation using n-butane. Response factors for all compounds were assumed the same, except for methane whose response factor was 1.1.
The closed-system pyrolysis chromatograms are given in Figures C3-C5, integration results are listed in Table B4 and Tables B9-11. The molar compositions of final corrected fluids are given in Table B5. The compositional kinetic models are summarised in Figure 12 and Table B7a-f, whereas the physical properties of the pseudo compounds used for the 14 compound models are shown in Table B6. The physical properties of the fluids generated from the investigated samples are reported in Figure 13 and Table B8. Calculated late gas yields and ratios are given in Table 1.3, whereas the evolution of the late gas potential with maturity is illustrated in Figure 14 and Figure 27. Data used for the determination of kinetic parameters of primary and secondary gas generation are given in Table B12.
16 Multi-component kinetics and late gas potential of selective Cooper Basin source rocks

3 Results
3.1 Screening analysesTotal organic carbon content and Rock Eval results are listed in Table 1.3 (all samples) and shown in Figure 4 (whole rocks).
Samples from the Patchawarra Formation cover a maturity interval 0.57–5.51% vitrinite reflectance (VRcalc), which translates to Tmax values between 421 and >600°C. Samples from the Epsilon and Toolachee formations, along with the Murteree and Roseneath shales, are immature to early mature based on Tmax values of ~430°C (VRcalc ~0.70%). Only one Roseneath Shale sample (G0012693) is overmature (Tmax ~608°C, VRcalc 2.5-2.99%). The maturity parameter VRcalc used is derived from direct vitrinite measurements (25 measurements for each sample) and the Rock-Eval Tmax.
The samples are characterised by high TOC contents ranging from 2 to 88% (Figure 4 right hand side). Generally, samples with TOC contents >40% are defined as coals, whereas samples with TOC contents <40% are defined as shales. Therefore, the majority of Patchawarra Formation samples are coals, as well as the two samples from the Epsilon Formation and one out of two samples from the Toolachee Formation. Based on the same TOC-criterium, the Roseneath and Murteree shale samples can be defined as shales. Nevertheless, the immature Roseneath Shale sample G012674 is organic-rich with TOC contents >20% and can be described as a coaly shale.
For the Patchawarra Formation maturity series, Hydrogen Indices (HI) extend from 1 to 453 mg HC/g TOC. For samples exhibiting VRcalc >1% (or Tmax >450°C), HI gradually decreases as a function of maturity and related to petroleum generation from ~300 mg HC/g TOC to 1 mg HC/g TOC. At these maturities, HI is no longer indicative of organic matter type. The best maturity stage to define organic matter type for coals can be found approximately at 0.7–0.8% Ro, as HI tends to increase between sub-bituminous and high volatile bituminous coal ranks in the course of loss of oxygen bearing functional groups (Vu et al., 2013). Two types of Patchawarra Formation coals can therefore be observed. Four volatile-rich ones (Type II) with HIs >400 mg HC/g TOC (G012672, G012677, G012678, G012680) and four “normal” humic coals (Type III–II/III) with HIs between 200 and 350 mg HC/g TOC (G012670, G012671, G012710, G012679). The early mature shale sample G012673 (TOC ~2%) from the Patchawarra Formation exhibits a low HI (<100 mg HC/g TOC) indicative of the presence of volatile-poor Type III organic matter. The kerogen concentrate of this sample produces similar Rock-Eval parameters (Table 1.3) ruling out mineral matrix effects.
The two Epsilon Formation coals can be classified as a volatile-rich (Type II) coal (G012667) and as a hydrogen-poor (Type III) coal (G012668). The two Toolache Formation shale (G012676) and coal (G012675) samples both comprise Type II/III organic matter, whereas the two early mature Murteree and Roseneath shale samples both comprise Type III organic matter.
Multi-component kinetics and late gas potential of selected Cooper Basin source rocks 17

Figure 4: TOC and Rock Eval results for whole rock samples.
3.2 Free hydocarbons
Thermovaporisation was run for fifteen natural maturity series Patchawarra Formation whole rock samples and one overmature Roseneath Shale sample to characterise free hydrocarbons. Chromatograms are shown in Figure C1, boiling range and individual compound yields are listed in Tables B1a-B1c.
Thermal extracts up to a maturity level of 1.3% VRcalc consist of a complex light hydrocarbon mixture (up to approximately n-C10, methylcyclohexane is a very prominent substance), intermediate to high molecular weight paraffins, including both normal and branched alkanes in the range from C6 to C29, and a suite of aromatic compounds dominated by toluene, m,p-xylene and various alkyl-naphthalenes. The methylnaphthalenes might originate from terpenoid precursors in tree resins (Horsfield et al., 1988). Phenolic compounds and sulphur-bearing compounds are scarce and no significant hump (unresolved complex mixture) can be observed.
Thermal extracts of samples exhibiting maturity levels above 1.3% VRcalc are mainly made up of aromatic compounds again dominated by toluene, m,p-xylene and various alkyl-naphthalenes, whereas benzene becomes more and more prominent with increasing maturity. Intermediate to long-chain aliphatic compounds are detected but in much lower relative amounts than before. For maturity levels above 2.5% VRcalc gaseous compounds dominate over all other compounds.
3.3 Petroleum type organofaciesOpen-system pyrolysis GC-FID was run for all 27 whole rock samples. The pyrolysis gas chromatograms are shown in Figure C2, boiling range and individual compound yields are listed in Tables B2a-B2c.
18 Multi-component kinetics and late gas potential of selective Cooper Basin source rocks

Pyrolysates of the overmature samples (VRcalc >1.3%) are all dominated by gas compounds and aromatic compounds like benzene, toluene, xylenes, and alkylnaphthalenes. Benzene becomes increasingly dominant with increasing maturity of the source rock. Normal hydrocarbon doublets of n-alkenes and n-alkanes with more than 7 C-atoms are very scarce.
The pyrolysis products of immature to oil window mature samples (VRcalc <1.3%) are dominated by gas compounds, normal hydrocarbon doublets of n-alkenes and n-alkanes extending to long chain lengths, and by aromatic and phenolic compounds. Aromatic compounds, especially toluene and m,p-xylene, and phenolic compounds are in most cases present in much higher relative amounts than coeluting aliphatic compounds. Sulphur compounds, such as methylthiophenes, dimethylthiophenes or ethylmethylthiophenes are essentially absent. Phenol and cresols, typical of land plant lignocellulosic pyrolysis products, are very prominent in almost all immature and early mature samples, indicate major terrigeneous organic matter input, and decrease only for maturity levels above 1% VRcalc. Exceptions are the Murteree Shale sample G012669 and the Patchawarra Formation shale sample G012673 which generate only minor amounts of phenolic compounds upon pyrolysis.
Figure 5 shows the carbon chain length distribution of the samples plotted in the Petroleum Type Organofacies triangle of Horsfield (1989). For further molecular description of the kerogen structure (phenol abundance, aromaticity, and sulphur content) the triangular plots of Larter (1984) and Eglinton et al. (1990) are used (Figure 5 to Figure 7, respectively).
The inferred petroleum type (Figure 5) for mature samples (VRcalc >1.3%) is gas and condensate. At those maturity stages, source rocks are generally known to have only a potential for gas left. The kerogen structure is short-chain dominated and very aromatic (Figure 7). The scatter in the ternary of Larter (1984) (Figure 6) is induced by overall very low pyrolysis yields for very high maturitiy samples.
The inferred petroleum type (Figure 5) for immature to oil window mature Patchawarra Formation samples (VRcalc <1.3%) and samples from all other formations under investigation is mainly paraffinic-naphthenic-aromatic (P-N-A) low wax or, for less samples, gas and condensate. The position within the P-N-A low wax field, i.e. at the border to the gas and condensate field, and at the border to the P-N-A high wax field, is diagnostic of fluviodeltaic depositional environments with variable organic matter input leading to slightly differing maceral assemblages (e.g. vitrinite, cutinite, liptodetrinite, and resinite in variable proportions). Taking into account the very low sulphur compounds abundance within pyrolysates (Figure 7), deposition in a marine environment is highly unlikely whereas input of algal or bacterial organic matter within a lacustrine/brackish environment is still very likely. The gas and condensate field was defined using pyrolysates of vitrinites and sporinites in accordance with the mainly Type III gas-prone nature of northwest European Carboniferous coals, which are rich in vitrinite and whose major liptinite maceral is sporinite (Stach et al., 1982; Horsfield, 1989). Plotting in the centre of the gas and condensate field, this “vitrinite-richness” could be therefore ascribed to Toolachee Formation coal sample G012675 and to Patchawarra Formation samples G012671, G012673 (shale sample), G012681, and G012682.
The samples have, typical for terrestrially derived or strongly influenced organic matter, high phenol contents (Larter 1984; Figure 6), with the exception of Patchawarra Formation coals exhibiting maturity levels exceeding 1.3% VRcalc. For the latter samples phenol precursor structures are already consumed or incorporated into the residual organic matter structure. Generally, pyrolysate compositions outside of the “aquatic” field indicate the presence of heterogeneous, aromatic and short-chained precursor structures within the kerogen translating into broad activation energy distributions and broad temperature intervals over which hydrocarbons are generated under natural conditions (compare next sub-chapter - Bulk Kinetics).
Multi-component kinetics and late gas potential of selected Cooper Basin source rocks 19

All samples show, typically for terrestrially derived samples, low sulphur contents and plot in the intermediate to high aromaticity field in the ternary diagram of Eglinton et al. (1990; Figure 7). Highest aromaticities are evident for the most mature samples whereas less mature samples tend to plot in the intermediate field or towards the border of the intermediate field as higher amounts of aliphatic precursor structures are still present. The rather low sulphur contents explain, at least partly, relatively high thermal stabilities (compare next sub-chapter - Bulk Kinetics).
Figure 5: Petroleum Type Organofacies after Horsfield (1989).
20 Multi-component kinetics and late gas potential of selective Cooper Basin source rocks

Figure 6: Phenol abundance (diagram after Larter, 1984).
Figure 7: The kerogen type characterisation after Eglinton et al. (1990).
Multi-component kinetics and late gas potential of selected Cooper Basin source rocks 21

3.4 Bulk kineticsTable B3 lists the activation energy distributions and frequency factors determined for five Patchawarra Formation samples and six sampls from the Epsilon and Toolachee formations and the Roseneath and Murteree shales analysed using a Source Rock Analyzer and 4 heating rates (0.7, 2.0, 5.0 and 15.0°C/min; kinetics parameters are determined using all heating rates). Extracted sample material or kerogen concentrate was used to minimise the influence of free, high molecular weight oil compounds or inorganic matrix components, respectively, on the generation and release of pyrolysis products.
Application of the kinetic models to a geologic heating rate of 3°C/Ma was performed for Patchawarra Formation samples (Figure 9) and for the samples from other formations in the Cooper Basin (Figure 11) based on the activation energy distributions calculated for each sample (Figure 8 and Figure 10 respectively). Figure 9 shows the comparison of predicted transformation ratio rate and generation rate curves for each Patchawarra Formation sample indicating in part kinetic variability related to maturity, whereas kinetic variability in Figure 11 can be related to differences in the organic matter structure.
Patchawarra Formation samples can be grouped into one general type and two sub-types. Hydrocarbon generation of all samples is characterised by broad Ea distributions. Activation energies range over ~23 potentials, whereas the activation energy with the highest potential accounts for 20-25% of the total bulk reaction for the first sub-group (Figure 8 left hand side: G012670, G012672, G012710) and for below 15% of the total bulk reaction for the second sub-group (Figure 8 right hand side: G012671, G012673). Interestingly, the first sub-group’s pyrolysate falls into the P-N-A low wax petroleum generating organofacies field whereas the second sub-group’s pyrolysate falls into the gas and condensate generating organofacies field (Figure 5). The main energy is shifted to higher values with increasing maturity of the samples. The main activation energy ranges from 52, 53 kcal for the least mature samples G012670 and G012671 (VRcalc = 0.57%) to 57/58 kcal for sample G012710 (VRcalc = 0.73%) to 59, 63 kcal for the most mature samples G012672 and G012673 (VRcalc = 0.77%). In any case, the kinetic parameters are characteristic for heterogeneous structures that generate over a broad maturity interval under geologic conditions.
Figure 9 shows the calculated evolution of the transformation ratio and generation rate for a geologic heating rate of 3°C/Ma. In this figure the observations made with respect to the Ea distributions in Figure 8 are projected to a geological scenario. In concordance with the main activation energy shift to higher values with increasing maturity the geologic onset temperatures (10% TR, Figure 9 top) and Tpeak values (Figure 9 bottom) are shifted to higher temperatures with increasing maturity of the samples. Onset and and Tpeak temperatures range from ~130°C respectively ~148°C for the least mature samples G012670 and G012671 (VRcalc = 0.57%) to ~147°C respectively ~160°C for sample G012710 (VRcalc = 0.73%) to ~151°C respectively ~170°C for the most mature samples G012672 and G012673 (VRcalc = 0.77%). All samples show a gradual increase in TR with increasing temperature, whereas samples of the first sub-group generate petroleum over a slightly smaller temperature interval (60-65°C) than samples from the second sub-group (75-90°C).
22 Multi-component kinetics and late gas potential of selective Cooper Basin source rocks

Figure 8: Bulk kinetic parameters of Patchawarra Coals based on all heating rates (0.7; 2.0; 5.0; 15.0 K/min). (Data in Table B3).
Multi-component kinetics and late gas potential of selected Cooper Basin source rocks 23
Figure 9: Transformation ratio rate curves (top) and generation rate curves (bottom) calculated using the bulk kinetic models shown in Figure 8 applied to a geologic heating rate of 3 K/Ma.
24 Multi-component kinetics and late gas potential of selective Cooper Basin source rocks

Primary kerogen conversion for all Patchawarra Formation samples is completed (90% TR) at temperatures exceeding 150°C by far, they exceed 200°C in most cases, hinting to a very stable organic matter structure or at least to the presence of refractory organic matter. High thermal stabilities are also indicated by onset temperatures of hydrocarbon generation (10% TR) exceeding 125°C for the least mature sample. This feature is rather related to the fact that the organic matter is not rich in organic sulphur (compare sub-chapter Petroleum Type Organofacies).
Samples from the Epsilon and Toolachee formations and Roseneath and Murteree shales exhibit similar maturities (VRcalc ~0.7%) and can be grouped into one general type and three sub-types according to organic matter stability. Hydrocarbon generation of all samples is characterised by broad Ea distributions (Figure 10). Activation energies range over 22-25 potentials, whereas the activation energy with the highest potential accounts for >20% of the total bulk reaction in most cases. Only the potential of the main activation energy of Toolachee Formation sample G012675 accounts for less than 15% of the bulk reaction. Interestingly, this sample’s pyrolysate again falls into the gas and condensate generating organofacies field (Figure 5) in contrast to all other samples (P-N-A low wax). The main energy is shifted to higher values with different organic matter type, or sub-group. The main activation energy ranges from 54 kcal for Murteree Shale G012669 to 56 and 57 kcal for Roseneath Shale sample G012674 and Epsilon Formation samples G012667/8 (respectively) to 65 kcal for Toolachee Formation samples G012675 and G012675. The Roseneath Shale and Epsilon Formation samples therefore have similar bulk kinetic paramteres than Patchawarra Formation samples exhibiting identical maturity (e.g. sample GO12710). In any case, the kinetic parameters are characteristic for heterogeneous structures that generate over a broad maturity interval under geologic conditions. In addition, all samples exhibit Ea distribution envelopes which are asymmetric, i.e. minor activation potentials are rather located on the high stability than at the low stability side of the main activation energy.
Figure 11 shows the calculated evolution of the transformation ratio and generation rate for a geologic heating rate of 3°C/Ma. In this figure the observations made with respect to the Ea distributions in Figure 10 are projected to a geological scenario. In concordance with the main activation energy shift to higher values related to “organic matter sub-groups”, the geologic onset temperatures (10% TR; Figure 11 top) and Tpeak values (Figure 11 bottom) are shifted to higher temperatures. Onset and and Tpeak temperatures range from ~132°C respectively ~143°C for Murteree Shale G012669 to ~146°C respectively ~160°C for Roseneath Shale sample G012674 and Epsilon Formation samples G012667/8 to ~165°C respectively ~180°C for Toolachee Formation samples G012675 and G012675. All samples show a gradual increase in TR with increasing temperature and generate petroleum over a temperature interval exceeding 65°C in most cases by far. Primary kerogen conversion for all samples is completed (90% TR) at temperatures exceeding 200°C, hinting to a very stable organic matter structure or at least to the presence of refractory organic matter. High thermal stabilities are also indicated by onset temperatures of hydrocarbon generation exceeding 130°C for the least mature sample. This feature is rather related to the fact, that the organic matter is not rich in organic sulphur (compare sub-chapter Petroleum Type Organofacies).
Multi-component kinetics and late gas potential of selected Cooper Basin source rocks 25

Figure 10: Bulk kinetic parameters of further coals and shales from the Cooper Basin based on all heating rates (0.7; 2.0; 5.0; 15.0 K/min). (Data in Table B3).
26 Multi-component kinetics and late gas potential of selective Cooper Basin source rocks

Figure 11: Transformation ratio rate curves (top) and generation rate curves (bottom) calculated using the bulk kinetic models shown in Figure 10 applied to a geologic heating rate of 3 K/Ma.
Multi-component kinetics and late gas potential of selected Cooper Basin source rocks 27

3.5 MSSV-pyrolysis: PhaseKinetics
3.5.1 Primary cracking products
Following the two-level screening (Rock-Eval and pyrolysis gas chromatography) and bulk kinetics analyses, six Permian Cooper Basin samples, one from each formation, were subjected to close-system pyrolysis and data synthesis following the PhaseKinetic approach (di Primio and Horsfield, 2006). Data for a second Patchawarra Formation sample (G012710) was co-collected during higher resolution MSSV-pyrolysis experiments performed to determine kinetic parameters for secondary gas generation (compare sub-chapter MSSV-Pyrolysis: secondary cracking kinetics).
MSSV-pyrolysis gas chromatograms are shown in Figure C3 and individual compound and boiling range yields are listed in Table B4. Five MSSV pyrolysis experiments were performed using a heating rate of 0.7°C/min up to temperatures representing 10, 30, 50, 70 and 90% transformation. The end temperatures for each heating experiment (Table B4) were determined based on the bulk kinetic results (bulk pyrolysis at 0.7°C/min).
Thermovaporisation for identification of previously generated hydrocarbons was not performed because extacted samples or kerogen concentrates were used.
Compositional information at each transformation ratio, after correction of the gas composition as discussed in Appendix A was used to determine molar proportions of selected compounds for the characterisation of the generated fluids physical properties (PVT-properties). Through integration of these individual PVT-datasets with the bulk kinetics of the sample, following the PhaseKinetic approach (di Primio and Horsfield, 2006), a phase predictive compositional kinetic model was developed using the methodology described in Appendix A.
Table B5 shows the molar composition of the final corrected fluid descriptions. Table B6 gives the physical properties of the pseudo compounds used for the 14 compound models. Standard “wet gas” and “black oil” definitions from Petromod® are recommended for the 2-compound kinetic models. The final compositional subdivision of the models for the individual transformation ratio stages are shown in Figure 12 and the complete compositional kinetic models, including two and four compound compositional kinetics, are listed in Table B7a-f.
It is very important to note that the final compositional kinetic model discussed to this point predicts the generation of petroleum as a function of primary cracking exclusively. Generally we assume that the compositions predicted are representative of the expelled fluid phase which then migrates to the reservoir. This assumption is most likely valid for good quality oil-prone source rocks, which are efficient expellers. In the case of poor samples, however, expulsion efficiency and the secondary cracking of retained compounds should be taken into account.
28 Multi-component kinetics and late gas potential of selective Cooper Basin source rocks

Figure 12: PhaseKinetic 14-compound models for selected samples. (Data in Table B7a-f).
Multi-component kinetics and late gas potential of selected Cooper Basin source rocks 29

Concerning the physical properties (e.g. GOR, saturation pressure Psat, formation volume factor Bo) predictions of the compositional kinetic models closely follow the physical properties of cumulative fluids generated during MSSV-pyrolysis as a function of primary cracking (Figure 13 and Table B8). The observations made based on activation energy distributions and carbon chain length distributions from pyrolysis are generally supported by the results shown, but are somewhat on the “gas-rich side“. A P-N-A low wax petroleum type was predicted for all here investigated samples with the exception of Toolachee Formation sample G012675 (gas and condensate), but the fluids generated fall within the volatile oil class. They reach saturation pressures over 200 bars in all cases already at 70% transformation ratio and over 150 bar at 30%. At highest maturity levels (90% TR) saturation pressures generally range above 400 bar with GORs exceeding 1000 Sm³/Sm³. Only the most immature Patchawarra Formation sample G012670 (VRcalc ~0.57%) generates a volatile oil with GORs of ~200 Sm³/Sm³ and saturation pressures of ~200 bar over the entire primary kerogen conversion range. The more gas-rich signature (compared to PyGC results) might be caused by the extraction procedure. In this context Vu et al. (2008) showed that employing solvent extraction prior to pyrolysis might not be appropriate when assessing the petroleum potential of coal as the presence of bitumen finely dispersed throughout the kerogen matrix prevents cross-linking reactions and pyrolysis products to become overly gas-rich. Nevertheless, the here observed physical properties of generated fluids are not unusual for terrestrial derived organic matter.
Samples from all formations, with the exception of the most immature Patchawarra Formation sample G012670, show similar systematics of GOR evolution which reflect the earlier results from kinetics and, with some restrictions, pyrolysis GC: In concordance with broad Ea distribution GORs as well as saturation pressures and formation volume factors show a high degree of variability and steep gradients. GOR and saturation pressures strongly increase with increasing maturity, reproducing the natural behaviour of terrestrial organic matter derived fluids. Overall high GORs, saturation pressures, and formation volume factors correlate very well with the gas-rich and aromatic signature observed under open-system pyrolysis conditions.
The saturation pressure increases with increasing transformation ratio and is positively correlated to Bo in most cases (Figure 13 bottom). Hence, closed-system artificial maturation experiments at low maturation stages reflect the behaviour of naturally occurring petroleum, i.e. volatile oil, very well.
30 Multi-component kinetics and late gas potential of selective Cooper Basin source rocks

Figure 13: Calculated Gas/Oil ratio (top left) and saturation pressure (top right) as a function of kerogen transformation, as well as predictions of saturation pressure (Psat) and formation volume factor (Bo) for selected samples. (The outlined area marks physical properties of naturally occurring petroleum). (Data in Table B8).
Multi-component kinetics and late gas potential of selected Cooper Basin source rocks 31

3.5.2 Secondary cracking products
The characterisation of secondary cracking effects is not as well constrained, and has been implemented into the Phasekinetic approach based on the following assumptions:
PhaseKinetics describe the hydrocarbon composition generated and expelled from the source rock.
A proportion of the entire generated phase is retained in the kerogen by adsorption.
The proportion retained depends on the dead carbon content of the kerogen and a specific sorption coefficient, which applies to the entire petroleum phase.
Dead carbon proportion and sorption coefficients are based on the Pepper and Corvi (1995a) approach, these numbers are defined for the secondary cracking versions of each 14-compound phase-predictive model.
Expulsion occurs once the sorption capacity of the kerogen is exceeded.
Retained fluids will mix with newly generated fluids, cracking kinetics of exclusively the liquid pseudo-compounds are also defined based on Pepper and Corvi (1995b).
The only compound generated by cracking is methane.
In order to implement the secondary cracking kinetics the specific kinetic model must be assigned to a source rock facies. In the Petromod® V2012 kinetic editor under the Adsorption tab the Component Adsorption Model "Expelled Composition" should be selected. The simulator will then calculate expulsion of the generated phase from the source rock.
3.6 MSSV-pyrolysis: late gas potentialsFollowing Rock-Eval pyrolysis and open-system gas chromatography fifteen samples were subjected to closed-system high temperature pyrolysis to evaluate their late gas potential following the approach of Mahlstedt and Horsfield (2012a).
MSSV-pyrolysis gas chromatograms are shown in Figure C4 and individual compound and boiling range yields are listed in Table B9 and Table 3.4. Two MSSV pyrolysis experiments were performed for each sample using a heating rate of 2.0°C/min. One tube was heated from 200°C to 560°C and another one from 200°C to 700°C. The temperature range between 560°C and 700°C represents the main stage of late methane generation and occurs subsequently to primary C1+ generation as well as subsequently to secondary cracking of the major portion of C6+ compounds.
Total C1-5 and C6+ product yields at MSSV temperatures 560°C and 700°C, calculated total late gas yields, late secondary gas (A) yields from oil cracking, and late secondary gas (B) yields from cracking of a refractory kerogen moiety, as well as late gas ratios LGP and LGT for all samples are given in Table 3.4.
32 Multi-component kinetics and late gas potential of selective Cooper Basin source rocks

Table 3.4: High temperature MSSV-Pyrolysis GC-FID.
G-Number Rr C1-5
560°CC1-5
700°CC6+
560°CC6+
700°CLate Gas
sec. Gas (A)
sec. Gas (B) LGP LGT
% mg/g TOC kg/kg
G012670 0.57 104.7 151.0 21.4 1.8 46.3 5.9 40.4 0.59 1.37
G012710 0.73 102.8 145.4 17.6 1.3 42.6 4.9 37.7 0.59 1.35
G012677 0.77 128.0 162.4 27.6 4.5 34.4 6.9 27.5 0.56 1.20
G012672 0.77 143.4 155.9 32.4 2.2 12.5 9.1 3.5 0.52 1.02
G012678 0.83 114.7 145.2 26.7 4.9 30.6 6.5 24.0 0.56 1.20
G012680 0.91 101.4 148.9 20.2 1.8 47.6 5.5 42.1 0.60 1.39
G012681 1.12 79.5 119.4 19.3 3.4 39.9 4.8 35.2 0.60 1.42
G012683 1.30 59.8 114.6 11.8 0.9 54.8 3.3 51.5 0.66 1.82
G012684 1.52 36.9 84.2 8.0 0.6 47.3 2.2 45.1 0.70 2.15
G012685 1.64 37.4 93.2 7.0 0.8 55.8 1.9 53.9 0.71 2.37
G012687 1.92 24.3 78.0 4.5 0.5 53.7 1.2 52.5 0.76 3.06
G012688 2.47 7.9 59.6 0.9 0.2 51.7 0.2 51.5 0.88 7.38
G012693 2.50 21.3 69.0 3.8 2.4 47.7 0.4 47.2 0.76 3.17
G012692 3.05 1.0 4.6 0.2 0.1 3.7 0.0 3.6 0.83 4.62
G012690 5.51 0.5 8.9 0.0 0.0 8.4 0.0 8.4 0.95 17.25
Late Gas: Yield C1-5(700°C) – Yield C1-5(560°C)sec. Gas (A): Late Gas from late oil cracking: (Yield C6+(560°C) – Yield C6+(700°C))*0.3sec. Gas (B): Late Gas from refractory OM: Late Gas – sec. Gas (A)LGP: Late Gas Potential ratio: Yield C1-5(700°C)/(YieldC1-5(560°C) + Yield C1-5(700°C))LGT: Late Gas Type ratio: Yield C1-5(700°C)/(YieldC1-5(560°C) + sec. Gas (A))
For all investigated samples, gas yields at 700°C are higher than gas yields at 560°C, thus all samples generate late gas whereas all but one (G012672) exhibit high late gas potentials (LGP >>0.55). This means that the late gas has to be largely explained by the cracking of a refractory kerogen moiety (formed during catagenesis) because input of secondary gas from oil cracking (sec. Gas (A)) is neglectable (LGT >>1). Late gas yields (sec. Gas (B)) range between ~25 and 54 mg/g TOC, only the most mature samples with vitrinite reflectance >3% (G012692, G012690) show yields below 10 mg/g TOC, as well as immature sample G012672. The latter sample exhibits an only intermediate late gas potential (LGP 0.52) and generates 3.5 mg/g TOC secondary gas B.
Figure 14 shows the evolution of late gas potential ratios for Patchawarra Formation coals and a single Roseneath Shale sample compared with earlier published results of Type II and Type III source rocks (Mahlstedt and Horsfield, 2012b). All source rocks, despite of initial late gas potential develop high late gas potentials with increasing maturity, the ratios even exceeding borders previously defined by an immature sample set (Mahlstedt and Horsfield, 2012a). This maturity trend is systematic and can be more or less well described by a logarithmic function implying that late gas potentials increase up to infinity. Of course, this relationship is only applicable for ratios, not for absolute yields, as shown in the following paragraphs. It should be stated here though that results for Cooper Basin coals and shales fit very well thoses of previously described coals and shales.
Multi-component kinetics and late gas potential of selected Cooper Basin source rocks 33

Figure 15 shows the evolution of late gas potential as a function of maturity for the investigated Patchawarra Formation coal and Roseneath Shale samples in comparison to published results of Type II and Type III source rocks (Mahlstedt and Horsfield, 2012b; Mahlstedt and Horsfield, in prep). For the latter, it could be shown that late gas potentials are underestimates for immature samples and that late gas potentials increase during catagenesis up to values of at least ~40 mg/g TOC at 2.0% vitrinite reflectance for possibly any given kerogen type. Relevant late gas precursor structures, i.e. methyl-aromatics, are formed during catagenesis within the residual organic matter by chain shortening reactions via β–scission as well as by concentration of refractory kerogen. The late methane forming reaction itself can be described by a final demethylation of residual aromatic nuclei within spent organic matter via α-cleavage mechanisms involving condensation reactions of aromatic clusters. Based on kinetic parameters published in Mahlstedt (2012) and Mahlstedt and Horsfield (in prep), late gas generation takes place between 2.5 and 3.5% Ro for a simplified geological heating history (3°C/ma heating rate), a prediction directly confirmed by decreasing late gas potentials of naturally matured samples of Type II and Type III origin exhibiting vitrinite reflectances >2.0% Ro (Figure 15).
Late gas potentials of investigated Patchawarra Formation coals follow very well the previously described evolution trend for coals with maturity, i.e. late gas potentials of ~40 mg/g TOC at lowest maturities (Rr 0.57%), lowest late gas potentials at maturity stages around 0.8% Ro, and increasing late gas potentials during catagenesis up to Ro ~2.0%. In the case of Cooper Basin coals, very high values of 54 mg/g TOC are reached here, which indicates that earlier results (40 mg/g TOC) represent minimum late gas potentials. At 2.4% Ro late gas potentials still exceed 45 mg/g TOC confiming kinetic calculation which predict that late gas generation commences at ~2.5% Ro. Interestingly, Roseneath Shale sample G012693 falls on the same late gas potential evolution trend as the Type III coals, giving evidence to the described phenomenon as being relevant for any initial organic matter type. Late gas potentials below 10 mg/g TOC at maturities exceeding 3% Ro as well demonstrate that late gas generation takes place for vitrinitre reflectances between 2.5 and 3.5% under natural conditions by consumption of late gas precursor structures.
34 Multi-component kinetics and late gas potential of selective Cooper Basin source rocks
Figure 14: Late Gas Potential ratios evolution with maturity for Cooper Basin samples (colored cricles) as well as for published maturity series samples (Mahlstedt and Horsfield, 2012b; Mahlstedt and Horsfield (in prep)) (white symbols). (Data in Table 3.4).
Figure 15: Late Gas potential evolution with maturity (vitrinite reflectance) for Cooper Basin samples (colored cricles) as well as for published maturity series samples (Mahlstedt and Horsfield, 2012b; Mahlstedt and Horsfield (in prep)) (white symbols). White arrows indicate the evolution of late gas potentials with maturity. (Data in Table 3.4).
Multi-component kinetics and late gas potential of selected Cooper Basin source rocks 35

One interesting feature of the late gas potentials evolution (Figure 15) is the decrease of late gas potentials between 0.4 and ~0.7% vitrinite reflectance, which is observed in New Zealand coals as well as, less distinctive though, for Australian Patchawarra Formation coals. This feature can be explained by the loss of late gas precursor structures together with the most unstable O-bearing functional groups and low molecular weight compounds, such as acetate during diagenesis and early catagenesis (also compare Vu et al. (2013)). Glombitza et al. (2009) performed alkaline ester cleavage experiments on immature New Zealand coals and observed that concentrations of liberated low molecular weight compounds such as acetate, which possesses a methyl group within its chemical structure, considerably decrease during early catagenesis up to maturity levels of about 0.6% Ro. This indicates a continuous loss of kerogen-linked small organic acids during maturation of organic matter, whether by release from or incorporation into the residual kerogen.
3.7 MSSV-pyrolysis: secondary cracking kineticsFollowing the two-level screening (Rock-Eval and pyrolysis gas chromatography) and bulk kinetics analyses one “representative” Patchwarra Formation coal sample (G012710ex) was subjected to close-system pyrolysis to determine the kinetics of primary and secondary gas formation following the approach of Mahlstedt et al. (2013) and using a modified GORFit – model (Mahlstedt, in prep). 39 MSSV experiments were performed at conditions shown in Table 3.5. An important change in comparison to earlier application is that five end temperatures were used for each heating rate which represent 10, 30, 50, 70, and 90% kerogen conversion as determined by directly measured bulk pyrolysis transformation ratio rate curves. Chromatograms are shown in Figure C5 and individual compound and boiling range yields are listed in Table B10-11c.
In Figure 16 to Figure 23 the compositional evolution of boiling ranges and selected single compounds as a function of maturity, i.e. temperature, are displayed. Total pyrolysis yield curves are displaced to higher temperatures with increasing heating rate (Figure 16), in accordance with the laws of chemical kinetics (Schenk et al., 1997). Maximum yields seem to be rather similar for all heating rates. Four zones have been defined for the 0.7 K/min experiments according to the compositional changes taking place, some of which are presented in subsequent figures. Within Zones 1 and 2 primary cracking predominates and total products are generated in increasing abundance. At the end of Zone 2 secondary cracking commences, which leads to decreasing yields of C6+ boiling range compounds (Figure 18, Figure 22) throughout Zone 3 and to increasing gas yields (Figure 18), and thus gas-oil-ratios (Figure 17). Decreasing total product amounts at the end of Zone 3 (Figure 16) indicate coke formation in the course of secondary cracking, a feature also recognisable by decreasing aromatic and phenolic compound yields (Figure 23). In the middle of Zone 3, secondary cracking of wet gases starts (Figure 19 to Figure 21), leading to a pronounced decrease in gas wetness (Figure 17). Zone 4 is characterised by the cracking of all compound groups with methane (and coke as a non-GC-amenable fraction) being sole end products (Figure 19).
Table 3.5: MSSV-Pyrolysis GC-FID end temperatures.
temp [°C] 0.7 K/min 2.0 K/min 5.0 K/min
300.0
350.0
355.0
360.0
36 Multi-component kinetics and late gas potential of selective Cooper Basin source rocks

temp [°C] 0.7 K/min 2.0 K/min 5.0 K/min
384.5 10
408.0 10 10
408.9 30
425.0 50
430.5 30
437.1 30
445.5 70 50
454.9 50
464.9 70
470.0
476.7 70
485.0
490.0
493.5 90
500.0
505.0
517.9 90
520.0
526.9 90
535.0
540.0
550.0
560.0
570.0
580.0
590.0
TR MSSV Temp
% °C °C °C
10 384.5 408.0 408.0
30 408.9 430.5 437.1
50 425.0 445.3 454.9
70 445.5 464.9 476.7
90 493.5 517.9 526.9
Multi-component kinetics and late gas potential of selected Cooper Basin source rocks 37

Figure 16: Cumulative MSSV-pyrolysis yields of Total C1+ products at three different heating rates (top) and at 0.7°C/min (bottom). Colored zones indicate 4 temperature regimes in which different reactions predominate.
38 Multi-component kinetics and late gas potential of selective Cooper Basin source rocks

1 2 3 4300 350 400 450 500 550 600
Temperature [°C]
0
0.2
0.4
0.6
0.8
1
Gas W
etne
ss [k
g/kg
]
1 2 3 4300 350 400 450 500 550 600
Temperature [°C]
0
1
2
3
4
GOR [
kg/k
g]
Figure 17: Cumulative MSSV-pyrolysis Gas-Oil-Ratio (top) and gas wetness (bottom) at 0.7°C/min. Colored zones indicate 4 temperature regimes in which different reactions predominate.
Multi-component kinetics and late gas potential of selected Cooper Basin source rocks 39

1 2 3 4300 350 400 450 500 550 600
Temperature [°C]
0
10000
20000
30000
40000
50000
60000
Tota
l C6+
Yiel
d [µg
/g sa
mpl
e]
1 2 3 4300 350 400 450 500 550 600
Temperature [°C]
0
20000
40000
60000
Tota
l C1-
5 Yiel
d [µg
/g sa
mpl
e]
Figure 18: Cumulative MSSV-pyrolysis yields of Total C1-5 (top) products and Total C6+ products (bottom) at 0.7°C/min.Colored zones indicate 4 temperature regimes in which different reactions predominate.
40 Multi-component kinetics and late gas potential of selective Cooper Basin source rocks

1 2 3 4300 350 400 450 500 550 600
Temperature [°C]
0
10000
20000
30000
40000
C 2-5
Yiel
d [µg
/g sa
mpl
e]
1 2 3 4300 350 400 450 500 550 600
Temperature [°C]
0
10000
20000
30000
40000
Meth
ane Y
ield [
µg/g
sam
ple]
Figure 19: Cumulative MSSV-pyrolysis yields of Methane (top) and Wet gases (bottom) at 0.7°C/min. Colored zones indicate 4 temperature regimes in which different reactions predominate.
Multi-component kinetics and late gas potential of selected Cooper Basin source rocks 41
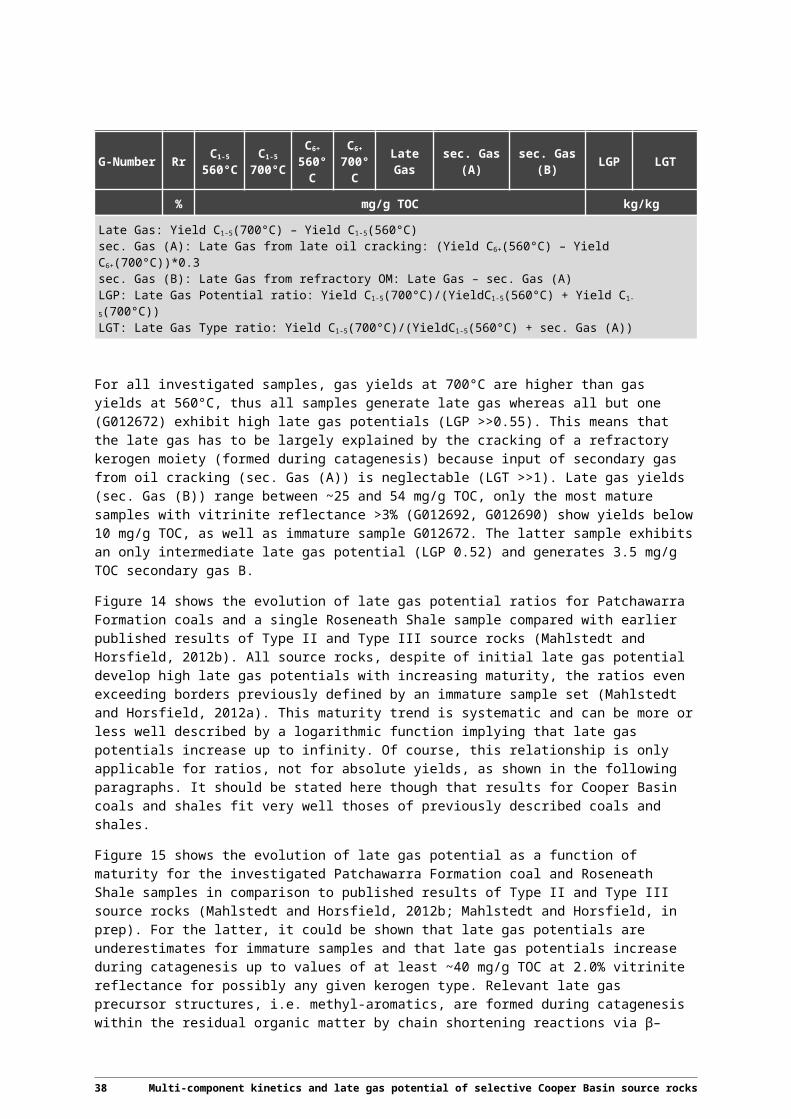
1 2 3 4300 350 400 450 500 550 600
Temperature [°C]
0
4000
8000
12000
Prop
ane Y
ield [
µg/g
sam
ple]
1 2 3 4300 350 400 450 500 550 600
Temperature [°C]
0
4000
8000
12000
16000
Ethan
e Yiel
d [µg
/g sa
mpl
e]
Figure 20: Cumulative MSSV-pyrolysis yields of Ethane (top) and Propane (bottom) at 0.7°C/min. Colored zones indicate 4 temperature regimes in which different reactions predominate.
42 Multi-component kinetics and late gas potential of selective Cooper Basin source rocks

1 2 3 4300 350 400 450 500 550 600
Temperature [°C]
0
1000
2000
3000
4000
5000
Buta
ne Yi
eld [µ
g/g s
ampl
e]
1 2 3 4300 350 400 450 500 550 600
Temperature [°C]
0
500
1000
1500
2000
2500
Pent
ane Y
ield [
µg/g
sam
ple]
Figure 21: Cumulative MSSV-pyrolysis yields of Butane (top) and Pentane (bottom) at 0.7°C/min. Colored zones indicate 4 temperature regimes in which different reactions predominate.
Multi-component kinetics and late gas potential of selected Cooper Basin source rocks 43

1 2 3 4300 350 400 450 500 550 600
Temperature [°C]
0
2000
4000
6000
8000
n-C 6
-14 Y
ield [
µg/g
sam
ple]
1 2 3 4300 350 400 450 500 550 600
Temperature [°C]
0
400
800
1200
1600
2000
n-C 1
5+ Yi
eld [µ
g/g s
ampl
e]
Figure 22: Cumulative MSSV-pyrolysis yields of n-C6-14 (top) and n-C15+ products (bottom) at 0.7°C/min. Colored zones indicate 4 temperature regimes in which different reactions predominate.
44 Multi-component kinetics and late gas potential of selective Cooper Basin source rocks

1 2 3 4300 350 400 450 500 550 600
Temperature [°C]
0
4000
8000
12000
16000
Sum
of Ar
omat
ics [µ
g/g s
ampl
e]
1 2 3 4300 350 400 450 500 550 600
Temperature [°C]
0
1000
2000
3000
4000
Sum
of Ph
enol
ics [µ
g/g s
ampl
e]
Figure 23: Cumulative MSSV-pyrolysis yields of summed aromatic compounds (top) and summed phenolic compounds (bottom) at 0.7°C/min. Colored zones indicate 4 temperature regimes in which different reactions predominate.
Multi-component kinetics and late gas potential of selected Cooper Basin source rocks 45

3.7.1 GORFit-model
For the first step of the GORFit-model approach, C1+ MSSV-yields, as well as the C1-5 and C6+ boiling fractions, are normalised to the maximum MSSV-yield and plotted in comparison to directly measured open-system bulk-pyrolysis SRA-Transformation Ratio curves (Figure 24). An excellent correlation between open-system bulk-yields and C1+ closed-system yields usually exists, at least for most Type II and Type I source rocks, and SRA-TR curves can be directly multiplied by factors ranging between 0 and 1 to infer cumulative primary gas and C6+ splines. Nevertheless, for the Type II/III Patchawarra Formation coal sample G012710ex C1+ closed-system compound amounts reach maximum yields much earlier than indicated by the SRA-TR curve for each heating rate and a strong deviation of open- and closed-system pyrolysis yields is evident for higher transformation ratios. An explanation for this is that primary hydrocarbon generation (as monitored by open-system pyrolysis) from terrestrial source rocks takes place over a much broader temperature interval than primary hydrocarbon generation from mainly marine organic matter types and that therefore primary and secondary cracking reactions also overlap within a much broader temperature interval. Secondary cracking at e.g. 90% kerogen conversion (TR 90%) would be much more advanced for heterogeneous Type III organic matter than for more homogeneous Type II organic matter, leading to steeper cumulative product yield curves when normalised to maximum MSSV-yields and compared to open-system bulk-pyrolysis yields (Figure 24).
The solution or modification of the GORFit model chosen here is to “assume” an higher maximum MSSV C1+-compounds yield. The “assumption” is iterated manually to fit the SRA-TR curve to MSSV-yields at low transformation ratios, i.e. 10, 30, 50, and 70% TR. At 70% TR MSSV end temperatures still range at the end of reaction Zone 2 (compare Figure 16 to Figure 23) where secondary cracking has just set in. The best solution (fit) is shown in Figure 25 in which Total MSSV-pyrolysis product yields as well as the C1-5 and C6+ boiling fractions are shown normalised to the assumed maximum MSSV-yield. Directly measured SRA-TR curves and derived spline approximations for cumulative primary gas and oil and secondary gas evolution are shown as well.
The maximum pyrolysis yield was taken as the end-point in the kinetic modelling described below; decreasing yields at very high maturities were not modelled.
Using simple stoichiometric relationships kinetic parameters describing primary oil (C6+), primary gas, and secondary gas generation can be deduced from the data shown in Figure 25. In the GORFit-model, the normalised best-fit C1+ curve (SRA-TR curve) is multiplied by factors (see Table 3.6) ranging between 0 and 1 in order to infer cumulative primary gas and C6+ splines. A uniform open-system pyrolysis-GC GOR of 0.43 kg/kg was assumed a meaningful input parameter to define fitting factors as secondary cracking reactions are not likely to occur under open-system pyrolysis conditions. This results in a factor of 0.697 for primary C6+ generation and in a factor of 0.303 for primary gas generation (Table 3.6). It should be kept in mind though that constant GOR is an oversimplification and a slight increase with maturation should be expected (Horsfield and Dueppenbecker, 1991). Nevertheless, spline curves are temperature shifted to fit measured MSSV values, with negative shifts for C6+ compounds and positive shifts for primary gas, inducing an increase in GOR with higher thermal stress levels matching natural maturation characteristics.
46 Multi-component kinetics and late gas potential of selective Cooper Basin source rocks

Figure 24: Comparison of MSSV-yields normalised to the maximum MSSV-yield and directly measured SRA transformation ratio curves of Patchawarra Formation sample G012710ex. (Data in Table B10.).
Multi-component kinetics and late gas potential of selected Cooper Basin source rocks 47

Figure 25: Measured MSSV pyrolysis data for boiling ranges C1+, C6+ and C1-5 normalised to a manually fitted maximum C1+ yield and fitted spline curves for calculated primary petroleum and secondary gas generation (3 heating rates: 0.7, 2.0, 5.0 K/min). Normalised SRA-curve for comparison.
48 Multi-component kinetics and late gas potential of selective Cooper Basin source rocks

Table 3.6: Factors and corresponding yields of the boiling ranges in the GORFit-model.
boiling range Factor MSSV S2
mg/g sample
C1+ 1.000 86.83 163.79
primary C6+ 0.697 60.54 114.20
primary Gas 0.303 26.29 49.59
secondary Gas 0.371 32.19 60.71
The best solution for all three heating rates was a negative temperature shift of 5°C for C6+ and a positive shift of 14°C for primary gas (Figure 25). The primary gas spline curve gives now an excellent fit with the measured MSSV C1-5 totals at low conversions, and the C6+ spline curve does likewise with measured MSSV C6+ yields at low temperatures. Importantly, the cumulative plateau of generated C6+ compounds indicates a higher “oil potential” than can be deduced from MSSV-pyrolysis data, and furthermore it is reached at temperatures which are higher than temperatures of maximal measured MSSV C6+ generation. This observation is clearly a sign that C6+ degradation starts in the closed system long before C6+ generation has come to an end (also compare Erdmann (1999a)).
Secondary gas amounts were calculated by subtracting fitted primary gas yields from measured MSSV C1-5 yields at corresponding temperatures. A secondary gas spline is not approximated manually to fit calculated secondary gas values, but again a factor was used to convert the SRA-curve which is then shifted to higher temperatures to match calculated secondary gas yields (Figure 25). The factor is derived by multiplying the difference of the C6+ spline factor (maximum C6+ yield) and the normalised lowest high temperature C6+ value (at highest MSSV-temperatures some C6+ compounds are still present, usually simple aromatics such as benzene) by 0.7, assuming that 70% of C6+ compounds are degraded to gas, and 30% to coke (Dieckmann et al., 1998). The obtained average factor is 0.371 (Table 3.6), the best-fit temperature shifts are 55°C for 0.7 K/min, 55.5°C for 2.0 K/min, and 56°C for 5.0 K/min (Figure 25). Noteworthy is the excellent fit of spline curves and calculated secondary gas yields for temperatures equivalent to up to ~80-90% TR of the secondary cracking reaction, demonstrating the relevance of basic theoretical considerations. Deviations at higher temperatures, with systematically slightly enhanced approximated secondary gas yields (cumulative spline curves), can be tracked back to the commencing secondary cracking of wet gas compounds to methane and coke (e.g. from 500°C on for the 0.7 K/min heating rate; compare Figure 19 and Figure 25) under closed-system pyrolysis conditions.
The subsequent kinetic analysis using Kinetics05 software resulted in potential-versus-activation-energy distributions and a single frequency factor. Kinetic parameters are shown in Table B12, with curve fit and activation energy distributions shown in Figure 26. The prediction of primary and secondary gas in a hypothetical geological context is given in Figure 27 and Table B12. For a geological heating rate of 3 K/Ma secondary gas formation begins at ~193.6°C, i.e. at temperatures for which primary oil generation is completed to ~80% and primary gas generation is completed to ~70%. This demonstrates a relatively broad temperature interval exists in wich overlapping primary and secondary reactions occur. Maximum secondary gas generation (Tpeak) can be expected for ~208°C, or for a calculated vitrinite reflectance of ~2.2% Ro. Significant primary gas generation (163.9-226.7°C) occurs ~11°C later (~0.4 km deeper) than generation of C6+ compounds (152.7-216.0°C). Please note the very good fit of the primary oil and gas generation rate curves beneath the envelope given by the bulk reaction generation rate curve.
Multi-component kinetics and late gas potential of selected Cooper Basin source rocks 49
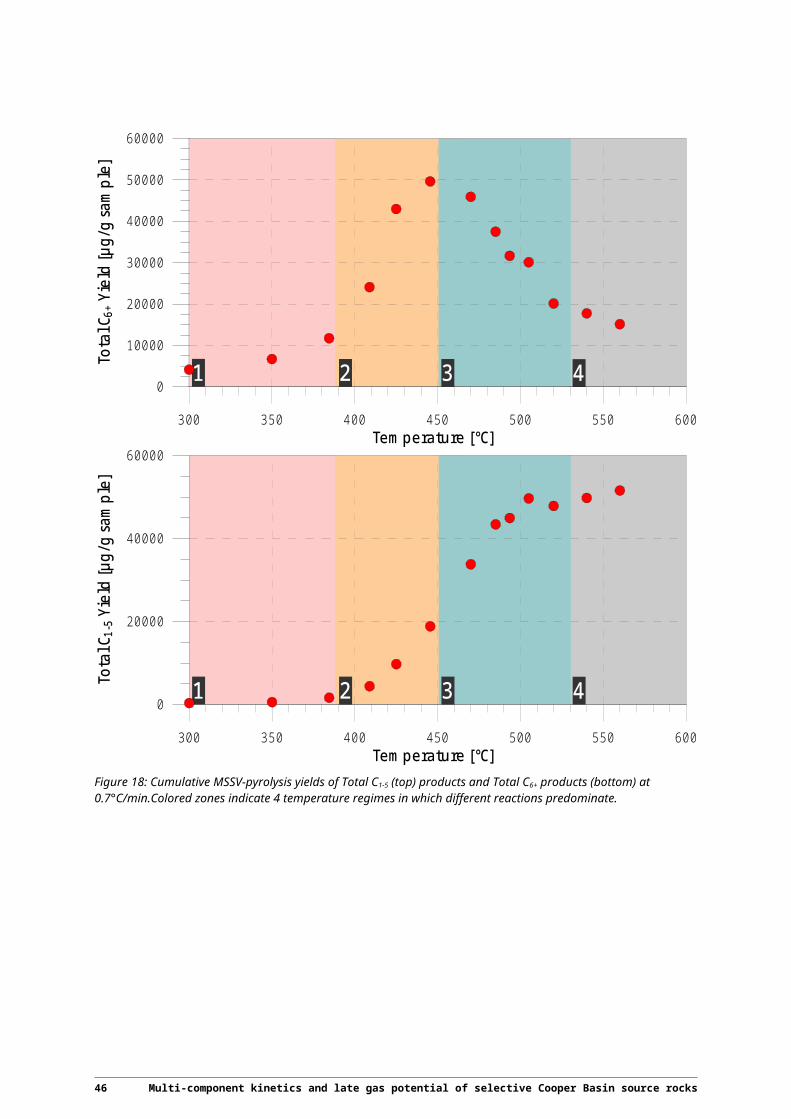
In Figure 27, transformation ratio rate curve (top) and generation rate curve (bottom) of predicted late gas formation from sample G012710ex are also displayed. They are calculated using the kinetic parameters given in the introduction and assuming a late gas potential of ~50 mg CH4/g TOC. For the Patchawarra Formation natural maturity series, it was shown that late gas potentials might be higher than the previously assumed 40 mg CH4/g TOC.
In conclusion, the model described here appears to be robust and is in accordance with the general understanding of gas generation occurring subsequent to oil generation. In addition, it has the advantage of being a simple way of modelling the generation of gas from source rocks in which overlapping liquid generation and destruction reactions occur.
50 Multi-component kinetics and late gas potential of selective Cooper Basin source rocks

Figure 26: Activation energy (Ea) distributions and normalised measured and calculated generation rate curves for C1+, primary C6+, primary and secondary gas formation from sample G012710ex. (Data in Table B12).
Multi-component kinetics and late gas potential of selected Cooper Basin source rocks 51

Figure 27: Transformation ratio rate curves (top) and generation rate curves (bottom) calculated using the kinetic models shown in Figure 26 applied to a geologic heating rate of 3 K/Ma. Note that a default late gas generation scenario is as well implemented (red curve).
52 Multi-component kinetics and late gas potential of selective Cooper Basin source rocks

4 Conclusions
Twenty-seven powdered whole rock samples and eleven solvent- extracted samples or kerogen concentrates were used to investigate the multi-component kinetics and late gas potential of selected potential Permian source rocks within the Cooper Basin of Australia. Source rocks sampled include the Patchawarra Formation (coal), Epsilon Formation (coal), Toolachee Formation (coals and shales) and the Murteree and Roseneath shales. Eleven samples were analysed for their petroleum generation characterisation and six samples were analysed for multi-component (1-, 2-, 4-, 14 component) kinetic characterisation, following the approach of di Primio and Horsfield (2006).
Organofacies Type definition was performed for twenty-seven samples and characterisation of free hydrocarbons for fifteen samples. The evolution of late gas potentials as a function of organofacies and maturity were determined for fifteen samples, following the approach of Mahlstedt (2012) and Mahlstedt and Horsfield (2012a). In addition, kinetic parameters of primary and secondary gas formation were determined from one sample using a modified GORFit - model (Mahlstedt et al., 2013; Mahlstedt, in prep). The thermal maturity of the Patchawarra Formation samples is broad (0.5–5.5% VR) offering insights into the variation in gas generation potential with maturity.
Based on screening data, the investigated samples, mainly humic coals, can be described as organic-rich with Total Organic Carbon (TOC) contents up to 88%. All shale samples exhibit TOC contents exceeding 2%. For the Patchawarra Formation maturity series, the generative potential extends from 453 to 1 mg HC/g TOC. For samples exhibiting VRcalc >1% (or Tmax >450°C), Hydrogen Index (HI) gradually decreases as a function of increasing maturity and related petroleum generation, from ~300 mg HC/g TOC to 1 mg HC/g TOC. At immature stages three types of coals and shales can be observed as follows:
volatile-rich coals and shales (Type II kerogen) with HIs >400 mg HC/g TOC (5 samples);
“average” humic coals (Type III – II/III kerogens) with HIs between 200–350 mg HC/g TOC (6 samples) and;
hydrogen poor organic matter (Type III) with HIs <150 mg HC/g TOC (4 samples).
The three shale samples from the Patchawarra Formation and the Murteree and Roseneath shales fall into the last group.
Free hydrocarbons are characterised at lower maturity levels (<1.3% VRcalc) for fifteen natural maturity series Patchawarra Formation whole rock samples and one overmature Roseneath Shale sample. Thermal extracts are rich in light hydrocarbons, intermediate to high molecular weight paraffins and mainly aromatic compounds dominated by toluene, m,p-xylene and various alkyl-naphthalenes, suggesting the presence of tree resins as precursor structure. Thermal extracts of samples exhibiting maturity levels above 1.3% VRcalc mainly consist of aromatic compounds, whereas gaseous compounds dominate those from samples with maturity levels exceeding 2.5% VRcalc.
Upon pyrolysis, all overmature samples (VRcalc >1.3%) yield mainly gas and aromatic compounds and their petroleum type organofacies is predicted as gas and condensate. The inferred petroleum type for immature to oil window mature samples (VRcalc <1.3%) is either gas and condensate or paraffinic-napthenic-aromatic (P-N-A) low wax. These pyrolysate compositions are diagnostic of fluviodeltaic
Multi-component kinetics and late gas potential of selected Cooper Basin source rocks 53

depositional environments with high gas compounds contents, high but varying aromatic and phenolic compounds contents (depending on individual maceral composition again depending on the exact depositional position in the fluviodeltaic environment), very low sulphur compound contents, and abundance of normal hydrocarbon doublets of n-alkenes and n-alkanes extending to long chain lengths (waxes).
Kerogen conversion of all eleven investigated samples is characterised by broad activation energy (Ea) distributions, as is typically observed for terrestrial derived organic matter. This translates to a broad maturity interval of >60°C over which hydrocarbons are generated. High thermal stabilities are indicated by onset temperatures of hydrocarbon generation (10% transformation ratio (TR) and assuming a geological heating rate of 3oC / Ma) >125°C for the least mature sample, a feature most likely related to the sulphur-poor state of the organic matter. Kerogen conversion ends (90% TR) at temperatures exceeding 200°C (in all but one case), also suggesting a very stable organic matter structure, or at least indicating the presence of refractory organic matter.
Activation energies of the five Patchawarra Formation samples span over ~23 potentials.These range from 52 kcal to 53 kcal for the least mature samples (VRcalc = 0.57%); from 57 kcal to 58 kcal at 0.73% VRcalc and from 59 kcal to 63 kcal for the most mature samples (VRcalc = 0.77%). The resulting geologic onset and Tpeak temperatures range as follows:
~130°C to ~148°C for the least mature samples (VRcalc = 0.57%);
~147°C to ~160°C at 0.73% VRcalc;
~151°C to ~170°C for the most mature samples (VRcalc = 0.77%).
Samples of the first sub-group generate petroleum over a slightly smaller temperature interval (60–65°C) than samples from the second sub-group (75–90°C).
Samples from the other formations (VRcalc ~0.7%) can be grouped into three sub-types according to thermal stability. The main activation energy ranges a follows: 54 kcal for the Murteree Shale, from 56 kcal to 57 kcal for the Roseneath Shale and Epsilon Formation coals, and 65 kcal for the Toolachee Formation. Geologic onset and Tpeak temperatures range are as follows:
~132°C to ~143°C for the Murteree Shale;
~146°C to ~160°C for the Roseneath Shale and Epsilon Formation coals;
~165°C to ~180°C for the Toolachee Formation.
The fluids generated from the five main Permian source rock samples in the Cooper Basin fall within the volatile oil class. All reach saturation pressures of over 150 bar by a TR of 30%, and over 200 bars by a TR of over 70%. At the highest maturity levels (90% TR), saturation pressures generally range above 400 bar with Gas Oil Ratios (GORs) exceeding 1000 Sm³/Sm³. In concordance with the broad range of activation energies, the distribution of GORs, saturation pressures and formation volume factors all show a high degree of variability. Only the most immature Patchawarra Formation sample (VRcalc ~0.57%) generates a volatile oil with GORs of ~200 Sm³/Sm³ and saturation pressures of ~200 bar over the entire primary kerogen conversion range. Generally, the physical properties of generated fluids observed here reflect the behaviour of naturally occurring petroleum (i.e. volatile oil) very well and are not unusual for fluids formed from terrestrial derived organic matter. Compositional kinetic models were developed for each of these source rocks, which may be used to calculate petroleum phase behaviour under the subsurface conditions of hydrocarbon migration and entrapment.
54 Multi-component kinetics and late gas potential of selective Cooper Basin source rocks

The Patchawarra Formation samples, along with one Roseneath Shale sample, show late gas generating potentials which fall on the recently demonstrated late gas potential evolution trend (Mahlstedt and Horsfield, 2012b; Mahlstedt and Horsfield, in prep) at all maturities. Nevertheless, the maximum amounts of late gas generation encountered prior to metagenesis (Ro ~2.0%) exceed previously encountered potentials (~40 mg/g TOC) by ~10 mg/g TOC. As a result, a late gas potential of ca.50 mg/g TOC should be considered in any Gas-In-Place calculations related to these Permian source rocks. This is applicable at maturity stages over ~2.0% Ro, and is most likely to be realised between 2.5 and 3.5% Ro.
Distinct kinetic parameters for primary C6+ and gas generation, as well as secondary gas generations, were determined for one Patchawarra Formation sample using a modified GORFit- model. This indicated that the onset of secondary cracking occurred at ~194°C, assuming a geologic heating rate of 3°C per million years. For this specific sample it could be shown that primary and secondary cracking processes largely overlap.
Multi-component kinetics and late gas potential of selected Cooper Basin source rocks 55

5 References
Andresen, B., Throndsen, T., Barth, T. and Bolstad, J., 1994. Thermal generation of carbon dioxide and organic acids from different source rocks. Organic Geochemistry 21, 1229-1242.
Arouri, K.R., McKirdy, D.M., Schwark, L., Leythaeuser, D. and Boult, P.J., 2004. Accumulation and mixing of hydrocarbons in oil fields along the Murteree Ridge, Eromanga Basin, South Australia. Organic Geochemistry, 35: 1597-1618.
Behar, F., Ungerer, P., Kressmann, S. and Rudkiewicz, J.L., 1991. Thermal evolution of crude oils in sedimentary basins; experimental simulation in a confined system and kinetic modeling. Revue de l'Institut Francais du Petrole 46, 151-181.
Berner, U., Faber, E., Scheeder, G. and Panten, D., 1995. Primary cracking of algal and landplant kerogens; kinetic models of isotope variations in methane, ethane and propane, Processes of natural gas formation. Elsevier, Amsterdam, Netherlands, pp. 233-245.
Boreham, C.J. and Hill, A.J., 1998. Source Rock distribution and hydrocarbon geochemistry. Chapter 8, p. 129-142 In Gravestock, D.I., Hibburt, J.E., Drexel, J.F., (Eds), Petroleum Geology of South Australia. Cooper Basin, Volume 4. Department of Primary Industry and Resources. Petroleum Geology of South Australia Series.
Boreham, C.J. and Summons, R.E., 1999. New insights into the active petroleum systems in the Cooper and Eromanga Basins, Australia. APPEA Journal, 39 (1),263-296.
Carr, L.K., Korsch R.J, Palu T.J. and Reese, B, 2015. Onshore Basin Inventory: the McArthur, South Nicholson, Georgina, Amadeus, Warburton, Wiso, Galilee and Cooper basins. Geoscience Australia Record, in press.
di Primio, R., Dieckmann, V. and Mills, N., 1998. PVT and phase behaviour analysis in petroleum exploration. Organic Geochemistry 29, 207-222.
di Primio, R. and Horsfield, B., 2006. From petroleum-type organofacies to hydrocarbon phase prediction. AAPG Bulletin 90, 1031-1058.
Dieckmann, V., Schenk, H.J., Horsfield, B. and Welte, D.H., 1998. Kinetics of petroleum generation and cracking by programmed-temperature closed-system pyrolysis of Toarcian Shales. Fuel 77, 23-31.
Draper, J.J., (Ed.), 2002. Geology of the Cooper and Eromanga Basins, Queensland. Queensland Government, Natural Resources and Mines, Queensland Mineral and Energy Review Series, DVD.
Eglinton, T.I., Sinninghe Damsté, J.S., Kohnen, M.E.L. and de Leeuw, J.W., 1990. Rapid estimation of the organic sulphur content of kerogens, coals and asphaltenes by pyrolysis-gas chromatography. Fuel 69, 1394-1404.
Erdmann, M., 1999a. Gas Generation from Overmature Upper Jurassic Source Rocks, Northern Viking Graben. RWTH Aachen, Aachen, p. 128.
Erdmann, M., 1999b. Gas generation from overmature Upper Jurassic source rocks, Northern Viking Graben. Berichte des Forschungszentrum Jülich, p. 128.
Glombitza, C., Mangelsdorf, K. and Horsfield, B., 2009. A novel procedure to detect low molecular weight compounds released by alkaline ester cleavage from low maturity coals to assess its feedstock potential for deep microbial life. Organic Geochemistry 40, 175-183.
Goldstein, B., Menpes, S., Hill, A., Wickham, A., Alexander, E., Jarosz, M., Pepicelli, D., Malavazos, M, Staritski, K., Taliangis, P., Coda, J., Hill, D. and Webb, M., 2012. Roadmap for Unconventional Gas Projects in South Australia. South Australia Department for Manufacturing, Innovation, Trade, Resources and Energy, Energy Resources Division, 267 pp. http://www.statedevelopment.sa.gov.au/resources/unconventional-gas-projects
56 Multi-component kinetics and late gas potential of selective Cooper Basin source rocks

Gravestock, D.I. and Jensen-Schmidt, B., 1998. Structural setting. In: Gravestock, D.I., Hibburt, J.E. and Drexel, J.F. (Editors), Petroleum geology of South Australia. Volume 4: Cooper Basin. South Australia Department of Primary Industries and Resources, Report Book, 1998/9, 47-67
Gray, A.R.G. and McKellar, J.L., 2002. Cooper Basin stratigraphy. In: Draper, J.J. (Editor), Geology of the Cooper and Eromanga Basins, Queensland. Queensland Department of Natural Resources and Mines, Queensland Minerals and Energy Review Series, 9-26.
Hall, L.S., Hill, A.J., Troup, A., Korsch, R.J., Palu, T.J., Radke, B., Morton, J., Wang, L. and Stacey, A., in prep. Basin Architecture and Lithofacies of the Cooper Basin. Geoscience Australia Record, in prep.
Hill, A.J. and Gravestock, D.I., 1995. Cooper Basin. In: Drexel, J.F. and Preiss, W.V. (Editors), The Geology of South Australia. Volume 2, The Phanerozoic. South Australian Geological Survey, Bulletin, 54, 78-87.
Horsfield, B., 1989. Practical criteria for classifying kerogens: Some observations from pyrolysis-gas chromatography. Geochimica et Cosmochimica Acta 53, 891-901.
Horsfield, B., Disko, U. and Leistner, F., 1989. The micro-scale simulation of maturation: outline of a new technique and its potential applications. Geologische Rundschau 78, 361-374.
Horsfield, B. and Dueppenbecker, S.J., 1991. The decomposition of posidonia shale and green river shale kerogens using microscale sealed vessel (MSSV) pyrolysis. Journal of Analytical and Applied Pyrolysis 20, 107-123.
Horsfield, B., Yordy, K.L. and Crelling, J.C., 1988. Determining the petroleum-generating potential of coal using organic geochemistry and organic petrology. Organic Geochemistry 13, 121-129.
Larter, S.R., 1984. Application of Analytical Pyrolysis Techniques to Kerogen Characterisation and Fossil Fuel Exploration/Exploitation, in: Voorhees, K. (Ed.), Analytical pyrolysis, methods and applications. Butterworth, London, pp. 212-275.
Mahlstedt, N., 2012. Evaluating the late gas potential of source rocks stemming from different sedimentary environments. Dissertation. Technische Universität Berlin, Berlin, p. 342.
Mahlstedt (in prep.). GORFit: Deconvoluting Primary from Secondary Gas Generation Kinetics. (to be submitted in Organic Geochemistry).
Mahlstedt, N. and Horsfield, B., 2012a. Metagenetic methane generation in gas shales I. Screening protocols using immature samples. Marine and Petroleum Geology - Insights into Shale Gas Exploration and Exploitation 31, 27-42.
Mahlstedt, N., Horsfield, B., 2012b. Gas Generation at High Maturities (> Ro = 2.0%) in Gas Shales. Search and Discovery Article #40873.
Mahlstedt and Horsfield (in prep.). Metagenetic methane generation II. Screening protocols using naturally and artificially matured, organic matter-rich samples. (To be submitted in Geology).
Mahlstedt, N., Horsfield, B. and di Primio, R., 2013. GORFit – From Liquids to Late Gas: Deconvoluting Primary from Secondary Gas Generation Kinetics. 26th International Meeting on Organic Geochemistry (IMOG), Tenerife, Canary Islands (Spain). Book of Abstracts, p. 193.
Mango, F.D., 1996. Transition metal catalysis in the generation of natural gas. Organic Geochemistry 24, 977-984.
Mango, F.D., 1997. The light hydrocarbons in petroleum: a critical review. Organic Geochemistry 26, 417-440.
McKellar, J.L., 2013. Cooper Basin. In: Jell, P.A. (Editor), Geology of Queensland. Geological Survey of Queensland, Brisbane, 204-212.
McKirdy, D.M., Yu, X., Leythaeuser, D., Schwark, L., and Arouri, K.R., 2001. A pilot study of secondary migration and reservoir filling in the Cooper/Eromanga Basin, South Australia. 20th International Meeting on Organic Geochemistry, Nancy, France, Abstracts p. 425-426
Menpes, S., Hill, A., and Pepicelli, D., 2013. Characteristics of the Gidgealpa Group Composite Resource Play in the Cooper Basin, South Australia. Unconventional Resources Technology Conference, Denver, 2013. http://dx.doi.org/10.1190/URTEC2013-273
Multi-component kinetics and late gas potential of selected Cooper Basin source rocks 57

Michaelsen, B.H., and McKirdy, D.M., 2001. Migration and mixing of oils in the Cooper and Eromanga Basins, Central Australia. In Hill, K.C., and Bernecker, T. (Eds), Eastern Australian Basins Symposium, A refocused energy perspective for the future. PESA Special Publication, 289-300.
Michels, R., Enjelvin-Raoult, N., Elie, M., Mansuy, L., Faure, P. and Oudin, J.L., 2002. Understanding of reservoir gas compositions in a natural case using stepwise semi-open artificial maturation. Marine and Petroleum Geology 19, 589-599.
Nakanishi, T. and Lang S.C., 2001. The search for stratigraphic traps goes on – visualisation of fluival-lacustrine successions in the Moorari 3D survey, Cooper-Eromanga Basin. APPEA Journal (41), 115-137.
Pedersen, K.S., Fredenslund, A. and Thomassen, P., 1989. Properties of oils and natural gases. Gulf Publishing Company, Houston.
Pepper, A.S., Corvi, P.J., 1995a. Simple kinetic models of petroleum formation. Part I: oil and gas generation from kerogen. Marine and Petroleum Geology 12, 291-319.
Pepper, A.S., Corvi, P.J., 1995b. Simple kinetic models of petroleum formation. Part III: Modelling an open system. Marine and Petroleum Geology 12, 417-452.
Radke, B., 2009. Hydrocarbon and Geothermal Prospectivity of Sedimentary Basins in Central Australia Warburton, Cooper, Pedirka, Galilee, Simpson and Eromanga Basins. Record 2009/25. Geoscience Australia: Canberra.
Schenk, H.J., Horsfield, B., Krooss, B., Schaefer, R.G. and Schwochau, K., 1997. Kinetics of petroleum formation and cracking, in: Welte, D.H., Horsfield, B., Backer, D.R. (Eds.), Petroleum and Basin Evolution. Springer, Berlin, pp. 231-270.
Stach, E., Mackowsky, M. T., Teichmüller, M., Taylor, G. H., Chandra, D., and Teichmüller, R., 1982. Coal petrology. Gebrüder Borntraeger, Berlin, 1-535.
Stewart, A.J., Raymond, O.L., Totterdell, J.M., Zhang, W. and Gallagher, R., 2013. Australian Geological Provinces, 2013.01 edition, scale 1:2 500 000. Geoscience Australia, Canberra. http://www.ga.gov.au/metadata-gateway/metadata/record/gcat_c3fac1d5-48c1-624e-e044-00144fdd4fa6/Australian+Geological+Provinces%2C+2013.01+edition
Underschultz, J. and Boult, P., 2004. Top seal and reservoir continuity: hydrodynamic evaluation of the Hutton-Birkhead Reservoir, Gidgealpa Oilfield. In Boult, P.J., Johns, D.R., and Lang, S.C., 2004, Eastern Australian Basins Symposium II, PESA Special Publication, 473-482.
Vu, T.A.T., Horsfield, B. and Sykes, R., 2008. Influence of in-situ bitumen on the generation of gas and oil in New Zealand coals. Organic Geochemistry 39, 1606-1619.
Vu, T.T.A., Horsfield, B., Mahlstedt, N., Schenk, H.J., Kelemen, S.R., Walters, C.C., Kwiatek, P.J. and Sykes, R., 2013. The structural evolution of organic matter during maturation of coals and its impact on petroleum potential and feedstock for the deep biosphere. Organic Geochemistry 62, 17-27.
Weiss, H.M., Wilhelms, A., Mills, N., Scotchmer, J., Hall, P.B., Lind, K., and Brekke, T., 2000. NIGOGA: The Norwegian Industry Guide to Organic Geochemical Analyses, edition 4.0. Norsk Hydro, Statoil, Geolab Nor, SINTEF Petroleum Research and the Norwegian Petroleum Directorate. http://www.webcitation.org/6SeqTrQGE
58 Multi-component kinetics and late gas potential of selective Cooper Basin source rocks

Appendix A - PhaseKinetics approach
A.1 Methodology and background information on the PhaseKinetics approach.
The phase behaviour of migrating petroleum fluids is controlled by the fluids composition. The geological conditions upon which a migrating oil separates into oil and gas are strongly controlled by the gas (C1-C5) composition of the fluid (di Primio et al., 1998). For petroleum phase behaviour gas composition plays the dominant role with respect to the fluids saturation pressure and shrinkage behaviour, however, influence of the liquid fraction composition should not be neglected.
The gross description of oil and gas generation from closed system pyrolysis results, and the surface GORs derived therefrom, are very similar to the GOR distributions observed in nature. Hence, it appears that the relative gas and oil proportions generated as a function of maturity can be estimated based on laboratory experiments.
Compositional predictions are, however, not as straight forward. High methane contents generally result in phase separation at relatively high pressures, i.e. at great depth. A very wet gas composition results in a much lower saturation pressure (Psat) for a given fluid. The sensitivity of gas composition on phase behaviour of migrating hydrocarbons has severe implications for the prediction of petroleum phase behaviour during petroleum generation and migration. Mango (1996, 1997) documented the discrepancy between gas compositions generated by pyrolysis of source rocks or oils and natural fluids. As discussed by Mango (1996; 1997) natural fluids display a much stronger predominance of methane in their gas fractions than observed in source rock pyrolysates. Interestingly, the lack of predictive ability of laboratory experiments is common to all experimental approaches: published gas compositions from closed system hydrous pyrolysis (Andresen et al., 1994), closed system anhydrous pyrolysis (Behar et al., 1991; Dieckmann et al., 1998; Erdmann, 1999b; Michels et al., 2002) and open system pyrolysis (Berner et al., 1995) of Type I, II and III source rocks all show the same systematics.
It is commonly known that for genetically related fluids saturation pressure correlates linearly to GOR and formation volume factor (Bo). As discussed above the methane content of a fluid is the most important factor controlling its saturation pressure. Hence, a correction of the gas compositions generated by pyrolysis is possible assuming a linear relationship between the methane proportion of the gas phase (C1-C5) and the fluids GOR. The equation used for methane correction in this study is based on linear regression using a natural dataset from the North Sea representative of the black oil to gas-condensate range (correlation coefficient for the relationship between GOR and C1/C2-5 r2=0.98). The original GOR used as a starting point for the methane correction was that determined on the MSSV pyrolysates and converted to volumetric data by a single stage flash using PVT simulation software.
The characterisation of the generated fluids oil composition (C6+) for phase behaviour assessment is based on the compositional information from MSSV analysis. The resolved compounds from C6 onwards were quantified, their proportions converted to molar amounts and these were summed to a total description of the liquid phase which consisted of a pseudo compound C6 (containing all resolved compounds in the range eluting after n-pentane until and including hexane) and a C7+ fraction (containing the rest of the resolved compounds). The C7+ fraction was further characterised by a molecular weight and density. The molecular weight of the C7+ fraction was determined by subdividing the GC hump (MSSV total minus resolved compounds) into boiling ranges according to the resolved n-
Multi-component kinetics and late gas potential of selected Cooper Basin source rocks 59

alkanes, and using the average molecular weights of the resolved compounds as representative of the respective hump range. Quantification of the subdivisions led thus to an averaged molecular weight of the entire hump. The density of the C7+ fraction was determined using a C7+ molecular weight–density correlation for natural petroleums from the North Sea.
The compositional description obtained by these methods is ideal for initial phase behaviour calculations. For the determination of a compositional kinetic model, however, a C7+ fraction consisting of molar amount, molecular weight and density was inappropriate. In PVT simulators the C7+ fraction definition is used to calculate a distribution of components representing the total liquid phase. This so called C7+ characterisation consists in representing the hydrocarbons with seven and more carbon atoms as a reasonable number (generally 12) of pseudo-components (with specific equation of state parameters) whereby a logarithmic relationship between the molar concentration zN, of a given fraction and the corresponding carbon number, CN, for CN >7 is assumed (Pedersen et al., 1989). This characterisation leads to the automatic definition of a set of additional compounds of increasing molecular weight (usually up to the molecular weight range corresponding to alkane chainlengths of C80-C100). For this study a series of 6 pseudo compounds were defined: P10, P20, P30, P40, P50 and P60+. The physical properties of the individual pseudo compounds remain constant for all sample types, only their molar proportion varies depending on the samples original composition. This subdivision of the C7+ fraction into 6 additional fractions was tested to be the minimum number of pseudo compounds required for satisfactory calculation of phase behaviour.
The determined PVT descriptions of the fluids at different transformation ratios are used for the definition of the compositional kinetic models. The individual potentials per activation energy derived from the bulk kinetic analysis of the samples are subdivided into 14 sub-potentials, one for each compound described in the PVT dataset. The PVT data is assigned to individual bulk potentials based on its transformation ratio. For example bulk potentials below a TR of 10% were assigned the compositional description of the 10% TR MSSV experiment, from 10 to under 30% TR the 30% TR compositional description is used, etc. The final compositional kinetic models, hence, consist of an activation energy distribution for each compound (potentials normalised to 100%) as well as a total potential for each compound (again normalised to 100%). In combination with the sample HI and TOC absolute potentials can be calculated.
60 Multi-component kinetics and late gas potential of selective Cooper Basin source rocks

Appendix B - Tables
Table B1a: Thermovaporisation boiling ranges amounts.
Sample G012670 G012672 G012677 G01271
0 G012678 G012680 G012681 G012683
TOC (%) 32.07 44.59 61.42 70.70 80.60 14.29 63.60 43.35
Amount, mg 6.98 2.47 4.70 4.77 3.76 7.39 5.46 6.35
(µg/g sample)
C1*1.1 18.5 14.4 14.8 23.8 37.3 3.0 18.0 4.5
C2-C5 Total 66.7 301.4 942.5 327.6 967.1 161.7 411.0 195.6
C6-14 Total (-Blank) 560.1 8394.2 5508.7 1636.6 11538.8 1854.1 6254.3 3280.7
C15+ Total (-Blank) 1700.3 4928.9 4592.1 2399.6 15140.6 2543.0 6668.4 4571.5
C1-5 Total 87.2 327.2 959.7 349.9 1005.0 164.7 430.9 199.4
C1-30+ Tot. (-Blank)
2347.7 13650.3 11060.5 4386.1 27684.4 4561.8 13353.5 8051.6
GOR Total 0.04 0.02 0.10 0.09 0.04 0.04 0.03 0.03
C6-C14 Resolved 274.8 6908.7 4718.1 1034.9 10321.2 1680.7 5426.9 2952.9
C15+ Resolved 343.8 1244.9 2240.1 303.3 5465.8 486.1 2932.8 1672.4
C1-30 Resolved 705.8 8480.8 7917.8 1688.1 16792.1 2331.5 8790.5 4824.7
GOR Resolved 0.14 0.04 0.14 0.26 0.06 0.08 0.05 0.04
(µg/g TOC)
C1*1.1 57.7 32.3 24.0 33.7 46.3 20.7 28.3 10.3
C2-C5 Total 208.1 676.0 1534.5 463.4 1200.0 1131.9 646.3 451.2
C6-14 Total (-Blank) 1746.6 18827.4 8968.8 2314.9 14317.0 12978.2 9833.6 7568.3
C15+ Total (-Blank) 5301.9 11055.0 7476.4 3394.1 18786.1 17800.9 10484.8 10546.0
C1-5 Total 272.0 733.9 1562.5 494.9 1247.0 1153.2 677.4 460.0
C1-30+ Tot. (-Blank)
7320.5 30616.3 18007.6 6203.9 34350.1 31932.3 20995.8 18574.2
GOR Total 0.04 0.02 0.10 0.09 0.04 0.04 0.03 0.03
C6-C14 Resolved 856.8 15495.6 7681.6 1463.7 12806.3 11764.5 8532.7 6812.1
C15+ Resolved 1072.1 2792.2 3647.1 429.0 6781.9 3402.8 4611.2 3858.0
C1-30 Resolved 2200.9 19021.7 12891.1 2387.7 20835.2 16320.5 13821.4 11130.1
GOR Resolved 0.14 0.04 0.14 0.26 0.06 0.08 0.05 0.04
Table B1a (continued): Thermovaporisation boiling ranges amounts
Sample G012684 G012685 G012687 G012688 G012690 G012692 G012693
TOC (%) 70.75 46.08 56.88 87.62 83.75 63.99 3.13
Amount, mg 7.25 9.45 9.96 12.84 15.38 16.78 20.24
Multi-component kinetics and late gas potential of selected Cooper Basin source rocks 61

Sample G012684 G012685 G012687 G012688 G012690 G012692 G012693
(µg/g sample)
C1*1.1 6.9 4.5 3.6 4.5 7.1 0.0 0.8
C2-C5 Total 151.4 95.9 53.9 7.0 36.3 15.0 9.1
C6-14 Total (-Blank) 3076.6 1718.7 1338.4 270.7 50.3 55.7 103.9
C15+ Total (-Blank) 3885.9 2136.5 1947.6 443.2 192.7 86.6 500.7
C1-5 Total 165.2 101.2 57.4 11.6 43.2 15.0 10.0
C1-30+ Tot. (-Blank)
7127.6 3956.3 3343.4 725.5 286.1 157.3 614.6
GOR Total 0.02 0.03 0.02 0.02 0.18 0.11 0.02
C6-C14 Resolved 2598.6 1653.1 1063.8 210.1 25.1 29.5 35.3
C15+ Resolved 1181.5 762.3 470.8 90.2 0.2 8.3 5.0
C1-30 Resolved 3945.3 2516.6 1592.1 311.8 68.4 52.8 50.2
GOR Resolved 0.04 0.04 0.04 0.04 1.71 0.40 0.25
(µg/g TOC)
C1*1.1 9.8 9.7 6.4 5.1 8.5 0.0 25.1
C2-C5 Total 214.1 208.0 94.7 7.9 43.4 23.4 291.5
C6-14 Total (-Blank) 4348.8 3730.1 2352.9 309.0 60.0 87.0 3319.8
C15+ Total (-Blank) 5492.7 4636.8 3423.9 505.8 230.0 135.4 15997.1
C1-5 Total 233.5 219.6 100.9 13.2 51.6 23.4 318.5
C1-30+ Tot. (-Blank)
10075.0 8586.5 5877.7 828.0 341.6 245.8 19635.3
GOR Total 0.02 0.03 0.02 0.02 0.18 0.11 0.02
C6-C14 Resolved 3673.2 3587.8 1870.3 239.8 29.9 46.1 1127.1
C15+ Resolved 1670.1 1654.3 827.8 102.9 0.2 13.0 158.9
C1-30 Resolved 5576.7 5461.7 2798.9 355.9 81.7 82.6 1604.5
GOR Resolved 0.04 0.04 0.04 0.04 1.71 0.40 0.25
62 Multi-component kinetics and late gas potential of selective Cooper Basin source rocks

Table B1b: Thermovaporisation aliphatic compounds amounts.
Sample G012670 G012672 G012677 G012710 G012678 G012680 G012681 G012683
TOC (%) 32.07 44.59 61.42 70.70 80.60 14.29 63.60 43.35
Amount, mg 6.98 2.47 4.70 4.77 3.76 7.39 5.46 6.35
Aliphatics (µg/g sample)
C1 18.5 14.4 14.8 23.8 37.3 3.0 18.0 4.5
C2 15.7 19.8 14.3 20.9 26.3 3.4 9.2 4.6
nC3 13.6 24.5 91.5 23.0 122.6 5.5 63.2 17.8
iC4 27.8 60.3 243.4 14.1 160.5 34.9 89.5 59.4
nC4 6.4 29.6 173.4 10.9 223.5 27.8 82.4 37.2
iC5 19.6 157.7 254.8 29.7 202.6 46.4 105.0 54.3
nC5 1.9 45.5 153.2 7.4 181.2 30.8 63.4 25.0
nC6 1.3 110.5 128.3 17.5 188.4 48.6 74.4 33.4
nC7 1.7 186.4 114.1 13.0 179.8 41.6 85.5 39.0
mecyC6 1.4 751.3 406.8 47.0 689.7 130.6 417.4 191.7
nC8 1.6 177.8 98.5 15.4 145.3 35.8 91.0 39.0
etcyC6 0.9 22.5 14.6 3.1 20.0 5.0 17.1 13.3
nC9 1.9 139.9 89.0 14.7 123.6 33.5 93.9 38.4
nC10 2.9 108.6 84.8 13.5 108.1 30.8 94.5 36.5
nC11 4.0 84.0 79.5 11.3 91.1 28.4 89.5 32.6
nC12 5.3 59.0 77.0 10.4 80.4 26.1 81.9 27.1
nC13 5.1 46.0 75.6 9.3 60.3 23.6 74.4 23.2
nC14 5.8 33.6 72.5 9.6 60.6 21.2 63.8 19.0
nC15 6.6 28.4 73.5 9.3 61.2 19.9 58.1 17.0
nC16 4.4 21.6 71.7 8.1 59.6 16.7 49.9 14.7
nC17 4.0 12.8 72.4 4.7 51.0 13.4 40.9 10.1
nC18 4.3 8.5 70.7 4.5 47.8 10.2 33.4 6.6
nC19 4.4 8.9 71.8 3.3 59.4 7.1 31.7 7.9
nC20 3.5 5.7 65.4 2.7 58.4 3.9 28.9 6.0
nC21 2.9 3.2 55.4 1.8 51.1 1.7 21.4 4.5
nC22 1.7 1.5 48.1 1.2 44.5 0.7 15.8 2.9
nC23 2.4 0.4 40.4 0.8 44.3 0.5 16.0 0.0
nC24 1.1 0.0 25.3 0.7 35.7 0.5 11.1 0.0
nC25 0.4 0.0 14.9 0.1 24.6 0.2 6.6 0.0
nC26 0.0 0.0 7.6 0.0 26.3 0.0 10.1 0.0
nC27 0.0 0.0 3.4 0.0 12.9 0.0 1.7 0.0
nC28 0.0 0.0 1.8 0.0 6.1 0.0 0.0 0.0
Multi-component kinetics and late gas potential of selected Cooper Basin source rocks 63

Sample G012670 G012672 G012677 G012710 G012678 G012680 G012681 G012683
nC29 0.0 0.0 0.0 0.0 3.9 0.0 0.0 0.0
nC30 0.0 0.0 0.0 0.0 0.0 0.0 0.0 0.0
nC31 0.0 0.0 0.0 0.0 0.0 0.0 0.0 0.0
nC32 0.0 0.0 0.0 0.0 0.0 0.0 0.0 0.0
Sum nC6-14 39.4 1816.7 1364.3 185.5 1907.9 459.5 1247.3 527.7
Sum nC15+ 35.6 91.1 622.3 37.3 586.8 74.8 325.6 69.6
Aliphatics –Isoprenoids
(µg/g sample)
iC10 2.4 34.4 41.4 8.0 54.1 9.6 12.3 10.4
iC11 1.9 49.4 32.1 7.7 61.7 13.4 26.2 12.5
iC13 1.9 7.9 18.6 2.7 19.8 5.0 12.9 6.0
iC14 1.4 5.4 31.5 2.4 24.9 6.4 12.4 5.6
iC18 1.4 2.9 16.0 1.3 13.8 2.7 4.9 2.8
Prist 2.8 9.3 65.6 1.3 22.1 2.0 8.7 5.1
Phyt 4.2 7.3 12.4 2.1 70.2 1.7 31.5 20.8
64 Multi-component kinetics and late gas potential of selective Cooper Basin source rocks

Table B1b (continued): Thermovaporisation aliphatic compounds amounts.
Sample G012684 G012685 G012687 G012688 G012690 G012692 G012693
TOC (%) 70.75 46.08 56.88 87.62 83.75 63.99 3.13
Amount, mg 7.25 9.45 9.96 12.84 15.38 16.78 20.24
Aliphatics (µg/g sample)
C1 6.9 4.5 3.6 4.5 7.1 0.0 0.8
C2 4.1 3.4 2.2 2.8 0.0 0.1 0.3
nC3 37.0 12.2 9.5 6.2 0.6 0.1 1.0
iC4 44.1 18.6 9.1 4.7 12.6 0.2 1.4
nC4 37.6 41.3 27.5 7.2 30.2 0.7 1.3
iC5 19.3 15.2 9.7 0.5 0.6 10.1 1.0
nC5 13.4 6.2 3.3 1.1 0.9 0.0 0.3
nC6 13.5 10.0 8.0 3.5 1.8 0.5 0.6
nC7 9.1 9.1 6.6 0.4 0.4 0.6 0.3
mecyC6 46.1 18.8 4.5 0.7 0.4 0.0 0.0
nC8 7.4 9.8 8.2 0.1 0.3 0.4 0.1
etcyC6 2.8 0.9 0.2 0.0 0.0 0.0 0.0
nC9 6.7 5.7 4.0 0.1 0.3 0.4 0.0
nC10 8.3 8.6 8.6 0.0 0.9 0.6 0.1
nC11 8.8 4.5 3.2 0.0 1.8 0.7 0.1
nC12 9.0 7.0 4.9 0.1 1.5 0.6 0.2
nC13 9.4 9.1 6.2 0.3 0.7 0.6 0.0
nC14 8.3 8.0 5.5 0.2 0.1 0.3 0.0
nC15 7.0 6.8 5.8 0.2 0.0 0.2 0.0
nC16 7.0 4.2 3.1 0.1 0.0 0.0 0.0
nC17 4.4 5.1 5.7 0.4 0.0 0.0 0.0
nC18 3.0 2.3 2.3 0.1 0.0 0.0 0.0
nC19 4.4 3.4 2.6 0.0 0.0 0.0 0.0
nC20 3.0 1.4 1.0 0.0 0.0 0.0 0.0
nC21 2.6 1.7 0.8 0.0 0.0 0.0 0.0
nC22 1.7 0.7 0.3 0.0 0.0 0.0 0.0
nC23 0.0 0.0 0.0 0.0 0.0 0.0 0.0
nC24 0.0 0.0 0.0 0.0 0.0 0.0 0.0
nC25 0.0 0.0 0.0 0.0 0.0 0.0 0.0
nC26 0.0 0.0 0.0 0.0 0.0 0.0 0.0
nC27 0.0 0.0 0.0 0.0 0.0 0.0 0.0
nC28 0.0 0.0 0.0 0.0 0.0 0.0 0.0
Multi-component kinetics and late gas potential of selected Cooper Basin source rocks 65

Sample G012684 G012685 G012687 G012688 G012690 G012692 G012693
nC29 0.0 0.0 0.0 0.0 0.0 0.0 0.0
nC30 0.0 0.0 0.0 0.0 0.0 0.0 0.0
nC31 0.0 0.0 0.0 0.0 0.0 0.0 0.0
nC32 0.0 0.0 0.0 0.0 0.0 0.0 0.0
Sum nC6-14 139.4 96.6 62.8 5.5 8.7 5.3 1.4
Sum nC15+ 33.1 25.6 21.6 0.7 0.0 0.2 0.0
Aliphatics –Isoprenoids
(µg/g sample)
iC10 4.3 1.9 0.9 0.0 0.1 0.2 0.0
iC11 3.6 2.0 1.2 0.0 0.0 0.2 0.0
iC13 1.1 0.8 0.4 0.0 0.2 0.0 0.0
iC14 0.8 0.6 0.4 0.0 0.2 0.0 0.0
iC18 1.0 0.5 0.4 0.0 0.0 0.0 0.0
Prist 2.4 0.8 0.2 0.2 0.0 0.0 0.0
Phyt 11.9 7.0 2.9 0.1 0.0 0.0 0.0
66 Multi-component kinetics and late gas potential of selective Cooper Basin source rocks

Table B1c: Thermovaporisation aromatic compounds amounts.
Sample G012670
G012672
G012677
G012710
G012678
G012680
G012681
G012683
TOC (%) 32.07 44.59 61.42 70.70 80.60 14.29 63.60 43.35
Amount, mg 6.98 2.47 4.70 4.77 3.76 7.39 5.46 6.35
Aromatics (µg/g sample)
Benzene 9.3 18.3 66.4 21.2 320.6 28.0 126.2 76.4
Toluene 5.2 322.8 311.5 90.0 1399.0 111.2 590.8 343.0
et-Benzene 1.6 37.5 22.5 7.0 57.1 12.1 37.3 21.2
m+p Xylene 4.1 630.2 308.7 82.5 1142.0 116.5 566.3 359.1
o-Xylene 1.9 150.0 104.8 25.2 248.7 39.0 99.7 50.6
1,3,5 trime-Benzene 0.8 24.7 14.5 3.9 26.7 7.2 14.1 6.4
Phenol 2.6 7.1 15.9 5.8 12.9 6.9 4.1 2.5
1,2,4 trime-Benzene 1.7 163.2 73.3 16.6 197.9 32.5 102.3 52.0
1,2,3 trime-Benzene 1.6 49.9 32.3 7.6 61.5 13.4 26.3 12.3
o-Cresol 1.3 5.4 3.8 5.3 3.0 0.9 1.4 0.8
m+p Cresol 0.5 12.5 6.3 1.6 13.7 3.1 7.9 4.3
1,2,3,4 tetrame-Benzene
1.5 26.7 9.5 3.5 19.8 4.5 7.1 3.1
Naphthalene 1.3 134.9 111.8 25.5 388.4 40.3 119.5 96.9
2meNaphthalene 2.4 166.8 139.1 24.4 550.4 51.2 242.1 181.8
1meNaphthalene 1.9 116.7 110.2 19.2 333.2 42.0 115.8 61.9
DMN1 30.5 192.7 169.9 33.1 499.5 60.9 272.3 174.7
DMN2 35.7 346.9 331.2 51.8 935.0 114.2 452.5 252.4
TMN 48.3 239.1 230.1 49.9 616.2 80.1 273.8 144.8
TeMN 24.8 117.5 151.8 26.4 366.5 42.3 167.0 90.8
Sum monoaromatic HC 27.6 1423.2 943.5 257.4 3473.4 364.4 1570.0 924.0
Sum diaromatic HC 144.9 1314.7 1244.0 230.3 3689.1 431.1 1642.9 1003.2
Sum phenols 4.4 25.0 26.0 12.7 29.6 11.0 13.3 7.5
Multi-component kinetics and late gas potential of selected Cooper Basin source rocks 67
Table B1c (continued): Thermovaporisation aromatic compounds amounts.
Sample G012684 G012685 G012687 G012688 G012690 G012692 G012693
TOC (%) 70.75 46.08 56.88 87.62 83.75 63.99 3.13
Amount, mg 7.25 9.45 9.96 12.84 15.38 16.78 20.24
Aromatics (µg/g sample)
Benzene 387.4 234.6 261.7 104.0 2.6 2.8 18.0
Toluene 732.3 481.6 271.1 34.9 2.8 3.6 0.9
et-Benzene 17.9 10.5 5.1 0.2 0.1 0.4 0.1
m+p Xylene 316.3 191.9 75.7 3.3 0.6 1.3 0.2
o-Xylene 28.2 20.1 9.9 0.5 0.2 0.8 0.1
1,3,5 trime-Benzene 2.9 1.4 1.1 0.1 0.0 0.2 0.0
Phenol 0.8 0.6 0.5 0.0 0.0 0.0 0.0
1,2,4 trime-Benzene 19.7 11.5 5.3 0.1 0.1 0.5 0.2
1,2,3 trime-Benzene 3.6 2.0 1.2 0.1 0.0 0.2 0.0
o-Cresol 0.2 1.1 0.9 0.0 0.0 0.0 0.0
m+p Cresol 2.2 1.3 0.7 0.0 0.0 0.0 0.0
1,2,3,4 tetrame-Benzene 1.1 0.5 0.5 0.0 0.0 0.2 0.0
Naphthalene 130.4 63.2 34.4 7.7 0.3 1.9 0.2
2meNaphthalene 168.2 73.3 23.9 2.9 0.2 0.8 0.0
1meNaphthalene 37.3 15.6 5.4 0.5 0.0 1.2 0.0
DMN1 152.4 101.9 83.1 22.1 1.8 4.5 0.0
DMN2 163.2 102.0 51.4 6.3 0.5 2.1 0.0
TMN 79.1 51.1 32.9 1.9 0.0 1.0 0.0
TeMN 63.5 32.9 17.9 1.6 0.0 0.1 0.0
Sum monoaromatic HC 1509.5 954.2 631.7 143.2 6.5 10.0 19.4
Sum diaromatic HC 794.1 439.9 249.0 43.1 2.9 11.5 0.2
Sum phenols 3.3 3.0 2.1 0.0 0.0 0.0 0.0
68 Multi-component kinetics and late gas potential of selective Cooper Basin source rocks

Table B2a: Pyrolysis GC boiling ranges amounts.
Sample G012670 G012671 G012672 G012673 G012677 G012710 G012678 G012679
TOC (%) 32.07 69.17 44.59 2.09 61.42 70.70 80.60 82.38
Amount, mg 6.98 5.34 2.83 16.82 4.70 4.77 3.76 4.41
(µg/g sample)
C1*1.1 5571.2 18160.1 11547.2 238.7 17609.9 16126.4 23262.6 25285.3
C2-C5 Total 6528.0 13842.2 11939.1 218.4 18094.8 17640.4 21667.8 28549.3
C6-14 Total (-Blank) 14923.7 29116.1 21409.8 442.3 30916.8 30908.9 36596.6 48542.4
C15_+ Total (-Blank) 25982.4 38191.5 34323.0 764.5 53269.3 46854.4 67083.1 90037.9
C1-5 Total 12099.2 32002.3 23486.3 457.0 35704.7 33766.8 44930.3 53834.6
C1-30+ Total (-Blank)
53005.4 99309.9 79219.2 1663.9 119890.7 111530.1 148610.1 192414.9
GOR Total 0.30 0.48 0.42 0.38 0.42 0.43 0.43 0.39
C6-C14 Resolved 11579.9 23885.2 17158.3 305.3 25466.6 24943.2 29727.1 40515.9
C15+ Resolved 6398.1 9929.8 8836.1 104.8 15229.1 10997.0 17045.3 27115.9
C1-30 Resolved 30077.2 65817.3 49480.8 867.1 76400.4 69707.1 91702.7 121466.4
GOR Resolved 0.67 0.95 0.90 1.11 0.88 0.94 0.96 0.80
(µg/g TOC)
C1*1.1 17372.1 26254.3 25899.3 11423.6 28670.8 22809.6 28863.5 30694.2
C2-C5 Total 20355.4 20011.9 26778.3 10451.7 29460.3 24951.1 26884.8 34656.5
C6-14 Total (-Blank) 46534.9 42093.5 48020.2 21170.7 50335.8 43718.3 45408.1 58926.4
C15_+ Total (-Blank) 81017.9 55214.0 76983.4 36591.2 86728.1 66272.1 83234.9 109298.5
C1-5 Total 37727.5 46266.2 52677.6 21875.3 58131.1 47760.7 55748.3 65350.7
C1-30+ Total (-Blank)
165280 143574 177681 79637 195195 157751 184391 233576
GOR Total 0.30 0.48 0.42 0.38 0.42 0.43 0.43 0.39
C6-C14 Resolved 36108.2 34531.2 38484.6 14613.6 41462.3 35280.4 36884.5 49182.9
C15+ Resolved 19950.5 14355.6 19818.6 5013.8 24794.7 15554.5 21149.3 32916.4
C1-30 Resolved 93786 95153 110981 41503 124388 98596 113782 147450
GOR Resolved 0.67 0.95 0.90 1.11 0.88 0.94 0.96 0.80
Multi-component kinetics and late gas potential of selected Cooper Basin source rocks 69

Table B2a (continued): Pyrolysis GC boiling ranges amounts.
Sample G012680 G012681 G012682 G012683 G012684 G012685 G012686 G012687
TOC (%) 14.29 63.60 86.69 43.35 70.75 46.08 51.95 56.88
Amount, mg 7.39 5.46 3.05 6.35 7.25 9.45 10.89 9.96
(µg/g sample)
C1*1.1 3240.1 14660.9 24099.0 9386.3 9799.5 5924.9 5707.7 3623.4
C2-C5 Total 3135.4 11352.9 16259.2 6093.5 5568.3 3180.5 2946.4 1908.3
C6-14 Total (-Blank) 4606.8 14904.3 21811.6 6273.9 5822.4 2858.4 3250.9 1406.0
C15_+ Total (-Blank) 6374.9 25515.7 44162.0 11756.5 12386.6 6200.0 6175.3 2555.8
C1-5 Total 6375.5 26013.8 40358.3 15479.8 15367.8 9105.4 8654.1 5531.8
C1-30+ Total (-Blank)
17357.1 66433.8 106331.9 33510.2 33576.8 18163.9 18080.3 9493.6
GOR Total 0.58 0.64 0.61 0.86 0.84 1.01 0.92 1.40
C6-C14 Resolved 3733.5 12211.8 17997.0 5221.4 4967.0 2478.9 2884.9 1343.5
C15+ Resolved 1484.3 7906.9 13750.4 3939.2 6145.3 3176.5 3410.8 1551.8
C1-30 Resolved 11593.2 46132.5 72105.6 24640.4 26480.0 14760.8 14949.8 8427.0
GOR Resolved 1.22 1.29 1.27 1.69 1.38 1.61 1.37 1.91
(µg/g TOC)
C1*1.1 22680.1 23051.4 27798.8 21653.4 13851.6 12859.0 10987.9 6370.1
C2-C5 Total 21947.3 17850.1 18755.4 14057.1 7870.9 6902.7 5672.2 3354.9
C6-14 Total (-Blank) 32246.6 23434.1 25160.1 14473.3 8230.1 6203.6 6258.4 2471.8
C15_+ Total (-Blank) 44623.4 40118.4 50941.9 27121.2 17508.5 13456.1 11888.1 4493.1
C1-5 Total 44627.5 40901.6 46554.2 35710.5 21722.5 19761.8 16660.1 9725.0
C1-30+ Total (-Blank)
121498 104454 122656 77305 47461 39422 34807 16690
GOR Total 0.58 0.64 0.61 0.86 0.84 1.01 0.92 1.40
C6-C14 Resolved 26133.8 19200.6 20759.9 12045.3 7020.8 5380.0 5553.8 2361.8
C15+ Resolved 10389.6 12432.1 15861.4 9087.3 8686.4 6894.1 6566.3 2728.1
C1-30 Resolved 81151 72534 83175 56843 37430 32036 28780 14815
GOR Resolved 1.22 1.29 1.27 1.69 1.38 1.61 1.37 1.91
70 Multi-component kinetics and late gas potential of selective Cooper Basin source rocks
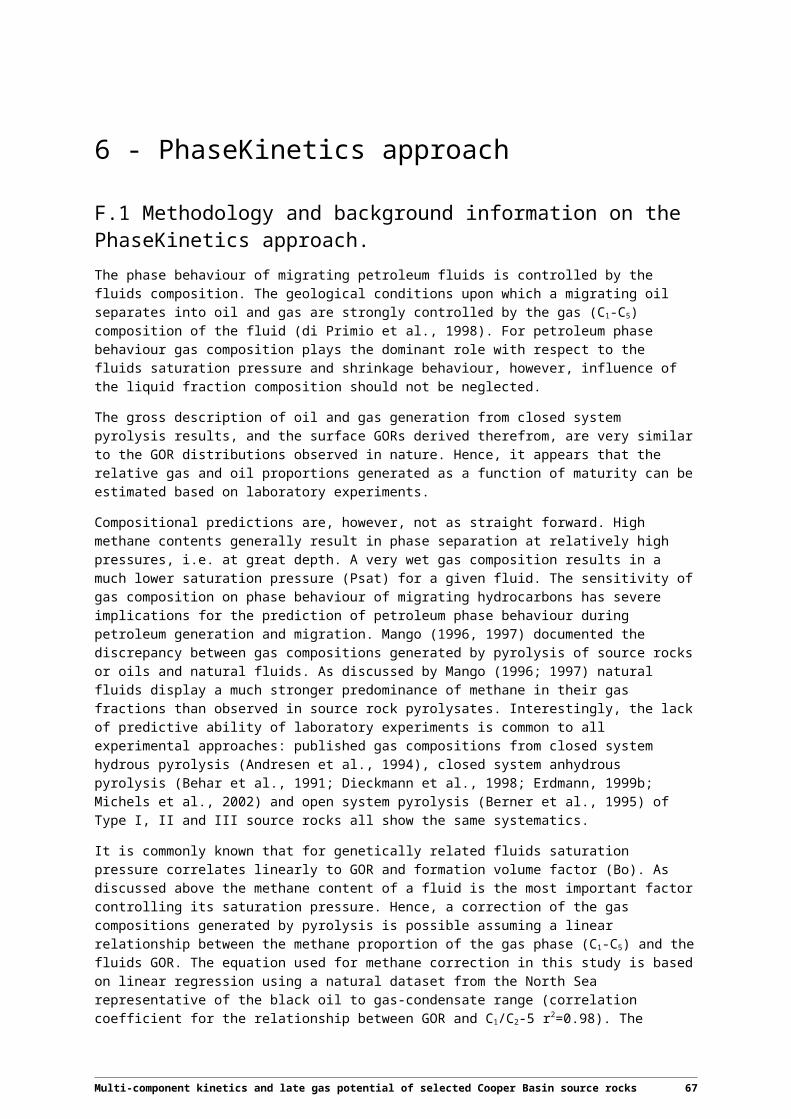
Table B2a (continued): Pyrolysis GC boiling ranges amounts.
Sample G012688 G012689 G012690 G012691 G012692 G012693 G012667 G012668
TOC (%) 87.62 6.90 83.75 8.78 63.99 3.13 77.21 56.67
Amount, mg 12.84 17.61 15.38 14.26 16.78 20.24 2.25 6.15
(µg/g sample)
C1*1.1 2026.3 8.5 57.6 840.0 85.4 67.3 20305.4 7238.9
C2-C5 Total 703.6 20.5 12.5 132.3 51.6 24.2 18968.0 6579.8
C6-14 Total (-Blank) 547.9 113.8 1.3 161.7 72.9 57.3 38513.6 14783.2
C15_+ Total (-Blank) 1395.8 301.1 0.0 177.3 148.1 0.0 73635.7 26355.2
C1-5 Total 2729.9 29.0 70.1 972.3 137.1 91.5 39273.4 13818.7
C1-30+ Total (-Blank)
4673.6 443.9 71.5 1311.2 358.1 148.7 151422.7 54957.1
GOR Total 1.40 0.07 52.89 2.87 0.62 1.60 0.35 0.34
C6-C14 Resolved 487.5 53.6 1.3 133.7 62.4 19.7 31087.9 12006.2
C15+ Resolved 873.7 26.8 0.0 28.1 3.2 0.0 18883.6 7774.7
C1-30 Resolved 4091.2 109.4 71.5 1134.0 202.7 111.2 89245.0 33599.6
GOR Resolved 2.01 0.36 52.89 6.01 2.09 4.64 0.79 0.70
(µg/g TOC)
C1*1.1 2312.7 123.3 68.8 9564.0 133.5 2150.1 26298.9 12773.8
C2-C5 Total 803.1 296.9 15.0 1506.0 80.7 772.0 24566.8 11610.7
C6-14 Total (-Blank) 625.3 1648.1 1.6 1841.1 113.9 1829.7 49881.6 26086.5
C15_+ Total (-Blank) 1593.1 4362.4 0.0 2018.7 231.5 0.0 95370.7 46506.5
C1-5 Total 3115.8 420.2 83.7 11070.0 214.2 2922.1 50865.7 24384.5
C1-30+ Total (-Blank)
5334 6431 85 14930 560 4752 196118 96977
GOR Total 1.40 0.07 52.89 2.87 0.62 1.60 0.35 0.34
C6-C14 Resolved 556.4 776.5 1.6 1522.0 97.5 629.7 40264.1 21186.2
C15+ Resolved 997.2 388.1 0.0 319.9 5.1 0.0 24457.5 13719.2
C1-30 Resolved 4669 1585 85 12912 317 3552 115587 59290
GOR Resolved 2.01 0.36 52.89 6.01 2.09 4.64 0.79 0.70
Multi-component kinetics and late gas potential of selected Cooper Basin source rocks 71

Table B2a (continued): Pyrolysis GC boiling ranges amounts.
Sample G012669 G012674 G012675 G012676
TOC (%) 2.32 22.36 68.70 3.98
Amount, mg 12.59 14.35 2.89 13.84
(µg/g sample)
C1*1.1 210.7 5468.1 23682.9 700.6
C2-C5 Total 306.1 4395.4 19750.3 937.9
C6-14 Total (-Blank) 700.0 9163.0 32828.1 1929.3
C15_+ Total (-Blank) 1628.6 13078.8 66629.8 3936.6
C1-5 Total 516.8 9863.6 43433.2 1638.5
C1-30+ Total (-Blank) 2845.4 32105.4 142891.1 7504.4
GOR Total 0.22 0.44 0.44 0.28
C6-C14 Resolved 525.2 7675.6 27629.6 1456.8
C15+ Resolved 164.3 4729.2 17545.2 799.1
C1-30 Resolved 1206.4 22268.3 88608.0 3894.4
GOR Resolved 0.75 0.80 0.96 0.73
(µg/g TOC)
C1*1.1 9081.0 24459.3 34473.0 17604.0
C2-C5 Total 13195.3 19661.1 28748.6 23565.0
C6-14 Total (-Blank) 30170.5 40986.9 47784.7 48476.1
C15_+ Total (-Blank) 70197.8 58502.4 96986.6 98908.4
C1-5 Total 22276.3 44120.4 63221.6 41169.0
C1-30+ Total (-Blank) 122645 143610 207993 188553
GOR Total 0.22 0.44 0.44 0.28
C6-C14 Resolved 22639.4 34333.7 40217.7 36602.4
C15+ Resolved 7082.8 21153.8 25538.9 20077.2
C1-30 Resolved 51998 99608 128978 97849
GOR Resolved 0.75 0.80 0.96 0.73
72 Multi-component kinetics and late gas potential of selective Cooper Basin source rocks

Table B2b: Pyrolysis GC n-aliphatic compound amounts.
Sample G012670 G012671 G012672 G012673 G012677 G012710 G012678 G012679
TOC (%) 32.07 69.17 44.59 2.09 61.42 70.70 80.60 82.38
Amount, mg 6.98 5.34 2.83 16.82 4.70 4.77 3.76 4.41
n-Aliphatics (µg/g sample)
C2:1 0.0 0.0 0.0 0.0 0.0 0.0 0.0 0.0
C2:0 2831.4 6877.3 5547.4 104.9 8221.6 7738.5 10439.3 12890.2
C3:1 0.0 0.0 0.0 0.0 0.0 0.0 0.0 0.0
C3:0 1672.0 3506.5 3032.6 46.3 4714.5 4633.5 5694.6 7725.8
C4:1 505.5 737.9 835.5 15.4 1114.9 1338.8 1415.3 1587.0
C4:0 299.1 610.8 622.5 11.3 1282.7 1157.5 1241.2 2104.4
C5:1 243.0 196.2 354.0 4.9 559.8 608.0 540.7 738.0
C5:0 205.7 268.0 400.8 3.3 705.4 679.6 644.9 1251.6
C6:1 273.9 176.6 381.9 4.5 573.1 629.4 519.0 736.8
C6:0 176.8 183.6 313.4 2.7 563.1 540.2 467.2 1015.8
C7:1 204.4 134.4 303.0 3.3 479.8 507.2 403.3 615.4
C7:0 182.1 229.8 334.8 2.6 567.7 536.0 508.3 1059.3
C8:1 163.5 95.8 248.6 2.6 387.5 383.1 318.8 481.8
C8:0 142.9 131.5 247.6 2.0 457.1 399.5 353.0 758.0
C9:1 127.9 68.4 205.1 2.1 316.7 303.8 251.4 401.2
C9:0 114.4 93.4 207.2 1.4 380.7 327.7 288.0 637.3
C10:1 122.2 56.6 200.7 1.8 290.8 266.2 224.1 358.4
C10:0 106.3 87.6 194.7 1.3 356.1 296.3 269.5 597.8
C11:1 111.9 65.1 173.8 1.5 267.8 235.2 208.4 329.4
C11:0 100.2 82.2 178.8 1.1 344.1 261.9 242.3 583.3
C12:1 106.9 70.8 176.0 1.5 266.6 223.1 213.2 329.0
C12:0 127.4 159.1 219.3 1.4 449.3 296.9 297.0 781.0
C13:1 119.4 198.8 168.5 1.3 321.5 225.2 301.2 489.4
C13:0 112.3 80.4 185.3 1.5 370.5 266.6 258.2 593.7
C14:1 96.0 97.2 156.8 1.4 256.3 196.2 219.5 339.2
C14:0 93.8 76.4 161.8 1.3 327.5 217.9 241.6 560.3
C15:1 80.9 185.9 141.8 1.2 234.8 165.0 191.6 294.9
C15:0 96.4 90.3 162.6 1.3 331.4 217.6 249.8 563.4
C16:1 96.1 123.8 147.5 1.0 278.4 182.3 219.2 348.2
C16:0 91.8 98.1 163.2 1.1 328.6 197.2 259.1 581.8
C17:1 93.5 102.8 156.0 1.1 263.7 188.2 257.5 339.4
C17:0 76.1 72.0 142.2 0.8 303.4 163.9 221.3 512.8
Multi-component kinetics and late gas potential of selected Cooper Basin source rocks 73

Sample G012670 G012671 G012672 G012673 G012677 G012710 G012678 G012679
C18:1 70.7 50.6 125.3 0.4 212.0 122.9 159.0 256.8
C18:0 92.5 88.9 161.4 1.0 334.6 169.5 237.0 548.9
C19:1 83.4 78.5 130.0 0.7 228.4 145.6 210.6 368.2
C19:0 94.4 88.0 155.5 0.6 311.8 143.8 217.2 514.4
Table B2b (continued): Pyrolysis GC n-aliphatic compound amounts.
Sample G012670 G012671 G012672 G012673 G012677 G012710 G012678 G012679
n-Aliphatics (µg/g sample)
C20:1 73.8 61.1 113.8 0.2 216.4 113.5 168.0 259.3
C20:0 104.2 95.4 159.3 0.5 339.8 165.7 252.5 585.5
C21:1 66.6 52.9 111.6 0.4 209.8 101.1 144.7 224.4
C21:0 93.8 74.0 142.7 0.3 295.4 127.9 195.8 480.0
C22:1 66.6 40.2 102.4 0.2 180.7 80.4 120.2 202.6
C22:0 87.8 68.5 132.7 0.2 276.3 109.6 179.9 456.1
C23:1 58.5 42.2 85.9 0.1 160.8 65.0 100.0 162.5
C23:0 90.8 70.9 121.5 0.2 245.9 100.2 162.0 419.0
C24:1 56.1 41.0 80.6 0.2 134.2 67.9 92.9 154.1
C24:0 80.5 67.6 109.4 0.2 206.2 90.4 144.9 363.2
C25:1 42.5 37.3 62.0 0.0 85.8 48.5 77.0 109.7
C25:0 67.7 48.6 80.6 0.0 137.8 67.1 115.4 279.0
C26:1 30.9 30.4 51.1 0.0 74.5 54.5 88.0 147.8
C26:0 47.9 46.5 71.2 0.0 105.2 56.7 105.3 211.7
C27:1 23.0 16.3 33.8 0.0 33.7 19.9 35.9 41.9
C27:0 37.0 28.1 46.2 0.0 65.6 32.9 65.6 128.7
C28:1 13.8 9.4 23.5 0.0 28.5 16.7 31.7 38.5
C28:0 20.7 18.4 29.9 0.0 39.6 20.2 45.6 89.1
C29:1 10.7 9.1 16.2 0.0 20.3 12.2 23.3 38.3
C29:0 16.6 13.4 21.7 0.0 29.3 16.0 33.4 69.3
C30:1 4.8 4.7 8.8 0.0 12.5 8.9 12.1 21.0
C30:0 6.6 4.2 9.6 0.0 14.5 7.4 13.9 40.1
C31:1 3.9 2.6 0.0 0.0 0.0 0.0 0.0 0.0
C31:0 0.0 0.0 0.0 0.0 0.0 0.0 0.0 0.0
C32:1 0.6 0.0 0.0 0.0 0.0 0.0 0.0 0.0
C32:0 0.8 0.0 0.0 0.0 0.0 0.0 0.0 0.0
Sum nC6-14 2482.6 2087.8 4057.2 35.2 6976.3 6112.4 5583.9 10667.2
Sum nC15+ 1981.6 1861.8 3099.8 11.6 5739.9 3078.7 4430.2 8850.5
74 Multi-component kinetics and late gas potential of selective Cooper Basin source rocks

Table B2b (contd.): Pyrolysis GC n-aliphatic compound amounts.
Sample G012680 G012681 G012682 G012683 G012684 G012685 G012686 G012687
TOC (%) 14.29 63.60 86.69 43.35 70.75 46.08 51.95 56.88
Amount, mg 7.39 5.46 3.05 6.35 7.25 9.45 10.89 9.96
n-Aliphatics (µg/g sample)
C2:1 0.0 0.0 0.0 0.0 0.0 0.0 0.0 0.0
C2:0 1463.8 5899.4 8513.3 3417.9 3316.1 1917.7 1838.3 1177.4
C3:1 0.0 0.0 0.0 0.0 0.0 0.0 0.0 0.0
C3:0 788.5 2827.1 4215.2 1470.5 1214.8 671.9 641.9 386.8
C4:1 223.7 610.3 737.9 329.5 266.5 147.2 142.1 74.5
C4:0 198.8 628.6 916.0 248.4 169.3 90.5 82.8 45.4
C5:1 105.1 257.5 242.9 88.5 53.5 26.2 22.5 9.2
C5:0 94.3 314.3 414.6 92.6 57.8 23.7 22.5 8.3
C6:1 110.4 237.0 199.1 74.2 39.2 18.3 14.3 5.4
C6:0 77.1 236.9 296.6 58.9 34.2 14.2 12.8 4.7
C7:1 89.4 191.6 169.7 52.8 25.9 11.8 9.7 2.9
C7:0 74.6 241.0 325.7 62.6 41.0 17.9 15.2 3.7
C8:1 70.8 148.1 114.4 40.2 18.5 8.5 6.8 2.4
C8:0 59.7 167.1 211.0 36.4 18.1 7.5 6.0 1.9
C9:1 57.8 116.1 93.7 28.5 10.0 5.4 4.4 0.9
C9:0 50.3 133.5 177.8 28.7 13.7 5.4 4.6 1.5
C10:1 53.1 94.6 77.0 23.1 7.6 4.0 3.7 0.6
C10:0 45.3 118.3 165.5 23.3 9.8 5.1 5.0 1.0
C11:1 46.7 79.9 65.8 18.4 5.7 3.7 4.0 0.7
C11:0 41.4 104.8 151.5 18.8 7.4 2.9 3.0 0.6
C12:1 44.2 78.3 76.5 16.7 5.4 2.5 2.3 0.4
C12:0 43.8 110.2 163.3 19.3 5.9 2.9 2.4 0.7
C13:1 37.0 78.8 110.0 17.4 7.1 3.5 3.4 0.7
C13:0 38.0 85.4 124.0 13.4 4.2 3.0 0.9 0.4
C14:1 33.1 54.8 60.5 12.4 4.9 2.8 2.5 0.5
C14:0 34.4 78.7 118.6 12.3 3.4 2.0 2.0 0.5
C15:1 29.1 50.7 46.0 11.2 4.5 6.3 0.0 0.0
C15:0 30.5 79.8 126.9 14.7 6.1 3.5 0.0 0.0
C16:1 28.1 63.9 56.8 21.5 0.0 0.0 0.0 0.0
C16:0 29.0 81.1 134.1 16.1 0.0 0.0 0.0 0.0
C17:1 30.8 107.6 135.5 0.0 0.0 0.0 0.0 0.0
C17:0 23.4 48.5 70.0 0.0 0.0 0.0 0.0 0.0
Multi-component kinetics and late gas potential of selected Cooper Basin source rocks 75

Sample G012680 G012681 G012682 G012683 G012684 G012685 G012686 G012687
C18:1 17.9 35.9 33.9 0.0 0.0 0.0 0.0 0.0
C18:0 21.9 31.3 79.6 0.0 0.0 0.0 0.0 0.0
C19:1 21.4 0.0 0.0 0.0 0.0 0.0 0.0 0.0
C19:0 19.6 0.0 65.5 0.0 0.0 0.0 0.0 0.0
76 Multi-component kinetics and late gas potential of selective Cooper Basin source rocks

Table B2b (continued.): Pyrolysis GC n-aliphatic compound amounts.
Sample G012680 G012681 G012682 G012683 G012684 G012685 G012686 G012687
n-Aliphatics (µg/g sample)
C20:1 17.2 0.0 34.0 0.0 0.0 0.0 0.0 0.0
C20:0 22.0 0.0 87.1 0.0 0.0 0.0 0.0 0.0
C21:1 14.6 0.0 22.9 0.0 0.0 0.0 0.0 0.0
C21:0 17.2 0.0 49.9 0.0 0.0 0.0 0.0 0.0
C22:1 11.6 0.0 0.0 0.0 0.0 0.0 0.0 0.0
C22:0 14.1 0.0 49.5 0.0 0.0 0.0 0.0 0.0
C23:1 9.0 0.0 0.0 0.0 0.0 0.0 0.0 0.0
C23:0 12.3 0.0 83.7 0.0 0.0 0.0 0.0 0.0
C24:1 8.7 0.0 0.0 0.0 0.0 0.0 0.0 0.0
C24:0 11.4 0.0 44.3 0.0 0.0 0.0 0.0 0.0
C25:1 5.2 0.0 0.0 0.0 0.0 0.0 0.0 0.0
C25:0 6.6 0.0 45.5 0.0 0.0 0.0 0.0 0.0
C26:1 3.2 0.0 0.0 0.0 0.0 0.0 0.0 0.0
C26:0 6.1 0.0 59.1 0.0 0.0 0.0 0.0 0.0
C27:1 2.4 0.0 0.0 0.0 0.0 0.0 0.0 0.0
C27:0 3.0 0.0 0.0 0.0 0.0 0.0 0.0 0.0
C28:1 1.3 0.0 0.0 0.0 0.0 0.0 0.0 0.0
C28:0 1.4 0.0 0.0 0.0 0.0 0.0 0.0 0.0
C29:1 1.0 0.0 0.0 0.0 0.0 0.0 0.0 0.0
C29:0 1.0 0.0 0.0 0.0 0.0 0.0 0.0 0.0
C30:1 0.7 0.0 0.0 0.0 0.0 0.0 0.0 0.0
C30:0 0.3 0.0 0.0 0.0 0.0 0.0 0.0 0.0
C31:1 0.0 0.0 0.0 0.0 0.0 0.0 0.0 0.0
C31:0 0.0 0.0 0.0 0.0 0.0 0.0 0.0 0.0
C32:1 0.0 0.0 0.0 0.0 0.0 0.0 0.0 0.0
C32:0 0.0 0.0 0.0 0.0 0.0 0.0 0.0 0.0
Sum nC6-14 1007.1 2355.1 2700.6 557.3 262.1 121.3 103.0 29.6
Multi-component kinetics and late gas potential of selected Cooper Basin source rocks 77

Table B2b (continued): Pyrolysis GC n-aliphatic compound amounts.
Sample G012688 G012689 G012690 G012691 G012692 G012693 G012667 G012668
TOC (%) 87.62 6.90 83.75 8.78 63.99 3.13 77.21 56.67
Amount, mg 12.84 17.61 15.38 14.26 16.78 20.24 2.25 6.15
n-Aliphatics (µg/g sample)
C2:1 0.0 0.0 0.0 0.0 0.0 0.0 0.0 0.0
C2:0 490.7 6.1 5.2 58.0 14.9 7.7 9213.6 2916.4
C3:1 0.0 0.0 0.0 0.0 0.0 0.0 0.0 0.0
C3:0 131.7 4.4 2.7 18.4 11.9 6.8 5215.8 1653.5
C4:1 17.5 2.8 1.3 6.6 5.8 2.2 1233.7 467.7
C4:0 12.9 1.1 0.9 3.5 4.0 1.7 1132.9 458.8
C5:1 1.7 1.9 0.8 2.5 2.6 0.9 473.3 260.2
C5:0 1.3 0.6 0.2 1.4 1.7 0.8 570.5 236.6
C6:1 1.1 0.6 0.4 1.2 1.3 0.4 463.2 282.9
C6:0 0.4 0.1 0.1 0.8 1.0 0.4 454.3 210.1
C7:1 0.6 0.5 0.2 0.9 0.7 0.2 366.1 221.5
C7:0 0.7 0.3 0.1 0.9 0.9 0.2 494.8 204.5
C8:1 0.6 0.9 0.1 0.6 0.6 0.1 291.2 172.0
C8:0 0.2 0.2 0.1 0.6 0.7 0.1 357.0 167.0
C9:1 0.4 0.3 0.1 0.4 0.2 0.0 241.6 135.0
C9:0 0.2 0.1 0.0 0.5 0.4 0.1 287.8 134.1
C10:1 0.3 0.0 0.0 0.3 0.1 0.0 218.5 122.2
C10:0 0.1 0.0 0.0 0.4 0.3 0.0 287.5 123.1
C11:1 0.3 0.1 0.0 0.2 0.1 0.0 218.7 111.1
C11:0 0.1 0.2 0.0 0.4 0.3 0.0 254.2 113.8
C12:1 0.3 0.1 0.0 0.2 0.1 0.0 228.4 105.7
C12:0 0.2 0.4 0.0 0.4 0.2 0.0 318.9 130.7
C13:1 0.2 0.1 0.0 0.1 0.0 0.0 322.9 100.2
C13:0 0.1 0.5 0.0 0.6 0.3 0.0 262.0 102.2
C14:1 0.3 0.1 0.0 0.1 0.0 0.0 232.5 89.6
C14:0 0.1 0.3 0.0 0.6 0.1 0.0 258.6 103.2
C15:1 0.0 0.1 0.0 0.1 0.0 0.0 207.6 84.9
C15:0 0.0 0.1 0.0 0.7 0.0 0.0 283.8 105.6
C16:1 0.0 0.0 0.0 0.0 0.0 0.0 253.2 94.3
C16:0 0.0 0.1 0.0 0.5 0.0 0.0 315.5 114.5
C17:1 0.0 0.0 0.0 0.0 0.0 0.0 254.0 131.7
C17:0 0.0 0.0 0.0 0.3 0.0 0.0 274.7 97.4
78 Multi-component kinetics and late gas potential of selective Cooper Basin source rocks

Sample G012688 G012689 G012690 G012691 G012692 G012693 G012667 G012668
C18:1 0.0 0.0 0.0 0.0 0.0 0.0 196.0 68.5
C18:0 0.0 0.0 0.0 0.1 0.0 0.0 317.1 106.9
C19:1 0.0 0.0 0.0 0.0 0.0 0.0 237.2 106.4
C19:0 0.0 0.0 0.0 0.0 0.0 0.0 337.1 108.0
Table B2b (continued): Pyrolysis GC n-aliphatic compound amounts.
Sample G012688 G012689 G012690 G012691 G012692 G012693 G012667 G012668
n-Aliphatics (µg/g sample)
C20:1 0.0 0.0 0.0 0.0 0.0 0.0 222.5 66.8
C20:0 0.0 0.0 0.0 0.0 0.0 0.0 380.8 118.1
C21:1 0.0 0.0 0.0 0.0 0.0 0.0 223.0 58.1
C21:0 0.0 0.0 0.0 0.0 0.0 0.0 347.9 100.2
C22:1 0.0 0.0 0.0 0.0 0.0 0.0 217.4 51.0
C22:0 0.0 0.0 0.0 0.0 0.0 0.0 366.9 90.1
C23:1 0.0 0.0 0.0 0.0 0.0 0.0 204.8 41.2
C23:0 0.0 0.0 0.0 0.0 0.0 0.0 336.5 94.0
C24:1 0.0 0.0 0.0 0.0 0.0 0.0 156.7 46.7
C24:0 0.0 0.0 0.0 0.0 0.0 0.0 277.8 83.6
C25:1 0.0 0.0 0.0 0.0 0.0 0.0 103.1 31.9
C25:0 0.0 0.0 0.0 0.0 0.0 0.0 184.8 66.4
C26:1 0.0 0.0 0.0 0.0 0.0 0.0 102.6 44.9
C26:0 0.0 0.0 0.0 0.0 0.0 0.0 151.5 58.1
C27:1 0.0 0.0 0.0 0.0 0.0 0.0 55.5 19.3
C27:0 0.0 0.0 0.0 0.0 0.0 0.0 97.9 37.7
C28:1 0.0 0.0 0.0 0.0 0.0 0.0 40.3 16.1
C28:0 0.0 0.0 0.0 0.0 0.0 0.0 66.5 21.7
C29:1 0.0 0.0 0.0 0.0 0.0 0.0 35.1 14.2
C29:0 0.0 0.0 0.0 0.0 0.0 0.0 53.0 16.5
C30:1 0.0 0.0 0.0 0.0 0.0 0.0 16.0 7.7
C30:0 0.0 0.0 0.0 0.0 0.0 0.0 20.5 7.3
C31:1 0.0 0.0 0.0 0.0 0.0 0.0 31.3 7.9
C31:0 0.0 0.0 0.0 0.0 0.0 0.0 120.9 25.9
C32:1 0.0 0.0 0.0 0.0 0.0 0.0 7.4 3.1
C32:0 0.0 0.0 0.0 0.0 0.0 0.0 29.7 3.3
Sum nC6-14 6.1 5.0 1.1 9.1 7.3 1.6 5558.3 2628.9
Sum nC15+ 0.0 0.4 0.0 1.8 0.0 0.0 6526.4 2150.0
Multi-component kinetics and late gas potential of selected Cooper Basin source rocks 79

Table B2b (continued): Pyrolysis GC n-aliphatic compound amounts.
Sample G012669 G012674 G012675 G012676
TOC (%) 2.32 22.36 68.70 3.98
Amount, mg
12.59 14.35 2.89 13.84
n-Aliphatics (µg/g sample)
C2:1 0.0 0.0 0.0 0.0
C2:0 107.9 2054.7 9954.9 407.4
C3:1 0.0 0.0 0.0 0.0
C3:0 74.8 1091.9 5255.5 247.5
C4:1 27.4 309.0 985.3 75.9
C4:0 23.7 242.2 1131.8 57.9
C5:1 14.8 121.6 305.5 38.9
C5:0 9.6 142.3 474.9 31.0
C6:1 13.8 121.0 258.0 46.8
C6:0 10.1 119.1 329.0 26.3
C7:1 9.8 95.3 204.5 35.4
C7:0 8.2 124.6 397.3 26.9
C8:1 7.0 72.9 150.0 28.4
C8:0 7.0 93.7 236.5 21.9
C9:1 5.8 57.1 123.3 23.4
C9:0 5.1 74.1 181.7 17.9
C10:1 5.4 52.1 101.6 22.4
C10:0 4.3 70.6 165.9 16.4
C11:1 4.9 48.9 95.0 20.1
C11:0 3.9 64.9 157.2 15.5
C12:1 4.4 52.0 116.5 19.5
C12:0 4.2 85.3 195.0 17.0
C13:1 3.1 56.2 305.4 16.5
C13:0 5.0 64.8 151.8 16.2
C14:1 2.9 44.8 158.2 15.2
C14:0 3.4 61.5 151.6 14.1
C15:1 2.4 47.5 96.8 13.8
C15:0 2.9 67.3 189.0 13.4
C16:1 2.2 54.9 124.5 13.5
C16:0 2.6 70.3 209.7 13.5
C17:1 2.4 67.4 142.9 15.0
C17:0 1.9 58.4 150.0 11.4
80 Multi-component kinetics and late gas potential of selective Cooper Basin source rocks

Sample G012669 G012674 G012675 G012676
C18:1 1.2 35.9 93.8 10.2
C18:0 1.9 67.1 196.2 12.3
C19:1 0.9 55.3 156.3 11.3
C19:0 1.4 67.1 205.2 11.7
Multi-component kinetics and late gas potential of selected Cooper Basin source rocks 81

Table B2b (continued): Pyrolysis GC n-aliphatic compound amounts.
Sample G012669 G012674 G012675 G012676
n-Aliphatics (µg/g sample)
C20:1 0.9 35.7 111.2 10.1
C20:0 1.5 69.6 239.9 13.6
C21:1 0.8 32.3 107.1 9.2
C21:0 1.1 59.2 218.1 12.7
C22:1 0.6 30.8 89.7 7.9
C22:0 0.9 56.9 221.1 11.6
C23:1 0.3 27.2 93.8 6.6
C23:0 0.7 56.6 222.5 11.2
C24:1 0.6 21.6 76.7 7.3
C24:0 0.7 46.2 189.4 10.7
C25:1 0.3 15.5 60.2 5.2
C25:0 0.5 34.1 157.3 8.9
C26:1 0.1 19.9 77.8 4.1
C26:0 0.3 30.0 119.4 7.6
C27:1 0.1 10.3 28.3 3.0
C27:0 0.1 18.0 77.5 5.4
C28:1 0.0 8.2 20.5 1.8
C28:0 0.0 11.1 46.4 3.0
C29:1 0.0 7.2 20.1 1.5
C29:0 0.0 8.0 39.6 2.2
C30:1 0.0 3.3 11.4 0.9
C30:0 0.0 3.4 15.9 1.0
C31:1 0.0 4.2 9.9 0.8
C31:0 0.0 17.2 53.9 3.0
C32:1 0.0 1.9 0.0 0.3
C32:0 0.0 1.9 0.0 0.7
Sum nC6-14 108.3 1358.9 3478.3 399.9
Sum nC15+ 29.2 1221.2 3871.8 276.5
82 Multi-component kinetics and late gas potential of selective Cooper Basin source rocks
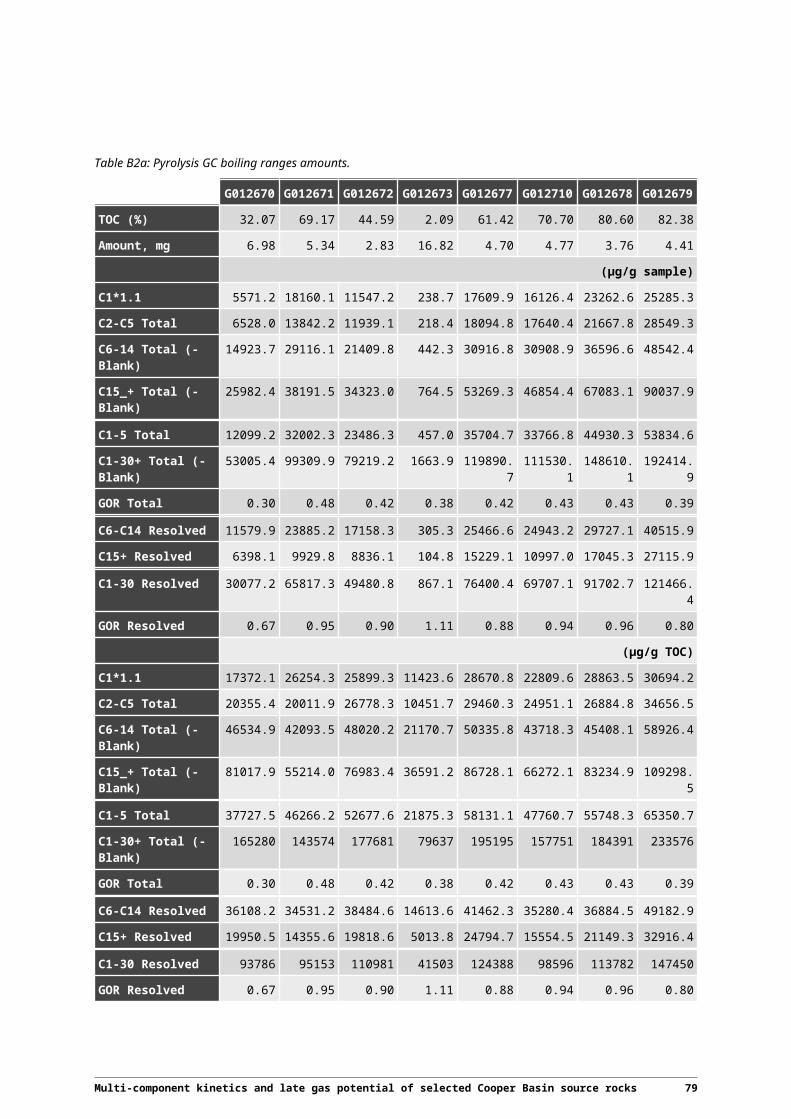
Table B2c: Pyrolysis GC aliphatic isoprenoids, aromatic and sulphur-bearing compounds amounts.
Sample G012670 G012671 G012672 G012673 G012677 G012710 G012678 G012679
TOC (%) 32.07 69.17 44.59 2.09 61.42 70.70 80.60 82.38
Amount, mg 6.98 5.34 2.83 16.82 4.70 4.77 3.76 4.41
Aliphatics - Isoprenoids
(µg/g sample)
iC18 7.9 22.5 15.0 0.1 19.6 17.0 28.4 28.0
Prist-1-ene 45.0 78.4 42.9 0.5 63.9 49.0 98.9 127.0
Prist-2-ene 15.6 27.8 33.1 0.5 18.7 19.7 35.5 50.6
Aromatics (µg/g sample)
Benz 223.4 340.5 265.4 21.0 346.2 470.4 369.3 308.8
Tol 518.5 952.3 796.3 38.7 917.8 1193.9 1263.0 1219.4
et-Benz 90.1 164.1 133.0 3.3 178.2 197.2 206.3 299.0
m+p Xyl 305.0 788.6 716.6 20.6 806.7 911.2 1298.4 1214.5
Styr 66.8 185.8 74.4 9.9 123.4 117.8 89.6 190.4
o-Xyl 119.1 206.7 176.8 5.2 223.7 251.6 262.7 332.6
Phenol 468.7 1872.3 349.8 4.1 459.1 529.9 932.8 889.7
o-Cresol 305.8 1049.7 352.9 3.6 627.7 492.1 871.7 905.4
m+p Cresol 448.2 2134.4 359.5 3.0 759.5 553.7 1221.5 1301.0
Napht 57.9 300.3 129.8 6.5 128.6 148.9 147.8 166.6
2meNapht 92.3 199.5 197.5 6.8 272.2 286.0 437.6 525.2
1meNapht 63.2 153.2 112.6 4.2 156.3 161.4 237.3 293.7
Sum dimeNapht 167.0 474.8 394.3 10.1 644.4 564.0 979.3 1268.5
Tetra-meNapht 47.2 52.7 51.1 1.6 68.7 88.3 113.8 131.8
Sum monoaromatic HC 1323.0 2637.8 2162.6 98.7 2596.0 3142.2 3489.3 3564.7
Sum diaromatic HC 427.6 1180.5 885.4 29.3 1270.3 1248.6 1915.8 2385.7
Sum phenols 1222.7 5056.4 1062.3 10.6 1846.3 1575.7 3025.9 3096.1
Sulphur Compounds (µg/g sample)
Thioph 74.1 168.9 146.9 1.4 213.0 185.4 272.7 558.3
2meThioph 23.7 19.8 22.6 0.0 0.0 23.8 0.0 30.4
3meThioph 40.5 34.5 38.3 0.0 84.1 75.4 87.7 166.3
2,5dimeThioph 4.0 0.0 0.0 0.0 0.0 0.0 0.0 0.0
2,3dimeThioph 13.6 32.3 27.2 0.0 36.8 38.1 41.7 71.2
Sum alkylthiophenes 81.9 86.6 88.0 0.0 120.9 137.4 129.4 267.8
Multi-component kinetics and late gas potential of selected Cooper Basin source rocks 83

Table B2c: Pyrolysis GC aliphatic isoprenoids, aromatic and sulphur-bearing compounds amounts.
Sample G012680 G012681 G012682 G012683 G012684 G012685 G012686 G012687
TOC (%) 14.29 63.60 86.69 43.35 70.75 46.08 51.95 56.88
Amount, mg 7.39 5.46 3.05 6.35 7.25 9.45 10.89 9.96
Aliphatics - Isoprenoids
(µg/g sample)
iC18 1.9 0.0 0.0 0.0 0.0 0.0 0.0 0.0
Prist-1-ene 7.0 45.1 62.2 0.0 0.0 0.0 0.0 0.0
Prist-2-ene 2.8 0.0 38.2 0.0 0.0 0.0 0.0 0.0
Aromatics (µg/g sample)
Benz 89.5 355.6 388.8 202.3 304.4 198.9 280.6 165.5
Tol 212.0 896.7 1180.0 525.1 787.8 433.0 573.7 285.3
et-Benz 30.3 126.3 199.9 55.3 67.5 33.9 41.8 22.1
m+p Xyl 155.7 798.0 1268.5 464.4 536.4 257.6 307.2 125.0
Styr 25.8 54.6 40.3 32.1 28.9 20.9 14.9 46.5
o-Xyl 41.5 137.5 223.8 62.8 66.0 32.2 37.7 19.9
Phenol 30.4 148.2 204.1 45.0 44.9 17.7 25.1 6.4
o-Cresol 66.8 186.8 330.8 61.5 52.4 14.9 34.6 17.5
m+p Cresol 51.0 206.1 352.7 67.9 62.3 22.6 21.6 6.7
Napht 33.0 147.2 222.8 89.7 154.6 87.5 117.3 63.5
2meNapht 51.8 290.5 487.6 172.2 259.7 123.2 142.6 64.9
1meNapht 29.8 126.5 215.1 67.3 85.0 39.4 40.4 21.2
Sum dimeNapht 84.1 515.2 865.7 250.8 275.0 112.8 104.1 42.1
Tetra-meNapht 12.6 83.0 106.3 44.1 89.4 50.5 61.8 29.2
Sum monoaromatic HC 554.9 2368.7 3301.3 1342.0 1791.0 976.4 1255.9 664.2
Sum diaromatic HC 211.3 1162.4 1897.5 624.0 863.7 413.4 466.2 220.9
Sum phenols 148.2 541.1 887.6 174.4 159.7 55.2 81.3 30.6
Sulphur Compounds (µg/g sample)
Thioph 24.8 75.1 182.6 46.7 35.5 11.3 15.4 6.2
2meThioph 0.0 0.0 0.0 0.0 0.0 0.0 0.0 0.0
3meThioph 11.7 38.5 68.2 13.5 11.0 5.5 5.2 2.2
2,5dimeThioph 0.0 0.0 0.0 0.0 0.0 0.0 0.0 0.0
2,3dimeThioph 6.5 18.8 27.7 6.5 3.0 0.8 0.8 0.2
Sum alkylthiophenes 18.2 57.3 95.9 20.0 13.9 6.3 6.0 2.5
84 Multi-component kinetics and late gas potential of selective Cooper Basin source rocks

Table B2c: Pyrolysis GC aliphatic isoprenoids, aromatic and sulphur-bearing compounds amounts.
Sample G012688 G012689 G012690 G012691 G012692 G012693 G012667 G012668
TOC (%) 87.62 6.90 83.75 8.78 63.99 3.13 77.21 56.67
Amount, mg 12.84 17.61 15.38 14.26 16.78 20.24 2.25 6.15
Aliphatics - Isoprenoids
(µg/g sample)
iC18 0.0 0.0 0.0 0.1 0.0 0.0 38.3 12.9
Prist-1-ene 0.0 0.0 0.0 0.0 0.0 0.0 110.9 82.8
Prist-2-ene 0.0 0.0 0.0 0.0 0.0 0.0 30.1 24.3
Aromatics (µg/g sample)
Benz 121.1 5.7 4.2 43.1 14.9 7.7 378.8 303.7
Tol 108.0 3.4 1.6 24.5 7.3 2.6 1289.0 931.2
et-Benz 5.3 0.6 0.1 1.2 0.7 0.2 212.3 115.7
m+p Xyl 29.8 0.5 0.3 5.5 1.8 0.6 1219.1 454.6
Styr 4.6 9.9 0.4 1.6 0.5 0.0 94.5 61.8
o-Xyl 6.6 0.4 0.1 2.2 1.5 0.3 293.8 158.9
Phenol 1.6 0.8 0.0 4.7 0.9 0.0 958.8 358.6
o-Cresol 0.8 0.5 0.0 0.0 0.0 0.0 984.6 355.6
m+p Cresol 1.0 0.0 0.1 0.3 0.2 0.0 1187.3 300.8
Napht 37.8 0.9 0.6 11.2 3.2 0.7 185.6 128.1
2meNapht 20.0 0.2 0.0 3.3 1.5 0.0 330.7 203.0
1meNapht 7.0 0.2 0.1 1.7 1.2 0.0 215.0 122.5
Sum dimeNapht 7.7 0.4 0.0 2.7 1.8 0.0 752.5 338.0
Tetra-meNapht 12.2 0.0 0.0 0.2 0.0 0.0 89.5 84.1
Sum monoaromatic HC 275.3 20.4 6.7 78.2 26.8 11.3 3487.5 2026.0
Sum diaromatic HC 84.7 1.6 0.7 19.1 7.6 0.7 1573.3 875.7
Sum phenols 3.4 1.3 0.1 5.0 1.1 0.0 3130.7 1015.0
Sulphur Compounds (µg/g sample)
Thioph 0.0 0.0 0.0 0.0 0.0 0.0 311.1 68.5
2meThioph 0.0 0.0 0.0 0.0 0.0 0.0 0.0 0.0
3meThioph 0.3 0.1 0.0 0.0 0.1 0.0 117.0 27.8
2,5dimeThioph 0.0 0.0 0.0 0.0 0.0 0.0 0.0 0.0
2,3dimeThioph 0.0 0.0 0.0 0.0 0.0 0.0 0.0 9.5
Sum alkylthiophenes 0.3 0.1 0.0 0.0 0.1 0.0 117.0 37.3
Table B2c: Pyrolysis GC aliphatic isoprenoids, aromatic and sulphur-bearing compounds amounts (continued).
Sample G012669 G012674 G012675 G012676
TOC (%) 2.32 22.36 68.70 3.98
Multi-component kinetics and late gas potential of selected Cooper Basin source rocks 85
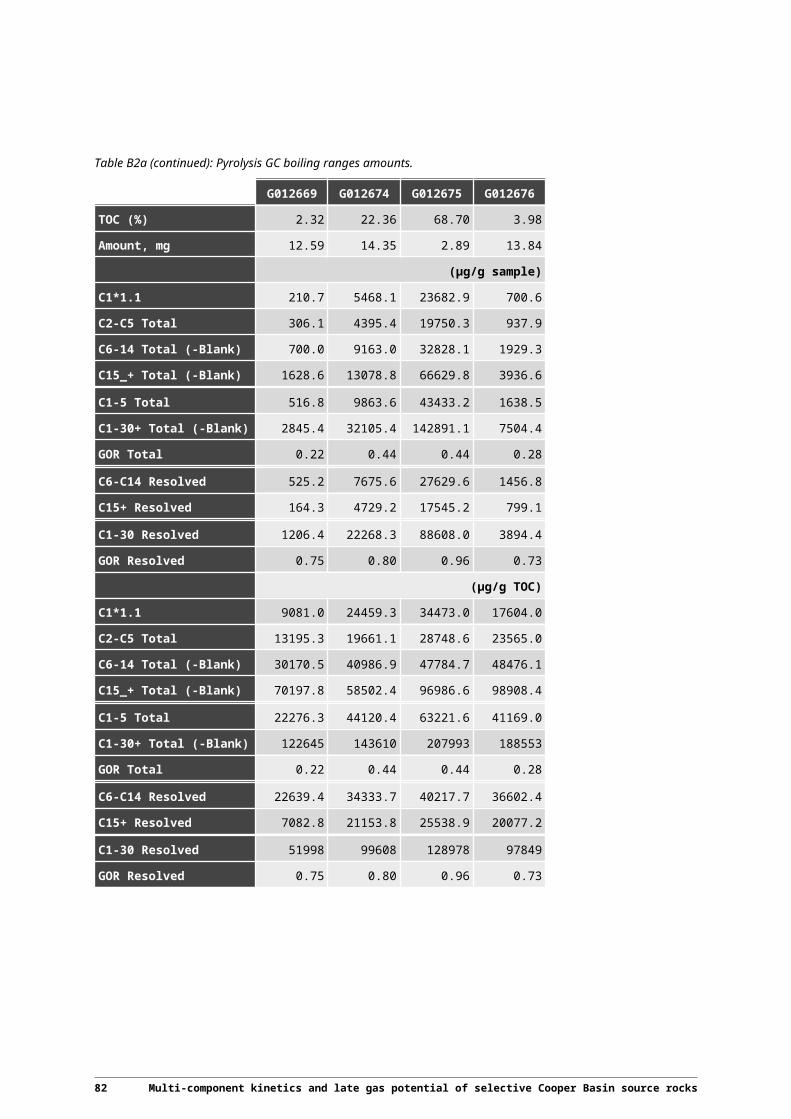
Sample G012669 G012674 G012675 G012676
Amount, mg 12.59 14.35 2.89 13.84
Aliphatics - Isoprenoids (µg/g sample)
iC18 0.3 8.4 25.5 1.2
Prist-1-ene 0.0 20.2 66.2 2.6
Prist-2-ene 0.0 14.6 24.1 2.0
Aromatics (µg/g sample)
Benz 23.5 216.6 344.0 25.9
Tol 37.4 582.7 974.4 63.2
et-Benz 4.5 85.3 195.7 9.8
m+p Xyl 15.9 312.6 927.3 36.9
Styr 6.2 20.2 57.9 9.2
o-Xyl 7.2 99.6 236.1 13.9
Phenol 6.2 322.1 1051.4 20.7
o-Cresol 4.6 243.0 1100.2 30.0
m+p Cresol 2.2 294.3 1514.6 23.9
Napht 8.3 102.7 393.0 10.0
2meNapht 6.9 135.0 342.0 16.5
1meNapht 4.7 84.1 243.7 8.1
Sum dimeNapht 9.5 204.9 856.5 27.9
Tetra-meNapht 2.5 46.3 95.9 6.0
Sum monoaromatic HC 94.7 1316.8 2735.3 159.1
Sum diaromatic HC 31.9 573.0 1931.0 68.5
Sum phenols 13.0 859.4 3666.1 74.7
Sulphur Compounds (µg/g sample)
Thioph 3.0 44.6 350.7 12.2
2meThioph 0.0 0.0 0.0 0.0
3meThioph 1.3 9.6 60.0 2.7
2,5dimeThioph 0.0 0.0 0.0 0.0
2,3dimeThioph 0.3 0.0 17.7 1.3
Sum alkylthiophenes 1.6 9.6 77.7 4.1
86 Multi-component kinetics and late gas potential of selective Cooper Basin source rocks

Table B3: Activation energy distribution and frequency factors of Patchawarra coals using all heating rates (0.7; 2.0; 5.0; 15K/min).
G012670 G012671 G012672 G012673 G012710
10% TR (°C) 128.4 132.9 152.5 150.7 147.5
50% TR (°C) 150.2 158.4 171.9 185.5 167.2
90% TR (°C) 188.1 208.2 218.7 242.6 212.3
A (1/sec) 2.08E+14 3.17E+14 2.79E+15 1.13E+16 1.28E+15
Ea (kcal/mol) (%)
45
46
47 0.17
48 0.23 0.20 0.05
49 0.85 0.33 0.15
50 0.74 0.74 0.08
51 3.18 1.19 0.03 0.52
52 3.36 2.79 0.17 0.60 0.11
53 12.44 4.52 0.27 0.06 1.11
54 22.46 13.01 0.16 0.95 0.29
55 17.55 15.71 0.63 0.71 1.78
56 13.85 14.13 0.50 1.58 1.42
57 6.61 11.12 2.19 1.88 21.75
58 4.89 8.21 18.19 3.10 22.30
59 2.74 5.64 20.63 6.19 11.55
60 2.56 5.45 15.49 9.63 11.41
61 1.43 3.11 10.21 9.75 4.82
62 1.35 3.35 7.01 9.94 5.90
63 1.29 1.13 5.76 8.28 3.44
64 0.29 2.93 4.19 8.06 2.57
65 1.56 0.18 2.53 6.29 2.55
66 1.94 2.45 6.25 1.35
67 0.71 1.37 1.32 4.35 1.41
68 0.66 2.13 4.76 2.10
69 2.46
70 1.09 2.96 2.66 4.61
71 3.34
72 5.00
73 0.27
74 3.48
Multi-component kinetics and late gas potential of selected Cooper Basin source rocks 87

G012670 G012671 G012672 G012673 G012710
75 5.29
76
77
78
79
80
88 Multi-component kinetics and late gas potential of selective Cooper Basin source rocks
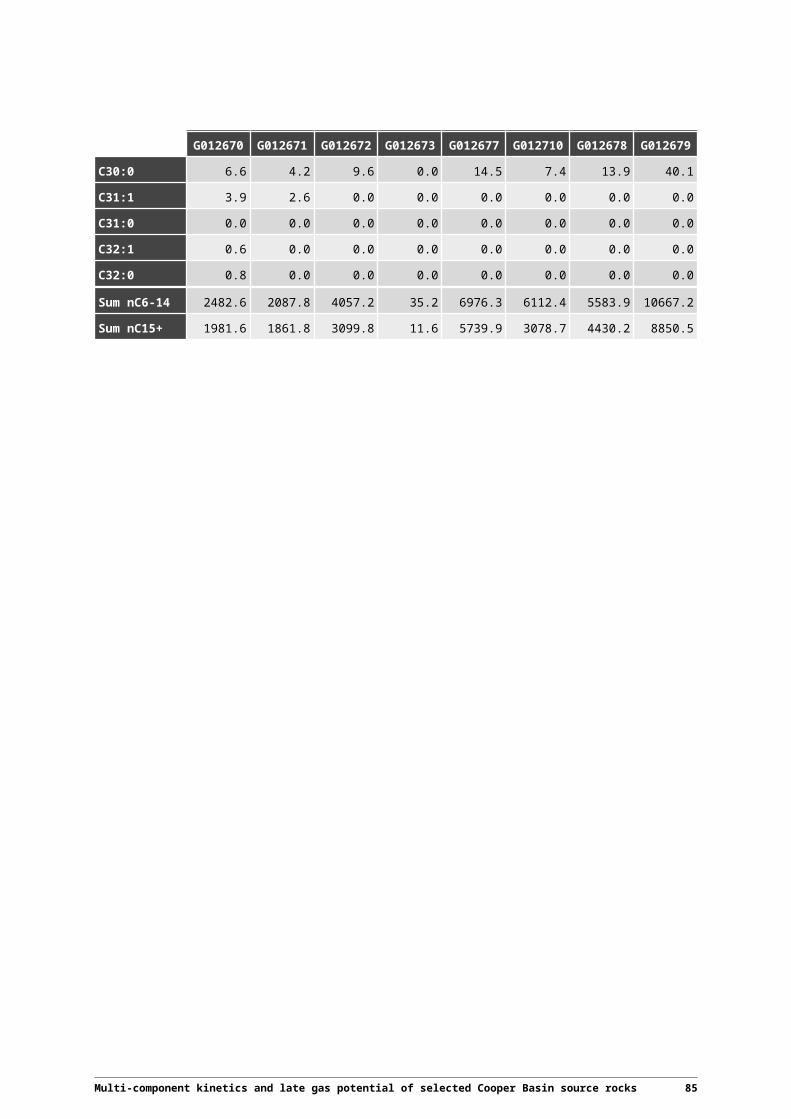
Table B3 (continued): Activation energy distribution and frequency factors of further Cooper Basin shales and coals using all heating rates (0.7; 2.0; 5.0; 15K/min).
G012667 G012668 G012669 G012674 G012675 G012676
10% TR (°C) 145.8 147.3 132.2 146.0 165.9 161.2
50% TR (°C) 167.4 166.1 151.2 168.7 190.7 184.0
90% TR (°C) 212.2 224.5 204.3 234.4 240.7 224.5
A (1/sec) 1.36E+15 1.27E+15 5.43E+13 6.63E+14 1.17E+17 2.31E+17
Ea (kcal/mol) (%)
45
46 0.36
47
48 1.04
49 0.02 0.41
50 0.22 0.04
51 0.12 0.12 0.09
52 0.58 0.41 20.66
53 0.36 0.46 23.42
54 1.38 0.68 13.11 0.55 0.11
55 1.21 0.81 10.67 5.43 0.12 0.14
56 5.65 3.38 4.82 19.87 0.05 0.18
57 19.88 28.29 5.29 13.26 0.29 0.38
58 17.14 16.68 3.57 14.25 0.24 0.39
59 13.88 11.92 3.17 7.52 0.55 0.77
60 9.69 6.86 3.09 6.96 0.53 0.99
61 6.65 5.11 1.76 4.82 0.99 1.39
62 5.39 4.13 2.27 4.08 3.78 2.88
63 4.26 3.62 2.00 4.11 11.09 8.16
64 2.90 3.05 2.07 13.51 16.50
65 2.25 2.31 3.04 4.11 13.55 16.66
66 1.36 2.39 0.76 11.13 13.64
67 2.13 1.65 4.85 9.01 10.05
68 0.03 1.59 0.56 6.80 6.73
69 2.40 1.62 3.37 6.24 4.68
70 1.06 4.01 3.84
71 1.42 4.47 2.28
72 2.50 4.61 1.43 2.96
73 2.44 3.74 0.81
74 0.32 1.82
Multi-component kinetics and late gas potential of selected Cooper Basin source rocks 89

G012667 G012668 G012669 G012674 G012675 G012676
75 2.25 1.64
76 2.02
77
78 3.01
79 3.88
80
Table B4: MSSV-yields: individual, resolved, total compounds for sample G012667ex.
Sample G012667extr
Heated to, °C 380.8 406.4 423.8 445.2 491.4
Weight, mg 2.80 2.62 2.54 2.28 2.10
Resolved (µg/g)
C1 16496.5 54260.8 110521.7 229725.1 633425.0
C2 12595.9 35275.3 79040.3 148382.2 362479.3
C3 9721.1 31185.3 62870.6 120133.3 269108.6
i-C4 1852.9 4277.7 8700.3 17003.1 38577.9
n-C4 15526.5 22452.9 36478.4 60739.5 109946.2
i-C5 3883.3 9734.6 16564.5 33290.7 34040.6
n-C5 3720.4 10167.1 18590.8 39927.5 43034.9
R06 6870.4 19379.0 36809.8 65885.5 39936.5
R07 9880.7 25400.0 45856.1 77943.8 51370.4
R08 13055.2 32620.2 56307.0 89527.6 82968.4
R09 11696.6 30351.2 51472.2 83000.0 84086.0
R10 8750.3 25681.8 46451.0 78153.8 78577.1
R11 9035.9 31821.6 61388.2 101655.4 78993.3
R12 8911.7 31646.3 61608.2 93376.6 53429.4
R13 7587.1 24625.3 45063.3 62291.6 35633.3
R14 4413.8 14919.1 26581.2 35222.0 14009.7
R15 4498.5 13792.3 24280.4 32458.5 19592.8
R16 4486.9 14488.7 24710.1 31149.1 13024.1
R17 2435.3 10450.0 17784.1 21815.0 7383.8
R18 3018.9 10888.7 18663.4 19811.3 6639.7
R19 2043.6 9125.5 15085.6 16696.7 5687.4
R20 2147.2 8336.8 13721.2 12535.8 2720.2
R21 2475.6 9249.4 13986.3 11614.2 2545.8
R22 2021.7 7410.8 10989.9 8298.6 1369.5
R23 1895.6 6698.8 9689.0 6595.6 1066.6
90 Multi-component kinetics and late gas potential of selective Cooper Basin source rocks

Sample G012667extr
R24 1070.6 5241.6 7100.9 4263.4 497.0
R25 633.1 3764.2 5224.2 2746.6 163.5
R26 376.0 2692.1 3760.2 1705.4 88.5
R27 205.1 1965.4 2835.9 951.6 47.6
R28 102.1 1290.6 2096.2 559.2 0.0
R29 131.0 861.3 1290.9 340.8 0.0
R30-32 683.5 1769.7 1598.0 373.8 0.0
Multi-component kinetics and late gas potential of selected Cooper Basin source rocks 91

Table B4: MSSV-yields: individual, resolved, total compounds for sample G012667ex.
Sample G012667extr
Totals (µg/g)
T06 -Blank 8703.5 21938.7
40096.3 70648.1 44549.8
T07 -Blank 11678.0 28791.1
50084.5 82989.9 54474.3
T08 -Blank 16120.7 35987.2
60477.4 94421.7 85659.6
T09 -Blank 15889.4 35895.4
60416.5 92045.9 87592.7
T10 -Blank 13875.9 33735.1
58999.4 88921.1 82444.7
T11 -Blank 14723.6 40670.5
74369.1 113377.1 84543.6
T12 -Blank 15231.9 42940.0
77584.3 110469.6 61074.9
T13 -Blank 14446.1 37750.0
65177.2 84969.3 43049.0
T14 -Blank 12328.0 32047.2
52638.7 60681.1 20306.9
T15 -Blank 12656.9 33268.1
53790.2 60211.9 26167.9
T16 -Blank 12470.7 32944.5
51250.0 52692.8 18777.0
T17 -Blank 9969.1 27769.3
42852.4 39702.6 11792.1
T18 -Blank 9955.4 28582.0
42859.4 37860.3 10008.4
T19 -Blank 8736.8 25897.4
38643.1 31768.5 10092.2
T20 -Blank 8587.7 25497.3
36854.5 29173.6 6484.8
T21 -Blank 8424.3 24486.0
34859.1 25954.0 5632.5
T22 -Blank 7718.2 21766.9
29805.0 20526.4 4308.3
T23 -Blank 6989.7 19763.3
26121.3 17129.3 2734.2
T24 -Blank 5694.0 17491.0
22528.1 13050.5 3097.0
T25 -Blank 4587.4 14469.8
17993.4 9875.5 1747.0
T26 -Blank 3809.0 12597.5
14547.7 7981.4 1442.4
T27 -Blank 3241.6 10576. 11240.0 5638.7 1218.9
92 Multi-component kinetics and late gas potential of selective Cooper Basin source rocks

Sample G012667extr
1
T28 -Blank 2857.5 8895.0 9019.1 3960.5 885.9
T29 -Blank 2852.6 7557.8 7694.9 2822.1 981.1
T30-32 -Blank
8769.6 17668.9
14143.4 3833.1 3394.7
Multi-component kinetics and late gas potential of selected Cooper Basin source rocks 93

Table B4 (continued): MSSV-yields: individual, resolved, total compounds for sample G012669ker.
Sample G012669ker
Heated to, °C 378.3 401.9 417.9 439.0 494.8
Weight, mg 6.99 6.68 6.21 6.65 6.04
Resolved (µg/g)
C1 5108.7 12528.0 23327.0 44485.2 274632.3
C2 3619.8 9639.9 19960.4 30394.8 104710.7
C3 3582.5 9794.9 16996.6 25391.1 56050.4
i-C4 979.2 2125.7 3295.5 2888.5 8848.9
n-C4 2656.2 5315.5 9416.0 13159.9 16921.4
i-C5 2185.4 3784.4 5982.5 7012.7 3473.2
n-C5 1747.1 4182.8 7376.4 8658.6 4153.0
R06 3106.8 7028.8 12031.8 13290.6 2581.6
R07 5540.3 10948.0 17596.9 12645.3 18759.1
R08 7457.9 16289.7 25473.3 14981.0 50434.5
R09 7029.9 14472.0 21758.5 13192.3 30036.0
R10 4815.3 10587.4 16150.8 12316.1 17428.7
R11 3983.3 9493.7 14113.1 13955.4 6840.5
R12 3864.1 8060.0 12167.7 11228.3 8501.0
R13 3160.8 6681.9 9883.5 6931.5 8366.1
R14 2076.1 4269.9 5872.5 3361.3 2437.1
R15 2937.6 6047.8 8401.4 3646.4 6022.6
R16 3305.3 4338.1 5476.5 3269.1 1700.8
R17 1163.8 2285.5 3487.0 1783.5 1865.2
R18 1348.5 2441.1 3516.8 1659.1 2947.2
R19 795.2 1508.5 2365.8 1548.2 1357.2
R20 800.3 1493.6 2253.6 846.7 599.3
R21 622.9 1256.8 1901.2 840.4 573.5
R22 418.6 810.5 1245.7 388.6 721.4
R23 409.8 808.3 1320.1 362.5 257.8
R24 165.5 389.1 662.2 155.3 63.5
R25 126.8 332.8 536.5 83.9 21.6
R26 76.4 139.8 302.6 35.9 0.0
R27 34.5 78.0 172.4 0.0 0.0
R28 41.0 61.4 130.2 0.0 0.0
R29 41.5 68.1 126.4 0.0 0.0
R30-32 57.2 136.5 92.4 0.0 0.0
94 Multi-component kinetics and late gas potential of selective Cooper Basin source rocks

Table B4 (continued): MSSV-yields: individual, resolved, total compounds for sample G012669ker.
Sample G012669ker
Totals (µg/g)
T06 -Blank 3653.0 7758.6 13089.9 14549.9 2967.1
T07 -Blank 6206.8 12062.5 18657.5 13975.9 19318.4
T08 -Blank 8497.3 17423.0 26690.9 15984.6 51244.1
T09 -Blank 8267.8 16145.2 23533.5 14638.7 31111.1
T10 -Blank 6382.0 12680.3 18743.0 14037.3 18476.5
T11 -Blank 5642.9 11701.6 17137.3 15847.1 7852.6
T12 -Blank 5749.1 10968.9 15677.6 13911.9 9369.2
T13 -Blank 5246.4 10015.3 14133.5 10041.8 9142.5
T14 -Blank 4285.2 7670.0 10443.5 6256.2 3215.0
T15 -Blank 5190.2 9555.7 13116.2 6541.9 6923.5
T16 -Blank 5574.4 8017.9 10092.8 5814.4 2617.3
T17 -Blank 3243.2 5448.8 7675.5 4044.7 2686.7
T18 -Blank 3339.0 5524.1 7640.8 3857.0 3697.5
T19 -Blank 2683.9 4495.7 6360.1 3425.7 2169.8
T20 -Blank 2653.1 4418.3 6288.6 2656.4 1408.2
T21 -Blank 2373.7 3856.4 5537.4 2566.0 1306.4
T22 -Blank 2057.8 3208.2 4611.4 2027.1 1454.0
T23 -Blank 1859.4 2899.5 4334.1 1824.8 913.0
T24 -Blank 1432.2 2178.0 3269.3 1417.0 559.1
T25 -Blank 1217.2 1763.3 2747.8 1198.1 528.8
T26 -Blank 1002.3 1410.6 2285.8 983.0 415.4
T27 -Blank 835.0 1084.2 1865.9 983.8 341.5
T28 -Blank 739.8 842.9 1554.3 915.2 265.0
T29 -Blank 761.0 807.5 1609.6 999.8 320.7
T30-32 -Blank 2299.7 1854.2 3820.4 3454.5 1331.9
Multi-component kinetics and late gas potential of selected Cooper Basin source rocks 95

Table B4 (continued): MSSV-yields: individual, resolved, total compounds for sample G012670ex.
Sample G012670extr
Heated to, °C 365.4 391.9 408.7 426.6 465.7
Weight, mg 3.48 3.24 2.67 2.35 2.26
Resolved (µg/g)
C1 5738.3 14854.9 26510.2 45625.8 159786.6
C2 3477.3 9246.9 19480.6 34326.3 119649.2
C3 2958.1 9318.3 17633.2 31680.1 83911.9
i-C4 497.5 989.8 1804.1 3484.7 15212.0
n-C4 7942.1 8372.8 12488.1 18002.7 46112.6
i-C5 2261.7 4402.9 6655.7 11635.6 20372.3
n-C5 1278.3 3812.4 7711.7 13726.3 34568.7
R06 2773.1 7493.4 13949.6 22984.0 48576.8
R07 3458.1 8762.2 16271.6 27724.2 68183.6
R08 3972.5 10637.8 19261.8 31134.4 106008.0
R09 3508.1 9776.3 17242.8 26873.0 88532.6
R10 3810.9 10564.0 18110.0 26729.9 63861.0
R11 3650.6 11128.8 20218.1 31325.1 53764.5
R12 3400.1 10319.8 19054.5 29388.6 42621.4
R13 2583.5 7981.3 14236.1 21377.3 34859.3
R14 1762.2 5313.1 9574.8 13522.4 18446.6
R15 1734.8 4810.4 8263.8 12338.0 28005.1
R16 2411.7 5690.6 9775.9 13352.4 16375.0
R17 1101.8 3130.6 5843.0 8621.6 10489.4
R18 1527.7 3823.7 6752.5 8765.5 10170.7
R19 755.4 2475.1 5192.6 6732.3 6511.0
R20 937.1 2642.2 4814.5 6207.1 5610.1
R21 886.2 2675.4 4617.8 6128.2 3956.2
R22 654.9 2046.1 3739.2 4475.6 1903.6
R23 676.8 1999.1 3675.1 4066.1 1659.3
R24 361.1 1255.2 2525.2 2759.9 688.0
R25 281.1 1102.8 2055.2 2154.9 420.3
R26 151.1 718.4 1470.5 1475.2 142.9
R27 125.9 538.0 1122.4 1064.4 70.9
R28 82.8 327.7 675.2 603.0 44.4
R29 82.2 196.6 525.5 337.6 0.0
R30-32 511.7 899.9 1229.8 764.8 0.0
96 Multi-component kinetics and late gas potential of selective Cooper Basin source rocks

Multi-component kinetics and late gas potential of selected Cooper Basin source rocks 97

Table B4 (continued): MSSV-yields: individual, resolved, total compounds for sample G012670ex.
Sample G012670extr
Totals (µg/g)
T06 -Blank 3677.0 8844.3 15858.2 26143.0 50667.0
T07 -Blank 4131.2 10453.7 18799.7 29668.6 70815.6
T08 -Blank 5099.8 12518.7 22153.4 34035.2 108743.2
T09 -Blank 5006.6 12071.6 21608.9 32766.8 91867.3
T10 -Blank 5796.5 13585.5 23923.9 34255.0 69830.9
T11 -Blank 5938.7 14589.8 26909.2 39498.5 60385.1
T12 -Blank 5887.5 14724.6 27139.8 39308.4 52233.2
T13 -Blank 5597.5 13255.4 24032.7 33867.6 45814.6
T14 -Blank 5382.7 12222.7 21512.2 28082.3 29036.8
T15 -Blank 5584.0 12627.0 21908.7 28349.7 38786.1
T16 -Blank 6173.3 13159.4 22209.9 28164.9 26534.2
T17 -Blank 4405.4 10216.1 17769.7 22407.3 19260.0
T18 -Blank 4502.6 10532.6 17954.5 22280.3 18600.4
T19 -Blank 3670.6 8997.4 15581.5 19018.5 14312.9
T20 -Blank 3639.0 8967.2 15474.0 18604.0 13305.2
T21 -Blank 3377.2 8332.1 14302.8 17120.1 10596.5
T22 -Blank 2961.7 7331.1 12580.4 14475.2 7728.6
T23 -Blank 2737.0 6729.3 12006.1 13028.4 6487.9
T24 -Blank 2264.1 5518.3 10042.7 10661.3 4577.6
T25 -Blank 2010.9 4979.0 9023.4 9125.8 3604.3
T26 -Blank 1868.9 4361.8 7381.3 7706.8 2929.4
T27 -Blank 1796.3 3913.5 6259.6 6440.2 2669.9
T28 -Blank 1770.1 3375.8 5242.0 5322.9 2413.3
T29 -Blank 1985.6 3161.2 4494.0 4670.9 2686.5
T30-32 -Blank 7076.2 8776.7 10030.1 11660.1 9161.0
98 Multi-component kinetics and late gas potential of selective Cooper Basin source rocks

Table B4 (continued): MSSV-yields: individual, resolved, total compounds for sample G012674ex.
Sample G012674extr
Heated to, °C 387.1 411.2 431.8 461.6 530.3
Weight, mg 16.48 16.57 15.91 15.55 13.14
Resolved (µg/g)
C1 4780.4 14944.3 27292.3 61875.9 236729.9
C2 2930.3 9243.1 17476.0 33154.3 56279.9
C3 2537.4 7617.6 12482.8 21315.4 18387.2
i-C4 513.6 1485.3 2343.4 3468.5 2094.2
n-C4 1858.4 3595.0 5904.2 9659.2 2270.3
i-C5 995.5 2552.1 3454.4 3812.5 526.7
n-C5 908.0 2469.8 4453.9 6171.3 334.4
R06 1756.0 4543.2 6441.8 7369.3 345.4
R07 2211.4 5815.6 8075.9 9145.9 12100.4
R08 3036.5 8057.4 11255.3 14574.2 22564.5
R09 2516.0 6897.2 9837.0 12836.3 10198.6
R10 2443.9 7082.1 10522.3 13643.0 7358.8
R11 2692.7 8253.8 12313.0 13726.0 1547.9
R12 2304.1 6841.3 9828.7 8949.0 4880.5
R13 1848.9 5029.6 6712.4 5928.6 2750.9
R14 1015.5 2733.7 3414.5 2518.8 841.8
R15 1091.8 2903.8 3735.0 3291.4 750.1
R16 1002.2 2751.1 3376.2 2514.4 1086.7
R17 619.8 2032.6 2329.5 1793.8 537.7
R18 718.4 2010.3 2269.0 1660.2 1114.1
R19 435.7 1484.5 1645.5 1345.7 246.5
R20 451.7 1393.9 1448.6 748.1 148.2
R21 417.0 1284.2 1354.3 743.5 132.4
R22 312.6 910.8 885.7 432.6 250.7
R23 281.1 858.5 761.6 436.5 52.1
R24 145.9 563.6 438.4 192.6 35.8
R25 102.1 415.3 290.5 118.5 36.5
R26 43.7 263.7 167.0 29.4 0.0
R27 25.3 168.8 94.9 6.8 0.0
R28 16.4 124.1 62.8 5.5 0.0
R29 17.6 70.2 34.7 7.7 0.0
R30-32 119.0 173.9 55.9 0.0 0.0
Multi-component kinetics and late gas potential of selected Cooper Basin source rocks 99
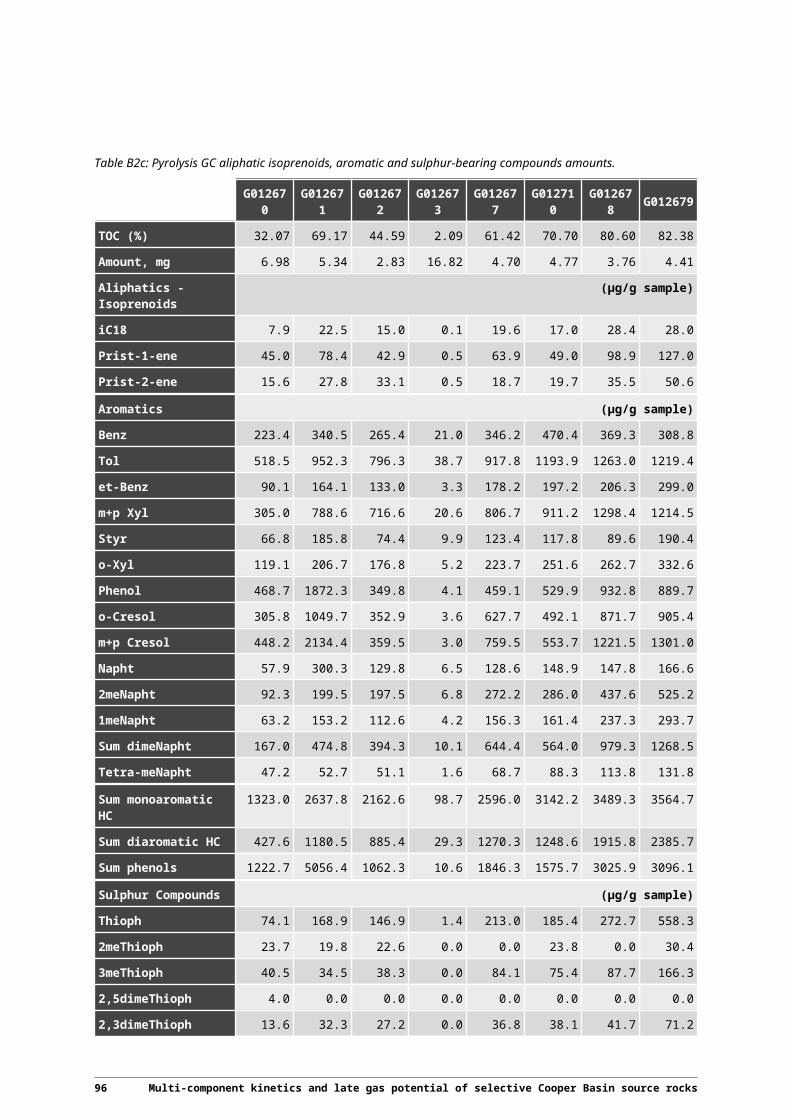
100 Multi-component kinetics and late gas potential of selective Cooper Basin source rocks

Table B4 (continued): MSSV-yields: individual, resolved, total compounds for sample G012674ex.
Sample G012674extr
Totals (µg/g)
T06 -Blank 1949.5 4875.8 6944.7 7728.2 413.4
T07 -Blank 2526.5 6304.9 8656.6 9407.5 12116.2
T08 -Blank 3355.7 8650.8 11863.9 15093.8 22576.1
T09 -Blank 2891.9 7746.2 10781.0 13558.6 10255.3
T10 -Blank 3046.0 8495.0 11754.1 14649.8 7434.4
T11 -Blank 3447.5 9975.4 13916.5 15015.5 1607.0
T12 -Blank 3148.4 8789.2 11862.5 10581.4 4915.9
T13 -Blank 2844.0 7322.1 9141.9 7655.0 2832.3
T14 -Blank 2149.0 5306.1 6065.2 4062.2 907.8
T15 -Blank 2236.5 5582.2 6272.9 4723.0 795.8
T16 -Blank 2120.5 5183.6 5500.4 3769.2 1149.4
T17 -Blank 1647.5 4282.4 4468.4 2994.2 578.5
T18 -Blank 1610.6 4226.5 4306.4 2864.6 1119.5
T19 -Blank 1291.8 3587.0 3609.0 2449.2 248.4
T20 -Blank 1332.8 3518.8 3335.4 1797.4 151.0
T21 -Blank 1205.5 3179.9 2892.6 1634.7 132.4
T22 -Blank 1061.0 2671.9 2202.3 1245.9 250.7
T23 -Blank 953.2 2442.4 1849.4 1144.7 52.1
T24 -Blank 719.9 1953.2 1307.3 785.7 68.0
T25 -Blank 607.2 1637.8 984.7 638.2 102.2
T26 -Blank 489.9 1338.7 744.7 510.1 81.0
T27 -Blank 410.4 1084.1 493.9 431.4 54.0
T28 -Blank 362.6 906.6 385.6 363.0 61.5
T29 -Blank 362.2 824.3 360.7 399.4 76.5
T30-32 -Blank 1171.2 2168.0 787.2 1259.9 213.4
Multi-component kinetics and late gas potential of selected Cooper Basin source rocks 101

Table B4 (continued): MSSV-yields: individual, resolved, total compounds for sample G012675ex.
Sample G012675extr
Heated to, °C 397.8 421.1 440.0 465.4 518.8
Weight, mg 3.37 3.35 3.16 2.59 2.02
Resolved (µg/g)
C1 177.2 74246.3 160110.7 327570.1 830283.4
C2 1487.2 54257.3 103449.3 184410.0 296512.3
C3 1821.0 41407.8 71271.2 118686.2 155718.7
i-C4 90.6 5661.4 10010.6 17082.7 22588.8
n-C4 904.4 19350.6 31857.8 47588.8 32116.9
i-C5 507.4 10857.6 17198.6 22799.4 9297.5
n-C5 458.3 9276.5 16415.1 24939.5 9329.6
R06 855.8 18262.5 29618.8 39736.9 8051.2
R07 1186.1 24523.2 36476.0 46402.6 21172.0
R08 1389.3 25669.5 39285.7 50986.2 51757.8
R09 1341.8 22684.9 34829.3 47749.5 48602.3
R10 1305.9 22775.0 39148.0 56949.7 56650.6
R11 1496.3 33169.0 59285.5 82794.2 39163.2
R12 1654.2 34555.0 58824.2 73505.5 22964.6
R13 1544.9 23948.0 37914.3 42197.7 18106.8
R14 907.5 12858.4 19766.6 19040.8 5974.5
R15 1167.4 11523.8 17944.9 19521.0 8772.7
R16 1137.9 10238.5 15631.9 15643.0 5492.5
R17 698.0 7627.9 11719.6 10042.1 4380.8
R18 834.8 7732.9 11120.3 8568.7 5385.4
R19 654.2 5408.3 8376.7 6696.9 3290.0
R20 519.2 4648.9 6303.5 4515.0 1627.6
R21 428.3 5018.6 6326.7 4131.3 1407.9
R22 240.0 3528.8 4310.4 2204.5 1134.4
R23 243.3 3154.6 3619.8 1756.8 731.9
R24 118.0 2359.8 2641.5 1060.6 324.0
R25 90.8 1751.4 1732.4 756.8 149.2
R26 0.0 1085.0 1200.2 398.9 51.4
R27 0.0 778.2 683.2 125.4 0.0
R28 0.0 385.5 418.0 82.8 0.0
R29 0.0 240.6 226.7 88.1 0.0
R30-32 0.0 563.1 482.6 0.0 0.0
102 Multi-component kinetics and late gas potential of selective Cooper Basin source rocks

Multi-component kinetics and late gas potential of selected Cooper Basin source rocks 103

Table B4 (continued): MSSV-yields: individual, resolved, total compounds for sample G012675ex.
Sample G012675extr
Totals (µg/g)
T06 -Blank 1083.3 20246.7 32053.9 42379.2 9522.7
T07 -Blank 1389.1 26484.4 40032.1 49748.4 23046.6
T08 -Blank 1934.7 28372.0 42575.4 53916.7 54556.9
T09 -Blank 2180.4 27394.9 41485.1 52686.5 52535.4
T10 -Blank 2407.2 29772.2 47338.5 63430.0 61275.4
T11 -Blank 2969.0 40698.2 68309.6 90955.6 44944.9
T12 -Blank 3467.5 44164.5 71042.5 85233.6 28992.4
T13 -Blank 3642.0 35957.8 53265.1 57009.5 23610.8
T14 -Blank 3335.7 26893.0 36752.9 33813.8 11547.3
T15 -Blank 3675.4 27819.6 37867.7 34098.7 14393.9
T16 -Blank 3713.9 25092.7 33204.2 28045.8 10924.4
T17 -Blank 3168.7 20593.9 27270.6 20759.3 9496.3
T18 -Blank 3068.5 20279.9 27016.1 19468.9 10233.8
T19 -Blank 2756.4 17072.0 23020.2 15872.1 7993.0
T20 -Blank 2613.6 15753.7 21268.2 13524.6 6623.0
T21 -Blank 2407.7 14653.1 19543.5 11626.7 5826.8
T22 -Blank 2085.9 12228.8 16396.4 8561.7 5421.6
T23 -Blank 1876.5 10812.1 14826.2 7420.0 5037.5
T24 -Blank 1597.6 9095.1 12796.3 5906.9 4000.9
T25 -Blank 1428.5 7454.2 11066.4 4783.6 3697.5
T26 -Blank 1232.6 6200.3 9535.8 4104.5 4010.7
T27 -Blank 987.6 4804.1 7813.1 3292.9 3417.0
T28 -Blank 687.6 3692.7 6765.6 2763.1 3441.5
T29 -Blank 684.3 3011.3 5936.4 2563.8 3879.9
T30-32 -Blank 2223.6 6372.6 15103.9 7536.7 13686.3
104 Multi-component kinetics and late gas potential of selective Cooper Basin source rocks

Table B4 (continued): MSSV-yields: individual, resolved, total compounds for sample G012710ex.
Sample G012710extr
Heated to, °C 384.5 408.9 425.0 445.5 493.5
Weight, mg 4.21 4.13 4.18 4.16 3.85
Resolved (µg/g)
C1 338.0 972.9 2222.7 4730.1 14734.6
C2 270.0 880.8 2106.9 4308.1 11290.1
C3 299.7 871.3 1949.9 3774.8 9680.6
i-C4 27.1 92.4 257.5 500.6 1314.2
n-C4 129.3 398.3 977.2 2010.1 4299.2
i-C5 116.8 201.7 400.9 691.1 798.4
n-C5 94.0 296.9 729.0 1463.4 1663.1
R06 312.4 735.4 1521.1 2543.7 1363.8
R07 476.1 1044.8 2038.0 3137.0 2124.8
R08 746.2 1444.2 2635.2 3724.4 3316.3
R09 652.4 1303.6 2419.1 3428.0 3371.9
R10 469.4 1139.9 2210.1 3115.5 3499.1
R11 459.2 1276.4 2574.6 3693.1 3482.8
R12 394.6 1183.0 2496.3 3626.1 2457.4
R13 389.8 1039.2 2226.4 3191.2 1979.3
R14 255.3 742.3 1485.9 1822.8 809.0
R15 333.0 899.2 1405.1 1702.6 1279.8
R16 348.1 670.8 1063.7 1221.1 675.2
R17 200.0 396.7 722.8 779.4 501.1
R18 198.6 424.5 700.7 713.7 465.3
R19 157.3 330.5 596.9 656.8 419.2
R20 159.2 280.3 502.8 465.9 348.7
R21 106.7 182.9 345.9 331.5 256.5
R22 87.7 155.4 265.5 237.0 111.2
R23 71.5 131.5 222.8 188.2 111.5
R24 65.5 122.1 221.4 175.9 92.8
R25 52.6 91.5 157.4 131.2 70.9
R26 38.6 68.9 124.1 105.3 57.6
R27 28.1 44.7 86.0 53.0 29.3
R28 25.6 39.0 73.8 50.4 31.2
R29 35.7 51.9 93.8 53.1 42.0
R30-32 76.2 84.2 160.7 97.7 76.2
Multi-component kinetics and late gas potential of selected Cooper Basin source rocks 105

106 Multi-component kinetics and late gas potential of selective Cooper Basin source rocks

Table B4 (continued): MSSV-yields: individual, resolved, total compounds for sample G012710ex.
Sample G012710extr
Totals (µg/g)
T06 -Blank 325.9 750.4 1538.8 2559.4 1375.8
T07 -Blank 523.3 1096.0 2098.5 3188.1 2160.5
T08 -Blank 855.3 1563.7 2782.7 3854.2 3395.0
T09 -Blank 814.0 1506.5 2703.0 3722.9 3491.7
T10 -Blank 656.7 1413.0 2626.3 3595.8 3665.0
T11 -Blank 670.4 1615.0 3152.1 4382.8 3718.2
T12 -Blank 615.9 1587.6 3240.4 4468.2 2743.0
T13 -Blank 641.8 1582.1 3280.8 4306.8 2261.9
T14 -Blank 523.7 1437.0 2760.4 3220.2 1061.0
T15 -Blank 672.5 1650.3 2848.2 2892.7 1543.1
T16 -Blank 705.9 1392.0 2119.0 2184.6 913.1
T17 -Blank 585.8 1064.9 1786.9 1751.4 728.2
T18 -Blank 531.1 1033.5 1612.5 1596.3 719.0
T19 -Blank 446.2 882.3 1404.3 1349.3 672.2
T20 -Blank 478.0 855.1 1269.1 1120.1 583.6
T21 -Blank 387.9 684.2 1072.7 947.3 485.6
T22 -Blank 286.5 538.9 916.5 731.9 287.9
T23 -Blank 250.0 484.8 795.2 599.7 264.3
T24 -Blank 223.7 433.5 784.2 523.0 215.0
T25 -Blank 217.5 394.5 648.6 454.0 190.2
T26 -Blank 185.8 352.0 603.7 428.9 178.1
T27 -Blank 171.0 322.8 565.5 325.1 144.9
T28 -Blank 164.2 295.6 469.2 307.9 138.7
T29 -Blank 183.0 295.9 517.1 289.8 159.6
T30-32 -Blank 385.0 601.1 1063.4 577.6 313.1
Multi-component kinetics and late gas potential of selected Cooper Basin source rocks 107

Table B5: Molar compositions (Mol%) of final corrected fluids.
G012670ex TR G012710ex TR
Mol% 10 30 50 70 90 10 30 50 70 90
n-C1 45.45 42.16 42.55 44.96 53.41 28.55 32.94 36.39 44.11 69.01
n-C2 8.05 10.00 11.15 11.41 12.89 8.99 10.60 11.31 12.07 10.35
n-C3 4.67 6.87 6.88 7.18 6.17 6.81 7.15 7.14 7.21 6.05
i-C4 0.60 0.55 0.53 0.60 0.85 0.47 0.57 0.72 0.73 0.62
n-C4 9.52 4.68 3.70 3.10 2.57 2.23 2.48 2.71 2.91 2.04
i-C5 2.18 1.98 1.59 1.61 0.91 1.62 1.01 0.90 0.81 0.31
n-C5 1.23 1.72 1.84 1.90 1.55 1.31 1.49 1.63 1.71 0.64
n-C6 3.34 3.66 3.74 3.70 2.66 4.54 4.09 3.94 3.66 0.91
C7-15 15.09 17.40 17.67 16.25 12.67 28.67 24.90 22.23 18.14 6.50
C16-25 6.35 7.16 6.93 6.27 4.46 11.25 9.85 8.72 6.19 2.44
C26-35 2.27 2.49 2.30 2.04 1.31 3.73 3.29 2.89 1.76 0.77
C36-45 0.81 0.87 0.76 0.66 0.39 1.23 1.10 0.96 0.50 0.24
C46-55 0.29 0.30 0.25 0.22 0.11 0.41 0.37 0.32 0.14 0.08
C56-80 0.15 0.15 0.12 0.10 0.05 0.19 0.17 0.15 0.05 0.03
108 Multi-component kinetics and late gas potential of selective Cooper Basin source rocks

Table B5: Molar compositions (Mol%) of final corrected fluids (continued).
G012667ex TR G012669ker TR
Mol% 10 30 50 70 90 10 30 50 70 90
n-C1 46.71 45.79 48.65 54.71 78.82 36.85 40.01 43.66 60.98 81.30
n-C2 10.40 11.67 12.71 12.05 7.86 9.31 10.32 11.75 11.09 8.66
n-C3 5.47 7.04 6.90 6.65 3.98 6.28 7.15 6.82 6.32 3.16
i-C4 0.79 0.73 0.72 0.71 0.43 1.30 1.18 1.00 0.55 0.38
n-C4 6.63 3.84 3.04 2.55 1.23 3.53 2.94 2.87 2.48 0.72
i-C5 1.34 1.34 1.11 1.13 0.31 2.34 1.69 1.47 1.07 0.12
n-C5 1.28 1.40 1.25 1.35 0.39 1.87 1.87 1.81 1.32 0.14
n-C6 2.97 2.87 2.77 2.65 0.75 3.70 3.62 3.55 2.83 0.13
C7-15 15.68 15.52 14.68 12.74 4.52 22.68 20.94 17.31 8.75 3.60
C16-25 5.95 6.39 5.57 4.02 1.30 8.37 7.29 6.62 3.20 1.25
C26-35 1.90 2.23 1.78 1.05 0.31 2.60 2.12 2.13 0.98 0.37
C36-45 0.61 0.78 0.57 0.28 0.07 0.81 0.62 0.69 0.30 0.11
C46-55 0.19 0.27 0.18 0.07 0.02 0.25 0.18 0.22 0.09 0.03
C56-80 0.09 0.13 0.08 0.03 0.01 0.11 0.07 0.10 0.04 0.01
Multi-component kinetics and late gas potential of selected Cooper Basin source rocks 109

Table B5: Molar compositions (Mol%) of final corrected fluids (continued).
G012674ex TR G012675ex TR
Mol% 10 30 50 70 90 10 30 50 70 90
n-C1 47.59 49.17 55.05 67.52 87.31 30.72 55.30 59.65 68.52 86.69
n-C2 11.33 12.41 12.74 11.52 7.52 8.88 12.82 13.03 11.50 6.66
n-C3 6.69 6.97 6.21 5.05 1.68 7.41 6.67 6.12 5.05 2.39
i-C4 1.03 1.03 0.88 0.62 0.14 0.28 0.69 0.65 0.55 0.26
n-C4 3.72 2.50 2.23 1.74 0.16 2.79 2.37 2.08 1.54 0.37
i-C5 1.60 1.43 1.05 0.55 0.03 1.26 1.07 0.90 0.59 0.09
n-C5 1.46 1.38 1.35 0.89 0.02 1.14 0.91 0.86 0.65 0.09
n-C6 3.06 2.68 2.25 1.38 0.02 4.19 2.23 1.88 1.40 0.14
C7-15 15.12 14.41 12.78 7.27 1.76 27.19 11.86 9.35 6.98 2.00
C16-25 5.73 5.47 4.03 2.48 0.82 10.76 4.26 3.67 2.33 0.84
C26-35 1.83 1.74 1.06 0.71 0.33 3.59 1.28 1.22 0.65 0.30
C36-45 0.58 0.56 0.28 0.20 0.13 1.20 0.39 0.40 0.18 0.11
C46-55 0.19 0.18 0.07 0.06 0.05 0.40 0.12 0.13 0.05 0.04
C56-80 0.08 0.08 0.03 0.02 0.03 0.19 0.05 0.06 0.02 0.02
110 Multi-component kinetics and late gas potential of selective Cooper Basin source rocks
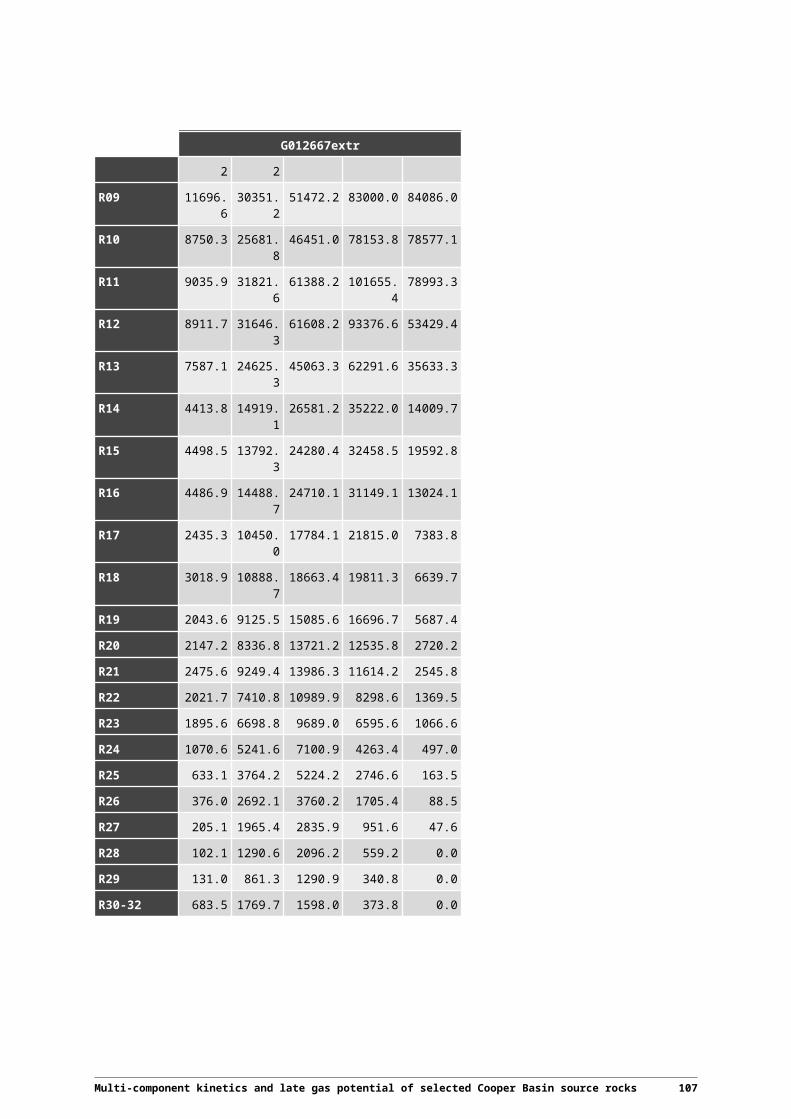
Table B6: Physical properties of the pseudo compounds used for the 14 compounds model.
PNA-Oil (low wax/low sulphur)
Mol Wt Tb Tc Pc Vc Acentric Factor
Rackett Factor
(g/mol) (K) (K) (MPa) (m3/mol) (Zra)
P10 137 182 335 2.39 0.63 0.612 0.256
P20 268 337 465 1.58 1.18 0.934 0.226
P30 406 444 570 1.40 1.83 1.189 0.194
P40 545 520 661 1.35 2.54 1.338 0.180
P50 683 583 746 1.33 3.29 1.361 0.168
P60+ 866 657 857 1.34 4.36 1.160 0.157
PNA-Oil (low wax/high sulphur)
Mol Wt Tb Tc Pc Vc Acentric Factor
Rackett Factor
(g/mol) (K) (K) (MPa) (m3/mol) (Zra)
P10 140 183 336 2.40 0.63 0.614 0.256
P20 273 338 466 1.58 1.18 0.935 0.226
P30 414 446 577 1.51 1.85 1.194 0.194
P40 554 521 668 1.44 2.58 1.340 0.180
P50 694 585 752 1.56 3.34 1.360 0.168
P60+ 895 664 869 1.42 4.51 1.130 0.157
Paraffinic-oil (high wax)
Mol Wt Tb Tc Pc Vc Acentric Factor
Rackett Factor
(g/mol) (K) (K) (MPa) (m3/mol) (Zra)
P10 140 184 328 2.16 0.69 0.614 0.239
P20 273 338 456 1.40 1.21 0.936 0.189
P30 412 445 560 1.23 1.83 1.190 0.161
P40 552 520 651 1.17 2.50 1.338 0.243
P50 692 581 735 1.15 3.20 1.360 0.190
P60+ 885 656 848 1.14 4.23 1.149 0.185
Multi-component kinetics and late gas potential of selected Cooper Basin source rocks 111

Gas/Condensate
Mol Wt Tb Tc Pc Vc Acentric Factor
Rackett Factor
(g/mol) (K) (K) (MPa) (m3/mol) (Zra)
P10 129 182 335 2.39 0.63 0.612 0.256
P20 250 337 465 1.58 1.18 0.934 0.226
P30 378 444 570 1.40 1.83 1.189 0.194
P40 506 520 661 1.35 2.54 1.338 0.180
P50 635 583 746 1.33 3.29 1.361 0.168
P60+ 806 657 857 1.34 4.36 1.160 0.157
112 Multi-component kinetics and late gas potential of selective Cooper Basin source rocks

Table B7a: 2-, 4-, and 14-compound compositional kinetic model: G012670.
14 compound kinetics
n-C1 n-C2 n-C3 i-C4 n-C4 i-C5 n-C5 n-C6 C7-15
C16-25
C26-35
C36-45
C46-55
C56-80
kcal/mol (%)
47 0.15 0.11 0.11 0.14 0.40 0.23 0.11 0.16 0.15 0.17 0.19 0.20 0.22 0.25
48 0.21 0.15 0.15 0.19 0.55 0.32 0.15 0.21 0.21 0.23 0.25 0.27 0.30 0.33
49 0.77 0.56 0.56 0.72 2.02 1.17 0.57 0.79 0.77 0.85 0.93 1.01 1.10 1.23
50 0.67 0.49 0.49 0.63 1.76 1.02 0.50 0.69 0.67 0.74 0.81 0.88 0.96 1.07
51 2.88 2.09 2.11 2.69 7.54 4.38 2.14 2.95 2.89 3.16 3.47 3.80 4.12 4.61
52 3.04 2.21 2.22 2.84 7.97 4.62 2.26 3.12 3.05 3.34 3.67 4.01 4.35 4.87
53 9.76 9.51 11.32 9.12 13.58 14.54 10.90 11.81 12.19 13.04 13.97 14.92 15.86 17.08
54 18.35 19.75 21.12 16.40 19.97 21.68 21.73 22.48 23.06 23.53 23.96 24.30 24.57 24.83
55 16.24 16.93 18.47 15.41 14.00 18.44 18.82 18.66 17.77 17.83 17.82 17.76 17.64 17.42
56 12.82 13.36 14.57 12.16 11.05 14.55 14.85 14.72 14.02 14.07 14.07 14.02 13.92 13.75
57 9.22 9.15 7.58 10.42 5.56 5.00 7.34 6.41 6.62 6.06 5.48 4.94 4.45 3.82
58 6.82 6.77 5.61 7.71 4.11 3.70 5.43 4.74 4.90 4.48 4.06 3.66 3.29 2.83
59 3.82 3.79 3.14 4.32 2.30 2.07 3.04 2.66 2.74 2.51 2.27 2.05 1.85 1.58
60 3.57 3.54 2.94 4.04 2.15 1.94 2.84 2.48 2.56 2.35 2.12 1.91 1.72 1.48
61 2.00 1.98 1.64 2.26 1.20 1.08 1.59 1.39 1.43 1.31 1.19 1.07 0.96 0.83
62 1.88 1.87 1.55 2.13 1.14 1.02 1.50 1.31 1.35 1.24 1.12 1.01 0.91 0.78
63 1.80 1.78 1.48 2.03 1.08 0.98 1.43 1.25 1.29 1.18 1.07 0.96 0.87 0.75
64 0.40 0.40 0.33 0.46 0.24 0.22 0.32 0.28 0.29 0.27 0.24 0.22 0.20 0.17
65 2.18 2.16 1.79 2.46 1.31 1.18 1.73 1.51 1.56 1.43 1.29 1.17 1.05 0.90
66 0.00 0.00 0.00 0.00 0.00 0.00 0.00 0.00 0.00 0.00 0.00 0.00 0.00 0.00
67 0.99 0.98 0.81 1.12 0.60 0.54 0.79 0.69 0.71 0.65 0.59 0.53 0.48 0.41
68 0.92 0.91 0.76 1.04 0.56 0.50 0.73 0.64 0.66 0.60 0.55 0.49 0.44 0.38
69 0.00 0.00 0.00 0.00 0.00 0.00 0.00 0.00 0.00 0.00 0.00 0.00 0.00 0.00
70 1.52 1.51 1.25 1.72 0.92 0.82 1.21 1.06 1.09 1.00 0.90 0.82 0.73 0.63
Potential
10.31 4.70 3.98 0.53 2.98 1.46 1.69 3.97 29.42 22.18 10.90 4.77 1.96 1.14
Multi-component kinetics and late gas potential of selected Cooper Basin source rocks 113

Table B7a (continued): 2-, 4-, and 14-compound compositional kinetic model: G012670.
2 compound kinetics 4 compound kinetics
kcal/mol Gas Oil C1 C2-5 C6-14 C15+
47 0.17 0.17 0.15 0.18 0.15 0.18
48 0.23 0.23 0.21 0.25 0.21 0.25
49 0.85 0.85 0.77 0.91 0.77 0.91
50 0.74 0.74 0.67 0.79 0.67 0.79
51 3.19 3.18 2.88 3.40 2.90 3.40
52 3.37 3.36 3.04 3.59 3.06 3.60
53 10.73 13.03 9.76 11.39 12.14 13.75
54 19.60 23.45 18.35 20.44 22.99 23.82
55 16.73 17.83 16.24 17.06 17.87 17.80
56 13.20 14.07 12.82 13.46 14.11 14.05
57 8.19 6.07 9.22 7.49 6.60 5.63
58 6.06 4.49 6.82 5.54 4.88 4.17
59 3.39 2.51 3.82 3.11 2.73 2.34
60 3.17 2.35 3.57 2.90 2.55 2.18
61 1.77 1.31 2.00 1.62 1.43 1.22
62 1.67 1.24 1.88 1.53 1.35 1.15
63 1.60 1.18 1.80 1.46 1.29 1.10
64 0.36 0.27 0.40 0.33 0.29 0.25
65 1.93 1.43 2.18 1.77 1.56 1.33
66 0.00 0.00 0.00 0.00 0.00 0.00
67 0.88 0.65 0.99 0.80 0.71 0.61
68 0.82 0.61 0.92 0.75 0.66 0.56
69 0.00 0.00 0.00 0.00 0.00 0.00
70 1.35 1.00 1.52 1.24 1.09 0.93
Potential 25.66 74.34 10.31 15.35 33.40 40.95
114 Multi-component kinetics and late gas potential of selective Cooper Basin source rocks

Table B7b: 2-, 4-, and 14-compound compositional kinetic model: G012710.
14 compound kinetics
n-C1 n-C2 n-C3 i-C4 n-C4 i-C5 n-C5 n-C6 C7-15
C16-25
C26-35
C36-45
C46-55
C56-80
kcal/mol (%)
48 0.02 0.03 0.03 0.02 0.03 0.07 0.03 0.05 0.06 0.06 0.06 0.06 0.07 0.07
49 0.05 0.08 0.09 0.07 0.08 0.22 0.10 0.15 0.17 0.18 0.18 0.19 0.20 0.21
50 0.03 0.04 0.05 0.04 0.04 0.12 0.05 0.08 0.09 0.09 0.10 0.10 0.11 0.11
51 0.18 0.26 0.32 0.23 0.29 0.76 0.34 0.53 0.58 0.61 0.64 0.67 0.69 0.72
52 0.04 0.06 0.07 0.05 0.06 0.16 0.07 0.11 0.12 0.13 0.14 0.14 0.15 0.15
53 0.39 0.56 0.69 0.49 0.62 1.61 0.72 1.13 1.25 1.31 1.37 1.42 1.48 1.54
54 0.10 0.15 0.18 0.13 0.16 0.42 0.19 0.30 0.33 0.34 0.36 0.37 0.39 0.40
55 0.62 0.90 1.10 0.78 0.99 2.59 1.16 1.82 2.00 2.10 2.19 2.28 2.37 2.47
56 0.49 0.71 0.88 0.62 0.79 2.07 0.92 1.45 1.60 1.67 1.75 1.82 1.89 1.97
57 9.66 14.29 15.70 13.00 14.93 21.84 17.86 22.12 23.53 24.83 26.21 27.54 28.82 30.39
58 11.97 17.11 17.59 18.14 18.34 21.74 21.95 23.94 23.56 24.66 25.80 26.87 27.91 29.13
59 9.57 12.04 11.71 12.14 12.98 12.89 15.16 14.66 12.68 11.54 10.38 9.30 8.30 7.06
60 9.45 11.89 11.57 11.99 12.82 12.73 14.98 14.48 12.52 11.40 10.25 9.19 8.20 6.97
61 3.99 5.02 4.89 5.06 5.42 5.38 6.33 6.12 5.29 4.81 4.33 3.88 3.47 2.94
62 13.92 9.60 9.14 9.70 8.45 4.53 5.24 3.40 4.22 4.24 4.23 4.21 4.16 4.13
63 8.11 5.60 5.33 5.65 4.93 2.64 3.06 1.98 2.46 2.47 2.47 2.45 2.42 2.41
64 6.06 4.18 3.98 4.22 3.68 1.97 2.28 1.48 1.84 1.85 1.84 1.83 1.81 1.80
65 6.02 4.15 3.95 4.19 3.65 1.96 2.27 1.47 1.83 1.83 1.83 1.82 1.80 1.79
66 3.18 2.20 2.09 2.22 1.93 1.04 1.20 0.78 0.97 0.97 0.97 0.96 0.95 0.95
67 3.33 2.29 2.19 2.32 2.02 1.08 1.25 0.81 1.01 1.01 1.01 1.00 0.99 0.99
68 4.95 3.42 3.25 3.45 3.01 1.61 1.87 1.21 1.50 1.51 1.51 1.50 1.48 1.47
69 0.00 0.00 0.00 0.00 0.00 0.00 0.00 0.00 0.00 0.00 0.00 0.00 0.00 0.00
70 0.00 0.00 0.00 0.00 0.00 0.00 0.00 0.00 0.00 0.00 0.00 0.00 0.00 0.00
71 7.88 5.44 5.18 5.49 4.78 2.57 2.97 1.92 2.39 2.40 2.39 2.38 2.35 2.34
Potential 11.49 4.68 4.22 0.54 2.03 0.70 1.26 3.34 30.79 22.62 10.82 4.61 1.85 1.04
Multi-component kinetics and late gas potential of selected Cooper Basin source rocks 115
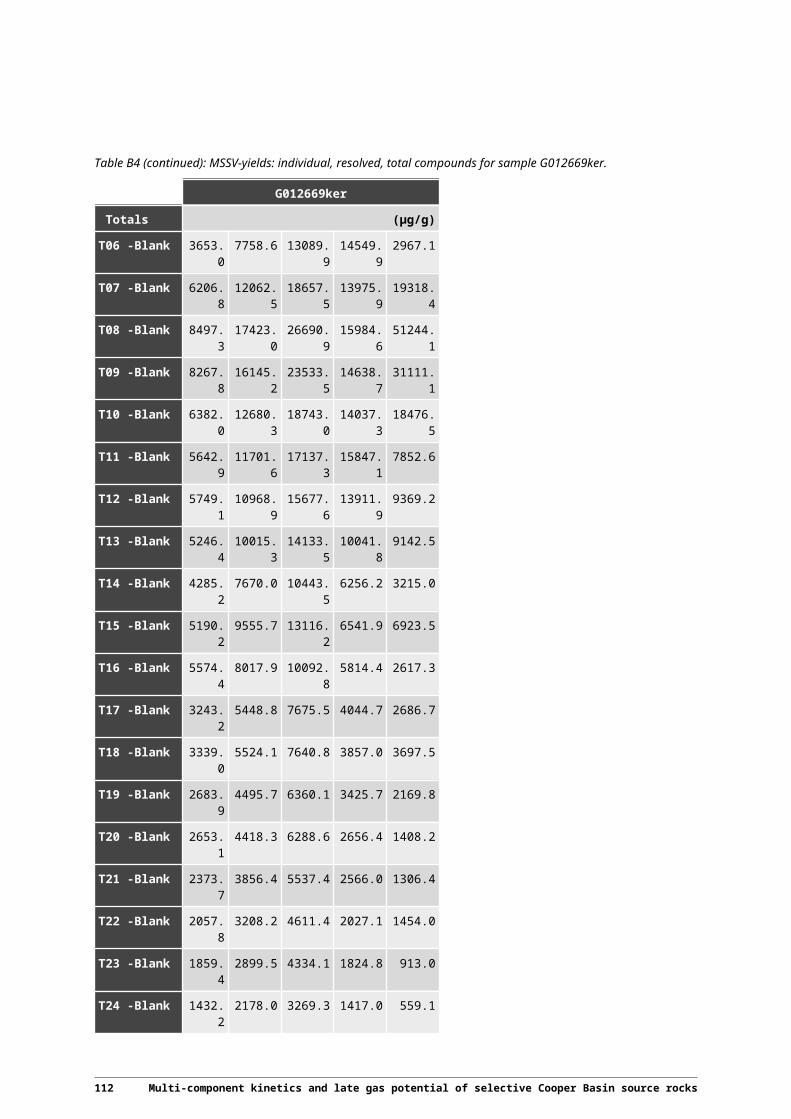
Table B7b (continued): 2-, 4-, and 14-compound compositional kinetic model: G012710.
2 compound kinetics 4 compound kinetics
kcal/mol Gas Oil C1 C2-5 C6-14 C15+
48 0.02 0.06 0.02 0.03 0.06 0.06
49 0.07 0.18 0.05 0.09 0.17 0.18
50 0.04 0.09 0.03 0.05 0.09 0.10
51 0.25 0.61 0.18 0.32 0.58 0.63
52 0.05 0.13 0.04 0.07 0.12 0.13
53 0.54 1.30 0.39 0.68 1.24 1.35
54 0.14 0.34 0.10 0.18 0.32 0.35
55 0.87 2.08 0.62 1.08 1.98 2.16
56 0.69 1.66 0.49 0.87 1.58 1.73
57 12.81 24.72 9.66 15.51 23.39 25.82
58 15.32 24.62 11.97 18.18 23.59 25.47
59 11.10 11.70 9.57 12.42 12.87 10.72
60 10.97 11.56 9.45 12.27 12.72 10.59
61 4.63 4.88 3.99 5.18 5.37 4.47
62 11.06 4.19 13.92 8.61 4.14 4.22
63 6.45 2.44 8.11 5.02 2.42 2.46
64 4.82 1.82 6.06 3.75 1.80 1.84
65 4.78 1.81 6.02 3.72 1.79 1.83
66 2.53 0.96 3.18 1.97 0.95 0.97
67 2.64 1.00 3.33 2.06 0.99 1.01
68 3.94 1.49 4.95 3.07 1.47 1.50
69 0.00 0.00 0.00 0.00 0.00 0.00
70 0.00 0.00 0.00 0.00 0.00 0.00
71 6.26 2.37 7.88 4.88 2.35 2.39
Potential 24.92 75.08 11.49 13.43 34.14 40.94
116 Multi-component kinetics and late gas potential of selective Cooper Basin source rocks

Table B7c: 2-, 4-, and 14-compound compositional kinetic model: G012667.
14 compound kinetics
n-C1 n-C2 n-C3 i-C4 n-C4 i-C5 n-C5 n-C6 C7-15
C16-25
C26-35
C36-45
C46-55
C56-80
kcal/mol (%)
49 0.01 0.01 0.01 0.02 0.04 0.02 0.02 0.02 0.02 0.02 0.02 0.02 0.03 0.03
50 0.12 0.16 0.16 0.21 0.41 0.25 0.22 0.24 0.24 0.25 0.26 0.27 0.28 0.28
51 0.07 0.09 0.08 0.11 0.22 0.14 0.12 0.13 0.13 0.14 0.14 0.15 0.15 0.15
52 0.32 0.42 0.41 0.54 1.07 0.67 0.57 0.64 0.63 0.67 0.70 0.72 0.73 0.73
53 0.20 0.26 0.25 0.34 0.67 0.42 0.35 0.39 0.39 0.41 0.43 0.45 0.45 0.45
54 0.76 1.00 0.98 1.30 2.56 1.60 1.36 1.51 1.50 1.58 1.66 1.71 1.73 1.73
55 0.67 0.88 0.86 1.14 2.24 1.40 1.19 1.33 1.31 1.39 1.45 1.50 1.52 1.52
56 3.13 4.11 4.00 5.30 10.46 6.53 5.57 6.20 6.12 6.49 6.78 6.98 7.09 7.08
57 10.30 15.50 17.26 16.48 20.36 22.04 20.49 20.05 20.36 23.40 26.70 29.99 33.32 37.46
58 10.47 16.16 16.19 15.59 15.39 17.45 17.43 18.55 18.44 19.53 20.41 21.00 21.38 21.41
59 8.48 13.09 13.11 12.63 12.46 14.13 14.11 15.02 14.93 15.81 16.53 17.01 17.31 17.33
60 8.12 10.56 10.77 10.61 8.92 12.21 13.03 12.22 11.03 9.71 8.32 7.02 5.86 4.61
61 5.57 7.25 7.39 7.28 6.12 8.38 8.94 8.39 7.57 6.66 5.71 4.82 4.02 3.16
62 12.02 7.08 6.62 6.60 4.43 3.43 3.85 3.55 4.02 3.24 2.52 1.94 1.42 0.95
63 9.50 5.59 5.23 5.22 3.50 2.71 3.05 2.81 3.18 2.56 1.99 1.53 1.12 0.75
64 6.47 3.81 3.56 3.55 2.38 1.84 2.07 1.91 2.16 1.74 1.36 1.04 0.77 0.51
65 5.02 2.96 2.76 2.76 1.85 1.43 1.61 1.48 1.68 1.35 1.05 0.81 0.59 0.40
66 3.03 1.79 1.67 1.67 1.12 0.86 0.97 0.90 1.02 0.82 0.64 0.49 0.36 0.24
67 4.75 2.80 2.62 2.61 1.75 1.35 1.52 1.40 1.59 1.28 1.00 0.77 0.56 0.37
68 0.07 0.04 0.04 0.04 0.02 0.02 0.02 0.02 0.02 0.02 0.01 0.01 0.01 0.01
69 5.35 3.15 2.95 2.94 1.97 1.53 1.72 1.58 1.79 1.44 1.12 0.86 0.63 0.42
70 0.00 0.00 0.00 0.00 0.00 0.00 0.00 0.00 0.00 0.00 0.00 0.00 0.00 0.00
71 0.00 0.00 0.00 0.00 0.00 0.00 0.00 0.00 0.00 0.00 0.00 0.00 0.00 0.00
72 5.58 3.28 3.07 3.06 2.05 1.59 1.79 1.65 1.87 1.50 1.17 0.90 0.66 0.44
Potential 18.58 5.90 4.68 0.67 2.86 1.14 1.29 3.21 27.50 19.30 8.90 3.70 1.46 0.82
Multi-component kinetics and late gas potential of selected Cooper Basin source rocks 117

Table B7c (continued): 2-, 4-, and 14-compound compositional kinetic model: G012667.
2 compound kinetics 4 compound kinetics
kcal/mol Gas Oil C1 C2-5 C6-14 C15+
49 0.02 0.02 0.01 0.02 0.02 0.02
50 0.17 0.25 0.12 0.21 0.24 0.26
51 0.09 0.14 0.07 0.12 0.13 0.14
52 0.44 0.66 0.32 0.57 0.63 0.68
53 0.27 0.41 0.20 0.35 0.39 0.42
54 1.04 1.57 0.76 1.35 1.50 1.63
55 0.91 1.37 0.67 1.18 1.31 1.43
56 4.25 6.41 3.13 5.51 6.13 6.66
57 13.79 23.17 10.30 17.72 20.33 25.73
58 13.17 19.29 10.47 16.20 18.45 20.04
59 10.67 15.62 8.48 13.12 14.94 16.23
60 9.31 9.90 8.12 10.64 11.15 8.77
61 6.39 6.79 5.57 7.30 7.65 6.02
62 9.17 3.34 12.02 5.97 3.97 2.78
63 7.25 2.64 9.50 4.72 3.14 2.20
64 4.93 1.80 6.47 3.21 2.14 1.50
65 3.83 1.40 5.02 2.49 1.66 1.16
66 2.31 0.84 3.03 1.51 1.00 0.70
67 3.62 1.32 4.75 2.36 1.57 1.10
68 0.05 0.02 0.07 0.03 0.02 0.02
69 4.08 1.49 5.35 2.66 1.77 1.24
70 0.00 0.00 0.00 0.00 0.00 0.00
71 0.00 0.00 0.00 0.00 0.00 0.00
72 4.25 1.55 5.58 2.77 1.84 1.29
Potential 35.11 64.89 18.58 16.54 30.71 34.18
118 Multi-component kinetics and late gas potential of selective Cooper Basin source rocks

Table B7d: 2-, 4-, and 14-compound compositional kinetic model: G012669.
14 compound kinetics
n-C1 n-C2 n-C3 i-C4 n-C4 i-C5 n-C5 n-C6 C7-15
C16-25
C26-35
C36-45
C46-55
C56-80
kcal/mol (%)
46 0.13 0.19 0.25 0.40 0.37 0.54 0.36 0.37 0.44 0.45 0.45 0.45 0.45 0.45
47 0.00 0.00 0.00 0.00 0.00 0.00 0.00 0.00 0.00 0.00 0.00 0.00 0.00 0.00
48 0.36 0.55 0.71 1.14 1.08 1.57 1.05 1.06 1.28 1.29 1.30 1.31 1.31 1.31
49 0.14 0.22 0.28 0.45 0.42 0.62 0.42 0.42 0.50 0.51 0.51 0.52 0.52 0.52
50 0.00 0.00 0.00 0.00 0.00 0.00 0.00 0.00 0.00 0.00 0.00 0.00 0.00 0.00
51 0.00 0.00 0.00 0.00 0.00 0.00 0.00 0.00 0.00 0.00 0.00 0.00 0.00 0.00
52 8.69 13.44 17.75 22.72 19.71 24.81 23.08 22.87 25.97 24.72 23.40 22.10 20.83 19.34
53 11.50 18.55 20.53 23.47 23.27 26.14 27.13 27.16 26.04 27.22 28.51 29.78 31.00 32.69
54 6.44 10.39 11.49 13.14 13.03 14.63 15.19 15.20 14.57 15.24 15.96 16.67 17.36 18.30
55 11.59 12.64 13.72 9.20 14.55 13.71 14.24 15.66 9.50 9.49 9.47 9.45 9.42 9.29
56 5.24 5.71 6.20 4.16 6.57 6.19 6.43 7.08 4.29 4.29 4.28 4.27 4.25 4.20
57 5.75 6.27 6.80 4.56 7.21 6.80 7.06 7.77 4.71 4.71 4.69 4.68 4.67 4.61
58 8.86 5.66 3.94 3.66 2.43 0.88 0.89 0.43 2.24 2.13 2.02 1.90 1.80 1.64
59 7.87 5.02 3.49 3.25 2.16 0.78 0.79 0.38 1.99 1.89 1.79 1.69 1.60 1.46
60 7.67 4.90 3.41 3.17 2.10 0.76 0.77 0.37 1.94 1.85 1.75 1.65 1.56 1.42
61 4.37 2.79 1.94 1.81 1.20 0.43 0.44 0.21 1.10 1.05 0.99 0.94 0.89 0.81
62 5.63 3.60 2.50 2.33 1.55 0.56 0.56 0.27 1.42 1.36 1.28 1.21 1.14 1.04
63 4.96 3.17 2.20 2.05 1.36 0.49 0.50 0.24 1.26 1.19 1.13 1.07 1.01 0.92
64 0.00 0.00 0.00 0.00 0.00 0.00 0.00 0.00 0.00 0.00 0.00 0.00 0.00 0.00
65 7.54 4.82 3.35 3.12 2.07 0.75 0.76 0.36 1.91 1.82 1.72 1.62 1.53 1.40
66 1.89 1.20 0.84 0.78 0.52 0.19 0.19 0.09 0.48 0.45 0.43 0.40 0.38 0.35
67 0.00 0.00 0.00 0.00 0.00 0.00 0.00 0.00 0.00 0.00 0.00 0.00 0.00 0.00
68 1.39 0.89 0.62 0.57 0.38 0.14 0.14 0.07 0.35 0.33 0.32 0.30 0.28 0.26
69 0.00 0.00 0.00 0.00 0.00 0.00 0.00 0.00 0.00 0.00 0.00 0.00 0.00 0.00
Potential 18.26 5.71 4.39 0.74 2.15 1.21 1.44 3.37 27.62 19.81 9.21 3.81 1.48 0.80
Multi-component kinetics and late gas potential of selected Cooper Basin source rocks 119

Table B7d (continued): 2-, 4-, and 14-compound compositional kinetic model: G012669.
2 compound kinetics 4 compound kinetics
kcal/mol Gas Oil C1 C2-5 C6-14 C15+
46 0.20 0.44 0.13 0.28 0.44 0.45
47 0.00 0.00 0.00 0.00 0.00 0.00
48 0.58 1.28 0.36 0.82 1.26 1.30
49 0.23 0.50 0.14 0.32 0.50 0.51
50 0.00 0.00 0.00 0.00 0.00 0.00
51 0.00 0.00 0.00 0.00 0.00 0.00
52 12.86 24.66 8.69 17.72 25.63 23.80
53 16.05 27.20 11.50 21.37 26.16 28.12
54 8.99 15.23 6.44 11.96 14.64 15.74
55 12.37 9.80 11.59 13.27 10.17 9.47
56 5.59 4.43 5.24 5.99 4.59 4.28
57 6.13 4.86 5.75 6.58 5.04 4.70
58 6.54 2.05 8.86 3.83 2.04 2.05
59 5.80 1.82 7.87 3.40 1.81 1.82
60 5.66 1.77 7.67 3.31 1.77 1.78
61 3.22 1.01 4.37 1.89 1.01 1.01
62 4.16 1.30 5.63 2.43 1.30 1.30
63 3.66 1.15 4.96 2.14 1.14 1.15
64 0.00 0.00 0.00 0.00 0.00 0.00
65 5.57 1.74 7.54 3.26 1.74 1.75
66 1.39 0.44 1.89 0.81 0.43 0.44
67 0.00 0.00 0.00 0.00 0.00 0.00
68 1.03 0.32 1.39 0.60 0.32 0.32
69 0.00 0.00 0.00 0.00 0.00 0.00
Potential 33.91 66.09 18.26 15.65 31.00 35.09
120 Multi-component kinetics and late gas potential of selective Cooper Basin source rocks

Table B7e: 2-, 4-, and 14-compound compositional kinetic model: G012674.
14 compound kinetics
n-C1 n-C2 n-C3 i-C4 n-C4 i-C5 n-C5 n-C6 C7-15
C16-25
C26-35
C36-45
C46-55
C56-80
kcal/mol (%)
50 0.02 0.03 0.04 0.04 0.06 0.06 0.05 0.06 0.05 0.05 0.05 0.05 0.05 0.05
51 0.04 0.06 0.08 0.10 0.14 0.13 0.11 0.12 0.11 0.11 0.12 0.12 0.12 0.12
52 0.00 0.00 0.00 0.00 0.00 0.00 0.00 0.00 0.00 0.00 0.00 0.00 0.00 0.00
53 0.00 0.00 0.00 0.00 0.00 0.00 0.00 0.00 0.00 0.00 0.00 0.00 0.00 0.00
54 0.25 0.38 0.51 0.59 0.86 0.81 0.64 0.76 0.65 0.68 0.71 0.72 0.73 0.71
55 2.44 3.72 5.07 5.85 8.48 8.04 6.34 7.52 6.39 6.71 6.98 7.14 7.19 7.04
56 9.61 15.54 20.16 22.39 21.72 27.27 22.82 25.07 23.21 24.38 25.35 25.96 26.22 25.51
57 6.42 10.37 13.45 14.94 14.50 18.20 15.23 16.73 15.49 16.27 16.91 17.32 17.50 17.03
58 9.36 13.88 15.60 16.68 16.85 17.43 19.44 18.27 17.90 15.63 13.33 11.19 9.22 7.11
59 4.95 7.33 8.24 8.82 8.90 9.21 10.27 9.66 9.46 8.26 7.05 5.91 4.87 3.76
60 7.58 8.28 8.37 7.76 8.67 6.05 8.47 7.40 6.72 6.35 5.89 5.38 4.82 4.13
61 5.25 5.73 5.80 5.38 6.00 4.19 5.86 5.12 4.65 4.40 4.08 3.72 3.34 2.86
62 4.44 4.85 4.91 4.55 5.08 3.55 4.96 4.34 3.94 3.72 3.45 3.15 2.83 2.42
63 4.48 4.89 4.95 4.58 5.12 3.57 5.00 4.37 3.97 3.75 3.48 3.18 2.85 2.44
64 4.92 2.71 1.40 0.91 0.39 0.16 0.09 0.06 0.81 1.06 1.37 1.76 2.21 2.92
65 9.77 5.39 2.77 1.80 0.78 0.32 0.18 0.13 1.62 2.09 2.73 3.49 4.38 5.80
66 0.00 0.00 0.00 0.00 0.00 0.00 0.00 0.00 0.00 0.00 0.00 0.00 0.00 0.00
67 11.52 6.36 3.27 2.12 0.92 0.38 0.21 0.15 1.91 2.47 3.22 4.12 5.17 6.84
68 0.00 0.00 0.00 0.00 0.00 0.00 0.00 0.00 0.00 0.00 0.00 0.00 0.00 0.00
69 8.01 4.42 2.27 1.47 0.64 0.26 0.14 0.11 1.33 1.72 2.24 2.86 3.59 4.76
70 0.00 0.00 0.00 0.00 0.00 0.00 0.00 0.00 0.00 0.00 0.00 0.00 0.00 0.00
71 0.00 0.00 0.00 0.00 0.00 0.00 0.00 0.00 0.00 0.00 0.00 0.00 0.00 0.00
72 10.95 6.05 3.11 2.02 0.88 0.36 0.20 0.14 1.81 2.35 3.06 3.92 4.91 6.50
73 0.00 0.00 0.00 0.00 0.00 0.00 0.00 0.00 0.00 0.00 0.00 0.00 0.00 0.00
Potential 23.96 7.01 4.46 0.78 1.95 1.10 1.28 2.69 25.13 17.78 8.25 3.45 1.37 0.78
Multi-component kinetics and late gas potential of selected Cooper Basin source rocks 121

Table B7e (continued): 2-, 4-, and 14-compound compositional kinetic model: G012674.
2 compound kinetics 4 compound kinetics
kcal/mol Gas Oil C1 C2-5 C6-14 C15+
50 0.03 0.05 0.02 0.04 0.05 0.05
51 0.06 0.11 0.04 0.09 0.11 0.11
52 0.00 0.00 0.00 0.00 0.00 0.00
53 0.00 0.00 0.00 0.00 0.00 0.00
54 0.36 0.68 0.25 0.53 0.66 0.69
55 3.58 6.69 2.44 5.23 6.50 6.86
56 13.52 24.20 9.61 19.17 23.39 24.91
57 9.03 16.15 6.42 12.80 15.61 16.62
58 11.87 15.88 9.36 15.49 17.94 14.06
59 6.27 8.39 4.95 8.18 9.48 7.43
60 7.83 6.37 7.58 8.19 6.78 6.00
61 5.42 4.41 5.25 5.67 4.70 4.16
62 4.59 3.73 4.44 4.80 3.98 3.52
63 4.62 3.76 4.48 4.84 4.01 3.54
64 3.57 1.04 4.92 1.63 0.74 1.31
65 7.09 2.07 9.77 3.24 1.47 2.60
66 0.00 0.00 0.00 0.00 0.00 0.00
67 8.37 2.45 11.52 3.82 1.74 3.07
68 0.00 0.00 0.00 0.00 0.00 0.00
69 5.82 1.70 8.01 2.65 1.21 2.13
70 0.00 0.00 0.00 0.00 0.00 0.00
71 0.00 0.00 0.00 0.00 0.00 0.00
72 7.96 2.33 10.95 3.63 1.65 2.92
73 0.00 0.00 0.00 0.00 0.00 0.00
Potential 40.55 59.45 23.96 16.59 27.82 31.63
122 Multi-component kinetics and late gas potential of selective Cooper Basin source rocks

Table B7f: 2-, 4-, and 14-compound compositional kinetic model: G012675.
14 compound kinetics
n-C1 n-C2 n-C3 i-C4 n-C4 i-C5 n-C5 n-C6 C7-15
C16-25
C26-35
C36-45
C46-55
C56-80
kcal/mol (%)
55 0.02 0.04 0.08 0.03 0.10 0.11 0.10 0.15 0.17 0.18 0.19 0.20 0.20 0.21
56 0.01 0.02 0.03 0.01 0.04 0.04 0.04 0.06 0.07 0.08 0.08 0.08 0.08 0.09
57 0.05 0.10 0.18 0.07 0.23 0.26 0.24 0.37 0.42 0.44 0.45 0.47 0.49 0.50
58 0.04 0.08 0.15 0.06 0.19 0.21 0.20 0.31 0.34 0.36 0.38 0.39 0.40 0.41
59 0.10 0.19 0.35 0.13 0.44 0.49 0.46 0.70 0.79 0.83 0.86 0.90 0.93 0.95
60 0.09 0.19 0.34 0.13 0.42 0.47 0.44 0.67 0.76 0.80 0.83 0.86 0.89 0.91
61 0.17 0.35 0.63 0.24 0.79 0.88 0.82 1.26 1.42 1.49 1.55 1.61 1.67 1.71
62 0.65 1.33 2.40 0.91 3.02 3.36 3.15 4.81 5.41 5.67 5.93 6.16 6.36 6.52
63 1.92 3.90 7.05 2.67 8.86 9.86 9.23 14.11 15.89 16.65 17.38 18.06 18.67 19.12
64 8.10 13.23 14.91 15.49 17.64 19.63 17.38 17.62 16.28 15.47 14.55 13.62 12.69 11.23
65 9.63 14.80 15.07 16.08 17.05 18.26 18.06 16.36 14.14 14.69 15.21 15.66 16.02 16.32
66 7.91 12.16 12.38 13.21 14.00 15.00 14.83 13.44 11.61 12.07 12.50 12.86 13.16 13.41
67 9.57 11.31 10.75 11.77 10.92 10.38 11.76 10.55 9.13 8.07 7.02 6.07 5.21 4.33
68 7.22 8.54 8.12 8.88 8.24 7.83 8.87 7.96 6.89 6.09 5.30 4.58 3.93 3.27
69 6.63 7.83 7.45 8.15 7.56 7.19 8.14 7.30 6.32 5.59 4.86 4.20 3.61 3.00
70 8.68 4.70 3.65 4.02 1.90 1.09 1.14 0.78 1.88 2.09 2.34 2.59 2.84 3.27
71 9.68 5.24 4.07 4.48 2.12 1.22 1.27 0.87 2.09 2.33 2.61 2.88 3.17 3.64
72 3.10 1.68 1.30 1.43 0.68 0.39 0.41 0.28 0.67 0.75 0.83 0.92 1.01 1.17
73 8.10 4.38 3.40 3.75 1.78 1.02 1.06 0.73 1.75 1.95 2.18 2.41 2.65 3.05
74 0.69 0.38 0.29 0.32 0.15 0.09 0.09 0.06 0.15 0.17 0.19 0.21 0.23 0.26
75 4.87 2.64 2.05 2.26 1.07 0.61 0.64 0.44 1.05 1.17 1.31 1.45 1.59 1.83
76 4.37 2.37 1.84 2.03 0.96 0.55 0.57 0.39 0.95 1.05 1.18 1.30 1.43 1.65
77 0.00 0.00 0.00 0.00 0.00 0.00 0.00 0.00 0.00 0.00 0.00 0.00 0.00 0.00
79 8.40 4.55 3.53 3.89 1.84 1.06 1.10 0.76 1.82 2.03 2.26 2.50 2.75 3.16
Potential 25.79 6.86 4.65 0.61 1.84 0.93 0.89 2.57 23.77 17.59 8.50 3.66 1.49 0.86
Multi-component kinetics and late gas potential of selected Cooper Basin source rocks 123

Table B7f (continued) : 2-, 4-, and 14-compound compositional kinetic model: G012675.
2 compound kinetics 4 compound kinetics
kcal/mol Gas Oil C1 C2-5 C6-14 C15+
55 0.04 0.18 0.02 0.06 0.17 0.19
56 0.02 0.07 0.01 0.03 0.07 0.08
57 0.09 0.43 0.05 0.16 0.41 0.45
58 0.08 0.36 0.04 0.13 0.34 0.37
59 0.17 0.82 0.10 0.30 0.78 0.85
60 0.17 0.79 0.09 0.29 0.75 0.82
61 0.31 1.47 0.17 0.54 1.40 1.53
62 1.18 5.63 0.65 2.05 5.36 5.85
63 3.47 16.51 1.92 6.01 15.71 17.16
64 10.70 15.51 8.10 14.93 16.41 14.77
65 11.89 14.73 9.63 15.58 14.35 15.05
66 9.76 12.10 7.91 12.80 11.79 12.36
67 10.15 8.20 9.57 11.09 9.27 7.33
68 7.66 6.19 7.22 8.37 6.99 5.53
69 7.03 5.68 6.63 7.68 6.42 5.08
70 6.76 2.05 8.68 3.63 1.77 2.28
71 7.54 2.29 9.68 4.04 1.98 2.54
72 2.41 0.73 3.10 1.29 0.63 0.81
73 6.31 1.91 8.10 3.38 1.65 2.13
74 0.54 0.16 0.69 0.29 0.14 0.18
75 3.80 1.15 4.87 2.03 0.99 1.28
76 3.41 1.03 4.37 1.83 0.89 1.15
77 0.00 0.00 0.00 0.00 0.00 0.00
79 6.54 1.99 8.40 3.51 1.71 2.21
Potential 41.56 58.44 25.79 15.78 26.34 32.10
124 Multi-component kinetics and late gas potential of selective Cooper Basin source rocks

Table B8: Physical properties of generated fluids.
G012670 Patchawarra
TR (%) 10 30 50 70 90
GOR (Sm³/Sm³) 224 191 199 229 366
Bo (m³/Sm³) 1.77 1.66 1.69 1.78 2.21
Psat (bar) 218 201 200 214 268
G012710 Patchawarra
TR (%) 10 30 50 70 90
GOR (Sm³/Sm³) 87 115 142 226 817
Bo (m³/Sm³) 1.33 1.42 1.50 1.79
Psat (bar) 119 145 165 198 453
G012667 Epsilon Fm.
TR (%) 10 30 50 70 90
GOR (Sm³/Sm³) 249 234 280 399 1541
Bo (m³/Sm³) 1.86 1.78 1.93 2.35
Psat (bar) 221 232 243 260 470
G012669 Murteree Shale
TR (%) 10 30 50 70 90
GOR (Sm³/Sm³) 143 176 213 549 1754
Bo (m³/Sm³) 1.52 1.64 1.73 2.76
Psat (bar) 158 173 205 332 617
G012674 Roseneath Shale
TR (%) 10 30 50 70 90
GOR (Sm³/Sm³) 263 287 403 771 2780
Bo (m³/Sm³) 1.89 1.95 2.36
Psat (bar) 230 247 266 396 1047
G012675 Toolachee Fm.
TR (%) 10 30 50 70 90
GOR (Sm³/Sm³) 97 398 494 824 2733
Bo (m³/Sm³) 1.36 2.29 2.52
Psat (bar) 131 288 354 402 873
Multi-component kinetics and late gas potential of selected Cooper Basin source rocks 125
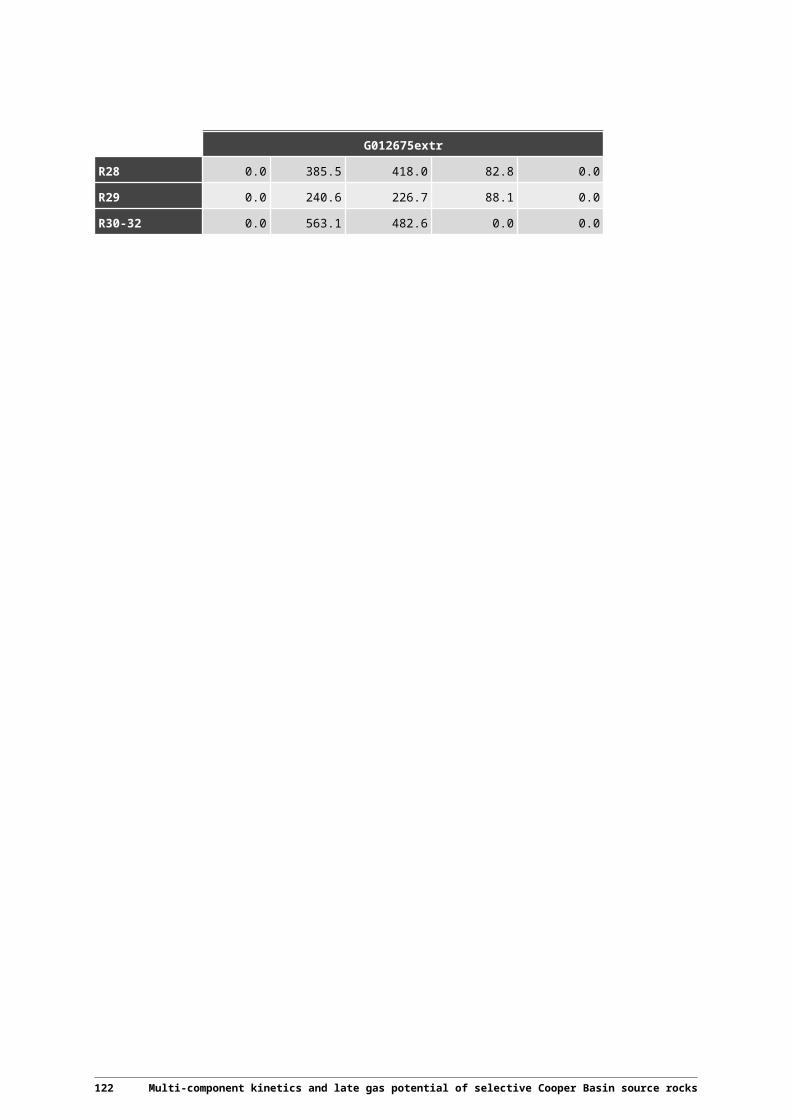
Table B9: MSSV-Pyrolysis GC-FID (Late Gas).
Sample G012670 G012677 G012710ex G012681
Heated to, °C 560 700 560 700 560 700 560 700
Weight, mg 8.14 3.60 2.92 1.17 5.34 2.32 3.82 1.81
(µg/g sample)
C1 (*1.1) 21352 48026 47109 98796 48325 101917 32726 75313
C2-5 12227 391 31507 959 24376 889 17817 616
C6+ (-Blank) 6867 580 16937 2778 12464 933 12278 2190
Sample G012684 G012687 G012688 G012692
Heated to, °C 560 700 560 700 560 700 560 700
Weight, mg 6.57 2.41 13.96 4.59 14.38 5.69 24.32 8.10
(µg/g sample)
C1 (*1.1) 21199 58970 12072 43946 6544 51700 375 2489
C2-5 4908 595 1749 427 360 496 243 483
C6+ (-Blank) 5663 426 2574 259 768 216 130 49
Sample G012672 G012678 G012680 G012683
Heated to, °C 560 700 560 700 560 700 560 700
Weight, mg 2.58 1.73 2.31 1.14 8.85 3.79 8.64 3.65
(µg/g sample)
C1 (*1.1) 37422 66240 57630 113436 8660 20216 19516 48478
C2-5 26511 3285 34801 3618 5819 1061 6410 1194
C6+ (-Blank) 14443 965 21482 3927 560 700 560 700
Sample G012685 G012693 G012690
Heated to, °C 560 700 560 700 560 700
Weight, mg 13.13 4.19 40.96 11.17 26.78 9.15
(µg/g sample)
C1 (*1.1) 14524 41915 449 1893 327 6975
C2-5 2711 1019 217 266 108 521
C6+ (-Blank) 3239 368 120 74 7 28
126 Multi-component kinetics and late gas potential of selective Cooper Basin source rocks

Table B10: MSSV-Pyrolysis GC-FID (secondary cracking). Boiling range yields.
G012710ex-0.7K/min
FID Range 6 6 6 6 8 8 9 9 9 9 9 9 9
Heated to, °C 300.0
350.0
384.5 408.9 425.0 445.5 470.0 485.0 493.5 505.0 520.0 540.0 560.0
Weight, mg 4.12 4.27 4.21 4.13 4.18 4.16 3.99 4.07 3.85 3.84 3.82 3.84 3.81
(µg/g sample)
C1-5 354 578 1646 4416 9736 18843
33789
43409
44945
49663
47852
49772
51567
Methane 29 96 338 973 2223 4730 9215 13057
14735
18388
21888
29377
36560
C02-05 Total 325 483 1308 3443 7513 14112
24573
30352
30211
31276
25964
20394
15007
C06-14 Total 2428 3191 5989 13329
25472
34672
36383
30287
24944
23450
16927
14858
12471
C15-32 Total(-Blank)
1731 3516 5743 10766
17501
14978
9539 7212 6710 6652 3200 2888 2662
C01-32 Total 4513 7286 13378
28512
52709
68492
79711
80907
76599
79765
67979
67518
66700
C6+ 4158 6708 11732
24095
42973
49650
45922
37498
31654
30101
20126
17746
15133
GOR 0.09 0.09 0.14 0.18 0.23 0.38 0.74 1.16 1.42 1.65 2.38 2.80 3.41
Gas wetness(C2-5/C1-5)
0.92 0.83 0.79 0.78 0.77 0.75 0.73 0.70 0.67 0.63 0.54 0.41 0.29
C06-14Resolved
1450 2035 4290 10282
20210
29028
32921
28331
23272
21964
16080
14152
11683
C15-32Resolved
589 1128 1857 3608 6156 6226 4692 4026 3714 3624 1719 1781 1382
C06-32Resolved
2040 3162 6147 13890
26366
35254
37613
32357
26986
25588
17799
15932
13065
Multi-component kinetics and late gas potential of selected Cooper Basin source rocks 127

Table B10: MSSV-Pyrolysis GC-FID (secondary cracking)(continued): Boiling range yields.
G012710ex-2.0K/min
FID Range 6 6 8 8 8 9 9 9 9 9 9 9 9
Heated to, °C
355.0
408.0 430.5 445.5 464.9 476.7 490.0 505.0 517.9 526.9 540.0 560.0 580.0
Weight, mg 4.01 4.31 3.95 4.15 3.97 4.28 3.88 4.17 4.04 4.21 3.78 3.75 3.81
(µg/g sample)
C1-5 510 2233 5643 10130
19152
25647
32448
41120
45292
45923
47815
48778
50817
Methane 83 451 1243 2332 4687 6520 8713 12385
15412
17427
21195
27161
34621
C02-05 Total 427 1782 4400 7799 14465
19127
23736
28736
29880
28496
26620
21617
16196
C06-14 Total 2468 7055 15182
24119
34657
37305
32691
27384
23630
21154
20490
16790
14308
C15-32 Total(-Blank)
1577 6604 11776
15054
14170
12716
8168 6802 6070 3900 6527 3562 3193
C01-32 Total 4555 15892
32601
49304
67979
75669
73307
75306
74992
70978
74831
69131
68318
C6+ 4045 13658
26958
39174
48827
50022
40859
34186
29700
25055
27017
20352
17501
GOR 0.13 0.16 0.21 0.26 0.39 0.51 0.79 1.20 1.52 1.83 1.77 2.40 2.90
Gas wetness(C2-5/C1-5)
0.84 0.80 0.78 0.77 0.76 0.75 0.73 0.70 0.66 0.62 0.56 0.44 0.32
C06-14Resolved
1733 5396 12062
19651
29824
32698
29971
25793
22550
19994
19155
15908
13452
C15-32Resolved
614 2267 4213 5720 6244 5758 4212 3900 3698 2278 4100 2045 1897
C06-32Resolved
2348 7662 16275
25371
36068
38456
34183
29693
26247
22272
23255
17953
15348
128 Multi-component kinetics and late gas potential of selective Cooper Basin source rocks

Table B10: MSSV-Pyrolysis GC-FID (secondary cracking)(continued): Boiling range yields.
heating rate G012710ex-5.0K/min
FID Range 6 6 6 6 6 8 8 8 9 9 8 8 8
Heated to, °C
360.0 408.0
425.0 437.1 454.9 476.7 500.0 517.9 526.9 535.0 550.0 570.0 590.0
Weight, mg 4.05 3.95 3.79 3.96 3.82 3.71 3.72 3.83 3.78 3.91 4.09 4.01 3.86
(µg/g sample)
C1-5 435 1272 2393 3957 7870 16156
27879
37950
39613
42901
45463
44734
50197
Methane 59 258 476 804 1719 3701 7102 10558
11855
14027
17751
21886
29975
C02-05 Total 377 1014 1917 3153 6152 12455
20777
27391
27758
28873
27713
22848
20222
C06-14 Total 1537 4375 7281 10927
18215
32022
33855
29983
25946
24754
22296
17803
17339
C15-32 Total (-Blank)
212 2771 6044 9137 12502
15573
10495
8617 7406 7414 6660 4399 4181
C01-32 Total 2184 8419 15719
24021
38587
63751
72229
76550
72965
75069
74419
66936
71718
C6+ 1749 7146 13326
20064
30717
47595
44350
38600
33352
32168
28956
22202
21520
GOR 0.25 0.18 0.18 0.20 0.26 0.34 0.63 0.98 1.19 1.33 1.57 2.01 2.33
Gas wetness(C2-5/C1-5)
0.86 0.80 0.80 0.80 0.78 0.77 0.75 0.72 0.70 0.67 0.61 0.51 0.40
C06-14Resolved
1202 3258 5532 8481 14751
26369
29988
27803
24390
23613
21134
17089
16586
C15-32Resolved
99 1084 2182 3175 4593 6264 4674 4330 4006 3548 4185 2843 2724
C06-32Resolved
1301 4342 7713 11656
19344
32633
34662
32133
28396
27161
25319
19932
19310
Multi-component kinetics and late gas potential of selected Cooper Basin source rocks 129

Table B11a: MSSV-Pyrolysis GC-FID (secondary cracking). Single compound yields for 0.7 K/min.
Sample/heating rate G012710ex-0.7K/min
FID Range 6 6 6 6 8 8 9 9 9 9 9 9 9
Heated to, °C 300.0
350.0
384.5
408.9
425.0
445.5 470.0 485.0 493.5 505.0 520.0 540.0 560.0
Weight, mg 4.12 4.27 4.21 4.13 4.18 4.16 3.99 4.07 3.85 3.84 3.82 3.84 3.81
(µg/g sample)
Methane 29 96 338 973 2223 4730 9215 13057
14735
18388
21888
29377
36560
N-C02 14 58 270 881 2107 4308 7863 10450
11290
13259
13445
13783
12846
N-C03 8 69 300 871 1950 3775 6944 9253 9681 10992
9475 5811 1931
N-C04 11 36 129 398 977 2010 3728 4602 4299 3609 1372 105 24
N-C05 9 24 94 297 729 1463 2421 2330 1663 717 69 10 0
N-C06 13 32 96 278 653 1251 1772 1245 648 142 14 0 0
Benzene 31 45 88 172 286 376 572 713 738 885 954 1462 2269
N-C07 16 34 118 341 743 1227 1379 712 288 40 0 0 0
Toluene 100 155 290 500 870 1230 1920 2512 2608 3118 3122 3577 3559
N-C08 23 36 88 227 504 842 840 328 103 0 0 0 0
Ethylbenzene 8 20 55 122 227 342 534 625 600 591 422 258 149
m+p-Xylene 86 135 239 401 682 966 1459 1838 1855 2151 1990 1902 1328
o-Xylene 27 42 75 138 250 378 584 682 656 688 539 367 174
N-C09 17 25 64 174 399 673 613 176 42 0 0 0 0
Phenol 30 39 84 288 238 455 852 1247 1169 1652 1453 1435 805
1,2,4-TriM-Benzene
21 31 58 107 208 297 452 522 489 502 396 219 79
N-C10 17 27 61 165 405 630 502 111 0 0 0 0 0
1,2,3-TriM-Benzene
9 15 34 80 137 184 244 240 217 193 109 47 16
o-Cresol 11 24 66 229 454 671 929 970 818 748 411 196 65
m+p-Cresol 9 18 55 276 569 809 1398 1629 1446 1597 1005 599 188
N-C11 16 24 61 163 362 563 380 0 0 0 0 0 0
TetraM-Benzene ? 3 8 29 134 302 490 677 612 417 324 106 24 0
Naphthalene 37 44 68 127 231 329 437 510 484 599 579 812 915
N-C12 18 26 66 199 449 686 457 0 0 0 0 0 0
2-M-Naphthalene 36 45 82 155 298 467 707 816 771 913 760 701 388
1-M-Naphthalene 28 34 63 130 249 335 413 429 381 399 257 166 66
N-C13 20 24 60 171 401 596 276 0 0 0 0 0 0
130 Multi-component kinetics and late gas potential of selective Cooper Basin source rocks

Sample/heating rate G012710ex-0.7K/min
N-C14 20 24 60 188 400 535 229 0 0 0 0 0 0
N-C15 30 27 70 204 343 439 240 0 0 0 0 0 0
N-C16 15 29 62 130 232 284 111 0 0 0 0 0 0
N-C17 15 27 63 132 244 283 90 0 0 0 0 0 0
N-C18 12 20 48 117 213 222 74 0 0 0 0 0 0
N-C19 10 15 43 106 194 218 0 0 0 0 0 0 0
N-C20 10 16 36 77 124 120 0 0 0 0 0 0 0
N-C21 4 13 30 54 108 84 0 0 0 0 0 0 0
N-C22 5 16 32 64 110 100 0 0 0 0 0 0 0
N-C23 3 8 18 43 73 60 0 0 0 0 0 0 0
N-C24 5 7 16 38 64 47 0 0 0 0 0 0 0
N-C25 3 9 17 32 51 36 0 0 0 0 0 0 0
N-C26 2 5 10 22 36 24 0 0 0 0 0 0 0
N-C27 1 7 9 18 31 20 0 0 0 0 0 0 0
N-C28 1 6 7 14 21 13 0 0 0 0 0 0 0
N-C29 0 0 4 8 13 0 0 0 0 0 0 0 0
N-C30 0 0 2 7 0 0 0 0 0 0 0 0 0
DMN1 (Group_E) 71 89 202 554 1109 1288 1091 967 798 750 415 285 180
DMN2 (Group_F) 105 122 263 696 1054 1264 1286 1343 1182 1123 558 323 147
TMN (Group_G) 36 37 96 197 294 330 342 337 304 275 130 169 139
TeMN (Group_H) 64 86 186 344 545 607 483 395 334 324 163 148 109
nC6-14 160 251 673 1905 4316 7003 6447 2573 1081 182 14 0 0
nC15+ 116 207 466 1066 1856 1951 515 0 0 0 0 0 0
Sum of Phenols 49 81 205 793 1261 1935 3178 3846 3432 3997 2870 2230 1058
Sum of Aro 664 906 1824 3855 6741 8882 11199
12542
11836
12836
10500
10459
9518
Sum Aro+Phenol 713 987 2029 4648 8002 10817
14377
16388
15268
16833
13370
12688
10576
Table B11b: MSSV-Pyrolysis GC-FID (secondary cracking). Single compound yields for 2.0 K/min.
Sample/heating rate G012710ex-2.0K/min
FID Range 6 6 8 8 8 9 9 9 9 9 9 9 9
Heated to, °C 355.0
408.0
430.5
445.5
464.9 476.7 490.0 505.0 517.9 526.9 540.0 560.0 580.0
Weight, mg 4.01 4.31 3.95 4.15 3.97 4.28 3.88 4.17 4.04 4.21 3.78 3.75 3.81
(µg/g sample)
Methane 83 451 1243 2332 4687 6520 8713 12385
15412
17427
21195
27161
34621
Multi-component kinetics and late gas potential of selected Cooper Basin source rocks 131

Sample/heating rate G012710ex-2.0K/min
N-C02 44 395 1147 2186 4349 5916 7623 10105
11818
12409
13522
13988
13526
N-C03 51 438 1142 2045 3909 5242 6770 8858 9969 10165
9716 6604 2365
N-C04 25 172 494 972 1918 2644 3325 4011 3656 2988 1325 143 45
N-C05 20 129 364 719 1371 1909 2047 1838 1052 461 83 15 0
N-C06 20 124 336 638 1204 1483 1467 898 308 79 0 0 0
Benzene 38 108 200 282 424 520 629 774 872 914 1113 1450 2206
N-C07 27 158 413 728 1187 1363 1134 498 121 0 0 0 0
Toluene 129 334 550 817 1212 1521 1803 2349 2706 2888 3242 3505 3676
N-C08 30 111 265 485 788 856 636 204 33 0 0 0 0
Ethylbenzene 14 69 137 218 342 420 492 576 575 544 505 355 234
m+p-Xylene 108 269 445 656 959 1177 1327 1679 1804 1848 2018 1910 1498
o-Xylene 34 85 154 240 378 471 528 616 624 601 580 437 258
N-C09 25 81 203 386 627 655 439 102 0 0 0 0 0
Phenol 45 128 308 273 397 518 786 1127 1284 1455 1564 1605 1223
1,2,4-TriM-Benzene 30 67 122 203 296 372 404 466 461 432 405 298 128
N-C10 21 76 191 393 597 598 364 65 0 0 0 0 0
1,2,3-TriM-Benzene 11 41 91 132 185 220 216 212 196 169 134 72 28
o-Cresol 20 91 252 418 678 809 845 905 823 717 596 307 130
m+p-Cresol 22 89 312 464 916 1086 1369 1532 1505 1468 1280 852 394
N-C11 18 76 191 353 529 486 266 0 0 0 0 0 0
TetraM-Benzene ? 9 49 158 269 551 667 677 626 477 353 227 72 18
Naphthalene 37 70 134 199 324 372 382 447 482 480 581 715 846
N-C12 18 85 234 432 669 612 365 0 0 0 0 0 0
2-M-Naphthalene 38 91 172 289 474 597 611 719 756 693 795 753 541
1-M-Naphthalene 28 71 150 247 350 384 366 391 384 346 333 237 127
N-C13 16 74 205 400 578 473 198 0 0 0 0 0 0
N-C14 16 82 232 425 537 422 170 0 0 0 0 0 0
N-C15 21 95 206 343 399 351 180 0 0 0 0 0 0
N-C16 18 80 137 219 261 189 0 0 0 0 0 0 0
N-C17 19 73 156 229 265 202 0 0 0 0 0 0 0
N-C18 15 58 128 201 200 137 0 0 0 0 0 0 0
N-C19 12 53 122 185 193 148 0 0 0 0 0 0 0
N-C20 12 42 88 107 102 77 0 0 0 0 0 0 0
N-C21 8 35 71 87 74 44 0 0 0 0 0 0 0
N-C22 7 38 75 105 93 72 0 0 0 0 0 0 0
N-C23 4 22 49 71 55 27 0 0 0 0 0 0 0
132 Multi-component kinetics and late gas potential of selective Cooper Basin source rocks
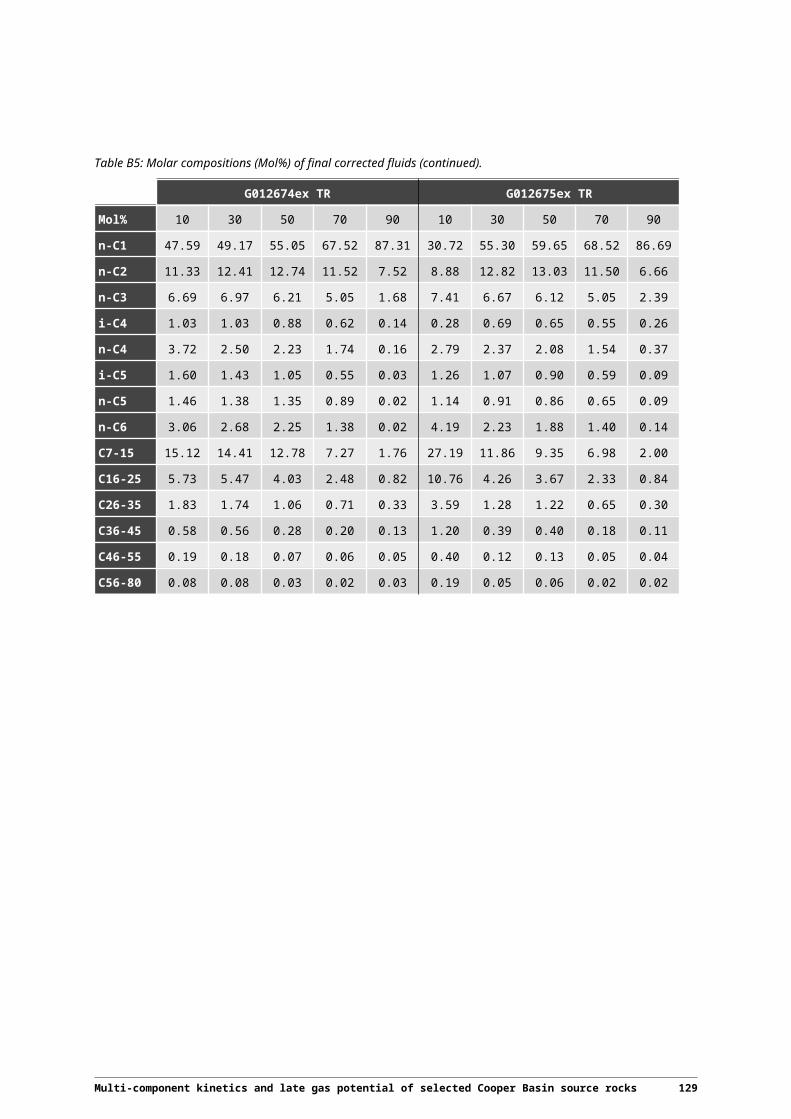
Sample/heating rate G012710ex-2.0K/min
N-C24 5 20 44 60 43 22 0 0 0 0 0 0 0
N-C25 3 21 41 46 32 0 0 0 0 0 0 0 0
N-C26 3 13 26 34 22 0 0 0 0 0 0 0 0
N-C27 2 11 20 28 18 0 0 0 0 0 0 0 0
N-C28 0 9 15 18 11 0 0 0 0 0 0 0 0
N-C29 0 0 12 11 7 0 0 0 0 0 0 0 0
N-C30 0 0 9 10 5 0 0 0 0 0 0 0 0
DMN1 (Group_E) 69 273 707 1153 1604 1555 1143 980 849 637 684 409 283
DMN2 (Group_F) 97 376 859 1205 1391 1432 1236 1266 1196 946 979 518 308
TMN (Group_G) 37 136 202 272 332 348 321 381 294 242 248 101 51
TeMN (Group_H) 61 237 356 508 605 581 448 396 352 252 342 198 166
nC6-14 192 868 2270 4241 6714 6948 5039 1767 462 79 0 0 0
nC15+ 129 571 1199 1754 1780 1269 180 0 0 0 0 0 0
Sum of Phenols 87 308 872 1155 1991 2412 3000 3565 3612 3640 3440 2764 1747
Sum of Aro 741 2276 4438 6688 9427 10637
10582
11878
12026
11345
12186
11030
10368
Sum Aro+Phenol 828 2585 5310 7844 11418
13049
13582
15442
15638
14985
15626
13795
12115
Multi-component kinetics and late gas potential of selected Cooper Basin source rocks 133

Table B11c: MSSV-Pyrolysis GC-FID (secondary cracking). Single compound yields for 5.0 K/min.
Sample/heating rate G012710ex-5.0K/min
FID Range 6 6 6 6 6 8 8 8 9 9 8 8 8
Heated to, °C 360.0
408.0
425.0
437.1
454.9
476.7 500.0 517.9 526.9 535.0 550.0 570.0 590.0
Weight, mg 4.05 3.95 3.79 3.96 3.82 3.71 3.72 3.83 3.78 3.91 4.09 4.01 3.86
(µg/g sample)
Methane 59 258 476 804 1719 3701 7102 10558
11855
14027
17751
21886
29975
N-C02 32 196 432 769 1679 3627 6546 9171 9930 11126
12566
13050
14492
N-C03 39 221 473 808 1611 3332 5803 8189 8684 9548 9883 7797 4875
N-C04 123 86 178 321 694 1501 2626 3513 3477 3253 2034 430 112
N-C05 13 62 130 236 506 1067 1698 1794 1430 980 253 36 17
N-C06 14 59 124 223 461 968 1364 1093 669 319 41 0 0
Benzene 36 79 115 164 246 427 614 844 878 987 1174 1423 2072
N-C07 18 79 164 285 552 1010 1158 692 350 146 0 0 0
Toluene 114 217 318 437 648 1055 1535 2133 2307 2662 3081 3206 3732
N-C08 23 61 107 181 357 655 686 319 131 37 0 0 0
Ethylbenzene 11 37 66 102 171 293 420 541 540 568 546 444 399
m+p-Xylene 94 178 262 358 533 837 1167 1496 1553 1733 1878 1776 1800
o-Xylene 28 54 81 117 190 319 467 573 572 605 586 471 396
N-C09 16 42 79 136 280 510 503 186 63 0 0 0 0
Phenol 31 96 136 188 188 486 725 1023 1150 1378 1502 1453 1485
1,2,4-TriM-Benzene 20 42 64 93 153 253 362 443 422 435 408 302 250
N-C10 16 39 75 129 292 497 448 131 40 0 0 0 0
1,2,3-TriM-Benzene 9 23 41 71 111 159 203 206 193 189 160 95 60
o-Cresol 9 58 98 147 304 571 792 895 861 874 711 473 332
m+p-Cresol 7 74 118 162 357 826 1287 1556 1570 1703 1509 1086 778
N-C11 15 39 77 131 258 445 350 86 0 0 0 0 0
TetraM-Benzene ? 2 35 58 85 192 476 662 727 629 589 399 188 91
Naphthalene 34 50 70 90 143 273 342 405 418 466 518 570 757
N-C12 16 46 90 151 297 571 458 139 0 0 0 0 0
2-M-Naphthalene 28 62 91 126 187 394 561 656 652 715 745 680 718
1-M-Naphthalene 22 45 71 105 161 308 346 382 362 378 364 288 244
N-C13 11 38 75 133 251 498 297 68 0 0 0 0 0
N-C14 9 40 83 151 259 463 264 50 0 0 0 0 0
N-C15 9 47 95 157 215 334 243 74 0 0 0 0 0
134 Multi-component kinetics and late gas potential of selective Cooper Basin source rocks
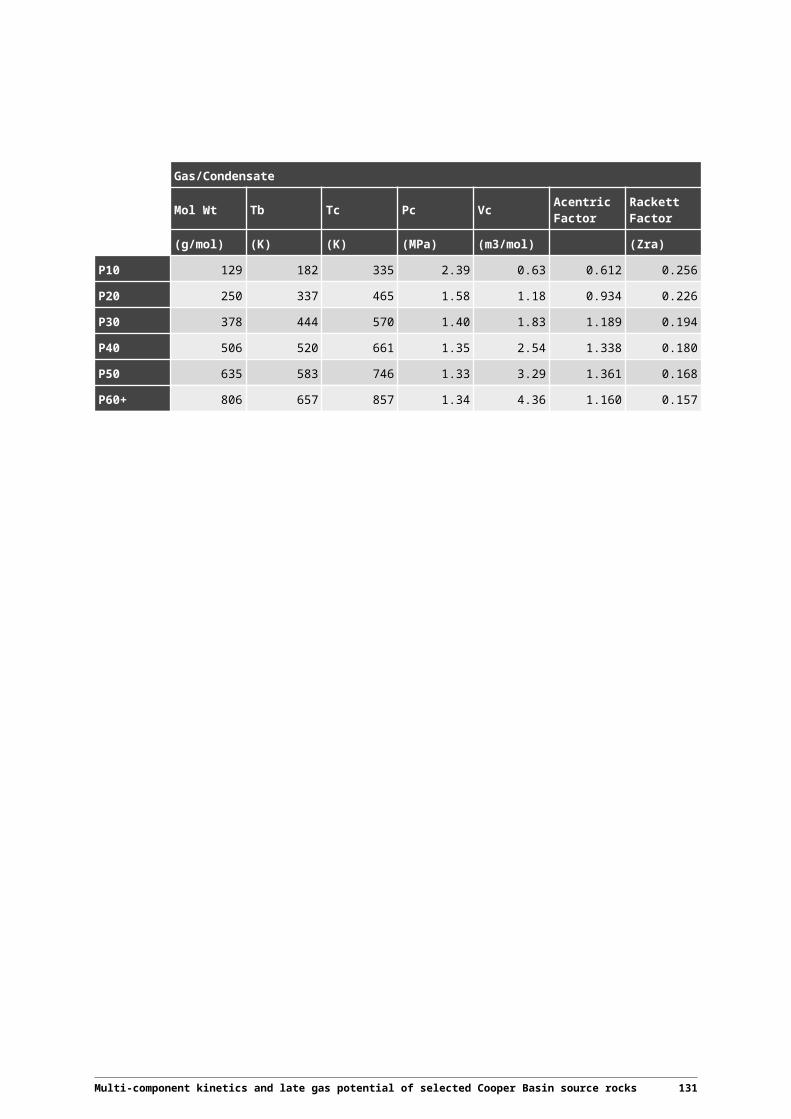
Sample/heating rate G012710ex-5.0K/min
N-C16 4 40 76 108 161 238 122 0 0 0 0 0 0
N-C17 3 39 69 114 190 254 108 0 0 0 0 0 0
N-C18 0 31 58 94 143 211 86 0 0 0 0 0 0
N-C19 0 28 56 88 143 192 102 0 0 0 0 0 0
N-C20 0 22 50 69 85 109 49 0 0 0 0 0 0
N-C21 0 17 35 50 83 98 25 0 0 0 0 0 0
N-C22 0 12 35 53 87 96 0 0 0 0 0 0 0
N-C23 0 8 22 35 58 57 0 0 0 0 0 0 0
N-C24 0 8 21 32 51 49 0 0 0 0 0 0 0
N-C25 0 7 20 28 40 44 0 0 0 0 0 0 0
N-C26 0 5 13 19 28 25 0 0 0 0 0 0 0
N-C27 0 2 9 15 22 20 0 0 0 0 0 0 0
N-C28 0 1 7 10 15 13 0 0 0 0 0 0 0
N-C29 0 0 4 7 10 9 0 0 0 0 0 0 0
N-C30 0 0 3 4 9 6 0 0 0 0 0 0 0
DMN1 (Group_E) 34 152 286 458 755 1322 1081 1030 928 901 836 533 428
DMN2 (Group_F) 44 191 371 578 846 1261 1162 1272 1228 1228 1226 806 592
TMN (Group_G) 14 65 126 182 214 310 321 345 327 317 307 198 113
TeMN (Group_H) 14 126 227 302 395 590 517 489 432 408 439 318 285
nC6-14 139 442 875 1521 3006 5618 5527 2766 1252 502 41 0 0
nC15+ 16 269 572 883 1341 1755 733 74 0 0 0 0 0
Sum of Phenols 47 228 352 497 849 1882 2804 3474 3581 3955 3722 3012 2595
Sum of Aro 503 1355 2248 3267 4945 8278 9759 11543
11443
12181
12667
11298
11938
Sum Aro+Phenol 550 1583 2600 3764 5794 10160
12564
15017
15025
16136
16389
14310
14532
Table B12: MSSV-Pyrolysis GC-FID (secondary cracking). Activation energy distribution and frequency factors for primary and secondary petroleum formation from sample G012710ex.
MSSV-bulk prim. Oil prim. Gas sec. Gas
10% TR (°C) 156.6 152.7 163.9 193.6
50% TR (°C) 177.1 173.6 184.4 213.9
90% TR (°C) 219.9 216.0 226.7 256.5
A (1/sec) 1.94E+16 1.49E+16 1.08E+16 2.53E+16
Ea (kcal/mol) (%)
45
46
47
Multi-component kinetics and late gas potential of selected Cooper Basin source rocks 135

MSSV-bulk prim. Oil prim. Gas sec. Gas
48
49
50
51
52 0.07
53 0.12 0.22 0.02
54 0.19 0.28 0.20
55 0.44 0.50 0.25
56 0.34 0.74 0.37
57 1.23 1.27 0.69
58 0.70 1.64 0.92 0.02
59 2.47 4.87 1.44 0.28
60 6.31 18.59 2.42 0.11
61 22.79 20.57 16.21 0.57
62 18.15 12.39 22.68 0.40
63 11.20 10.75 13.40 1.17
64 9.96 5.75 11.50 0.60
65 4.99 5.37 6.54 2.82
66 5.30 4.01 5.25 19.05
67 3.40 2.62 4.70 21.80
68 2.65 2.34 2.36 12.58
69 2.07 1.80 2.93 11.25
70 1.72 0.94 1.36 6.17
71 0.94 2.29 1.43 4.96
72 2.13 2.15 5.16
73 1.44
74 3.00 4.08
75 2.89 3.17
76 2.61
77 1.57
78
79
80 3.36
136 Multi-component kinetics and late gas potential of selective Cooper Basin source rocks

Appendix C – Figures
Figure C1: Thermovaporisation chromatograms of Patchawarra Coals. For reference, selected peaks are marked.
Multi-component kinetics and late gas potential of selected Cooper Basin source rocks 137

Figure C1 (continued): Thermovaporisation chromatograms of Patchawarra Coals. For reference, selected peaks are marked.
138 Multi-component kinetics and late gas potential of selective Cooper Basin source rocks

Figure C1 (continued): Thermovaporisation chromatograms of Patchawarra Coals. For reference, selected peaks are marked.
Multi-component kinetics and late gas potential of selected Cooper Basin source rocks 139

Figure C1 (continued): Thermovaporisation chromatograms of Patchawarra Coals. For reference, selected peaks are marked.
140 Multi-component kinetics and late gas potential of selective Cooper Basin source rocks
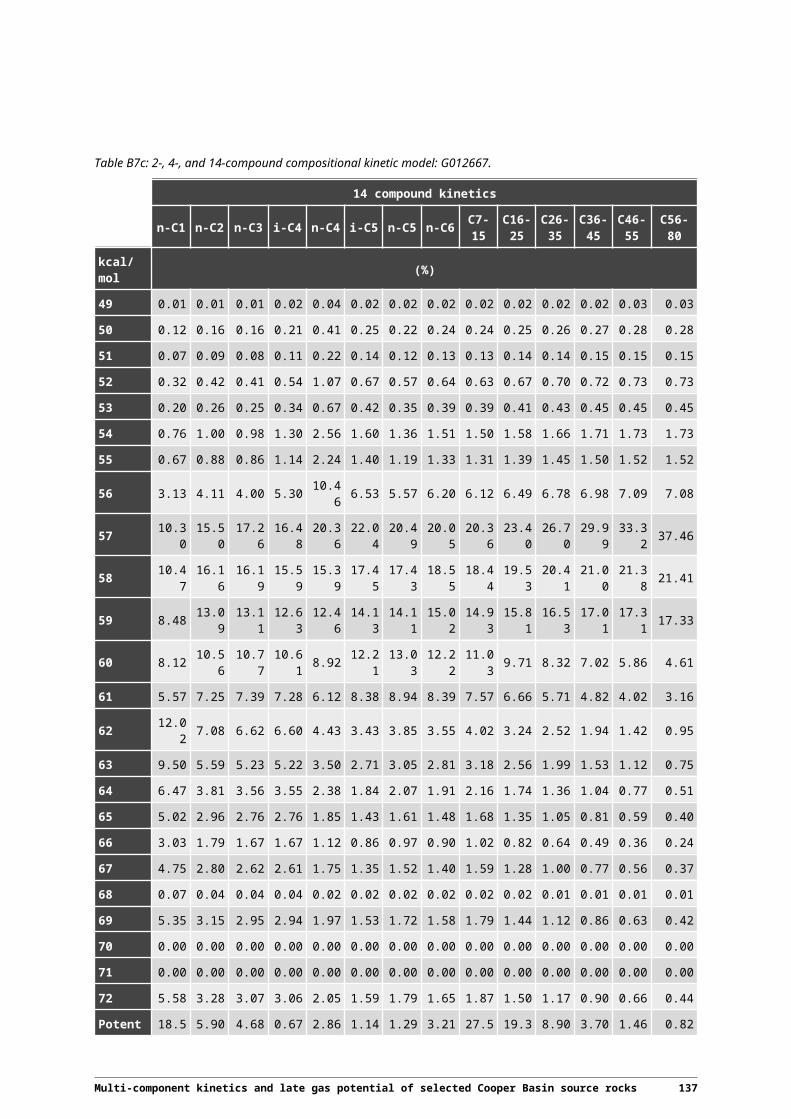
Figure C1 (continued): Thermovaporisation chromatograms of Patchawarra Coals. For reference, selected peaks are marked.
Multi-component kinetics and late gas potential of selected Cooper Basin source rocks 141
Figure C1 (continued): Thermovaporisation chromatograms of Patchawarra Coals. For reference, selected peaks are marked.
142 Multi-component kinetics and late gas potential of selective Cooper Basin source rocks

Figure C1 (continued): Thermovaporisation chromatograms of Patchawarra Coals. For reference, selected peaks are marked.
Multi-component kinetics and late gas potential of selected Cooper Basin source rocks 143

Figure C1 (continued): Thermovaporisation chromatogram of Roseneath Shale. For reference, selected peaks are marked.
144 Multi-component kinetics and late gas potential of selective Cooper Basin source rocks

Figure C2: Pyrolysis gas chromatograms detail of Cooper Basin Coals and Shales. For reference, selected peaks are marked.
Multi-component kinetics and late gas potential of selected Cooper Basin source rocks 145

Figure C2 (continued): Pyrolysis gas chromatograms detail of Cooper Basin Coals and Shales. For reference, selected peaks are marked.
146 Multi-component kinetics and late gas potential of selective Cooper Basin source rocks

Figure C2 (continued): Pyrolysis gas chromatograms detail of Cooper Basin Coals and Shales. For reference, selected peaks are marked.
Multi-component kinetics and late gas potential of selected Cooper Basin source rocks 147

Figure C2 (continued): Pyrolysis gas chromatograms detail of Patchawarra Fm. Coals. For reference, selected peaks are marked.
148 Multi-component kinetics and late gas potential of selective Cooper Basin source rocks

Figure C2 (continued): Pyrolysis gas chromatograms detail of Patchawarra Fm. Coals.For reference, selected peaks are marked.
Multi-component kinetics and late gas potential of selected Cooper Basin source rocks 149

Figure C2 (continued): Pyrolysis gas chromatograms detail of Patchawarra Fm. Coals.For reference, selected peaks are marked.
150 Multi-component kinetics and late gas potential of selective Cooper Basin source rocks

Figure C2 (continued): Pyrolysis gas chromatograms detail of Patchawarra Fm. Coals.For reference, selected peaks are marked.
Multi-component kinetics and late gas potential of selected Cooper Basin source rocks 151

Figure C2 (continued): Pyrolysis gas chromatograms detail of Patchawarra Fm. Coals.For reference, selected peaks are marked.
152 Multi-component kinetics and late gas potential of selective Cooper Basin source rocks

Figure C2 (continued): Pyrolysis gas chromatograms detail of Patchawarra Fm. Coals.For reference, selected peaks are marked.
Multi-component kinetics and late gas potential of selected Cooper Basin source rocks 153

Figure C2 (continued): Pyrolysis gas chromatograms detail of Patchawarra Fm. Coals.For reference, selected peaks are marked.
154 Multi-component kinetics and late gas potential of selective Cooper Basin source rocks

Figure C2 (continued): Pyrolysis gas chromatograms detail of Patchawarra Fm. Coals.For reference, selected peaks are marked.
Multi-component kinetics and late gas potential of selected Cooper Basin source rocks 155

Figure C2 (continued): Pyrolysis gas chromatograms detail of Patchawarra Fm. Coals.For reference, selected peaks are marked.
156 Multi-component kinetics and late gas potential of selective Cooper Basin source rocks

Figure C2 (continued): Pyrolysis gas chromatograms detail of Patchawarra Fm. Coals.For reference, selected peaks are marked.
Multi-component kinetics and late gas potential of selected Cooper Basin source rocks 157

Figure C2 (continued): Pyrolysis gas chromatograms detail of Patchawarra Fm. Coals.For reference, selected peaks are marked.
158 Multi-component kinetics and late gas potential of selective Cooper Basin source rocks

Figure C3: MSSV chromatograms a) sample G012667: Transformation ratio (TR) of 10 % (top) and 30% (bottom).
Multi-component kinetics and late gas potential of selected Cooper Basin source rocks 159
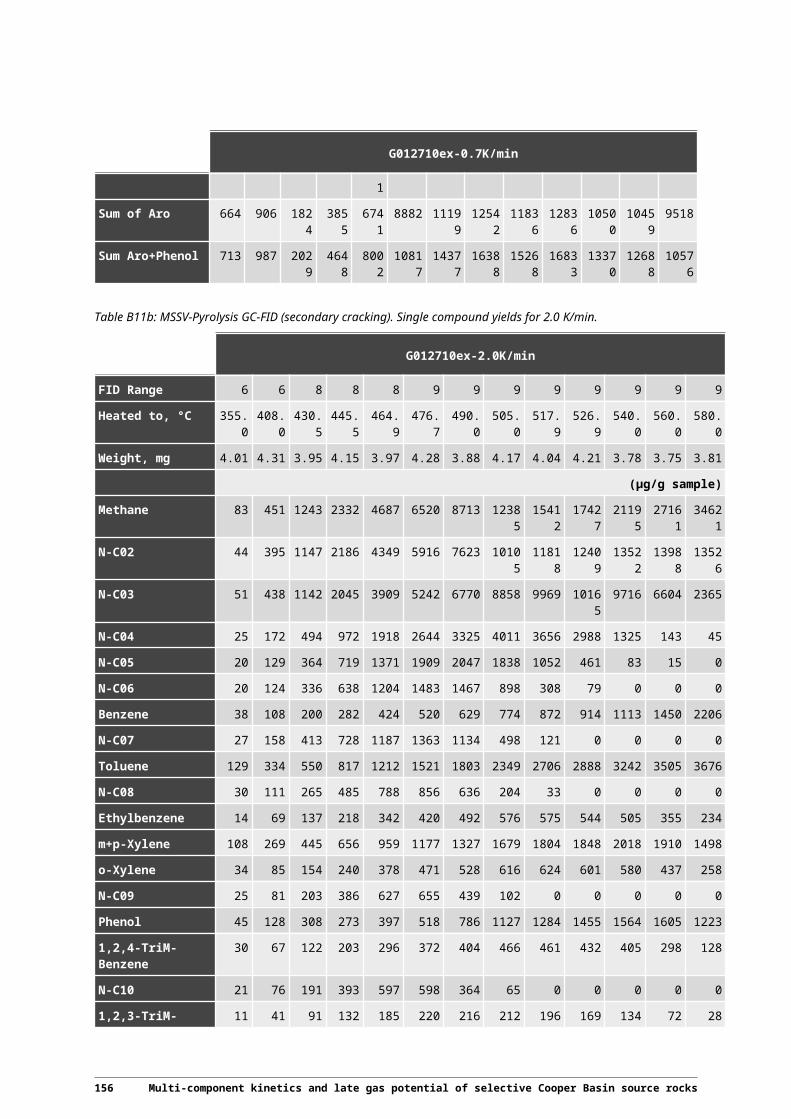
Figure C3 (contd.): MSSV chromatograms a) sample G012667: Transformation Ratio (TR) of 50 % (top), 70% (middle) and 90% (bottom).
160 Multi-component kinetics and late gas potential of selective Cooper Basin source rocks

Figure C3: MSSV chromatograms b) sample G012669: Transformation ratio (TR) of 10 % (top) and 30% (bottom).
Multi-component kinetics and late gas potential of selected Cooper Basin source rocks 161

Figure C3 (contd.): MSSV chromatograms b) sample G012669: Transformation Ratio (TR) of 50 % (top), 70% (middle) and 90% (bottom).
162 Multi-component kinetics and late gas potential of selective Cooper Basin source rocks

Figure C3: MSSV chromatograms c) sample G012674: Transformation ratio (TR) of 10 % (top) and 30% (bottom).
Multi-component kinetics and late gas potential of selected Cooper Basin source rocks 163

Figure C3 (contd.): MSSV chromatograms c) sample G012674: Transformation Ratio (TR) of 50 % (top), 70% (middle) and 90% (bottom).
164 Multi-component kinetics and late gas potential of selective Cooper Basin source rocks

Figure C3: MSSV chromatograms d) sample G012675: Transformation ratio (TR) of 10 % (top) and 30% (bottom).
Multi-component kinetics and late gas potential of selected Cooper Basin source rocks 165

Figure C3 (contd.): MSSV chromatograms d) sample G012675: Transformation Ratio (TR) of 50 % (top), 70% (middle) and 90% (bottom).
166 Multi-component kinetics and late gas potential of selective Cooper Basin source rocks
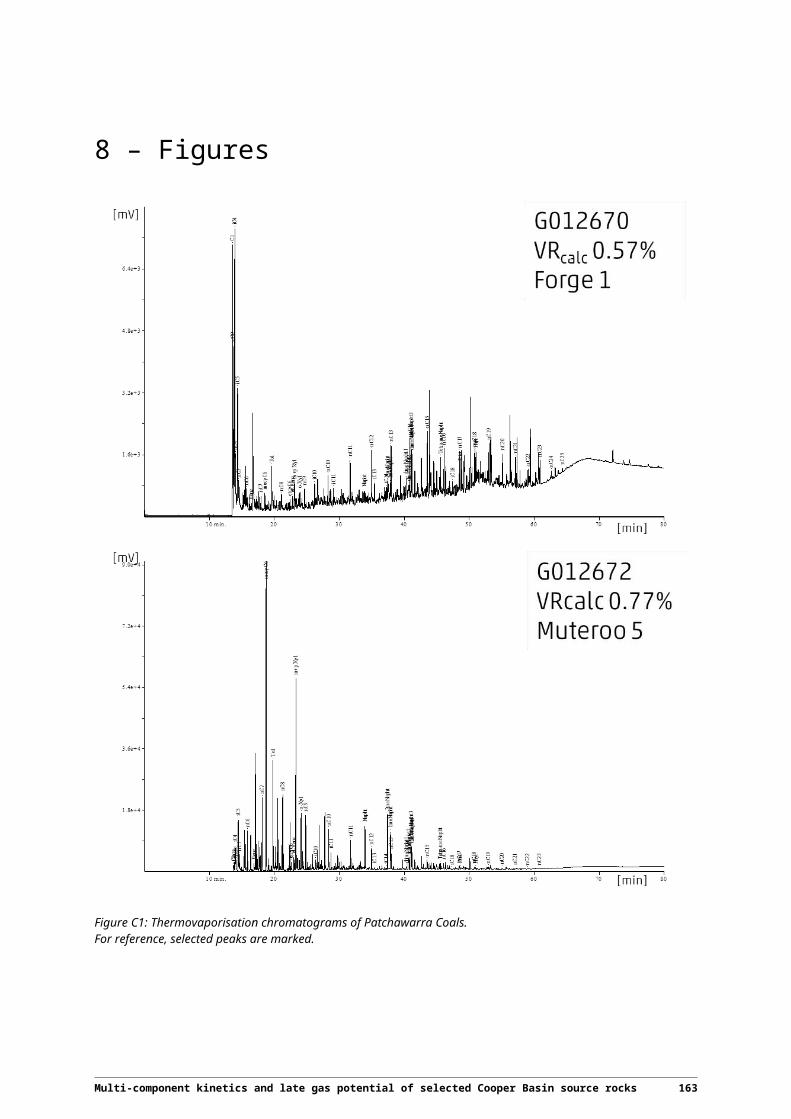
Figure C3: MSSV chromatograms e) sample G012670: Transformation ratio (TR) of 10 % (top) and 30% (bottom).
Multi-component kinetics and late gas potential of selected Cooper Basin source rocks 167

Figure C3 (contd.): MSSV chromatograms e) sample G012670: Transformation Ratio (TR) of 50 % (top), 70% (middle) and 90% (bottom).
168 Multi-component kinetics and late gas potential of selective Cooper Basin source rocks

Figure C4: Late Gas Potential MSSV chromatograms of a) sample G012670: end temperatures 560°C (top) and 700°C (bottom). For reference, selected peaks are marked: B= benzene, T = toluene.
Multi-component kinetics and late gas potential of selected Cooper Basin source rocks 169

Figure C4: Late Gas Potential MSSV chromatograms of b) sample G012710: end temperatures 560°C (top) and 700°C (bottom). For reference, selected peaks are marked: B= benzene, T = toluene.
170 Multi-component kinetics and late gas potential of selective Cooper Basin source rocks

Figure C4: Late Gas Potential MSSV chromatograms of c) sample G012672: end temperatures 560°C (top) and 700°C (bottom). For reference, selected peaks are marked: B= benzene, T = toluene.
Multi-component kinetics and late gas potential of selected Cooper Basin source rocks 171

Figure C4: Late Gas Potential MSSV chromatograms of d) sample G012677: end temperatures 560°C (top) and 700°C (bottom). For reference, selected peaks are marked: B= benzene, T = toluene.
172 Multi-component kinetics and late gas potential of selective Cooper Basin source rocks

Figure C4: Late Gas Potential MSSV chromatograms of e) sample G012678: end temperatures 560°C (top) and 700°C (bottom). For reference, selected peaks are marked: B= benzene, T = toluene.
Multi-component kinetics and late gas potential of selected Cooper Basin source rocks 173

Figure C4: Late Gas Potential MSSV chromatograms of f) sample G012680: end temperatures 560°C (top) and 700°C (bottom). For reference, selected peaks are marked: B= benzene, T = toluene.
174 Multi-component kinetics and late gas potential of selective Cooper Basin source rocks

Figure C4: Late Gas Potential MSSV chromatograms of g) sample G012681: end temperatures 560°C (top) and 700°C (bottom). For reference, selected peaks are marked: B= benzene, T = toluene.
Multi-component kinetics and late gas potential of selected Cooper Basin source rocks 175

Figure C4: Late Gas Potential MSSV chromatograms of h) sample G012683: end temperatures 560°C (top) and 700°C (bottom). For reference, selected peaks are marked: B= benzene, T = toluene.
176 Multi-component kinetics and late gas potential of selective Cooper Basin source rocks

Figure C4: Late Gas Potential MSSV chromatograms of i) sample G012684: end temperatures 560°C (top) and 700°C (bottom). For reference, selected peaks are marked: B= benzene, T = toluene.
Multi-component kinetics and late gas potential of selected Cooper Basin source rocks 177

Figure C4: Late Gas Potential MSSV chromatograms of j) sample G012685: end temperatures 560°C (top) and 700°C (bottom). For reference, selected peaks are marked: B= benzene, T = toluene.
178 Multi-component kinetics and late gas potential of selective Cooper Basin source rocks
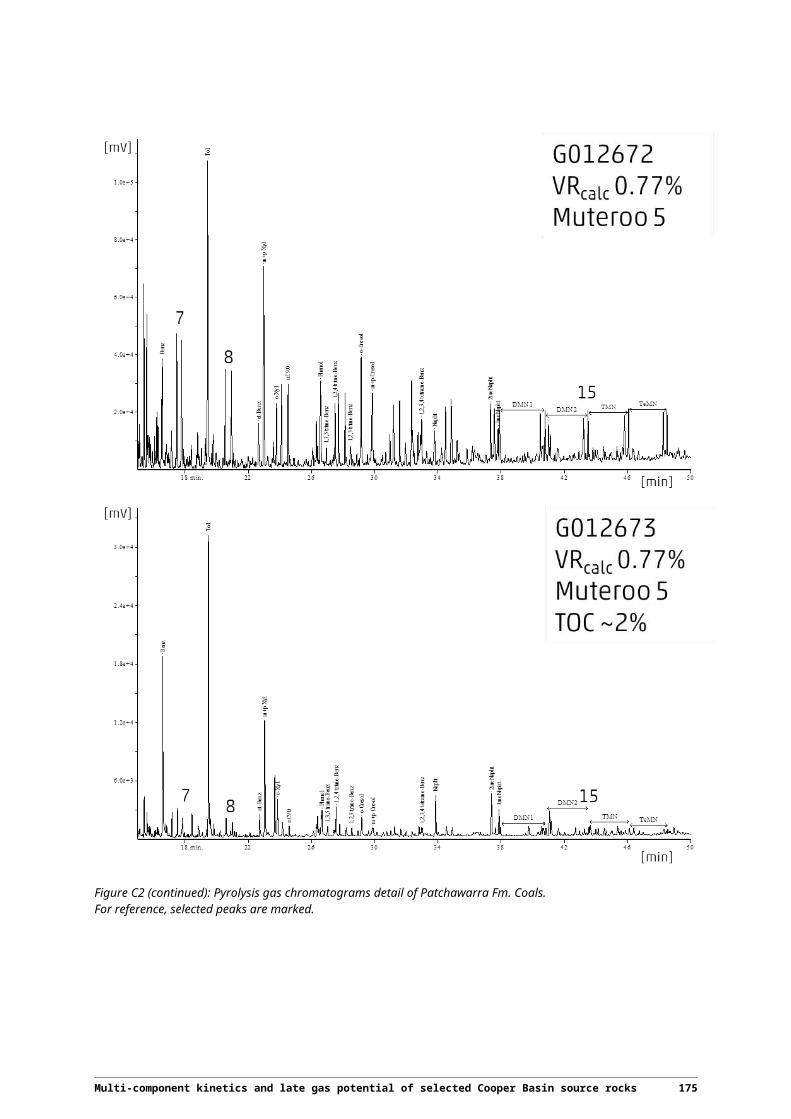
Figure C4: Late Gas Potential MSSV chromatograms of k) sample G012687: end temperatures 560°C (top) and 700°C (bottom). For reference, selected peaks are marked: B= benzene, T = toluene.
Multi-component kinetics and late gas potential of selected Cooper Basin source rocks 179

Figure C4: Late Gas Potential MSSV chromatograms of l) sample G012688: end temperatures 560°C (top) and 700°C (bottom). For reference, selected peaks are marked: B= benzene, T = toluene.
180 Multi-component kinetics and late gas potential of selective Cooper Basin source rocks

Figure C4: Late Gas Potential MSSV chromatograms of m) sample G012693: end temperatures 560°C (top) and 700°C (bottom). For reference, selected peaks are marked: B= benzene, T = toluene.
Multi-component kinetics and late gas potential of selected Cooper Basin source rocks 181

Figure C4: Late Gas Potential MSSV chromatograms of n) sample G012692: end temperatures 560°C (top) and 700°C (bottom). For reference, selected peaks are marked: B= benzene, T = toluene.
182 Multi-component kinetics and late gas potential of selective Cooper Basin source rocks

Figure C4: Late Gas Potential MSSV chromatograms of o) sample G012690: end temperatures 560°C (top) and 700°C (bottom). For reference, selected peaks are marked: B= benzene.
Multi-component kinetics and late gas potential of selected Cooper Basin source rocks 183

Figure C5: MSSV chromatograms of Patchawarra Fm. sample G012710 using a heating rate of a) 0.7°C/min.
184 Multi-component kinetics and late gas potential of selective Cooper Basin source rocks

Figure C5 (contd.): MSSV chromatograms of Patchawarra Fm. sample G012710 using a heating rate of a) 0.7°C/min.
Multi-component kinetics and late gas potential of selected Cooper Basin source rocks 185

Figure C5 (contd.): MSSV chromatograms of Patchawarra Fm. sample G012710 using a heating rate of a) 0.7°C/min.
186 Multi-component kinetics and late gas potential of selective Cooper Basin source rocks

Figure C5 (contd.): MSSV chromatograms of Patchawarra Fm. sample G012710 using a heating rate of a) 0.7°C/min.
Multi-component kinetics and late gas potential of selected Cooper Basin source rocks 187
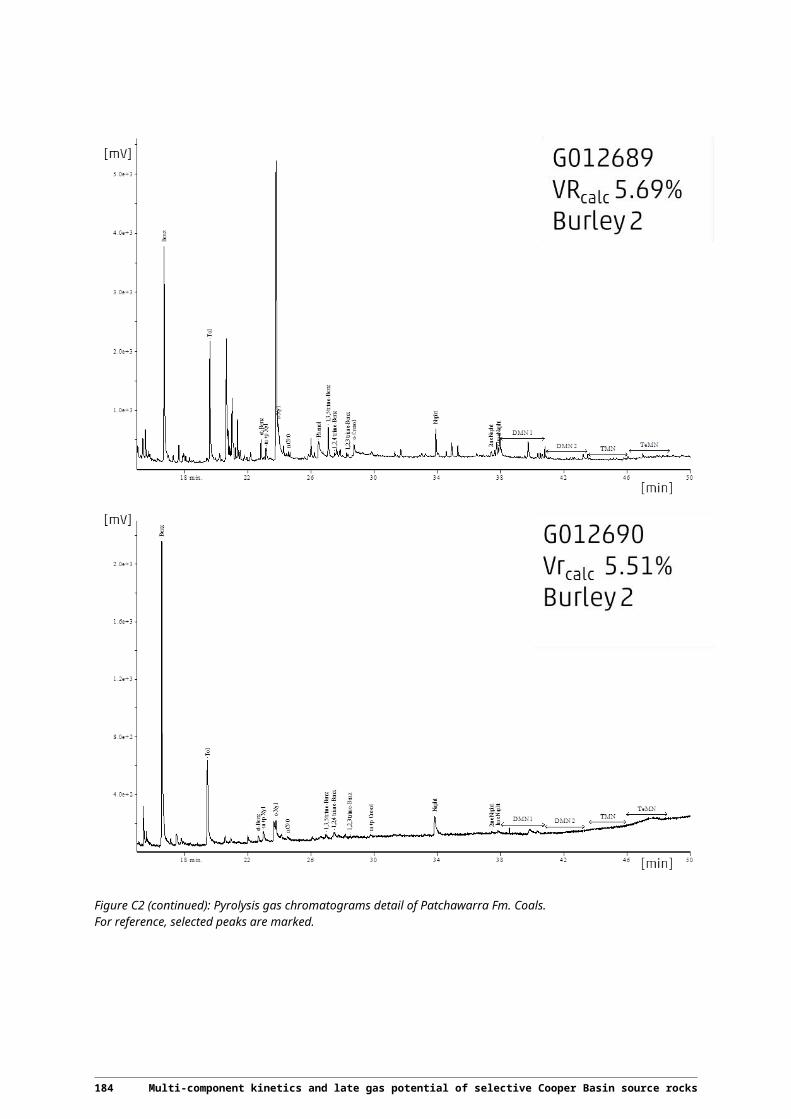
Figure C5 (contd.): MSSV chromatograms of Patchawarra Fm. sample G012710 using a heating rate of a) 0.7°C/min.
188 Multi-component kinetics and late gas potential of selective Cooper Basin source rocks

Figure C5: MSSV chromatograms of Patchawarra Fm. sample G012710 using a heating rate of b) 2.0°C/min.
Multi-component kinetics and late gas potential of selected Cooper Basin source rocks 189

Figure C5 (contd.): MSSV chromatograms of Patchawarra Fm. sample G012710 using a heating rate of b) 2.0°C/min.
190 Multi-component kinetics and late gas potential of selective Cooper Basin source rocks

Figure C5 (contd.): MSSV chromatograms of Patchawarra Fm. sample G012710 using a heating rate of b) 2.0°C/min.
Multi-component kinetics and late gas potential of selected Cooper Basin source rocks 191
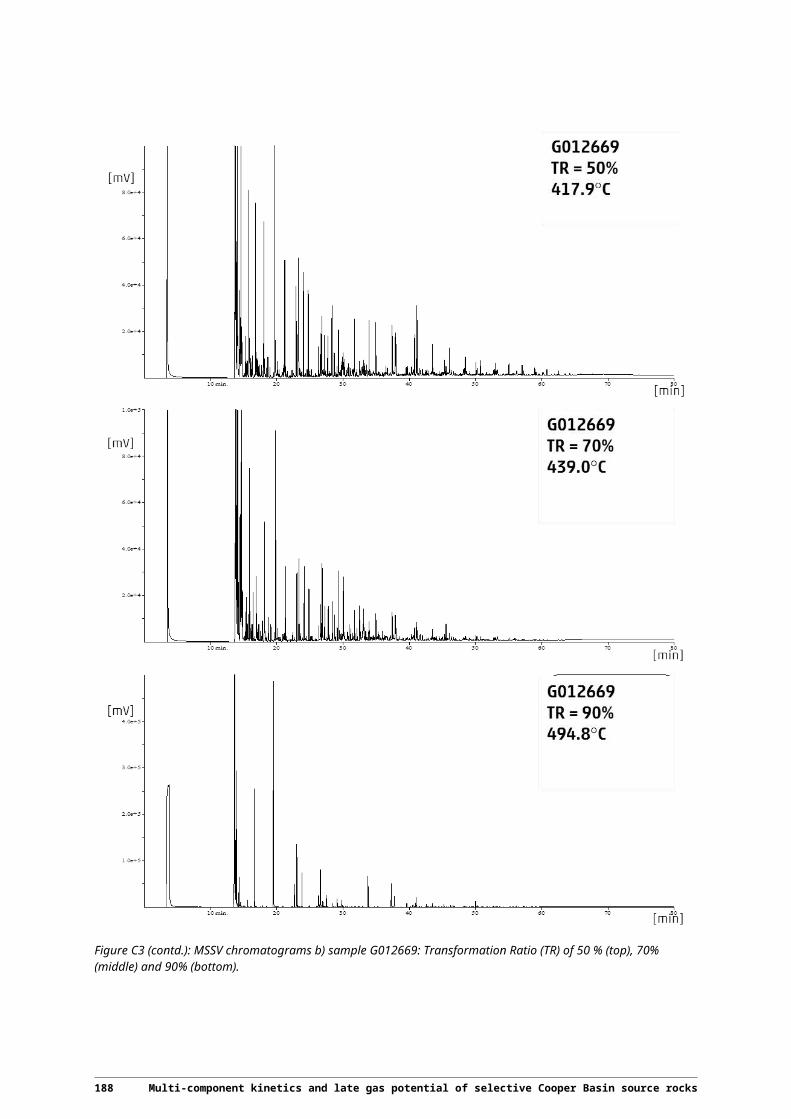
Figure C5 (contd.): MSSV chromatograms of Patchawarra Fm. sample G012710 using a heating rate of b) 2.0°C/min.
192 Multi-component kinetics and late gas potential of selective Cooper Basin source rocks

Figure C5 (contd.): MSSV chromatograms of Patchawarra Fm. sample G012710 using a heating rate of b) 2.0°C/min.
Multi-component kinetics and late gas potential of selected Cooper Basin source rocks 193

Figure C5: MSSV chromatograms of Patchawarra Fm. sample G012710 using a heating rate of c) 5.0°C/min.
194 Multi-component kinetics and late gas potential of selective Cooper Basin source rocks

Figure C5 (contd.): MSSV chromatograms of Patchawarra Fm. sample G012710 using a heating rate of c) 5.0°C/min.
Multi-component kinetics and late gas potential of selected Cooper Basin source rocks 195

Figure C5 (contd.): MSSV chromatograms of Patchawarra Fm. sample G012710 using a heating rate of c) 5.0°C/min.
196 Multi-component kinetics and late gas potential of selective Cooper Basin source rocks
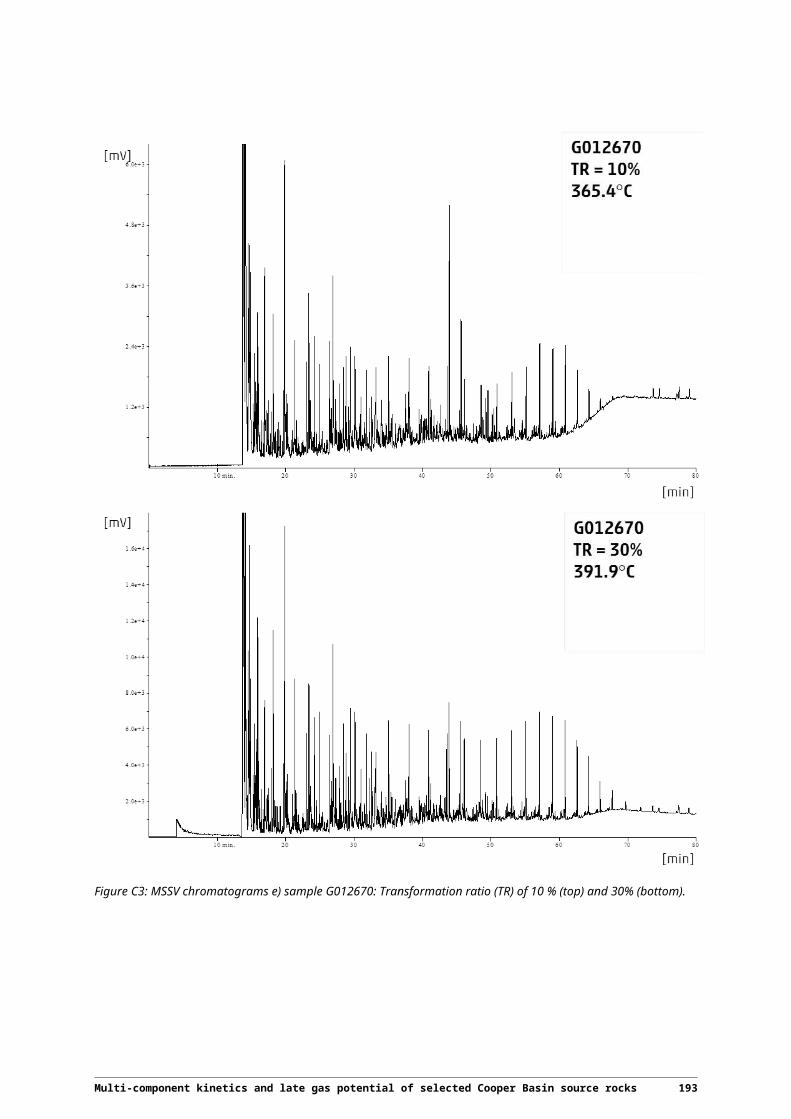
Figure C5 (contd.): MSSV chromatograms of Patchawarra Fm. sample G012710 using a heating rate of c) 5.0°C/min.
Multi-component kinetics and late gas potential of selected Cooper Basin source rocks 197

Figure C5 (contd.): MSSV chromatograms of Patchawarra Fm. sample G012710 using a heating rate of c) 5.0°C/min.
198 Multi-component kinetics and late gas potential of selective Cooper Basin source rocks


![Pasar Modal Global - eprints.dinus.ac.ideprints.dinus.ac.id/14552/1/[Materi]_10._Reksadana.pdf · Pasar Modal Pasar Uang Bank Kustodian. Net Asset Value (NAV)/Nilai Aktiva Bersih(](https://img.pdfslide.net/doc/110x75/5c8d68a109d3f26d548c78a9/pasar-modal-global-materi10reksadanapdf-pasar-modal-pasar-uang-bank-kustodian.jpg)