Embed Size (px)
Citation preview

GABAergic inhibition shapes interictaldynamics in awake epileptic mice
Sarah Feldt Muldoon,1,2,3,*,† Vincent Villette,1,2,3,* Thomas Tressard,1,2,3
Arnaud Malvache,1,2,3 Susanne Reichinnek,1,2,3 Fabrice Bartolomei4 and Rosa Cossart1,2,3
*These authors contributed equally to this work.
Epilepsy is characterized by recurrent seizures and brief, synchronous bursts called interictal spikes that are present in-between
seizures and observed as transient events in EEG signals. While GABAergic transmission is known to play an important role in
shaping healthy brain activity, the role of inhibition in these pathological epileptic dynamics remains unclear. Examining the
microcircuits that participate in interictal spikes is thus an important first step towards addressing this issue, as the function of
these transient synchronizations in either promoting or prohibiting seizures is currently under debate. To identify the microcircuits
recruited in spontaneous interictal spikes in the absence of any proconvulsive drug or anaesthetic agent, we combine a chronic
model of epilepsy with in vivo two-photon calcium imaging and multiunit extracellular recordings to map cellular recruitment
within large populations of CA1 neurons in mice free to run on a self-paced treadmill. We show that GABAergic neurons, as
opposed to their glutamatergic counterparts, are preferentially recruited during spontaneous interictal activity in the CA1 region of
the epileptic mouse hippocampus. Although the specific cellular dynamics of interictal spikes are found to be highly variable, they
are consistently associated with the activation of GABAergic neurons, resulting in a perisomatic inhibitory restraint that reduces
neuronal spiking in the principal cell layer. Given the role of GABAergic neurons in shaping brain activity during normal cognitive
function, their aberrant unbalanced recruitment during these transient events could have important downstream effects with clinical
implications.
1 Institut National de la Sante et de la Recherche Medicale Unite 901, 13009 Marseille, France2 Aix-Marseille Universite, Unite Mixte de Recherche S901, 13009 Marseille, France3 Institut de Neurobiologie de la Mediterranee, 13009 Marseille, France4 Institut des Neurosciences des Systemes, Institut National de la Sante et de la Recherche Medicale Unite 1106, 13005 Marseille,
France
†Present address: Department of Mathematics and Computational Data Science and Engineering Program, University at Buffalo,
SUNY, Buffalo, NY 14260, USA
Correspondence to: Dr Rosa Cossart,
Institut de Neurobiologie de la Mediterranee,
INMED UMR901,
Parc Scientifique de Luminy BP 13,
13273 Marseille cedex 09,
France
E-mail: [email protected]
Keywords: epilepsy; interictal spikes; calcium imaging; GABA; microcircuits
Abbreviations: kCSD = kernel current source density; TLE = temporal lobe epilepsy
doi:10.1093/brain/awv227 BRAIN 2015: 138; 2875–2890 | 2875
Received December 17, 2014. Revised June 9, 2015. Accepted June 22, 2015. Advance Access publication August 13, 2015
� The Author (2015). Published by Oxford University Press on behalf of the Guarantors of Brain. All rights reserved.
For Permissions, please email: [email protected]
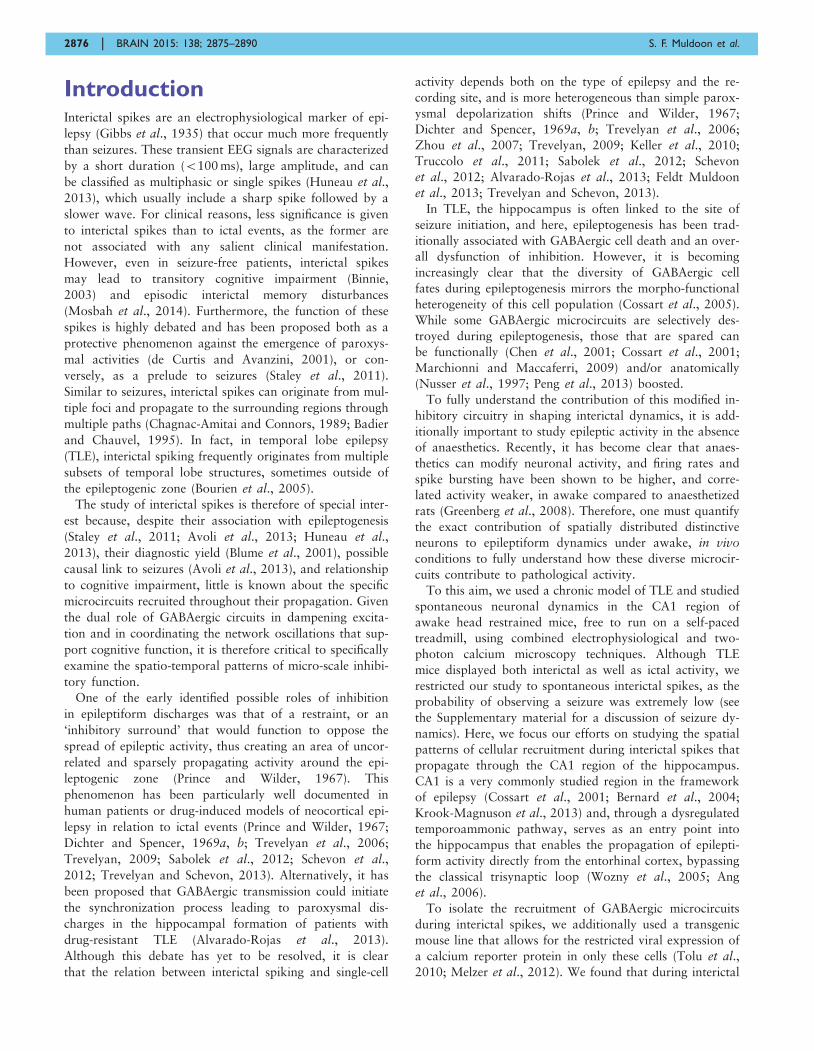
IntroductionInterictal spikes are an electrophysiological marker of epi-
lepsy (Gibbs et al., 1935) that occur much more frequently
than seizures. These transient EEG signals are characterized
by a short duration (5100 ms), large amplitude, and can
be classified as multiphasic or single spikes (Huneau et al.,
2013), which usually include a sharp spike followed by a
slower wave. For clinical reasons, less significance is given
to interictal spikes than to ictal events, as the former are
not associated with any salient clinical manifestation.
However, even in seizure-free patients, interictal spikes
may lead to transitory cognitive impairment (Binnie,
2003) and episodic interictal memory disturbances
(Mosbah et al., 2014). Furthermore, the function of these
spikes is highly debated and has been proposed both as a
protective phenomenon against the emergence of paroxys-
mal activities (de Curtis and Avanzini, 2001), or con-
versely, as a prelude to seizures (Staley et al., 2011).
Similar to seizures, interictal spikes can originate from mul-
tiple foci and propagate to the surrounding regions through
multiple paths (Chagnac-Amitai and Connors, 1989; Badier
and Chauvel, 1995). In fact, in temporal lobe epilepsy
(TLE), interictal spiking frequently originates from multiple
subsets of temporal lobe structures, sometimes outside of
the epileptogenic zone (Bourien et al., 2005).
The study of interictal spikes is therefore of special inter-
est because, despite their association with epileptogenesis
(Staley et al., 2011; Avoli et al., 2013; Huneau et al.,
2013), their diagnostic yield (Blume et al., 2001), possible
causal link to seizures (Avoli et al., 2013), and relationship
to cognitive impairment, little is known about the specific
microcircuits recruited throughout their propagation. Given
the dual role of GABAergic circuits in dampening excita-
tion and in coordinating the network oscillations that sup-
port cognitive function, it is therefore critical to specifically
examine the spatio-temporal patterns of micro-scale inhibi-
tory function.
One of the early identified possible roles of inhibition
in epileptiform discharges was that of a restraint, or an
‘inhibitory surround’ that would function to oppose the
spread of epileptic activity, thus creating an area of uncor-
related and sparsely propagating activity around the epi-
leptogenic zone (Prince and Wilder, 1967). This
phenomenon has been particularly well documented in
human patients or drug-induced models of neocortical epi-
lepsy in relation to ictal events (Prince and Wilder, 1967;
Dichter and Spencer, 1969a, b; Trevelyan et al., 2006;
Trevelyan, 2009; Sabolek et al., 2012; Schevon et al.,
2012; Trevelyan and Schevon, 2013). Alternatively, it has
been proposed that GABAergic transmission could initiate
the synchronization process leading to paroxysmal dis-
charges in the hippocampal formation of patients with
drug-resistant TLE (Alvarado-Rojas et al., 2013).
Although this debate has yet to be resolved, it is clear
that the relation between interictal spiking and single-cell
activity depends both on the type of epilepsy and the re-
cording site, and is more heterogeneous than simple parox-
ysmal depolarization shifts (Prince and Wilder, 1967;
Dichter and Spencer, 1969a, b; Trevelyan et al., 2006;
Zhou et al., 2007; Trevelyan, 2009; Keller et al., 2010;
Truccolo et al., 2011; Sabolek et al., 2012; Schevon
et al., 2012; Alvarado-Rojas et al., 2013; Feldt Muldoon
et al., 2013; Trevelyan and Schevon, 2013).
In TLE, the hippocampus is often linked to the site of
seizure initiation, and here, epileptogenesis has been trad-
itionally associated with GABAergic cell death and an over-
all dysfunction of inhibition. However, it is becoming
increasingly clear that the diversity of GABAergic cell
fates during epileptogenesis mirrors the morpho-functional
heterogeneity of this cell population (Cossart et al., 2005).
While some GABAergic microcircuits are selectively des-
troyed during epileptogenesis, those that are spared can
be functionally (Chen et al., 2001; Cossart et al., 2001;
Marchionni and Maccaferri, 2009) and/or anatomically
(Nusser et al., 1997; Peng et al., 2013) boosted.
To fully understand the contribution of this modified in-
hibitory circuitry in shaping interictal dynamics, it is add-
itionally important to study epileptic activity in the absence
of anaesthetics. Recently, it has become clear that anaes-
thetics can modify neuronal activity, and firing rates and
spike bursting have been shown to be higher, and corre-
lated activity weaker, in awake compared to anaesthetized
rats (Greenberg et al., 2008). Therefore, one must quantify
the exact contribution of spatially distributed distinctive
neurons to epileptiform dynamics under awake, in vivo
conditions to fully understand how these diverse microcir-
cuits contribute to pathological activity.
To this aim, we used a chronic model of TLE and studied
spontaneous neuronal dynamics in the CA1 region of
awake head restrained mice, free to run on a self-paced
treadmill, using combined electrophysiological and two-
photon calcium microscopy techniques. Although TLE
mice displayed both interictal as well as ictal activity, we
restricted our study to spontaneous interictal spikes, as the
probability of observing a seizure was extremely low (see
the Supplementary material for a discussion of seizure dy-
namics). Here, we focus our efforts on studying the spatial
patterns of cellular recruitment during interictal spikes that
propagate through the CA1 region of the hippocampus.
CA1 is a very commonly studied region in the framework
of epilepsy (Cossart et al., 2001; Bernard et al., 2004;
Krook-Magnuson et al., 2013) and, through a dysregulated
temporoammonic pathway, serves as an entry point into
the hippocampus that enables the propagation of epilepti-
form activity directly from the entorhinal cortex, bypassing
the classical trisynaptic loop (Wozny et al., 2005; Ang
et al., 2006).
To isolate the recruitment of GABAergic microcircuits
during interictal spikes, we additionally used a transgenic
mouse line that allows for the restricted viral expression of
a calcium reporter protein in only these cells (Tolu et al.,
2010; Melzer et al., 2012). We found that during interictal
2876 | BRAIN 2015: 138; 2875–2890 S. F. Muldoon et al.
spikes, CA1 inhibition is synchronized, which leads to the
quieting of neurons in the pyramidal cell layer. Therefore,
we identify a dysfunction of the CA1 feedforward inhibi-
tory microcircuit that potentially acts as an inhibitory
brake to the propagation of epileptiform dynamics from
the hippocampus to the rest of the brain (Prince and
Wilder, 1967; Dichter and Spencer, 1969a, b; Trevelyan
et al., 2006; Trevelyan, 2009; Sabolek et al., 2012;
Schevon et al., 2012; Trevelyan and Schevon, 2013), and
contributes to a functional deafferentation of the subiculum
(Cohen et al., 2002; Wozny et al., 2003), even in the ab-
sence of hippocampal sclerosis. This finding challenges the
intuitive view that epilepsy results from an imbalance of
inhibitory and excitatory action in favour of runaway ex-
citation and instead supports earlier work (Prince, 1968;
Velazquez and Carlen, 1999; Cohen et al., 2002;
Klaassen et al., 2006; Zhou et al., 2007; Marchionni and
Maccaferri, 2009; Avoli and de Curtis, 2011; Huberfeld
et al., 2011) as well as theoretical predictions (Li et al.,
2008) indicating that the GABAergic microcircuits that
are spared in the course of epileptogenesis contribute in
shaping interictal discharges.
Materials and methodsHere we present a condensed version of the experimental andanalytical methods. For complete descriptions, please see theSupplementary material. All protocols were performed underthe guidelines of the French National Ethic Committee forSciences and Health report on ‘Ethical Principles for AnimalExperimentation’ in agreement with the European CommunityDirective 86/609/EEC under agreement #01413.03. Unlessotherwise noted, all analysis was carried out in MATLABusing custom-made code, which can be provided by the au-thors upon request. Error bars denote standard error of themean (SEM), and when necessary, Kolmogorov-Smirnov testswere used to assess the normality of distributions. Sample sizeswere chosen to ensure experimental reproducibility and robust-ness while minimizing animal distress.
The pilocarpine model of temporallobe epilepsy
Male adult wild-type Swiss mice (n = 14) or GAD67-Cre mice(Tolu et al., 2010; Melzer et al., 2012) (n = 4) crossed onto aSwiss background were used for experiments. As previouslydescribed (Feldt Muldoon et al., 2013), mice were subjectedto the pilocarpine model of TLE (Cavalheiro et al., 1996). Toensure that the mice had reached the chronic phase of themodel (displayed both interictal spikes and seizures), wewaited an average of 58 � 11 days (range 26–136) betweenpilocarpine injections and the first recording session(Supplementary Fig. 1A).
Interictal spike detection
To detect the occurrence of spontaneous interictal spikes, micewere implanted contralaterally with a global cortico-hippocampal
electroencephalogram (contralateral EEG), hippocampallocal field potential (contralateral LFP) and neck electromyogram(EMG) as shown in Fig. 1A. Interictal spikes were semi-automatically detected from the electrophysiological data simul-taneously recorded in the contralateral hemisphere duringimaging/probe recording sessions using custom-made softwarewritten in MATLAB. First, to remove noise artefacts, contralat-eral EEG and contralateral local field potential signals were fil-tered between 1 and 25 Hz using a fourth order Butterworthfilter, and a threshold value was calculated using a moving stand-ard deviation of the filtered signal over a 5-s sliding window(Supplementary Fig. 1B). Potential spikes were selected aspoints where both the filtered contralateral EEG and contralat-eral local field potential signals exceed this threshold. Potentialspikes were then visually compared to the EMG signal to separ-ate true spikes from movement artefacts, and the start and endtimes of the spike were manually marked using the unfilteredsignal.
Linear probe recordings
A 16-channel linear silicon probe was used to obtain acuterecordings of the LFP depth profile of the CA1 region inTLE mice (n = 4 mice). The spatial properties describingsinks and sources during interictal spikes were evaluatedusing the 13 channel LFPs from these linear probe recordingsand a kernel current source density method (kCSD, for furtherdetails see Potworowski et al., 2012). In one mouse of the fourused for the probe experiments, the recorded signal saturatedthe amplifier during the spikes so this mouse was discardedfrom the kCSD analysis. Additionally, in one other mouse,obvious movement artefacts occurred during seven interictalspikes so these spikes were also removed from the analysis.This resulted in a final analysis of n = 158 interictal spikesrecorded from three mice. To analyse the multiunit activityof pyramidal cells, the probe channel in which unit activitycould be seen visually was selected for multiunit detection.The signal was first zero phase digitally filtered between 300and 3000 Hz using a fourth order Butterworth filter. A base-line movement-free period of 10 s was selected, and multiunitactivity was detected as points in time where the signal ex-ceeded a threshold of five times the standard deviation of thebaseline signal. To compare firing rates before and after inter-ictal spikes, the average firing rate was calculated for a 500-mswindow immediately before and immediately after each spike.In one of the four mice used, we could not detect unit activityin any of the recorded channels and thus this mouse was dis-carded from further analysis, meaning that the analysis wasperformed over n = 131 interictal spikes recorded from threemice.
Calcium imaging
To perform large-scale calcium imaging, wild-type TLE micewere injected with a viral solution of either GCaMP5G (n = 3),GCaMP6m (n = 3), or TLE GAD67-Cre mice with a viralvector carrying a CRE-dependent version of GCaMP5G. Thisprocedure induced the expression of the GCaMP indicator inall neurons within the field of view, as quantified using immu-nohistochemical analysis (Supplementary Fig. 2). To allow op-tical access to the hippocampus, a �3-mm diametercraniotomy centred over injection sites was performed: the
Inhibition shapes interictal dynamics BRAIN 2015: 138; 2875–2890 | 2877
dura was gently cut and a small portion of the cortex wasaspirated. A chronic glass window was implanted as previ-
ously reported (Dombeck et al., 2010) but adapted slightly
for large-scale imaging (Supplementary Fig. 1C). Althoughthis procedure did involve the removal of a small portion of
the cortex, the cortex was not removed for the linear probe
recordings, and the spikes recorded on the contralateral EEGshowed the same variability under both conditions.
Additionally, all results are consistent between linear probe
experiments and imaging experiments, so we conclude that
our observations are not likely to be significantly affected bythe surgical procedure.
All mice were handled before recording sessions to limithead restraint associated stress.
During imaging, mice were head-fixed on a non-motorizedtreadmill (adapted from Royer et al., 2012) that allowed for
self-paced locomotion to limit stress (Supplementary Fig. 1D).
All experiments were performed in the dark. No rewards weregiven and the mice alternated between periods of moving and
resting activity during recordings. The fluorescence activityfrom a 400 � 400mm field of view (500 � 500mm for � 20
objective) was acquired at �7.7 Hz and recordings lasted
�4.5 min. Mice were imaged over multiple days (range 2–16days). During imaging sessions, mice displayed spontaneous
interictal spikes as detected in the contralateral EEG signal
and these spike times were aligned with the correspondingmovie frames through post hoc analysis.
For calibration experiments, mice (n = 28) were anaesthe-tized with ketamine (100 mg/kg) and xylazine (10 mg/kg) for
surgery. A reference electrode was placed above the contralat-
eral cerebellum and a glass coverslip with a hole allowing for
pipette insertion covered hippocampal fibres. During record-ings, a supplemental anaesthetic was provided if necessary
(urethane, 1.5 g/kg, Sigma). Juxtacellular recordings were
acquired using glass pipettes with a MultiClamp 700BAmplifier (Axon Instrument) and digitized at 20 kHz
(Digidata1440a, Axon Instrument) while imaging as described
above.
10 s
Max
kC
SD
so
urce
va
lue
(a.u
.)
A B
C
-2
-1
0
1
cEE
G(m
V)
-0.05 0 0.05
Time (s)
stratumoriens
stratumoriens
stratumpyramidale
stratumpyramidale
stratumradiatum
stratumradiatum
50 µ
m50
µm
-0.05 0 0.05
Time (s)
-0.05 0 0.05
Time (s)
5 mV
kni s
ecr u
os
0 0.5 1 1.50
1000
2000
cEEG spike amplitude (mV)
20
40
60
80
100
Inte
ricta
l spi
ke n
umbe
r
-2 0 20
100
200
Spi
ke c
ount
Time (s) Before After0
5
10
15
Mea
n fir
ing
rate
(H
z)
D E
Recording sitecEEG
cLFP
EMG
*
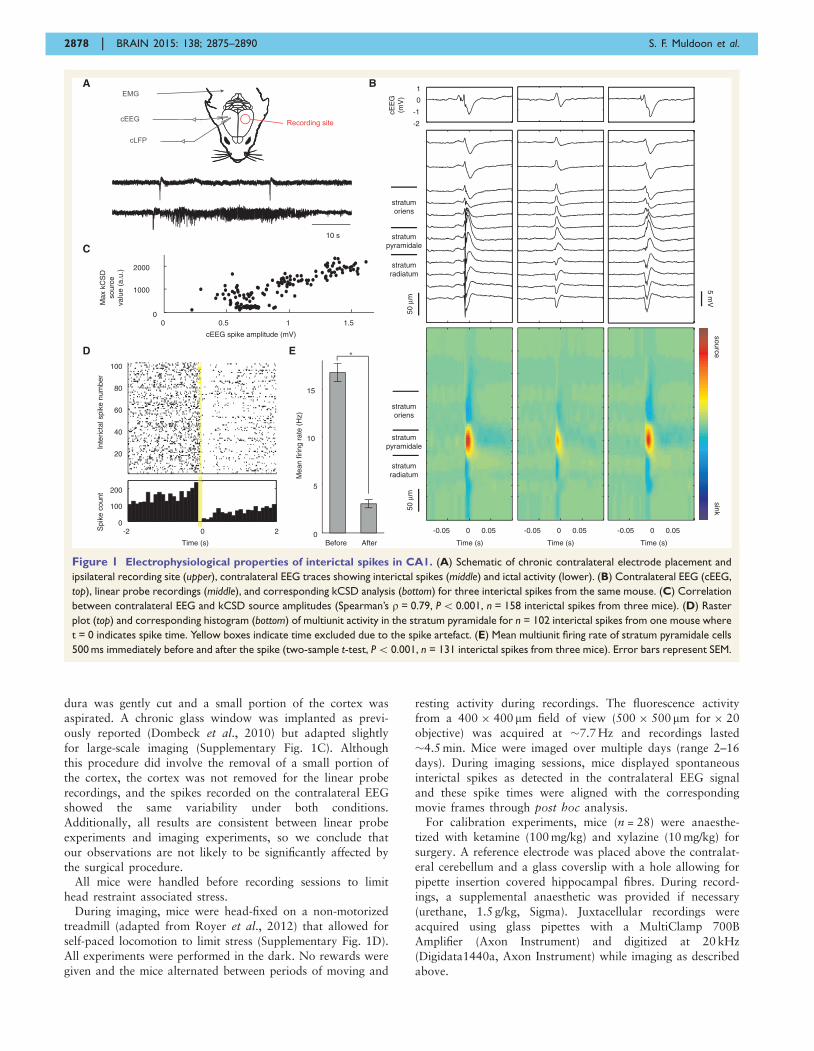
Figure 1 Electrophysiological properties of interictal spikes in CA1. (A) Schematic of chronic contralateral electrode placement and
ipsilateral recording site (upper), contralateral EEG traces showing interictal spikes (middle) and ictal activity (lower). (B) Contralateral EEG (cEEG,
top), linear probe recordings (middle), and corresponding kCSD analysis (bottom) for three interictal spikes from the same mouse. (C) Correlation
between contralateral EEG and kCSD source amplitudes (Spearman’s r = 0.79, P5 0.001, n = 158 interictal spikes from three mice). (D) Raster
plot (top) and corresponding histogram (bottom) of multiunit activity in the stratum pyramidale for n = 102 interictal spikes from one mouse where
t = 0 indicates spike time. Yellow boxes indicate time excluded due to the spike artefact. (E) Mean multiunit firing rate of stratum pyramidale cells
500 ms immediately before and after the spike (two-sample t-test, P5 0.001, n = 131 interictal spikes from three mice). Error bars represent SEM.
2878 | BRAIN 2015: 138; 2875–2890 S. F. Muldoon et al.
Spatial imprint analysis
To analyse the spatial patterning of cells recruited during inter-ictal spikes, we calculated the ‘spatial imprint’ for each spike.Spatial imprints are composed of the pixel-by-pixel percentagechange in fluorescence during a given interictal spike andtherefore serve as a visual representation of the pixels activatedduring the spike. An image of baseline activity was created byaveraging the movie frames acquired during a 500 ms windowimmediately preceding (but not including) the interictal spike(Supplementary Fig. 1E: ‘Before image’). Similarly, an imagerepresenting the activity recorded during the spike was createdby averaging the movie frames acquired during a 500-mswindow immediately after (and including) the interictal spike(Supplementary Fig. 1E: ‘After image’). We then produced thespatial imprint for each event by computing the dF/F image forthe event, i.e. for each pixel, we calculated the change in fluor-escence as (Image_after � Image_before) / Image_before. Thespatial imprint is thus a normalized image that represents thespatial patterning of cell bodies and processes activated duringeach interictal spike, i.e. pixels that were active (experiencedan increase in fluorescence) during the event appear brighterthan those that were not active. In Supplementary Fig. 1E, thered arrow indicates a cell that did not participate in the spike,while the green arrow indicates a cell that was recruited duringthe spike.
ResultsTo identify the microcircuits recruited in spontaneous inter-
ictal spikes in the absence of any proconvulsive drug or
anaesthetic agent, for the first time, we recorded electrical
and optical signals from chronically epileptic awake mice
using the pilocarpine model of TLE (Cavalheiro et al.,
1996). This widely used chronic model of epilepsy
(Brooks-Kayal et al., 1998; Cossart et al., 2001; Smolders
et al., 2002; Fabene et al., 2008; Hunt et al., 2013) was
chosen not only because spontaneous recurrent interictal
spikes and seizures occur following an initial brain insult,
but also because the development of such epileptiform ac-
tivity has been associated with several well-described be-
havioural and structural network changes that reproduce
the human pathology. Recordings from awake mice were
achieved using head-restrained animals, allowed to self-
regulate their motion on a non-motorized treadmill
(Royer et al., 2012). During each recording session, mice
spontaneously alternated between run and rest periods, as
their behaviour was not guided toward any reward.
Interictal spikes suppress multiunitactivity in pyramidal cell layer
To observe epileptiform activities, TLE mice were chronic-
ally implanted with a contralateral macroscopic surface
electroencephalogram (contralateral EEG), hippocampal
CA1 local field potential (contralateral local field potential),
and neck electromyogram (EMG) (Fig. 1A). Mice displayed
spontaneous interictal spikes and seizures as observed in
the contralateral EEG signal (Fig. 1A). Neuronal activity
was then monitored ipsilaterally in the CA1 region of the
hippocampus using either acute electrophysiological record-
ings with a linear silicone probe (n = 171 interictal spikes
from four mice) or chronic two-photon calcium imaging
(n = 2619 interictal spikes from 10 mice). The contralateral
EEG signal was used for interictal spike detection, as these
occurred simultaneously with local ipsilateral CA1 interic-
tal spikes observed in linear probe recordings spanning the
deeper neocortical layers down to the stratum radiatum
(Supplementary Fig. 3). As previously described, interictal
spikes are polymorphic events (Buzsaki et al., 1991;
Chauviere et al., 2012) and all probe channels therefore
expressed a wide heterogeneity in the interictal spike
shape from event to event. However, kCSD analysis con-
sistently revealed a source in the CA1 pyramidal cell layer
(Fig. 1B). Interestingly, the strength of this local source was
highly correlated with the amplitude of the global contra-
lateral EEG spike (Fig. 1C, Spearman’s r = 0.79, n = 158
interictal spikes from three mice). Although a source in the
CA1 pyramidal layer is often produced by synchronous
neuronal firing, it could also originate from a phasic peri-
somatic inhibitory input, and further information is needed
to address this ambiguity (Buzsaki et al., 2012). We there-
fore first examined multiunit activity in the CA1 pyramidal
cell layer within a 2-s window centred on each interictal
spike. Analysis revealed that multiunit frequency decreased
immediately following interictal spikes, and this was con-
sistently observed across all events in all animals (Fig. 1D
and E, firing rate 500 ms before interictal spike = 16.7 �
0.9 Hz, firing rate 500 ms after interictal spike = 3.0 �
0.4 Hz, n = 131 interictal spikes from three mice). This
striking result indicates that the kCSD source was likely
due to pyramidal cells receiving a strong inhibition.
Unfortunately, multiunit activity of pyramidal cells could
not be assessed directly during the interictal spike due to
the spike artefact (indicated by the yellow boxes in
Fig. 1D), and we therefore turned to calcium imaging to
further investigate cellular activity during the interictal
spikes.
Calcium imaging of spontaneousinterictal spikes
We used a viral vector to express the calcium reporter pro-
tein GCaMP5G (n = 3 mice) or GCaMP6m (n = 3 mice) in
CA1 hippocampal cells (Akerboom et al., 2012; Chen
et al., 2013). We adapted the surgical implantation of a
previously described chronic window on the hippocampus
that was shown to allow for the visualization of place cell
firing (Dombeck et al., 2010). This procedure allows for
direct imaging of spontaneous activity in the stratum
oriens (a layer with mostly somata of GABAergic neurons)
and stratum pyramidale (mainly somata of glutamatergic
principal cells) during interictal spikes over several days
(range 2–16 days). All reported results were robust
Inhibition shapes interictal dynamics BRAIN 2015: 138; 2875–2890 | 2879
throughout the entire imaging period. As with probe ex-
periments, the detection of interictal spikes was based upon
the contralateral EEG signal. During periods free of inter-
ictal spikes, cells were spontaneously active with more ac-
tivity in the stratum pyramidale observed during periods of
running, consistent with calcium imaging of non-epileptic,
wild-type mice (Supplementary Fig. 4 and Supplementary
Video 1).
In vivo two-photon imaging using GCaMP reporters has
been previously used in the hippocampus to report bursting
dynamics in place cells (Dombeck et al., 2010) or to map
neuronal activation during fear learning (Lovett-Barron
et al., 2014). However, it is important to understand if
these reporters can reliably capture single-cell activation
under conditions with lower neuronal firing rates.
Although the GCaMP reporters have been shown to be
sensitive to single action potential firing in the upper
layers of the visual cortex in vivo (Chen et al., 2013), it
is unclear if these results hold under our conditions. As
simultaneous imaging and patch-clamp recording is difficult
under the hippocampal window, in order to probe the re-
liability of our experimental procedure for single action
potential detection, we first tested whether we could
detect the calcium transients associated with ripple events,
a well-described physiological activity pattern that is
known to produce single-spikes in CA1 pyramidal neurons
within a similar time window as the interictal spikes
(Csicsvari et al., 1999; Gulyas and Freund, 2014). We de-
tected ripple events in the contralateral local field potential
of wild-type, non-epileptic mice (n = 2 mice) and observed
time-locked calcium transients in stratum pyramidale neu-
rons. These transients were of smaller amplitude than those
associated with place-modulated firing, further indicating
that they were produced by a few, if not single, spikes
(Supplementary Fig. 5). In addition, using juxtacellular
recordings from anaesthetized mice, we were able to
record calcium signals in stratum pyramidale that aligned
with the firing of action potentials and confirmed that
sparse firing (approximately two to three spikes) produced
significant calcium transients in these cells (n = 4 cells,
Supplementary Fig. 6). Altogether, this indicates that our
imaging set-up allows for the detection of single-cell acti-
vation during synchronous events, even when single-cell
firing rate is low. Although the time resolution of the ima-
ging does not allow for the evaluation of temporal se-
quences of cellular activation during these fast events, it
instead provides information concerning the spatial pattern-
ing of cells that participate (or not) in events.
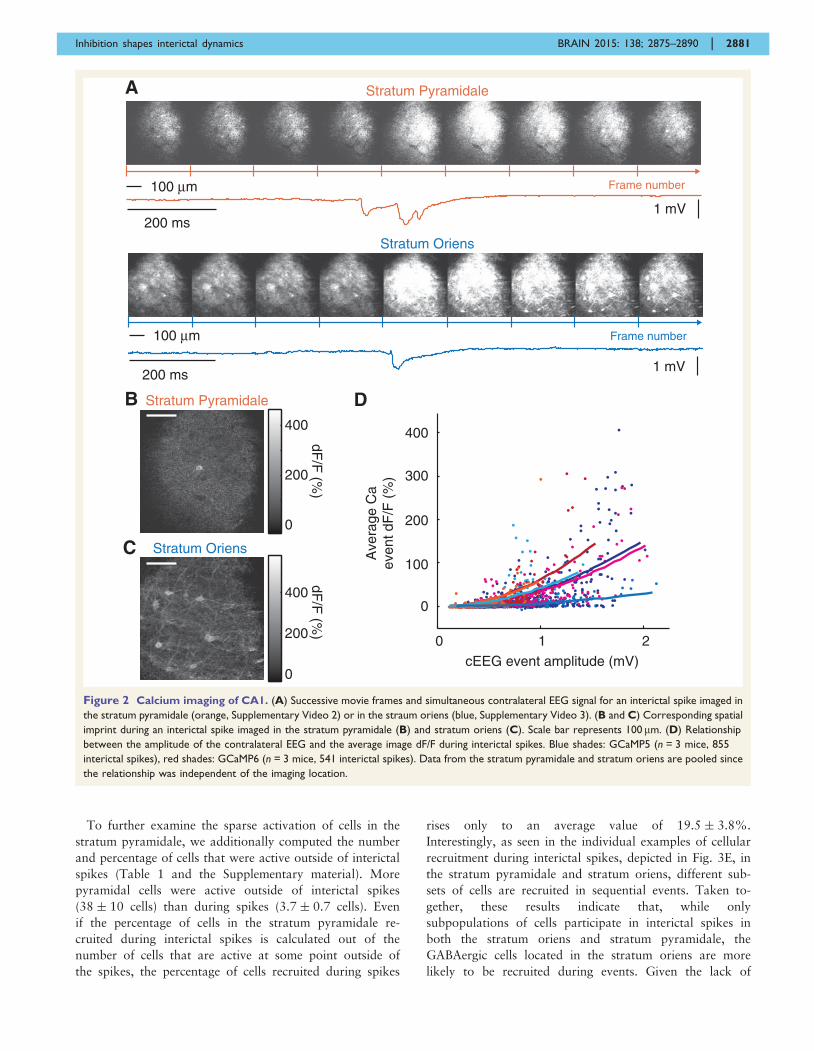
In both the stratum oriens and the stratum pyramidale,
interictal spikes appeared as global flashes in the calcium
movies (Fig. 2A and Supplementary Videos 2 and 3), indi-
cating a large calcium rise throughout the CA1 region
(n = 1396 interictal spikes from six mice). To examine the
spatial patterning of cells involved in these spikes, we cre-
ated a ‘spatial imprint’ of each interictal spike, i.e. an image
that allows for the visualization of cell bodies and processes
that were active during the event (Fig. 2B and C). In the
spatial imprints of interictal spikes, we consistently
observed a diffuse spatial patterning in the stratum pyrami-
dale (Fig. 2B), compared to the clearly visible activation of
somata and processes in the stratum oriens (Fig. 2C). Yet,
when we pool all events (distributed throughout all observ-
able imaging depths across both the stratum oriens and
stratum pyramidale), we see a supralinear correlation be-
tween the amplitude of the spike recorded by the contra-
lateral EEG and the amplitude of the fluorescence change
associated with the interictal spike (Fig. 2D), with no de-
pendence upon the depth of imaging. Thus the diffuse ac-
tivation pattern observed in the stratum pyramidale
followed the same relation as the spatially defined cellular
activation patterns in the stratum oriens.
Differential recruitment of cells instratum oriens versus pyramidale
To investigate further the relationship between firing of
individual cells and the global calcium transient, we studied
the dynamics of individual cells in both the stratum oriens
and stratum pyramidale during interictal spikes using both
the GCaMP5G and the more sensitive GCaMP6m variants
of the reporter. Although one can see a faint increase in an
individual cell’s GCaMP signal during the interictal spike
(Fig. 3A and B), cells show larger increase outside of
events, indicating that cells with a soma in the stratum
pyramidale are firing more when active outside of the inter-
ictal spike than during the spike. The same phenomenon
was observed regardless of the indicator used (5G/6 m) so
data from the two indicators were pooled for the remaining
analysis.
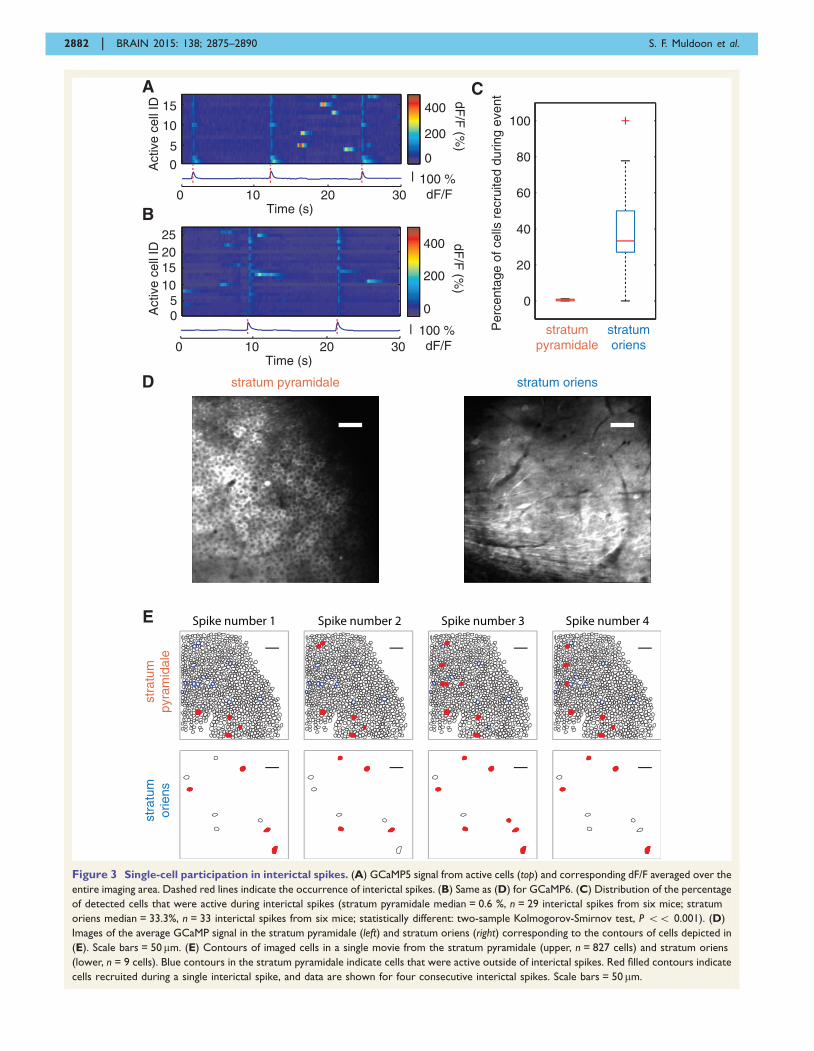
To detect differences in neuronal recruitment during an
interictal spike when imaging in the stratum oriens versus
stratum pyramidale, we next compared the percentage of
cells displaying a significant increase in the calcium signal
(i.e. recruited cells) during large interictal spikes (i.e. inter-
ictal spikes with an average dF/F amplitude 450%). Due
to the differences in the density of cells between the stratum
pyramidale and stratum oriens (Fig. 3D), we quantified the
percentage of imaged cells that were recruited during inter-
ictal spikes, but absolute numbers of cells are also reported
(Table 1). The percentage of neuronal recruitment in the
stratum pyramidale was remarkably low (Fig. 3C,
median = 0.6%), which represented a significantly lower
fraction of cells than observed in the stratum oriens
(Fig. 3C, median = 33%, two-sample Kolmogorov-
Smirnov test, P 4 0.001). This low percentage of active
cells in the stratum pyramidale corresponds to, on average,
4 � 1 cells (out of an estimated 766 � 47 imaged cells in
the stratum pyramidale) that are recruited during interictal
spikes. On the contrary, in the stratum oriens, we see that a
much higher fraction of cells are recruited (on average
2.1 � 0.3 of a total of 7 � 1 imaged cells), although this
distribution is widespread and highly variable from event to
event.
2880 | BRAIN 2015: 138; 2875–2890 S. F. Muldoon et al.
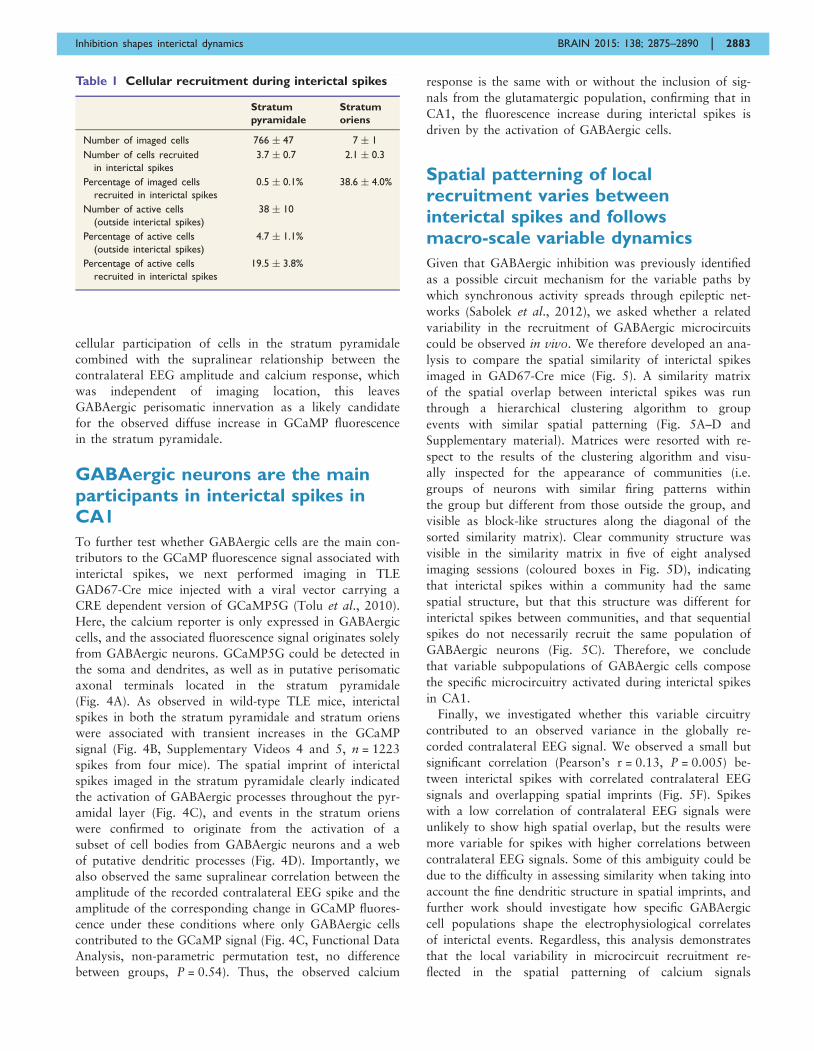
To further examine the sparse activation of cells in the
stratum pyramidale, we additionally computed the number
and percentage of cells that were active outside of interictal
spikes (Table 1 and the Supplementary material). More
pyramidal cells were active outside of interictal spikes
(38 � 10 cells) than during spikes (3.7 � 0.7 cells). Even
if the percentage of cells in the stratum pyramidale re-
cruited during interictal spikes is calculated out of the
number of cells that are active at some point outside of
the spikes, the percentage of cells recruited during spikes
rises only to an average value of 19.5 � 3.8%.
Interestingly, as seen in the individual examples of cellular
recruitment during interictal spikes, depicted in Fig. 3E, in
the stratum pyramidale and stratum oriens, different sub-
sets of cells are recruited in sequential events. Taken to-
gether, these results indicate that, while only
subpopulations of cells participate in interictal spikes in
both the stratum oriens and stratum pyramidale, the
GABAergic cells located in the stratum oriens are more
likely to be recruited during events. Given the lack of
200 ms1 mV
200 ms
A
0
200
400
dF/F
(%)
0
200
400
dF/F
(%)
B
C
D
0 1 2
0
100
200
300
400
cEEG event amplitude (mV)
Ave
rage
Ca
even
t dF
/F (
%)
Stratum Pyramidale
Stratum Oriens
Frame number
Frame number
Stratum Pyramidale
Stratum Oriens
1 mV
100 µm
100 µm
Figure 2 Calcium imaging of CA1. (A) Successive movie frames and simultaneous contralateral EEG signal for an interictal spike imaged in
the stratum pyramidale (orange, Supplementary Video 2) or in the straum oriens (blue, Supplementary Video 3). (B and C) Corresponding spatial
imprint during an interictal spike imaged in the stratum pyramidale (B) and stratum oriens (C). Scale bar represents 100 mm. (D) Relationship
between the amplitude of the contralateral EEG and the average image dF/F during interictal spikes. Blue shades: GCaMP5 (n = 3 mice, 855
interictal spikes), red shades: GCaMP6 (n = 3 mice, 541 interictal spikes). Data from the stratum pyramidale and stratum oriens are pooled since
the relationship was independent of the imaging location.
Inhibition shapes interictal dynamics BRAIN 2015: 138; 2875–2890 | 2881
A C
E
0 10 20 30Time (s)
Act
ive
cell
ID5
10
15
100 % dF/F
0
200
400
0
dF/F
(%)
0 10 20 30Time (s)
100 % dF/F
0
200
400 dF/F
(%)
510152025
0Act
ive
cell
IDst
ratu
mpy
ram
idal
est
ratu
mor
iens
0
20
40
60
80
100
stratumpyramidale
stratumoriens
Per
cent
age
of c
ells
rec
ruite
d du
ring
even
t
B
Spike number 1 Spike number 2 Spike number 3 Spike number 4
D stratum pyramidale stratum oriens
Figure 3 Single-cell participation in interictal spikes. (A) GCaMP5 signal from active cells (top) and corresponding dF/F averaged over the
entire imaging area. Dashed red lines indicate the occurrence of interictal spikes. (B) Same as (D) for GCaMP6. (C) Distribution of the percentage
of detected cells that were active during interictal spikes (stratum pyramidale median = 0.6 %, n = 29 interictal spikes from six mice; stratum
oriens median = 33.3%, n = 33 interictal spikes from six mice; statistically different: two-sample Kolmogorov-Smirnov test, P 55 0.001). (D)
Images of the average GCaMP signal in the stratum pyramidale (left) and stratum oriens (right) corresponding to the contours of cells depicted in
(E). Scale bars = 50mm. (E) Contours of imaged cells in a single movie from the stratum pyramidale (upper, n = 827 cells) and stratum oriens
(lower, n = 9 cells). Blue contours in the stratum pyramidale indicate cells that were active outside of interictal spikes. Red filled contours indicate
cells recruited during a single interictal spike, and data are shown for four consecutive interictal spikes. Scale bars = 50 mm.
2882 | BRAIN 2015: 138; 2875–2890 S. F. Muldoon et al.
cellular participation of cells in the stratum pyramidale
combined with the supralinear relationship between the
contralateral EEG amplitude and calcium response, which
was independent of imaging location, this leaves
GABAergic perisomatic innervation as a likely candidate
for the observed diffuse increase in GCaMP fluorescence
in the stratum pyramidale.
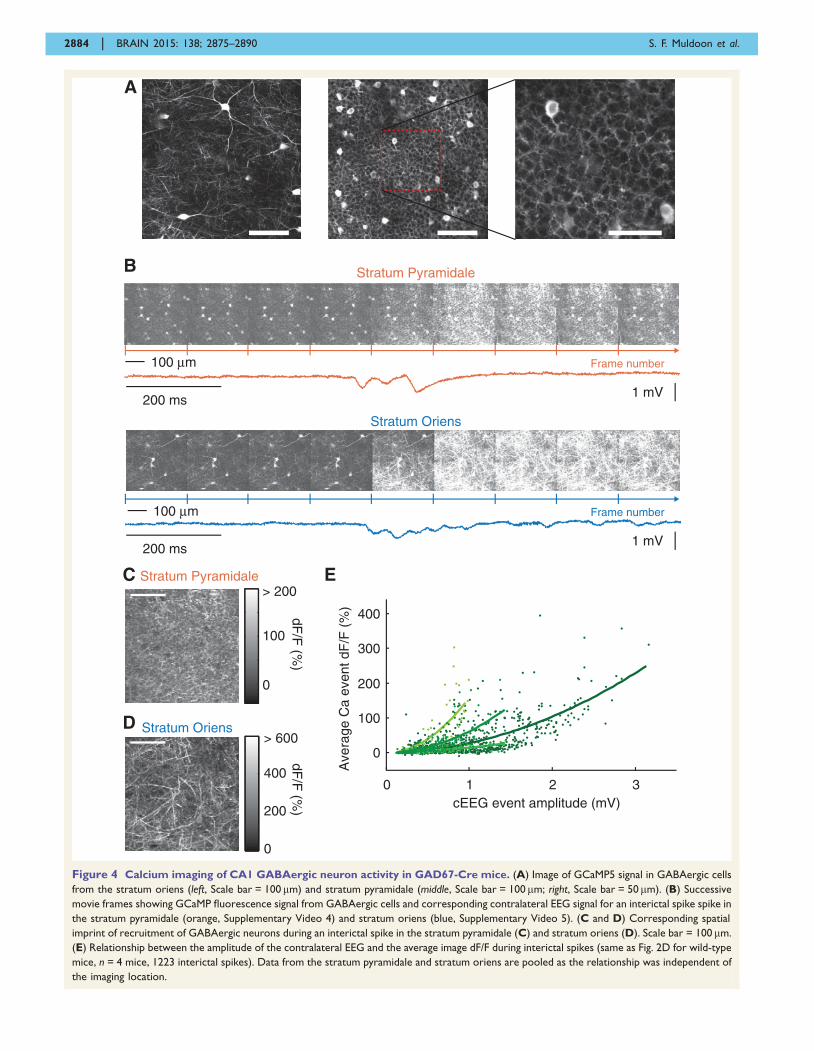
GABAergic neurons are the mainparticipants in interictal spikes inCA1
To further test whether GABAergic cells are the main con-
tributors to the GCaMP fluorescence signal associated with
interictal spikes, we next performed imaging in TLE
GAD67-Cre mice injected with a viral vector carrying a
CRE dependent version of GCaMP5G (Tolu et al., 2010).
Here, the calcium reporter is only expressed in GABAergic
cells, and the associated fluorescence signal originates solely
from GABAergic neurons. GCaMP5G could be detected in
the soma and dendrites, as well as in putative perisomatic
axonal terminals located in the stratum pyramidale
(Fig. 4A). As observed in wild-type TLE mice, interictal
spikes in both the stratum pyramidale and stratum oriens
were associated with transient increases in the GCaMP
signal (Fig. 4B, Supplementary Videos 4 and 5, n = 1223
spikes from four mice). The spatial imprint of interictal
spikes imaged in the stratum pyramidale clearly indicated
the activation of GABAergic processes throughout the pyr-
amidal layer (Fig. 4C), and events in the stratum oriens
were confirmed to originate from the activation of a
subset of cell bodies from GABAergic neurons and a web
of putative dendritic processes (Fig. 4D). Importantly, we
also observed the same supralinear correlation between the
amplitude of the recorded contralateral EEG spike and the
amplitude of the corresponding change in GCaMP fluores-
cence under these conditions where only GABAergic cells
contributed to the GCaMP signal (Fig. 4C, Functional Data
Analysis, non-parametric permutation test, no difference
between groups, P = 0.54). Thus, the observed calcium
response is the same with or without the inclusion of sig-
nals from the glutamatergic population, confirming that in
CA1, the fluorescence increase during interictal spikes is
driven by the activation of GABAergic cells.
Spatial patterning of localrecruitment varies betweeninterictal spikes and followsmacro-scale variable dynamics
Given that GABAergic inhibition was previously identified
as a possible circuit mechanism for the variable paths by
which synchronous activity spreads through epileptic net-
works (Sabolek et al., 2012), we asked whether a related
variability in the recruitment of GABAergic microcircuits
could be observed in vivo. We therefore developed an ana-
lysis to compare the spatial similarity of interictal spikes
imaged in GAD67-Cre mice (Fig. 5). A similarity matrix
of the spatial overlap between interictal spikes was run
through a hierarchical clustering algorithm to group
events with similar spatial patterning (Fig. 5A–D and
Supplementary material). Matrices were resorted with re-
spect to the results of the clustering algorithm and visu-
ally inspected for the appearance of communities (i.e.
groups of neurons with similar firing patterns within
the group but different from those outside the group, and
visible as block-like structures along the diagonal of the
sorted similarity matrix). Clear community structure was
visible in the similarity matrix in five of eight analysed
imaging sessions (coloured boxes in Fig. 5D), indicating
that interictal spikes within a community had the same
spatial structure, but that this structure was different for
interictal spikes between communities, and that sequential
spikes do not necessarily recruit the same population of
GABAergic neurons (Fig. 5C). Therefore, we conclude
that variable subpopulations of GABAergic cells compose
the specific microcircuitry activated during interictal spikes
in CA1.
Finally, we investigated whether this variable circuitry
contributed to an observed variance in the globally re-
corded contralateral EEG signal. We observed a small but
significant correlation (Pearson’s r = 0.13, P = 0.005) be-
tween interictal spikes with correlated contralateral EEG
signals and overlapping spatial imprints (Fig. 5F). Spikes
with a low correlation of contralateral EEG signals were
unlikely to show high spatial overlap, but the results were
more variable for spikes with higher correlations between
contralateral EEG signals. Some of this ambiguity could be
due to the difficulty in assessing similarity when taking into
account the fine dendritic structure in spatial imprints, and
further work should investigate how specific GABAergic
cell populations shape the electrophysiological correlates
of interictal events. Regardless, this analysis demonstrates
that the local variability in microcircuit recruitment re-
flected in the spatial patterning of calcium signals
Table 1 Cellular recruitment during interictal spikes
Stratum
pyramidale
Stratum
oriens
Number of imaged cells 766 � 47 7 � 1
Number of cells recruited
in interictal spikes
3.7 � 0.7 2.1 � 0.3
Percentage of imaged cells
recruited in interictal spikes
0.5 � 0.1% 38.6 � 4.0%
Number of active cells
(outside interictal spikes)
38 � 10
Percentage of active cells
(outside interictal spikes)
4.7 � 1.1%
Percentage of active cells
recruited in interictal spikes
19.5 � 3.8%
Inhibition shapes interictal dynamics BRAIN 2015: 138; 2875–2890 | 2883
200 ms
Stratum Pyramidale
Frame number
1 mV
200 ms
Stratum Oriens
Frame number
1 mV
A
B
0 1 2 3
0
100
200
300
400
cEEG event amplitude (mV)
Ave
rage
Ca
even
t dF
/F (
%)dF
/F (%
)dF
/F (%
)
C
D
Stratum Pyramidale
Stratum Oriens
0
100
> 200E
0
200
400
> 600
100 µm
100 µm
Figure 4 Calcium imaging of CA1 GABAergic neuron activity in GAD67-Cre mice. (A) Image of GCaMP5 signal in GABAergic cells
from the stratum oriens (left, Scale bar = 100 mm) and stratum pyramidale (middle, Scale bar = 100 mm; right, Scale bar = 50mm). (B) Successive
movie frames showing GCaMP fluorescence signal from GABAergic cells and corresponding contralateral EEG signal for an interictal spike spike in
the stratum pyramidale (orange, Supplementary Video 4) and stratum oriens (blue, Supplementary Video 5). (C and D) Corresponding spatial
imprint of recruitment of GABAergic neurons during an interictal spike in the stratum pyramidale (C) and stratum oriens (D). Scale bar = 100 mm.
(E) Relationship between the amplitude of the contralateral EEG and the average image dF/F during interictal spikes (same as Fig. 2D for wild-type
mice, n = 4 mice, 1223 interictal spikes). Data from the stratum pyramidale and stratum oriens are pooled as the relationship was independent of
the imaging location.
2884 | BRAIN 2015: 138; 2875–2890 S. F. Muldoon et al.
originating from GABAergic neurons shapes the macro-
scale epileptiform dynamics recorded globally.
DiscussionHere, for the first time, using two-photon calcium imaging
in awake epileptic mice to probe CA1 multi-neuron dy-
namics with single-cell and axonal innervation resolution,
we have shown that spontaneous interictal spikes recruit
variable subsets of GABAergic neurons. In turn, their glu-
tamatergic counterparts receive synchronous inhibitory
input resulting from the activation of perisomatic
GABAergic terminals, which reduces their firing rate, as
revealed by the combined analysis of imaging and kCSD
data. These results confirm previously reported increases of
GABAergic transmission in various models of epilepsy
(Chen et al., 2001; Cossart et al., 2001; Klaassen et al.,
2006) and theoretical predictions (Li et al., 2008). Given
that GABAergic neurons are a major substrate for cognitive
function (Lewis, 2014), such imbalanced recruitment of in-
hibitory circuits, even outside of epileptogenic regions,
could support the transitory or long-term cognitive impair-
ments associated with interictal spiking (Binnie, 2003;
Mosbah et al., 2014). Future work should further investi-
gate these potential links between GABAergic activation
and cognitive deficits observed during interictal spiking.
Relationship to previous studies andclinical relevance
Synchronous GABAergic activity associated with epilepti-
form discharges has been previously reported in electro-
physiological recordings from rodent acute slice models
(Velazquez and Carlen, 1999; Zhang et al., 2012),
in vivo animal models (Prince, 1968), and resected
human tissue (Cohen et al., 2002; Huberfeld et al.,
2011). However, these previous studies involved reduced
preparations that do not preserve network integrity and/
or relied on convulsive agents (4-AP, low Mg2 + , high po-
tassium, etc.) to artificially boost activity through a non-
specific increase in neuronal excitability. Importantly, some
of these agents (such as penicillin) have a direct action on
GABAergic transmission which will likely impact cellular
dynamics. In addition, previous studies analysed interictal-
like events originating from normal functioning networks
rather than from structurally and functionally rewired net-
works following epileptogenesis. The chronic experimental
model studied here mimics the structural network changes
reported in human patients after epileptogenesis (Curia
et al., 2008) and therefore is more likely to capture the
relevant cellular mechanisms at the basis of epileptiform
activity. The clinical translation of the synchronous activa-
tion of CA1 GABAergic neurons and resultant inhibition of
principle cells observed here supports the hypothesis that
dF/F
(%)
0
100
200
300
400
500
0
0.1
0.2
0.3
0.4
0.5 Min M
anders coeff.
0.4 0.5 0.6 0.7 0.8 0.9 10
0.1
0.2
0.3
0.4
0.5
0.6
0.7
0.8
0.9
1
cEEG correlation
Spa
tial o
verla
p
A B C D
E F
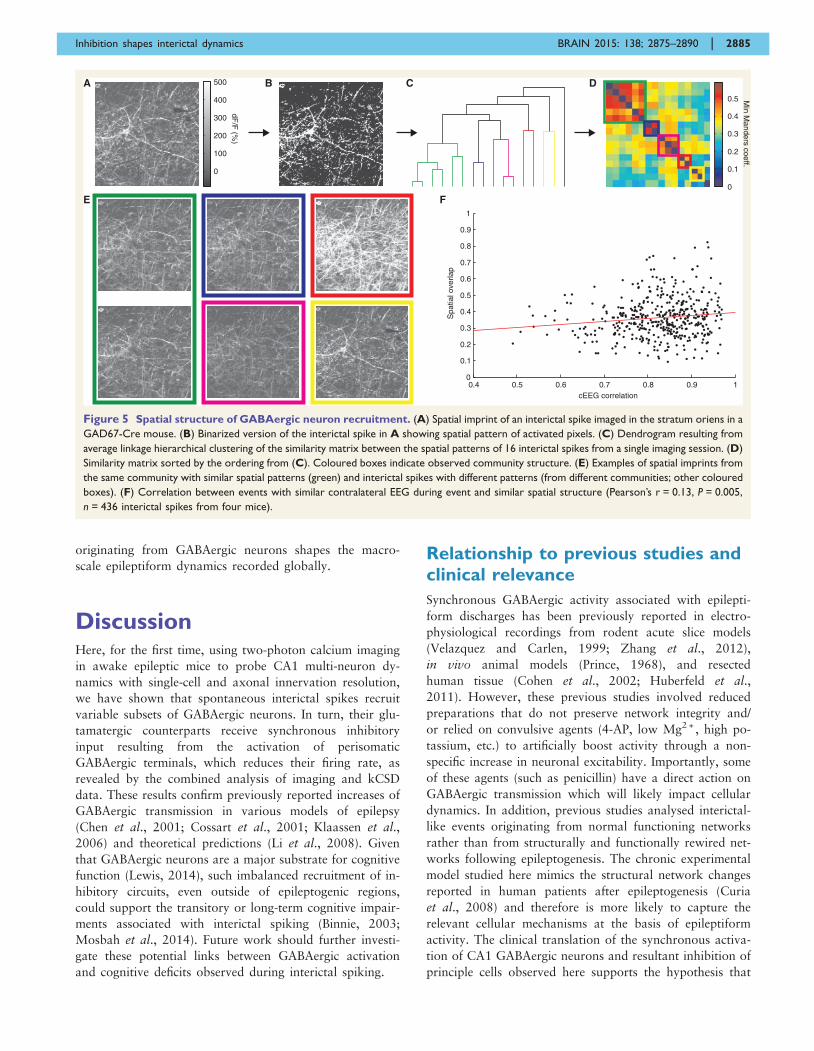
Figure 5 Spatial structure of GABAergic neuron recruitment. (A) Spatial imprint of an interictal spike imaged in the stratum oriens in a
GAD67-Cre mouse. (B) Binarized version of the interictal spike in A showing spatial pattern of activated pixels. (C) Dendrogram resulting from
average linkage hierarchical clustering of the similarity matrix between the spatial patterns of 16 interictal spikes from a single imaging session. (D)
Similarity matrix sorted by the ordering from (C). Coloured boxes indicate observed community structure. (E) Examples of spatial imprints from
the same community with similar spatial patterns (green) and interictal spikes with different patterns (from different communities; other coloured
boxes). (F) Correlation between events with similar contralateral EEG during event and similar spatial structure (Pearson’s r = 0.13, P = 0.005,
n = 436 interictal spikes from four mice).
Inhibition shapes interictal dynamics BRAIN 2015: 138; 2875–2890 | 2885
some interictal spikes in human patients may reflect a pro-
tective phenomenon (Avoli et al., 2013).
In studies that have previously described an increase in
inhibitory drive, this increase was generally followed or
paralleled by an increase in the excitatory drive, sometimes
resulting from a direct depolarizing action of GABA in
pathological tissue (Cohen et al., 2002). However, we do
not observe this phenomenon because the activation of
somatic GABAergic terminals does not induce spiking.
We cannot exclude the possibility that glutamatergic activ-
ity is also contributing to the observed interictal spikes, but
we do show that the synaptic inputs that potentially drive
GABAergic neurons are not likely to originate from a burst
of action potentials generated at the soma of local gluta-
matergic neurons since these neurons become quiescent
during interictal spikes (although see ‘Technical consider-
ations’ section below). In contrast, bursting activity is
observed in principal layer neurons outside of interictal
spikes, for example when the mouse is running on the
treadmill.
We also provided the first in vivo demonstration with
cellular resolution of the variability in neuronal recruitment
during interictal events, a feature previously observed in
slice recordings (Sabolek et al., 2012; Feldt Muldoon
et al., 2013). Interestingly, both variability in neuronal re-
cruitment as well as an increase in the inhibitory drive were
also shown to be characteristic features of the so-called
‘ictal penumbra’ (Prince and Wilder, 1967; Dichter and
Spencer, 1969a, b; Trevelyan et al., 2006; Trevelyan,
2009; Sabolek et al., 2012; Schevon et al., 2012;
Trevelyan and Schevon, 2013), a region around the terri-
tory supporting ictal activity that displays large amplitude
EEG signals, reflecting feedforward synaptic currents, but
with little actual local recruitment of neurons. The presence
of an ictal penumbra suggests heterogeneity in neuronal
activation with massive activation only at certain spatially
focused sites. It is possible that our data reflect a similar
phenomenon, however, the previous work studying penum-
bral regions was done in regard to ictal events and the
interictal spikes observed here are very likely to involve
different mechanisms of neuronal recruitment than those
which lead to seizures.
This finding also has potential implications regarding
the interpretation of functional MRI data obtained from
epileptic patients. It is likely that the magnitude of the
contribution of GABAergic neurons to the blood oxygen
level-dependent signal differs from that of excitatory cells
(Buzsaki et al., 2007), and therefore one must be cautious
when drawing conclusions about epileptiform activity when
using this standard modality.
Technical considerations
As this study pushes current in vivo imaging techniques
to their experimental limits, it is important to take some
technical considerations into account when interpreting the
data. First, to image at the depth of the dorsal
hippocampus, it was necessary to remove a small portion
of the overlying neocortex. While this could affect the
propagation of interictal spikes through the neocortex, it
is important to note that the interictal spikes detected in the
contralateral EEG signal showed similar properties to those
from previously studied TLE mice chronically implanted
with a telemetric surface EEG (Feldt Muldoon et al.,
2013). Additionally, the linear probe experiments presented
here did not involve the removal of the neocortex, and we
observed the same variation in spike shape, along with a
silencing of neuronal activity in the stratum pyramidale and
a current source that could represent the synchronous
inflow of chloride into somata resulting from synchronous
GABAergic inputs. Thus, the findings from the linear probe
experiments in which the cortex was not removed are con-
sistent with the data obtained in the imaging experiments
that did involve the removal of a small portion of the
cortex, supporting the notion that the removal of the
cortex did not greatly influence the propagation dynamics.
We also note that the pilocarpine model used in this study
is a multifocal model and we have no reason to suspect
that one hemisphere would preferentially be associated with
the focus of spikes. Although interictal spike detection was
done on the contralateral side, for all detected spikes, the
linear probe recordings confirmed the presence of an asso-
ciated ipsilateral spike.
Another important consideration stems from the fact that
the exact firing patterns of CA1 pyramidal cells during
interictal spikes are difficult to assess. The sharp slope asso-
ciated with interictal spikes in linear probe recordings
meant that a short window of time centred on the interictal
spike had to be excluded from multiunit analysis. Thus, to
examine cellular participation of cells in the stratum pyra-
midale during interictal spikes, we turned to imaging of
calcium dynamics using GCaMP. These reporters are par-
ticularly well suited for our experimental conditions since
they reliably detect bursting dynamics and ‘epileptic’ neu-
rons have been shown to display a higher bursting propen-
sity (Yaari and Beck, 2002). In principle, the ability of the
GCaMP reporters to detect the influx of calcium from a
single action potential is less reliable. For this reason, we
used both GCaMP 5 and 6 variants as the newer GCaMP6
has been shown to be more sensitive to the detection of
single action potentials, both in pyramidal cells and in
interneurons (Chen et al., 2013). While we were able to
detect more active cells in mice injected with GCaMP6
versus GCaMP5 (Supplementary material), these cells
were observed to be active outside of interictal spikes,
and the cellular recruitment in the stratum pyramidale
during interictal spikes was not significantly different
when using the two indicators. In addition, we have both
directly and indirectly demonstrated the sensitivity of the
GCaMP reporters to detect single spikes by performing
juxtacellular spike recordings from single imaged neurons
in anaesthetized mice, and by imaging ripple events in the
stratum pyramidale. Still, it is possible that we failed to
observe the activation of some cells in the stratum
2886 | BRAIN 2015: 138; 2875–2890 S. F. Muldoon et al.
pyramidale, especially those that display a tonic mode
of firing for which two consecutive spikes are below our
temporal resolution or cells that fire only a single action
potential during the interictal spike.
Finally, it should be noted that we attempted to isolate
the calcium signal originating only from pyramidal cells by
performing calcium imaging, but could not find experimen-
tal conditions for which GCaMP expression was strictly
restricted to glutamatergic neurons, as a small percentage
of GABAergic cells additionally expressed the GCaMP in-
dicator when using a CAMKII-Cre viral vector, and Emx1-
Cre mice could no longer drive Cre expression in CA1 at
adult stages.
Circuit mechanisms for the initiationand propagation of GABAergicactivity
From a circuits perspective, our study introduces many
questions. What are the upstream cellular mechanisms
that support the preferential recruitment of GABAergic
neurons? Are specific GABAergic microcircuits activated
that contribute to the control of downstream neuronal
populations? As mentioned above, the somata of most neu-
rons located in the principal cell layer do not display spon-
taneous calcium transients during interictal spikes, but
instead show decreased spiking as observed in multiunit
extracellular recordings. It is therefore unlikely that
GABAergic neurons are synaptically activated from local
CA1 collateral inputs. However, it was previously reported
that CA1 GABAergic neurons that were spared in the
course of epileptogenesis (including those with perisomatic
projections) received an enhanced glutamatergic drive that
contributed to increased spontaneous firing (Cossart et al.,
2001). It was thought that this enhanced glutamatergic
drive originated from the sprouting of local CA1 axon col-
laterals (Esclapez et al., 1999; Cossart et al., 2001).
However, it may instead be that this arises from CA3 or
the entorhinal cortex, as both regions provide a main ex-
citatory drive to CA1 and were shown to be potential sites
of origin for epileptiform events (Wozny et al., 2005). In
fact, rather than Schaffer collaterals from CA3, inputs ori-
ginating from the entorhinal cortex were recently shown to
be more likely to drive CA1 interneurons (as opposed to
their glutamatergic counterparts) (Sun et al., 2014).
Additionally, it could be that glutamate is released due to
distal axonal firing that occurs independently from somatic
activity (Dugladze et al., 2012). Alternatively, CA1
GABAergic neurons could be driven by a very sparse and
currently unidentified population of glutamatergic bursting
neurons (Miles and Wong, 1983; Marissal et al., 2012), so
we cannot exclude that GABAergic neurons could be
driven by the few cells in the stratum pyramidale that are
detected as being active during interictal spikes. Finally, the
preferential activation of interneurons may result from sev-
eral other factors, including a lower action potential
threshold, short response latency, and fast axonal signalling
(Geiger et al., 1997; Galarreta and Hestrin, 2001; Hu et al.,
2010; Hu and Jonas, 2014), the properties and distribution
of the excitatory synapses they receive (in particular higher
amplitude excitatory postsynaptic potentials) (Gulyas et al.,
1999; Megias et al., 2001; Molnar et al., 2008), or their
forming a gap-junction syncytium (Galarreta and Hestrin,
1999; Gigout et al., 2006). Thus, future work is needed to
identify the upstream source of GABAergic cell
coordination.
Identification of the specific downstream targets of
GABAergic neurons recruited during interictal spikes is
also an important issue due to the critical role that subsets
of GABAergic neurons play in single-handedly priming net-
work bursts and behaviour (Bonifazi et al., 2009; Ellender
et al., 2010; Doron et al., 2014), and the fact that there is
increasing experimental evidence indicating that inhibition
can balance and even oppose spreading excitatory activity
very effectively (Prince and Wilder, 1967; Grenier et al.,
2001, 2003; Timofeev et al., 2002; Trevelyan et al.,
2006; Rheims et al., 2008). Given that the cellular recruit-
ment we describe is heterogeneous, it is likely that, in add-
ition to perisomatic projecting neurons, other classes of
GABAergic neurons are also recruited during interictal
spikes. For example, the activation of somata in the pyr-
amidal layer could be observed when imaging GAD67-Cre
mice, which suggests that GABAergic neurons in that layer,
i.e. basket cells and Ivy cells (Fuentealba et al., 2008), could
be recruited. In fact they represent a similar fraction to the
fraction cells detected as being active in the stratum pyra-
midale during interictal spikes (Supplementary Fig. 2).
Interestingly, an additional sprouting of GABAergic axons
has recently been revealed, which could also link CA1 to
the dentate gyrus and have important functional conse-
quences in the present context (Peng et al., 2013).
Linking micro and macroscopic scales
Finally, it is important to understand the relationship be-
tween micro and macro network activity because the vari-
ous mechanisms proposed to underlie the generation of
epileptiform discharges are united by the assumption that
their dynamics are conserved across multiple scales. A
somewhat unexpected finding of this study is the correl-
ation between the maximum value of the kCSD source
located in the pyramidal layer and the amplitude of inter-
ictal spikes recorded at the global/surface level from the
contralateral EEG. Additionally, we found a supralinear
relationship between the amplitude of the locally observed
cellular GCaMP fluorescence signal and the contralateral
EEG amplitude of interictal spikes. Notably, this relation-
ship was independent of the depth of imaging. Given that
we also observed variable spatial patterning as different
subsets of GABAergic cells were recruited during sequential
interictal spikes, it is unlikely that this supralinear response
is solely due to a progressive increase in the number of cells
recruited during spikes. In fact, it has been shown that the
Inhibition shapes interictal dynamics BRAIN 2015: 138; 2875–2890 | 2887

relationship between the number of action potentials fired
and the fluorescence amplitude of the GCaMP indicator is
also supralinear (Akerboom et al., 2012; Chen et al.,
2013). This suggests that the amplitude of the interictal
spike, measured at the macroscopic scale, could reflect an
increased firing rate of cells that are recruited in our micro-
scopic imaging area. Whether or not this reflects a globally
observed phenomenon throughout all brain regions or if
the global signal is dominated by the GABAergic activity
we observe locally remains an open question (Trevelyan,
2009; Bazelot et al., 2010).
We also observed a small but significant relationship be-
tween interictal spikes with similar spatial patterning and
spike shape, with the main observation being that spikes
with a lower correlation between contralateral EEG shapes
were unlikely to also have similar spatial patterning of cel-
lular recruitment. Spikes with a high correlation of contra-
lateral EEG shape displayed a more variable relationship
between spatial patterning of interictal spikes. However,
because of the difficulty in comparing images of the fine
dendritic webs recruited during interictal spikes (even after
movement correction of images, small shifts of a few pixels
in dendritic location matter when comparing spatial pat-
terns of recruitment), it is likely that our analysis under-
estimated this relationship. Therefore, future studies should
additionally address cellular recruitment in different areas
and how different brain regions and neuronal subpopula-
tions differentially contribute to the globally measured EEG
signals observed at the surface of the brain.
In conclusion, our finding that inhibitory GABAergic
microcircuits are the main participants of interictal activity
in CA1 supports recent theoretical and experimental predic-
tions by connecting several separate pieces of previous evi-
dence supporting the importance of GABAergic inhibition in
shaping epileptiform activity. Importantly, we also provided
the first demonstration of these principles in the intact brain
of un-anaesthetized chronically epileptic animals, which is a
modality that has not been previously explored. This work
therefore provides valuable insight into the micro-scale epi-
leptiform dynamics that underlie macro-scale subdural EEG
signals, and suggests that large scale inhibition could poten-
tially be related to some of the clinically observed cognitive
deficits associated with interictal spikes.
AcknowledgementsWe acknowledge the GENIE Program and the Janelia Farm
Research Campus, specifically for GCAMP5G: Loren L.
Looger, Ph.D., Jasper Akerboom, Ph.D., Douglas S. Kim,
Ph.D and for GCAMP6m: Vivek Jayaraman, Ph.D., Rex A.
Kerr, Ph.D., Douglas S. Kim, Ph.D., Loren L. Looger,
Ph.D., Karel Svoboda, Ph.D. from the GENIE Project,
Janelia Farm Research Campus, Howard Hughes Medical
Institute. We also thank Daniel Wojcik for helpful com-
ments and providing the Matlab code used in the kCSD
analysis, Pr. Hannah Monyer for providing the GAD67-
Cre mice, Pr. Daniel Dombeck for helping with the im-
plantation of the chronic hippocampal imaging window
and Drs E. Andresen and L. Gallais for designing the
window for juxtacellular recordings.
FundingWe acknowledge funding from an FP7-PEOPLE-2011-IIF
Marie Curie Fellowship (#301728 S.F.M.), an FP7-ERC
‘GABA Networks’ grant (#242842; V.V., T.T., R.C.), the
Fondation pour la Recherche Medicale (R.C.), and an
ERA-Net: EpiNet Grant (V.V., R.C.).
Supplementary materialSupplementary material is available at Brain online.
ReferencesAkerboom J, Chen TW, Wardill TJ, Tian L, Marvin JS, Mutlu S, et al.
Optimization of a GCaMP calcium indicator for neural activity
imaging. J Neurosci 2012; 32: 13819–40.Alvarado-Rojas C, Lehongre K, Bagdasaryan J, Bragin A, Staba R,
Engel J, Jr, et al. Single-unit activities during epileptic discharges
in the human hippocampal formation. Front Comput Neurosci
2013; 7: 140.Ang CW, Carlson GC, Coulter DA. Massive and specific dysregulation
of direct cortical input to the hippocampus in temporal lobe epi-
lepsy. J Neurosci 2006; 26: 11850–6.
Avoli M, de Curtis CM. GABAergic synchronization in the limbicsystem and its role in the generation of epileptiform activity. Prog
Neurobiol 2011; 95: 104–32.
Avoli M, de Curtis CM, Kohling R. Does interictal synchronization
influence ictogenesis? Neuropharmacology 2013; 69: 37–44.Badier JM, Chauvel P. Spatio-temporal characteristics of paroxysmal
interictal events in human temporal lobe epilepsy. J Physiol Paris
1995; 89: 255–64.
Bazelot M, Dinocourt C, Cohen I, Miles R. Unitary inhibitory fieldpotentials in the CA3 region of rat hippocampus. J Physiol 2010;
588: 2077–90.
Bernard C, Anderson A, Becker A, Poolos NP, Beck H, Johnston D.
Acquired dendritic channelopathy in temporal lobe epilepsy. Science
2004; 305: 532–5.Binnie CD. Cognitive impairment during epileptiform discharges: is it
ever justifiable to treat the EEG? Lancet Neurol 2003; 2: 725–30.
Blume WT, Holloway GM, Wiebe S. Temporal epileptogenesis: loca-
lizing value of scalp and subdural interictal and ictal EEG data.Epilepsia 2001; 42: 508–14.
Bonifazi P, Goldin M, Picardo MA, Jorquera I, Cattani A, Bianconi G,
et al. GABAergic hub neurons orchestrate synchrony in developing
hippocampal networks. Science 2009; 326: 1419–24.Bourien J, Bartolomei F, Bellanger JJ, Gavaret M, Chauvel P,
Wendling F. A method to identify reproducible subsets of co-
activated structures during interictal spikes. Application to intracer-
ebral EEG in temporal lobe epilepsy. Clin Neurophysiol 2005; 116:443–55.
Brooks-Kayal AR, Shumate MD, Jin H, Rikhter TY, Coulter DA.
Selective changes in single cell GABA(A) receptor subunit expression
and function in temporal lobe epilepsy [see comments]. Nat Med1998; 4: 1166–72.
Buzsaki G, Anastassiou CA, Koch C. The origin of extracellular fields
and currents–EEG, ECoG, LFP and spikes. Nat Rev Neurosci 2012;
13: 407–20.
2888 | BRAIN 2015: 138; 2875–2890 S. F. Muldoon et al.
Buzsaki G, Hsu M, Slamka C, Gage FH, Horvath Z. Emergence and
propagation of interictal spikes in the subcortically denervated
hippocampus. Hippocampus 1991; 1: 163–80.
Buzsaki G, Kaila K, Raichle M. Inhibition and brain work. Neuron
2007; 56: 771–83.
Cavalheiro EA, Santos NF, Priel MR. The pilocarpine model of epi-
lepsy in mice. Epilepsia 1996; 37: 1015–19.
Chagnac-Amitai Y, Connors BW. Horizontal spread of synchronized
activity in neocortex and its control by GABA-mediated inhibition.
J Neurophysiol 1989; 61: 747–58.Chauviere L, Doublet T, Ghestem A, Siyoucef SS, Wendling F, Huys
R, et al. Changes in interictal spike features precede the onset of
temporal lobe epilepsy. Ann Neurol 2012; 71: 805–14.
Chen K, Aradi I, Thon N, Eghbal-Ahmadi M, Baram TZ, Soltesz I.
Persistently modified h-channels after complex febrile seizures con-
vert the seizure-induced enhancement of inhibition to hyperexcitabil-
ity. Nat Med 2001; 7: 331–37.Chen TW, Wardill TJ, Sun Y, Pulver SR, Renninger SL, Baohan A,
et al. Ultrasensitive fluorescent proteins for imaging neuronal activ-
ity. Nature 2013; 499: 295–300.
Cohen I, Navarro V, Clemenceau S, Baulac M, Miles R. On the origin
of interictal activity in human temporal lobe epilepsy in vitro.
Science 2002; 298: 1418–21.
Cossart R, Bernard C, Ben-Ari Y. Multiple facets of GABAergic neu-
rons and synapses: multiple fates of GABA signalling in epilepsies.
Trends Neurosci 2005; 28: 108–15.Cossart R, Dinocourt C, Hirsch JC, Merchan-Perez A, De Felipe J,
Ben-Ari Y, et al. Dendritic but not somatic GABAergic inhibition is
decreased in experimental epilepsy. Nat Neurosci 2001; 4: 52–62.
Csicsvari J, Hirase H, Czurko A, Mamiya A, Buzsaki G. Fast network
oscillations in the hippocampal CA1 region of the behaving rat.
J Neurosci 1999; 19: RC20.
Curia G, Longo D, Biagini G, Jones RS, Avoli M. The pilocarpine
model of temporal lobe epilepsy. J Neurosci Methods 2008; 172:
143–57.
de Curtis M, Avanzini G. Interictal spikes in focal epileptogenesis.
Prog Neurobiol 2001; 63: 541–67.
Dichter M, Spencer WA. Penicillin-induced interictal discharges from
the cat hippocampus. I. Characteristics and topographical features.
J Neurophysiol 1969a; 32: 649–62.Dichter M, Spencer WA. Penicillin-induced interictal discharges from
the cat hippocampus. II. Mechanisms underlying origin and restric-
tion. J Neurophysiol 1969b; 32: 663–87.
Dombeck DA, Harvey CD, Tian L, Looger LL, Tank DW. Functional
imaging of hippocampal place cells at cellular resolution during vir-
tual navigation. Nat Neurosci 2010; 13: 1433–40.
Doron G, von HM, Schlattmann P, Houweling AR, Brecht M. Spiking
irregularity and frequency modulate the behavioral report of single-
neuron stimulation. Neuron 2014; 81: 653–63.Dugladze T, Schmitz D, Whittington MA, Vida I, Gloveli T.
Segregation of axonal and somatic activity during fast network os-
cillations. Science 2012; 336: 1458–61.
Ellender TJ, Nissen W, Colgin LL, Mann EO, Paulsen O. Priming of
hippocampal population bursts by individual perisomatic-targeting
interneurons. J Neurosci 2010; 30: 5979–91.
Esclapez M, Hirsch JC, Ben-Ari Y, Bernard C. Newly formed
excitatory pathways provide a substrate for hyperexcitability in
experimental temporal lobe epilepsy. J Comp Neurol 1999; 408:
449–60.
Fabene PF, Navarro MG, Martinello M, Martinello M, Rossi B,
Merigo F, et al. A role for leukocyte-endothelial adhesion mechan-
isms in epilepsy. Nat Med 2008; 14: 1377–83.
Feldt Muldoon S, Soltesz I, Cossart R. Spatially clustered neur-
onal assemblies comprise the microstructure of synchrony in
chronically epileptic networks. Proc Natl Acad Sci USA 2013;
110: 3567–72.
Fuentealba P, Begum R, Capogna M, Jinno S, Marton LF, Csicsvari J,
et al. Ivy cells: a population of nitric-oxide-producing, slow-spiking
GABAergic neurons and their involvement in hippocampal network
activity. Neuron 2008; 57: 917–29.
Galarreta M, Hestrin S. A network of fast-spiking cells in the neocor-
tex connected by electrical synapses. Nature 1999; 402: 72–5.
Galarreta M, Hestrin S. Electrical synapses between GABA-releasing
interneurons. Nat Rev Neurosci 2001; 2: 425–33.
Geiger JR, Lubke J, Roth A, Frotscher M, Jonas P. Submillisecond
AMPA receptor-mediated signaling at a principal neuron- inter-
neuron synapse. Neuron 1997; 18: 1009–23.
Gibbs FA, Davis H, Lennox WG. The electroencephalogram in epi-
lepsy and conditions with impaired consciousness. Arch Neurol
Psychiatry 1935; 34: 1133–48.
Gigout S, Louvel J, Kawasaki H, D’Antuono M, Armand V,
Kurcewicz I, et al. Effects of gap junction blockers on human neo-
cortical synchronization. Neurobiol Dis 2006; 22: 496–508.Greenberg DS, Houweling AR, Kerr JN. Population imaging of on-
going neuronal activity in the visual cortex of awake rats. Nat
Neurosci 2008; 11: 749–51.
Grenier F, Timofeev I, Steriade M. Focal synchronization of ripples
(80-200 Hz) in neocortex and their neuronal correlates.
J Neurophysiol 2001; 86: 1884–98.
Grenier F, Timofeev I, Steriade M. Neocortical very fast oscillations
(ripples, 80-200 Hz) during seizures: intracellular correlates.
J Neurophysiol 2003; 89: 841–52.
Gulyas AI, Freund TT. Generation of physiological and pathological
high frequency oscillations: the role of perisomatic inhibition in
sharp-wave ripple and interictal spike generation. Curr Opin
Neurobiol 2014; 31C: 26–32.
Gulyas AI, Megias M, Emri Z, Freund TF. Total number and ratio of
excitatory and inhibitory synapses converging onto single inter-
neurons of different types in the CA1 area of the rat hippocampus.
J Neurosci 1999; 19: 10082–97.
Hu H, Jonas P. A supercritical density of Na( + ) channels ensures fast
signaling in GABAergic interneuron axons. Nat Neurosci 2014; 17:
686–93.Hu H, Martina M, Jonas P. Dendritic mechanisms underlying rapid
synaptic activation of fast-spiking hippocampal interneurons.
Science 2010; 327: 52–8.
Huberfeld G, Menendez de la PL, Pallud J, Cohen I, Le Van Quyen M,
Adam C, et al. Glutamatergic pre-ictal discharges emerge at the
transition to seizure in human epilepsy. Nat Neurosci 2011; 14:
627–34.
Huneau C, Benquet P, Dieuset G, Biraben A, Martin B, Wendling F.
Shape features of epileptic spikes are a marker of epileptogenesis in
mice. Epilepsia 2013; 54: 2219–27.Hunt RF, Girskis KM, Rubenstein JL, Alvarez-Buylla A, Baraban SC.
GABA progenitors grafted into the adult epileptic brain control seiz-
ures and abnormal behavior. Nat Neurosci 2013; 16: 692–7.
Keller CJ, Truccolo W, Gale JT, Eskandar E, Thesen T, Carlson C,
et al. Heterogeneous neuronal firing patterns during interictal
epileptiform discharges in the human cortex. Brain 2010; 133:
1668–81.
Klaassen A, Glykys J, Maguire J, Labarca C, Mody I, Boulter J.
Seizures and enhanced cortical GABAergic inhibition in two mouse
models of human autosomal dominant nocturnal frontal lobe epi-
lepsy. Proc Natl Acad Sci USA 2006; 103: 19152–7.
Krook-Magnuson E, Armstrong C, Oijala M, Soltesz I. On-demand
optogenetic control of spontaneous seizures in temporal lobe epi-
lepsy. Nat Commun 2013; 4: 1376.
Lewis DA. Inhibitory neurons in human cortical circuits: substrate for
cognitive dysfunction in schizophrenia. Curr Opin Neurobiol 2014;
26C: 22–6.
Li Y, Fleming IN, Colpan ME, Mogul DJ. Neuronal desynchronization
as a trigger for seizure generation. IEEE Trans Neural Syst Rehabil
Eng 2008; 16: 62–73.Lovett-Barron M, Kaifosh P, Kheirbek MA, Danielson N, Zaremba
JD, Reardon TR, et al. Dendritic inhibition in the hippocampus
supports fear learning. Science 2014; 343: 857–63.
Inhibition shapes interictal dynamics BRAIN 2015: 138; 2875–2890 | 2889
Marchionni I, Maccaferri G. Quantitative dynamics and spatial profileof perisomatic GABAergic input during epileptiform synchronization
in the CA1 hippocampus. J Physiol 2009; 587: 5691–708.
Marissal T, Bonifazi P, Picardo MA, Nardou R, Petit LF, Baude A,
et al. Pioneer glutamatergic cells develop into a morpho-functionallydistinct population in the juvenile CA3 hippocampus. Nat Commun
2012; 3: 1316.
Megias M, Emri Z, Freund TF, Gulyas AI. Total number and distri-
bution of inhibitory and excitatory synapses on hippocampal CA1pyramidal cells. Neuroscience 2001; 102: 527–40.
Melzer S, Michael M, Caputi A, Eliava M, Fuchs EC, Whittington
MA, et al. Long-range-projecting GABAergic neurons modulate in-hibition in hippocampus and entorhinal cortex. Science 2012; 335:
1506–10.
Miles R, Wong R. Single neurons can initiate synchronized population
discharge in the hippocampus. Nature 1983; 306: 371–3.Molnar G, Olah S, Komlosi G, Fule M, Szabadics J, Varga C, et al.
Complex events initiated by individual spikes in the human cerebral
cortex. PLoS Biol 2008; 6: e222.
Mosbah A, Tramoni E, Guedj E, Aubert S, Daquin G, Ceccaldi M,et al. Clinical, neuropsychological, and metabolic characteristics of
transient epileptic amnesia syndrome. Epilepsia 2014; 55: 699–706.
Nusser Z, Cull-Candy S, Farrant M, Hausser M, Clark BA.
Differences in synaptic GABA(A) receptor number underlie variationin GABA mini amplitude Tonic synaptic inhibition modulates neur-
onal output pattern and spatiotemporal synaptic integration.
Neuron 1997; 19: 665–78.Peng Z, Zhang N, Wei W, Huang CS, Cetina Y, Otis TS, et al. A
reorganized GABAergic circuit in a model of epilepsy: evidence from
optogenetic labeling and stimulation of somatostatin interneurons.
J Neurosci 2013; 33: 14392–405.Potworowski J, Jakuczun W, Leski S, Wojcik D. Kernel current source
density method. Neural Computation 2012; 24: 541–75.
Prince DA. Inhibition in “epileptic” neurons. Exp Neurol 1968; 21:
307–21.Prince DA, Wilder BJ. Control mechanisms in cortical epileptogenic
foci. “Surround” inhibition. Arch Neurol 1967; 16: 194–202.
Rheims S, Represa A, Ben-Ari Y, Zilberter Y. Layer-specific generationand propagation of seizures in slices of developing neocortex: role
of excitatory GABAergic synapses. J Neurophysiol 2008; 100:
620–8.
Royer S, Zemelman BV, Losonczy A, Kim J, Chance F, Magee JC, et al.Control of timing, rate and bursts of hippocampal place cells by den-
dritic and somatic inhibition. Nat Neurosci 2012; 15: 769–75.
Sabolek HR, Swiercz WB, Lillis KP, Cash SS, Huberfeld G, Zhao G,
et al. A candidate mechanism underlying the variance of interictalspike propagation. J Neurosci 2012; 32: 3009–21.
Schevon CA, Weiss SA, McKhann G, Jr, Goodman RR, Yuste R,Emerson RG, et al. Evidence of an inhibitory restraint of seizure
activity in humans. Nat Commun 2012; 3: 1060.
Smolders I, Bortolotto ZA, Clarke VR, Warre R, Khan GM, O’Neill
MJ, et al. Antagonists of GLU(K5)-containing kainate receptors pre-vent pilocarpine-induced limbic seizures. Nat Neurosci 2002; 5:
796–804.
Staley KJ, White A, Dudek FE. Interictal spikes: harbingers or causes
of epilepsy? Neurosci Lett 2011; 497: 247–50.Sun Y, Nguyen AQ, Nguyen JP, Le L, Saur D, Choi J, et al. Cell-type-
specific circuit connectivity of hippocampal CA1 revealed through
Cre-dependent rabies tracing. Cell Rep 2014; 7: 269–80.Timofeev I, Grenier F, Steriade M. The role of chloride-dependent
inhibition and the activity of fast-spiking neurons during cor-
tical spike-wave electrographic seizures. Neuroscience 2002; 114:
1115–32.Tolu S, Avale ME, Nakatani H, Pons S, Parnaudeau S, Tronche F,
et al. A versatile system for the neuronal subtype specific expression
of lentiviral vectors. FASEB J 2010; 24: 723–30.
Trevelyan AJ. The direct relationship between inhibitory currents andlocal field potentials. J Neurosci 2009; 29: 15299–307.
Trevelyan AJ, Schevon CA. How inhibition influences seizure propa-
gation. Neuropharmacology 2013; 69: 45–54.
Trevelyan AJ, Sussillo D, Watson BO, Yuste R. Modular propagationof epileptiform activity: evidence for an inhibitory veto in neocortex.
J Neurosci 2006; 26: 12447–55.
Truccolo W, Donoghue JA, Hochberg LR, Eskandar EN, Madsen JR,Anderson WS, et al. Single-neuron dynamics in human focal epi-
lepsy. Nat Neurosci 2011; 14: 635–41.
Velazquez JL, Carlen PL. Synchronization of GABAergic interneuronal
networks during seizure-like activity in the rat horizontal hippocam-pal slice. Eur J Neurosci 1999; 11: 4110–18.
Wozny C, Gabriel S, Jandova K, Schulze K, Heinemann U, Behr J.
Entorhinal cortex entrains epileptiform activity in CA1 in pilocar-
pine-treated rats. Neurobiol Dis 2005; 19: 451–60.Wozny C, Kivi A, Lehmann TN, Dehnicke C, Heinemann U, Behr J.
Comment on “On the origin of interictal activity in human temporal
lobe epilepsy in vitro". Science 2003; 301: 463.Yaari Y, Beck H. “Epileptic neurons” in temporal lobe epilepsy. Brain
Pathol 2002; 12: 234–9.
Zhang ZJ, Koifman J, Shin DS, Ye H, Florez CM, Zhang L, et al.
Transition to seizure: ictal discharge is preceded by exhausted pre-synaptic GABA release in the hippocampal CA3 region. J Neurosci
2012; 32: 2499–512.
Zhou JL, Lenck-Santini PP, Zhao Q, Holmes GL. Effect of interictal
spikes on single-cell firing patterns in the hippocampus. Epilepsia2007; 48: 720–31.
2890 | BRAIN 2015: 138; 2875–2890 S. F. Muldoon et al.