Embed Size (px)
Citation preview
© 2005 International Monetary Fund May 2005
IMF Country Report No. 05/147
Gabon: Selected Issues and Statistical Appendix
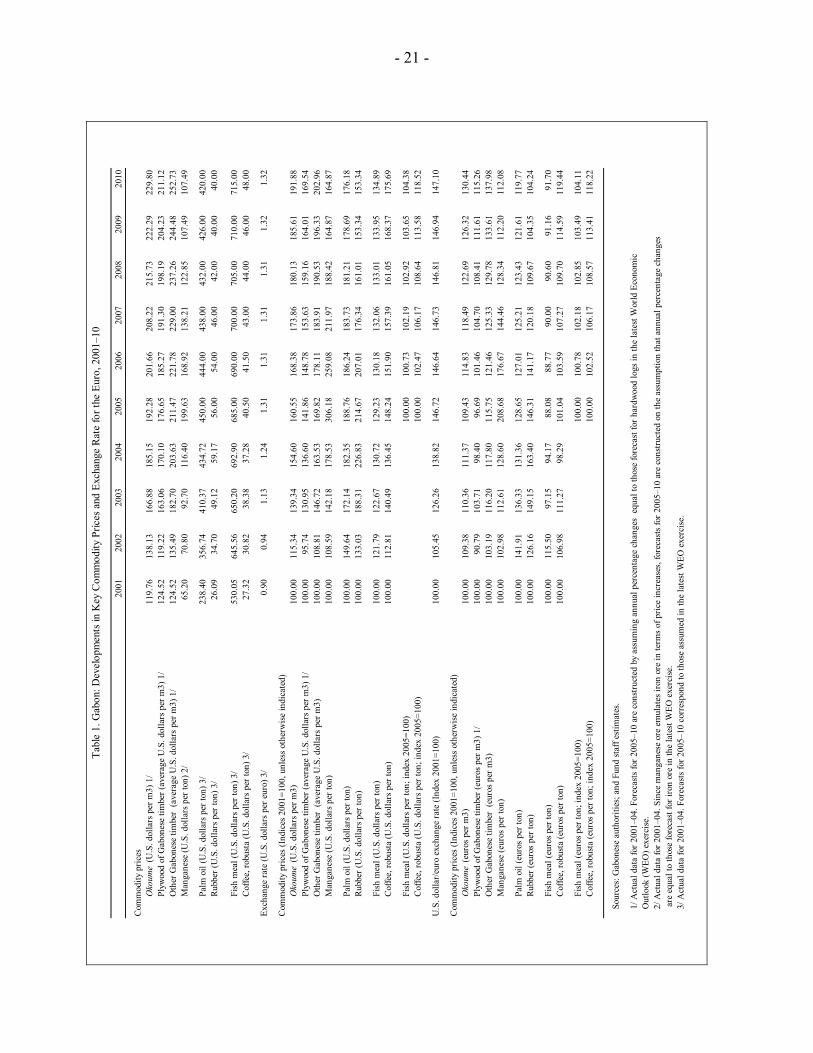
This Selected Issues and Statistical Appendix paper for Gabon was prepared by a staff team of the International Monetary Fund as background documentation for the periodic consultation with the member country. It is based on the information available at the time it was completed on March 21, 2005. The views expressed in this document are those of the staff team and do not necessarily reflect the views of the government of Gabon or the Executive Board of the IMF. The policy of publication of staff reports and other documents by the IMF allows for the deletion of market-sensitive information.
To assist the IMF in evaluating the publication policy, reader comments are invited and may be sent by e-mail to [email protected].
Copies of this report are available to the public from
International Monetary Fund ● Publication Services 700 19th Street, N.W. ● Washington, D.C. 20431
Telephone: (202) 623 7430 ● Telefax: (202) 623 7201 E-mail: [email protected] ● Internet: http://www.imf.org
Price: $15.00 a copy
International Monetary Fund
Washington, D.C.

INTERNATIONAL MONETARY FUND
GABON
Selected Issues and Statistical Appendix
Prepared by Roger Nord (Head), Oscar Melhado, Chris Geiregat (all AFR), Gabriel Di Bella (PDR), and Tahsin Saadi Sedik (FAD)
Approved by the African Department
March 21, 2005
Contents Page I. Introduction.......................................................................................................................4
II. Managing Oil Revenues in Gabon—Is There a Role for the Fund for Future Generations? .................................................................................................6 A. Introduction: Two Views on Oil Revenues ................................................................6 B. Natural Resource Funds..............................................................................................8 C. The Fund for Future Generations................................................................................9 D. Economic Analysis of the Fund for Future Generations ..........................................10 E. Policy Implications and Conclusions........................................................................17
III. Competitiveness and Growth..........................................................................................20 A. Introduction...............................................................................................................20 B. Some Competitiveness Issues ...................................................................................20 C. What Drives Gabon’s Non-Oil GDP Growth? .........................................................28 D. Conclusions...............................................................................................................37
Appendices I. Data Sources and Description...................................................................................40 II. Vector Autoregression (VAR) ..................................................................................42
IV. Medium-Term Fiscal Constraints in Gabon: A Scenario Approach...............................44 A. Introduction...............................................................................................................44 B. Alternative Scenarios ................................................................................................46 C. Policy Implications ...................................................................................................53 D. Conclusion ................................................................................................................55
V. Forestry Sector Reform in Gabon ...................................................................................57 A. Gabon and the Congo Basin .....................................................................................57
- 2 -
Contents Page B. Reform Objectives in the Congo Basin ....................................................................60 C. Gabon’s Forestry Reform Agenda ............................................................................61 D. Next Steps .................................................................................................................64
Tables II. 1. Projected Oil Production and Prices .........................................................................10 2. Value of FGF, Total and Per Capita Consumption...................................................12 3. Intergenerational Equity: Annuity Values (Permanent Income) Compared to FGF Scenarios..................................................................................15 4. Value of FGF, Total and Per Capita Consumption, With Contributions Starting in 1999......................................................................................................16 5. Intergenerational Equity: Annuity Values (Permanent Income) Compared to FGF Scenarios, With Contributions Starting in 1999........................................17 III. 1. Developments in Key Commodity Prices and Exchange Rate for the Euro, 2001–10..................................................................................................................21 2. Non-Oil Private Sector Wages and the Public Sector Wage Bill .............................27 3. Sub-Saharan Africa Aggregate Governance Indicators, 1996–2002........................31 4. Non-Oil Formal Employment ...................................................................................37 IV. 1. Comparison of Oil and Non-Oil Revenues...............................................................45 2. Oil Windfall ..............................................................................................................48 3. Summary of Scenario Assumptions..........................................................................49 4. Government Finance Under Baseline Scenario ........................................................50 V. 1. Forest Sector Indicators for the Congo Basin Countries in 2001 .............................58 2. Forestry Sector Tax Revenues ..................................................................................58
Figures III. A. Real Effective Exchange Rate ..................................................................................24 B. Some Regression Analysis........................................................................................32 C. Impulse Response Functions.....................................................................................34 D. Wages and Tradable Goods Production....................................................................36 IV. 1. Government Finance, 1990–2004.............................................................................44 2. Non-Oil Balance, 1990–2004 ...................................................................................45 3. Composition of Current Expenditure, 1990–2004....................................................46 4. Projection of Oil Revenue.........................................................................................47 5. Selected African Countries, Wage Bill as a Percentage of GDP..............................47 6. Financing Gap...........................................................................................................51 7. Financing Gap...........................................................................................................52 8. Total Public Debt ......................................................................................................52 9. Total Public Debt ......................................................................................................53
- 3 -
Contents Page V. 1. Forests .......................................................................................................................56 2. Forests Area Per Capita ............................................................................................58 3. Cut and Export of Logs.............................................................................................59
Statistical Appendix Tables
Basic Data .............................................................................................................................67 1. Gross Domestic Product by Sector at Current Prices, 1998-2004 ..................................69 2. Gross Domestic Product by Sector at Constant 1991 Market Prices, 1998-2004 ..........70 3. Gross Domestic Product, 1998-2004 ..............................................................................71 4. Supply and Use of Resources at Current Prices, 1998-2004 ..........................................72 5. Supply and Use of Resources at Constant 1991 Prices, 1998-2004 ...............................73 6. Supply and Use of Resources at Current Prices, 1998-2004 ..........................................74 7. Supply and Use of Resources at Constant 1991 Prices, 1998-2004 ...............................75 8. Saving and Investment Balances, 1998-2004 .................................................................76 9. Saving and Investment Balances, 1998-2004 .................................................................77 10. Discovered Oil Fields During 1990-2004 ......................................................................78 11. Production and Export of Timber, 1998-2004................................................................79 12. Marketing of Timber by SNBG, 1998-2004...................................................................80 13. Production in Agriculture, Livestock, and Fishing, 1998-2004......................................81 14. Industrial Production, 1998-2004 ...................................................................................82 15. Wood Production and Prices, 1998-02004 .....................................................................83 16. Production and Distribution of Electricity and Water, 1998-2004 .................................84 17. Production and Consumption of Refined Oil Products, 1998-2004 ...............................85 18. Transportation, 1998-2004..............................................................................................86 19. Salaried Employment in the Formal Sector, 1998-2003.................................................87 20. Fiscal Operations of the Central Government, 1998-2004 .............................................88 21. Central Government Revenue and Grants, 1998-2004 ...................................................90 22. Central Government Revenue, 1998-2004 .....................................................................91 23. Central Government Expenditure, 1998-2004................................................................92 24. Interest Rate Structure, 1998-2004 .................................................................................93 25. Composition of Exports, 1998-2004...............................................................................94 26. Composition of Imports, 1998-2004...............................................................................95 27. Direction of Trade, 1998-2003 .......................................................................................96 28. External Public Debt, 2000-04........................................................................................97
- 4 -
I. INTRODUCTION
1. On a per capita basis, Gabon is one of the richest countries in sub-Saharan Africa. For the past three decades, oil production has yielded significant income and now accounts for nearly half of GDP, 80 percent of export earnings, and over half of fiscal revenue. But despite its wealth, Gabon has continued to face problems. Oil booms and political cycles have resulted in a ratcheting up of public expenditure, followed by painful adjustment when prices have fallen. Unable to service its heavy debt burden, Gabon accumulated external payment arrears requiring repeated, expensive rescheduling. Meanwhile, available information suggests that social indicators remain quite weak. Since 1997, oil production has fallen by 30 percent. Significant investment in recent years, driven by technological progress as well as high oil prices, has temporarily stemmed the decline. But barring significant new discoveries, which are not on the horizon, the steady drop in output is expected to resume.
2. Against this background, the challenge for Gabon is to prepare itself for the post-oil era. This requires both adjusting macroeconomic policies, notably fiscal policy, and accelerating structural reforms aimed at promoting the diversification of the economy. The selected issues papers analyze these requirements in more detail.
3. Chapter II looks at how oil revenues are managed in Gabon and the role that the Fund for Future Generations (FFG) can play. Many resource-rich countries have established funds aimed at helping governments achieve stabilization or savings objectives, often with mixed results. Indeed, accumulating deposits in a fund alone says very little about net government savings or intergenerational equity. This paper takes sustainable fiscal policies as a given (treated in more detail in Chapter IV) and asks a more narrow question: what is the impact of Gabon’s FFG on present and future generations? The paper concludes that while the FFG does shift benefits from current to future generations, it falls well short of achieving inter-generational equity. It also suggests, given the secular decline in oil production, that at least in the next few years, reducing government debt rather than accumulating FFG deposits may be the optimal use of Gabon’s oil revenues.
4. Chapter III examines competitiveness and the sources of non-oil growth in Gabon. Data availability and Gabon’s long-standing membership in the CFA franc zone impose some limitations on classical competitiveness analysis. However, buoyant world market prices of Gabon’s main non-oil exports—timber and manganese—have helped it remain competitive in recent years, despite the sharp appreciation of the euro, to which the CFA franc is pegged. At the same time, the large and well paid civil service that Gabon maintains has likely contributed to the high cost structure in the formal sector and may have shifted activities to the informal economy. Available data also suggest a sustained shift of economic activity from the tradable to nontradable sector, suggesting a deterioration of export competitiveness. The paper concludes that Gabon faces some Dutch disease-like challenges, which, to overcome, require persistent structural reforms to promote investment and economic diversification.
- 5 -
5. Chapter IV conducts a series of scenario analyses for 2005–23 to test the constraints facing fiscal policy as a result of the steady decline in oil production and related government revenue. Using a number of different plausible assumptions, the paper illustrates that Gabon will face a significant challenge when oil revenues begin to fall. Non-oil revenues are already quite high by sub-Saharan African standards, and most of the adjustment will need to be shouldered by controlling expenditure, notably the government wage bill. However, the paper also shows that Gabon has a unique opportunity to enter a virtuous cycle if it uses the current windfall revenue from high prices wisely. If it maintains budgetary discipline, and manages its oil windfall prudently, foreign debt can fall by more than half by 2010. If, on the other hand, Gabon relaxes fiscal policy today, foreign debt will remain at current levels and unsustainable financing gaps will open up.
6. Finally, Chapter V examines the recent reforms in Gabon’s forestry sector, a key source of potential future growth. Following many years of almost unregulated exploitation of its forest, Gabon has initiated a series of reforms since 2001 geared toward protecting its forestry resources and managing them sustainably. The creation of national parks was accompanied by a simplification of forestry taxation to provide incentives for sustainable management and promote domestic transformation. More recently, the decision to eliminate the timber marketing board and introduce more transparency in the allocation of forestry permits also aims to make timber a long-term, sustainable economic resource for Gabon.
- 6 -
II. MANAGING OIL REVENUES IN GABON—IS THERE A ROLE FOR THE FUND FOR FUTURE GENERATIONS?1
A. Introduction: Two Views on Oil Revenues
1. A country that is blessed with abundant natural resources—notably oil—faces several macroeconomic challenges. Export receipts, as well as fiscal revenues from resource extraction are often highly volatile, requiring the government to plan budgetary expenditures carefully. This task is complicated by the need to distinguish temporary shocks from longer-term or permanent ones. Even when the path of expenditures is relatively well known (such as with long-term investment projects and recurrent expenditures), if future oil revenues are the main source for paying for these engagements, then a certain degree of prudence is still required. Otherwise, governments run the risk of ending up with an unsustainable debt.
2. Governments must also take into consideration the dynamic effects that revenues from oil have on the rest of the economy. For example, rapid expansion of the “enclave” oil sector and large inflows of foreign exchange may put upward pressure on the currency and prices, hampering competitiveness and the development of other sectors (see Chapter III). Also, large oil revenues may hamper the development of a broad-based tax system and may weaken discipline in overall budgetary management and governance.
3. Finally, governments that rely on revenues from natural resource extraction must address the fact that those revenues are exhaustible. The finite nature of natural resource extraction opens the question of the intertemporal allocation of the economic benefits from such resources. One view is to interpret revenues from extraction as current income, in which case the intertemporal allocation of extraction revenues boils down to a standard consumption and savings decision. Due to the volatility in receipts, the decision to save may be based on precautionary motives, resulting in attempts to smooth the impact of income volatility on consumption. Or, the savings decision may be motivated by a bequest motive that leaves assets for future generations. If the savings are put to productive use, then future generations will inherit a higher capital stock and would be better off (even with low yields on those savings) than if all current revenues were consumed immediately.
4. An alternative view is to consider natural resource revenues as a transformation of natural resource wealth into financial wealth, rather than an income stream. Total wealth is then the sum of natural resource wealth (the present value of current and all future extraction revenues) and financial wealth.2 In managing natural resource wealth, each generation must then answer two basic questions. First, how much of the natural resource reserves will be extracted each period? In principle, the answer to this question depends both on technological 1 Prepared by Chris Geiregat.
2 And the stock of productive physical assets. The issue if spending on investment goods is largely ignored in this paper to simplify the discussion.
- 7 -
constraints and on the risk-return characteristics of each type of asset (natural and financial) in the overall wealth portfolio. For example, when world oil prices are temporarily “high,” it may be desirable to speed up oil extraction by operating marginal fields. The second question is how much should be consumed in each period. If all the extraction revenues are immediately consumed, then the present generation effectively pays for current consumption by reducing assets and does so at the expense of all future generations. The other extreme would be to invest all extraction revenues in financial assets, leaving everything for future generations. Clearly, there exist an infinite number of intermediate choices that provide a more evenly distributed outcome across generations. The “optimal” intergenerational distribution depends on society’s intertemporal welfare function and is hard to determine.3 One choice is to ensure intergenerational equity by letting only the permanent income from wealth accrue to each generation. This permanent income may be thought of as an annuity that allows each generation to consume without depleting wealth for future generations. In a society with population growth, the annuity value would be calculated as the permanent income from a constant real per capita stock of wealth of all current and future members of society. Alternatively, countries with a relatively low capital stock might prefer to spend more on investment, thereby helping them achieve their steady-state capital stock faster.4
5. The intertemporal choices become more complicated when a society has accumulated debt. In that case, the extraction revenues could be used for immediate consumption, for building up gross financial wealth, and for paying off debt. The optimal composition of the nation’s net wealth portfolio divides this portfolio into natural resource wealth, gross financial wealth, and debt. In principle, risk-return characteristics of each of the three components should guide this decision. If the interest rate on debt is higher than the expected return on financial assets, then it may be desirable to pay off debt first before building up financial assets. However, it may be optimal to keep some financial assets for precautionary reasons, even if their expected return is lower. If access to credit is constrained during bad times, such a stock of financial assets would allow smoothing of consumption expenditures and also guarantee the timeliness of future debt service payments in light of volatile extraction revenues.
6. In the context of ensuring intergenerational equity, the decision to pay off debt with oil revenues may depend on the origins of the debt. If the debt was accumulated to finance investments in productive activities, and both the current and future generations stand to benefit from a higher capital stock, then it can be argued that all generations share in paying off the debt. In that case, it would be justified to reduce the debt burden through the use of oil revenues. A moral argument may suggest a different approach if the debt was accumulated
3 For a discussion of savings to ensure justice across generations, see Rawls, 1971, pp. 251–258.
4 See Takizawa et al, 2004 for this argument. For theoretical models on fiscal strategies for oil producing countries, see Engel and Valdés, 2000.
- 8 -
primarily to pay for consumption of an impatient present generation, of if the debt financed largely unproductive and wasteful investment spending. In that case, a more just outcome might be to save more oil revenues for future generations and pay off the debt mainly through non-oil primary surpluses (that is, less current spending, increased non-oil revenues, or both).
7. This paper focuses on the question of how useful it is to put some of the Gabonese oil revenues aside in a Fund for Future Generations, with a focus on the institutional arrangements of the Fund as outlined in its founding legal provisions. A full assessment of the intergenerational aspects of the Fund for Future Generations requires making assumptions about the current and future path of government revenues and expenditures. The reason is that, for example, simply setting aside part of oil revenues while financing non-oil deficits with expensive debt would not leave future generations better off, as net wealth declines. Thus, a complete analysis would impose fiscal rules on the non-oil fiscal deficit, and then derive the required fiscal adjustment for given contributions to the Fund. However, such an extensive exercise is beyond the scope of this paper. Instead, a more limited approach is taken by focusing exclusively on the contribution of the Fund to consumption of present and future generations and comparing the outcomes of different scenarios of remuneration. This is justified as long as the contributions are made from any remaining oil revenues, after first financing the non-oil deficit. Once the non-oil deficit is financed, the remaining choices are those of portfolio allocation. In this paper, the opportunity cost of contributing to the Fund (building up other financial assets or paying down debt) is captured by the discount rate.
8. The rest of the paper is organized as follows. Sections B and C give examples of natural resource funds from various countries and describe the modalities of the Gabonese Fund for Future Generations in detail. In Section D the assumptions are developed and the results of various scenarios of the potential effects on present and future generations are presented. Finally, Section E sums up the findings and concludes.
B. Natural Resource Funds
9. Several countries with natural resource revenues have set up funds in which some or all such revenues are deposited. The objectives, operational rules, transparency requirements and the actual performance of such funds vary widely; a detailed description of the modalities is beyond the scope of this paper.5 One example is the Norwegian State Petroleum Fund, which is a separate government account where oil revenues are deposited. In return, the fund finances the non-oil fiscal deficit through a transfer to the budget. The Norwegian oil fund has been credited with improving the transparency of the budgetary process, and
5 The interested reader may find more information in Fasano, 2000, Davis et al., 2001; and Katz et al., 2004. This section draws heavily from those sources.
- 9 -
makes clearer the intertemporal choices facing the government, which sets explicit targets for the non-oil budget deficit.
10. In other cases, the natural resource fund has mainly a stabilization objective, such as with the Chilean Copper Stabilization Fund, the Mineral Resources Stabilization Fund in Papua New Guinea (abolished in 2001), and the Macroeconomic Stabilization Fund in Venezuela. The decision to contribute and withdraw may depend on price triggers that could be rules-based or left up to the discretion of policymakers.
11. Finally, in some cases the goal of the fund is to be a store of value for future generations. Examples of this class of “savings” funds include the Reserve Fund for Future Generations in Kuwait and the Alaska Permanent Fund set up by the State of Alaska. In both cases, contributions are made independently of world oil market developments or of the budgetary situation of the government.
C. The Fund for Future Generations
12. Gabon is a mature oil producing economy. Barring any significant new discoveries, oil production is expected to decline substantially during the next decade. The intergenerational dimension of the projected decline in oil production is given higher urgency by the low degree of diversification of the economy, the reliance of the government budget on oil revenues, and the large stock of outstanding debt.
13. To safeguard some of the oil revenues for future generations, a law was passed in July 1998 that created a Fund for Future Generations (Fonds pour les Générations Futures, FGF). The FGF is conceived as a perpetual reserve fund with a minimum capital of CFAF 500 billion. The 1998 law explicitly bars the use of the resources in the FGF to finance government spending.
14. The law describes the rules for contributions into the FGF. During a first phase, which applies up to the minimum capital is reached, the following contribution rules apply:
• 10 percent of projected revenues, using a baseline projection that is determined in the annual budget law;
• 50 percent of oil revenues exceeding the baseline projection contained in the budget law (that is, half of the “windfall” revenues);
• reinvestment of all the interest income from the FGF.
15. Once the minimum capital is reached, contributions would be made as follows:
• all the oil revenues exceeding the baseline projection set out in the budget law (that is, all of the windfall revenues);
• reinvestment of one fourth of the interest income from the FGF (the remaining three quarters of interest income is paid into the general resources of the government).
- 10 -
16. The FGF is held in a special account at the regional central bank (BEAC). While originally not remunerated, since January 2005 the BEAC pays interest on the outstanding balance at a rate of 1.7 percent per annum.
17. In practice, the government has not made the contributions to the FGF as outlined in the 1998 law, and at end-2004, the outstanding balance of the FGF stood at CFAF 55 billion (1.43 percent of GDP).
D. Economic Analysis of the Fund for Future Generations
Main assumptions
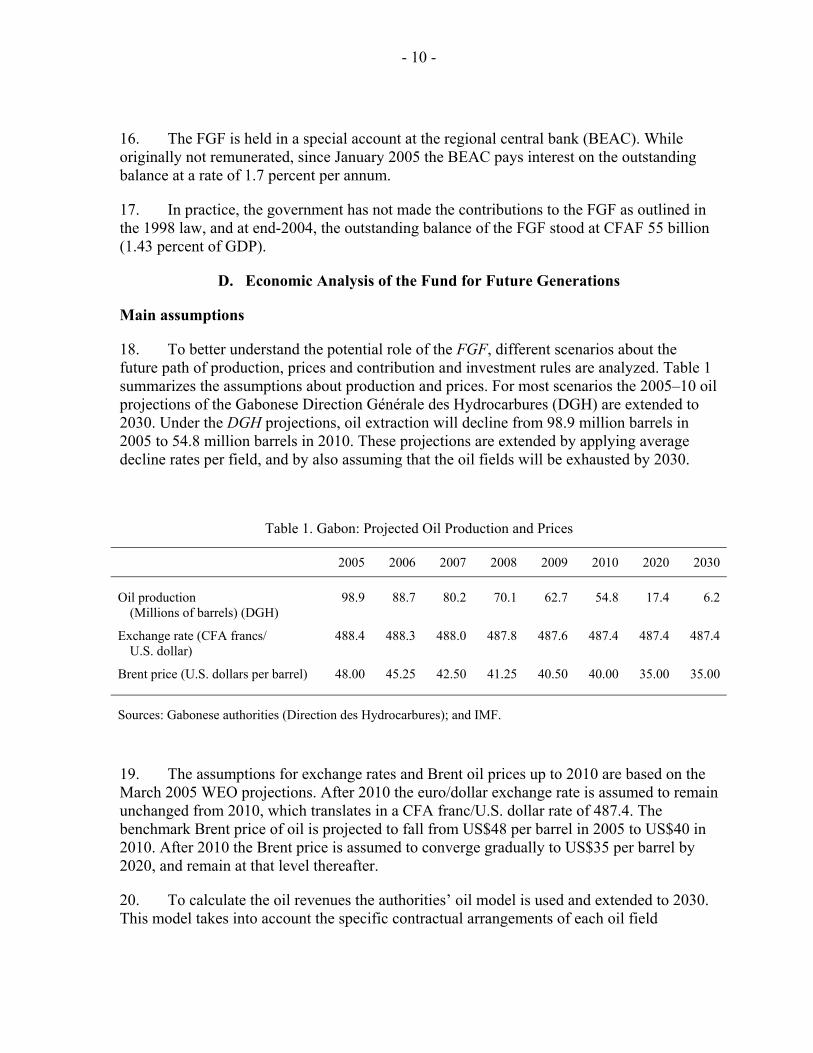
18. To better understand the potential role of the FGF, different scenarios about the future path of production, prices and contribution and investment rules are analyzed. Table 1 summarizes the assumptions about production and prices. For most scenarios the 2005–10 oil projections of the Gabonese Direction Générale des Hydrocarbures (DGH) are extended to 2030. Under the DGH projections, oil extraction will decline from 98.9 million barrels in 2005 to 54.8 million barrels in 2010. These projections are extended by applying average decline rates per field, and by also assuming that the oil fields will be exhausted by 2030.
Table 1. Gabon: Projected Oil Production and Prices
2005 2006 2007 2008 2009 2010 2020 2030 Oil production
(Millions of barrels) (DGH) 98.9 88.7 80.2 70.1 62.7 54.8 17.4 6.2
Exchange rate (CFA francs/ U.S. dollar)
488.4 488.3 488.0 487.8 487.6 487.4 487.4 487.4
Brent price (U.S. dollars per barrel) 48.00 45.25 42.50 41.25 40.50 40.00 35.00 35.00
Sources: Gabonese authorities (Direction des Hydrocarbures); and IMF.
19. The assumptions for exchange rates and Brent oil prices up to 2010 are based on the March 2005 WEO projections. After 2010 the euro/dollar exchange rate is assumed to remain unchanged from 2010, which translates in a CFA franc/U.S. dollar rate of 487.4. The benchmark Brent price of oil is projected to fall from US$48 per barrel in 2005 to US$40 in 2010. After 2010 the Brent price is assumed to converge gradually to US$35 per barrel by 2020, and remain at that level thereafter.
20. To calculate the oil revenues the authorities’ oil model is used and extended to 2030. This model takes into account the specific contractual arrangements of each oil field
- 11 -
(concession contracts and production sharing agreements) and also makes assumptions about the price of each type of Gabonese oil relative to the Brent price benchmark.
21. To calculate the net present value of future revenue streams, a discount rate of 3.29 percent is used, which is the WEO average projected euro Libor rate over the period 2005–10. Inflation is projected to remain at 1 percent, resulting in a real discount rate of 2.27 percent. All the scenarios are calculated and reported in constant 2005 prices. The population is assumed to grow at 2 percent, which is somewhat lower than the current growth rate of the population.
22. To calculate the contributions to the FGF, the parameters set in the 1998 law are used. This requires an assumption about the projected windfall oil revenues for the government, that is, an assumption of the actual oil revenues relative to those projected in the budget. Since the authorities typically project oil revenues based on conservative assumptions, the windfall is calculated by assuming a reference Brent price of US$30 per barrel. Given the WEO projections for the Brent price of oil, this implies substantial windfall revenues in the early projection years, converging to a US$5 windfall per barrel after 2010.
Main scenario: contributions start in 2005
23. Three scenarios for the intertemporal effects of the FGF are developed, applying the rules set in the 1998 law from 2005 onwards. The first scenario is a benchmark in which all oil revenues are immediately consumed and nothing is saved. Given the projected production and the assumptions about the Brent price of oil, this implies that there will be no revenues left after 2030. In the second scenario the FGF is introduced, with the assumption that all contributions are made in line with the 1998 law, starting in 2005. In particular, the FGF receives an interest rate of 1.7 percent. Finally, the third scenario follows the same contribution guidelines but assumes that the FGF is remunerated at the euro Libor rate of 3.29 percent (the same rate as the nominal discount rate).
24. Table 2 summarizes the results from the three scenarios. The first column gives the present discounted value of all future flows. The table shows total oil revenues, the value of the FGF, total and per capita at different years up to 2030.
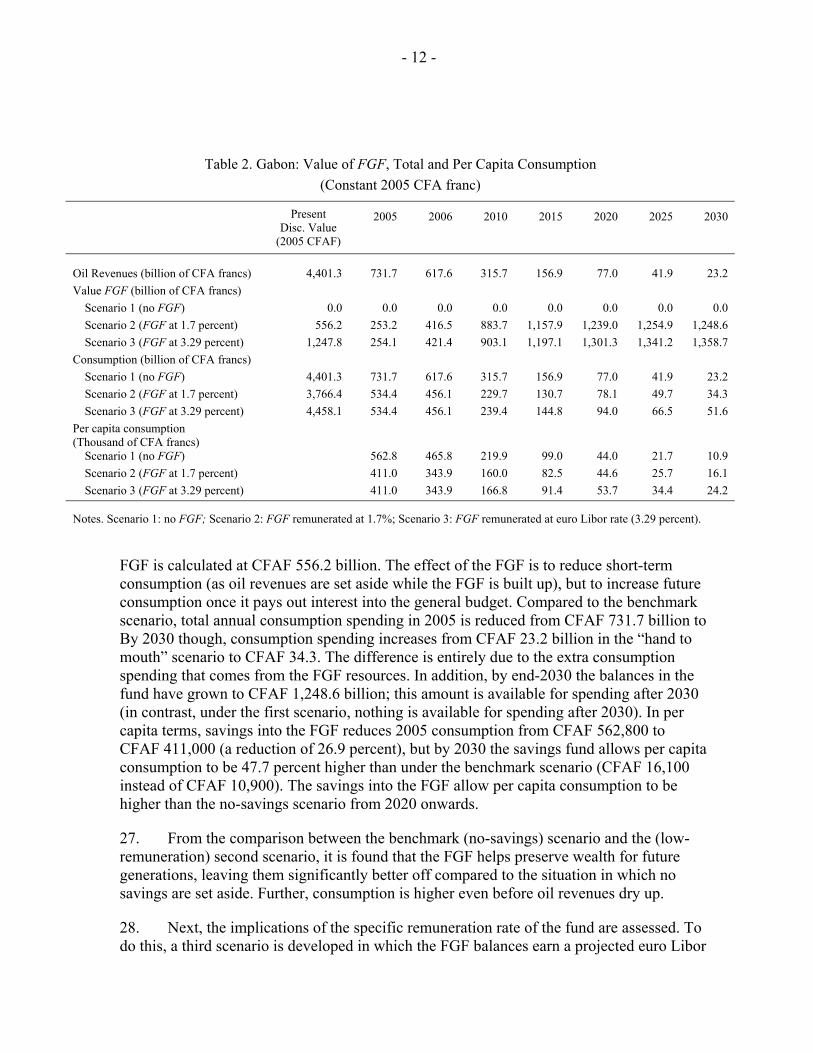
25. The present discounted value of all future oil revenues is calculated at CFAF 4,401.3 billion. This is the total amount of oil wealth, in 2005 CFA francs, that can be shared among the present and all future generations. In the first scenario, this oil wealth is consumed at the same rate as oil is extracted. Under this scenario, total consumption is projected to fall from CFAF 731.7 billion in 2005 to CFAF 23.2 billion in 2030, and is zero forever after. In per capita terms, consumption falls from CFAF 562,800 in 2005 to CFAF 10,900 by 2030.
26. This first “hand to mouth” scenario is used as a reference for comparison with the second and third scenarios, in which contributions to the FGF are introduced. In the second scenario, with the FGF remunerated at a nominal rate of 1.7 percent, the total value of the
- 12 -
Table 2. Gabon: Value of FGF, Total and Per Capita Consumption
(Constant 2005 CFA franc)
Present Disc. Value
(2005 CFAF)
2005 2006 2010 2015 2020 2025 2030
Oil Revenues (billion of CFA francs) 4,401.3 731.7 617.6 315.7 156.9 77.0 41.9 23.2 Value FGF (billion of CFA francs)
Scenario 1 (no FGF) 0.0 0.0 0.0 0.0 0.0 0.0 0.0 0.0 Scenario 2 (FGF at 1.7 percent) 556.2 253.2 416.5 883.7 1,157.9 1,239.0 1,254.9 1,248.6 Scenario 3 (FGF at 3.29 percent) 1,247.8 254.1 421.4 903.1 1,197.1 1,301.3 1,341.2 1,358.7
Consumption (billion of CFA francs) Scenario 1 (no FGF) 4,401.3 731.7 617.6 315.7 156.9 77.0 41.9 23.2 Scenario 2 (FGF at 1.7 percent) 3,766.4 534.4 456.1 229.7 130.7 78.1 49.7 34.3 Scenario 3 (FGF at 3.29 percent) 4,458.1 534.4 456.1 239.4 144.8 94.0 66.5 51.6
Per capita consumption (Thousand of CFA francs)
Scenario 1 (no FGF) 562.8 465.8 219.9 99.0 44.0 21.7 10.9 Scenario 2 (FGF at 1.7 percent) 411.0 343.9 160.0 82.5 44.6 25.7 16.1 Scenario 3 (FGF at 3.29 percent) 411.0 343.9 166.8 91.4 53.7 34.4 24.2
Notes. Scenario 1: no FGF; Scenario 2: FGF remunerated at 1.7%; Scenario 3: FGF remunerated at euro Libor rate (3.29 percent).
FGF is calculated at CFAF 556.2 billion. The effect of the FGF is to reduce short-term consumption (as oil revenues are set aside while the FGF is built up), but to increase future consumption once it pays out interest into the general budget. Compared to the benchmark scenario, total annual consumption spending in 2005 is reduced from CFAF 731.7 billion to By 2030 though, consumption spending increases from CFAF 23.2 billion in the “hand to mouth” scenario to CFAF 34.3. The difference is entirely due to the extra consumption spending that comes from the FGF resources. In addition, by end-2030 the balances in the fund have grown to CFAF 1,248.6 billion; this amount is available for spending after 2030 (in contrast, under the first scenario, nothing is available for spending after 2030). In per capita terms, savings into the FGF reduces 2005 consumption from CFAF 562,800 to CFAF 411,000 (a reduction of 26.9 percent), but by 2030 the savings fund allows per capita consumption to be 47.7 percent higher than under the benchmark scenario (CFAF 16,100 instead of CFAF 10,900). The savings into the FGF allow per capita consumption to be higher than the no-savings scenario from 2020 onwards.
27. From the comparison between the benchmark (no-savings) scenario and the (low-remuneration) second scenario, it is found that the FGF helps preserve wealth for future generations, leaving them significantly better off compared to the situation in which no savings are set aside. Further, consumption is higher even before oil revenues dry up.
28. Next, the implications of the specific remuneration rate of the fund are assessed. To do this, a third scenario is developed in which the FGF balances earn a projected euro Libor
- 13 -
rate of 3.29 percent instead of the relatively low rate of 1.7 percent from the second scenario. The results form the third scenario are also reported in Table 2. Just like in the other two scenarios, total consumption drops dramatically between 2005 and 2030, in this case from CFAF 534.4 billion to CFAF 51.6 billion respectively. In per capita terms this translates into a reduction from CFAF 411,000 in 2005 to CFAF 24.2 in 2030. However, when these magnitudes are compared to those from the low-remuneration scenario, it is found that future generations are left substantially better off when the fund earns the higher market return. For example, per capita consumption is 10.8 percent higher in 2015 (CFAF 91,400 versus CFAF 82,500), and by 2030 per capita consumption is 50 percent higher (and more than double than in the no-savings scenario). The effect of the differences in remuneration also shows up in the capitalization value of the FGF: it is calculated at CFAF 556.2 billion in the low-remuneration scenario, versus CFAF 1,247.8 billion when a market interest is earned. By the time when oil revenues dry up completely (in 2030), future generations will inherit a fund with a total value of CFAF 1,358.7 billion, almost 9 percent more than the CFAF 1,248.6 billion that accumulates under the 1.7 percent remuneration scenario.
29. Further evidence of the impact of using different remuneration rates is found when the present discounted values of total consumption are compared. For the third scenario, this value is calculated at CFAF 4,458.1 billion, which is equal to the sum of the outstanding value of the fund at end-2004 and the present discounted value of all future oil revenues. However, in the low-remuneration scenario, the present discounted value of total consumption is only CFAF 3,766.4 billion. That is, while redistributing consumption from present generations to future generations, the low-remuneration scenario achieves this at the cost of leaving all generations worse off by a combined amount of CFAF 691.7 billion. This is entirely due the fact that the interest rate on the outstanding balances is less than the discount rate, which reduces the value of all savings.6
30. Although both scenarios in which oil revenues are saved into the FGF increase consumption for future generations, neither achieves perfect intergenerational equity. To achieve such equity would require that only the permanent income from oil wealth is made available for annual consumption spending. With a capitalization value of oil wealth equal to CFAF 4,401.3 billion, total annual permanent income would be equal to CFAF 99.8 billion. However, with population growth this annuity amount would still imply declining per capita consumption spending. For that reason the per capita annuity APC is also calculated, which is
6 One way to understand this loss is as follows. Suppose that one could auction off all future oil revenues (plus the initial balance in the FGF) for one payment. An investor, using a discount rate of 3.29 percent, would offer CFAF 4,458.1 billion. However, if the contract required that investor to invest part of those future revenues in interest-bearing assets that yield only 1.7 percent, then she would offer only CFAF 3,766.4 billion. The difference is a net loss to the country.
- 14 -
the permanent income from a constant per capita wealth for each current and future individual. This amount is calculated as follows:
APC = (W2005/P2005)*(r - g)/(1 + r)
31. In the expression, W2005 is the present discounted value of all oil wealth, P2005 is the population in 2005, r is the discount rate, and finally g is the growth rate of population. Applying the assumptions gives a per capita annuity of CFAF 8,850. It is clear that both the total annual annuity and the per capita annuity are much lower than short-term and medium-term consumption spending of each of the three scenarios reported in Table 2. For example, compared to the no-savings scenario, for 2005 the constant annuity would imply that CFAF 631.9 billion of oil revenues should be saved; the per capita annuity would require a reduction in per capita consumption of CFAF 553,950. For the per capita annuity, the low amount is due mainly because the real discount rate and the population growth rate are close (2.27 percent and 2.0 percent, respectively), which requires that most of the oil revenues must be saved in order to preserve sufficient per capita wealth for all future generations.7
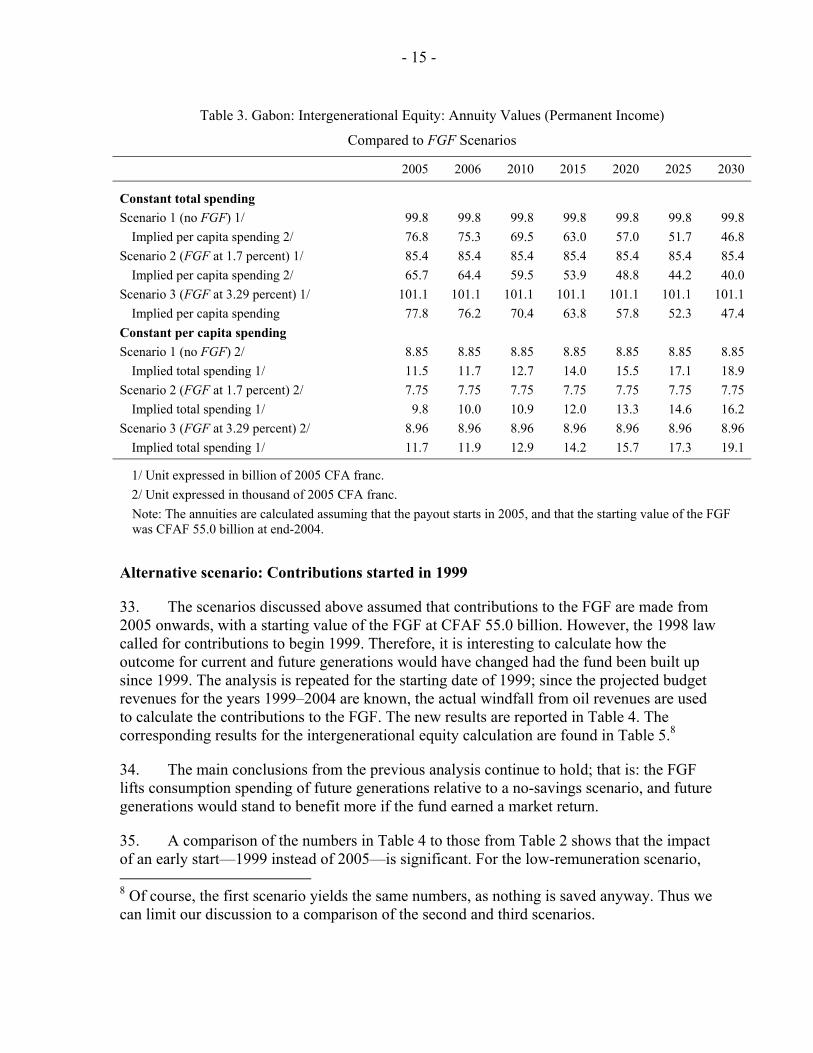
32. The results from the intergenerational equity calculations for each of the three scenarios are reported in Table 3. The most striking observation is that the annuities from the second scenario are smaller than those from both the benchmark scenario and the high-remuneration scenario. For the total annual annuity, this amount is CFAF 85.4 billion versus CFAF 99.8 billion and CFAF 101.1 billion, respectively. Again, the low remuneration of the FGF leaves a smaller permanent income available for all generations, confirming the earlier findings.
7 Indeed, the per capita annuity is very sensitive to changes in the population growth rate. The per capita annuity will lie between one of two extremes. First, if g = r then no interest may be paid out, and second, if g = 0 then each period all permanent income is made available.
- 15 -
Alternative scenario: Contributions started in 1999
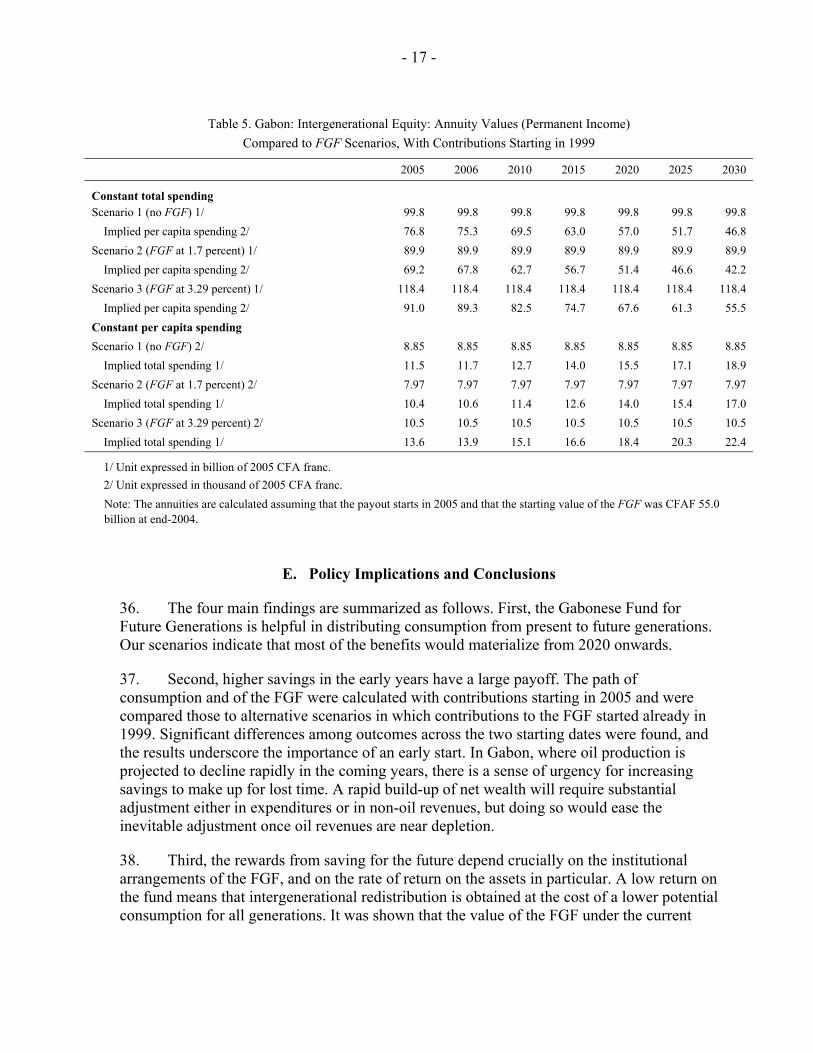
33. The scenarios discussed above assumed that contributions to the FGF are made from 2005 onwards, with a starting value of the FGF at CFAF 55.0 billion. However, the 1998 law called for contributions to begin 1999. Therefore, it is interesting to calculate how the outcome for current and future generations would have changed had the fund been built up since 1999. The analysis is repeated for the starting date of 1999; since the projected budget revenues for the years 1999–2004 are known, the actual windfall from oil revenues are used to calculate the contributions to the FGF. The new results are reported in Table 4. The corresponding results for the intergenerational equity calculation are found in Table 5.8
34. The main conclusions from the previous analysis continue to hold; that is: the FGF lifts consumption spending of future generations relative to a no-savings scenario, and future generations would stand to benefit more if the fund earned a market return.
35. A comparison of the numbers in Table 4 to those from Table 2 shows that the impact of an early start—1999 instead of 2005—is significant. For the low-remuneration scenario, 8 Of course, the first scenario yields the same numbers, as nothing is saved anyway. Thus we can limit our discussion to a comparison of the second and third scenarios.
Table 3. Gabon: Intergenerational Equity: Annuity Values (Permanent Income)
Compared to FGF Scenarios
2005 2006 2010 2015 2020 2025 2030
Constant total spending Scenario 1 (no FGF) 1/ 99.8 99.8 99.8 99.8 99.8 99.8 99.8
Implied per capita spending 2/ 76.8 75.3 69.5 63.0 57.0 51.7 46.8 Scenario 2 (FGF at 1.7 percent) 1/ 85.4 85.4 85.4 85.4 85.4 85.4 85.4
Implied per capita spending 2/ 65.7 64.4 59.5 53.9 48.8 44.2 40.0 Scenario 3 (FGF at 3.29 percent) 1/ 101.1 101.1 101.1 101.1 101.1 101.1 101.1
Implied per capita spending 77.8 76.2 70.4 63.8 57.8 52.3 47.4 Constant per capita spending Scenario 1 (no FGF) 2/ 8.85 8.85 8.85 8.85 8.85 8.85 8.85
Implied total spending 1/ 11.5 11.7 12.7 14.0 15.5 17.1 18.9 Scenario 2 (FGF at 1.7 percent) 2/ 7.75 7.75 7.75 7.75 7.75 7.75 7.75
Implied total spending 1/ 9.8 10.0 10.9 12.0 13.3 14.6 16.2 Scenario 3 (FGF at 3.29 percent) 2/ 8.96 8.96 8.96 8.96 8.96 8.96 8.96
Implied total spending 1/ 11.7 11.9 12.9 14.2 15.7 17.3 19.1
1/ Unit expressed in billion of 2005 CFA franc. 2/ Unit expressed in thousand of 2005 CFA franc.
Note: The annuities are calculated assuming that the payout starts in 2005, and that the starting value of the FGF was CFAF 55.0 billion at end-2004.
- 16 -
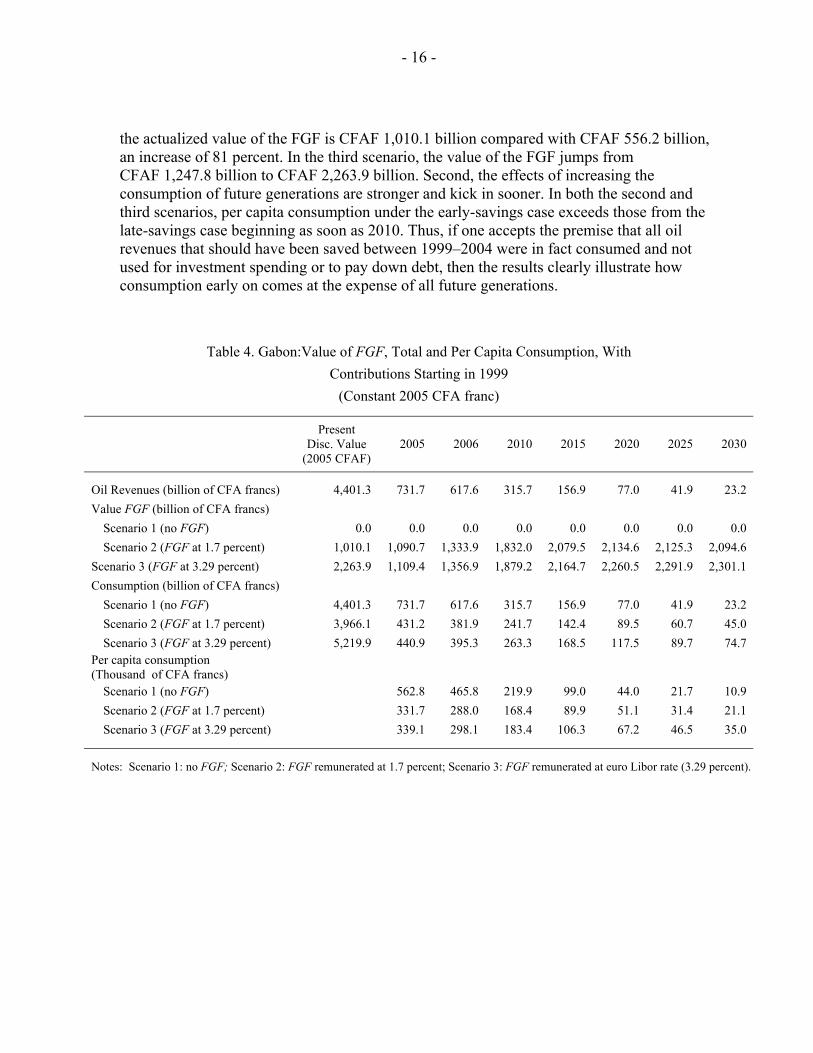
the actualized value of the FGF is CFAF 1,010.1 billion compared with CFAF 556.2 billion, an increase of 81 percent. In the third scenario, the value of the FGF jumps from CFAF 1,247.8 billion to CFAF 2,263.9 billion. Second, the effects of increasing the consumption of future generations are stronger and kick in sooner. In both the second and third scenarios, per capita consumption under the early-savings case exceeds those from the late-savings case beginning as soon as 2010. Thus, if one accepts the premise that all oil revenues that should have been saved between 1999–2004 were in fact consumed and not used for investment spending or to pay down debt, then the results clearly illustrate how consumption early on comes at the expense of all future generations.
Table 4. Gabon:Value of FGF, Total and Per Capita Consumption, With Contributions Starting in 1999
(Constant 2005 CFA franc)
Present
Disc. Value (2005 CFAF)
2005 2006 2010 2015 2020 2025 2030
Oil Revenues (billion of CFA francs) 4,401.3 731.7 617.6 315.7 156.9 77.0 41.9 23.2 Value FGF (billion of CFA francs)
Scenario 1 (no FGF) 0.0 0.0 0.0 0.0 0.0 0.0 0.0 0.0 Scenario 2 (FGF at 1.7 percent) 1,010.1 1,090.7 1,333.9 1,832.0 2,079.5 2,134.6 2,125.3 2,094.6
Scenario 3 (FGF at 3.29 percent) 2,263.9 1,109.4 1,356.9 1,879.2 2,164.7 2,260.5 2,291.9 2,301.1 Consumption (billion of CFA francs)
Scenario 1 (no FGF) 4,401.3 731.7 617.6 315.7 156.9 77.0 41.9 23.2 Scenario 2 (FGF at 1.7 percent) 3,966.1 431.2 381.9 241.7 142.4 89.5 60.7 45.0 Scenario 3 (FGF at 3.29 percent) 5,219.9 440.9 395.3 263.3 168.5 117.5 89.7 74.7
Per capita consumption (Thousand of CFA francs)
Scenario 1 (no FGF) 562.8 465.8 219.9 99.0 44.0 21.7 10.9 Scenario 2 (FGF at 1.7 percent) 331.7 288.0 168.4 89.9 51.1 31.4 21.1 Scenario 3 (FGF at 3.29 percent) 339.1 298.1 183.4 106.3 67.2 46.5 35.0
Notes: Scenario 1: no FGF; Scenario 2: FGF remunerated at 1.7 percent; Scenario 3: FGF remunerated at euro Libor rate (3.29 percent).
- 17 -
E. Policy Implications and Conclusions
36. The four main findings are summarized as follows. First, the Gabonese Fund for Future Generations is helpful in distributing consumption from present to future generations. Our scenarios indicate that most of the benefits would materialize from 2020 onwards.
37. Second, higher savings in the early years have a large payoff. The path of consumption and of the FGF were calculated with contributions starting in 2005 and were compared those to alternative scenarios in which contributions to the FGF started already in 1999. Significant differences among outcomes across the two starting dates were found, and the results underscore the importance of an early start. In Gabon, where oil production is projected to decline rapidly in the coming years, there is a sense of urgency for increasing savings to make up for lost time. A rapid build-up of net wealth will require substantial adjustment either in expenditures or in non-oil revenues, but doing so would ease the inevitable adjustment once oil revenues are near depletion.
38. Third, the rewards from saving for the future depend crucially on the institutional arrangements of the FGF, and on the rate of return on the assets in particular. A low return on the fund means that intergenerational redistribution is obtained at the cost of a lower potential consumption for all generations. It was shown that the value of the FGF under the current
Table 5. Gabon: Intergenerational Equity: Annuity Values (Permanent Income) Compared to FGF Scenarios, With Contributions Starting in 1999
2005 2006 2010 2015 2020 2025 2030
Constant total spending
Scenario 1 (no FGF) 1/ 99.8 99.8 99.8 99.8 99.8 99.8 99.8 Implied per capita spending 2/ 76.8 75.3 69.5 63.0 57.0 51.7 46.8
Scenario 2 (FGF at 1.7 percent) 1/ 89.9 89.9 89.9 89.9 89.9 89.9 89.9 Implied per capita spending 2/ 69.2 67.8 62.7 56.7 51.4 46.6 42.2
Scenario 3 (FGF at 3.29 percent) 1/ 118.4 118.4 118.4 118.4 118.4 118.4 118.4 Implied per capita spending 2/ 91.0 89.3 82.5 74.7 67.6 61.3 55.5
Constant per capita spending Scenario 1 (no FGF) 2/ 8.85 8.85 8.85 8.85 8.85 8.85 8.85
Implied total spending 1/ 11.5 11.7 12.7 14.0 15.5 17.1 18.9 Scenario 2 (FGF at 1.7 percent) 2/ 7.97 7.97 7.97 7.97 7.97 7.97 7.97
Implied total spending 1/ 10.4 10.6 11.4 12.6 14.0 15.4 17.0 Scenario 3 (FGF at 3.29 percent) 2/ 10.5 10.5 10.5 10.5 10.5 10.5 10.5
Implied total spending 1/ 13.6 13.9 15.1 16.6 18.4 20.3 22.4
1/ Unit expressed in billion of 2005 CFA franc. 2/ Unit expressed in thousand of 2005 CFA franc.
Note: The annuities are calculated assuming that the payout starts in 2005 and that the starting value of the FGF was CFAF 55.0 billion at end-2004.
- 18 -
regime, in which it earns only 1.7 percent per annum, would improve dramatically if it earned a return that is closer to the one prevailing in international financial markets.
39. Fourth, the current institutional arrangement does not achieve intergenerational equity. To achieve such equity would require a substantial increase in savings in the short term, of a magnitude that may not be feasible in practice.
40. In the scenarios, the choice of helping future generations by paying down debt, instead of saving in a FGF, was not explicitly discussed. After all, either of the two choices would build up net financial wealth for future generations. It would be easy to include this part of the intertemporal dimension in our scenarios. For example, if it is assumed that most of the debt is contracted at the short-term interest rate, then the savings decision from the third scenario is equivalent to paying down debt. In fact, the average interest rate on the stock of external debt is 6.07 percent in 2005, clearly underscoring the relative attraction of using oil revenues primarily to pay down debt, at least in the short term. A moral case can be made that the present generation—to the extent that it contracted the debt and invested it poorly—should be primarily responsible for servicing it, i.e. that a larger non-oil primary surplus should be generated. But if this is not feasible, future generations would still be better off if oil revenues were used to reduce debt levels rather than accumulate deposits in the FGF.
- 19 -
References
Davis, Jeffrey, Rolando Ossowski, James Daniel, and Steven Barnett, 2001, “Stabilization and Savings Funds for Nonrenewable Resources. Experience and Policy Implications,” IMF Occasional Paper No 205 (Washington: International Monetary Fund), 41 p.
Engel, Eduardo and Rodrigo Valdés, 2000, “Optimal Fiscal Strategies for Oil Exporting Countries,” IMF Working Paper 00/118 (Washington: International Monetary Fund), 70 p.
Fasano, Ugo, 2000, “Review of the Experience with Oil Stabilization and Savings Funds in Selected Countries,” IMF Working Paper 00/112 (Washington: International Monetary Fund), 21 p.
Katz, Menachem, Ulrich Bartsch, Harinder Malothra, and Milan Cuc, 2004, “Lifting the Oil Curse. Improving Revenue Management in Sub-Saharan Africa,” IMF, 65 p.
Rawls, John, 1971, A theory of Justice, Harvard University Press, 538 p.
Takizawa, Hajime, Edward Gardner, and Kenichi Ueda, 2004, “Are Developing Countries Better off Spending their Oil Wealth Upfront?” IMF Working Paper 04/141 (Washington: International Monetary Fund), 29 p.
- 20 -
III. COMPETITIVENESS AND GROWTH9
The Gabonese authorities have resolved to resume their adjustment efforts after considerable slippages...[]. Their strategy remains that of limiting the economy’s dependence on oil, strengthening the dynamism of the private sector and the growth of the economy, and making fiscal and balance of payments positions viable (Gabon—Staff Report for the 1991 Article IV Consultation and Request for Stand-By Arrangement).
A. Introduction
1. Gabon’s major challenges have remained unchanged during the past 15 years: a drop in oil production that, sooner or later will materialize; a lack of economic diversification and poor growth in the non-oil sectors. To fully mobilize the country’s growth potential and attract new investment, it is necessary to understand and highlight the key obstacles to growth in the non-oil sectors. Is Gabon competitive enough to lay the groundwork for sustained non-oil growth and economic diversification? Has the pegged CFA franc had a negative impact on the competitiveness and profitability of tradable goods, in particular those in which Gabon has strong potential (for example, timber, manganese, palm oil, and rubber)? Are the relatively high wages and large number of public sector jobs hurting private sector development? Have oil sector developments affected the pattern and composition of growth of non-oil GDP? Has this growth been biased toward nontradable sectors?
B. Some Competitiveness Issues
Has the recent appreciation of the CFA francs in itself, affected Gabon’s competitiveness?
2. Gabon has what is still untapped potential for large productive expansion in many areas. In addition to the traditional primary non-oil sectors—that is, timber and manganese—it has the potential to develop, for example, rubber, palm oil, fisheries, coffee, and cocoa production. The profitability of these commodities is closely linked to changes in their prices measured in CFA francs, in international markets.
3. Gabon’s participation in the CEMAC area means that its currency, the CFA franc, is pegged to the euro. An appreciation of the euro vis-à-vis the U.S. dollar implies a commensurate appreciation of the CFA franc and, therefore, a decrease in the CFA franc prices of international commodities. The potential effect of this development on the profitability of tradable goods is evident.
4. Table 1 below, shows the evolution of the prices of Gabon’s main non-oil export staples (that is, okoumé and other Gabonese timber species, plywood, and manganese).
9 Prepared by Gabriel Di Bella.
- 21 -
2001
2002
2003
2004
2005
2006
2007
2008
2009
2010
Com
mod
ity p
rices
Oko
ume
(U.S
. dol
lars
per
m3)
1/
119.
7613
8.13
166.
8818
5.15
192.
2820
1.66
208.
2221
5.73
222.
2922
9.80
Plyw
ood
of G
abon
ese
timbe
r (av
erag
e U
.S. d
olla
rs p
er m
3) 1
/12
4.52
119.
2216
3.06
170.
1017
6.65
185.
2719
1.30
198.
1920
4.23
211.
12O
ther
Gab
ones
e tim
ber
(ave
rage
U.S
. dol
lars
per
m3)
1/
124.
5213
5.49
182.
7020
3.63
211.
4722
1.78
229.
0023
7.26
244.
4825
2.73
Man
gane
se (U
.S. d
olla
rs p
er to
n) 2
/65
.20
70.8
092
.70
116.
4019
9.63
168.
9213
8.21
122.
8510
7.49
107.
49
Palm
oil
(U.S
. dol
lars
per
ton)
3/
238.
4035
6.74
410.
3743
4.72
450.
0044
4.00
438.
0043
2.00
426.
0042
0.00
Rubb
er (U
.S. d
olla
rs p
er to
n) 3
/26
.09
34.7
049
.12
59.1
756
.00
54.0
046
.00
42.0
040
.00
40.0
0
Fish
mea
l (U
.S. d
olla
rs p
er to
n) 3
/53
0.05
645.
5665
0.20
692.
9068
5.00
690.
0070
0.00
705.
0071
0.00
715.
00C
offe
e, ro
bust
a (U
.S. d
olla
rs p
er to
n) 3
/27
.32
30.8
238
.38
37.2
840
.50
41.5
043
.00
44.0
046
.00
48.0
0
Exch
ange
rate
(U.S
. dol
lars
per
eur
o) 3
/0.
900.
941.
131.
241.
311.
311.
311.
311.
321.
32
Com
mod
ity p
rices
(Ind
ices
200
1=10
0, u
nles
s oth
erw
ise
indi
cate
d)O
koum
e (U
.S. d
olla
rs p
er m
3)
100.
0011
5.34
139.
3415
4.60
160.
5516
8.38
173.
8618
0.13
185.
6119
1.88
Plyw
ood
of G
abon
ese
timbe
r (av
erag
e U
.S. d
olla
rs p
er m
3) 1
/10
0.00
95.7
413
0.95
136.
6014
1.86
148.
7815
3.63
159.
1616
4.01
169.
54O
ther
Gab
ones
e tim
ber
(ave
rage
U.S
. dol
lars
per
m3)
100.
0010
8.81
146.
7216
3.53
169.
8217
8.11
183.
9119
0.53
196.
3320
2.96
Man
gane
se (U
.S. d
olla
rs p
er to
n)10
0.00
108.
5914
2.18
178.
5330
6.18
259.
0821
1.97
188.
4216
4.87
164.
87
Palm
oil
(U.S
. dol
lars
per
ton)
100.
0014
9.64
172.
1418
2.35
188.
7618
6.24
183.
7318
1.21
178.
6917
6.18
Rubb
er (U
.S. d
olla
rs p
er to
n)10
0.00
133.
0318
8.31
226.
8321
4.67
207.
0117
6.34
161.
0115
3.34
153.
34
Fish
mea
l (U
.S. d
olla
rs p
er to
n)10
0.00
121.
7912
2.67
130.
7212
9.23
130.
1813
2.06
133.
0113
3.95
134.
89C
offe
e, ro
bust
a (U
.S. d
olla
rs p
er to
n)10
0.00
112.
8114
0.49
136.
4514
8.24
151.
9015
7.39
161.
0516
8.37
175.
69
Fish
mea
l (U
.S. d
olla
rs p
er to
n; in
dex
2005
=100
)10
0.00
100.
7310
2.19
102.
9210
3.65
104.
38C
offe
e, ro
bust
a (U
.S. d
olla
rs p
er to
n; in
dex
2005
=100
)10
0.00
102.
4710
6.17
108.
6411
3.58
118.
52
U.S
. dol
lar/e
uro
exch
ange
rate
(Ind
ex 2
001=
100)
100.
0010
5.45
126.
2613
8.82
146.
7214
6.64
146.
7314
6.81
146.
9414
7.10
Com
mod
ity p
rices
(Ind
ices
200
1=10
0, u
nles
s oth
erw
ise
indi
cate
d)O
koum
e (e
uros
per
m3)
10
0.00
109.
3811
0.36
111.
3710
9.43
114.
8311
8.49
122.
6912
6.32
130.
44Pl
ywoo
d of
Gab
ones
e tim
ber (
euro
s per
m3)
1/
100.
0090
.79
103.
7198
.40
96.6
910
1.46
104.
7010
8.41
111.
6111
5.26
Oth
er G
abon
ese
timbe
r (e
uros
per
m3)
100.
0010
3.19
116.
2011
7.80
115.
7512
1.46
125.
3312
9.78
133.
6113
7.98
Man
gane
se (e
uros
per
ton)
100.
0010
2.98
112.
6112
8.60
208.
6817
6.67
144.
4612
8.34
112.
2011
2.08
Palm
oil
(eur
os p
er to
n)10
0.00
141.
9113
6.33
131.
3612
8.65
127.
0112
5.21
123.
4312
1.61
119.
77Ru
bber
(eur
os p
er to
n)10
0.00
126.
1614
9.15
163.
4014
6.31
141.
1712
0.18
109.
6710
4.35
104.
24
Fish
mea
l (eu
ros p
er to
n)10
0.00
115.
5097
.15
94.1
788
.08
88.7
790
.00
90.6
091
.16
91.7
0C
offe
e, ro
bust
a (e
uros
per
ton)
100.
0010
6.98
111.
2798
.29
101.
0410
3.59
107.
2710
9.70
114.
5911
9.44
Fish
mea
l (eu
ros p
er to
n; in
dex
2005
=100
)10
0.00
100.
7810
2.18
102.
8510
3.49
104.
11C
offe
e, ro
bust
a (e
uros
per
ton;
inde
x 20
05=1
00)
100.
0010
2.52
106.
1710
8.57
113.
4111
8.22
Sour
ces:
Gab
ones
e au
thor
ities
; and
Fun
d st
aff e
stim
ates
.
1/ A
ctua
l dat
a fo
r 200
1–04
. For
ecas
ts fo
r 200
5–10
are
con
stru
cted
by
assu
min
g an
nual
per
cent
age
chan
ges
equa
l to
thos
e fo
reca
st fo
r har
dwoo
d lo
gs in
the
late
st W
orld
Eco
nom
ic
Out
look
(WEO
) exe
rcis
e.2/
Act
ual d
ata
for 2
001–
04. S
ince
man
gane
se o
re e
mul
ates
iron
ore
in te
rms o
f pric
e in
crea
ses,
fore
cast
s for
200
5–10
are
con
stru
cted
on
the
assu
mpt
ion
that
ann
ual p
erce
ntag
e ch
ange
s a
re e
qual
to th
ose
fore
cast
for i
ron
ore
in th
e la
test
WEO
exe
rcis
e.3/
Act
ual d
ata
for 2
001–
04. F
orec
asts
for 2
005–
10 c
orre
spon
d to
thos
e as
sum
ed in
the
late
st W
EO e
xerc
ise.
Tabl
e 1.
Gab
on: D
evel
opm
ents
in K
ey C
omm
odity
Pric
es a
nd E
xcha
nge
Rat
e fo
r the
Eur
o, 2
001–
10
- 22 -
It also shows the prices of commodities that meet at least one of the following criteria: (i) they are currently produced in nonnegligible quantities (that is, rubber, palm oil); (ii) in the past, they were produced in nonnegligible quantities (that is, coffee, cocoa); or (iii) they belong to a sector that is being restructured or targeted for development in the context of an agreement with an IFI (that is, fisheries).10
5. As shown in Table 1, the U.S. dollar prices of these commodities have increased since 2001, in some cases significantly. These increases reflect both the robust growth of the world economy and the recent weakening of the U.S. dollar. Particularly important for Gabon are the increases in the price of manganese (almost 80 percent during 2001–04), okoumé (close to 55 percent), and Gabonese timber species other than okoumé (more than 60 percent).11
• Although the euro has appreciated by close to 40 percent, the euro prices of the commodities that constitute the largest share of Gabon’s non-oil exports have also increased. Only the price of plywood has remained approximately constant in euro terms during the period.
• The prices of palm oil and rubber have also increased in euro terms (more than 30 and 60 percent, respectively). Although, at this point, Gabon does not export significant quantities of these products, the favorable prices and structural reform in this area, including through the privatization of two state-owned companies during 2004 (Agrogabon and Hevegab), have attracted foreign investors.
• Although the U.S. dollar prices of the commodities for which Gabon still has untapped potential (that is, coffee, fisheries), have increased, these increases are not high enough to offset the euro appreciation. Therefore, the prices decrease (only slightly) in euro terms.
6. Looking forward (that is for the period 2005–10), the euro price of timber (both raw and processed) is expected to increase moderately. The price of manganese, in turn, is expected to increase strongly in euro terms during 2005 and then decrease over the medium term to levels similar to those that prevailed at the beginning of the decade. Similar trajectories are forecast for palm oil and rubber. As for coffee and fisheries, a recovery in euro terms is forecast for the former while further decreases are expected for the latter. However, if 2005 is chosen as the base year, the price of fisheries is also expected to increase in euro terms.
10 The World Bank’s letter of development policy includes, in addition to forestry, fisheries, and tourism.
11 More than 80 percent of Gabon non-oil exports in 2004 were comprised by manganese and timber (either raw or processed).
- 23 -
7. Therefore, from the revenue side, Gabon’s current non-oil export staples are likely to remain profitable for the remaining of the decade. This conclusion is also valid for those staples that are produced but not currently exported (that is, palm oil and rubber); finally, with 2005 as the base year, it is also valid for those products that are not currently produced in significant quantities (that is, coffee and, in particular, fisheries).12
***
Gabon’s currency, the CFA franc, is pegged to the French franc at the fixed rate of CFAF 50 per F 1. In the 12-month period since the last Article IV consultation, the real effective exchange rate as measured by relative consumer prices, continued to decline, depreciating by a further 10 percent [...]. It should be noted, however, that the weighting pattern (based on a family expenditure survey undertaken in 1968–69) in Gabon’s consumer price index is outdated, and the staff has recommended that this weakness be corrected. Moreover, other indicators, including a very high wage structure, point to a continuing lack of competitiveness in many non-oil activities in Gabon (Gabon—Staff Report for the 1992 Article IV Consultation).
Is the real effective exchange rate a meaningful measure of Gabon’s competitiveness?
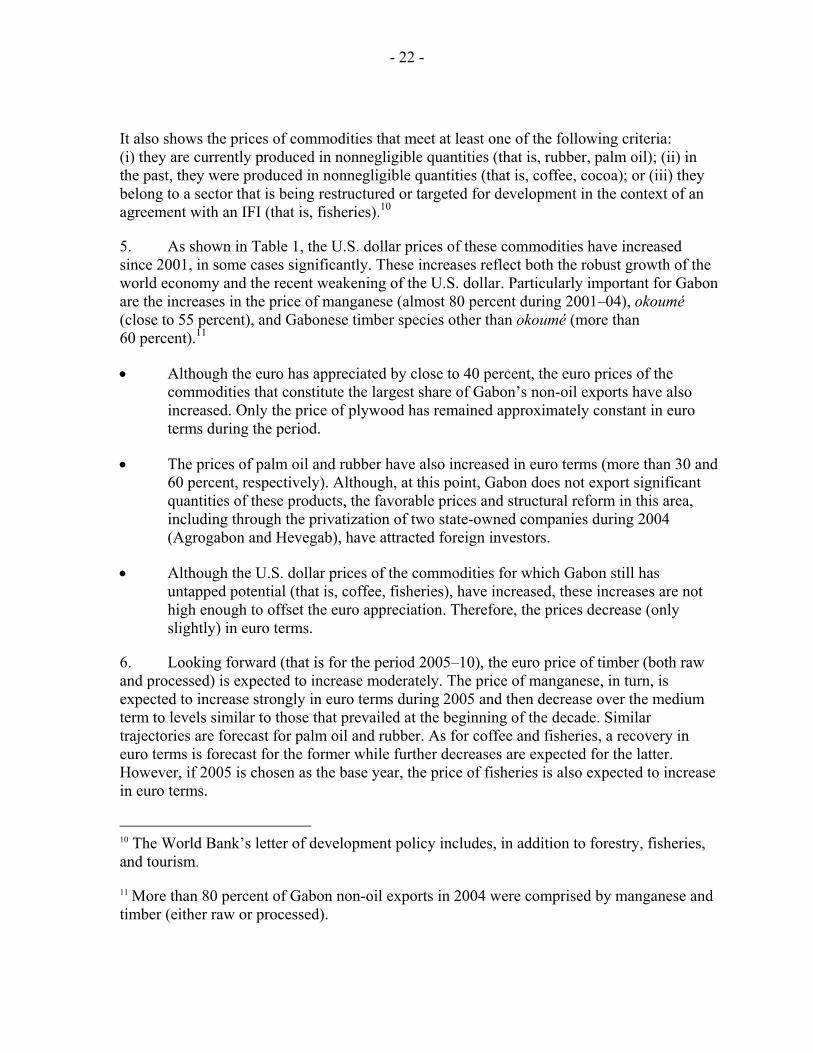
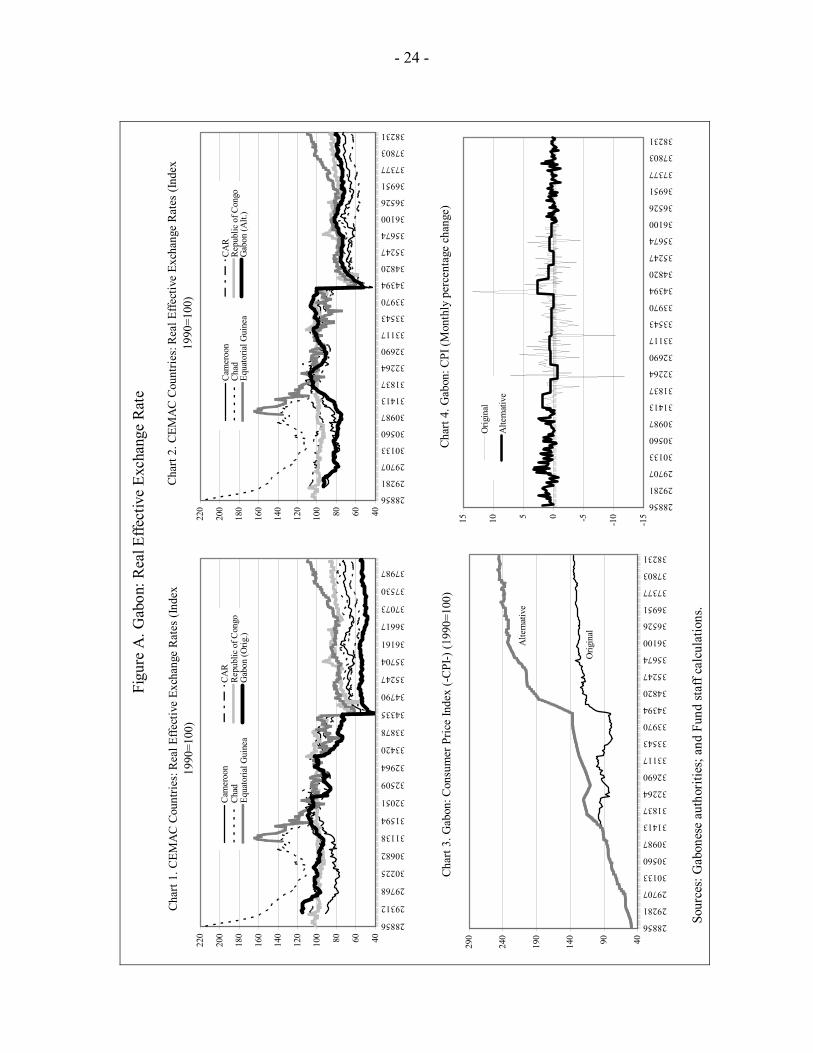
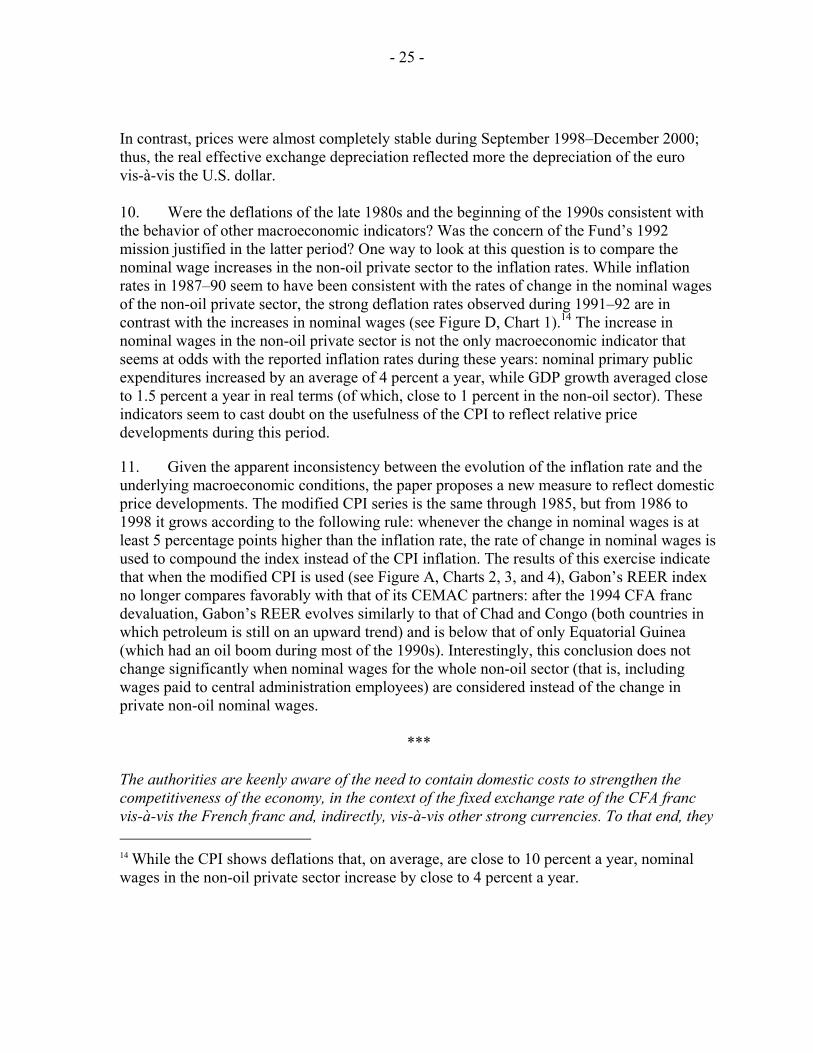
8. The CFA franc devaluation of 1994 seems to have been more effective in Gabon than in other CEMAC country members (Figure A, Chart 1). In addition, the real effective exchange rate depreciations of 15 percent during 1988, about 30 percent from December 1990 to December 1993 and 13 percent from September 1998 to December 2000, compounded the effect of the 1994 devaluation.13 Did those changes reflect underlying macroeconomic conditions? Did they reflect effective gains in competitiveness? The answers to these questions are essential to determine how meaningful the real effective exchange rate (REER) is as a measure of Gabon’s competitiveness.
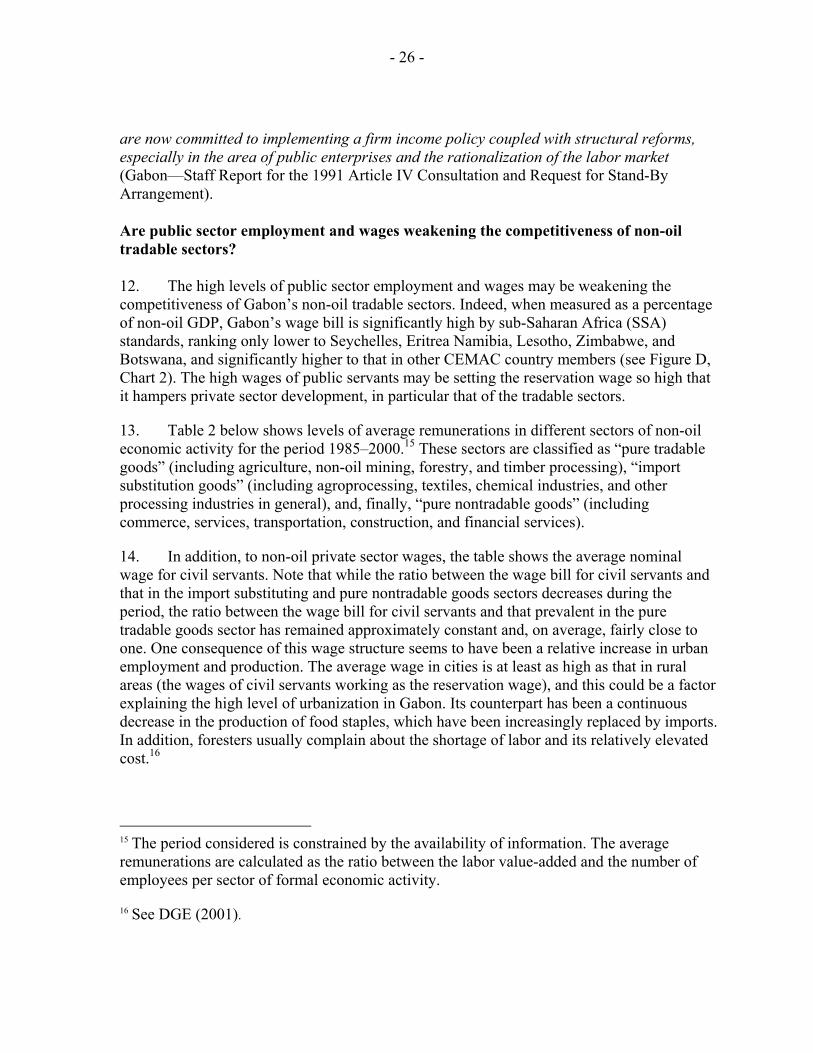
9. Gabon’s REER is calculated using the inflation rate as measured by the consumer price index (CPI) (See Figure A, Charts 3, and 4). Clearly, strong price deflations of about 10 percent and 20 percent explain the real exchange rate depreciation of 1988 and December 1990–December 1993, respectively.
12 It can be argued that the profitability of these sectors would have increased even more if the CFA franc had not appreciated vis-à-vis the U.S. dollar. However, this does not seem to be an obvious conclusion. The appreciation of the CFA franc has contributed to the stability of domestic prices and costs, including of wages, and facilitated the current social truce, thereby making Gabon more attractive to foreign investors.
13 The CFA franc was devalued from 50 French francs (FF) per CFA franc to FF 100 per CFA franc in January 1994.
- 24 -
Figu
re A
. Gab
on: R
eal E
ffect
ive
Exch
ange
Rat
e
S
ourc
es: G
abon
ese
auth
oriti
es; a
nd F
und
staf
f cal
cula
tions
.
Cha
rt 1.
CEM
AC
Cou
ntrie
s: R
eal E
ffect
ive
Exch
ange
Rat
es (I
ndex
19
90=1
00)
406080100
120
140
160
180
200
220
28856
29312
29768
30225
30682
31138
31594
32051
32509
32964
33420
33878
34335
34790
35247
35704
36161
36617
37073
37530
37987
Cam
eroo
nC
AR
Cha
dR
epub
lic o
f Con
goEq
uato
rial G
uine
aG
abon
(Orig
.)
Cha
rt 2.
CEM
AC
Cou
ntrie
s: R
eal E
ffect
ive
Exch
ange
Rat
es (I
ndex
19
90=1
00)
406080100
120
140
160
180
200
220
28856
29281
29707
30133
30560
30987
31413
31837
32264
32690
33117
33543
33970
34394
34820
35247
35674
36100
36526
36951
37377
37803
38231
Cam
eroo
nCA
RCh
adRe
publ
ic o
f Con
goEq
uato
rial G
uine
aG
abon
(Alt.
)
Cha
rt 3.
Gab
on: C
onsu
mer
Pric
e In
dex
(-CPI
-) (1
990=
100)
4090140
190
240
290
28856
29281
29707
30133
30560
30987
31413
31837
32264
32690
33117
33543
33970
34394
34820
35247
35674
36100
36526
36951
37377
37803
38231
Orig
inal
Alte
rnat
ive
Cha
rt 4.
Gab
on: C
PI (M
onth
ly p
erce
ntag
e ch
ange
)
-15
-10-5051015
28856
29281
29707
30133
30560
30987
31413
31837
32264
32690
33117
33543
33970
34394
34820
35247
35674
36100
36526
36951
37377
37803
38231
Orig
inal
Alte
rnat
ive
- 25 -
In contrast, prices were almost completely stable during September 1998–December 2000; thus, the real effective exchange depreciation reflected more the depreciation of the euro vis-à-vis the U.S. dollar.
10. Were the deflations of the late 1980s and the beginning of the 1990s consistent with the behavior of other macroeconomic indicators? Was the concern of the Fund’s 1992 mission justified in the latter period? One way to look at this question is to compare the nominal wage increases in the non-oil private sector to the inflation rates. While inflation rates in 1987–90 seem to have been consistent with the rates of change in the nominal wages of the non-oil private sector, the strong deflation rates observed during 1991–92 are in contrast with the increases in nominal wages (see Figure D, Chart 1).14 The increase in nominal wages in the non-oil private sector is not the only macroeconomic indicator that seems at odds with the reported inflation rates during these years: nominal primary public expenditures increased by an average of 4 percent a year, while GDP growth averaged close to 1.5 percent a year in real terms (of which, close to 1 percent in the non-oil sector). These indicators seem to cast doubt on the usefulness of the CPI to reflect relative price developments during this period.
11. Given the apparent inconsistency between the evolution of the inflation rate and the underlying macroeconomic conditions, the paper proposes a new measure to reflect domestic price developments. The modified CPI series is the same through 1985, but from 1986 to 1998 it grows according to the following rule: whenever the change in nominal wages is at least 5 percentage points higher than the inflation rate, the rate of change in nominal wages is used to compound the index instead of the CPI inflation. The results of this exercise indicate that when the modified CPI is used (see Figure A, Charts 2, 3, and 4), Gabon’s REER index no longer compares favorably with that of its CEMAC partners: after the 1994 CFA franc devaluation, Gabon’s REER evolves similarly to that of Chad and Congo (both countries in which petroleum is still on an upward trend) and is below that of only Equatorial Guinea (which had an oil boom during most of the 1990s). Interestingly, this conclusion does not change significantly when nominal wages for the whole non-oil sector (that is, including wages paid to central administration employees) are considered instead of the change in private non-oil nominal wages.
***
The authorities are keenly aware of the need to contain domestic costs to strengthen the competitiveness of the economy, in the context of the fixed exchange rate of the CFA franc vis-à-vis the French franc and, indirectly, vis-à-vis other strong currencies. To that end, they 14 While the CPI shows deflations that, on average, are close to 10 percent a year, nominal wages in the non-oil private sector increase by close to 4 percent a year.
- 26 -
are now committed to implementing a firm income policy coupled with structural reforms, especially in the area of public enterprises and the rationalization of the labor market (Gabon—Staff Report for the 1991 Article IV Consultation and Request for Stand-By Arrangement).
Are public sector employment and wages weakening the competitiveness of non-oil tradable sectors?
12. The high levels of public sector employment and wages may be weakening the competitiveness of Gabon’s non-oil tradable sectors. Indeed, when measured as a percentage of non-oil GDP, Gabon’s wage bill is significantly high by sub-Saharan Africa (SSA) standards, ranking only lower to Seychelles, Eritrea Namibia, Lesotho, Zimbabwe, and Botswana, and significantly higher to that in other CEMAC country members (see Figure D, Chart 2). The high wages of public servants may be setting the reservation wage so high that it hampers private sector development, in particular that of the tradable sectors.
13. Table 2 below shows levels of average remunerations in different sectors of non-oil economic activity for the period 1985–2000.15 These sectors are classified as “pure tradable goods” (including agriculture, non-oil mining, forestry, and timber processing), “import substitution goods” (including agroprocessing, textiles, chemical industries, and other processing industries in general), and, finally, “pure nontradable goods” (including commerce, services, transportation, construction, and financial services).
14. In addition, to non-oil private sector wages, the table shows the average nominal wage for civil servants. Note that while the ratio between the wage bill for civil servants and that in the import substituting and pure nontradable goods sectors decreases during the period, the ratio between the wage bill for civil servants and that prevalent in the pure tradable goods sector has remained approximately constant and, on average, fairly close to one. One consequence of this wage structure seems to have been a relative increase in urban employment and production. The average wage in cities is at least as high as that in rural areas (the wages of civil servants working as the reservation wage), and this could be a factor explaining the high level of urbanization in Gabon. Its counterpart has been a continuous decrease in the production of food staples, which have been increasingly replaced by imports. In addition, foresters usually complain about the shortage of labor and its relatively elevated cost.16
15 The period considered is constrained by the availability of information. The average remunerations are calculated as the ratio between the labor value-added and the number of employees per sector of formal economic activity.
16 See DGE (2001).
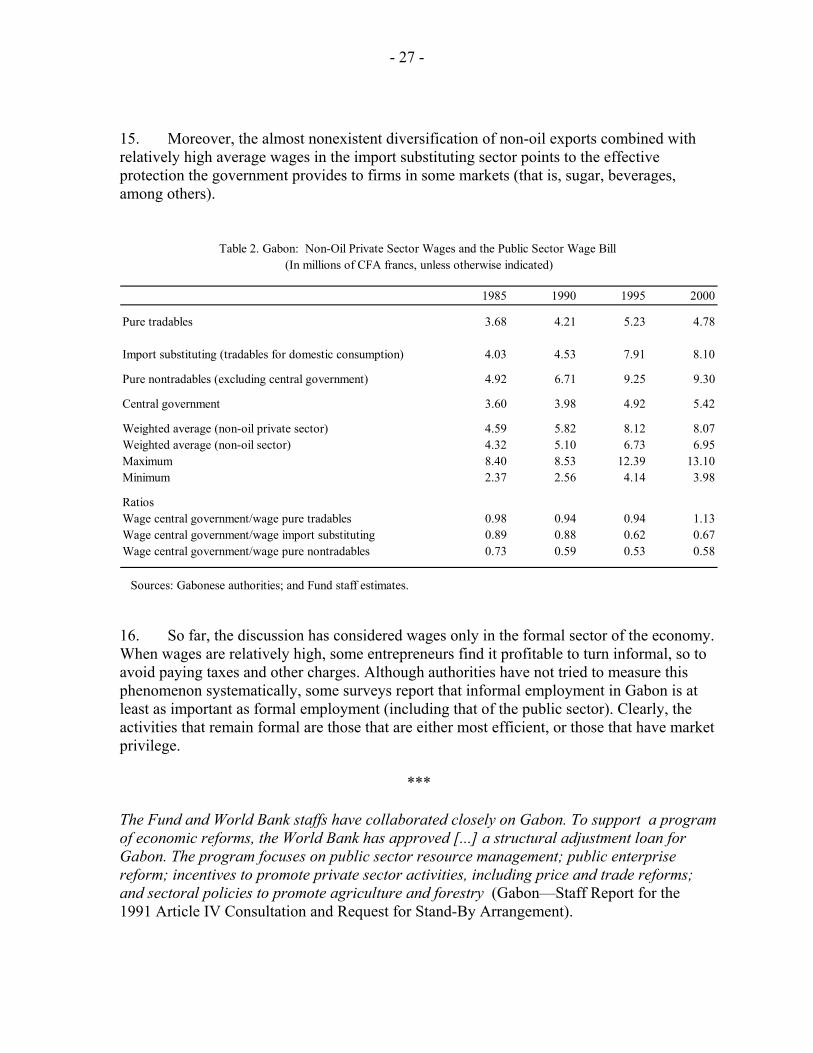
- 27 -
15. Moreover, the almost nonexistent diversification of non-oil exports combined with relatively high average wages in the import substituting sector points to the effective protection the government provides to firms in some markets (that is, sugar, beverages, among others).
1985 1990 1995 2000
Pure tradables 3.68 4.21 5.23 4.78
Import substituting (tradables for domestic consumption) 4.03 4.53 7.91 8.10
Pure nontradables (excluding central government) 4.92 6.71 9.25 9.30
Central government 3.60 3.98 4.92 5.42
Weighted average (non-oil private sector) 4.59 5.82 8.12 8.07Weighted average (non-oil sector) 4.32 5.10 6.73 6.95Maximum 8.40 8.53 12.39 13.10Minimum 2.37 2.56 4.14 3.98
RatiosWage central government/wage pure tradables 0.98 0.94 0.94 1.13Wage central government/wage import substituting 0.89 0.88 0.62 0.67Wage central government/wage pure nontradables 0.73 0.59 0.53 0.58
Sources: Gabonese authorities; and Fund staff estimates.
Table 2. Gabon: Non-Oil Private Sector Wages and the Public Sector Wage Bill (In millions of CFA francs, unless otherwise indicated)
16. So far, the discussion has considered wages only in the formal sector of the economy. When wages are relatively high, some entrepreneurs find it profitable to turn informal, so to avoid paying taxes and other charges. Although authorities have not tried to measure this phenomenon systematically, some surveys report that informal employment in Gabon is at least as important as formal employment (including that of the public sector). Clearly, the activities that remain formal are those that are either most efficient, or those that have market privilege.
***
The Fund and World Bank staffs have collaborated closely on Gabon. To support a program of economic reforms, the World Bank has approved [...] a structural adjustment loan for Gabon. The program focuses on public sector resource management; public enterprise reform; incentives to promote private sector activities, including price and trade reforms; and sectoral policies to promote agriculture and forestry (Gabon—Staff Report for the 1991 Article IV Consultation and Request for Stand-By Arrangement).
- 28 -
Other competitiveness issues
17. Up to this point, the objective of the presentation was to continue to motivate a discussion that has been ongoing for the last 15 years. However, the issues discussed are only a subset of those relevant, and not necessarily, the most relevant subset.
18. Many of these issues are discussed in a report recently issued by the Foreign Investment Advisory Service (FIAS) of the World Bank that assesses the investment climate in Gabon. It underscores the fact that investment, particularly foreign, is low and provides some explanations for these low levels. Among them, it points to (i) rigidities in the labor market and the shortage of qualified labor, (ii) high factor costs, including that of public services, (iii) the “unfair” competition created by the activities that take place in the informal economy, (iv) the relatively small size of the domestic market, (v) the difficult access to bank financing, (vi) the insecurity about the appropriate conduct of justice and the application of laws, and (vii) the heavy administrative procedures, which are somewhat opaque and discretionary.17
19. The report also makes some recommendations, some of them general, about how Gabon should tackle the problems it faces. On a number of issues, however, its recommendations are more specific, including on the most appropriate role and structure of a number of government agencies and on how to improve the investment climate for small and medium-sized enterprises and eliminate red tape. The report concludes that the government should seek to promote not only foreign investment, but also domestic investment, including by targeting the “formalization” of informal sector activities.
C. What Drives Gabon’s Non-Oil GDP Growth?
Institutions and growth
20. In a paper analyzing cross-country growth behavior, Tsangarides (2005) finds that what is good for growth around the world is, in principle, also good for growth in Africa. Moreover, he finds that, in addition to initial conditions, other economic factors are robustly linked with growth, namely, higher investment, lower inflation and government consumption, a better fiscal stance, an improved political environment, favorable terms of trade shocks, and fixed geographical factors. For Africa, he finds that political and
17 So far, this paper has analyzed some of the issues related with factors (i) to (iii). Interestingly, factors (vi) and (vii) will be briefly analyzed in the following section. Factors (iv) and (v) are, no doubt, interestingly enough to constitute the objective of future research.
- 29 -
institutional variables seem to be particularly important.18
21. In this regard, Kauffman, Kraay, and Mastruzzi (2003) present estimates of six dimensions of governance, namely voice and accountability, political stability, government effectiveness, regulatory quality, rule of law, and control of corruption.19 The first two governance indicators are intended to capture the process by which those in authority are selected and replaced (that is, the extent to which citizens of a country are able to participate in the selection of governments, the independence of the media, and the likelihood of disruptive changes in government, among others). The next two indicators measure the ability of the government to formulate and implement sound policies (that is, the quality of public service provision, the quality of the bureaucracy, the competence of civil servants, the incidence of market-unfriendly policies or that imposed by excessive regulation in such areas as foreign trade and business development). Finally, the last two indicators summarize the respect of citizens and the state for the institutions that govern their interactions (that is, the incidence of crime, the effectiveness and predictability of the judiciary, and the enforceability of contracts, among others).
22. Countries that rank consistently in the top 10 in the subregion for the indicators are those that present the highest levels of development and the highest per capita growth (that is, Mauritius, Botswana, South Africa, Seychelles, and Ghana). Interestingly, for 2002 Gabon ranks quite high in the subregion for regulatory quality (6) and rule of law (11). It ranks relatively high for political stability (14) and government effectiveness (15), and above
18 Tahari and others (2004), analyse sources of growth in sub-Saharan Africa using the standard neo-classical model, as described, for instance, in Barro and Sala-i-Martin (1995). In the particular case of Gabon, they find that for the period 1960–2002, out of an average annual rate of 2.7 percent, 1.9 percent was explained by capital accumulation, 1.1 percent by labor and -0.2 percent by total factor productivity (TFP). Among CEMAC countries, the outcome for Gabon’s TFP only compares favorably with that for the Republic of Congo. 19 The analysis covers 199 countries and territories for 1996–2002. The six ‘clusters’ are based on several hundred individual variables measuring perceptions of governance, drawn from 25 separate data sources constructed by 18 different organizations.
- 30 -
average for control of corruption (17) and voice and accountability (19).20 At the same time, growth performance in most of SSA during recent decades has been sobering (IMF, 2005). This could indicate that the average level for these indicators in SSA is still relatively low, and thus having relatively high/average rankings for these indicators in the subregion could be not enough to attract investment and foster growth.21
***
The authorities share the concern expressed [..] at the time of the last consultation about the lack of diversification in the Gabonese economy and its heavy reliance on the oil sector in the face of an uncertain medium-term outlook (Gabon—Staff Report for the 1991 Article IV Consultation and Request for Stand-By Arrangement).
Has growth in the oil sector driven non-oil GDP growth?
23. Given the relative high share of oil in the Gabonese economy, those who analyze Gabon expect that developments in the oil sector will have a significant effect on non-oil growth. But is there any support for this hypothesis? What are the links through which non-oil growth and growth are connected? Figure B covering the period 1970–2004, depicts a number of relationships between oil and non-oil GDP growth in real terms (Chart 1), between oil GDP growth and growth of petroleum revenues in real terms (Chart 2), between petroleum revenue growth and primary expenditure growth in real term (Chart 3), and between primary expenditure growth and non-oil GDP growth in real terms (Chart 4).
24. Some interesting issues emerge from the analysis of these relationships. First, the simultaneous impact of oil GDP growth on non-oil GDP growth is very weak. As a matter of fact, if the sample is reduced to the period 1980–2004, the association between both variables is negative and not statistically significant. Second, the simultaneous relationship between real oil GDP growth and the growth of fiscal oil revenues in real terms is positive (but not large) and also statistically weak.
25. In contrast, the relationship between the growth of primary expenditures and that of fiscal oil revenues in real terms is positive and more statistically robust. Likewise, the relationship between changes in primary expenditure in real terms and non-oil growth is positive and statistically significant.
20 The authors point out that the margins of error associated with these estimates are large relative to the units in which governance is measured. Thus, cross-country comparisons based on this type of data should be made with due caution.
21 According to Transparency International (2004), Gabon ranks relatively high in the subregion; however, it ranks 64 (for 145 positions) in the general sample. In SSA, among the highest ranked countries are, again, South Africa (44), Seychelles (48), and Mauritius (54).
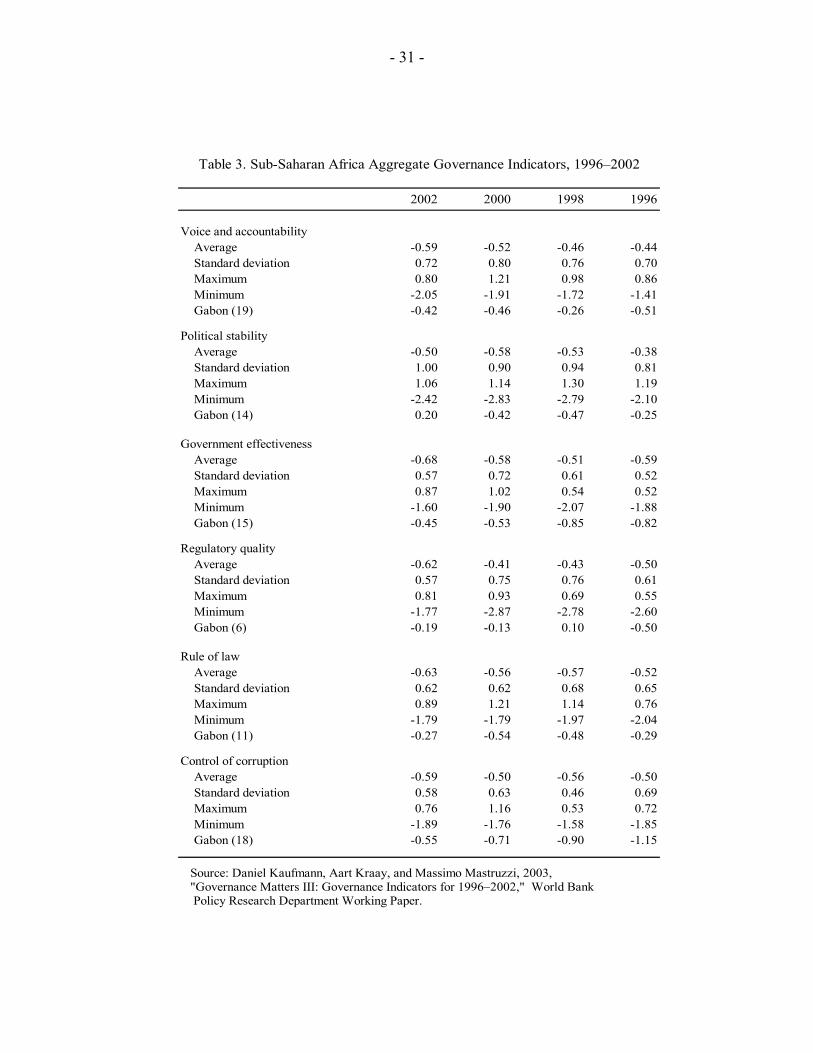
- 31 -
2002 2000 1998 1996
Average -0.59 -0.52 -0.46 -0.44Standard deviation 0.72 0.80 0.76 0.70Maximum 0.80 1.21 0.98 0.86Minimum -2.05 -1.91 -1.72 -1.41Gabon (19) -0.42 -0.46 -0.26 -0.51
Average -0.50 -0.58 -0.53 -0.38Standard deviation 1.00 0.90 0.94 0.81Maximum 1.06 1.14 1.30 1.19Minimum -2.42 -2.83 -2.79 -2.10Gabon (14) 0.20 -0.42 -0.47 -0.25
Average -0.68 -0.58 -0.51 -0.59Standard deviation 0.57 0.72 0.61 0.52Maximum 0.87 1.02 0.54 0.52Minimum -1.60 -1.90 -2.07 -1.88Gabon (15) -0.45 -0.53 -0.85 -0.82
Average -0.62 -0.41 -0.43 -0.50Standard deviation 0.57 0.75 0.76 0.61Maximum 0.81 0.93 0.69 0.55Minimum -1.77 -2.87 -2.78 -2.60Gabon (6) -0.19 -0.13 0.10 -0.50
Average -0.63 -0.56 -0.57 -0.52Standard deviation 0.62 0.62 0.68 0.65Maximum 0.89 1.21 1.14 0.76Minimum -1.79 -1.79 -1.97 -2.04Gabon (11) -0.27 -0.54 -0.48 -0.29
Average -0.59 -0.50 -0.56 -0.50Standard deviation 0.58 0.63 0.46 0.69Maximum 0.76 1.16 0.53 0.72Minimum -1.89 -1.76 -1.58 -1.85Gabon (18) -0.55 -0.71 -0.90 -1.15
Source: Daniel Kaufmann, Aart Kraay, and Massimo Mastruzzi, 2003, "Governance Matters III: Governance Indicators for 1996–2002," World Bank Policy Research Department Working Paper.
Control of corruption
Table 3. Sub-Saharan Africa Aggregate Governance Indicators, 1996–2002
Rule of law
Government effectiveness
Voice and accountability
Political stability
Regulatory quality
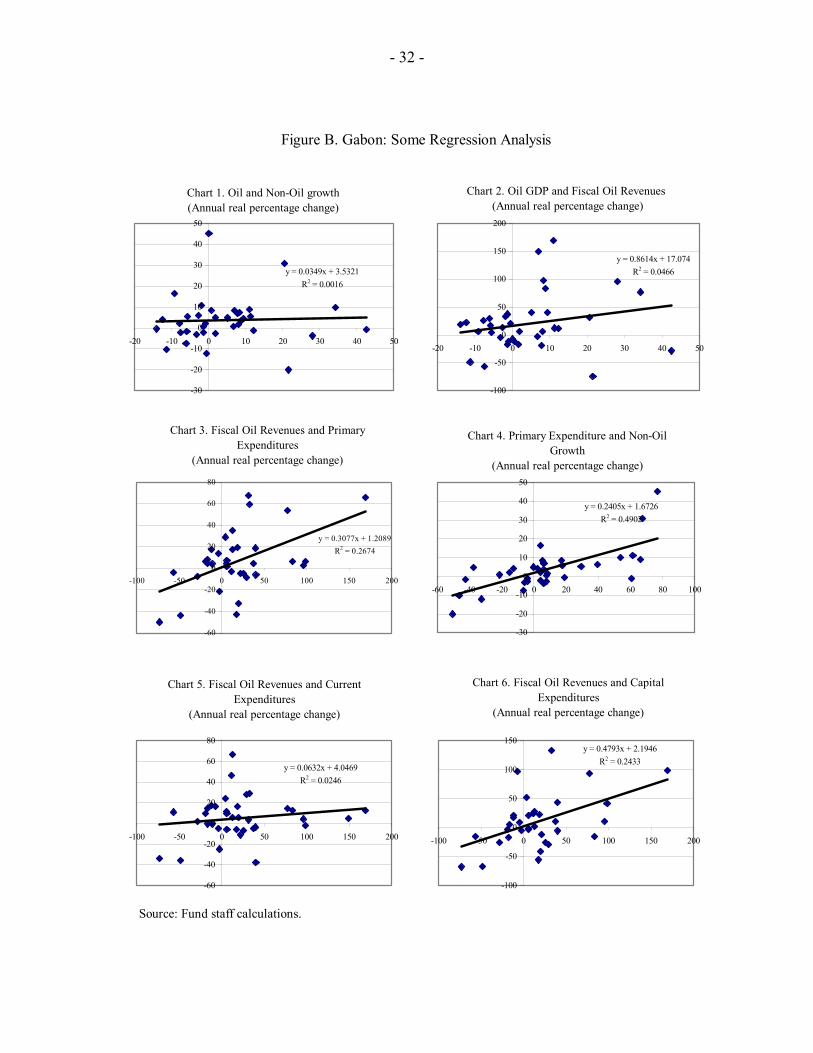
- 32 -
Figure B. Gabon: Some Regression Analysis
Source: Fund staff calculations.
Chart 1. Oil and Non-Oil growth (Annual real percentage change)
y = 0.0349x + 3.5321R2 = 0.0016
-30
-20
-10
0
10
20
30
40
50
-20 -10 0 10 20 30 40 50
Chart 2. Oil GDP and Fiscal Oil Revenues (Annual real percentage change)
y = 0.8614x + 17.074R2 = 0.0466
-100
-50
0
50
100
150
200
-20 -10 0 10 20 30 40 50
Chart 3. Fiscal Oil Revenues and Primary Expenditures
(Annual real percentage change)
y = 0.3077x + 1.2089R2 = 0.2674
-60
-40
-20
0
20
40
60
80
-100 -50 0 50 100 150 200
Chart 4. Primary Expenditure and Non-Oil Growth
(Annual real percentage change)
y = 0.2405x + 1.6726R2 = 0.4902
-30
-20
-10
0
10
20
30
40
50
-60 -40 -20 0 20 40 60 80 100
Chart 5. Fiscal Oil Revenues and Current Expenditures
(Annual real percentage change)
y = 0.0632x + 4.0469R2 = 0.0246
-60
-40
-20
0
20
40
60
80
-100 -50 0 50 100 150 200
Chart 6. Fiscal Oil Revenues and Capital Expenditures
(Annual real percentage change)
y = 0.4793x + 2.1946R2 = 0.2433
-100
-50
0
50
100
150
-100 -50 0 50 100 150 200
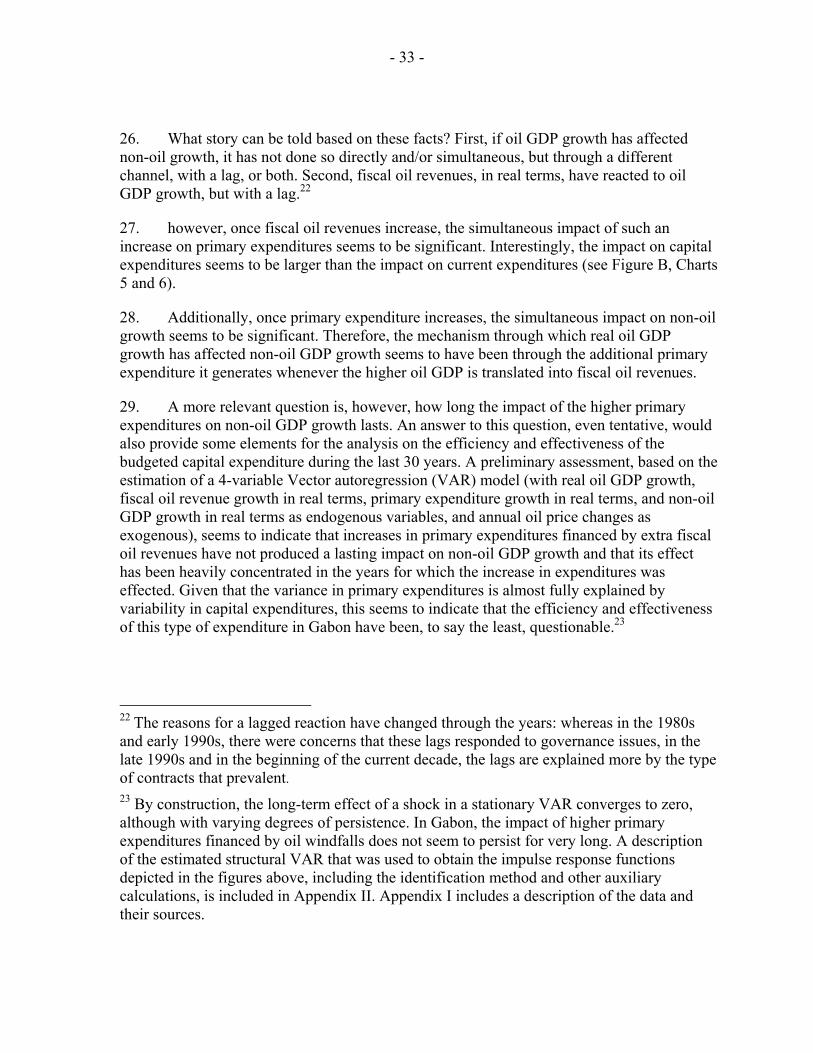
- 33 -
26. What story can be told based on these facts? First, if oil GDP growth has affected non-oil growth, it has not done so directly and/or simultaneous, but through a different channel, with a lag, or both. Second, fiscal oil revenues, in real terms, have reacted to oil GDP growth, but with a lag.22
27. however, once fiscal oil revenues increase, the simultaneous impact of such an increase on primary expenditures seems to be significant. Interestingly, the impact on capital expenditures seems to be larger than the impact on current expenditures (see Figure B, Charts 5 and 6).
28. Additionally, once primary expenditure increases, the simultaneous impact on non-oil growth seems to be significant. Therefore, the mechanism through which real oil GDP growth has affected non-oil GDP growth seems to have been through the additional primary expenditure it generates whenever the higher oil GDP is translated into fiscal oil revenues.
29. A more relevant question is, however, how long the impact of the higher primary expenditures on non-oil GDP growth lasts. An answer to this question, even tentative, would also provide some elements for the analysis on the efficiency and effectiveness of the budgeted capital expenditure during the last 30 years. A preliminary assessment, based on the estimation of a 4-variable Vector autoregression (VAR) model (with real oil GDP growth, fiscal oil revenue growth in real terms, primary expenditure growth in real terms, and non-oil GDP growth in real terms as endogenous variables, and annual oil price changes as exogenous), seems to indicate that increases in primary expenditures financed by extra fiscal oil revenues have not produced a lasting impact on non-oil GDP growth and that its effect has been heavily concentrated in the years for which the increase in expenditures was effected. Given that the variance in primary expenditures is almost fully explained by variability in capital expenditures, this seems to indicate that the efficiency and effectiveness of this type of expenditure in Gabon have been, to say the least, questionable.23
22 The reasons for a lagged reaction have changed through the years: whereas in the 1980s and early 1990s, there were concerns that these lags responded to governance issues, in the late 1990s and in the beginning of the current decade, the lags are explained more by the type of contracts that prevalent. 23 By construction, the long-term effect of a shock in a stationary VAR converges to zero, although with varying degrees of persistence. In Gabon, the impact of higher primary expenditures financed by oil windfalls does not seem to persist for very long. A description of the estimated structural VAR that was used to obtain the impulse response functions depicted in the figures above, including the identification method and other auxiliary calculations, is included in Appendix II. Appendix I includes a description of the data and their sources.
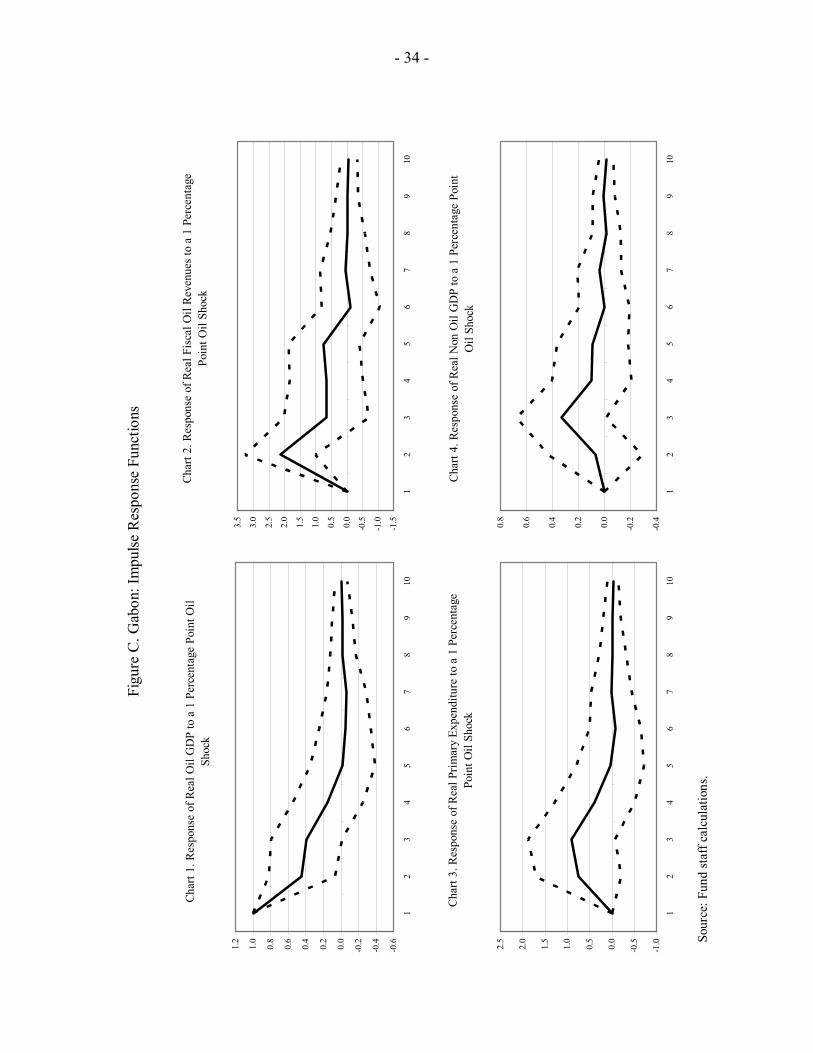
- 34 -
Figu
re C
. Gab
on: I
mpu
lse R
espo
nse
Func
tions
Sour
ce: F
und
staf
f cal
cula
tions
.
Cha
rt 1.
Res
pons
e of
Rea
l Oil
GD
P to
a 1
Per
cent
age
Poin
t Oil
Shoc
k
-0.6
-0.4
-0.20.0
0.2
0.4
0.6
0.8
1.0
1.2
12
34
56
78
910
Cha
rt 2.
Res
pons
e of
Rea
l Fis
cal O
il R
even
ues
to a
1 P
erce
ntag
e Po
int O
il Sh
ock
-1.5
-1.0
-0.50.0
0.5
1.0
1.5
2.0
2.5
3.0
3.5
12
34
56
78
910
Cha
rt 3.
Res
pons
e of
Rea
l Prim
ary
Expe
nditu
re to
a 1
Per
cent
age
Poin
t Oil
Shoc
k
-1.0
-0.50.0
0.5
1.0
1.5
2.0
2.5
12
34
56
78
910
Cha
rt 4.
Res
pons
e of
Rea
l Non
Oil
GD
P to
a 1
Per
cent
age
Poin
t O
il Sh
ock
-0.4
-0.20.0
0.2
0.4
0.6
0.8
12
34
56
78
910
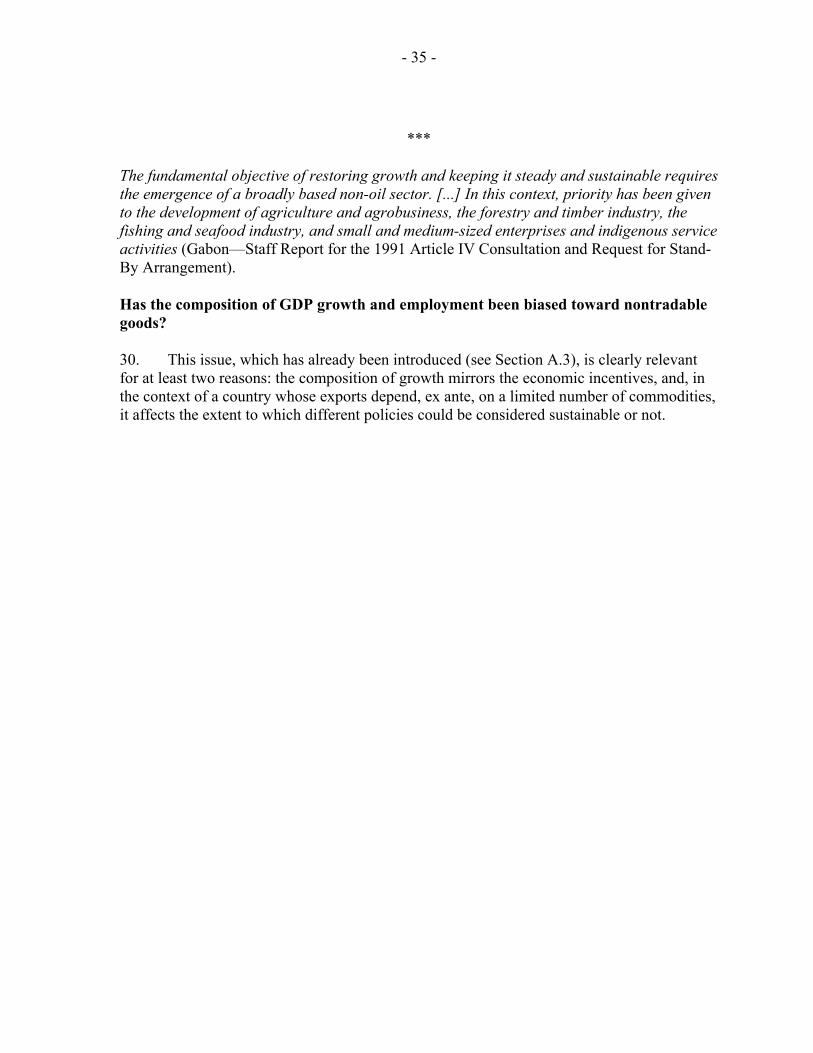
- 35 -
***
The fundamental objective of restoring growth and keeping it steady and sustainable requires the emergence of a broadly based non-oil sector. [...] In this context, priority has been given to the development of agriculture and agrobusiness, the forestry and timber industry, the fishing and seafood industry, and small and medium-sized enterprises and indigenous service activities (Gabon—Staff Report for the 1991 Article IV Consultation and Request for Stand-By Arrangement).
Has the composition of GDP growth and employment been biased toward nontradable goods?
30. This issue, which has already been introduced (see Section A.3), is clearly relevant for at least two reasons: the composition of growth mirrors the economic incentives, and, in the context of a country whose exports depend, ex ante, on a limited number of commodities, it affects the extent to which different policies could be considered sustainable or not.
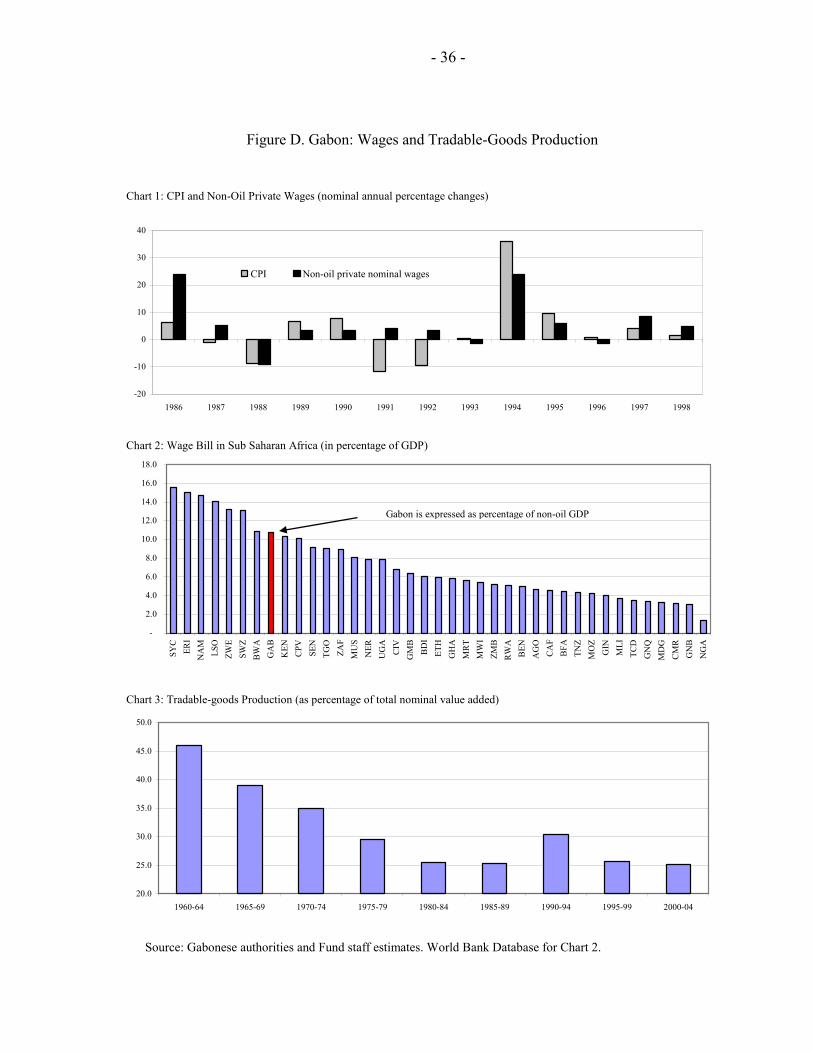
- 36 -
Figure D. Gabon: Wages and Tradable-Goods Production
Source: Gabonese authorities and Fund staff estimates. World Bank Database for Chart 2.
Chart 1: CPI and Non-Oil Private Wages (nominal annual percentage changes)
-20
-10
0
10
20
30
40
1986 1987 1988 1989 1990 1991 1992 1993 1994 1995 1996 1997 1998
CPI Non-oil private nominal wages
Chart 2: Wage Bill in Sub Saharan Africa (in percentage of GDP)
-
2.0
4.0
6.0
8.0
10.0
12.0
14.0
16.0
18.0
SYC
ERI
NA
MLS
OZW
ESW
ZB
WA
GA
BK
EN CPV SE
NTG
OZA
FM
US
NER
UG
AC
IVG
MB
BD
IET
HG
HA
MR
TM
WI
ZMB
RW
AB
ENA
GO
CA
FB
FATN
ZM
OZ
GIN
MLI
TCD
GN
QM
DG
CM
RG
NB
NG
A
Gabon is expressed as percentage of non-oil GDP
Chart 3: Tradable-goods Production (as percentage of total nominal value added)
20.0
25.0
30.0
35.0
40.0
45.0
50.0
1960-64 1965-69 1970-74 1975-79 1980-84 1985-89 1990-94 1995-99 2000-04
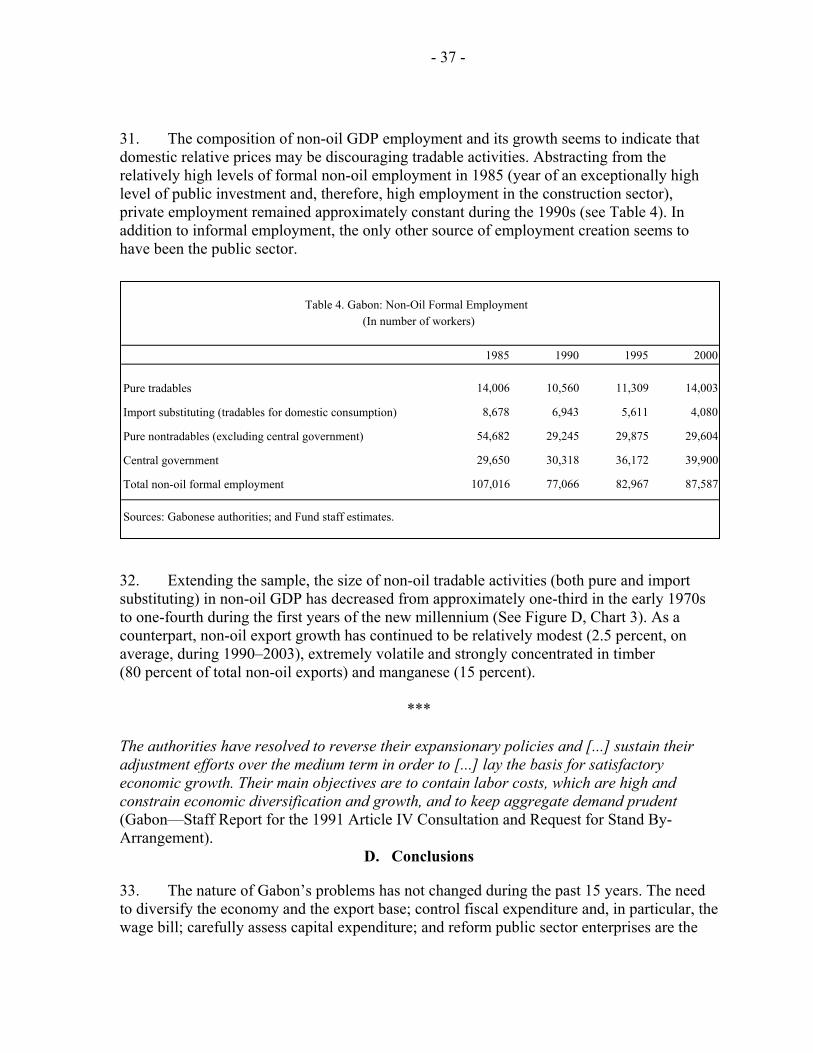
- 37 -
31. The composition of non-oil GDP employment and its growth seems to indicate that domestic relative prices may be discouraging tradable activities. Abstracting from the relatively high levels of formal non-oil employment in 1985 (year of an exceptionally high level of public investment and, therefore, high employment in the construction sector), private employment remained approximately constant during the 1990s (see Table 4). In addition to informal employment, the only other source of employment creation seems to have been the public sector.
32. Extending the sample, the size of non-oil tradable activities (both pure and import substituting) in non-oil GDP has decreased from approximately one-third in the early 1970s to one-fourth during the first years of the new millennium (See Figure D, Chart 3). As a counterpart, non-oil export growth has continued to be relatively modest (2.5 percent, on average, during 1990–2003), extremely volatile and strongly concentrated in timber (80 percent of total non-oil exports) and manganese (15 percent).
***
The authorities have resolved to reverse their expansionary policies and [...] sustain their adjustment efforts over the medium term in order to [...] lay the basis for satisfactory economic growth. Their main objectives are to contain labor costs, which are high and constrain economic diversification and growth, and to keep aggregate demand prudent (Gabon—Staff Report for the 1991 Article IV Consultation and Request for Stand By-Arrangement).
D. Conclusions
33. The nature of Gabon’s problems has not changed during the past 15 years. The need to diversify the economy and the export base; control fiscal expenditure and, in particular, the wage bill; carefully assess capital expenditure; and reform public sector enterprises are the
1985 1990 1995 2000
Pure tradables 14,006 10,560 11,309 14,003
Import substituting (tradables for domestic consumption) 8,678 6,943 5,611 4,080
Pure nontradables (excluding central government) 54,682 29,245 29,875 29,604
Central government 29,650 30,318 36,172 39,900
Total non-oil formal employment 107,016 77,066 82,967 87,587
Sources: Gabonese authorities; and Fund staff estimates.
Table 4. Gabon: Non-Oil Formal Employment (In number of workers)
- 38 -
challenges for which the Gabonese need to be prepared to implement adequate—and, by now, well-known—policies.
34. Gabon has a window of opportunity at this time: although its cost structure remains high, euro prices for oil and non-oil traditional exports are currently buoyant. The authorities should continue to implement the structural reform program they initiated in 2003. Fiscal discipline is key to making Gabon’s macroeconomic situation more stable and sustainable in the face of shocks, which are inevitable. Although, fiscal discipline is necessary if growth is to resume, it is not enough. In addition, the Gabonese authorities need to stick to structural reforms designated to improve the private sector environment. These two acts should foster investment (both foreign and domestic) and promote growth.
35. In sum, the current fiscal and structural reform efforts must be sustained to liberate resources for private sector development, reduce fiscal pressure, lower labor costs, and change the current structure of price/cost incentives, all of which are key to promoting growth in the non-oil sectors. The fixed CFA franc vis-à-vis the euro make these efforts even more relevant.
- 39 -
Bibliography
Banque Centrale des États de l’Afrique Centrale, 1990, “Études et Statistiques,” Numéro 168, (Janvier), Yaoundé.
Banque Centrale des États de l’Afrique Centrale, 2000, “Études et Statistiques,” Numéro 254, (Janvier – Février – Mars), Yaoundé.
Banque Centrale des États de l’Afrique Centrale, 2004, “Études et Statistiques,” Numéro 280, (Février), Yaoundé.
Barro Chambrier, H., 1990, “L’Économie du Gabon. Analyse des Politiques d’Ajustement et d’Adaptation,” Economica, (Paris).
Barro, R. and X. Sala-i-Martin,1995, “Economic Growth,” Mc Graw Hill International Editions, (New York).
Direction Générale de l’Économie, 1986, “25 Ans d’Économie Gabonaise, 1960–85,” Ministère de l’Économie, des Finances et des Participations, (Libreville).
Direction Générale de l’Économie, 2001, “Productivité Globale des Facteurs de Production de l’Économie Gabonaise. Synthèse des Journées de Concertation,” mimeo, (Libreville).
Enders, W., 1995, Applied Econometric Time Series. Wiley and Sons, (New York).
International Monetary Fund, 1989, “Gabon, Staff Report for the 1988 Article IV Consultation,” (Washington, D.C.).
International Monetary Fund, 1991, “Gabon, Staff Report for the 1991 Article IV Consultation and Request for a Stand-By Arrangement,” (Washington D.C.).
International Monetary Fund,1993, “Gabon, Staff Report for the 1992 Article IV Consultation,” International Monetary Fund, (Washington, D.C.).
International Monetary Fund, 2004, “Gabon. Second Review for the Stand-By Arrangement and Review of Financing Assurances,” (Washington, D.C.).
International Monetary Fund, 2005, “Sub-Saharan Africa Regional Economic Outlook,” (Forthcoming), (Washington, D.C.).
Kaufmann, D., A. Kraay, and P. Zoilo-Lobaton, 2003, “Governance Matters III: Governance Indicators for 1996–2002,” The World Bank, (June).
Tahari, A. and D. Ghura, B. Akitoby and E. Brou Aka, 2004, “Sources of Growth in Sub-Saharan Africa,” Working Paper 04/176, (Washington: International Monetary Fund).
Tsangarides, C., 2005, “Growth Empirics Under Model Uncertainty: Is Africa Different?” IMF Working Paper 05/18, (Washington: International Monetary Fund).
Transparency International, 2004, “TI Corruption Perceptions Index 2004,” (Berlin).
- 40 - APPENDIX I
I. DATA SOURCES AND DESCRIPTION
1. Commodity prices, U.S. dollar/euro exchange rate
Okoumé, plywood made of Gabonese timber and other Gabonese timber: For 2001–04 prices are annual average export prices and were provided by the Gabonese authorities (BEAC). For 2005–10, the prices assumed are calculated by compounding each series using the assumed percentage change for Hardwood Logs included in the latest WEO exercise (March 2005). Manganese, Palm oil, Rubber, Fish meal, Coffee (robusta), U.S. dollar/euro exchange rate: Historical and future prices are those included/assumed in the latest WEO exercise. 2. Real Effective Exchange Rates (REER) The series for the CEMAC countries were calculated using the Fund’s ‘Effective Exchange Rate Facility’ software. The alternative series for Gabon’s REER was calculated using the annual nominal percentage change of the average non-oil formal private sector labor cost during 1986–1998, in the way described in the main text. The source for the latter is the ministry of finance (Direction Générale de l’Économie). 3. Non-oil private sector wages and employment
The series used are available for 1985–98 and their source is the ministry of planning (Direction Prévision et Statistique). For 1998–2000, these series were estimated by the ministry of finance (Direction Générale de l’Économie). 4. Governance indicators
The point estimates for 1996–2002 correspond to the sub sample for the SSA countries presented in Kaufmann, Kraay and Mastruzzi (2003). 5. National accounts The sources for the GDP series in nominal terms (by sector of economic activity) are, (i) for 1960–1980, DGE (1986) (ii) for 1980–2000, the ministry of planning (Direction de la prévision et statistique); and (iii) for 2001–04, the ministry of finance (Direction Générale de l’Économie); and. For the GDP in real terms—measured in 1989 prices—(by sector of economic activity), the sources are, (i) for 1985–2000, the ministry of planning (Direction de la prévision et statistique); and (ii) for 2001–04, the ministry of finance (Direction Générale de l’Économie). There are no GDP series in real terms for 1960–1984. In order to have an indicator for the GDP changes in real terms both for the oil and non oil sectors, the following approximation was used: (i) for oil GDP in real terms, the level in 1985 was deflated by the ratio of the change in oil GDP in nominal terms and the price of oil, for the period 1960–85 (the source for both series is DGE (1986)); (ii) for non-oil GDP, the level in 1985 was
- 41 - APPENDIX I
deflated by the ratio of the changes in non-oil GDP in nominal terms and the Consumer Price index in average terms, for the period 1960-85. 6. Fiscal accounts
The sources for the series on oil and non-oil fiscal revenues and primary expenditures (both current and capital) are, (i) for 1960–1985, DGE (1986); (ii) for 1986–87, Barro Chambrier (1990) and IMF (1989); (iii) for 1988–99, BEAC (2000); and (iv) for 2000–04, IMF (2004). The series in real terms—expressed in 1989 prices—were approximated as follows: (i) for fiscal oil revenues, the series in nominal terms was deflated by the APSP index with base in 1989; (ii) for the remaining series, they were deflated by the non-oil GDP price deflator (for the period 1986–2004), and by the consumer price index (for the period 1960–1985). 7. Wage comparisons for sub-Saharan Africa
The international comparisons are based on a World Bank dataset from the website http://www1.worldbank.org/publicsector/civilservice/.
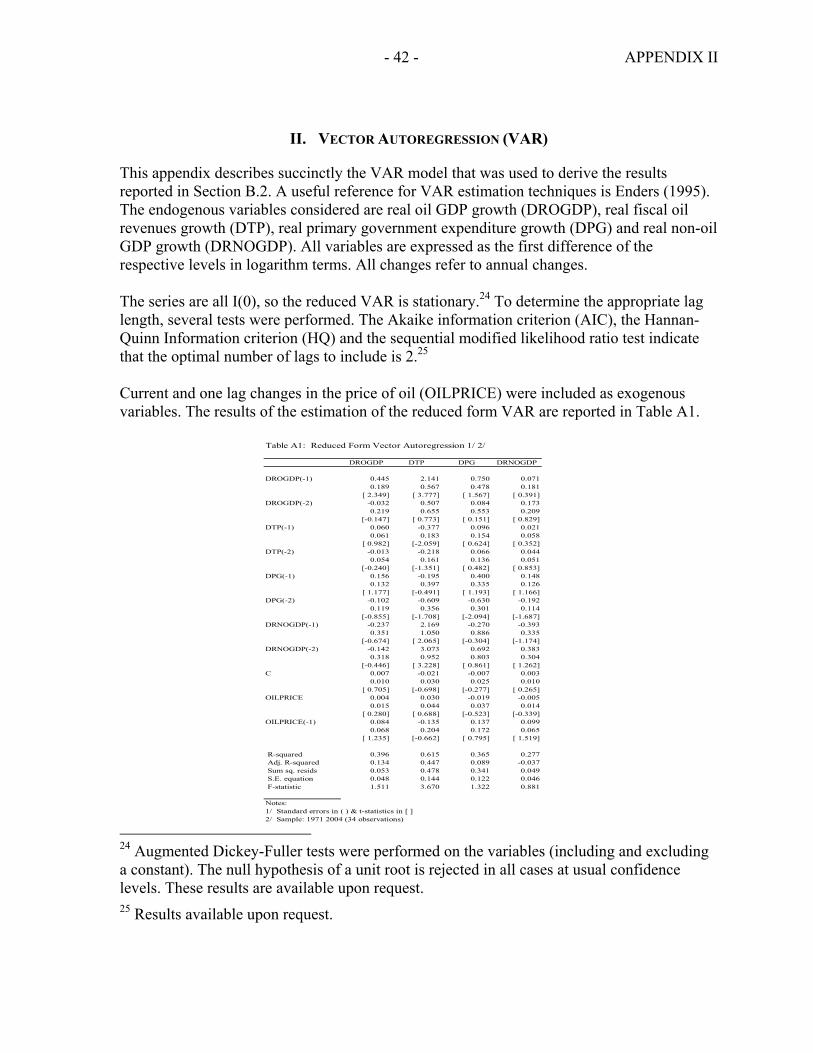
- 42 - APPENDIX II
II. VECTOR AUTOREGRESSION (VAR)
This appendix describes succinctly the VAR model that was used to derive the results reported in Section B.2. A useful reference for VAR estimation techniques is Enders (1995). The endogenous variables considered are real oil GDP growth (DROGDP), real fiscal oil revenues growth (DTP), real primary government expenditure growth (DPG) and real non-oil GDP growth (DRNOGDP). All variables are expressed as the first difference of the respective levels in logarithm terms. All changes refer to annual changes. The series are all I(0), so the reduced VAR is stationary.24 To determine the appropriate lag length, several tests were performed. The Akaike information criterion (AIC), the Hannan-Quinn Information criterion (HQ) and the sequential modified likelihood ratio test indicate that the optimal number of lags to include is 2.25 Current and one lag changes in the price of oil (OILPRICE) were included as exogenous variables. The results of the estimation of the reduced form VAR are reported in Table A1.
24 Augmented Dickey-Fuller tests were performed on the variables (including and excluding a constant). The null hypothesis of a unit root is rejected in all cases at usual confidence levels. These results are available upon request. 25 Results available upon request.
Table A1: Reduced Form Vector Autoregression 1/ 2/
DROGDP DTP DPG DRNOGDP
DROGDP(-1) 0.445 2.141 0.750 0.0710.189 0.567 0.478 0.181
[ 2.349] [ 3.777] [ 1.567] [ 0.391]DROGDP(-2) -0.032 0.507 0.084 0.173
0.219 0.655 0.553 0.209[-0.147] [ 0.773] [ 0.151] [ 0.829]
DTP(-1) 0.060 -0.377 0.096 0.0210.061 0.183 0.154 0.058
[ 0.982] [-2.059] [ 0.624] [ 0.352]DTP(-2) -0.013 -0.218 0.066 0.044
0.054 0.161 0.136 0.051[-0.240] [-1.351] [ 0.482] [ 0.853]
DPG(-1) 0.156 -0.195 0.400 0.1480.132 0.397 0.335 0.126
[ 1.177] [-0.491] [ 1.193] [ 1.166]DPG(-2) -0.102 -0.609 -0.630 -0.192
0.119 0.356 0.301 0.114[-0.855] [-1.708] [-2.094] [-1.687]
DRNOGDP(-1) -0.237 2.169 -0.270 -0.3930.351 1.050 0.886 0.335
[-0.674] [ 2.065] [-0.304] [-1.174]DRNOGDP(-2) -0.142 3.073 0.692 0.383
0.318 0.952 0.803 0.304[-0.446] [ 3.228] [ 0.861] [ 1.262]
C 0.007 -0.021 -0.007 0.0030.010 0.030 0.025 0.010
[ 0.705] [-0.698] [-0.277] [ 0.265]OILPRICE 0.004 0.030 -0.019 -0.005
0.015 0.044 0.037 0.014[ 0.280] [ 0.688] [-0.523] [-0.339]
OILPRICE(-1) 0.084 -0.135 0.137 0.0990.068 0.204 0.172 0.065
[ 1.235] [-0.662] [ 0.795] [ 1.519]
R-squared 0.396 0.615 0.365 0.277 Adj. R-squared 0.134 0.447 0.089 -0.037 Sum sq. resids 0.053 0.478 0.341 0.049 S.E. equation 0.048 0.144 0.122 0.046 F-statistic 1.511 3.670 1.322 0.881
Notes:1/ Standard errors in ( ) & t-statistics in [ ]2/ Sample: 1971 2004 (34 observations)
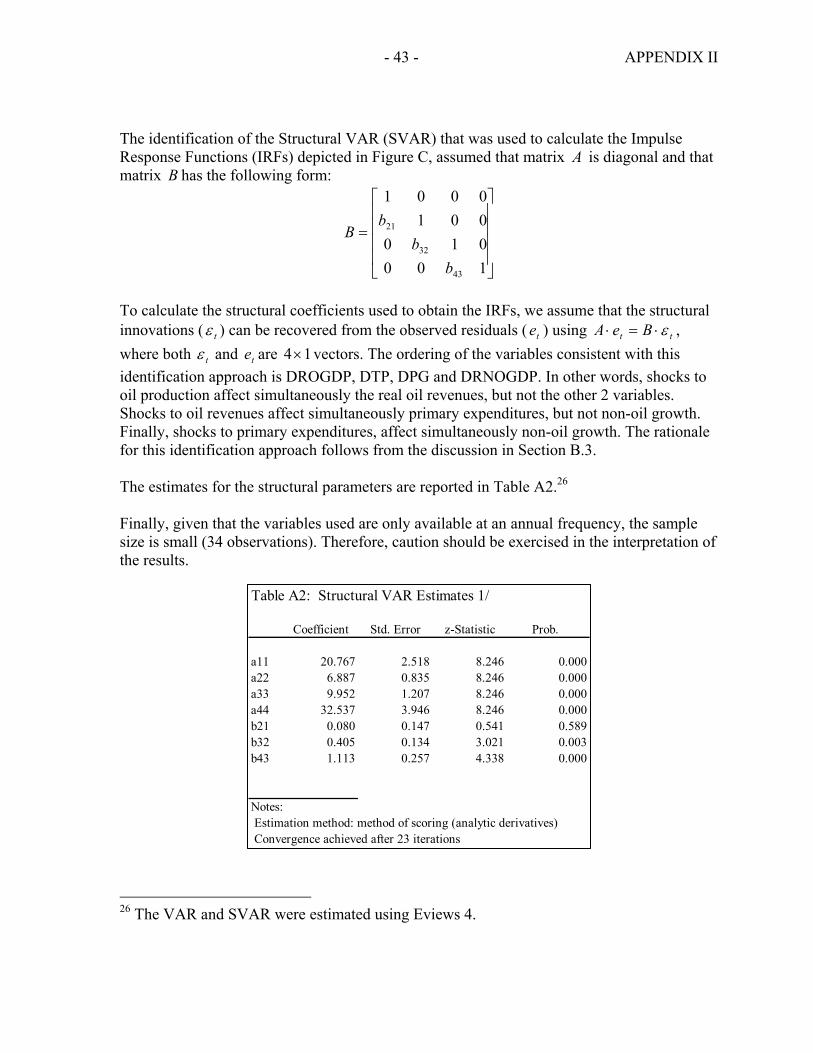
- 43 - APPENDIX II
Table A2: Structural VAR Estimates 1/
Coefficient Std. Error z-Statistic Prob.
a11 20.767 2.518 8.246 0.000a22 6.887 0.835 8.246 0.000a33 9.952 1.207 8.246 0.000a44 32.537 3.946 8.246 0.000b21 0.080 0.147 0.541 0.589b32 0.405 0.134 3.021 0.003b43 1.113 0.257 4.338 0.000
Notes: Estimation method: method of scoring (analytic derivatives) Convergence achieved after 23 iterations
The identification of the Structural VAR (SVAR) that was used to calculate the Impulse Response Functions (IRFs) depicted in Figure C, assumed that matrix A is diagonal and that matrix B has the following form:
⎥⎥⎥⎥
⎦
⎤
⎢⎢⎢⎢
⎣
⎡
=
1000100010001
43
32
21
bb
bB
To calculate the structural coefficients used to obtain the IRFs, we assume that the structural innovations ( tε ) can be recovered from the observed residuals ( te ) using tt BeA ε⋅=⋅ , where both tε and te are 14× vectors. The ordering of the variables consistent with this identification approach is DROGDP, DTP, DPG and DRNOGDP. In other words, shocks to oil production affect simultaneously the real oil revenues, but not the other 2 variables. Shocks to oil revenues affect simultaneously primary expenditures, but not non-oil growth. Finally, shocks to primary expenditures, affect simultaneously non-oil growth. The rationale for this identification approach follows from the discussion in Section B.3. The estimates for the structural parameters are reported in Table A2.26 Finally, given that the variables used are only available at an annual frequency, the sample size is small (34 observations). Therefore, caution should be exercised in the interpretation of the results.
26 The VAR and SVAR were estimated using Eviews 4.
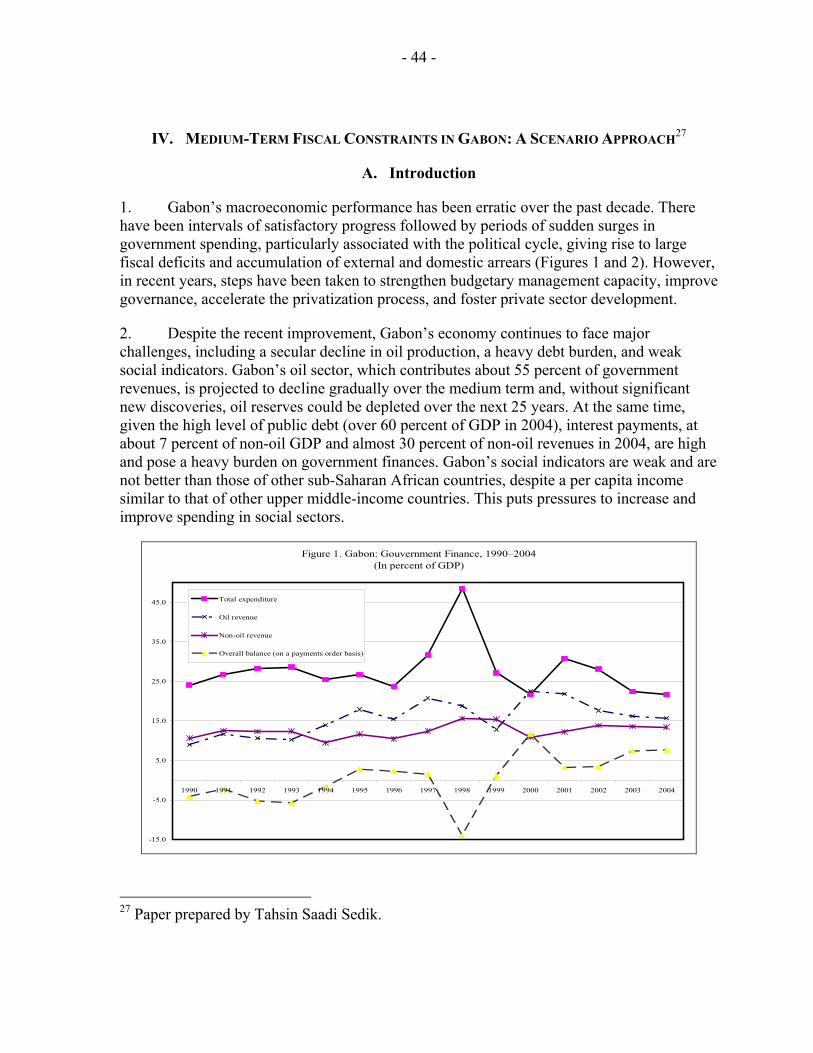
- 44 -
IV. MEDIUM-TERM FISCAL CONSTRAINTS IN GABON: A SCENARIO APPROACH27
A. Introduction
1. Gabon’s macroeconomic performance has been erratic over the past decade. There have been intervals of satisfactory progress followed by periods of sudden surges in government spending, particularly associated with the political cycle, giving rise to large fiscal deficits and accumulation of external and domestic arrears (Figures 1 and 2). However, in recent years, steps have been taken to strengthen budgetary management capacity, improve governance, accelerate the privatization process, and foster private sector development.
2. Despite the recent improvement, Gabon’s economy continues to face major challenges, including a secular decline in oil production, a heavy debt burden, and weak social indicators. Gabon’s oil sector, which contributes about 55 percent of government revenues, is projected to decline gradually over the medium term and, without significant new discoveries, oil reserves could be depleted over the next 25 years. At the same time, given the high level of public debt (over 60 percent of GDP in 2004), interest payments, at about 7 percent of non-oil GDP and almost 30 percent of non-oil revenues in 2004, are high and pose a heavy burden on government finances. Gabon’s social indicators are weak and are not better than those of other sub-Saharan African countries, despite a per capita income similar to that of other upper middle-income countries. This puts pressures to increase and improve spending in social sectors.
Figure 1. Gabon: Gouvernment Finance, 1990–2004(In percent of GDP)
-15.0
-5.0
5.0
15.0
25.0
35.0
45.0
1990 1991 1992 1993 1994 1995 1996 1997 1998 1999 2000 2001 2002 2003 2004
Total expenditure
Oil revenue
Non-oil revenue
Overall balance (on a payments order basis)
27 Paper prepared by Tahsin Saadi Sedik.
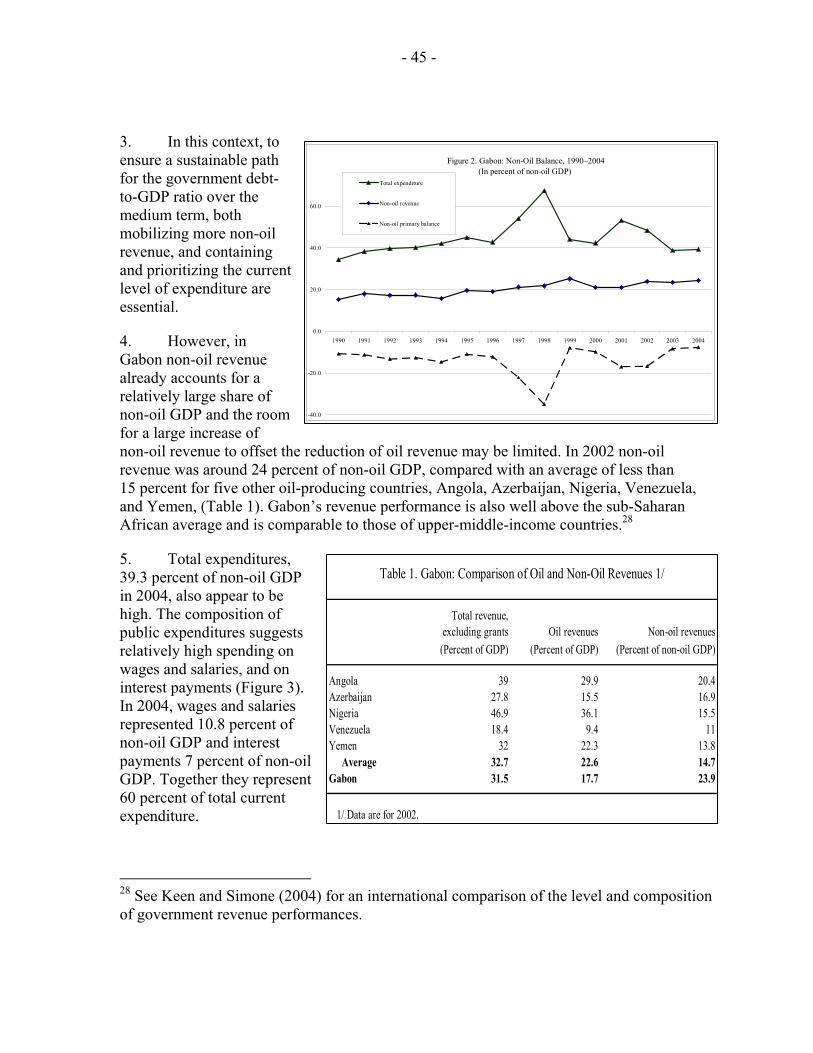
- 45 -
Total revenue,excluding grants Oil revenues Non-oil revenues
(Percent of GDP) (Percent of GDP) (Percent of non-oil GDP)
Angola 39 29.9 20.4Azerbaijan 27.8 15.5 16.9Nigeria 46.9 36.1 15.5Venezuela 18.4 9.4 11Yemen 32 22.3 13.8 Average 32.7 22.6 14.7Gabon 31.5 17.7 23.9
1/ Data are for 2002.
Table 1. Gabon: Comparison of Oil and Non-Oil Revenues 1/
3. In this context, to ensure a sustainable path for the government debt-to-GDP ratio over the medium term, both mobilizing more non-oil revenue, and containing and prioritizing the current level of expenditure are essential.
4. However, in Gabon non-oil revenue already accounts for a relatively large share of non-oil GDP and the room for a large increase of non-oil revenue to offset the reduction of oil revenue may be limited. In 2002 non-oil revenue was around 24 percent of non-oil GDP, compared with an average of less than 15 percent for five other oil-producing countries, Angola, Azerbaijan, Nigeria, Venezuela, and Yemen, (Table 1). Gabon’s revenue performance is also well above the sub-Saharan African average and is comparable to those of upper-middle-income countries.28
5. Total expenditures, 39.3 percent of non-oil GDP in 2004, also appear to be high. The composition of public expenditures suggests relatively high spending on wages and salaries, and on interest payments (Figure 3). In 2004, wages and salaries represented 10.8 percent of non-oil GDP and interest payments 7 percent of non-oil GDP. Together they represent 60 percent of total current expenditure.
28 See Keen and Simone (2004) for an international comparison of the level and composition of government revenue performances.
Figure 2. Gabon: Non-Oil Balance, 1990–2004 (In percent of non-oil GDP)
-40.0
-20.0
0.0
20.0
40.0
60.0
1990 1991 1992 1993 1994 1995 1996 1997 1998 1999 2000 2001 2002 2003 2004
Total expenditure
Non-oil revenue
Non-oil primary balance
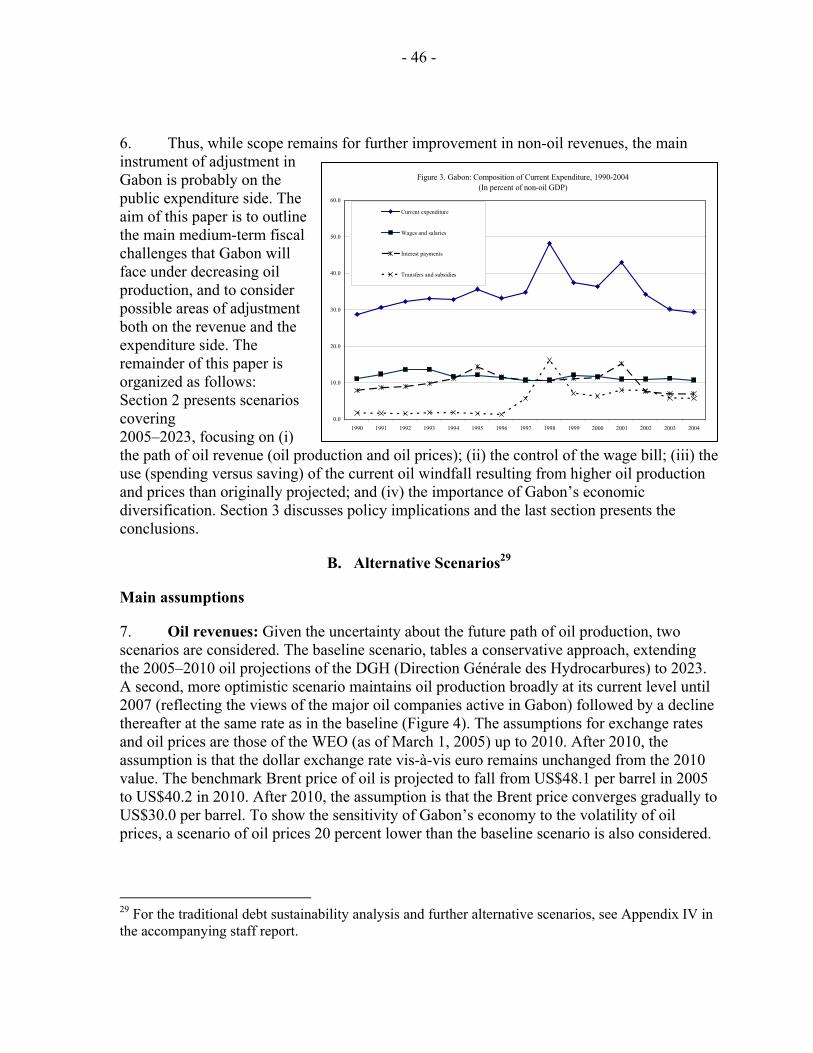
- 46 -
6. Thus, while scope remains for further improvement in non-oil revenues, the main instrument of adjustment in Gabon is probably on the public expenditure side. The aim of this paper is to outline the main medium-term fiscal challenges that Gabon will face under decreasing oil production, and to consider possible areas of adjustment both on the revenue and the expenditure side. The remainder of this paper is organized as follows: Section 2 presents scenarios covering 2005–2023, focusing on (i) the path of oil revenue (oil production and oil prices); (ii) the control of the wage bill; (iii) the use (spending versus saving) of the current oil windfall resulting from higher oil production and prices than originally projected; and (iv) the importance of Gabon’s economic diversification. Section 3 discusses policy implications and the last section presents the conclusions.
B. Alternative Scenarios29
Main assumptions
7. Oil revenues: Given the uncertainty about the future path of oil production, two scenarios are considered. The baseline scenario, tables a conservative approach, extending the 2005–2010 oil projections of the DGH (Direction Générale des Hydrocarbures) to 2023. A second, more optimistic scenario maintains oil production broadly at its current level until 2007 (reflecting the views of the major oil companies active in Gabon) followed by a decline thereafter at the same rate as in the baseline (Figure 4). The assumptions for exchange rates and oil prices are those of the WEO (as of March 1, 2005) up to 2010. After 2010, the assumption is that the dollar exchange rate vis-à-vis euro remains unchanged from the 2010 value. The benchmark Brent price of oil is projected to fall from US$48.1 per barrel in 2005 to US$40.2 in 2010. After 2010, the assumption is that the Brent price converges gradually to US$30.0 per barrel. To show the sensitivity of Gabon’s economy to the volatility of oil prices, a scenario of oil prices 20 percent lower than the baseline scenario is also considered.
29 For the traditional debt sustainability analysis and further alternative scenarios, see Appendix IV in the accompanying staff report.
Figure 3. Gabon: Composition of Current Expenditure, 1990-2004(In percent of non-oil GDP)
0.0
10.0
20.0
30.0
40.0
50.0
60.0
1990 1991 1992 1993 1994 1995 1996 1997 1998 1999 2000 2001 2002 2003 2004
Current expenditure
Wages and salaries
Interest payments
Transfers and subsidies
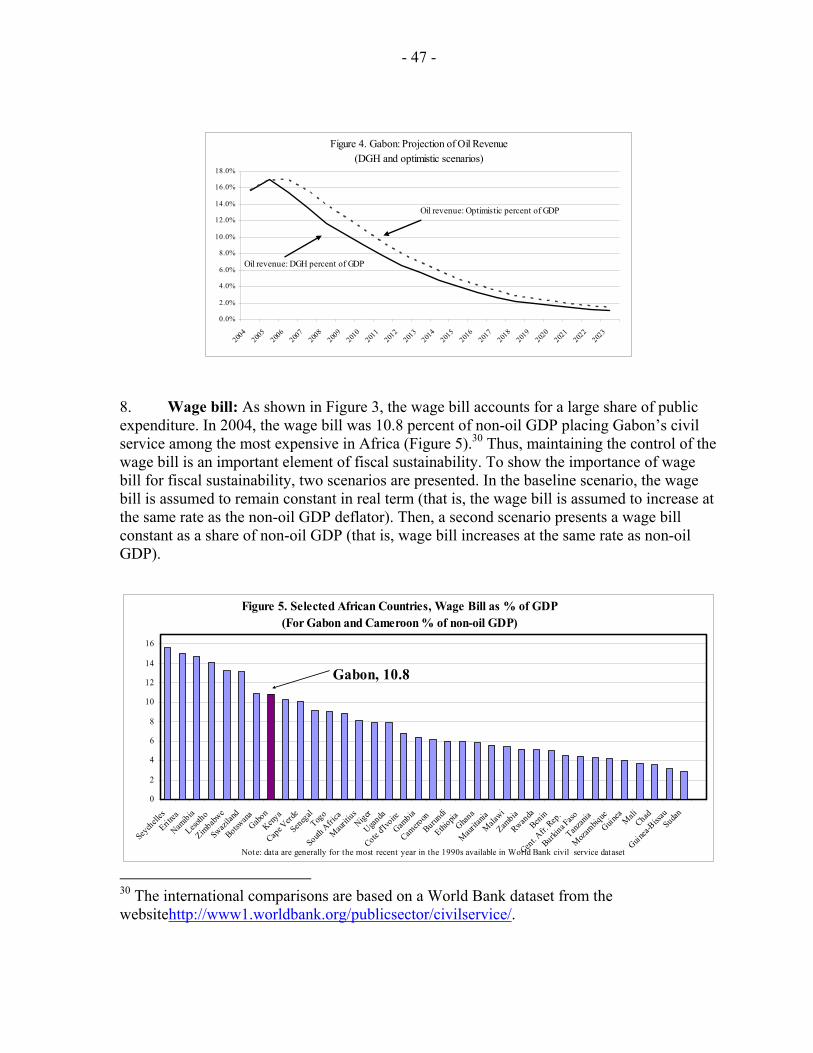
- 47 -
Figure 4. Gabon: Projection of Oil Revenue (DGH and optimistic scenarios)
0.0%
2.0%
4.0%
6.0%
8.0%
10.0%
12.0%
14.0%
16.0%
18.0%
2004
2005
2006
2007
2008
2009
2010
2011
2012
2013
2014
2015
2016
2017
2018
2019
2020
2021
2022
2023
Oil revenue: DGH percent of GDP
Oil revenue: Optimistic percent of GDP
8. Wage bill: As shown in Figure 3, the wage bill accounts for a large share of public expenditure. In 2004, the wage bill was 10.8 percent of non-oil GDP placing Gabon’s civil service among the most expensive in Africa (Figure 5).30 Thus, maintaining the control of the wage bill is an important element of fiscal sustainability. To show the importance of wage bill for fiscal sustainability, two scenarios are presented. In the baseline scenario, the wage bill is assumed to remain constant in real term (that is, the wage bill is assumed to increase at the same rate as the non-oil GDP deflator). Then, a second scenario presents a wage bill constant as a share of non-oil GDP (that is, wage bill increases at the same rate as non-oil GDP).
Figure 5. Selected African Countries, Wage Bill as % of GDP(For Gabon and Cameroon % of non-oil GDP)
0
2
4
6
8
10
12
14
16
Seychell
es
Eri trea
Namibia
Lesotho
Zimbabw
e
Swazilan
d
Botswana
GabonKeny
a
Cape V
erde
Senegal
Togo
South Afri
ca
Mauritiu
sNiger
Uganda
Cote d'I
voire
Gambia
Camero
onBurun
di
Ethiopia
Ghana
Maurita
niaMala
wi
Zambia
RwandaBen
in
Cent. A
fr. Rep
.
Burkina F
aso
Tanzani
a
Mozambiq
ueGuin
ea Mali
Chad
Guinea-
Bissau
Sudan
Note: data are generally for the most recent year in the 1990s available in World Bank civil service dataset
Gabon, 10.8
30 The international comparisons are based on a World Bank dataset from the websitehttp://www1.worldbank.org/publicsector/civilservice/.
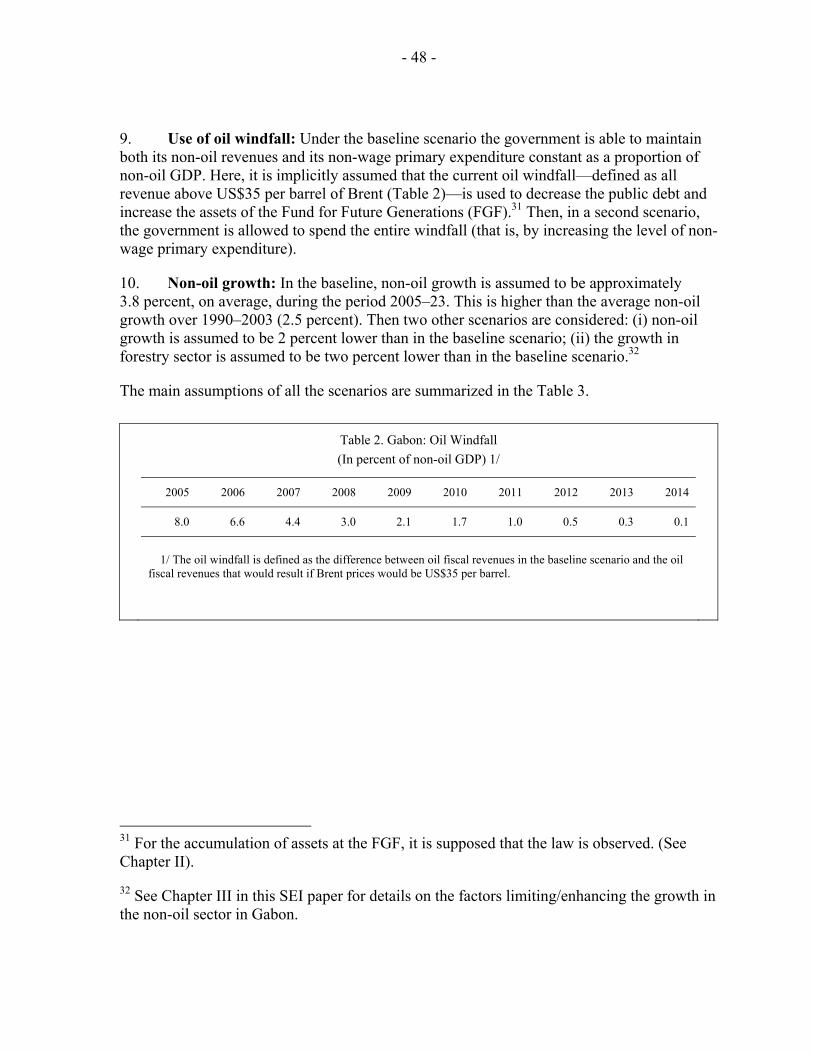
- 48 -
9. Use of oil windfall: Under the baseline scenario the government is able to maintain both its non-oil revenues and its non-wage primary expenditure constant as a proportion of non-oil GDP. Here, it is implicitly assumed that the current oil windfall—defined as all revenue above US$35 per barrel of Brent (Table 2)—is used to decrease the public debt and increase the assets of the Fund for Future Generations (FGF).31 Then, in a second scenario, the government is allowed to spend the entire windfall (that is, by increasing the level of non-wage primary expenditure).
10. Non-oil growth: In the baseline, non-oil growth is assumed to be approximately 3.8 percent, on average, during the period 2005–23. This is higher than the average non-oil growth over 1990–2003 (2.5 percent). Then two other scenarios are considered: (i) non-oil growth is assumed to be 2 percent lower than in the baseline scenario; (ii) the growth in forestry sector is assumed to be two percent lower than in the baseline scenario.32
The main assumptions of all the scenarios are summarized in the Table 3.
Table 2. Gabon: Oil Windfall (In percent of non-oil GDP) 1/
2005 2006 2007 2008 2009 2010 2011 2012 2013 2014
8.0 6.6 4.4 3.0 2.1 1.7 1.0 0.5 0.3 0.1
1/ The oil windfall is defined as the difference between oil fiscal revenues in the baseline scenario and the oil fiscal revenues that would result if Brent prices would be US$35 per barrel.
31 For the accumulation of assets at the FGF, it is supposed that the law is observed. (See Chapter II).
32 See Chapter III in this SEI paper for details on the factors limiting/enhancing the growth in the non-oil sector in Gabon.
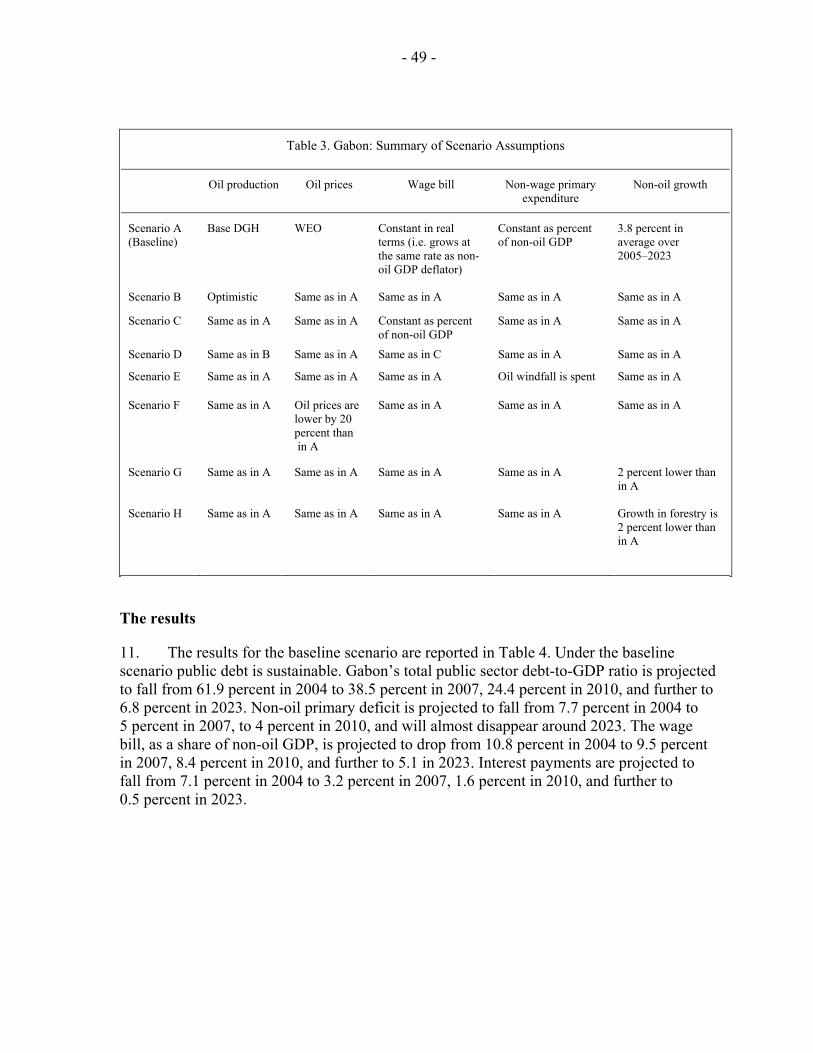
- 49 -
Table 3. Gabon: Summary of Scenario Assumptions
Oil production Oil prices Wage bill Non-wage primary
expenditure Non-oil growth
Scenario A (Baseline)
Base DGH
WEO Constant in real terms (i.e. grows at the same rate as non-oil GDP deflator)
Constant as percent of non-oil GDP
3.8 percent in average over 2005–2023
Scenario B Optimistic Same as in A Same as in A Same as in A Same as in A
Scenario C Same as in A Same as in A Constant as percent of non-oil GDP
Same as in A Same as in A
Scenario D Same as in B Same as in A Same as in C Same as in A Same as in A
Scenario E Same as in A Same as in A Same as in A Oil windfall is spent Same as in A
Scenario F Same as in A Oil prices are lower by 20 percent than in A
Same as in A Same as in A Same as in A
Scenario G Same as in A Same as in A Same as in A Same as in A 2 percent lower than in A
Scenario H Same as in A Same as in A Same as in A Same as in A Growth in forestry is 2 percent lower than in A
The results
11. The results for the baseline scenario are reported in Table 4. Under the baseline scenario public debt is sustainable. Gabon’s total public sector debt-to-GDP ratio is projected to fall from 61.9 percent in 2004 to 38.5 percent in 2007, 24.4 percent in 2010, and further to 6.8 percent in 2023. Non-oil primary deficit is projected to fall from 7.7 percent in 2004 to 5 percent in 2007, to 4 percent in 2010, and will almost disappear around 2023. The wage bill, as a share of non-oil GDP, is projected to drop from 10.8 percent in 2004 to 9.5 percent in 2007, 8.4 percent in 2010, and further to 5.1 in 2023. Interest payments are projected to fall from 7.1 percent in 2004 to 3.2 percent in 2007, 1.6 percent in 2010, and further to 0.5 percent in 2023.
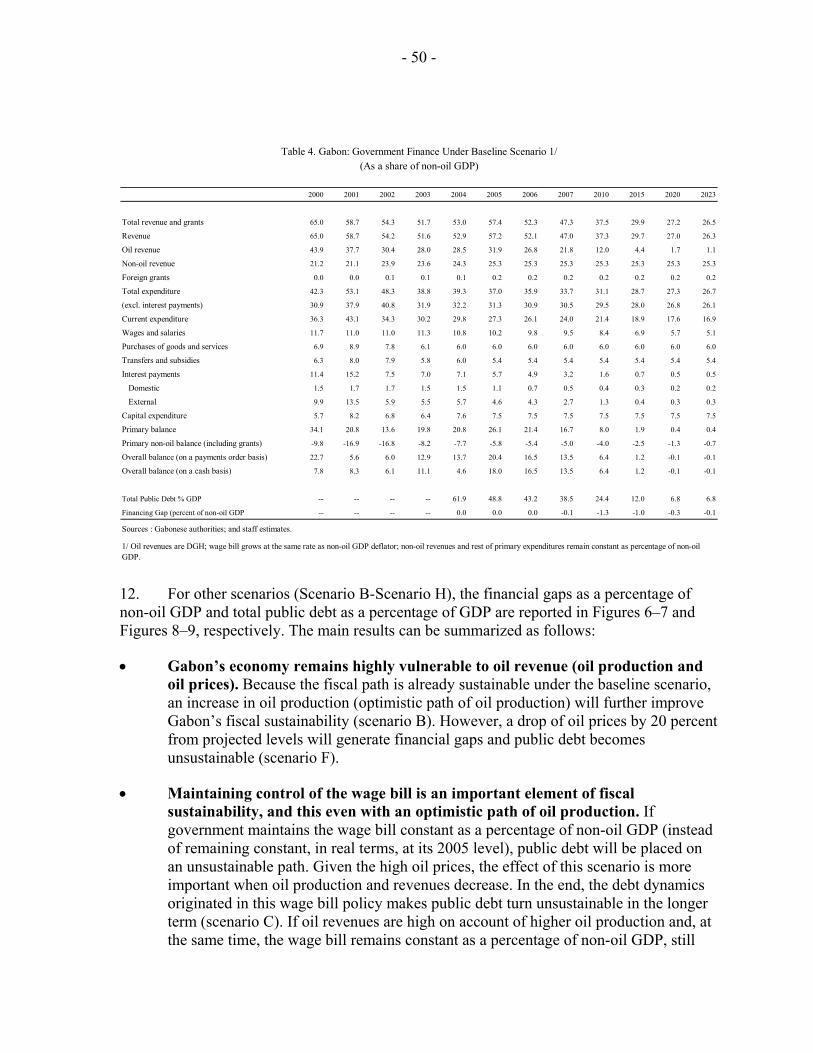
- 50 -
2000 2001 2002 2003 2004 2005 2006 2007 2010 2015 2020 2023
Total revenue and grants 65.0 58.7 54.3 51.7 53.0 57.4 52.3 47.3 37.5 29.9 27.2 26.5
Revenue 65.0 58.7 54.2 51.6 52.9 57.2 52.1 47.0 37.3 29.7 27.0 26.3
Oil revenue 43.9 37.7 30.4 28.0 28.5 31.9 26.8 21.8 12.0 4.4 1.7 1.1
Non-oil revenue 21.2 21.1 23.9 23.6 24.3 25.3 25.3 25.3 25.3 25.3 25.3 25.3
Foreign grants 0.0 0.0 0.1 0.1 0.1 0.2 0.2 0.2 0.2 0.2 0.2 0.2
Total expenditure 42.3 53.1 48.3 38.8 39.3 37.0 35.9 33.7 31.1 28.7 27.3 26.7
(excl. interest payments) 30.9 37.9 40.8 31.9 32.2 31.3 30.9 30.5 29.5 28.0 26.8 26.1
Current expenditure 36.3 43.1 34.3 30.2 29.8 27.3 26.1 24.0 21.4 18.9 17.6 16.9
Wages and salaries 11.7 11.0 11.0 11.3 10.8 10.2 9.8 9.5 8.4 6.9 5.7 5.1
Purchases of goods and services 6.9 8.9 7.8 6.1 6.0 6.0 6.0 6.0 6.0 6.0 6.0 6.0
Transfers and subsidies 6.3 8.0 7.9 5.8 6.0 5.4 5.4 5.4 5.4 5.4 5.4 5.4
Interest payments 11.4 15.2 7.5 7.0 7.1 5.7 4.9 3.2 1.6 0.7 0.5 0.5
Domestic 1.5 1.7 1.7 1.5 1.5 1.1 0.7 0.5 0.4 0.3 0.2 0.2
External 9.9 13.5 5.9 5.5 5.7 4.6 4.3 2.7 1.3 0.4 0.3 0.3
Capital expenditure 5.7 8.2 6.8 6.4 7.6 7.5 7.5 7.5 7.5 7.5 7.5 7.5
Primary balance 34.1 20.8 13.6 19.8 20.8 26.1 21.4 16.7 8.0 1.9 0.4 0.4
Primary non-oil balance (including grants) -9.8 -16.9 -16.8 -8.2 -7.7 -5.8 -5.4 -5.0 -4.0 -2.5 -1.3 -0.7
Overall balance (on a payments order basis) 22.7 5.6 6.0 12.9 13.7 20.4 16.5 13.5 6.4 1.2 -0.1 -0.1
Overall balance (on a cash basis) 7.8 8.3 6.1 11.1 4.6 18.0 16.5 13.5 6.4 1.2 -0.1 -0.1
Total Public Debt % GDP -- -- -- -- 61.9 48.8 43.2 38.5 24.4 12.0 6.8 6.8
Financing Gap (percent of non-oil GDP -- -- -- -- 0.0 0.0 0.0 -0.1 -1.3 -1.0 -0.3 -0.1
Sources : Gabonese authorities; and staff estimates.
1/ Oil revenues are DGH; wage bill grows at the same rate as non-oil GDP deflator; non-oil revenues and rest of primary expenditures remain constant as percentage of non-oil GDP.
Table 4. Gabon: Government Finance Under Baseline Scenario 1/(As a share of non-oil GDP)
12. For other scenarios (Scenario B-Scenario H), the financial gaps as a percentage of non-oil GDP and total public debt as a percentage of GDP are reported in Figures 6–7 and Figures 8–9, respectively. The main results can be summarized as follows:
• Gabon’s economy remains highly vulnerable to oil revenue (oil production and oil prices). Because the fiscal path is already sustainable under the baseline scenario, an increase in oil production (optimistic path of oil production) will further improve Gabon’s fiscal sustainability (scenario B). However, a drop of oil prices by 20 percent from projected levels will generate financial gaps and public debt becomes unsustainable (scenario F).
• Maintaining control of the wage bill is an important element of fiscal sustainability, and this even with an optimistic path of oil production. If government maintains the wage bill constant as a percentage of non-oil GDP (instead of remaining constant, in real terms, at its 2005 level), public debt will be placed on an unsustainable path. Given the high oil prices, the effect of this scenario is more important when oil production and revenues decrease. In the end, the debt dynamics originated in this wage bill policy makes public debt turn unsustainable in the longer term (scenario C). If oil revenues are high on account of higher oil production and, at the same time, the wage bill remains constant as a percentage of non-oil GDP, still
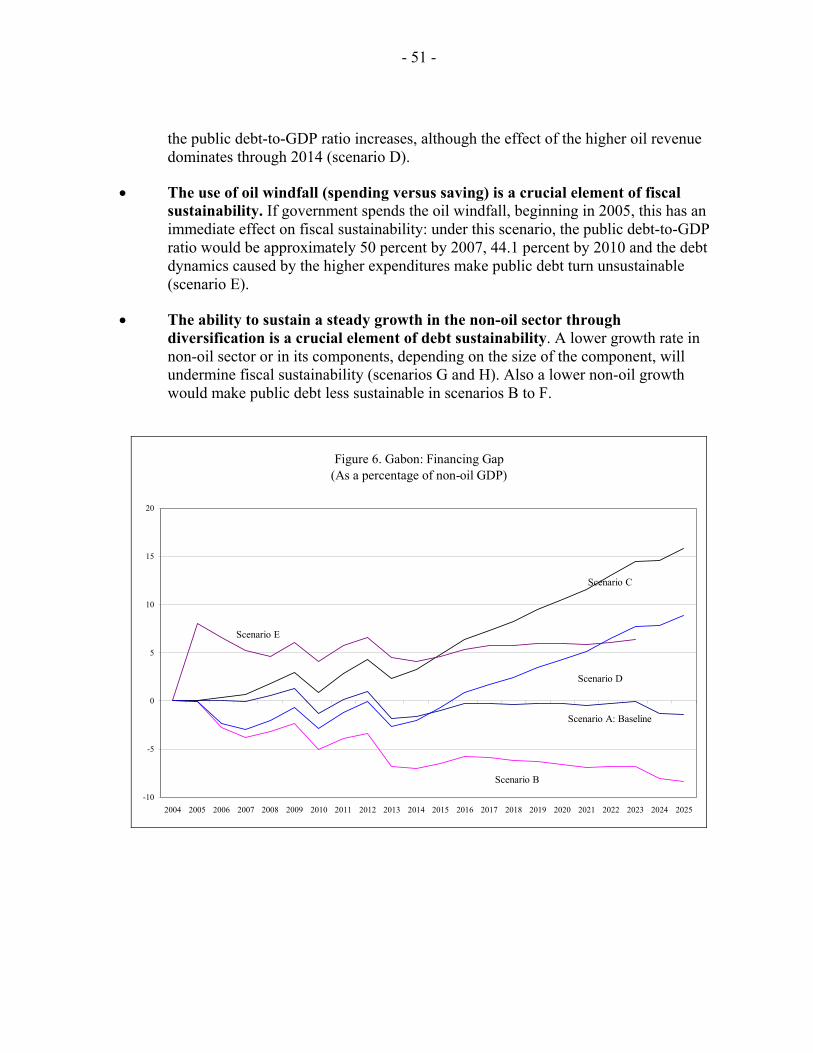
- 51 -
the public debt-to-GDP ratio increases, although the effect of the higher oil revenue dominates through 2014 (scenario D).
• The use of oil windfall (spending versus saving) is a crucial element of fiscal sustainability. If government spends the oil windfall, beginning in 2005, this has an immediate effect on fiscal sustainability: under this scenario, the public debt-to-GDP ratio would be approximately 50 percent by 2007, 44.1 percent by 2010 and the debt dynamics caused by the higher expenditures make public debt turn unsustainable (scenario E).
• The ability to sustain a steady growth in the non-oil sector through diversification is a crucial element of debt sustainability. A lower growth rate in non-oil sector or in its components, depending on the size of the component, will undermine fiscal sustainability (scenarios G and H). Also a lower non-oil growth would make public debt less sustainable in scenarios B to F.
Figure 6. Gabon: Financing Gap(As a percentage of non-oil GDP)
-10
-5
0
5
10
15
20
2004 2005 2006 2007 2008 2009 2010 2011 2012 2013 2014 2015 2016 2017 2018 2019 2020 2021 2022 2023 2024 2025
Scenario B
Scenario A: Baseline
Scenario D
Scenario C
Scenario E
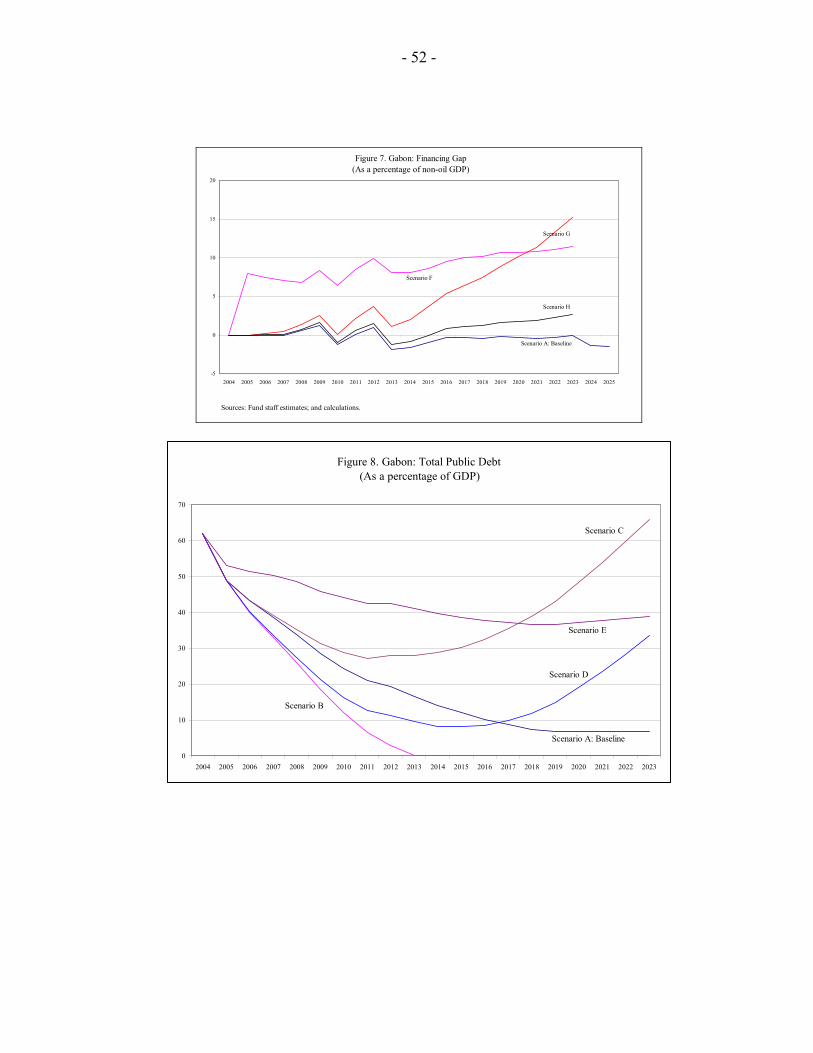
- 52 -
Sources: Fund staff estimates; and calculations.
Figure 7. Gabon: Financing Gap (As a percentage of non-oil GDP)
-5
0
5
10
15
20
2004 2005 2006 2007 2008 2009 2010 2011 2012 2013 2014 2015 2016 2017 2018 2019 2020 2021 2022 2023 2024 2025
Scenario F
Scenario A: Baseline
Scenario H
Scenario G
Figure 8. Gabon: Total Public Debt
(As a percentage of GDP)
0
10
20
30
40
50
60
70
2004 2005 2006 2007 2008 2009 2010 2011 2012 2013 2014 2015 2016 2017 2018 2019 2020 2021 2022 2023
Scenario B
Scenario A: Baseline
Scenario D
Scenario C
Scenario E
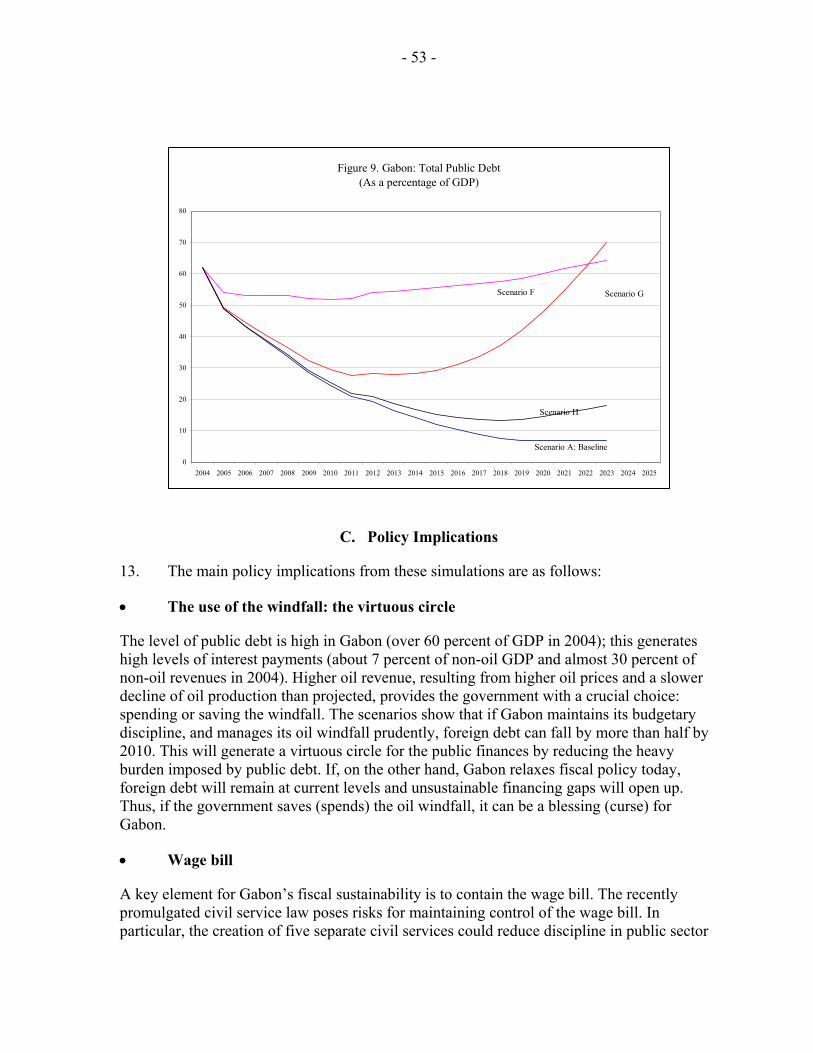
- 53 -
C. Policy Implications
13. The main policy implications from these simulations are as follows:
• The use of the windfall: the virtuous circle
The level of public debt is high in Gabon (over 60 percent of GDP in 2004); this generates high levels of interest payments (about 7 percent of non-oil GDP and almost 30 percent of non-oil revenues in 2004). Higher oil revenue, resulting from higher oil prices and a slower decline of oil production than projected, provides the government with a crucial choice: spending or saving the windfall. The scenarios show that if Gabon maintains its budgetary discipline, and manages its oil windfall prudently, foreign debt can fall by more than half by 2010. This will generate a virtuous circle for the public finances by reducing the heavy burden imposed by public debt. If, on the other hand, Gabon relaxes fiscal policy today, foreign debt will remain at current levels and unsustainable financing gaps will open up. Thus, if the government saves (spends) the oil windfall, it can be a blessing (curse) for Gabon.
• Wage bill
A key element for Gabon’s fiscal sustainability is to contain the wage bill. The recently promulgated civil service law poses risks for maintaining control of the wage bill. In particular, the creation of five separate civil services could reduce discipline in public sector
Figure 9. Gabon: Total Public Debt (As a percentage of GDP)
0
10
20
30
40
50
60
70
80
2004 2005 2006 2007 2008 2009 2010 2011 2012 2013 2014 2015 2016 2017 2018 2019 2020 2021 2022 2023 2024 2025
Scenario F
Scenario A: Baseline
Scenario H
Scenario G
- 54 -
hiring and remuneration decisions. To have its full impact, implementing decrees and a number of complementary laws need to be passed. These decrees and laws should provide instruments for the government to contain the wage bill. However, if the new civil service law inflates the wage bill, there would be serious risks for public debt sustainability.
• Non-oil revenue mobilization
In the scenarios we assumed that non-oil revenue remains constant as a share of non-oil GDP (that is, it grows at the same rate as the non-oil GDP). This does not mean that there is an unchanged tax effort. Indeed, some non-oil revenues are related to oil activities (e.g., taxes on wages for employees in oil companies; tax revenues from consumption by expatriates working in oil companies, etc). These revenues will decrease with the decline of oil production, raising pressures on other non-oil revenue to be constant as a percentage of non-oil GDP. Thus, government should maintain and enhance its tax effort. In this regard, a fund technical assistance report on tax policy and administration made a number of key recommendations. Many of them still have to be implemented:33
(i) streamlining of tax incentives and elimination of discretionary exemptions granted to specific businesses;
(ii) simplifying the structure of VAT and limiting exemptions;
(iii) strengthening the recovery of tax arrears, particularly VAT and forestry taxes; and
(iv) modernizing tax administration, including transferring all tax collection responsibilities from the Treasury to the Direction Générale des Impôts (DGI); increasing the number of tax auditors, and widening the coverage of tax audits.
14. The report also recommended the creation of a Large Taxpayers Unit (LTU). The decree establishing the LTU (Direction des Grandes Entreprises, DGE) in the tax directorate was adopted in September 2004. The DGE will begin its operations in 2005 and is expected to be fully operational during 2006. The task is now to make the DGE effective in enhancing revenue mobilization.
• Public expenditure management
Given the limited scope for increasing non-oil revenue, the core of fiscal adjustment is to contain public expenditures and enhance their efficiency. In this regard, a second technical assistance report34 contains many valuable suggestions that are still to be put into practice,
33 Benon, Olivier, Eric Lesprit, Maureen Kidd and Alain Jousten, February 2004, Gabon: “Amélioration du Système Fiscal et Modernisation de la Direction Générale des Impôts” (Washington : International Monetary Fund). 34 Hélis, Jean Luc, July 2004, “Gabon: Proposition pour une Amélioration de la Gestion Budgétaire,” (Washington: International Monetary Fund).
- 55 -
covering budget preparation, budget execution, and sound public accounting practices. Important priorities in the public expenditure management area include:
(i) integration of all special funds in the budget;
(ii) clarification on the division of responsibilities, and separation of functions, between the DGST (Treasury) and the DGCP (General Public Accounting Department);
(iii) enhancing the management of public investment. A large part of capital spending should be integrated into current expenditure. The investment budget needs to focus on true development projects; and
(iv) the establishment, over the medium term, of a medium-term expenditure framework.
D. Conclusion
15. Gabon faces huge medium term fiscal constraints imposed by the expected steady decline in oil production and its depletion in about 25 years. Clearly, a sustainable fiscal path needs (i) to maintain both tax effort and control of public expenditure, and (ii) to foster sustainable growth in the non-oil sector through diversification.
- 56 -
References
Benon, Olivier, Eric Lesprit, Maureen Kidd, and Alain Jousten, February 2004, “Gabon: Amélioration du Système Fiscal et Modernisation de la Direction Générale des Impôts,” (Washington: International Monetary Fund).
Hélis, Jean Luc, July 2004, Gabon: “Proposition pour une Amélioration de la Gestion Budgétaire,” (Washington: International Monetary Fund).
Keen, Michael and Alejandro Simone, (2004), “Tax policy in Developing Countries: Some Lessons from the 1990s, and Some Challenges Ahead,” in Sanjeev Gupta, Ben Clements, and Gabriela Inchauste (eds): Helping Countries Develop: The Role of the Fiscal Policy, (Washington: International Monetary Fund).
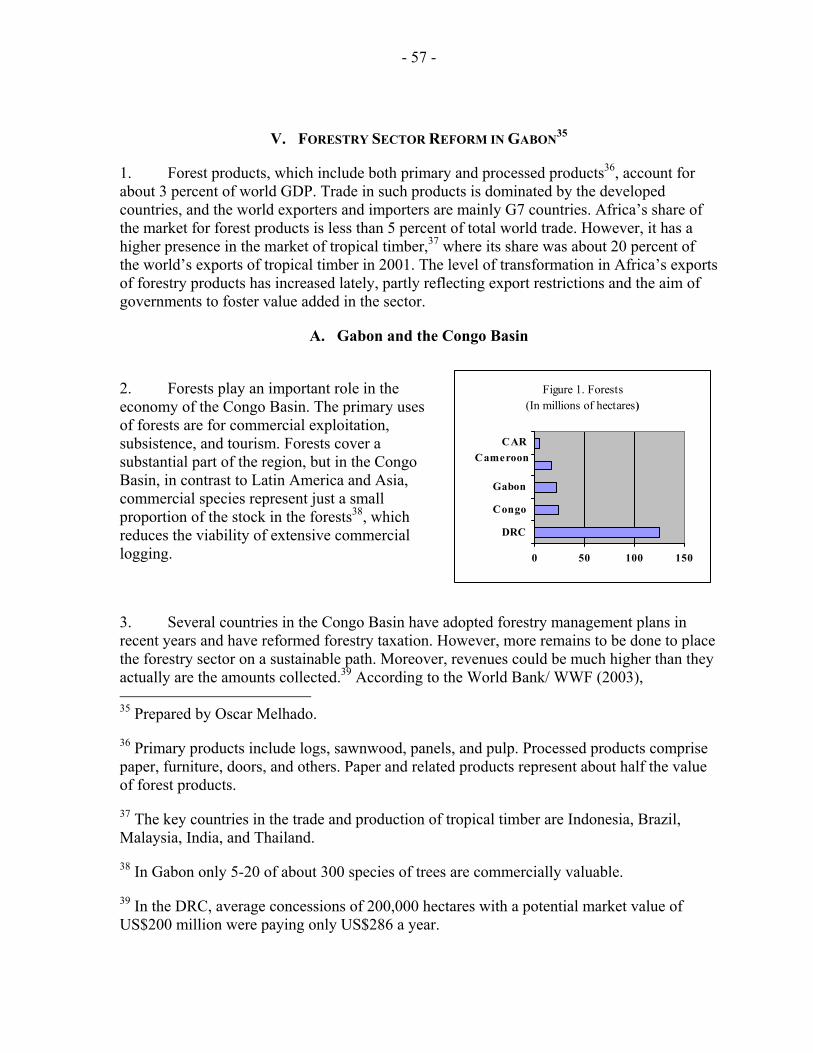
- 57 -
Figure 1. Forests (In millions of hectares)
0 50 100 150
DRC
Congo
Gabon
CameroonCAR
V. FORESTRY SECTOR REFORM IN GABON35
1. Forest products, which include both primary and processed products36, account for about 3 percent of world GDP. Trade in such products is dominated by the developed countries, and the world exporters and importers are mainly G7 countries. Africa’s share of the market for forest products is less than 5 percent of total world trade. However, it has a higher presence in the market of tropical timber,37 where its share was about 20 percent of the world’s exports of tropical timber in 2001. The level of transformation in Africa’s exports of forestry products has increased lately, partly reflecting export restrictions and the aim of governments to foster value added in the sector.
A. Gabon and the Congo Basin
2. Forests play an important role in the economy of the Congo Basin. The primary uses of forests are for commercial exploitation, subsistence, and tourism. Forests cover a substantial part of the region, but in the Congo Basin, in contrast to Latin America and Asia, commercial species represent just a small proportion of the stock in the forests38, which reduces the viability of extensive commercial logging.
3. Several countries in the Congo Basin have adopted forestry management plans in recent years and have reformed forestry taxation. However, more remains to be done to place the forestry sector on a sustainable path. Moreover, revenues could be much higher than they actually are the amounts collected.39 According to the World Bank/ WWF (2003), 35 Prepared by Oscar Melhado.
36 Primary products include logs, sawnwood, panels, and pulp. Processed products comprise paper, furniture, doors, and others. Paper and related products represent about half the value of forest products.
37 The key countries in the trade and production of tropical timber are Indonesia, Brazil, Malaysia, India, and Thailand.
38 In Gabon only 5-20 of about 300 species of trees are commercially valuable.
39 In the DRC, average concessions of 200,000 hectares with a potential market value of US$200 million were paying only US$286 a year.
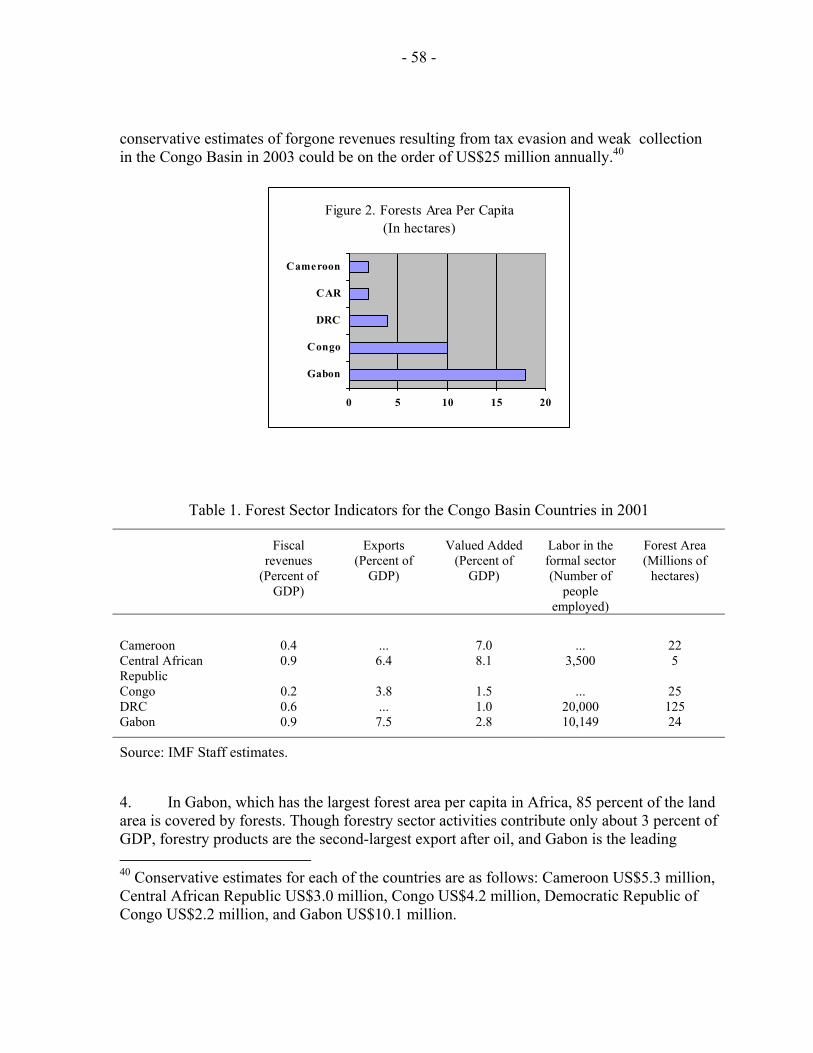
- 58 -
conservative estimates of forgone revenues resulting from tax evasion and weak collection in the Congo Basin in 2003 could be on the order of US$25 million annually.40
Table 1. Forest Sector Indicators for the Congo Basin Countries in 2001
Fiscal revenues
(Percent of GDP)
Exports (Percent of
GDP)
Valued Added (Percent of
GDP)
Labor in the formal sector (Number of
people employed)
Forest Area (Millions of
hectares)
Cameroon 0.4 ... 7.0 ... 22 Central African Republic
0.9 6.4 8.1 3,500 5
Congo 0.2 3.8 1.5 ... 25 DRC 0.6 ... 1.0 20,000 125 Gabon 0.9 7.5 2.8 10,149 24
Source: IMF Staff estimates.
4. In Gabon, which has the largest forest area per capita in Africa, 85 percent of the land area is covered by forests. Though forestry sector activities contribute only about 3 percent of GDP, forestry products are the second-largest export after oil, and Gabon is the leading 40 Conservative estimates for each of the countries are as follows: Cameroon US$5.3 million, Central African Republic US$3.0 million, Congo US$4.2 million, Democratic Republic of Congo US$2.2 million, and Gabon US$10.1 million.
Figure 2. Forests Area Per Capita (In hectares)
0 5 10 15 20
Gabon
Congo
DRC
CAR
Cameroon
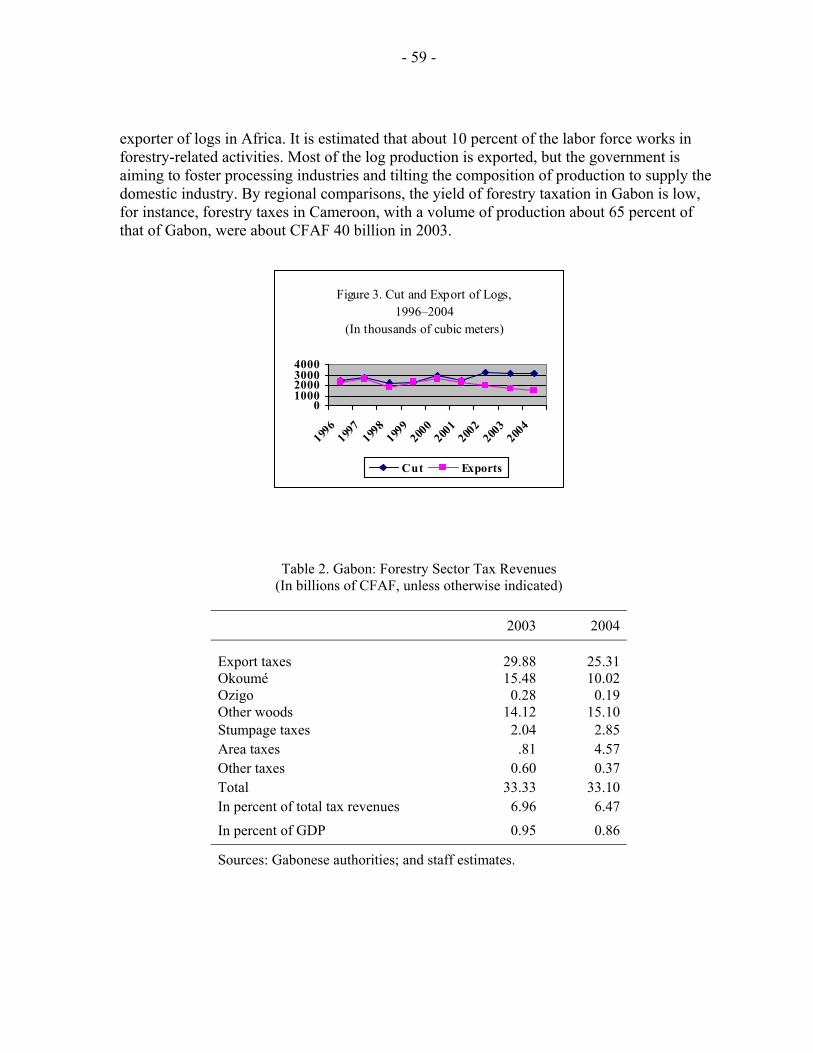
- 59 -
exporter of logs in Africa. It is estimated that about 10 percent of the labor force works in forestry-related activities. Most of the log production is exported, but the government is aiming to foster processing industries and tilting the composition of production to supply the domestic industry. By regional comparisons, the yield of forestry taxation in Gabon is low, for instance, forestry taxes in Cameroon, with a volume of production about 65 percent of that of Gabon, were about CFAF 40 billion in 2003.
Table 2. Gabon: Forestry Sector Tax Revenues (In billions of CFAF, unless otherwise indicated)
2003 2004 Export taxes Okoumé Ozigo Other woods
29.88 15.48 0.28
14.12
25.31 10.02 0.19
15.10 Stumpage taxes 2.04 2.85 Area taxes .81 4.57 Other taxes 0.60 0.37 Total 33.33 33.10 In percent of total tax revenues 6.96 6.47 In percent of GDP 0.95 0.86
Sources: Gabonese authorities; and staff estimates.
Figure 3. Cut and Export of Logs, 1996–2004
(In thousands of cubic meters)
01000200030004000
1996
1997
1998
1999
2000
2001
2002
2003
2004
Cut Exports
- 60 -
B. Reform Objectives in the Congo Basin
5. The overall objectives of forestry sector reform in the Congo Basin are to make the management of forest resources sustainable; improve the business and investment climate; put in place a tax system that is simple, transparent, and equitable; and ensure an equitable sharing of forestry rents among private entrepreneurs, the government, and local communities. Cameroon is the country that has made the most progress in achieving these objectives. 41
6. The forestry sector in Gabon, as in most of the Congo Basin countries, is largely undeveloped and, if managed in a sustainable manner, could be a considerable source of growth. Given the increasing demand from international markets for both logs and processed products from the region, the development of the sector should be designed to protect the resource and should address the following issues:
• Source of fiscal revenues. Currently, forestry revenues represent a relatively minor proportion of tax revenues. This may be due to inefficiently designed tax systems, weak compliance, and governance problems. Revenues derived in the sector could contribute substantially to the budget. With the adoption of better-designed systems, strengthened tax administration, and reduction of corruption, revenues from the forest sector would contribute to resource mobilization. The area tax, with concessions allocated through a public auction system, is becoming the best practice in the region.
• Export earnings. The sector is increasingly positioning itself as the second-largest export after oil in some of the central African countries. Forest products have potentials on account of the increasing demand for tropical logs and processed products from Asian and European markets and the relative abundance of the resource in the region.
• Labor markets. The industry is labor-intensive, and a considerable proportion of the labor force is employ in the sector, not to mention the segment of the population that depends on the forest for subsistence. A well-developed sector could become a leading employer not only in logging and processing, but also in forest management and tourism.
41 The most important tax in Cameroon is the area tax, followed by the stumpage tax, and tax and surcharges on log exports. Local communities receive a share of US$1.40 per m³ of the area tax. With World Bank assistance, Cameroon reformed the area tax, introducing a system of allocating concession through public auctions. The amount of tax to be paid is the bidding parameter during the auction. The new system based on auctions makes available the information to the public and guarantees that new permit holders adopt management plans.
- 61 -
• Domestic activity. A processing industry with additional value added generation could be developed. Most of the governments are aiming to this by adopting bans on the export of logs and taxing logs exports at higher rates. Processing industries are expanding under preferential treatment.
C. Gabon’s Forestry Reform Agenda
7. Following many years of almost unregulated exploitation of its forest, Gabon initiated in 2001 a comprehensive process of reform geared towards protection and sustainable management of its forestry resources. To this end, three important measures were implemented, which defined the institutional and legal frameworks, the vision of reform, and guarantee the protection and sustainable use of the forests:
• The approval in 2001 of a new Forestry Code. The key objectives of the Code are to place forests under sustainable management plans,42 to establish a taxation system that provide incentives for the sustainable management of the forests, and to promote a local transformation industry.
• The creation of a system of national parks. In 2002, Gabon approved an initiative to establish a system of 13 national parks (3 million hectares, or about 10.6 percent of the country’s area).
• The approval of a letter of development of the forestry sector in 2004. The letter prepared in consultation with the World bank lays out an agenda for reform, with measures to cope with some of the key obstacles for reaching the objectives of sustainable management.
Sustainable management and concessions
8. The new forestry Code divides the forestry domain in rural and permanent domain of the state. The rural domain comprises the community forests and other forests for use of the municipalities and represent about 8 million hectares. Community forests are subject to exploitation for commercial utilization. Though the law establishes simplified mandatory management plans, in practice these have not been enforced. In addition, local communities have been granted preferential treatment, exempting owners of permits in the rural domain from paying stumpage and other taxes.
9. The permanent domain of the state comprises all the areas that are subject to mandatory management plans, which represent about 14 to 16 million of hectares. The 42 A management plan is a planning program for an area with an horizon of at least 20 years. It establishes a pace of felling to guarantee the sustainability of the resource. It includes an inventory of the stock, a zoning map defining the annual areas for felling and the principal roads, the duration of the rotation, and the delimitation of the exploitation units.
- 62 -
forestry code established end of 2005 as deadline to adopt management plans, which would not be achieved, as of today less than 50 percent of the permanent domain of the state is under forestry management plans.43 The areas subject to management plan consist of protected areas including recreational areas,44 where no exploitation is allowed, and the productive areas where most of the logging takes place. The productive areas encompass three type of exploitation and permits associated. First, big forestry concessions under sustainable management (CFAD), where the area under concession is in a range from 50,000 to 200,000 hectares with a limit of 600,000 hectares by owner; in addition, the concessions are associated to a unit of transformation. This concession could be granted to foreign investors, provided the submission of a management plan. Second, medium size concessions or associated forestry permits (PFA), which are granted exclusively to nationals. The maximum area is 15,000 hectares and must be associated to a CFAD; however, if a management plan is submitted the extension could be up to 50,000 hectares. Third, the good faith permits (gré à gré), these are permits allocated only to nationals with relatively small areas, which are managed by the government. Owners of these permits are obliged to sell their production to a transformation industry.
10. A key issue has been the allocation mechanism of the permits. The World Bank in the context of the preparation of the letter of development policy in first half of 2004 advocated (i) a moratorium in the allocation of the gré à gré permits until a transparent mechanism is in place. A decree adopting the moratorium was signed on October 9, 2004; (ii) public information, including information on the holders of the permits, to this end the government published in February 2005 on the web page of the Ministry of Economy and Finance a list of the permit holders; and (iii) a system of auction to allocate concessions. The government is currently assessing how to implement an auction system and is looking at the way it is done in Cameroon.
Forestry taxation
11. Just until recently, Gabon had a cumbersome system of forestry taxation, with at least 20 different taxes and fees burdening the sector activities, particularly exports. In addition, a timber marketing board (SNBG) had the monopoly of the exports of the two principal varieties of timber, Okoumé and Ozigo, and charged a fee on exports to finance its operations. The government took in December 2004 the decision to eliminate the monopoly of the timber marketing board (SNBG)45 in international commercialization of Okoumé and
43 Only the big companies, mainly foreign owned have adopted management plans. These include, Compagnie Equatoriale de Gabon (CEB) Thanry, SBL, Rougier Gabon, Leroy Gabon, and SHM. 44 Includes the system of 13 national parks. 45 The government had 51 percent of participation and the rest was owned by several producers.
- 63 -
Ozigo. The decree approved establishing a period of transition, in which the SNBG will downsize its operations and will transform itself in an institution with functions of surveillance and control of the forestry sector. With this decision, the fees which amounted to about 10 percent of the sale prices and which were borne by the private sector will be abolished. Following lengthy negotiations between the government and forestry companies, in 2004 a reform reduced the taxes to three:
• An area tax, based on the size of the concession. This tax was previously differentiated by zone, with the rate varying accordingly: Zone A CFAF 20 per hectare, Zone B CFAF 12, Zone C CFAF 8, and Zone D CFAF 4. The new tax is based only on the size of the concession and was set at CFAF 600 per hectare. This tax exempts most of the permits in the rural domain. A transitory provision allows concessions under sustainable management plans to reduce their tax obligation by 50 percent.
• A stumpage tax, based on the value of the logged timber. The rate varies in a range from 2.6 percent to 7.7 according to the zone in where the tree is located to reflect costs associated with difficulties of exploitation. The incentive is to reduce waste and to facilitate the valuation of the real cost of the activity. The tax exempts the special permits and family exploitations and discriminates between logs for exports (the tax base is calculated by subtracting 15 percent of the price of the log) and logs for domestic processing (the tax base is calculated by subtracting 60 percent of the price of the log).
• An export tax on logs of 17 percent, with the rate lowered from the level set in 2002 of 22 percent. Processed exports are exempted.
12. A gradual phasing out of the export tax on logs has been advocated as it distorts incentives, penalizing exports in favor of domestic transformation. The most appropriate instrument for achieving the sustainable management objective is the area tax as the stumpage tax is difficult to administer. The stumpage tax is still far away of its original target of about CFAF 7 to 8 billion annually, and even farther of compensating the export tax revenues. The exemptions of the stumpage tax introduce distortions, which make difficult its consolidation and the phasing out of the export tax.46
46 For instance, if the same base is applied to both taxes the taxation is different on account of (i) the rate of the export tax is 17 percent and the rate of the stumpage tax varies from 3 percent to 9; (ii) permits in the rural domain are exonerated from the stumpage tax but pay the export tax; and (iii) the export tax considers the full value of the log while the stumpage tax has an exemption of 15 percent if the log is exported and 60 percent if the log is used for domestic transformation.
- 64 -
13. Gabon is currently consolidating the recently implemented tax reform. Main actions include the recovery of tax arrears from the area and stumpage taxes and the enforcement of the payment of the stumpage tax particularly from logs utilized in domestic processing. In a further stage it is envisaged the gradual phase out of the export tax and the strengthening of the area tax as the main source of revenue.
The bias toward domestic transformation
14. As expressed in the Forestry Code, the government aims to process 75 percent of total production domestically by 2012. This is not new, as over the years Gabon has intended to develop a domestic processing industry. However, with the approval of the Forestry Code, not only the government reassured the intention of developing a domestic processing industry, but also established a set of fiscal benefits that granted more incentives to processing. Those incentives include an exemption of the stumpage tax of 60 percent of the price of the log, a full exemption of the export tax, devolution of the value added tax paid on inputs for processed exports. Furthermore, as explained above, the permits for forestry production are mandatory associated with domestic processing units.
15. Distortions introduced, have indeed increased the rate of domestic transformation, but have generated at least three costs: (i) a revenue losses for the government; (ii) a bias against the export of logs; (iii) efficiency losses in the economy as some new enterprises coming on line could not be competitive.47
D. Next Steps
16. The future of the reform for Gabon’s forestry sector should take into account the following factors:
• To ensure the sustainable exploitation of Gabon’s forests it is crucial to consolidate the system of national parks and other protected areas; and to enforce the adoption of sustainable management plans in the productive and the rural domains. The consolidation of the national parks and other protected areas requires approval of the law, 48 which would provide the legal framework for the national parks, protecting the biodiversity of their surroundings and defining new protected areas.
• Regarding forestry taxation, in the short term the 2004 reform should be consolidated, a second stage of reform should aim at removing distortions and increasing tax revenues. The consolidation of the tax reform encompasses the recovery of 47 An indicator that could be associated with some competitiveness problems in the transformation industry is that at end-2004 most of the portfolio of nonperforming loans of the commercial banks were credits to wood transformation industries.
48 The draft law has received comments from the World Bank.
- 65 -
tax arrears from the area and stumpage taxes and the enforcement of the payment of the stumpage tax, particularly on logs used in domestic processing. The second stage should be geared toward the gradual phase-out of the export tax and the strengthening of the area tax as main source of revenue. The stumpage tax should also be strengthened.
• New permits should be allocated through an auction system. The current system for allocating permits lacks transparency. The experiences of other countries have shown that competitive bidding is the easiest method for identifying the proper rents. An allocation system based on auctions would make information available to the public and guarantee that new permit holders adopt management plans.
• The government should avoid picking winners and losers in the forestry sector. Developing the sector should be framed in the overall objective of diversifying the economy. To this end, measures to benefit the sector are those that reduce its transaction costs, for instance, eliminating the monopoly of the transport syndicate and eliminating additional surcharges, like the 1.5 percent fee charged by customs for entering information in the computer system. Fiscal incentives should be considered on general treatment to investment across sectors in the economy, for example accelerated depreciation under the corporate income tax.
• On the transformation of the SNBG, it is important to guarantee that the transformed SNBG, which is envisaged to have limited control functions, be significantly downsized. The reformed SNBG should not be financed by the private sector and should be limited to reinforce activities of the ministries of forestry, taxes, and customs.
- 66 -
Bibliography
Christy, Patrice, Roland Jaffré, Omer Ntougo, and Chris Wilks, 2003, “La forêt et la filière bois au Gabon,” Multipress-Gabon.
Ministère des eaux et forêts, 2002, “Code forestier,” (Gabon).
World Bank/ WWF, 2003, “Forest Law Enforcement in Selected African Countries,” (Switzerland).
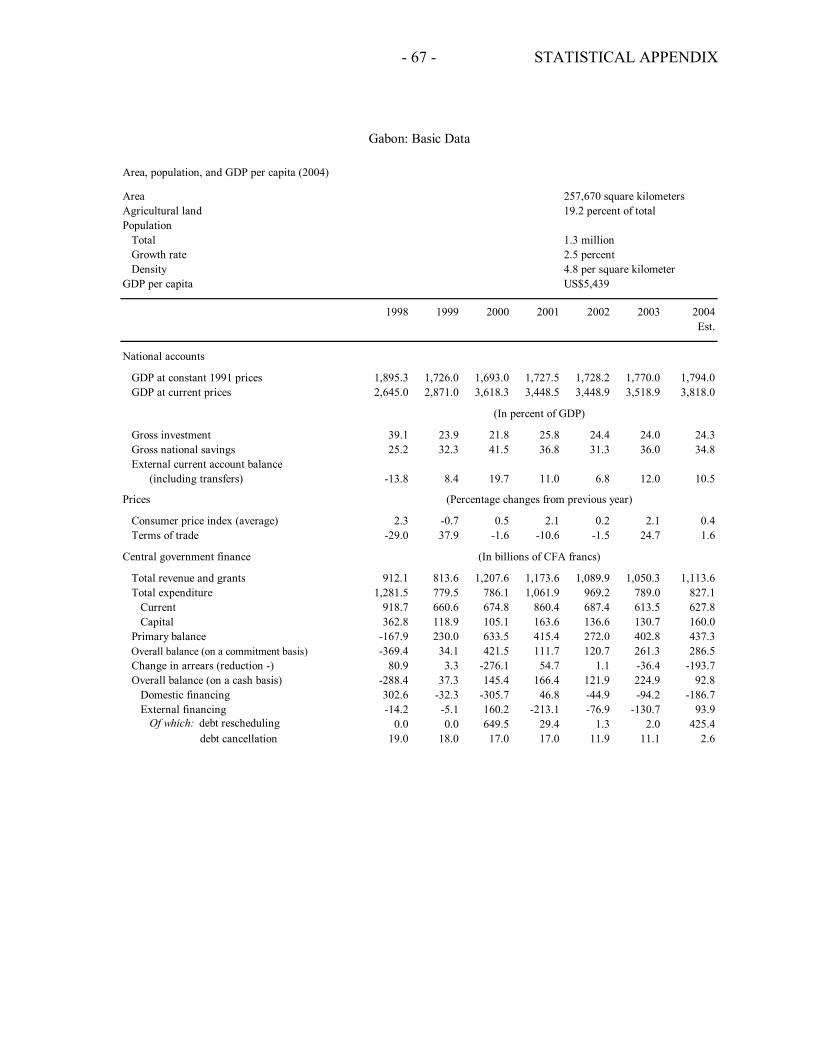
STATISTICAL APPENDIX
- 67 -
Area, population, and GDP per capita (2004)
Area 257,670 square kilometersAgricultural land 19.2 percent of totalPopulation
Total 1.3 million Growth rate 2.5 percentDensity 4.8 per square kilometer
GDP per capita US$5,439
1998 1999 2000 2001 2002 2003 2004Est.
National accounts
GDP at constant 1991 prices 1,895.3 1,726.0 1,693.0 1,727.5 1,728.2 1,770.0 1,794.0GDP at current prices 2,645.0 2,871.0 3,618.3 3,448.5 3,448.9 3,518.9 3,818.0
Gross investment 39.1 23.9 21.8 25.8 24.4 24.0 24.3Gross national savings 25.2 32.3 41.5 36.8 31.3 36.0 34.8External current account balance
(including transfers) -13.8 8.4 19.7 11.0 6.8 12.0 10.5
Prices
Consumer price index (average) 2.3 -0.7 0.5 2.1 0.2 2.1 0.4Terms of trade -29.0 37.9 -1.6 -10.6 -1.5 24.7 1.6
Central government finance
Total revenue and grants 912.1 813.6 1,207.6 1,173.6 1,089.9 1,050.3 1,113.6Total expenditure 1,281.5 779.5 786.1 1,061.9 969.2 789.0 827.1
Current 918.7 660.6 674.8 860.4 687.4 613.5 627.8Capital 362.8 118.9 105.1 163.6 136.6 130.7 160.0
Primary balance -167.9 230.0 633.5 415.4 272.0 402.8 437.3Overall balance (on a commitment basis) -369.4 34.1 421.5 111.7 120.7 261.3 286.5Change in arrears (reduction -) 80.9 3.3 -276.1 54.7 1.1 -36.4 -193.7Overall balance (on a cash basis) -288.4 37.3 145.4 166.4 121.9 224.9 92.8
Domestic financing 302.6 -32.3 -305.7 46.8 -44.9 -94.2 -186.7External financing -14.2 -5.1 160.2 -213.1 -76.9 -130.7 93.9
Of which: debt rescheduling 0.0 0.0 649.5 29.4 1.3 2.0 425.4 debt cancellation 19.0 18.0 17.0 17.0 11.9 11.1 2.6
Gabon: Basic Data
(In percent of GDP)
(Percentage changes from previous year)
(In billions of CFA francs)
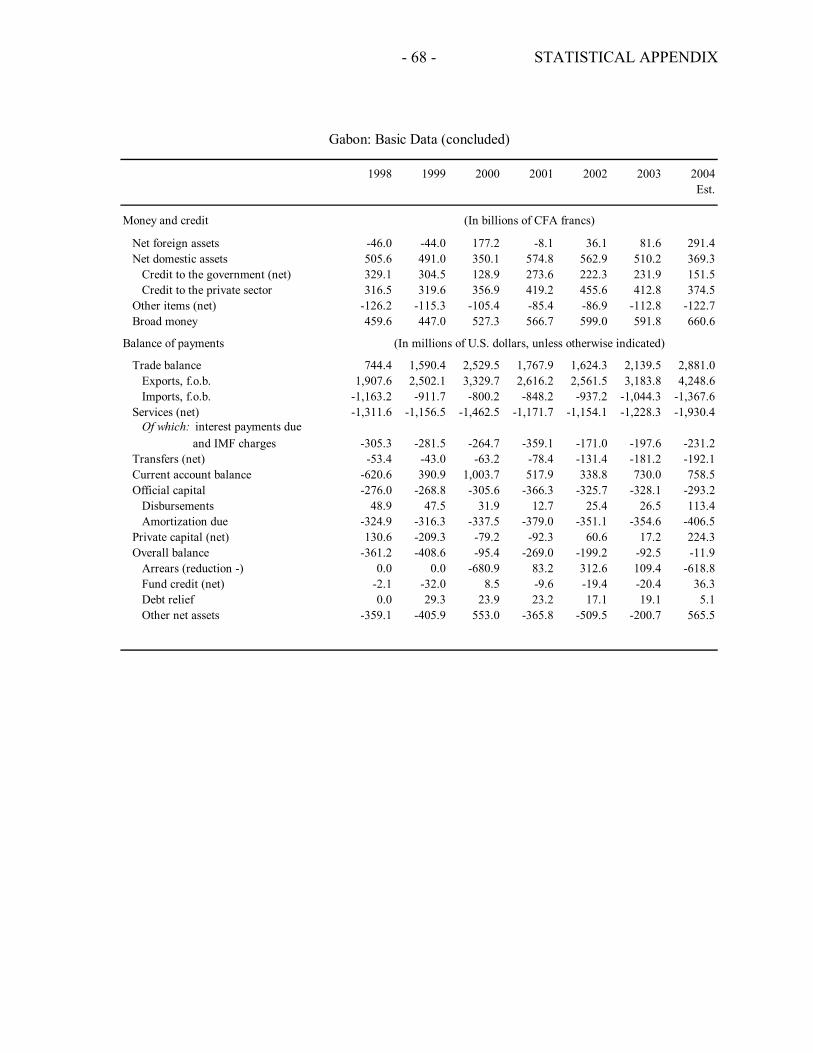
STATISTICAL APPENDIX
- 68 -
1998 1999 2000 2001 2002 2003 2004Est.
Money and credit
Net foreign assets -46.0 -44.0 177.2 -8.1 36.1 81.6 291.4Net domestic assets 505.6 491.0 350.1 574.8 562.9 510.2 369.3
Credit to the government (net) 329.1 304.5 128.9 273.6 222.3 231.9 151.5Credit to the private sector 316.5 319.6 356.9 419.2 455.6 412.8 374.5
Other items (net) -126.2 -115.3 -105.4 -85.4 -86.9 -112.8 -122.7Broad money 459.6 447.0 527.3 566.7 599.0 591.8 660.6
Balance of payments
Trade balance 744.4 1,590.4 2,529.5 1,767.9 1,624.3 2,139.5 2,881.0Exports, f.o.b. 1,907.6 2,502.1 3,329.7 2,616.2 2,561.5 3,183.8 4,248.6Imports, f.o.b. -1,163.2 -911.7 -800.2 -848.2 -937.2 -1,044.3 -1,367.6
Services (net) -1,311.6 -1,156.5 -1,462.5 -1,171.7 -1,154.1 -1,228.3 -1,930.4Of which: interest payments due
and IMF charges -305.3 -281.5 -264.7 -359.1 -171.0 -197.6 -231.2Transfers (net) -53.4 -43.0 -63.2 -78.4 -131.4 -181.2 -192.1Current account balance -620.6 390.9 1,003.7 517.9 338.8 730.0 758.5Official capital -276.0 -268.8 -305.6 -366.3 -325.7 -328.1 -293.2
Disbursements 48.9 47.5 31.9 12.7 25.4 26.5 113.4Amortization due -324.9 -316.3 -337.5 -379.0 -351.1 -354.6 -406.5
Private capital (net) 130.6 -209.3 -79.2 -92.3 60.6 17.2 224.3Overall balance -361.2 -408.6 -95.4 -269.0 -199.2 -92.5 -11.9
Arrears (reduction -) 0.0 0.0 -680.9 83.2 312.6 109.4 -618.8Fund credit (net) -2.1 -32.0 8.5 -9.6 -19.4 -20.4 36.3Debt relief 0.0 29.3 23.9 23.2 17.1 19.1 5.1Other net assets -359.1 -405.9 553.0 -365.8 -509.5 -200.7 565.5
Gabon: Basic Data (concluded)
(In millions of U.S. dollars, unless otherwise indicated)
(In billions of CFA francs)
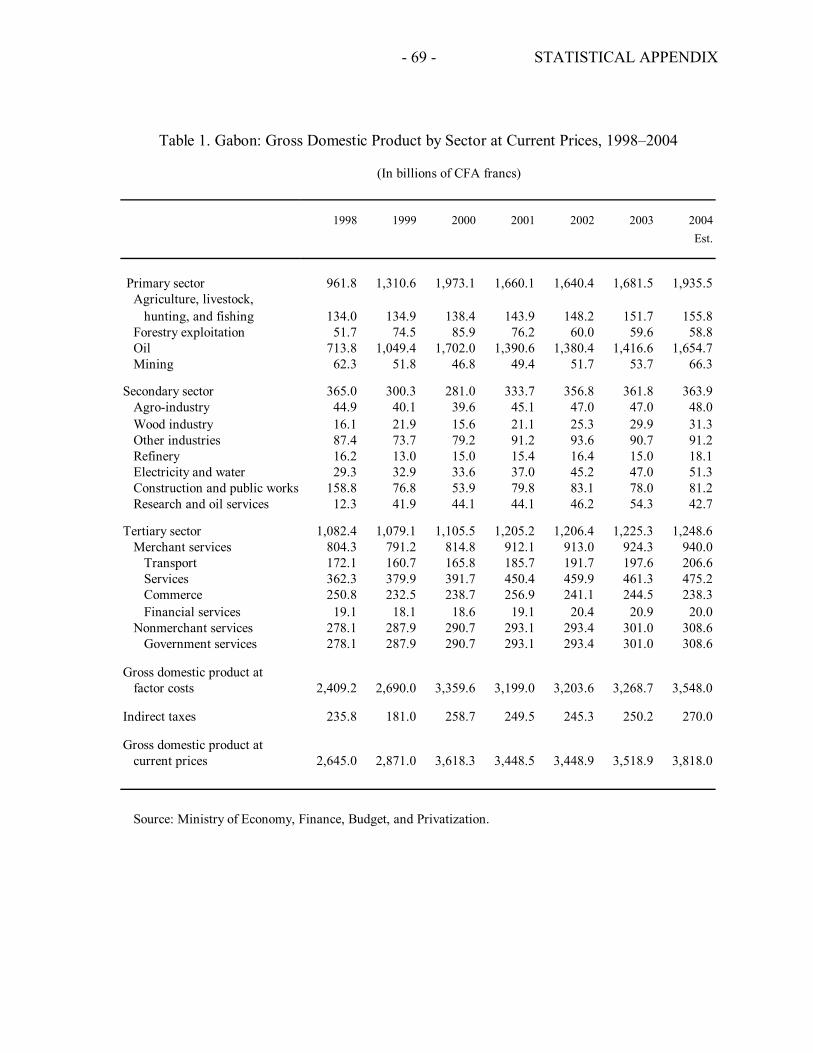
STATISTICAL APPENDIX
- 69 -
(In billions of CFA francs)
1998 1999 2000 2001 2002 2003 2004Est.
Primary sector 961.8 1,310.6 1,973.1 1,660.1 1,640.4 1,681.5 1,935.5Agriculture, livestock,
hunting, and fishing 134.0 134.9 138.4 143.9 148.2 151.7 155.8Forestry exploitation 51.7 74.5 85.9 76.2 60.0 59.6 58.8Oil 713.8 1,049.4 1,702.0 1,390.6 1,380.4 1,416.6 1,654.7Mining 62.3 51.8 46.8 49.4 51.7 53.7 66.3
Secondary sector 365.0 300.3 281.0 333.7 356.8 361.8 363.9Agro-industry 44.9 40.1 39.6 45.1 47.0 47.0 48.0Wood industry 16.1 21.9 15.6 21.1 25.3 29.9 31.3Other industries 87.4 73.7 79.2 91.2 93.6 90.7 91.2Refinery 16.2 13.0 15.0 15.4 16.4 15.0 18.1Electricity and water 29.3 32.9 33.6 37.0 45.2 47.0 51.3Construction and public works 158.8 76.8 53.9 79.8 83.1 78.0 81.2Research and oil services 12.3 41.9 44.1 44.1 46.2 54.3 42.7
Tertiary sector 1,082.4 1,079.1 1,105.5 1,205.2 1,206.4 1,225.3 1,248.6Merchant services 804.3 791.2 814.8 912.1 913.0 924.3 940.0
Transport 172.1 160.7 165.8 185.7 191.7 197.6 206.6Services 362.3 379.9 391.7 450.4 459.9 461.3 475.2Commerce 250.8 232.5 238.7 256.9 241.1 244.5 238.3Financial services 19.1 18.1 18.6 19.1 20.4 20.9 20.0
Nonmerchant services 278.1 287.9 290.7 293.1 293.4 301.0 308.6Government services 278.1 287.9 290.7 293.1 293.4 301.0 308.6
Gross domestic product atfactor costs 2,409.2 2,690.0 3,359.6 3,199.0 3,203.6 3,268.7 3,548.0
Indirect taxes 235.8 181.0 258.7 249.5 245.3 250.2 270.0
Gross domestic product atcurrent prices 2,645.0 2,871.0 3,618.3 3,448.5 3,448.9 3,518.9 3,818.0
Source: Ministry of Economy, Finance, Budget, and Privatization.
Table 1. Gabon: Gross Domestic Product by Sector at Current Prices, 1998–2004
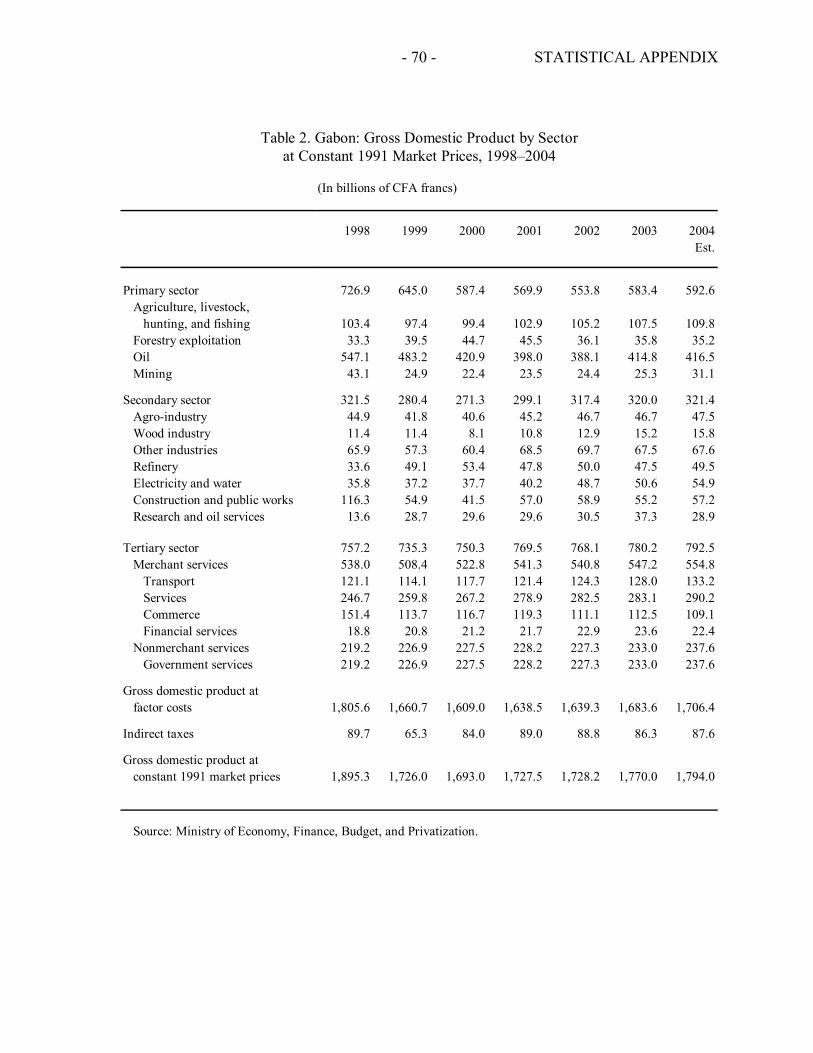
STATISTICAL APPENDIX
- 70 -
1998 1999 2000 2001 2002 2003 2004Est.
Primary sector 726.9 645.0 587.4 569.9 553.8 583.4 592.6Agriculture, livestock,
hunting, and fishing 103.4 97.4 99.4 102.9 105.2 107.5 109.8Forestry exploitation 33.3 39.5 44.7 45.5 36.1 35.8 35.2Oil 547.1 483.2 420.9 398.0 388.1 414.8 416.5Mining 43.1 24.9 22.4 23.5 24.4 25.3 31.1
Secondary sector 321.5 280.4 271.3 299.1 317.4 320.0 321.4Agro-industry 44.9 41.8 40.6 45.2 46.7 46.7 47.5Wood industry 11.4 11.4 8.1 10.8 12.9 15.2 15.8Other industries 65.9 57.3 60.4 68.5 69.7 67.5 67.6Refinery 33.6 49.1 53.4 47.8 50.0 47.5 49.5Electricity and water 35.8 37.2 37.7 40.2 48.7 50.6 54.9Construction and public works 116.3 54.9 41.5 57.0 58.9 55.2 57.2Research and oil services 13.6 28.7 29.6 29.6 30.5 37.3 28.9
Tertiary sector 757.2 735.3 750.3 769.5 768.1 780.2 792.5Merchant services 538.0 508.4 522.8 541.3 540.8 547.2 554.8
Transport 121.1 114.1 117.7 121.4 124.3 128.0 133.2Services 246.7 259.8 267.2 278.9 282.5 283.1 290.2Commerce 151.4 113.7 116.7 119.3 111.1 112.5 109.1Financial services 18.8 20.8 21.2 21.7 22.9 23.6 22.4
Nonmerchant services 219.2 226.9 227.5 228.2 227.3 233.0 237.6Government services 219.2 226.9 227.5 228.2 227.3 233.0 237.6
Gross domestic product atfactor costs 1,805.6 1,660.7 1,609.0 1,638.5 1,639.3 1,683.6 1,706.4
Indirect taxes 89.7 65.3 84.0 89.0 88.8 86.3 87.6
Gross domestic product atconstant 1991 market prices 1,895.3 1,726.0 1,693.0 1,727.5 1,728.2 1,770.0 1,794.0
Source: Ministry of Economy, Finance, Budget, and Privatization.
Table 2. Gabon: Gross Domestic Product by Sectorat Constant 1991 Market Prices, 1998–2004
(In billions of CFA francs)
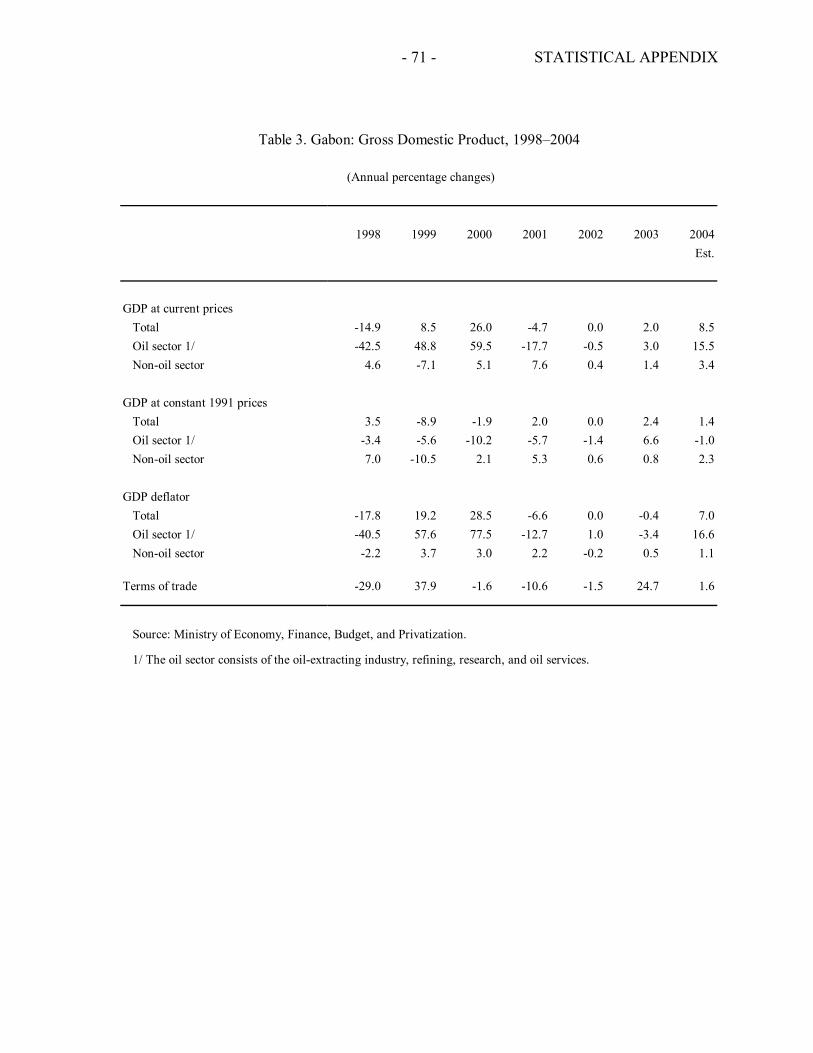
STATISTICAL APPENDIX
- 71 -
1998 1999 2000 2001 2002 2003 2004Est.
GDP at current pricesTotal -14.9 8.5 26.0 -4.7 0.0 2.0 8.5Oil sector 1/ -42.5 48.8 59.5 -17.7 -0.5 3.0 15.5Non-oil sector 4.6 -7.1 5.1 7.6 0.4 1.4 3.4
GDP at constant 1991 pricesTotal 3.5 -8.9 -1.9 2.0 0.0 2.4 1.4Oil sector 1/ -3.4 -5.6 -10.2 -5.7 -1.4 6.6 -1.0Non-oil sector 7.0 -10.5 2.1 5.3 0.6 0.8 2.3
GDP deflatorTotal -17.8 19.2 28.5 -6.6 0.0 -0.4 7.0Oil sector 1/ -40.5 57.6 77.5 -12.7 1.0 -3.4 16.6Non-oil sector -2.2 3.7 3.0 2.2 -0.2 0.5 1.1
Terms of trade -29.0 37.9 -1.6 -10.6 -1.5 24.7 1.6
Source: Ministry of Economy, Finance, Budget, and Privatization.
1/ The oil sector consists of the oil-extracting industry, refining, research, and oil services.
Table 3. Gabon: Gross Domestic Product, 1998–2004
(Annual percentage changes)
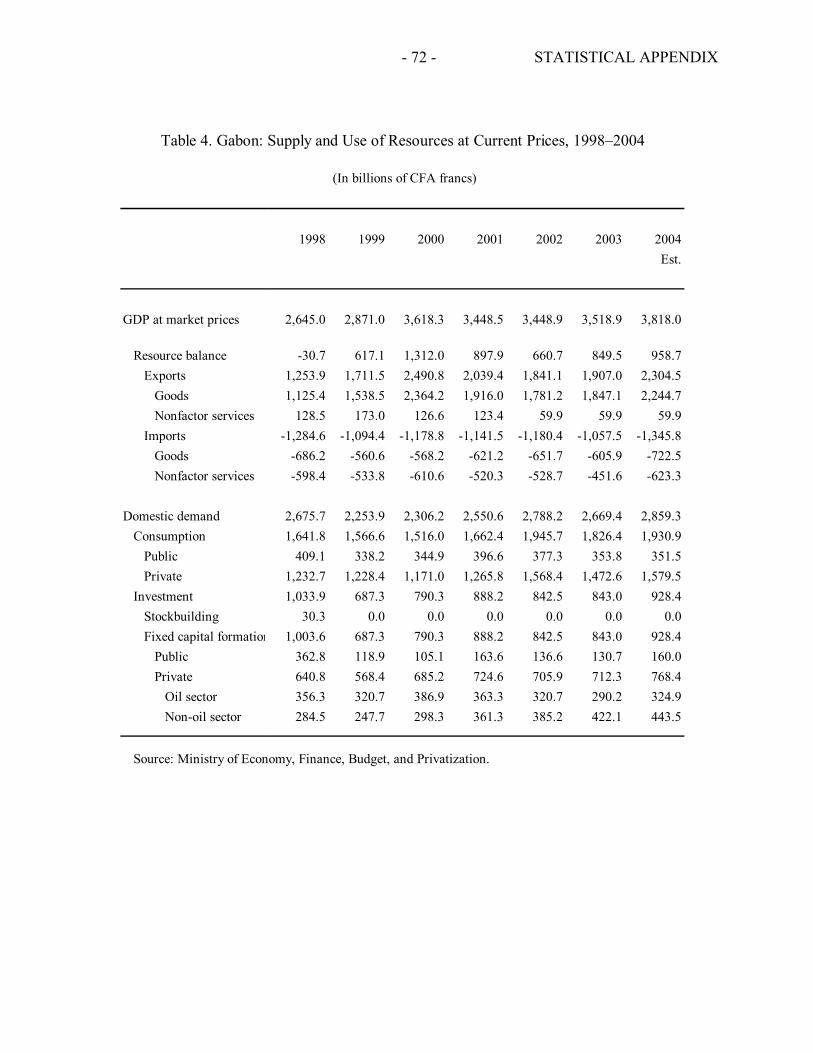
STATISTICAL APPENDIX
- 72 -
1998 1999 2000 2001 2002 2003 2004Est.
GDP at market prices 2,645.0 2,871.0 3,618.3 3,448.5 3,448.9 3,518.9 3,818.0
Resource balance -30.7 617.1 1,312.0 897.9 660.7 849.5 958.7Exports 1,253.9 1,711.5 2,490.8 2,039.4 1,841.1 1,907.0 2,304.5
Goods 1,125.4 1,538.5 2,364.2 1,916.0 1,781.2 1,847.1 2,244.7Nonfactor services 128.5 173.0 126.6 123.4 59.9 59.9 59.9
Imports -1,284.6 -1,094.4 -1,178.8 -1,141.5 -1,180.4 -1,057.5 -1,345.8Goods -686.2 -560.6 -568.2 -621.2 -651.7 -605.9 -722.5Nonfactor services -598.4 -533.8 -610.6 -520.3 -528.7 -451.6 -623.3
Domestic demand 2,675.7 2,253.9 2,306.2 2,550.6 2,788.2 2,669.4 2,859.3Consumption 1,641.8 1,566.6 1,516.0 1,662.4 1,945.7 1,826.4 1,930.9
Public 409.1 338.2 344.9 396.6 377.3 353.8 351.5Private 1,232.7 1,228.4 1,171.0 1,265.8 1,568.4 1,472.6 1,579.5
Investment 1,033.9 687.3 790.3 888.2 842.5 843.0 928.4Stockbuilding 30.3 0.0 0.0 0.0 0.0 0.0 0.0Fixed capital formation 1,003.6 687.3 790.3 888.2 842.5 843.0 928.4
Public 362.8 118.9 105.1 163.6 136.6 130.7 160.0Private 640.8 568.4 685.2 724.6 705.9 712.3 768.4
Oil sector 356.3 320.7 386.9 363.3 320.7 290.2 324.9Non-oil sector 284.5 247.7 298.3 361.3 385.2 422.1 443.5
Source: Ministry of Economy, Finance, Budget, and Privatization.
Table 4. Gabon: Supply and Use of Resources at Current Prices, 1998–2004
(In billions of CFA francs)
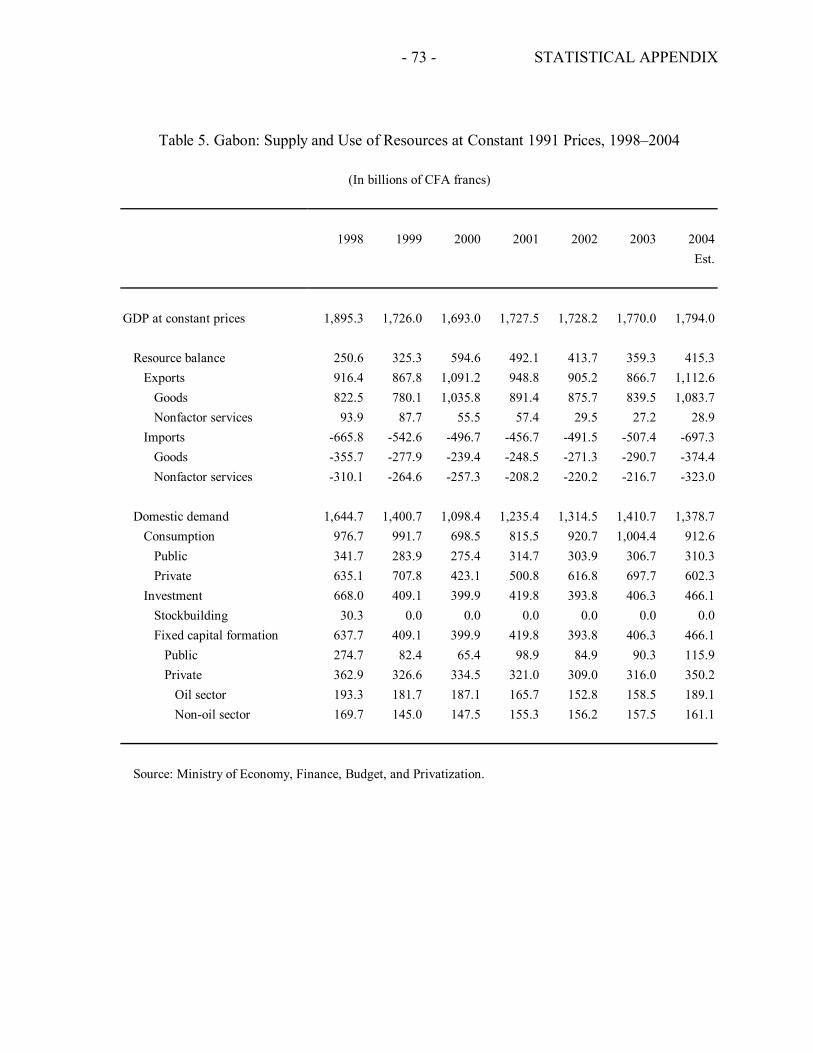
STATISTICAL APPENDIX
- 73 -
1998 1999 2000 2001 2002 2003 2004Est.
GDP at constant prices 1,895.3 1,726.0 1,693.0 1,727.5 1,728.2 1,770.0 1,794.0
Resource balance 250.6 325.3 594.6 492.1 413.7 359.3 415.3Exports 916.4 867.8 1,091.2 948.8 905.2 866.7 1,112.6
Goods 822.5 780.1 1,035.8 891.4 875.7 839.5 1,083.7Nonfactor services 93.9 87.7 55.5 57.4 29.5 27.2 28.9
Imports -665.8 -542.6 -496.7 -456.7 -491.5 -507.4 -697.3Goods -355.7 -277.9 -239.4 -248.5 -271.3 -290.7 -374.4Nonfactor services -310.1 -264.6 -257.3 -208.2 -220.2 -216.7 -323.0
Domestic demand 1,644.7 1,400.7 1,098.4 1,235.4 1,314.5 1,410.7 1,378.7Consumption 976.7 991.7 698.5 815.5 920.7 1,004.4 912.6
Public 341.7 283.9 275.4 314.7 303.9 306.7 310.3Private 635.1 707.8 423.1 500.8 616.8 697.7 602.3
Investment 668.0 409.1 399.9 419.8 393.8 406.3 466.1Stockbuilding 30.3 0.0 0.0 0.0 0.0 0.0 0.0Fixed capital formation 637.7 409.1 399.9 419.8 393.8 406.3 466.1
Public 274.7 82.4 65.4 98.9 84.9 90.3 115.9Private 362.9 326.6 334.5 321.0 309.0 316.0 350.2
Oil sector 193.3 181.7 187.1 165.7 152.8 158.5 189.1Non-oil sector 169.7 145.0 147.5 155.3 156.2 157.5 161.1
Source: Ministry of Economy, Finance, Budget, and Privatization.
Table 5. Gabon: Supply and Use of Resources at Constant 1991 Prices, 1998–2004
(In billions of CFA francs)
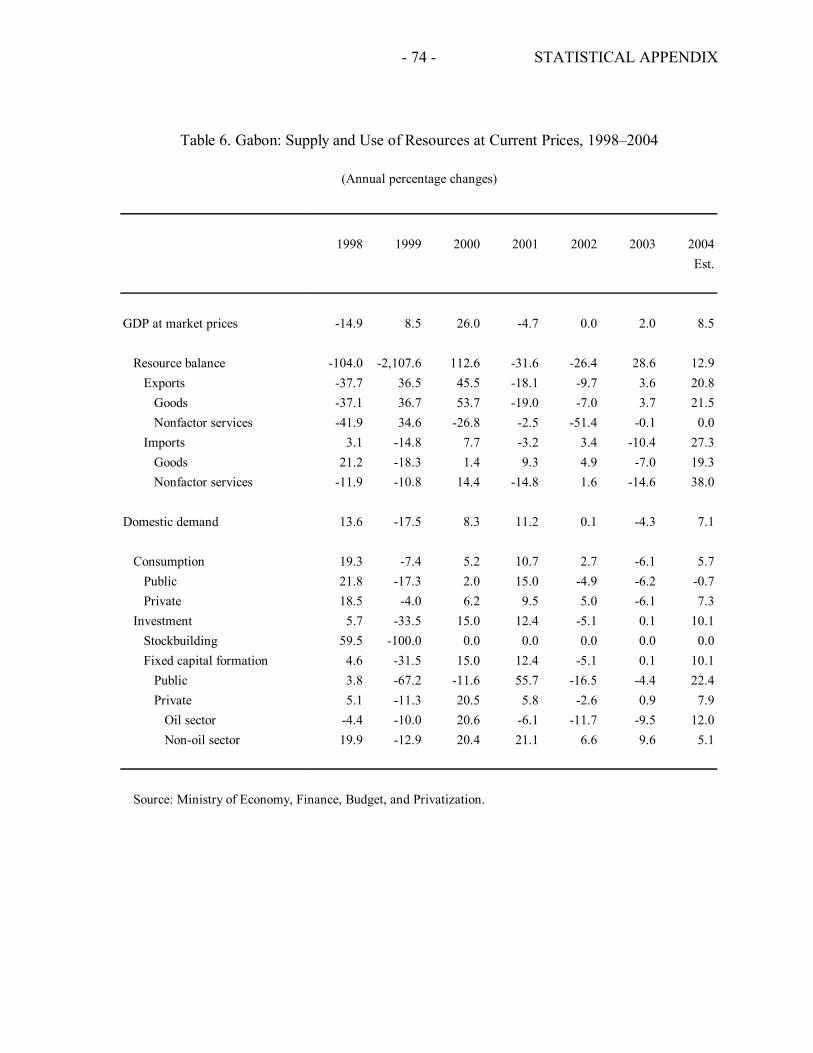
STATISTICAL APPENDIX
- 74 -
1998 1999 2000 2001 2002 2003 2004Est.
GDP at market prices -14.9 8.5 26.0 -4.7 0.0 2.0 8.5
Resource balance -104.0 -2,107.6 112.6 -31.6 -26.4 28.6 12.9Exports -37.7 36.5 45.5 -18.1 -9.7 3.6 20.8
Goods -37.1 36.7 53.7 -19.0 -7.0 3.7 21.5Nonfactor services -41.9 34.6 -26.8 -2.5 -51.4 -0.1 0.0
Imports 3.1 -14.8 7.7 -3.2 3.4 -10.4 27.3Goods 21.2 -18.3 1.4 9.3 4.9 -7.0 19.3Nonfactor services -11.9 -10.8 14.4 -14.8 1.6 -14.6 38.0
Domestic demand 13.6 -17.5 8.3 11.2 0.1 -4.3 7.1
Consumption 19.3 -7.4 5.2 10.7 2.7 -6.1 5.7Public 21.8 -17.3 2.0 15.0 -4.9 -6.2 -0.7Private 18.5 -4.0 6.2 9.5 5.0 -6.1 7.3
Investment 5.7 -33.5 15.0 12.4 -5.1 0.1 10.1Stockbuilding 59.5 -100.0 0.0 0.0 0.0 0.0 0.0Fixed capital formation 4.6 -31.5 15.0 12.4 -5.1 0.1 10.1
Public 3.8 -67.2 -11.6 55.7 -16.5 -4.4 22.4Private 5.1 -11.3 20.5 5.8 -2.6 0.9 7.9
Oil sector -4.4 -10.0 20.6 -6.1 -11.7 -9.5 12.0Non-oil sector 19.9 -12.9 20.4 21.1 6.6 9.6 5.1
Source: Ministry of Economy, Finance, Budget, and Privatization.
Table 6. Gabon: Supply and Use of Resources at Current Prices, 1998–2004
(Annual percentage changes)
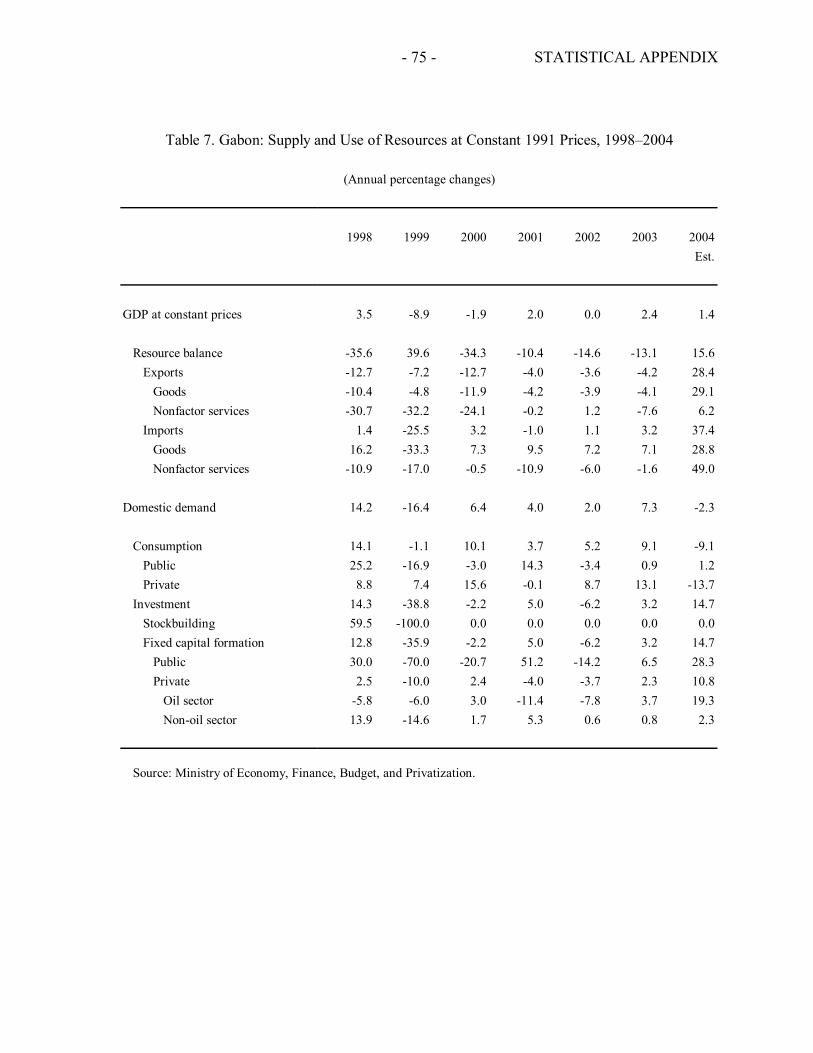
STATISTICAL APPENDIX
- 75 -
1998 1999 2000 2001 2002 2003 2004Est.
GDP at constant prices 3.5 -8.9 -1.9 2.0 0.0 2.4 1.4
Resource balance -35.6 39.6 -34.3 -10.4 -14.6 -13.1 15.6Exports -12.7 -7.2 -12.7 -4.0 -3.6 -4.2 28.4
Goods -10.4 -4.8 -11.9 -4.2 -3.9 -4.1 29.1Nonfactor services -30.7 -32.2 -24.1 -0.2 1.2 -7.6 6.2
Imports 1.4 -25.5 3.2 -1.0 1.1 3.2 37.4Goods 16.2 -33.3 7.3 9.5 7.2 7.1 28.8Nonfactor services -10.9 -17.0 -0.5 -10.9 -6.0 -1.6 49.0
Domestic demand 14.2 -16.4 6.4 4.0 2.0 7.3 -2.3
Consumption 14.1 -1.1 10.1 3.7 5.2 9.1 -9.1Public 25.2 -16.9 -3.0 14.3 -3.4 0.9 1.2Private 8.8 7.4 15.6 -0.1 8.7 13.1 -13.7
Investment 14.3 -38.8 -2.2 5.0 -6.2 3.2 14.7Stockbuilding 59.5 -100.0 0.0 0.0 0.0 0.0 0.0Fixed capital formation 12.8 -35.9 -2.2 5.0 -6.2 3.2 14.7
Public 30.0 -70.0 -20.7 51.2 -14.2 6.5 28.3Private 2.5 -10.0 2.4 -4.0 -3.7 2.3 10.8
Oil sector -5.8 -6.0 3.0 -11.4 -7.8 3.7 19.3Non-oil sector 13.9 -14.6 1.7 5.3 0.6 0.8 2.3
Source: Ministry of Economy, Finance, Budget, and Privatization.
Table 7. Gabon: Supply and Use of Resources at Constant 1991 Prices, 1998–2004
(Annual percentage changes)
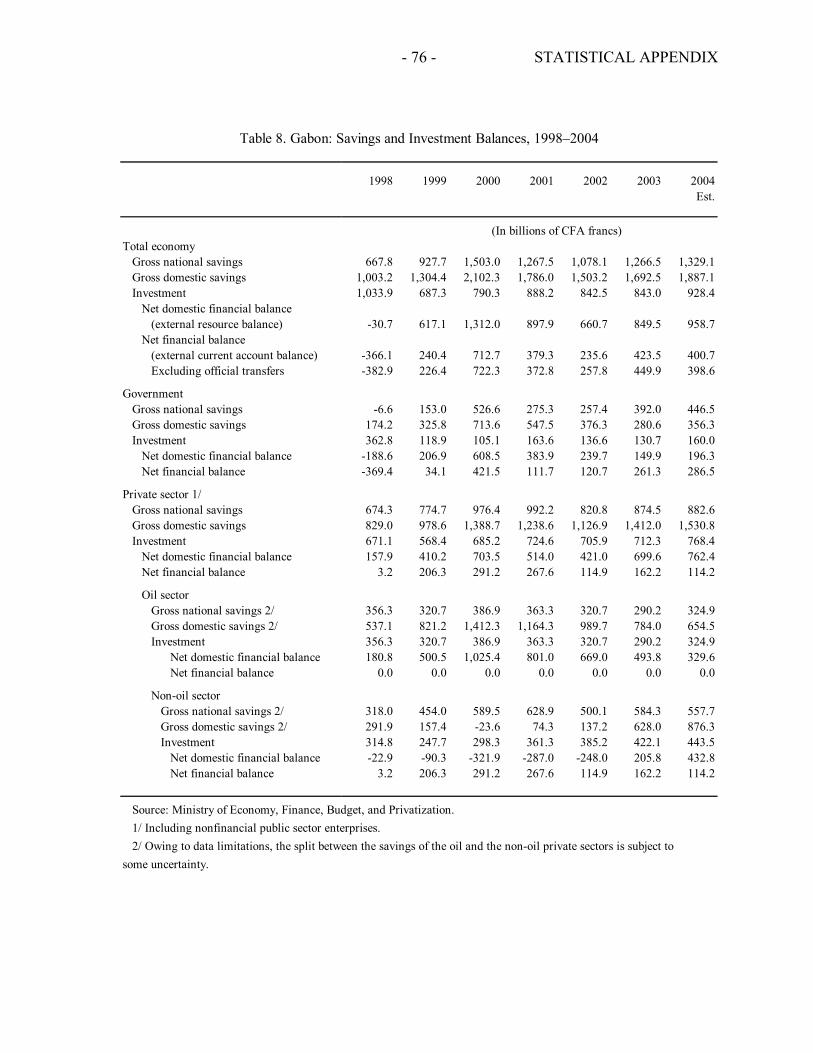
STATISTICAL APPENDIX
- 76 -
1998 1999 2000 2001 2002 2003 2004Est.
(In billions of CFA francs)Total economy
Gross national savings 667.8 927.7 1,503.0 1,267.5 1,078.1 1,266.5 1,329.1Gross domestic savings 1,003.2 1,304.4 2,102.3 1,786.0 1,503.2 1,692.5 1,887.1Investment 1,033.9 687.3 790.3 888.2 842.5 843.0 928.4
Net domestic financial balance(external resource balance) -30.7 617.1 1,312.0 897.9 660.7 849.5 958.7
Net financial balance(external current account balance) -366.1 240.4 712.7 379.3 235.6 423.5 400.7Excluding official transfers -382.9 226.4 722.3 372.8 257.8 449.9 398.6
Government Gross national savings -6.6 153.0 526.6 275.3 257.4 392.0 446.5Gross domestic savings 174.2 325.8 713.6 547.5 376.3 280.6 356.3Investment 362.8 118.9 105.1 163.6 136.6 130.7 160.0
Net domestic financial balance -188.6 206.9 608.5 383.9 239.7 149.9 196.3Net financial balance -369.4 34.1 421.5 111.7 120.7 261.3 286.5
Private sector 1/Gross national savings 674.3 774.7 976.4 992.2 820.8 874.5 882.6Gross domestic savings 829.0 978.6 1,388.7 1,238.6 1,126.9 1,412.0 1,530.8Investment 671.1 568.4 685.2 724.6 705.9 712.3 768.4
Net domestic financial balance 157.9 410.2 703.5 514.0 421.0 699.6 762.4Net financial balance 3.2 206.3 291.2 267.6 114.9 162.2 114.2
Oil sectorGross national savings 2/ 356.3 320.7 386.9 363.3 320.7 290.2 324.9Gross domestic savings 2/ 537.1 821.2 1,412.3 1,164.3 989.7 784.0 654.5Investment 356.3 320.7 386.9 363.3 320.7 290.2 324.9
Net domestic financial balance 180.8 500.5 1,025.4 801.0 669.0 493.8 329.6Net financial balance 0.0 0.0 0.0 0.0 0.0 0.0 0.0
Non-oil sectorGross national savings 2/ 318.0 454.0 589.5 628.9 500.1 584.3 557.7Gross domestic savings 2/ 291.9 157.4 -23.6 74.3 137.2 628.0 876.3Investment 314.8 247.7 298.3 361.3 385.2 422.1 443.5
Net domestic financial balance -22.9 -90.3 -321.9 -287.0 -248.0 205.8 432.8Net financial balance 3.2 206.3 291.2 267.6 114.9 162.2 114.2
Source: Ministry of Economy, Finance, Budget, and Privatization.1/ Including nonfinancial public sector enterprises.2/ Owing to data limitations, the split between the savings of the oil and the non-oil private sectors is subject to
some uncertainty.
Table 8. Gabon: Savings and Investment Balances, 1998–2004
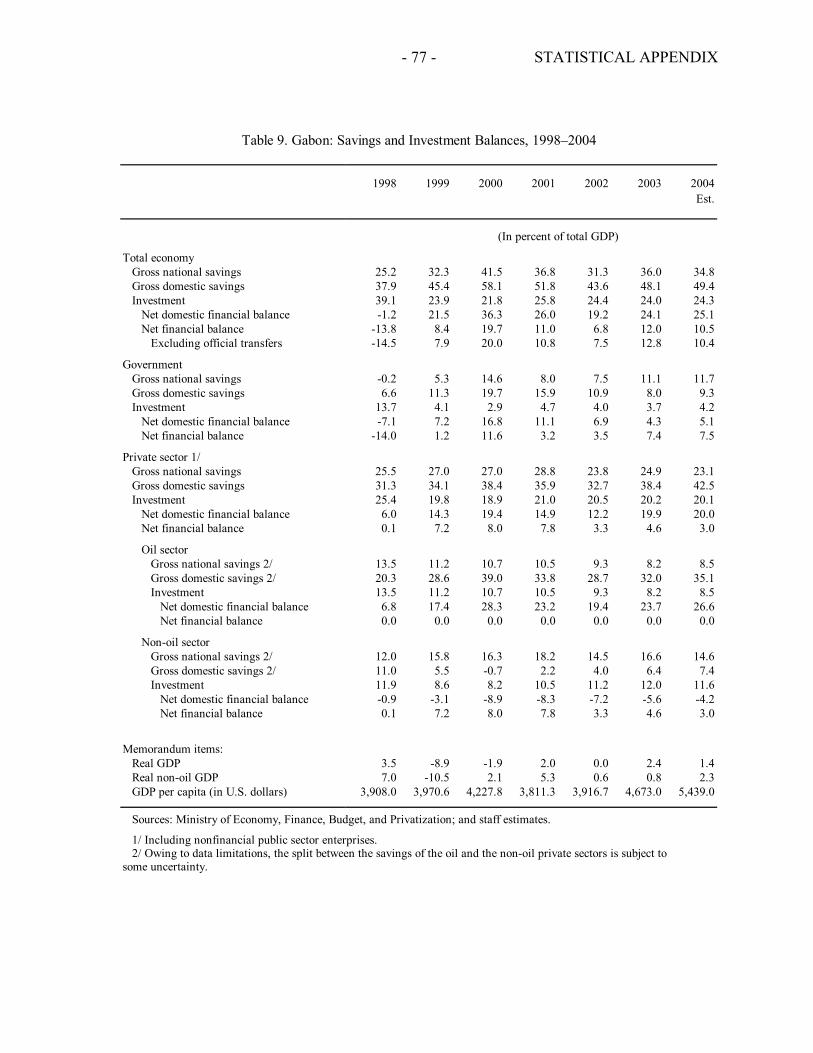
STATISTICAL APPENDIX
- 77 -
1998 1999 2000 2001 2002 2003 2004Est.
(In percent of total GDP)
Total economyGross national savings 25.2 32.3 41.5 36.8 31.3 36.0 34.8Gross domestic savings 37.9 45.4 58.1 51.8 43.6 48.1 49.4Investment 39.1 23.9 21.8 25.8 24.4 24.0 24.3
Net domestic financial balance -1.2 21.5 36.3 26.0 19.2 24.1 25.1Net financial balance -13.8 8.4 19.7 11.0 6.8 12.0 10.5
Excluding official transfers -14.5 7.9 20.0 10.8 7.5 12.8 10.4
Government Gross national savings -0.2 5.3 14.6 8.0 7.5 11.1 11.7Gross domestic savings 6.6 11.3 19.7 15.9 10.9 8.0 9.3Investment 13.7 4.1 2.9 4.7 4.0 3.7 4.2
Net domestic financial balance -7.1 7.2 16.8 11.1 6.9 4.3 5.1Net financial balance -14.0 1.2 11.6 3.2 3.5 7.4 7.5
Private sector 1/Gross national savings 25.5 27.0 27.0 28.8 23.8 24.9 23.1Gross domestic savings 31.3 34.1 38.4 35.9 32.7 38.4 42.5Investment 25.4 19.8 18.9 21.0 20.5 20.2 20.1
Net domestic financial balance 6.0 14.3 19.4 14.9 12.2 19.9 20.0Net financial balance 0.1 7.2 8.0 7.8 3.3 4.6 3.0
Oil sectorGross national savings 2/ 13.5 11.2 10.7 10.5 9.3 8.2 8.5Gross domestic savings 2/ 20.3 28.6 39.0 33.8 28.7 32.0 35.1Investment 13.5 11.2 10.7 10.5 9.3 8.2 8.5
Net domestic financial balance 6.8 17.4 28.3 23.2 19.4 23.7 26.6Net financial balance 0.0 0.0 0.0 0.0 0.0 0.0 0.0
Non-oil sectorGross national savings 2/ 12.0 15.8 16.3 18.2 14.5 16.6 14.6Gross domestic savings 2/ 11.0 5.5 -0.7 2.2 4.0 6.4 7.4Investment 11.9 8.6 8.2 10.5 11.2 12.0 11.6
Net domestic financial balance -0.9 -3.1 -8.9 -8.3 -7.2 -5.6 -4.2Net financial balance 0.1 7.2 8.0 7.8 3.3 4.6 3.0
Memorandum items:Real GDP 3.5 -8.9 -1.9 2.0 0.0 2.4 1.4Real non-oil GDP 7.0 -10.5 2.1 5.3 0.6 0.8 2.3GDP per capita (in U.S. dollars) 3,908.0 3,970.6 4,227.8 3,811.3 3,916.7 4,673.0 5,439.0
Sources: Ministry of Economy, Finance, Budget, and Privatization; and staff estimates. 1/ Including nonfinancial public sector enterprises.2/ Owing to data limitations, the split between the savings of the oil and the non-oil private sectors is subject to
some uncertainty.
Table 9. Gabon: Savings and Investment Balances, 1998–2004
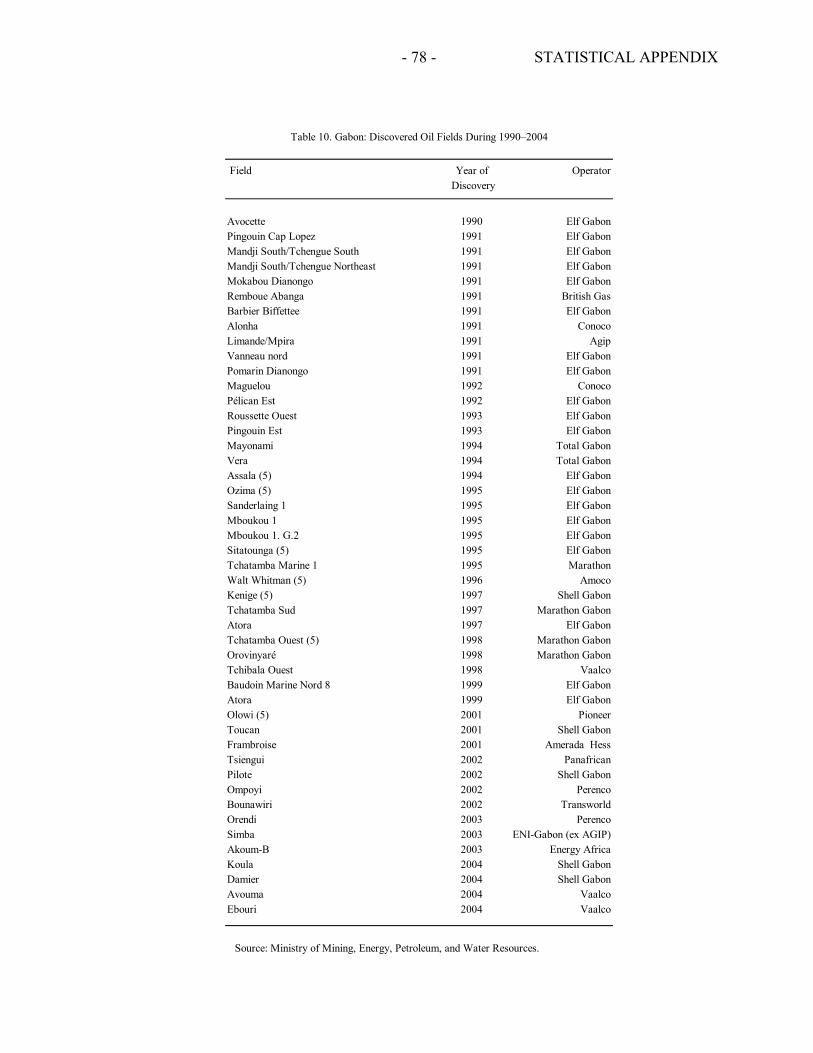
STATISTICAL APPENDIX
- 78 -
Table 10. Gabon: Discovered Oil Fields During 1990–2004
Field Year of OperatorDiscovery
Avocette 1990 Elf GabonPingouin Cap Lopez 1991 Elf GabonMandji South/Tchengue South 1991 Elf GabonMandji South/Tchengue Northeast 1991 Elf GabonMokabou Dianongo 1991 Elf GabonRemboue Abanga 1991 British GasBarbier Biffettee 1991 Elf GabonAlonha 1991 ConocoLimande/Mpira 1991 AgipVanneau nord 1991 Elf GabonPomarin Dianongo 1991 Elf GabonMaguelou 1992 ConocoPélican Est 1992 Elf GabonRoussette Ouest 1993 Elf GabonPingouin Est 1993 Elf GabonMayonami 1994 Total GabonVera 1994 Total GabonAssala (5) 1994 Elf GabonOzima (5) 1995 Elf GabonSanderlaing 1 1995 Elf GabonMboukou 1 1995 Elf GabonMboukou 1. G.2 1995 Elf GabonSitatounga (5) 1995 Elf GabonTchatamba Marine 1 1995 MarathonWalt Whitman (5) 1996 AmocoKenige (5) 1997 Shell GabonTchatamba Sud 1997 Marathon GabonAtora 1997 Elf GabonTchatamba Ouest (5) 1998 Marathon GabonOrovinyaré 1998 Marathon GabonTchibala Ouest 1998 VaalcoBaudoin Marine Nord 8 1999 Elf GabonAtora 1999 Elf GabonOlowi (5) 2001 PioneerToucan 2001 Shell GabonFrambroise 2001 Amerada HessTsiengui 2002 PanafricanPilote 2002 Shell GabonOmpoyi 2002 PerencoBounawiri 2002 TransworldOrendi 2003 PerencoSimba 2003 ENI-Gabon (ex AGIP)Akoum-B 2003 Energy AfricaKoula 2004 Shell GabonDamier 2004 Shell GabonAvouma 2004 VaalcoEbouri 2004 Vaalco
Source: Ministry of Mining, Energy, Petroleum, and Water Resources.
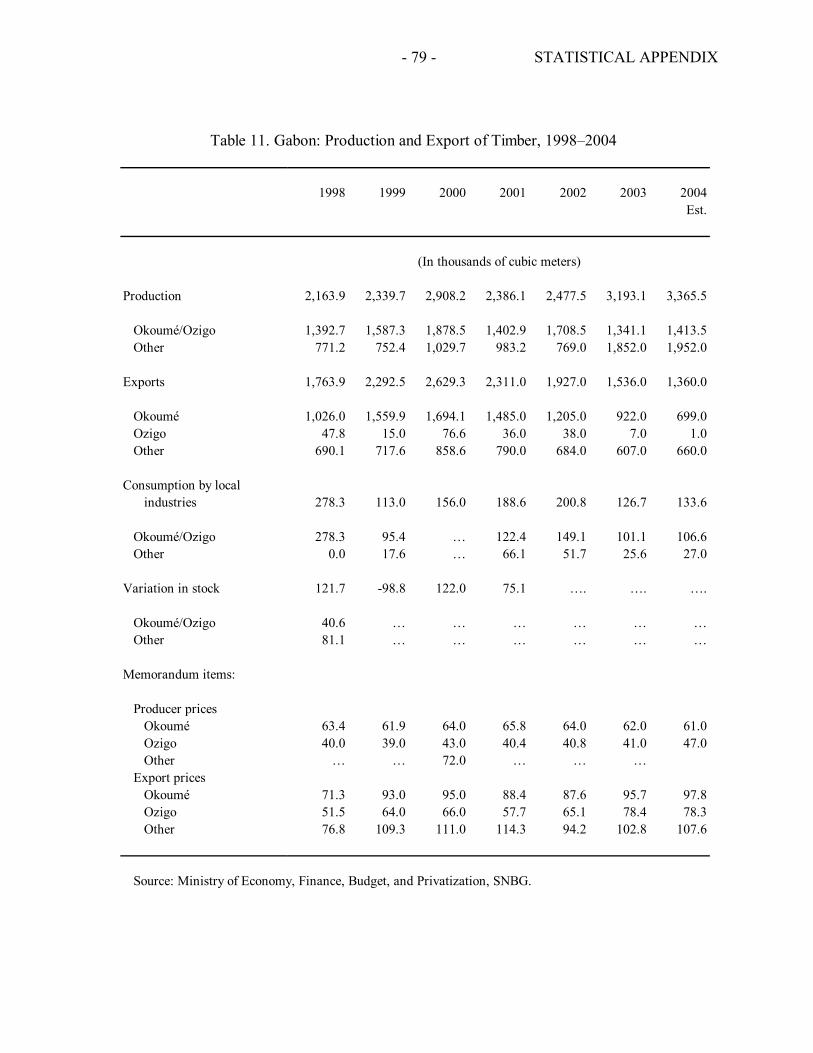
STATISTICAL APPENDIX
- 79 -
1998 1999 2000 2001 2002 2003 2004Est.
Production 2,163.9 2,339.7 2,908.2 2,386.1 2,477.5 3,193.1 3,365.5
Okoumé/Ozigo 1,392.7 1,587.3 1,878.5 1,402.9 1,708.5 1,341.1 1,413.5Other 771.2 752.4 1,029.7 983.2 769.0 1,852.0 1,952.0
Exports 1,763.9 2,292.5 2,629.3 2,311.0 1,927.0 1,536.0 1,360.0
Okoumé 1,026.0 1,559.9 1,694.1 1,485.0 1,205.0 922.0 699.0Ozigo 47.8 15.0 76.6 36.0 38.0 7.0 1.0Other 690.1 717.6 858.6 790.0 684.0 607.0 660.0
Consumption by local industries 278.3 113.0 156.0 188.6 200.8 126.7 133.6
Okoumé/Ozigo 278.3 95.4 … 122.4 149.1 101.1 106.6Other 0.0 17.6 … 66.1 51.7 25.6 27.0
Variation in stock 121.7 -98.8 122.0 75.1 …. …. ….
Okoumé/Ozigo 40.6 … … … … … …Other 81.1 … … … … … …
Memorandum items:
Producer pricesOkoumé 63.4 61.9 64.0 65.8 64.0 62.0 61.0Ozigo 40.0 39.0 43.0 40.4 40.8 41.0 47.0Other … … 72.0 … … …
Export pricesOkoumé 71.3 93.0 95.0 88.4 87.6 95.7 97.8Ozigo 51.5 64.0 66.0 57.7 65.1 78.4 78.3Other 76.8 109.3 111.0 114.3 94.2 102.8 107.6
Source: Ministry of Economy, Finance, Budget, and Privatization, SNBG.
(In thousands of cubic meters)
Table 11. Gabon: Production and Export of Timber, 1998–2004
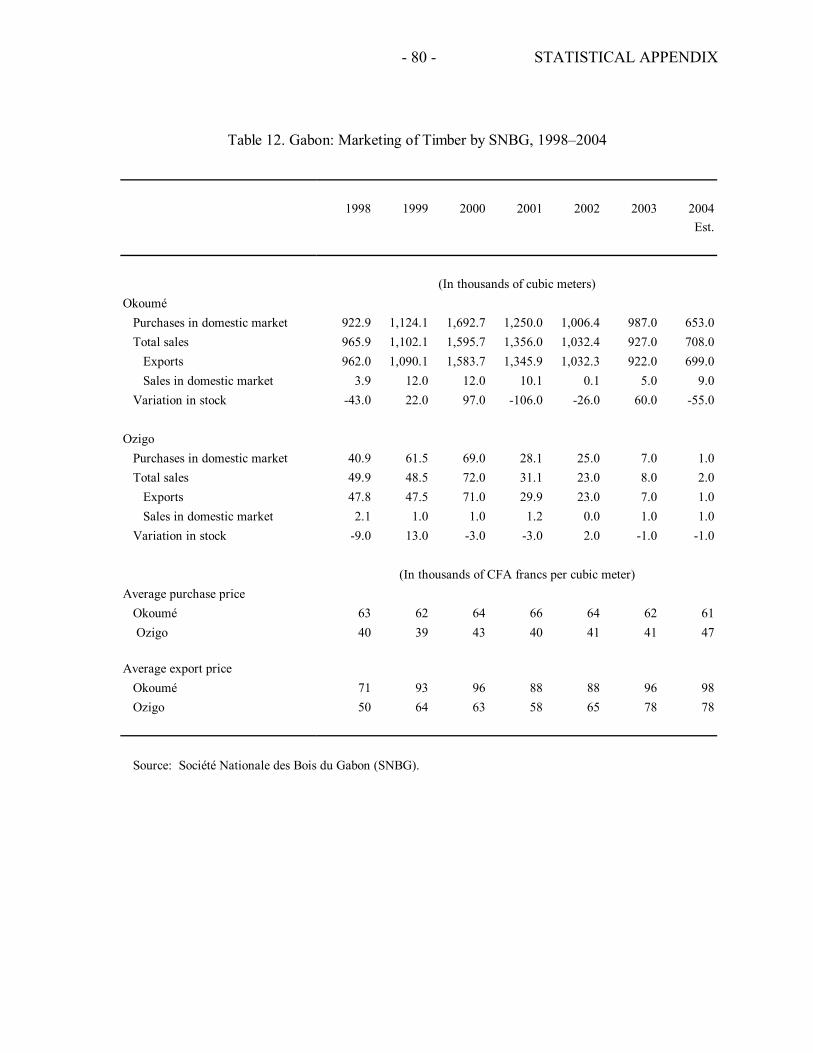
STATISTICAL APPENDIX
- 80 -
1998 1999 2000 2001 2002 2003 2004Est.
OkouméPurchases in domestic market 922.9 1,124.1 1,692.7 1,250.0 1,006.4 987.0 653.0Total sales 965.9 1,102.1 1,595.7 1,356.0 1,032.4 927.0 708.0
Exports 962.0 1,090.1 1,583.7 1,345.9 1,032.3 922.0 699.0Sales in domestic market 3.9 12.0 12.0 10.1 0.1 5.0 9.0
Variation in stock -43.0 22.0 97.0 -106.0 -26.0 60.0 -55.0
OzigoPurchases in domestic market 40.9 61.5 69.0 28.1 25.0 7.0 1.0Total sales 49.9 48.5 72.0 31.1 23.0 8.0 2.0
Exports 47.8 47.5 71.0 29.9 23.0 7.0 1.0Sales in domestic market 2.1 1.0 1.0 1.2 0.0 1.0 1.0
Variation in stock -9.0 13.0 -3.0 -3.0 2.0 -1.0 -1.0
Average purchase priceOkoumé 63 62 64 66 64 62 61 Ozigo 40 39 43 40 41 41 47
Average export priceOkoumé 71 93 96 88 88 96 98Ozigo 50 64 63 58 65 78 78
Source: Société Nationale des Bois du Gabon (SNBG).
(In thousands of CFA francs per cubic meter)
(In thousands of cubic meters)
Table 12. Gabon: Marketing of Timber by SNBG, 1998–2004
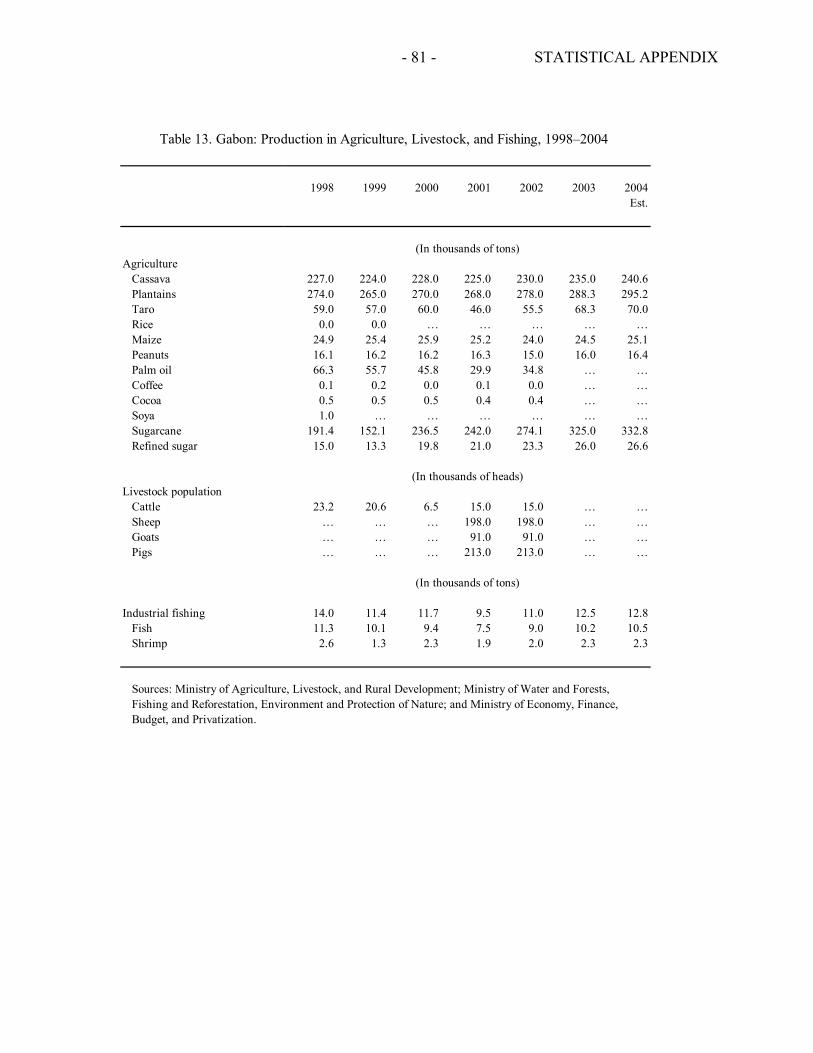
STATISTICAL APPENDIX
- 81 -
1998 1999 2000 2001 2002 2003 2004Est.
AgricultureCassava 227.0 224.0 228.0 225.0 230.0 235.0 240.6Plantains 274.0 265.0 270.0 268.0 278.0 288.3 295.2Taro 59.0 57.0 60.0 46.0 55.5 68.3 70.0Rice 0.0 0.0 … … … … …Maize 24.9 25.4 25.9 25.2 24.0 24.5 25.1Peanuts 16.1 16.2 16.2 16.3 15.0 16.0 16.4Palm oil 66.3 55.7 45.8 29.9 34.8 … …Coffee 0.1 0.2 0.0 0.1 0.0 … …Cocoa 0.5 0.5 0.5 0.4 0.4 … …Soya 1.0 … … … … … …Sugarcane 191.4 152.1 236.5 242.0 274.1 325.0 332.8Refined sugar 15.0 13.3 19.8 21.0 23.3 26.0 26.6
Livestock populationCattle 23.2 20.6 6.5 15.0 15.0 … …Sheep … … … 198.0 198.0 … …Goats … … … 91.0 91.0 … …Pigs … … … 213.0 213.0 … …
Industrial fishing 14.0 11.4 11.7 9.5 11.0 12.5 12.8Fish 11.3 10.1 9.4 7.5 9.0 10.2 10.5Shrimp 2.6 1.3 2.3 1.9 2.0 2.3 2.3
Sources: Ministry of Agriculture, Livestock, and Rural Development; Ministry of Water and Forests,Fishing and Reforestation, Environment and Protection of Nature; and Ministry of Economy, Finance,Budget, and Privatization.
Table 13. Gabon: Production in Agriculture, Livestock, and Fishing, 1998–2004
(In thousands of tons)
(In thousands of heads)
(In thousands of tons)
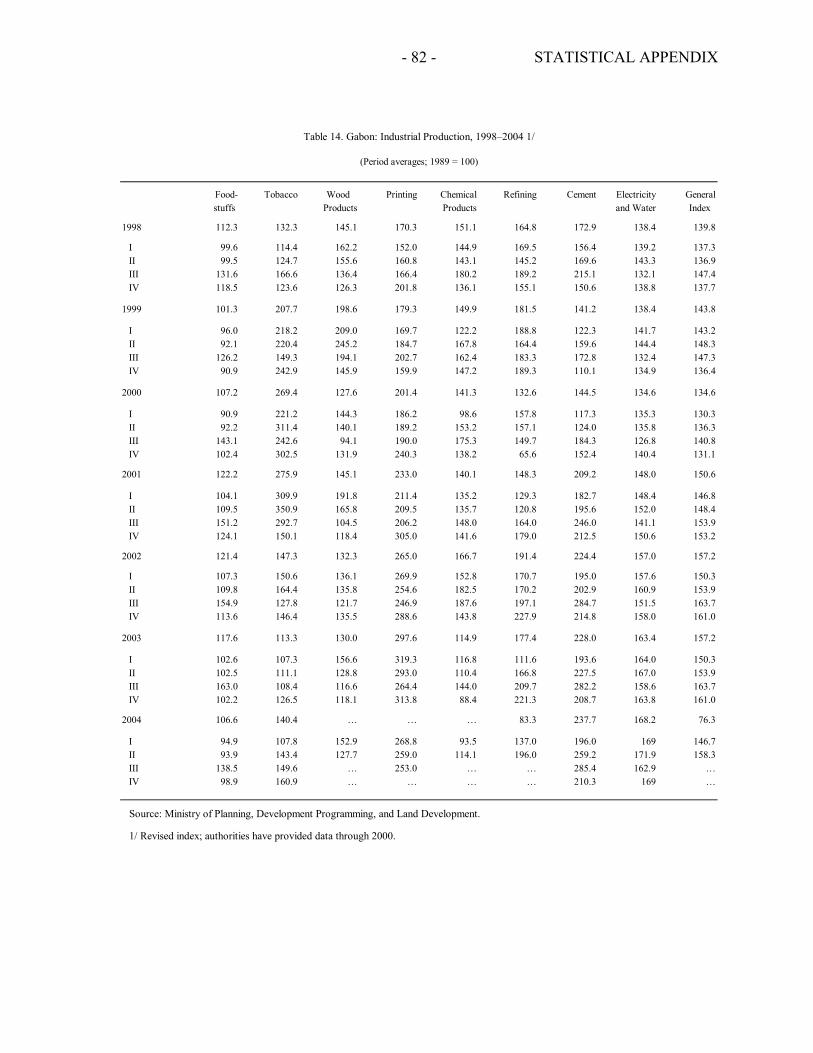
STATISTICAL APPENDIX
- 82 -
Table 14. Gabon: Industrial Production, 1998–2004 1/
(Period averages; 1989 = 100)
Food- Tobacco Wood Printing Chemical Refining Cement Electricity Generalstuffs Products Products and Water Index
1998 112.3 132.3 145.1 170.3 151.1 164.8 172.9 138.4 139.8
I 99.6 114.4 162.2 152.0 144.9 169.5 156.4 139.2 137.3II 99.5 124.7 155.6 160.8 143.1 145.2 169.6 143.3 136.9III 131.6 166.6 136.4 166.4 180.2 189.2 215.1 132.1 147.4IV 118.5 123.6 126.3 201.8 136.1 155.1 150.6 138.8 137.7
1999 101.3 207.7 198.6 179.3 149.9 181.5 141.2 138.4 143.8
I 96.0 218.2 209.0 169.7 122.2 188.8 122.3 141.7 143.2II 92.1 220.4 245.2 184.7 167.8 164.4 159.6 144.4 148.3III 126.2 149.3 194.1 202.7 162.4 183.3 172.8 132.4 147.3IV 90.9 242.9 145.9 159.9 147.2 189.3 110.1 134.9 136.4
2000 107.2 269.4 127.6 201.4 141.3 132.6 144.5 134.6 134.6
I 90.9 221.2 144.3 186.2 98.6 157.8 117.3 135.3 130.3II 92.2 311.4 140.1 189.2 153.2 157.1 124.0 135.8 136.3III 143.1 242.6 94.1 190.0 175.3 149.7 184.3 126.8 140.8IV 102.4 302.5 131.9 240.3 138.2 65.6 152.4 140.4 131.1
2001 122.2 275.9 145.1 233.0 140.1 148.3 209.2 148.0 150.6
I 104.1 309.9 191.8 211.4 135.2 129.3 182.7 148.4 146.8II 109.5 350.9 165.8 209.5 135.7 120.8 195.6 152.0 148.4III 151.2 292.7 104.5 206.2 148.0 164.0 246.0 141.1 153.9IV 124.1 150.1 118.4 305.0 141.6 179.0 212.5 150.6 153.2
2002 121.4 147.3 132.3 265.0 166.7 191.4 224.4 157.0 157.2
I 107.3 150.6 136.1 269.9 152.8 170.7 195.0 157.6 150.3II 109.8 164.4 135.8 254.6 182.5 170.2 202.9 160.9 153.9III 154.9 127.8 121.7 246.9 187.6 197.1 284.7 151.5 163.7IV 113.6 146.4 135.5 288.6 143.8 227.9 214.8 158.0 161.0
2003 117.6 113.3 130.0 297.6 114.9 177.4 228.0 163.4 157.2
I 102.6 107.3 156.6 319.3 116.8 111.6 193.6 164.0 150.3II 102.5 111.1 128.8 293.0 110.4 166.8 227.5 167.0 153.9III 163.0 108.4 116.6 264.4 144.0 209.7 282.2 158.6 163.7IV 102.2 126.5 118.1 313.8 88.4 221.3 208.7 163.8 161.0
2004 106.6 140.4 … … … 83.3 237.7 168.2 76.3
I 94.9 107.8 152.9 268.8 93.5 137.0 196.0 169 146.7II 93.9 143.4 127.7 259.0 114.1 196.0 259.2 171.9 158.3III 138.5 149.6 … 253.0 … … 285.4 162.9 …IV 98.9 160.9 … … … … 210.3 169 …
Source: Ministry of Planning, Development Programming, and Land Development.
1/ Revised index; authorities have provided data through 2000.
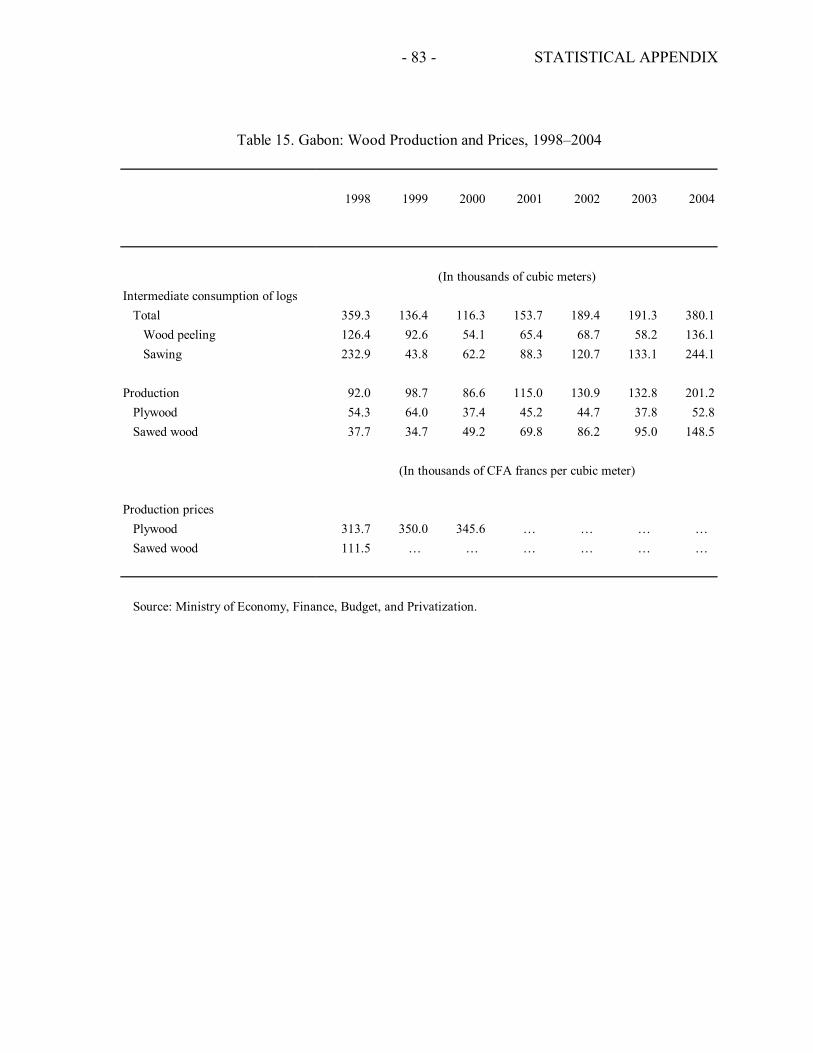
STATISTICAL APPENDIX
- 83 -
1998 1999 2000 2001 2002 2003 2004
Intermediate consumption of logsTotal 359.3 136.4 116.3 153.7 189.4 191.3 380.1
Wood peeling 126.4 92.6 54.1 65.4 68.7 58.2 136.1Sawing 232.9 43.8 62.2 88.3 120.7 133.1 244.1
Production 92.0 98.7 86.6 115.0 130.9 132.8 201.2Plywood 54.3 64.0 37.4 45.2 44.7 37.8 52.8Sawed wood 37.7 34.7 49.2 69.8 86.2 95.0 148.5
Production pricesPlywood 313.7 350.0 345.6 … … … … Sawed wood 111.5 … … … … … …
Source: Ministry of Economy, Finance, Budget, and Privatization.
Table 15. Gabon: Wood Production and Prices, 1998–2004
(In thousands of cubic meters)
(In thousands of CFA francs per cubic meter)
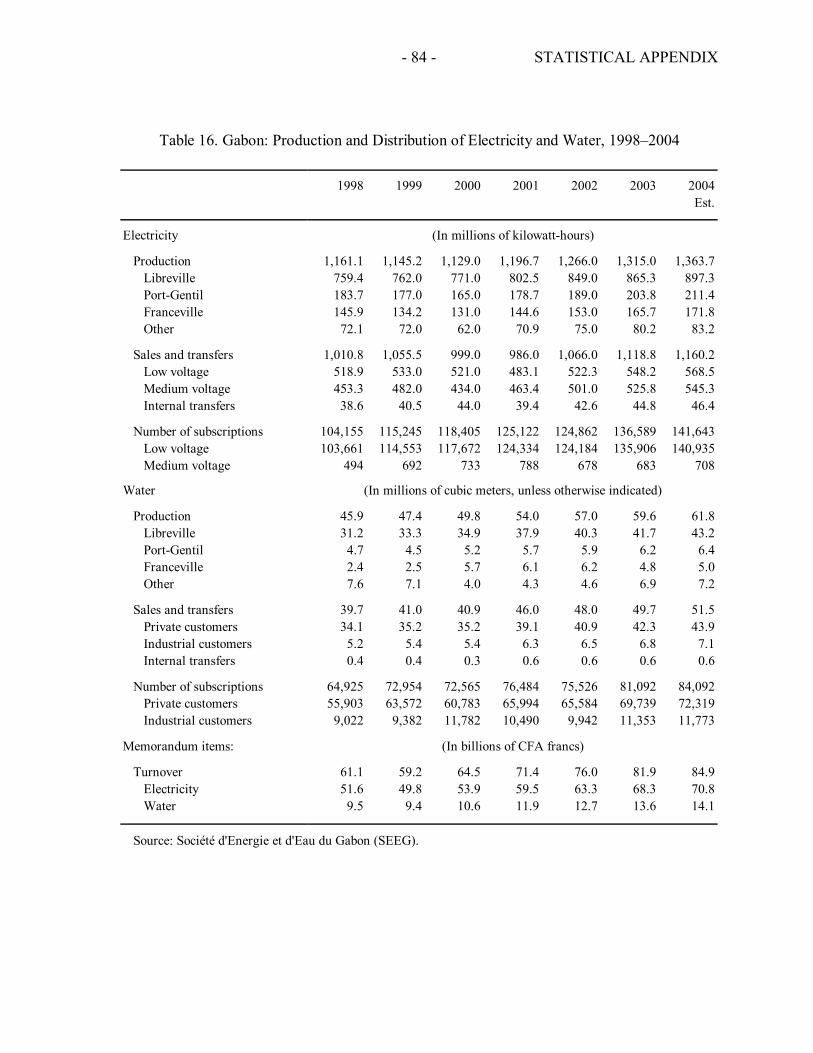
STATISTICAL APPENDIX
- 84 -
1998 1999 2000 2001 2002 2003 2004Est.
Electricity
Production 1,161.1 1,145.2 1,129.0 1,196.7 1,266.0 1,315.0 1,363.7Libreville 759.4 762.0 771.0 802.5 849.0 865.3 897.3Port-Gentil 183.7 177.0 165.0 178.7 189.0 203.8 211.4Franceville 145.9 134.2 131.0 144.6 153.0 165.7 171.8Other 72.1 72.0 62.0 70.9 75.0 80.2 83.2
Sales and transfers 1,010.8 1,055.5 999.0 986.0 1,066.0 1,118.8 1,160.2Low voltage 518.9 533.0 521.0 483.1 522.3 548.2 568.5Medium voltage 453.3 482.0 434.0 463.4 501.0 525.8 545.3Internal transfers 38.6 40.5 44.0 39.4 42.6 44.8 46.4
Number of subscriptions 104,155 115,245 118,405 125,122 124,862 136,589 141,643Low voltage 103,661 114,553 117,672 124,334 124,184 135,906 140,935Medium voltage 494 692 733 788 678 683 708
Water
Production 45.9 47.4 49.8 54.0 57.0 59.6 61.8Libreville 31.2 33.3 34.9 37.9 40.3 41.7 43.2Port-Gentil 4.7 4.5 5.2 5.7 5.9 6.2 6.4Franceville 2.4 2.5 5.7 6.1 6.2 4.8 5.0Other 7.6 7.1 4.0 4.3 4.6 6.9 7.2
Sales and transfers 39.7 41.0 40.9 46.0 48.0 49.7 51.5Private customers 34.1 35.2 35.2 39.1 40.9 42.3 43.9Industrial customers 5.2 5.4 5.4 6.3 6.5 6.8 7.1Internal transfers 0.4 0.4 0.3 0.6 0.6 0.6 0.6
Number of subscriptions 64,925 72,954 72,565 76,484 75,526 81,092 84,092Private customers 55,903 63,572 60,783 65,994 65,584 69,739 72,319Industrial customers 9,022 9,382 11,782 10,490 9,942 11,353 11,773
Memorandum items:
Turnover 61.1 59.2 64.5 71.4 76.0 81.9 84.9Electricity 51.6 49.8 53.9 59.5 63.3 68.3 70.8Water 9.5 9.4 10.6 11.9 12.7 13.6 14.1
Source: Société d'Energie et d'Eau du Gabon (SEEG).
Table 16. Gabon: Production and Distribution of Electricity and Water, 1998–2004
(In millions of kilowatt-hours)
(In millions of cubic meters, unless otherwise indicated)
(In billions of CFA francs)
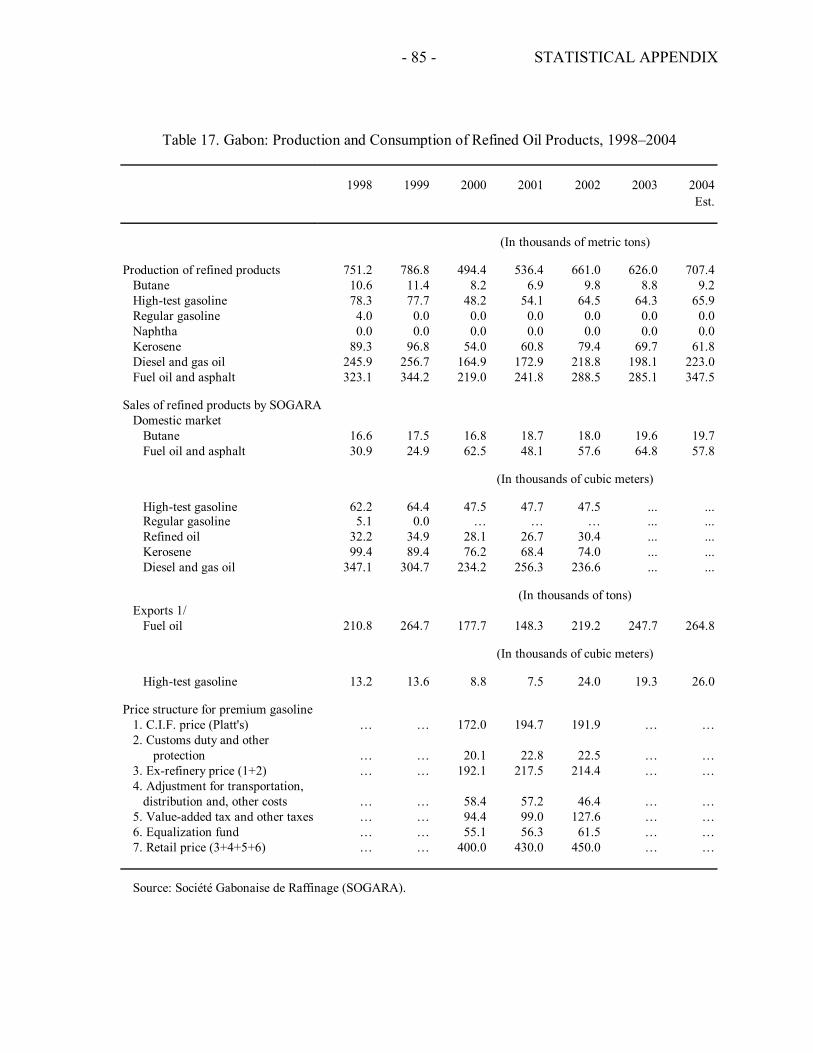
STATISTICAL APPENDIX
- 85 -
1998 1999 2000 2001 2002 2003 2004Est.
(In thousands of metric tons)
Production of refined products 751.2 786.8 494.4 536.4 661.0 626.0 707.4Butane 10.6 11.4 8.2 6.9 9.8 8.8 9.2High-test gasoline 78.3 77.7 48.2 54.1 64.5 64.3 65.9Regular gasoline 4.0 0.0 0.0 0.0 0.0 0.0 0.0Naphtha 0.0 0.0 0.0 0.0 0.0 0.0 0.0Kerosene 89.3 96.8 54.0 60.8 79.4 69.7 61.8Diesel and gas oil 245.9 256.7 164.9 172.9 218.8 198.1 223.0Fuel oil and asphalt 323.1 344.2 219.0 241.8 288.5 285.1 347.5
Sales of refined products by SOGARADomestic market
Butane 16.6 17.5 16.8 18.7 18.0 19.6 19.7Fuel oil and asphalt 30.9 24.9 62.5 48.1 57.6 64.8 57.8
(In thousands of cubic meters)
High-test gasoline 62.2 64.4 47.5 47.7 47.5 ... ...Regular gasoline 5.1 0.0 … … … ... ...Refined oil 32.2 34.9 28.1 26.7 30.4 ... ...Kerosene 99.4 89.4 76.2 68.4 74.0 ... ...Diesel and gas oil 347.1 304.7 234.2 256.3 236.6 ... ...
(In thousands of tons)Exports 1/
Fuel oil 210.8 264.7 177.7 148.3 219.2 247.7 264.8
(In thousands of cubic meters)
High-test gasoline 13.2 13.6 8.8 7.5 24.0 19.3 26.0
Price structure for premium gasoline1. C.I.F. price (Platt's) … … 172.0 194.7 191.9 … …2. Customs duty and other
protection … … 20.1 22.8 22.5 … …3. Ex-refinery price (1+2) … … 192.1 217.5 214.4 … …4. Adjustment for transportation,
distribution and, other costs … … 58.4 57.2 46.4 … …5. Value-added tax and other taxes … … 94.4 99.0 127.6 … …6. Equalization fund … … 55.1 56.3 61.5 … …7. Retail price (3+4+5+6) … … 400.0 430.0 450.0 … …
Source: Société Gabonaise de Raffinage (SOGARA).
Table 17. Gabon: Production and Consumption of Refined Oil Products, 1998–2004
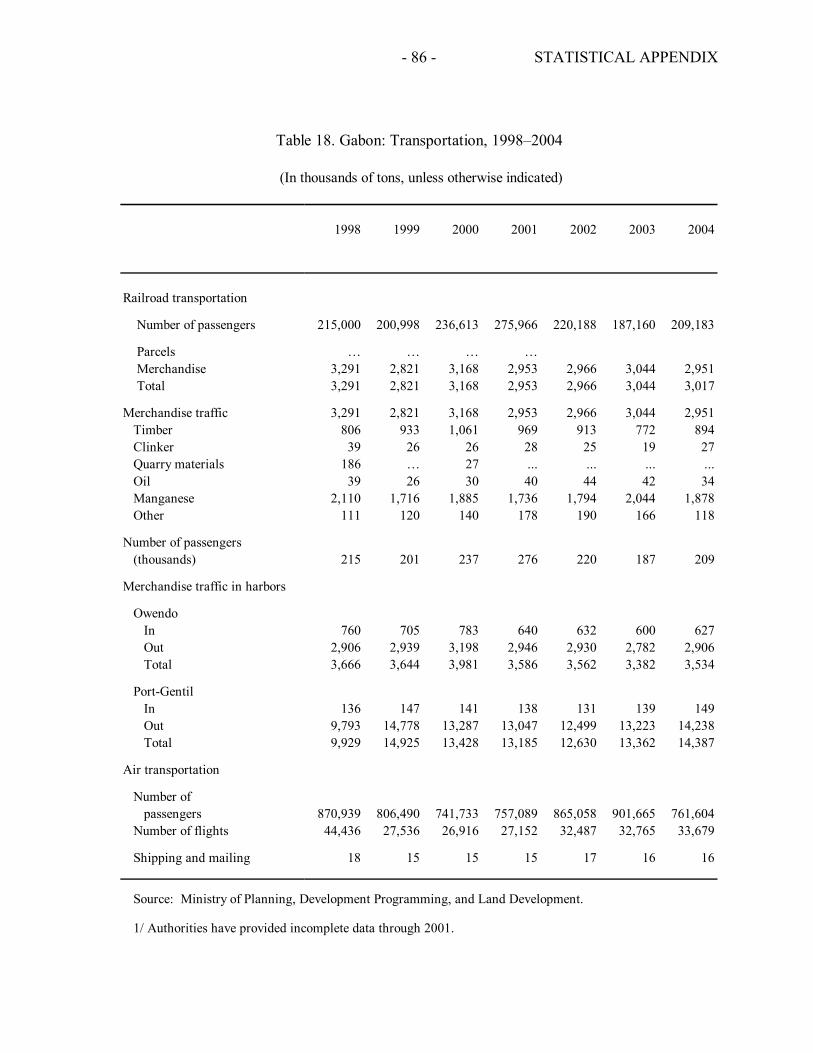
STATISTICAL APPENDIX
- 86 -
1998 1999 2000 2001 2002 2003 2004
Railroad transportation
Number of passengers 215,000 200,998 236,613 275,966 220,188 187,160 209,183
Parcels … … … … Merchandise 3,291 2,821 3,168 2,953 2,966 3,044 2,951 Total 3,291 2,821 3,168 2,953 2,966 3,044 3,017
Merchandise traffic 3,291 2,821 3,168 2,953 2,966 3,044 2,951Timber 806 933 1,061 969 913 772 894Clinker 39 26 26 28 25 19 27Quarry materials 186 … 27 ... ... ... ...Oil 39 26 30 40 44 42 34Manganese 2,110 1,716 1,885 1,736 1,794 2,044 1,878Other 111 120 140 178 190 166 118
Number of passengers(thousands) 215 201 237 276 220 187 209
Merchandise traffic in harbors
OwendoIn 760 705 783 640 632 600 627Out 2,906 2,939 3,198 2,946 2,930 2,782 2,906Total 3,666 3,644 3,981 3,586 3,562 3,382 3,534
Port-GentilIn 136 147 141 138 131 139 149Out 9,793 14,778 13,287 13,047 12,499 13,223 14,238Total 9,929 14,925 13,428 13,185 12,630 13,362 14,387
Air transportation
Number of passengers 870,939 806,490 741,733 757,089 865,058 901,665 761,604
Number of flights 44,436 27,536 26,916 27,152 32,487 32,765 33,679
Shipping and mailing 18 15 15 15 17 16 16
Source: Ministry of Planning, Development Programming, and Land Development.
1/ Authorities have provided incomplete data through 2001.
(In thousands of tons, unless otherwise indicated)
Table 18. Gabon: Transportation, 1998–2004
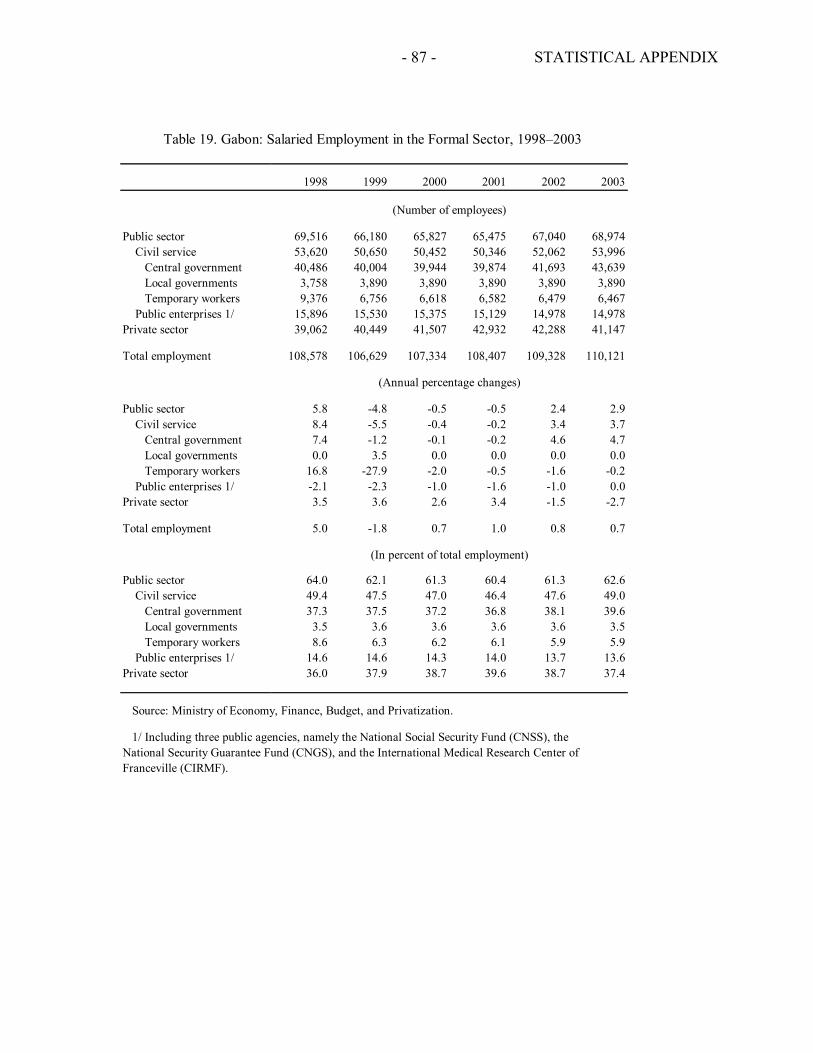
STATISTICAL APPENDIX
- 87 -
1998 1999 2000 2001 2002 2003
Public sector 69,516 66,180 65,827 65,475 67,040 68,974 Civil service 53,620 50,650 50,452 50,346 52,062 53,996 Central government 40,486 40,004 39,944 39,874 41,693 43,639 Local governments 3,758 3,890 3,890 3,890 3,890 3,890 Temporary workers 9,376 6,756 6,618 6,582 6,479 6,467 Public enterprises 1/ 15,896 15,530 15,375 15,129 14,978 14,978Private sector 39,062 40,449 41,507 42,932 42,288 41,147
Total employment 108,578 106,629 107,334 108,407 109,328 110,121
Public sector 5.8 -4.8 -0.5 -0.5 2.4 2.9 Civil service 8.4 -5.5 -0.4 -0.2 3.4 3.7 Central government 7.4 -1.2 -0.1 -0.2 4.6 4.7 Local governments 0.0 3.5 0.0 0.0 0.0 0.0 Temporary workers 16.8 -27.9 -2.0 -0.5 -1.6 -0.2 Public enterprises 1/ -2.1 -2.3 -1.0 -1.6 -1.0 0.0Private sector 3.5 3.6 2.6 3.4 -1.5 -2.7
Total employment 5.0 -1.8 0.7 1.0 0.8 0.7
Public sector 64.0 62.1 61.3 60.4 61.3 62.6 Civil service 49.4 47.5 47.0 46.4 47.6 49.0 Central government 37.3 37.5 37.2 36.8 38.1 39.6 Local governments 3.5 3.6 3.6 3.6 3.6 3.5 Temporary workers 8.6 6.3 6.2 6.1 5.9 5.9 Public enterprises 1/ 14.6 14.6 14.3 14.0 13.7 13.6Private sector 36.0 37.9 38.7 39.6 38.7 37.4
Source: Ministry of Economy, Finance, Budget, and Privatization.
1/ Including three public agencies, namely the National Social Security Fund (CNSS), theNational Security Guarantee Fund (CNGS), and the International Medical Research Center of Franceville (CIRMF).
(Number of employees)
(Annual percentage changes)
(In percent of total employment)
Table 19. Gabon: Salaried Employment in the Formal Sector, 1998–2003
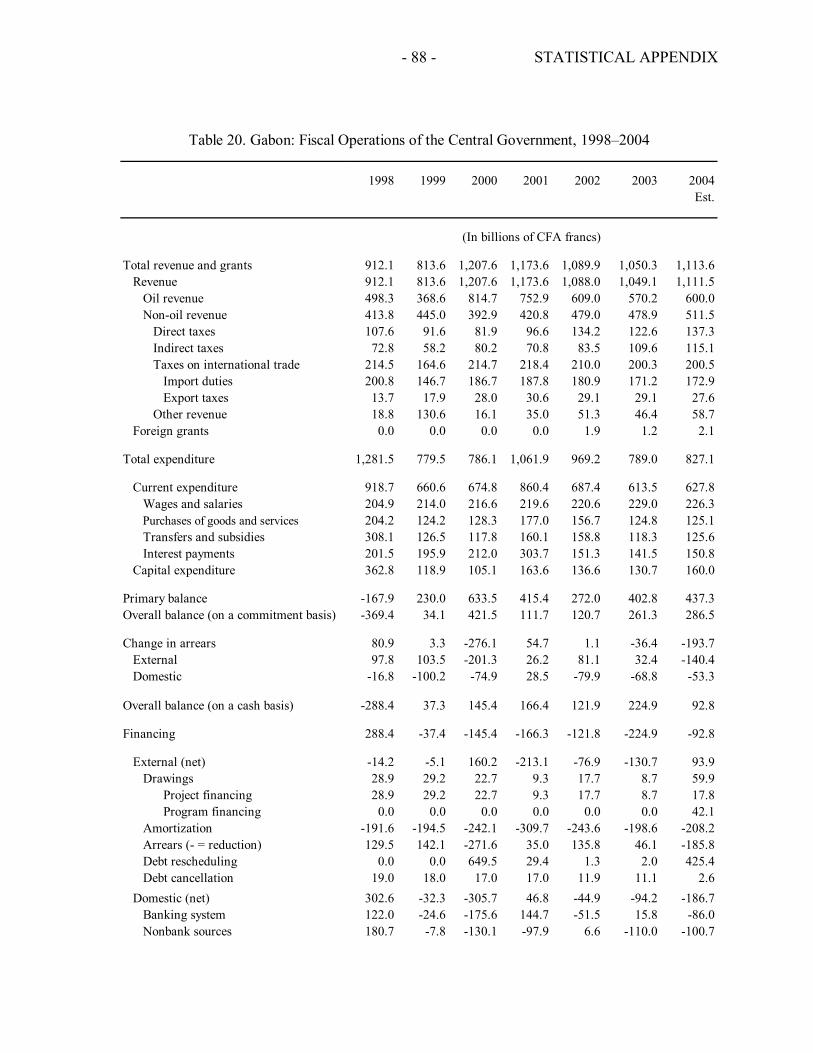
STATISTICAL APPENDIX
- 88 -
1998 1999 2000 2001 2002 2003 2004Est.
Total revenue and grants 912.1 813.6 1,207.6 1,173.6 1,089.9 1,050.3 1,113.6Revenue 912.1 813.6 1,207.6 1,173.6 1,088.0 1,049.1 1,111.5
Oil revenue 498.3 368.6 814.7 752.9 609.0 570.2 600.0Non-oil revenue 413.8 445.0 392.9 420.8 479.0 478.9 511.5
Direct taxes 107.6 91.6 81.9 96.6 134.2 122.6 137.3Indirect taxes 72.8 58.2 80.2 70.8 83.5 109.6 115.1Taxes on international trade 214.5 164.6 214.7 218.4 210.0 200.3 200.5
Import duties 200.8 146.7 186.7 187.8 180.9 171.2 172.9Export taxes 13.7 17.9 28.0 30.6 29.1 29.1 27.6
Other revenue 18.8 130.6 16.1 35.0 51.3 46.4 58.7Foreign grants 0.0 0.0 0.0 0.0 1.9 1.2 2.1
Total expenditure 1,281.5 779.5 786.1 1,061.9 969.2 789.0 827.1
Current expenditure 918.7 660.6 674.8 860.4 687.4 613.5 627.8Wages and salaries 204.9 214.0 216.6 219.6 220.6 229.0 226.3Purchases of goods and services 204.2 124.2 128.3 177.0 156.7 124.8 125.1Transfers and subsidies 308.1 126.5 117.8 160.1 158.8 118.3 125.6Interest payments 201.5 195.9 212.0 303.7 151.3 141.5 150.8
Capital expenditure 362.8 118.9 105.1 163.6 136.6 130.7 160.0
Primary balance -167.9 230.0 633.5 415.4 272.0 402.8 437.3Overall balance (on a commitment basis) -369.4 34.1 421.5 111.7 120.7 261.3 286.5
Change in arrears 80.9 3.3 -276.1 54.7 1.1 -36.4 -193.7External 97.8 103.5 -201.3 26.2 81.1 32.4 -140.4Domestic -16.8 -100.2 -74.9 28.5 -79.9 -68.8 -53.3
Overall balance (on a cash basis) -288.4 37.3 145.4 166.4 121.9 224.9 92.8
Financing 288.4 -37.4 -145.4 -166.3 -121.8 -224.9 -92.8
External (net) -14.2 -5.1 160.2 -213.1 -76.9 -130.7 93.9Drawings 28.9 29.2 22.7 9.3 17.7 8.7 59.9
Project financing 28.9 29.2 22.7 9.3 17.7 8.7 17.8 Program financing 0.0 0.0 0.0 0.0 0.0 0.0 42.1
Amortization -191.6 -194.5 -242.1 -309.7 -243.6 -198.6 -208.2Arrears (- = reduction) 129.5 142.1 -271.6 35.0 135.8 46.1 -185.8Debt rescheduling 0.0 0.0 649.5 29.4 1.3 2.0 425.4Debt cancellation 19.0 18.0 17.0 17.0 11.9 11.1 2.6
Domestic (net) 302.6 -32.3 -305.7 46.8 -44.9 -94.2 -186.7Banking system 122.0 -24.6 -175.6 144.7 -51.5 15.8 -86.0Nonbank sources 180.7 -7.8 -130.1 -97.9 6.6 -110.0 -100.7
Table 20. Gabon: Fiscal Operations of the Central Government, 1998–2004
(In billions of CFA francs)
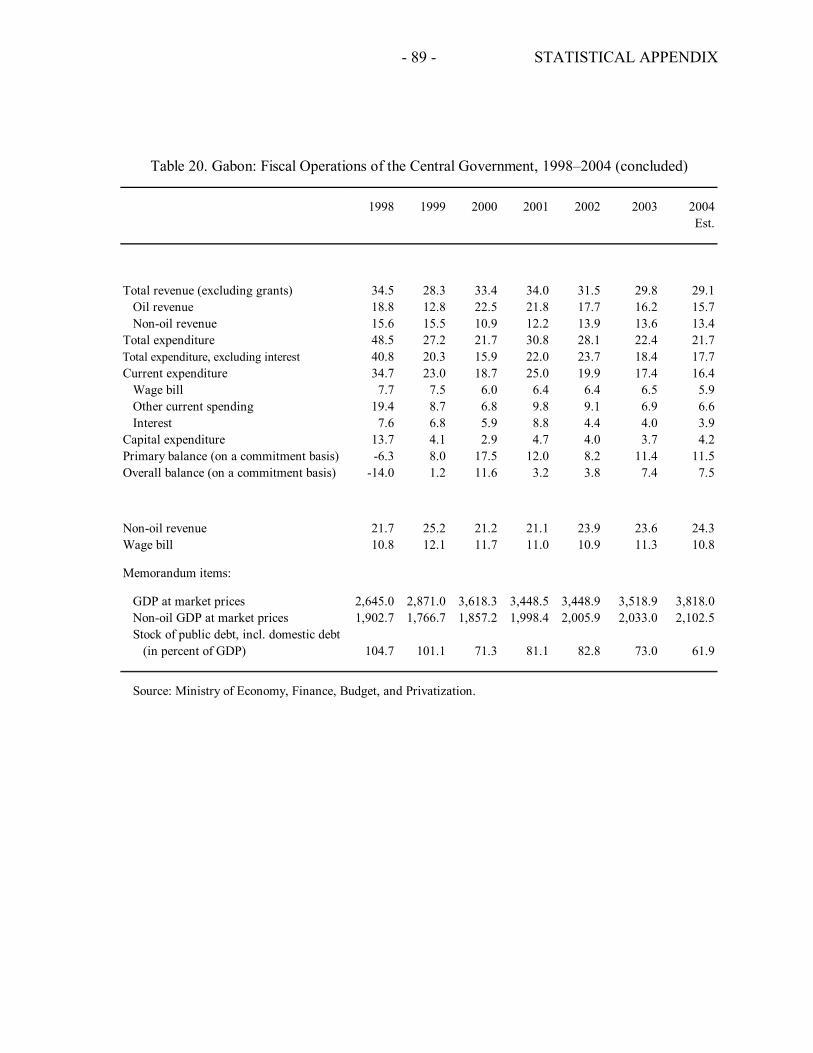
STATISTICAL APPENDIX
- 89 -
1998 1999 2000 2001 2002 2003 2004Est.
Total revenue (excluding grants) 34.5 28.3 33.4 34.0 31.5 29.8 29.1Oil revenue 18.8 12.8 22.5 21.8 17.7 16.2 15.7Non-oil revenue 15.6 15.5 10.9 12.2 13.9 13.6 13.4
Total expenditure 48.5 27.2 21.7 30.8 28.1 22.4 21.7Total expenditure, excluding interest 40.8 20.3 15.9 22.0 23.7 18.4 17.7Current expenditure 34.7 23.0 18.7 25.0 19.9 17.4 16.4
Wage bill 7.7 7.5 6.0 6.4 6.4 6.5 5.9Other current spending 19.4 8.7 6.8 9.8 9.1 6.9 6.6Interest 7.6 6.8 5.9 8.8 4.4 4.0 3.9
Capital expenditure 13.7 4.1 2.9 4.7 4.0 3.7 4.2Primary balance (on a commitment basis) -6.3 8.0 17.5 12.0 8.2 11.4 11.5Overall balance (on a commitment basis) -14.0 1.2 11.6 3.2 3.8 7.4 7.5
Non-oil revenue 21.7 25.2 21.2 21.1 23.9 23.6 24.3Wage bill 10.8 12.1 11.7 11.0 10.9 11.3 10.8
Memorandum items:
GDP at market prices 2,645.0 2,871.0 3,618.3 3,448.5 3,448.9 3,518.9 3,818.0Non-oil GDP at market prices 1,902.7 1,766.7 1,857.2 1,998.4 2,005.9 2,033.0 2,102.5Stock of public debt, incl. domestic debt
(in percent of GDP) 104.7 101.1 71.3 81.1 82.8 73.0 61.9
Source: Ministry of Economy, Finance, Budget, and Privatization.
Table 20. Gabon: Fiscal Operations of the Central Government, 1998–2004 (concluded)
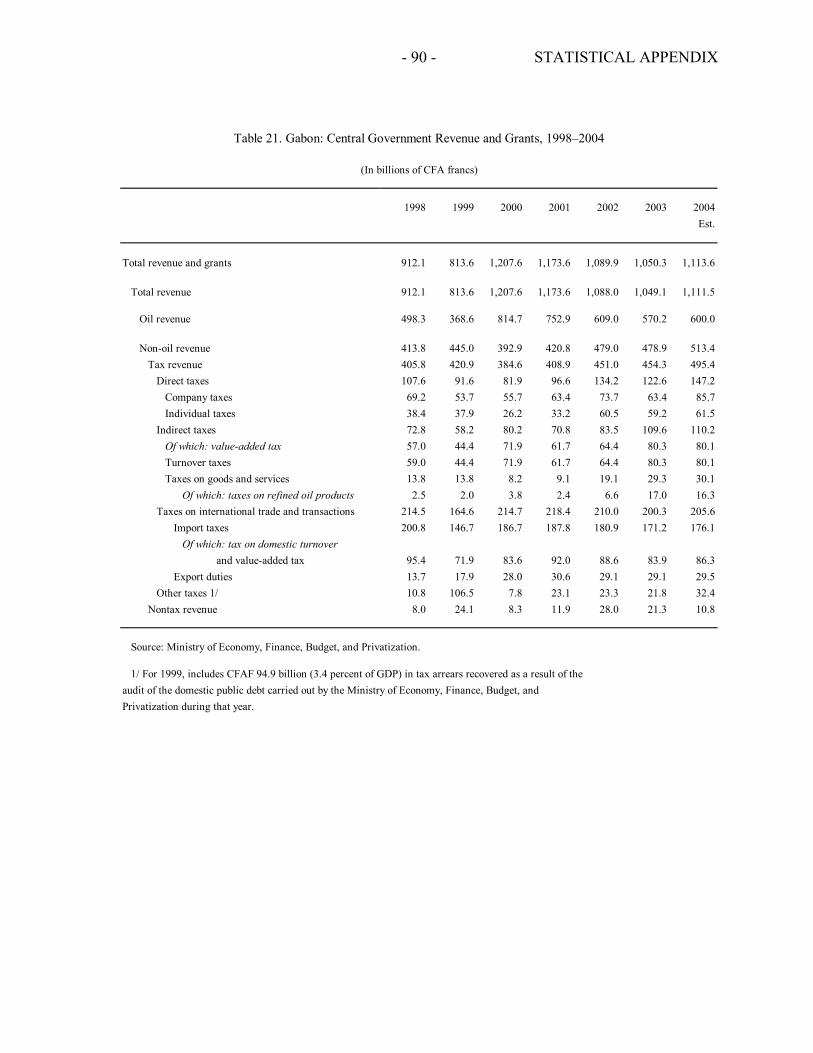
STATISTICAL APPENDIX
- 90 -
1998 1999 2000 2001 2002 2003 2004Est.
Total revenue and grants 912.1 813.6 1,207.6 1,173.6 1,089.9 1,050.3 1,113.6
Total revenue 912.1 813.6 1,207.6 1,173.6 1,088.0 1,049.1 1,111.5
Oil revenue 498.3 368.6 814.7 752.9 609.0 570.2 600.0
Non-oil revenue 413.8 445.0 392.9 420.8 479.0 478.9 513.4Tax revenue 405.8 420.9 384.6 408.9 451.0 454.3 495.4
Direct taxes 107.6 91.6 81.9 96.6 134.2 122.6 147.2Company taxes 69.2 53.7 55.7 63.4 73.7 63.4 85.7Individual taxes 38.4 37.9 26.2 33.2 60.5 59.2 61.5
Indirect taxes 72.8 58.2 80.2 70.8 83.5 109.6 110.2Of which: value-added tax 57.0 44.4 71.9 61.7 64.4 80.3 80.1Turnover taxes 59.0 44.4 71.9 61.7 64.4 80.3 80.1Taxes on goods and services 13.8 13.8 8.2 9.1 19.1 29.3 30.1
Of which: taxes on refined oil products 2.5 2.0 3.8 2.4 6.6 17.0 16.3Taxes on international trade and transactions 214.5 164.6 214.7 218.4 210.0 200.3 205.6
Import taxes 200.8 146.7 186.7 187.8 180.9 171.2 176.1Of which: tax on domestic turnover
and value-added tax 95.4 71.9 83.6 92.0 88.6 83.9 86.3Export duties 13.7 17.9 28.0 30.6 29.1 29.1 29.5
Other taxes 1/ 10.8 106.5 7.8 23.1 23.3 21.8 32.4Nontax revenue 8.0 24.1 8.3 11.9 28.0 21.3 10.8
Source: Ministry of Economy, Finance, Budget, and Privatization.
1/ For 1999, includes CFAF 94.9 billion (3.4 percent of GDP) in tax arrears recovered as a result of theaudit of the domestic public debt carried out by the Ministry of Economy, Finance, Budget, and Privatization during that year.
Table 21. Gabon: Central Government Revenue and Grants, 1998–2004
(In billions of CFA francs)
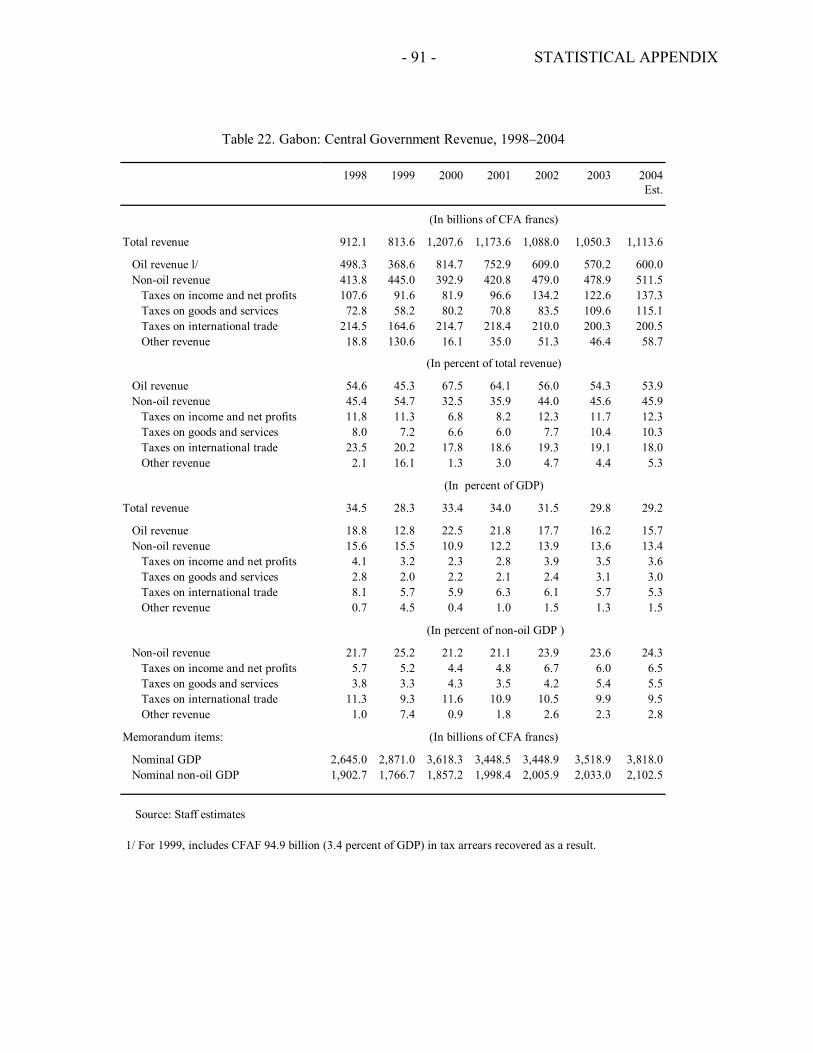
STATISTICAL APPENDIX
- 91 -
1998 1999 2000 2001 2002 2003 2004
Est.
Total revenue 912.1 813.6 1,207.6 1,173.6 1,088.0 1,050.3 1,113.6
Oil revenue l/ 498.3 368.6 814.7 752.9 609.0 570.2 600.0Non-oil revenue 413.8 445.0 392.9 420.8 479.0 478.9 511.5
Taxes on income and net profits 107.6 91.6 81.9 96.6 134.2 122.6 137.3Taxes on goods and services 72.8 58.2 80.2 70.8 83.5 109.6 115.1Taxes on international trade 214.5 164.6 214.7 218.4 210.0 200.3 200.5Other revenue 18.8 130.6 16.1 35.0 51.3 46.4 58.7
Oil revenue 54.6 45.3 67.5 64.1 56.0 54.3 53.9Non-oil revenue 45.4 54.7 32.5 35.9 44.0 45.6 45.9
Taxes on income and net profits 11.8 11.3 6.8 8.2 12.3 11.7 12.3Taxes on goods and services 8.0 7.2 6.6 6.0 7.7 10.4 10.3Taxes on international trade 23.5 20.2 17.8 18.6 19.3 19.1 18.0Other revenue 2.1 16.1 1.3 3.0 4.7 4.4 5.3
Total revenue 34.5 28.3 33.4 34.0 31.5 29.8 29.2
Oil revenue 18.8 12.8 22.5 21.8 17.7 16.2 15.7Non-oil revenue 15.6 15.5 10.9 12.2 13.9 13.6 13.4
Taxes on income and net profits 4.1 3.2 2.3 2.8 3.9 3.5 3.6Taxes on goods and services 2.8 2.0 2.2 2.1 2.4 3.1 3.0Taxes on international trade 8.1 5.7 5.9 6.3 6.1 5.7 5.3Other revenue 0.7 4.5 0.4 1.0 1.5 1.3 1.5
Non-oil revenue 21.7 25.2 21.2 21.1 23.9 23.6 24.3Taxes on income and net profits 5.7 5.2 4.4 4.8 6.7 6.0 6.5Taxes on goods and services 3.8 3.3 4.3 3.5 4.2 5.4 5.5Taxes on international trade 11.3 9.3 11.6 10.9 10.5 9.9 9.5Other revenue 1.0 7.4 0.9 1.8 2.6 2.3 2.8
Memorandum items:
Nominal GDP 2,645.0 2,871.0 3,618.3 3,448.5 3,448.9 3,518.9 3,818.0Nominal non-oil GDP 1,902.7 1,766.7 1,857.2 1,998.4 2,005.9 2,033.0 2,102.5
Source: Staff estimates
1/ For 1999, includes CFAF 94.9 billion (3.4 percent of GDP) in tax arrears recovered as a result.
(In percent of non-oil GDP )
(In billions of CFA francs)
Table 22. Gabon: Central Government Revenue, 1998–2004
(In billions of CFA francs)
(In percent of total revenue)
(In percent of GDP)
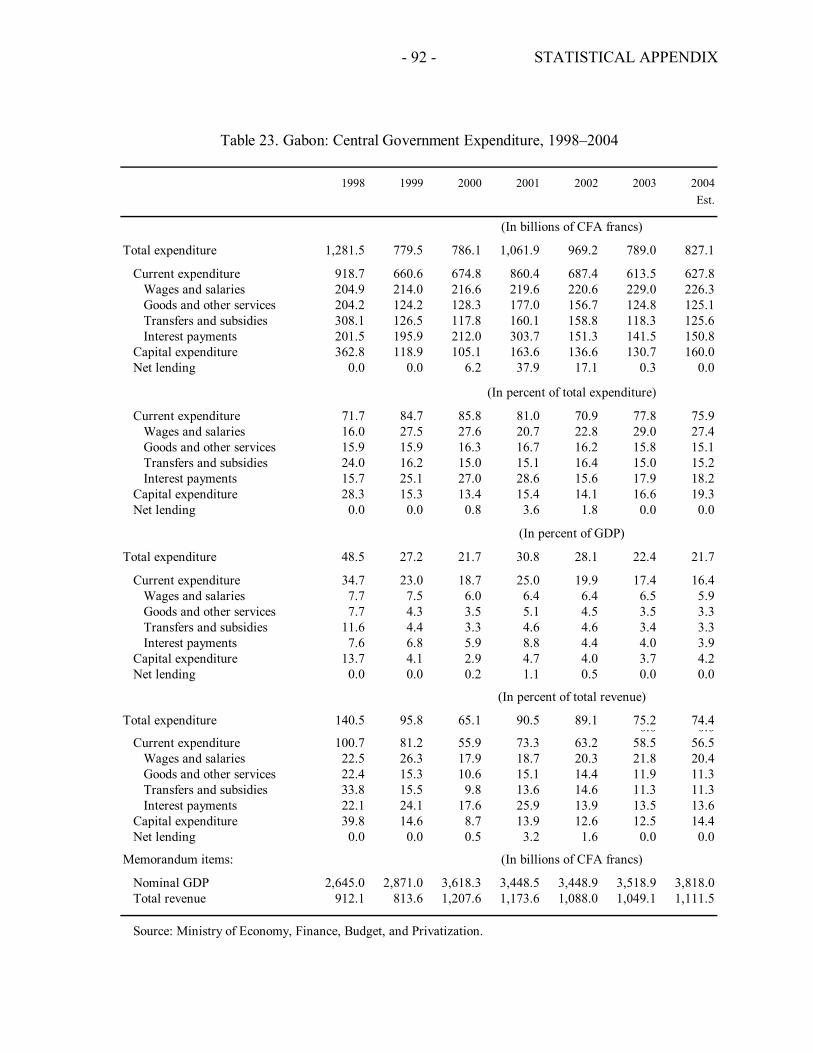
STATISTICAL APPENDIX
- 92 -
1998 1999 2000 2001 2002 2003 2004Est.
(In billions of CFA francs)
Total expenditure 1,281.5 779.5 786.1 1,061.9 969.2 789.0 827.1
Current expenditure 918.7 660.6 674.8 860.4 687.4 613.5 627.8Wages and salaries 204.9 214.0 216.6 219.6 220.6 229.0 226.3Goods and other services 204.2 124.2 128.3 177.0 156.7 124.8 125.1Transfers and subsidies 308.1 126.5 117.8 160.1 158.8 118.3 125.6Interest payments 201.5 195.9 212.0 303.7 151.3 141.5 150.8
Capital expenditure 362.8 118.9 105.1 163.6 136.6 130.7 160.0Net lending 0.0 0.0 6.2 37.9 17.1 0.3 0.0
(In percent of total expenditure)
Current expenditure 71.7 84.7 85.8 81.0 70.9 77.8 75.9Wages and salaries 16.0 27.5 27.6 20.7 22.8 29.0 27.4Goods and other services 15.9 15.9 16.3 16.7 16.2 15.8 15.1Transfers and subsidies 24.0 16.2 15.0 15.1 16.4 15.0 15.2Interest payments 15.7 25.1 27.0 28.6 15.6 17.9 18.2
Capital expenditure 28.3 15.3 13.4 15.4 14.1 16.6 19.3Net lending 0.0 0.0 0.8 3.6 1.8 0.0 0.0
(In percent of GDP)
Total expenditure 48.5 27.2 21.7 30.8 28.1 22.4 21.7
Current expenditure 34.7 23.0 18.7 25.0 19.9 17.4 16.4Wages and salaries 7.7 7.5 6.0 6.4 6.4 6.5 5.9Goods and other services 7.7 4.3 3.5 5.1 4.5 3.5 3.3Transfers and subsidies 11.6 4.4 3.3 4.6 4.6 3.4 3.3Interest payments 7.6 6.8 5.9 8.8 4.4 4.0 3.9
Capital expenditure 13.7 4.1 2.9 4.7 4.0 3.7 4.2Net lending 0.0 0.0 0.2 1.1 0.5 0.0 0.0
(In percent of total revenue)
Total expenditure 140.5 95.8 65.1 90.5 89.1 75.2 74.40.0 0.0Current expenditure 100.7 81.2 55.9 73.3 63.2 58.5 56.5
Wages and salaries 22.5 26.3 17.9 18.7 20.3 21.8 20.4Goods and other services 22.4 15.3 10.6 15.1 14.4 11.9 11.3Transfers and subsidies 33.8 15.5 9.8 13.6 14.6 11.3 11.3Interest payments 22.1 24.1 17.6 25.9 13.9 13.5 13.6
Capital expenditure 39.8 14.6 8.7 13.9 12.6 12.5 14.4Net lending 0.0 0.0 0.5 3.2 1.6 0.0 0.0
Memorandum items: (In billions of CFA francs)
Nominal GDP 2,645.0 2,871.0 3,618.3 3,448.5 3,448.9 3,518.9 3,818.0Total revenue 912.1 813.6 1,207.6 1,173.6 1,088.0 1,049.1 1,111.5
Source: Ministry of Economy, Finance, Budget, and Privatization.
Table 23. Gabon: Central Government Expenditure, 1998–2004
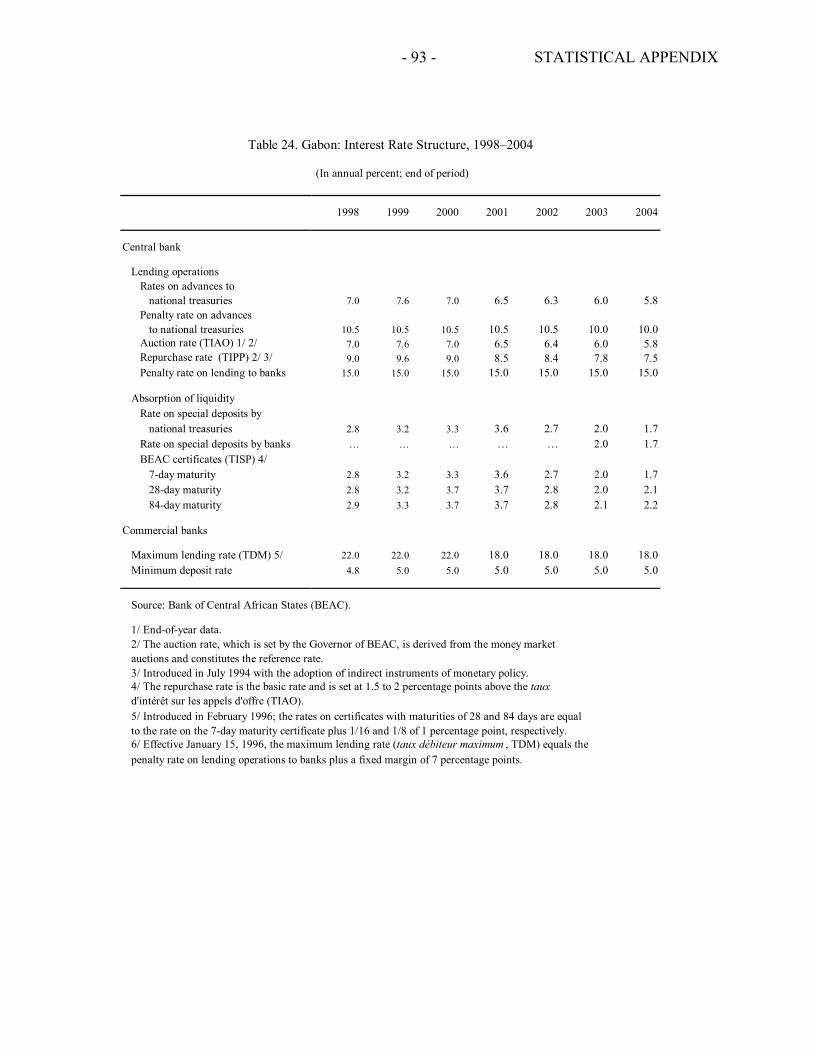
STATISTICAL APPENDIX
- 93 -
1998 1999 2000 2001 2002 2003 2004
Central bank
Lending operationsRates on advances to
national treasuries 7.0 7.6 7.0 6.5 6.3 6.0 5.8Penalty rate on advances
to national treasuries 10.5 10.5 10.5 10.5 10.5 10.0 10.0Auction rate (TIAO) 1/ 2/ 7.0 7.6 7.0 6.5 6.4 6.0 5.8Repurchase rate (TIPP) 2/ 3/ 9.0 9.6 9.0 8.5 8.4 7.8 7.5Penalty rate on lending to banks 15.0 15.0 15.0 15.0 15.0 15.0 15.0
Absorption of liquidityRate on special deposits by
national treasuries 2.8 3.2 3.3 3.6 2.7 2.0 1.7Rate on special deposits by banks … … … … … 2.0 1.7BEAC certificates (TISP) 4/
7-day maturity 2.8 3.2 3.3 3.6 2.7 2.0 1.728-day maturity 2.8 3.2 3.7 3.7 2.8 2.0 2.184-day maturity 2.9 3.3 3.7 3.7 2.8 2.1 2.2
Commercial banks
Maximum lending rate (TDM) 5/ 22.0 22.0 22.0 18.0 18.0 18.0 18.0Minimum deposit rate 4.8 5.0 5.0 5.0 5.0 5.0 5.0
Source: Bank of Central African States (BEAC).
1/ End-of-year data.2/ The auction rate, which is set by the Governor of BEAC, is derived from the money marketauctions and constitutes the reference rate.3/ Introduced in July 1994 with the adoption of indirect instruments of monetary policy.4/ The repurchase rate is the basic rate and is set at 1.5 to 2 percentage points above the tauxd'intérêt sur les appels d'offre (TIAO).5/ Introduced in February 1996; the rates on certificates with maturities of 28 and 84 days are equal to the rate on the 7-day maturity certificate plus 1/16 and 1/8 of 1 percentage point, respectively.6/ Effective January 15, 1996, the maximum lending rate (taux débiteur maximum , TDM) equals thepenalty rate on lending operations to banks plus a fixed margin of 7 percentage points.
Table 24. Gabon: Interest Rate Structure, 1998–2004
(In annual percent; end of period)
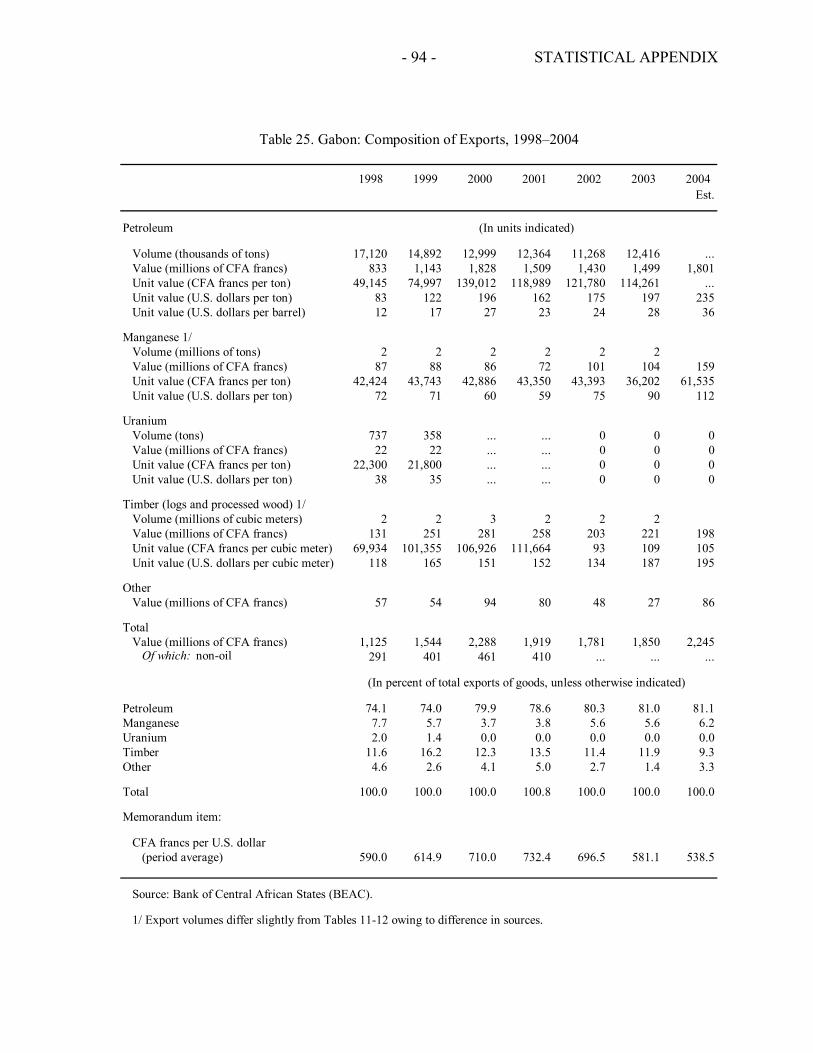
STATISTICAL APPENDIX
- 94 -
1998 1999 2000 2001 2002 2003 2004Est.
Petroleum
Volume (thousands of tons) 17,120 14,892 12,999 12,364 11,268 12,416 ...Value (millions of CFA francs) 833 1,143 1,828 1,509 1,430 1,499 1,801Unit value (CFA francs per ton) 49,145 74,997 139,012 118,989 121,780 114,261 ...Unit value (U.S. dollars per ton) 83 122 196 162 175 197 235Unit value (U.S. dollars per barrel) 12 17 27 23 24 28 36
Manganese 1/Volume (millions of tons) 2 2 2 2 2 2Value (millions of CFA francs) 87 88 86 72 101 104 159Unit value (CFA francs per ton) 42,424 43,743 42,886 43,350 43,393 36,202 61,535Unit value (U.S. dollars per ton) 72 71 60 59 75 90 112
UraniumVolume (tons) 737 358 ... ... 0 0 0Value (millions of CFA francs) 22 22 ... ... 0 0 0Unit value (CFA francs per ton) 22,300 21,800 ... ... 0 0 0Unit value (U.S. dollars per ton) 38 35 ... ... 0 0 0
Timber (logs and processed wood) 1/Volume (millions of cubic meters) 2 2 3 2 2 2Value (millions of CFA francs) 131 251 281 258 203 221 198Unit value (CFA francs per cubic meter) 69,934 101,355 106,926 111,664 93 109 105Unit value (U.S. dollars per cubic meter) 118 165 151 152 134 187 195
OtherValue (millions of CFA francs) 57 54 94 80 48 27 86
TotalValue (millions of CFA francs) 1,125 1,544 2,288 1,919 1,781 1,850 2,245
Of which: non-oil 291 401 461 410 ... ... ...
Petroleum 74.1 74.0 79.9 78.6 80.3 81.0 81.1Manganese 7.7 5.7 3.7 3.8 5.6 5.6 6.2Uranium 2.0 1.4 0.0 0.0 0.0 0.0 0.0Timber 11.6 16.2 12.3 13.5 11.4 11.9 9.3Other 4.6 2.6 4.1 5.0 2.7 1.4 3.3
Total 100.0 100.0 100.0 100.8 100.0 100.0 100.0
Memorandum item:
CFA francs per U.S. dollar(period average) 590.0 614.9 710.0 732.4 696.5 581.1 538.5
Source: Bank of Central African States (BEAC).
1/ Export volumes differ slightly from Tables 11-12 owing to difference in sources.
Table 25. Gabon: Composition of Exports, 1998–2004
(In units indicated)
(In percent of total exports of goods, unless otherwise indicated)
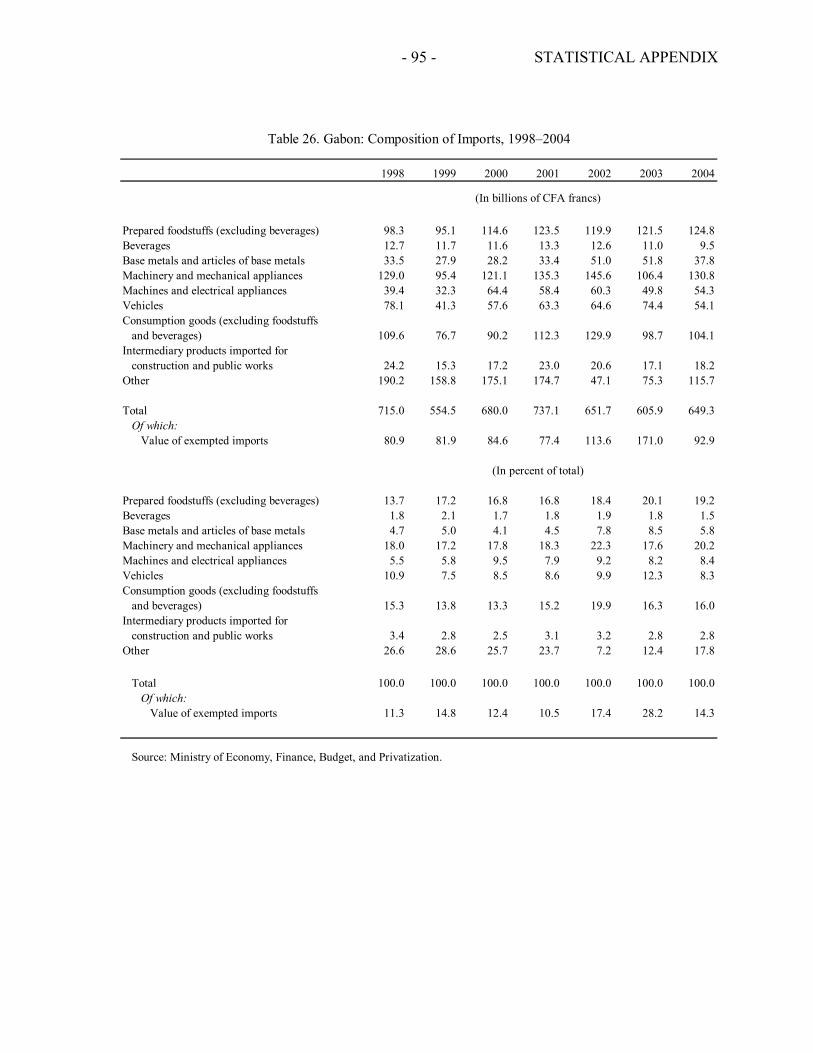
STATISTICAL APPENDIX
- 95 -
1998 1999 2000 2001 2002 2003 2004
Prepared foodstuffs (excluding beverages) 98.3 95.1 114.6 123.5 119.9 121.5 124.8Beverages 12.7 11.7 11.6 13.3 12.6 11.0 9.5Base metals and articles of base metals 33.5 27.9 28.2 33.4 51.0 51.8 37.8Machinery and mechanical appliances 129.0 95.4 121.1 135.3 145.6 106.4 130.8Machines and electrical appliances 39.4 32.3 64.4 58.4 60.3 49.8 54.3Vehicles 78.1 41.3 57.6 63.3 64.6 74.4 54.1Consumption goods (excluding foodstuffs
and beverages) 109.6 76.7 90.2 112.3 129.9 98.7 104.1Intermediary products imported for
construction and public works 24.2 15.3 17.2 23.0 20.6 17.1 18.2Other 190.2 158.8 175.1 174.7 47.1 75.3 115.7
Total 715.0 554.5 680.0 737.1 651.7 605.9 649.3Of which:
Value of exempted imports 80.9 81.9 84.6 77.4 113.6 171.0 92.9
Prepared foodstuffs (excluding beverages) 13.7 17.2 16.8 16.8 18.4 20.1 19.2Beverages 1.8 2.1 1.7 1.8 1.9 1.8 1.5Base metals and articles of base metals 4.7 5.0 4.1 4.5 7.8 8.5 5.8Machinery and mechanical appliances 18.0 17.2 17.8 18.3 22.3 17.6 20.2Machines and electrical appliances 5.5 5.8 9.5 7.9 9.2 8.2 8.4Vehicles 10.9 7.5 8.5 8.6 9.9 12.3 8.3Consumption goods (excluding foodstuffs
and beverages) 15.3 13.8 13.3 15.2 19.9 16.3 16.0Intermediary products imported for
construction and public works 3.4 2.8 2.5 3.1 3.2 2.8 2.8Other 26.6 28.6 25.7 23.7 7.2 12.4 17.8
Total 100.0 100.0 100.0 100.0 100.0 100.0 100.0Of which:
Value of exempted imports 11.3 14.8 12.4 10.5 17.4 28.2 14.3
Source: Ministry of Economy, Finance, Budget, and Privatization.
(In percent of total)
Table 26. Gabon: Composition of Imports, 1998–2004
(In billions of CFA francs)
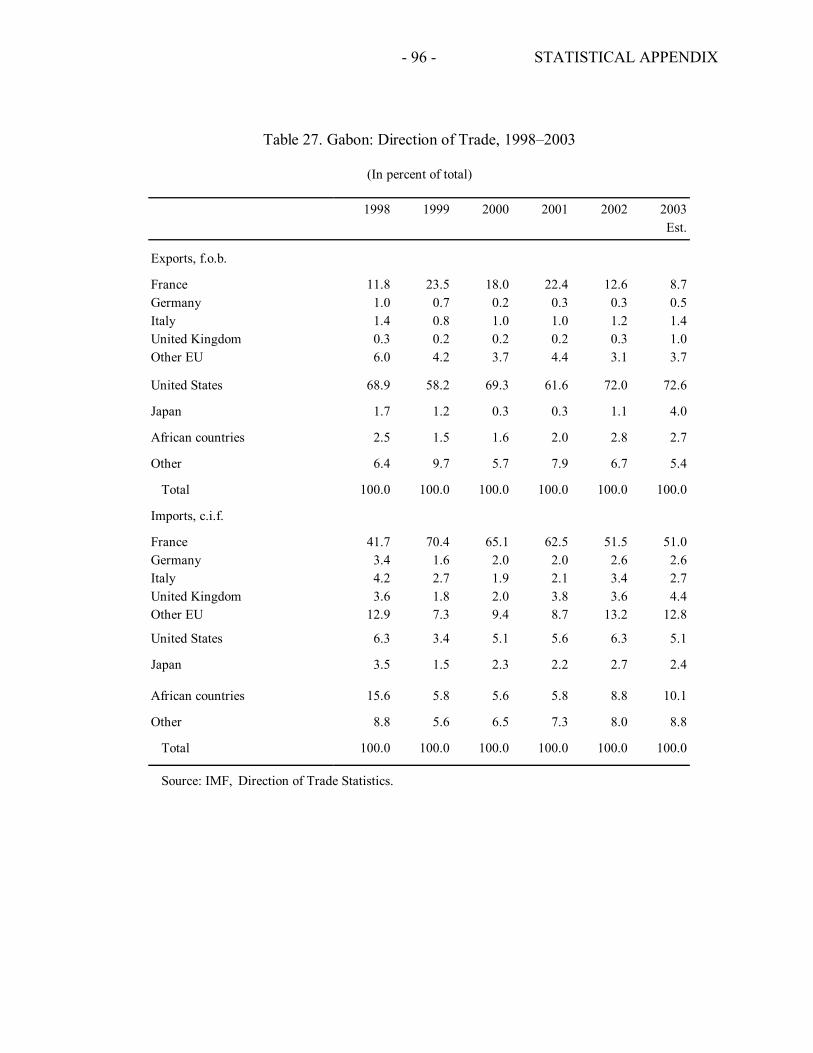
STATISTICAL APPENDIX
- 96 -
1998 1999 2000 2001 2002 2003Est.
Exports, f.o.b.
France 11.8 23.5 18.0 22.4 12.6 8.7Germany 1.0 0.7 0.2 0.3 0.3 0.5Italy 1.4 0.8 1.0 1.0 1.2 1.4United Kingdom 0.3 0.2 0.2 0.2 0.3 1.0Other EU 6.0 4.2 3.7 4.4 3.1 3.7
United States 68.9 58.2 69.3 61.6 72.0 72.6
Japan 1.7 1.2 0.3 0.3 1.1 4.0
African countries 2.5 1.5 1.6 2.0 2.8 2.7
Other 6.4 9.7 5.7 7.9 6.7 5.4
Total 100.0 100.0 100.0 100.0 100.0 100.0
Imports, c.i.f.
France 41.7 70.4 65.1 62.5 51.5 51.0Germany 3.4 1.6 2.0 2.0 2.6 2.6Italy 4.2 2.7 1.9 2.1 3.4 2.7United Kingdom 3.6 1.8 2.0 3.8 3.6 4.4Other EU 12.9 7.3 9.4 8.7 13.2 12.8
United States 6.3 3.4 5.1 5.6 6.3 5.1
Japan 3.5 1.5 2.3 2.2 2.7 2.4
African countries 15.6 5.8 5.6 5.8 8.8 10.1
Other 8.8 5.6 6.5 7.3 8.0 8.8
Total 100.0 100.0 100.0 100.0 100.0 100.0
Source: IMF, Direction of Trade Statistics.
Table 27. Gabon: Direction of Trade, 1998–2003
(In percent of total)
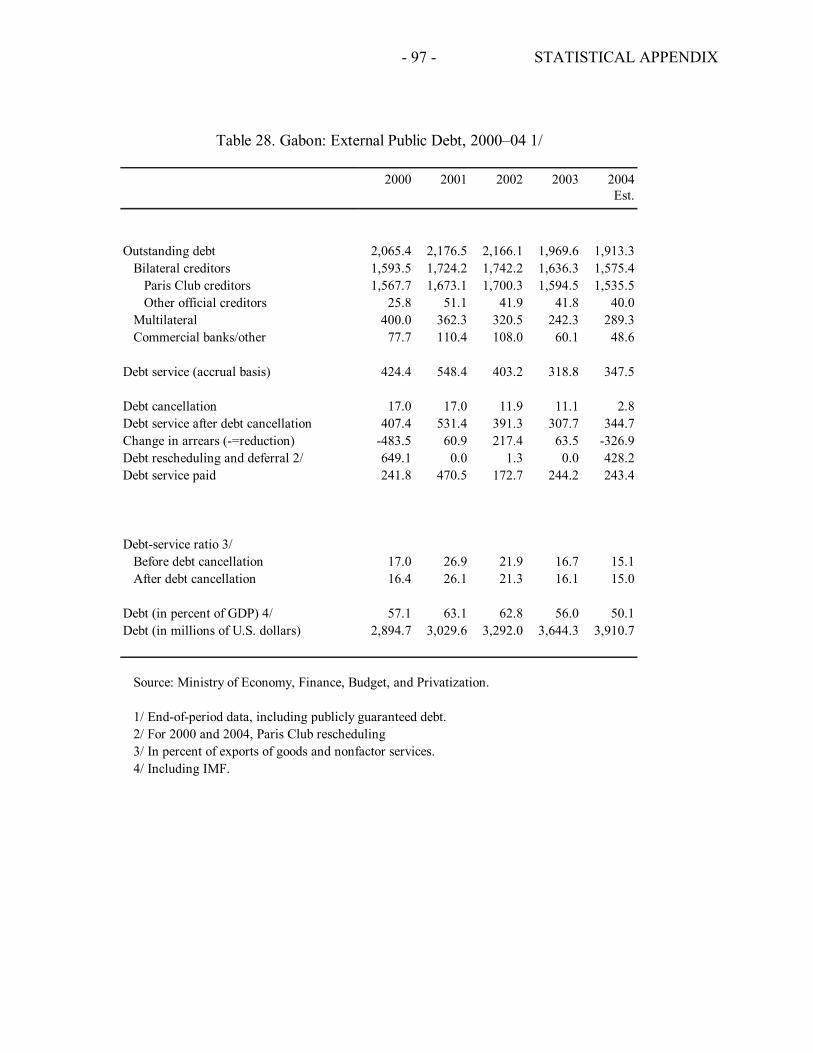
STATISTICAL APPENDIX
- 97 -
2000 2001 2002 2003 2004Est.
Outstanding debt 2,065.4 2,176.5 2,166.1 1,969.6 1,913.3Bilateral creditors 1,593.5 1,724.2 1,742.2 1,636.3 1,575.4
Paris Club creditors 1,567.7 1,673.1 1,700.3 1,594.5 1,535.5Other official creditors 25.8 51.1 41.9 41.8 40.0
Multilateral 400.0 362.3 320.5 242.3 289.3Commercial banks/other 77.7 110.4 108.0 60.1 48.6
Debt service (accrual basis) 424.4 548.4 403.2 318.8 347.5
Debt cancellation 17.0 17.0 11.9 11.1 2.8Debt service after debt cancellation 407.4 531.4 391.3 307.7 344.7Change in arrears (-=reduction) -483.5 60.9 217.4 63.5 -326.9Debt rescheduling and deferral 2/ 649.1 0.0 1.3 0.0 428.2Debt service paid 241.8 470.5 172.7 244.2 243.4
Debt-service ratio 3/Before debt cancellation 17.0 26.9 21.9 16.7 15.1After debt cancellation 16.4 26.1 21.3 16.1 15.0
Debt (in percent of GDP) 4/ 57.1 63.1 62.8 56.0 50.1Debt (in millions of U.S. dollars) 2,894.7 3,029.6 3,292.0 3,644.3 3,910.7
Source: Ministry of Economy, Finance, Budget, and Privatization.
1/ End-of-period data, including publicly guaranteed debt.2/ For 2000 and 2004, Paris Club rescheduling3/ In percent of exports of goods and nonfactor services.4/ Including IMF.
Table 28. Gabon: External Public Debt, 2000–04 1/