Embed Size (px)
Citation preview
ICES Advice on fishing opportunities, catch, and effort Greater North Sea Ecoregion Published 14 November 2017 cod.27.47d20 DOI: 10.17895/ices.pub.3526
ICES Advice 2017 1
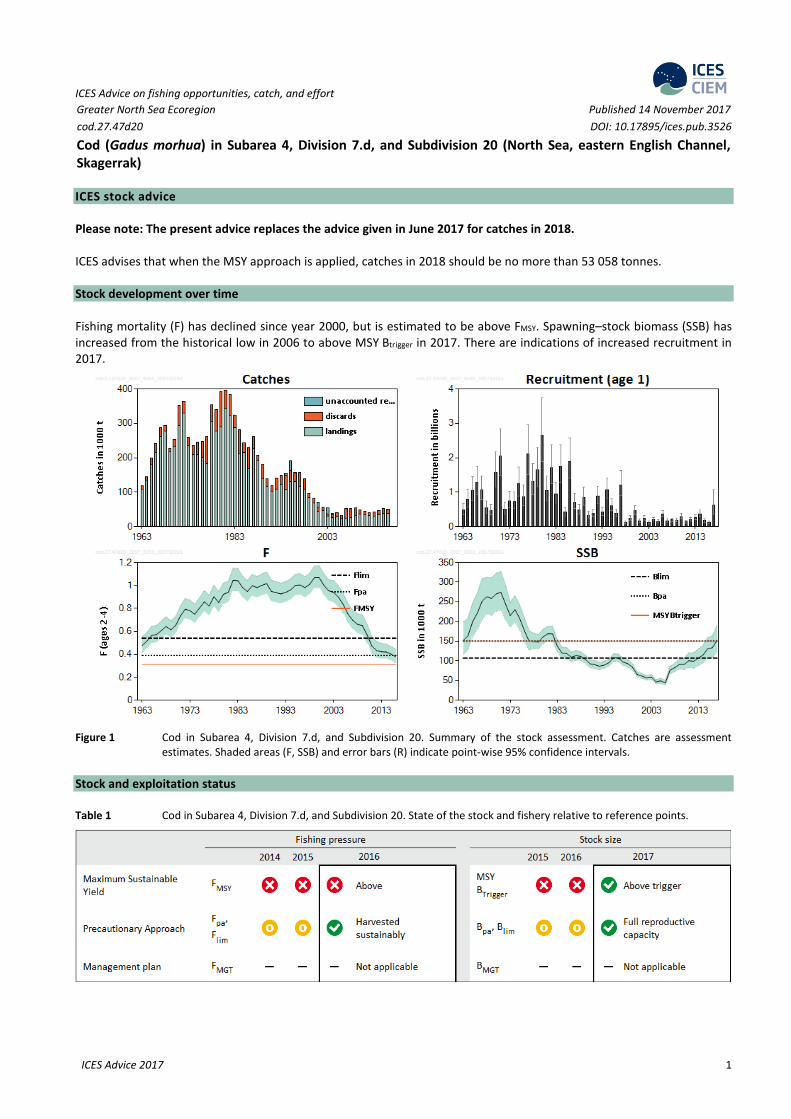
Cod (Gadus morhua) in Subarea 4, Division 7.d, and Subdivision 20 (North Sea, eastern English Channel, Skagerrak) ICES stock advice Please note: The present advice replaces the advice given in June 2017 for catches in 2018. ICES advises that when the MSY approach is applied, catches in 2018 should be no more than 53 058 tonnes. Stock development over time Fishing mortality (F) has declined since year 2000, but is estimated to be above FMSY. Spawning–stock biomass (SSB) has increased from the historical low in 2006 to above MSY Btrigger in 2017. There are indications of increased recruitment in 2017.
Figure 1 Cod in Subarea 4, Division 7.d, and Subdivision 20. Summary of the stock assessment. Catches are assessment estimates. Shaded areas (F, SSB) and error bars (R) indicate point-wise 95% confidence intervals.
Stock and exploitation status Table 1 Cod in Subarea 4, Division 7.d, and Subdivision 20. State of the stock and fishery relative to reference points.
ICES Advice on fishing opportunities, catch, and effort Published 14 November 2017 cod.27.47d20
ICES Advice 2017 2
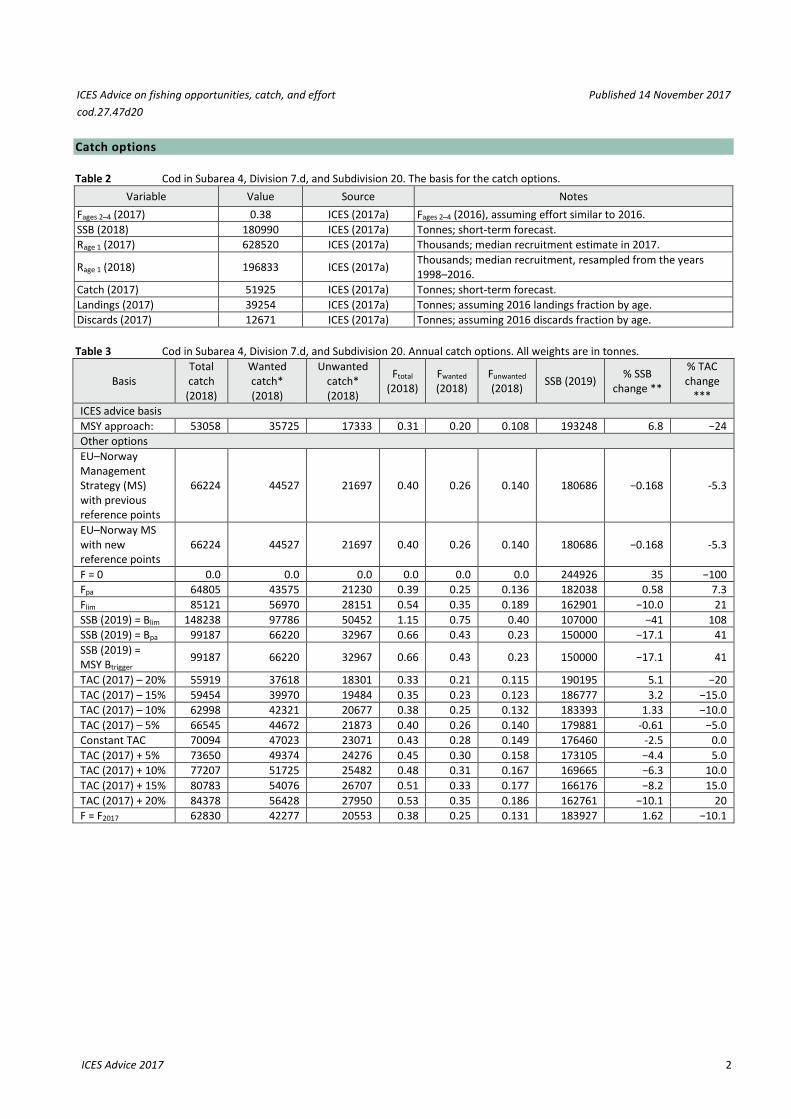
Catch options Table 2 Cod in Subarea 4, Division 7.d, and Subdivision 20. The basis for the catch options.
Variable Value Source Notes Fages 2–4 (2017) 0.38 ICES (2017a) Fages 2–4 (2016), assuming effort similar to 2016. SSB (2018) 180990 ICES (2017a) Tonnes; short-term forecast. Rage 1 (2017) 628520 ICES (2017a) Thousands; median recruitment estimate in 2017.
Rage 1 (2018) 196833 ICES (2017a) Thousands; median recruitment, resampled from the years 1998–2016.
Catch (2017) 51925 ICES (2017a) Tonnes; short-term forecast. Landings (2017) 39254 ICES (2017a) Tonnes; assuming 2016 landings fraction by age. Discards (2017) 12671 ICES (2017a) Tonnes; assuming 2016 discards fraction by age. Table 3 Cod in Subarea 4, Division 7.d, and Subdivision 20. Annual catch options. All weights are in tonnes.
Basis Total catch
(2018)
Wanted catch* (2018)
Unwanted catch* (2018)
Ftotal (2018)
Fwanted (2018)
Funwanted (2018) SSB (2019) % SSB
change **
% TAC change
*** ICES advice basis MSY approach:
53058 35725 17333 0.31 0.20 0.108 193248 6.8 −24
Other options EU–Norway Management Strategy (MS) with previous reference points
66224 44527 21697 0.40 0.26 0.140 180686 −0.168 -5.3
EU–Norway MS with new reference points
66224 44527 21697 0.40 0.26 0.140 180686 −0.168 -5.3
F = 0 0.0 0.0 0.0 0.0 0.0 0.0 244926 35 −100 Fpa 64805 43575 21230 0.39 0.25 0.136 182038 0.58 7.3 Flim 85121 56970 28151 0.54 0.35 0.189 162901 −10.0 21 SSB (2019) = Blim 148238 97786 50452 1.15 0.75 0.40 107000 −41 108 SSB (2019) = Bpa 99187 66220 32967 0.66 0.43 0.23 150000 −17.1 41 SSB (2019) = MSY Btrigger
99187 66220 32967 0.66 0.43 0.23 150000 −17.1 41
TAC (2017) – 20% 55919 37618 18301 0.33 0.21 0.115 190195 5.1 −20 TAC (2017) – 15% 59454 39970 19484 0.35 0.23 0.123 186777 3.2 −15.0 TAC (2017) – 10% 62998 42321 20677 0.38 0.25 0.132 183393 1.33 −10.0 TAC (2017) – 5% 66545 44672 21873 0.40 0.26 0.140 179881 -0.61 −5.0 Constant TAC 70094 47023 23071 0.43 0.28 0.149 176460 -2.5 0.0 TAC (2017) + 5% 73650 49374 24276 0.45 0.30 0.158 173105 −4.4 5.0 TAC (2017) + 10% 77207 51725 25482 0.48 0.31 0.167 169665 −6.3 10.0 TAC (2017) + 15% 80783 54076 26707 0.51 0.33 0.177 166176 −8.2 15.0 TAC (2017) + 20% 84378 56428 27950 0.53 0.35 0.186 162761 −10.1 20 F = F2017 62830 42277 20553 0.38 0.25 0.131 183927 1.62 −10.1
ICES Advice on fishing opportunities, catch, and effort Published 14 November 2017 cod.27.47d20
ICES Advice 2017 3
Basis Total catch
(2018)
Wanted catch* (2018)
Unwanted catch* (2018)
Ftotal (2018)
Fwanted (2018)
Funwanted (2018) SSB (2019) % SSB
change **
% TAC change
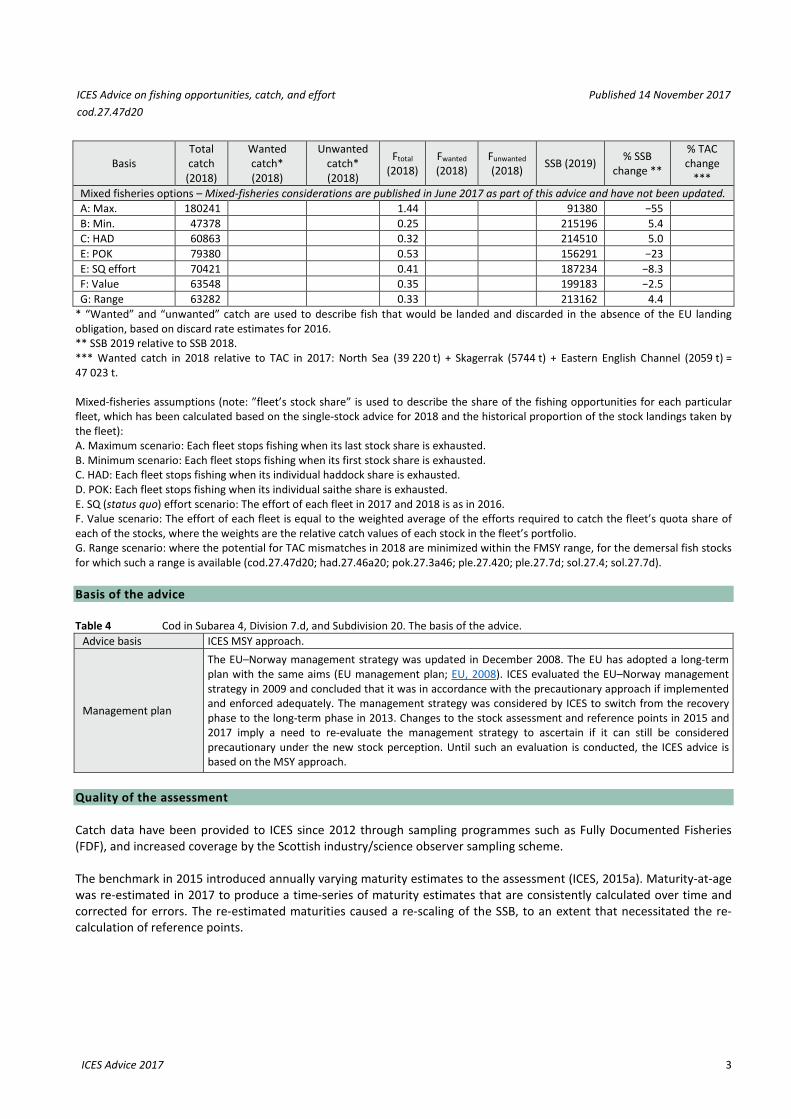
*** Mixed fisheries options – Mixed-fisheries considerations are published in June 2017 as part of this advice and have not been updated. A: Max. 180241 1.44 91380 −55 B: Min. 47378 0.25 215196 5.4 C: HAD 60863 0.32 214510 5.0 E: POK 79380 0.53 156291 −23 E: SQ effort 70421 0.41 187234 −8.3 F: Value 63548 0.35 199183 −2.5 G: Range 63282 0.33 213162 4.4
* “Wanted” and “unwanted” catch are used to describe fish that would be landed and discarded in the absence of the EU landing obligation, based on discard rate estimates for 2016. ** SSB 2019 relative to SSB 2018. *** Wanted catch in 2018 relative to TAC in 2017: North Sea (39 220 t) + Skagerrak (5744 t) + Eastern English Channel (2059 t) = 47 023 t. Mixed-fisheries assumptions (note: ”fleet’s stock share” is used to describe the share of the fishing opportunities for each particular fleet, which has been calculated based on the single-stock advice for 2018 and the historical proportion of the stock landings taken by the fleet): A. Maximum scenario: Each fleet stops fishing when its last stock share is exhausted. B. Minimum scenario: Each fleet stops fishing when its first stock share is exhausted. C. HAD: Each fleet stops fishing when its individual haddock share is exhausted. D. POK: Each fleet stops fishing when its individual saithe share is exhausted. E. SQ (status quo) effort scenario: The effort of each fleet in 2017 and 2018 is as in 2016. F. Value scenario: The effort of each fleet is equal to the weighted average of the efforts required to catch the fleet’s quota share of each of the stocks, where the weights are the relative catch values of each stock in the fleet’s portfolio. G. Range scenario: where the potential for TAC mismatches in 2018 are minimized within the FMSY range, for the demersal fish stocks for which such a range is available (cod.27.47d20; had.27.46a20; pok.27.3a46; ple.27.420; ple.27.7d; sol.27.4; sol.27.7d). Basis of the advice Table 4 Cod in Subarea 4, Division 7.d, and Subdivision 20. The basis of the advice.
Advice basis ICES MSY approach.
Management plan
The EU–Norway management strategy was updated in December 2008. The EU has adopted a long-term plan with the same aims (EU management plan; EU, 2008). ICES evaluated the EU–Norway management strategy in 2009 and concluded that it was in accordance with the precautionary approach if implemented and enforced adequately. The management strategy was considered by ICES to switch from the recovery phase to the long-term phase in 2013. Changes to the stock assessment and reference points in 2015 and 2017 imply a need to re-evaluate the management strategy to ascertain if it can still be considered precautionary under the new stock perception. Until such an evaluation is conducted, the ICES advice is based on the MSY approach.
Quality of the assessment Catch data have been provided to ICES since 2012 through sampling programmes such as Fully Documented Fisheries (FDF), and increased coverage by the Scottish industry/science observer sampling scheme. The benchmark in 2015 introduced annually varying maturity estimates to the assessment (ICES, 2015a). Maturity-at-age was re-estimated in 2017 to produce a time-series of maturity estimates that are consistently calculated over time and corrected for errors. The re-estimated maturities caused a re-scaling of the SSB, to an extent that necessitated the re-calculation of reference points.
ICES Advice on fishing opportunities, catch, and effort Published 14 November 2017 cod.27.47d20
ICES Advice 2017 4
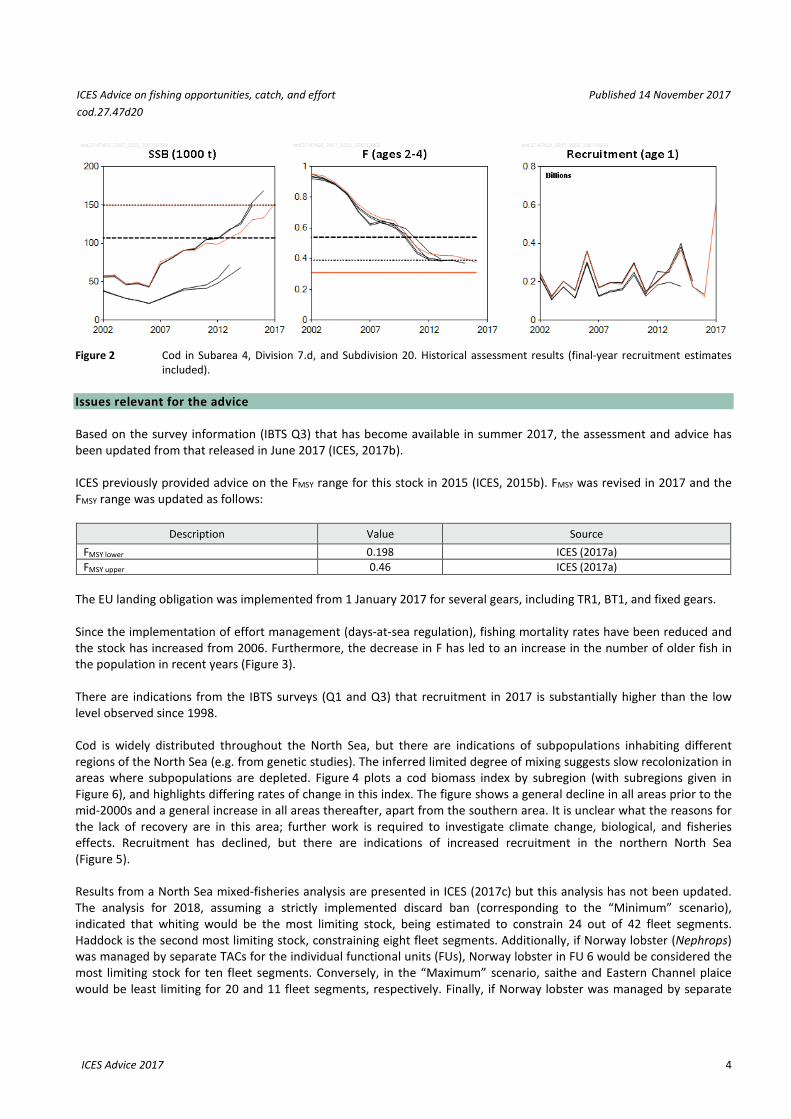
Figure 2 Cod in Subarea 4, Division 7.d, and Subdivision 20. Historical assessment results (final-year recruitment estimates included).
Issues relevant for the advice Based on the survey information (IBTS Q3) that has become available in summer 2017, the assessment and advice has been updated from that released in June 2017 (ICES, 2017b). ICES previously provided advice on the FMSY range for this stock in 2015 (ICES, 2015b). FMSY was revised in 2017 and the FMSY range was updated as follows:
Description Value Source FMSY lower 0.198 ICES (2017a) FMSY upper 0.46 ICES (2017a)
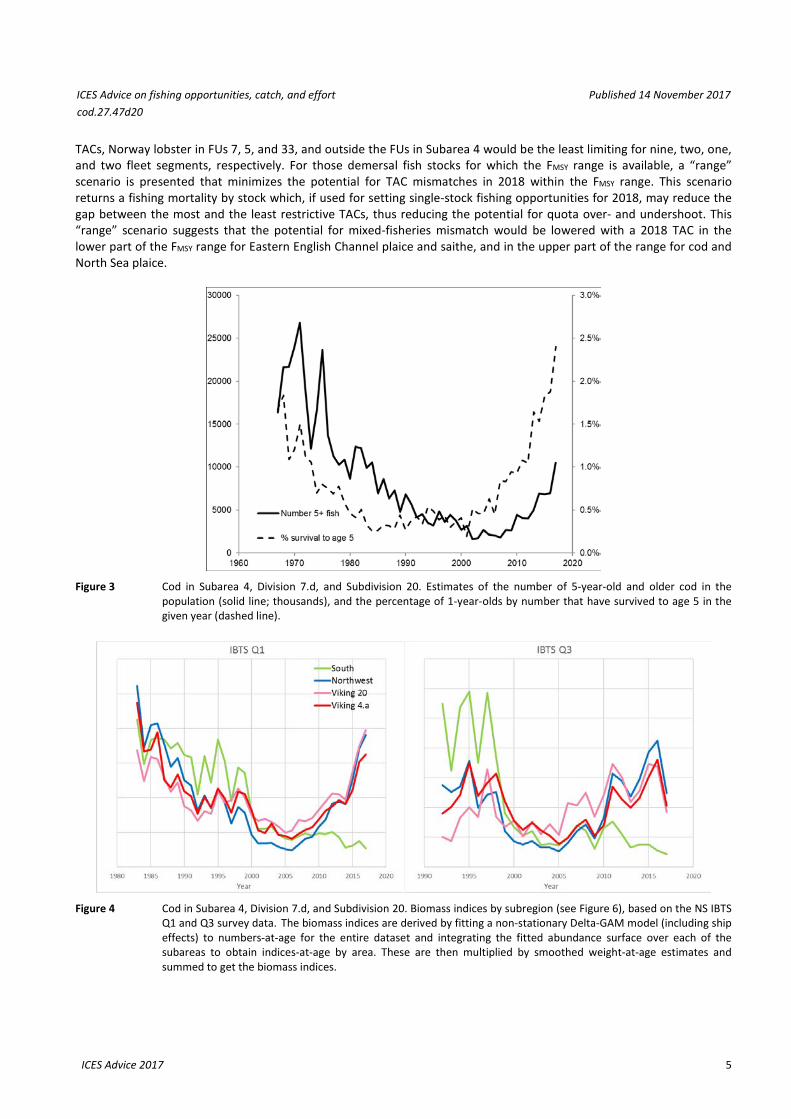
The EU landing obligation was implemented from 1 January 2017 for several gears, including TR1, BT1, and fixed gears. Since the implementation of effort management (days-at-sea regulation), fishing mortality rates have been reduced and the stock has increased from 2006. Furthermore, the decrease in F has led to an increase in the number of older fish in the population in recent years (Figure 3). There are indications from the IBTS surveys (Q1 and Q3) that recruitment in 2017 is substantially higher than the low level observed since 1998. Cod is widely distributed throughout the North Sea, but there are indications of subpopulations inhabiting different regions of the North Sea (e.g. from genetic studies). The inferred limited degree of mixing suggests slow recolonization in areas where subpopulations are depleted. Figure 4 plots a cod biomass index by subregion (with subregions given in Figure 6), and highlights differing rates of change in this index. The figure shows a general decline in all areas prior to the mid-2000s and a general increase in all areas thereafter, apart from the southern area. It is unclear what the reasons for the lack of recovery are in this area; further work is required to investigate climate change, biological, and fisheries effects. Recruitment has declined, but there are indications of increased recruitment in the northern North Sea (Figure 5). Results from a North Sea mixed-fisheries analysis are presented in ICES (2017c) but this analysis has not been updated. The analysis for 2018, assuming a strictly implemented discard ban (corresponding to the “Minimum” scenario), indicated that whiting would be the most limiting stock, being estimated to constrain 24 out of 42 fleet segments. Haddock is the second most limiting stock, constraining eight fleet segments. Additionally, if Norway lobster (Nephrops) was managed by separate TACs for the individual functional units (FUs), Norway lobster in FU 6 would be considered the most limiting stock for ten fleet segments. Conversely, in the “Maximum” scenario, saithe and Eastern Channel plaice would be least limiting for 20 and 11 fleet segments, respectively. Finally, if Norway lobster was managed by separate
ICES Advice on fishing opportunities, catch, and effort Published 14 November 2017 cod.27.47d20
ICES Advice 2017 5
TACs, Norway lobster in FUs 7, 5, and 33, and outside the FUs in Subarea 4 would be the least limiting for nine, two, one, and two fleet segments, respectively. For those demersal fish stocks for which the FMSY range is available, a “range” scenario is presented that minimizes the potential for TAC mismatches in 2018 within the FMSY range. This scenario returns a fishing mortality by stock which, if used for setting single-stock fishing opportunities for 2018, may reduce the gap between the most and the least restrictive TACs, thus reducing the potential for quota over- and undershoot. This “range” scenario suggests that the potential for mixed-fisheries mismatch would be lowered with a 2018 TAC in the lower part of the FMSY range for Eastern English Channel plaice and saithe, and in the upper part of the range for cod and North Sea plaice.
Figure 3 Cod in Subarea 4, Division 7.d, and Subdivision 20. Estimates of the number of 5-year-old and older cod in the
population (solid line; thousands), and the percentage of 1-year-olds by number that have survived to age 5 in the given year (dashed line).
Figure 4 Cod in Subarea 4, Division 7.d, and Subdivision 20. Biomass indices by subregion (see Figure 6), based on the NS IBTS
Q1 and Q3 survey data. The biomass indices are derived by fitting a non-stationary Delta-GAM model (including ship effects) to numbers-at-age for the entire dataset and integrating the fitted abundance surface over each of the subareas to obtain indices-at-age by area. These are then multiplied by smoothed weight-at-age estimates and summed to get the biomass indices.
ICES Advice on fishing opportunities, catch, and effort Published 14 November 2017 cod.27.47d20
ICES Advice 2017 6
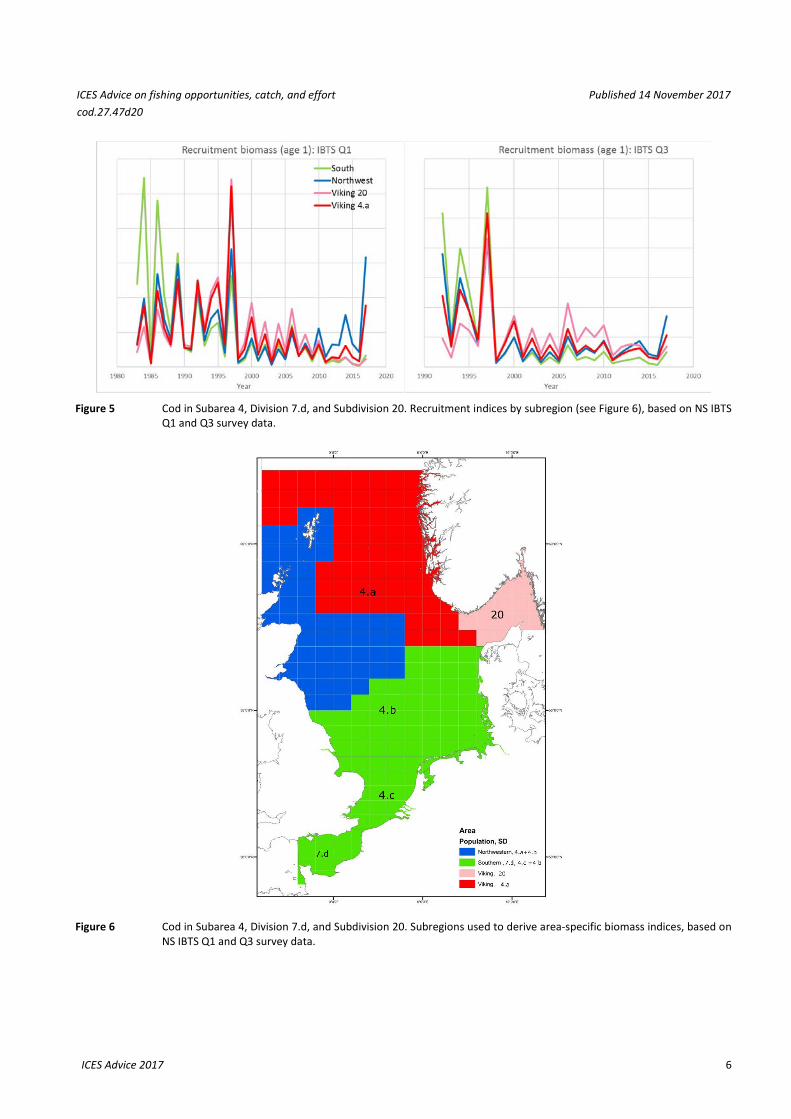
Figure 5 Cod in Subarea 4, Division 7.d, and Subdivision 20. Recruitment indices by subregion (see Figure 6), based on NS IBTS Q1 and Q3 survey data.
Figure 6 Cod in Subarea 4, Division 7.d, and Subdivision 20. Subregions used to derive area-specific biomass indices, based on
NS IBTS Q1 and Q3 survey data.
ICES Advice on fishing opportunities, catch, and effort Published 14 November 2017 cod.27.47d20
ICES Advice 2017 7
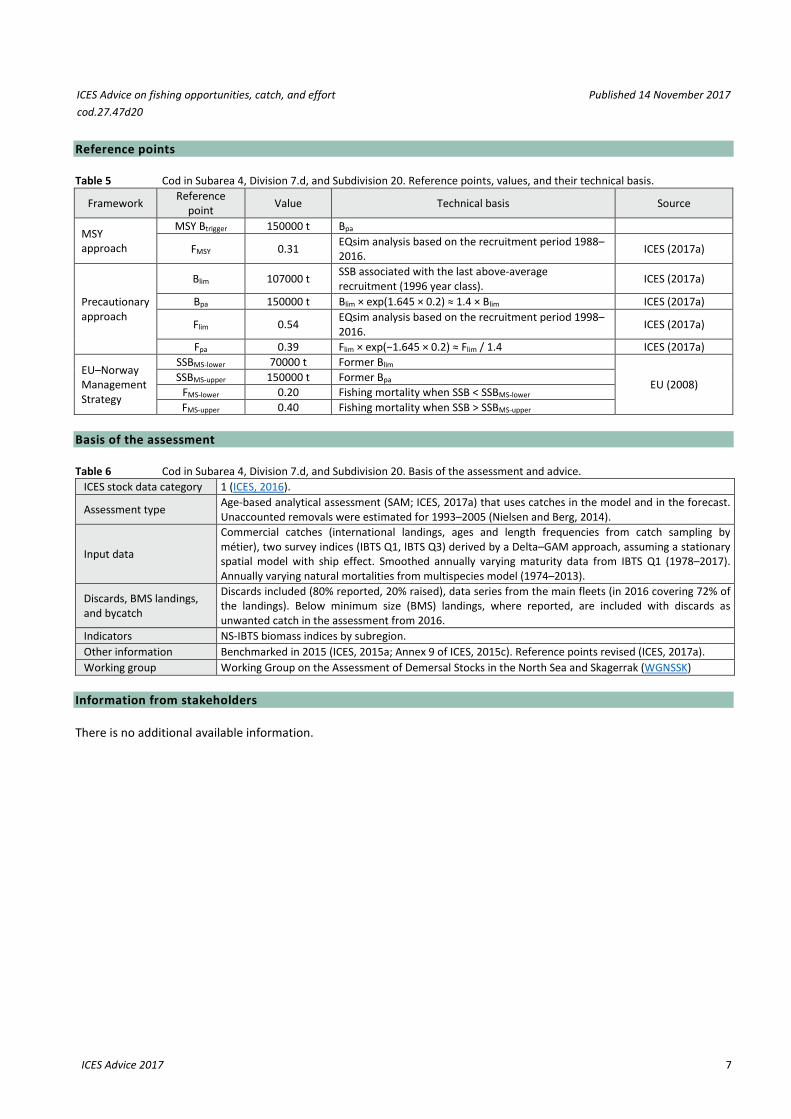
Reference points Table 5 Cod in Subarea 4, Division 7.d, and Subdivision 20. Reference points, values, and their technical basis.
Framework Reference point Value Technical basis Source
MSY approach
MSY Btrigger 150000 t Bpa
FMSY 0.31 EQsim analysis based on the recruitment period 1988–2016. ICES (2017a)
Precautionary approach
Blim 107000 t SSB associated with the last above-average recruitment (1996 year class). ICES (2017a)
Bpa 150000 t Blim × exp(1.645 × 0.2) ≈ 1.4 × Blim ICES (2017a)
Flim 0.54 EQsim analysis based on the recruitment period 1998–2016. ICES (2017a)
Fpa 0.39 Flim × exp(−1.645 × 0.2) ≈ Flim / 1.4 ICES (2017a)
EU–Norway Management Strategy
SSBMS-lower 70000 t Former Blim
EU (2008) SSBMS-upper 150000 t Former Bpa
FMS-lower 0.20 Fishing mortality when SSB < SSBMS-lower
FMS-upper 0.40 Fishing mortality when SSB > SSBMS-upper Basis of the assessment Table 6 Cod in Subarea 4, Division 7.d, and Subdivision 20. Basis of the assessment and advice.
ICES stock data category 1 (ICES, 2016). Assessment type Age-based analytical assessment (SAM; ICES, 2017a) that uses catches in the model and in the forecast.
Unaccounted removals were estimated for 1993–2005 (Nielsen and Berg, 2014).
Input data Commercial catches (international landings, ages and length frequencies from catch sampling by métier), two survey indices (IBTS Q1, IBTS Q3) derived by a Delta–GAM approach, assuming a stationary spatial model with ship effect. Smoothed annually varying maturity data from IBTS Q1 (1978–2017). Annually varying natural mortalities from multispecies model (1974–2013).
Discards, BMS landings, and bycatch
Discards included (80% reported, 20% raised), data series from the main fleets (in 2016 covering 72% of the landings). Below minimum size (BMS) landings, where reported, are included with discards as unwanted catch in the assessment from 2016.
Indicators NS-IBTS biomass indices by subregion. Other information Benchmarked in 2015 (ICES, 2015a; Annex 9 of ICES, 2015c). Reference points revised (ICES, 2017a). Working group Working Group on the Assessment of Demersal Stocks in the North Sea and Skagerrak (WGNSSK)
Information from stakeholders There is no additional available information.
ICES Advice on fishing opportunities, catch, and effort Published 14 November 2017 cod.27.47d20
ICES Advice 2017 8
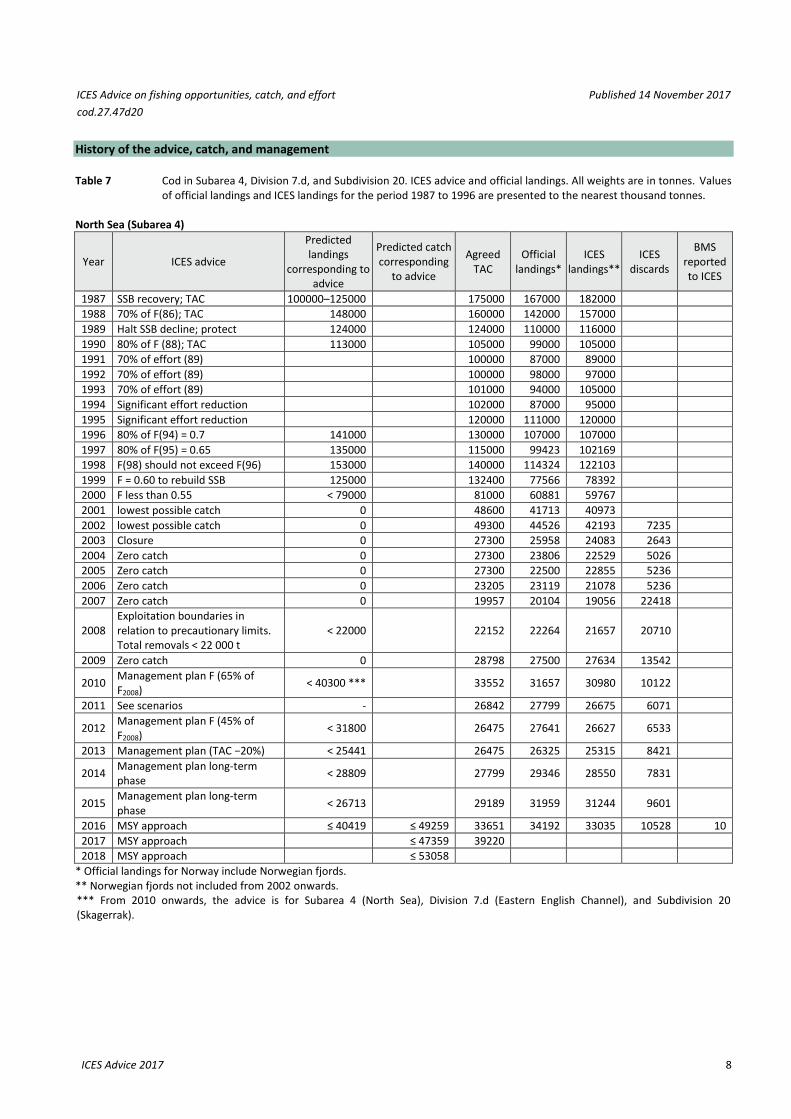
History of the advice, catch, and management Table 7 Cod in Subarea 4, Division 7.d, and Subdivision 20. ICES advice and official landings. All weights are in tonnes. Values
of official landings and ICES landings for the period 1987 to 1996 are presented to the nearest thousand tonnes. North Sea (Subarea 4)
Year ICES advice
Predicted landings
corresponding to advice
Predicted catch corresponding
to advice
Agreed TAC
Official landings*
ICES landings**
ICES discards
BMS reported to ICES
1987 SSB recovery; TAC 100000–125000 175000 167000 182000 1988 70% of F(86); TAC 148000 160000 142000 157000 1989 Halt SSB decline; protect
124000 124000 110000 116000
1990 80% of F (88); TAC 113000 105000 99000 105000 1991 70% of effort (89) 100000 87000 89000 1992 70% of effort (89) 100000 98000 97000 1993 70% of effort (89) 101000 94000 105000 1994 Significant effort reduction 102000 87000 95000 1995 Significant effort reduction 120000 111000 120000 1996 80% of F(94) = 0.7 141000 130000 107000 107000 1997 80% of F(95) = 0.65 135000 115000 99423 102169 1998 F(98) should not exceed F(96) 153000 140000 114324 122103 1999 F = 0.60 to rebuild SSB 125000 132400 77566 78392 2000 F less than 0.55 < 79000 81000 60881 59767 2001 lowest possible catch 0 48600 41713 40973 2002 lowest possible catch 0 49300 44526 42193 7235 2003 Closure 0 27300 25958 24083 2643 2004 Zero catch 0 27300 23806 22529 5026 2005 Zero catch 0 27300 22500 22855 5236 2006 Zero catch 0 23205 23119 21078 5236 2007 Zero catch 0 19957 20104 19056 22418
2008 Exploitation boundaries in relation to precautionary limits. Total removals < 22 000 t
< 22000 22152 22264 21657 20710
2009 Zero catch 0 28798 27500 27634 13542
2010 Management plan F (65% of F2008) < 40300 *** 33552 31657 30980 10122
2011 See scenarios - 26842 27799 26675 6071
2012 Management plan F (45% of F2008) < 31800 26475 27641 26627 6533
2013 Management plan (TAC −20%) < 25441 26475 26325 25315 8421
2014 Management plan long-term phase < 28809 27799 29346 28550 7831
2015 Management plan long-term phase < 26713 29189 31959 31244 9601
2016 MSY approach ≤ 40419 ≤ 49259 33651 34192 33035 10528 10 2017 MSY approach ≤ 47359 39220 2018 MSY approach ≤ 53058
* Official landings for Norway include Norwegian fjords. ** Norwegian fjords not included from 2002 onwards. *** From 2010 onwards, the advice is for Subarea 4 (North Sea), Division 7.d (Eastern English Channel), and Subdivision 20 (Skagerrak).
ICES Advice on fishing opportunities, catch, and effort Published 14 November 2017 cod.27.47d20
ICES Advice 2017 9
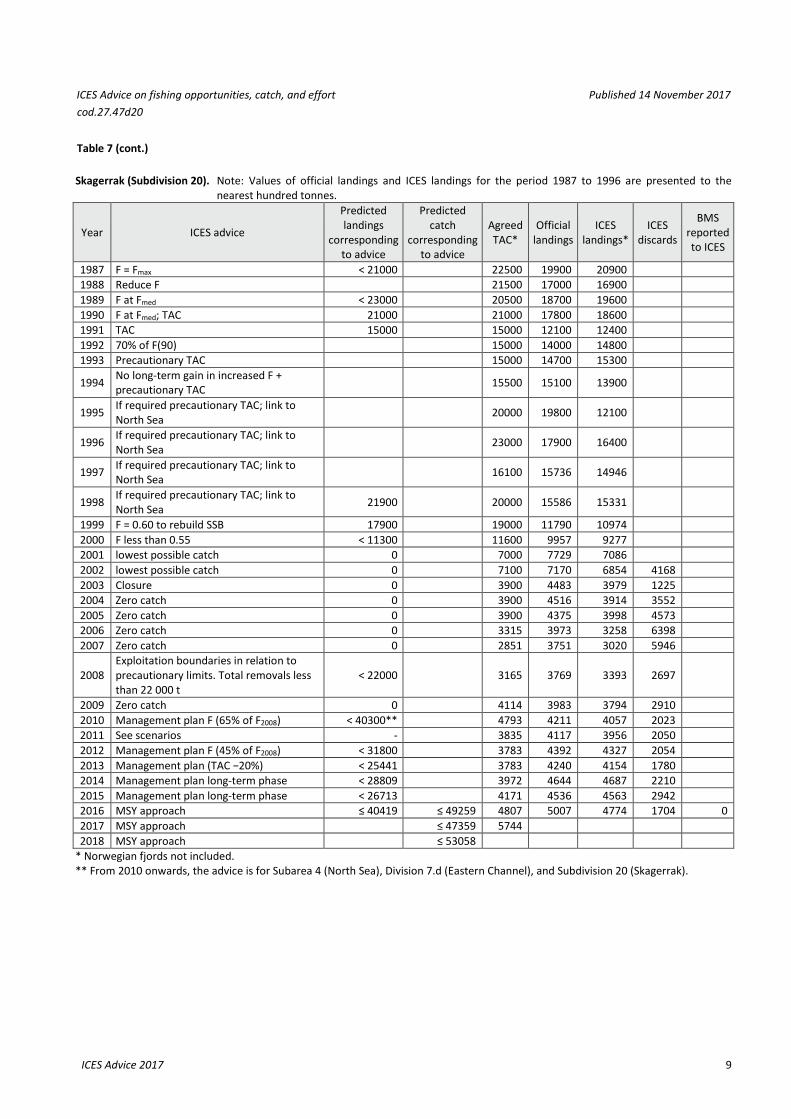
Table 7 (cont.) Skagerrak (Subdivision 20). Note: Values of official landings and ICES landings for the period 1987 to 1996 are presented to the
nearest hundred tonnes.
Year ICES advice
Predicted landings
corresponding to advice
Predicted catch
corresponding to advice
Agreed TAC*
Official landings
ICES landings*
ICES discards
BMS reported to ICES
1987 F = Fmax < 21000 22500 19900 20900 1988 Reduce F 21500 17000 16900 1989 F at Fmed < 23000 20500 18700 19600 1990 F at Fmed; TAC 21000 21000 17800 18600 1991 TAC 15000 15000 12100 12400 1992 70% of F(90) 15000 14000 14800 1993 Precautionary TAC 15000 14700 15300
1994 No long-term gain in increased F + precautionary TAC 15500 15100 13900
1995 If required precautionary TAC; link to North Sea 20000 19800 12100
1996 If required precautionary TAC; link to North Sea 23000 17900 16400
1997 If required precautionary TAC; link to North Sea 16100 15736 14946
1998 If required precautionary TAC; link to North Sea 21900 20000 15586 15331
1999 F = 0.60 to rebuild SSB 17900 19000 11790 10974 2000 F less than 0.55 < 11300 11600 9957 9277 2001 lowest possible catch 0 7000 7729 7086 2002 lowest possible catch 0 7100 7170 6854 4168 2003 Closure 0 3900 4483 3979 1225 2004 Zero catch 0 3900 4516 3914 3552 2005 Zero catch 0 3900 4375 3998 4573 2006 Zero catch 0 3315 3973 3258 6398 2007 Zero catch 0 2851 3751 3020 5946
2008 Exploitation boundaries in relation to precautionary limits. Total removals less than 22 000 t
< 22000 3165 3769 3393 2697
2009 Zero catch 0 4114 3983 3794 2910 2010 Management plan F (65% of F2008) < 40300** 4793 4211 4057 2023 2011 See scenarios - 3835 4117 3956 2050 2012 Management plan F (45% of F2008) < 31800 3783 4392 4327 2054 2013 Management plan (TAC −20%) < 25441 3783 4240 4154 1780 2014 Management plan long-term phase < 28809 3972 4644 4687 2210 2015 Management plan long-term phase < 26713 4171 4536 4563 2942 2016 MSY approach ≤ 40419 ≤ 49259 4807 5007 4774 1704 0 2017 MSY approach ≤ 47359 5744 2018 MSY approach ≤ 53058
* Norwegian fjords not included.
** From 2010 onwards, the advice is for Subarea 4 (North Sea), Division 7.d (Eastern Channel), and Subdivision 20 (Skagerrak).
ICES Advice on fishing opportunities, catch, and effort Published 14 November 2017 cod.27.47d20
ICES Advice 2017 10
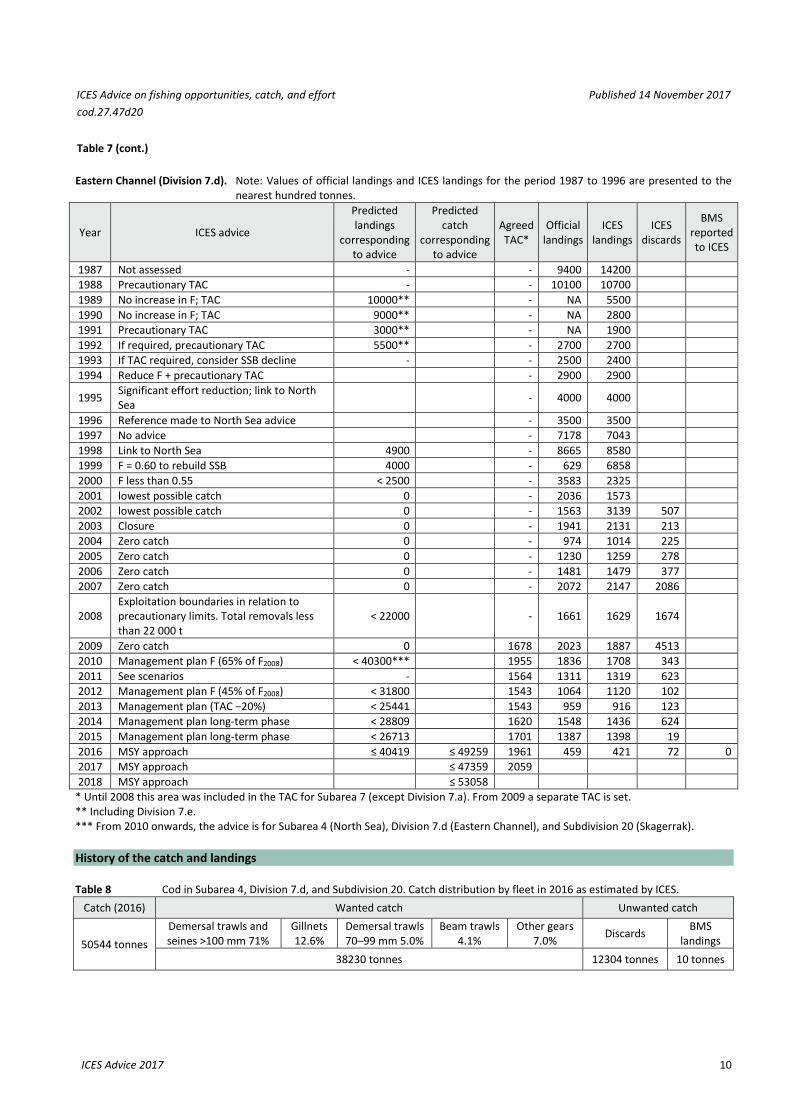
Table 7 (cont.) Eastern Channel (Division 7.d). Note: Values of official landings and ICES landings for the period 1987 to 1996 are presented to the
nearest hundred tonnes.
Year ICES advice
Predicted landings
corresponding to advice
Predicted catch
corresponding to advice
Agreed TAC*
Official landings
ICES landings
ICES discards
BMS reported to ICES
1987 Not assessed - - 9400 14200 1988 Precautionary TAC - - 10100 10700 1989 No increase in F; TAC 10000** - NA 5500 1990 No increase in F; TAC 9000** - NA 2800 1991 Precautionary TAC 3000** - NA 1900 1992 If required, precautionary TAC 5500** - 2700 2700 1993 If TAC required, consider SSB decline - - 2500 2400 1994 Reduce F + precautionary TAC - 2900 2900
1995 Significant effort reduction; link to North Sea - 4000 4000
1996 Reference made to North Sea advice - 3500 3500 1997 No advice - 7178 7043 1998 Link to North Sea 4900 - 8665 8580 1999 F = 0.60 to rebuild SSB 4000 - 629 6858 2000 F less than 0.55 < 2500 - 3583 2325 2001 lowest possible catch 0 - 2036 1573 2002 lowest possible catch 0 - 1563 3139 507 2003 Closure 0 - 1941 2131 213 2004 Zero catch 0 - 974 1014 225 2005 Zero catch 0 - 1230 1259 278 2006 Zero catch 0 - 1481 1479 377 2007 Zero catch 0 - 2072 2147 2086
2008 Exploitation boundaries in relation to precautionary limits. Total removals less than 22 000 t
< 22000 - 1661 1629 1674
2009 Zero catch 0 1678 2023 1887 4513 2010 Management plan F (65% of F2008) < 40300*** 1955 1836 1708 343 2011 See scenarios - 1564 1311 1319 623 2012 Management plan F (45% of F2008) < 31800 1543 1064 1120 102 2013 Management plan (TAC −20%) < 25441 1543 959 916 123 2014 Management plan long-term phase < 28809 1620 1548 1436 624 2015 Management plan long-term phase < 26713 1701 1387 1398 19 2016 MSY approach ≤ 40419 ≤ 49259 1961 459 421 72 0 2017 MSY approach ≤ 47359 2059 2018 MSY approach ≤ 53058
* Until 2008 this area was included in the TAC for Subarea 7 (except Division 7.a). From 2009 a separate TAC is set. ** Including Division 7.e. *** From 2010 onwards, the advice is for Subarea 4 (North Sea), Division 7.d (Eastern Channel), and Subdivision 20 (Skagerrak). History of the catch and landings Table 8 Cod in Subarea 4, Division 7.d, and Subdivision 20. Catch distribution by fleet in 2016 as estimated by ICES.
Catch (2016) Wanted catch Unwanted catch
50544 tonnes Demersal trawls and seines >100 mm 71%
Gillnets 12.6%
Demersal trawls 70–99 mm 5.0%
Beam trawls 4.1%
Other gears 7.0% Discards BMS
landings 38230 tonnes 12304 tonnes 10 tonnes
ICES Advice on fishing opportunities, catch, and effort Published 14 November 2017 cod.27.47d20
ICES Advice 2017 11
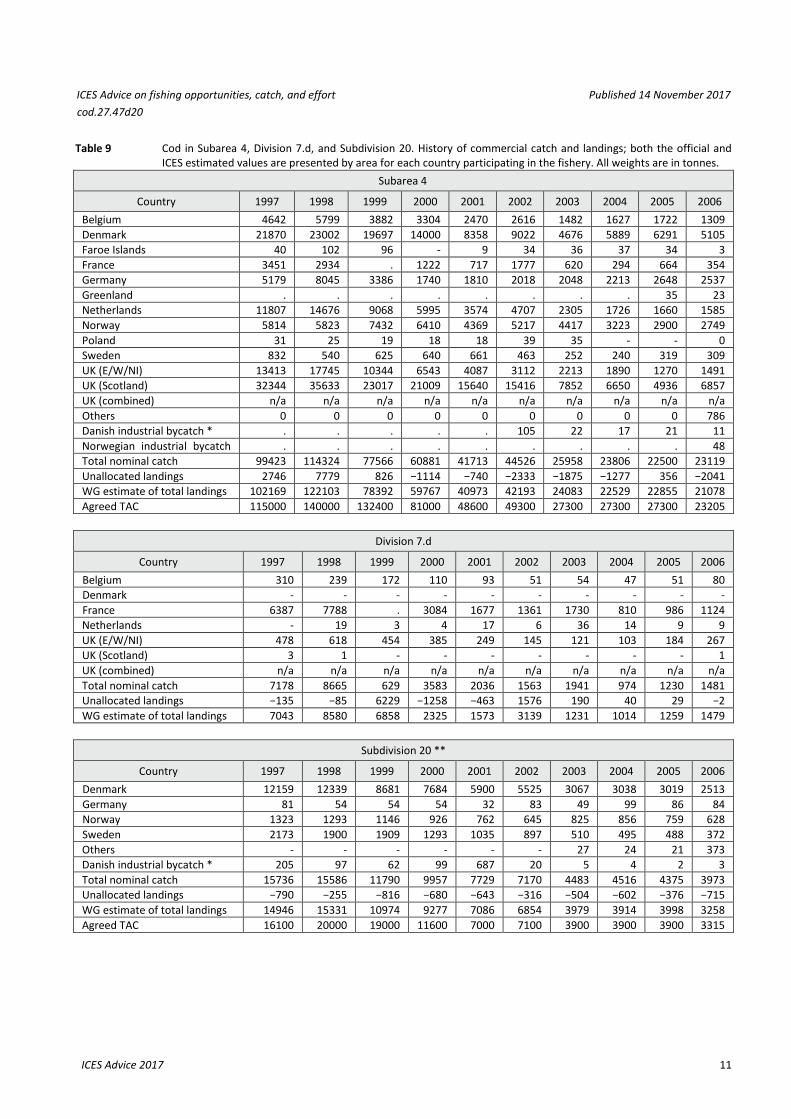
Table 9 Cod in Subarea 4, Division 7.d, and Subdivision 20. History of commercial catch and landings; both the official and ICES estimated values are presented by area for each country participating in the fishery. All weights are in tonnes.
Subarea 4
Country 1997 1998 1999 2000 2001 2002 2003 2004 2005 2006 Belgium 4642 5799 3882 3304 2470 2616 1482 1627 1722 1309 Denmark 21870 23002 19697 14000 8358 9022 4676 5889 6291 5105 Faroe Islands 40 102 96 - 9 34 36 37 34 3 France 3451 2934 . 1222 717 1777 620 294 664 354 Germany 5179 8045 3386 1740 1810 2018 2048 2213 2648 2537 Greenland . . . . . . . . 35 23 Netherlands 11807 14676 9068 5995 3574 4707 2305 1726 1660 1585 Norway 5814 5823 7432 6410 4369 5217 4417 3223 2900 2749 Poland 31 25 19 18 18 39 35 - - 0 Sweden 832 540 625 640 661 463 252 240 319 309 UK (E/W/NI) 13413 17745 10344 6543 4087 3112 2213 1890 1270 1491 UK (Scotland) 32344 35633 23017 21009 15640 15416 7852 6650 4936 6857 UK (combined) n/a n/a n/a n/a n/a n/a n/a n/a n/a n/a Others 0 0 0 0 0 0 0 0 0 786 Danish industrial bycatch * . . . . . 105 22 17 21 11 Norwegian industrial bycatch
. . . . . . . . . 48
Total nominal catch 99423 114324 77566 60881 41713 44526 25958 23806 22500 23119 Unallocated landings 2746 7779 826 −1114 −740 −2333 −1875 −1277 356 −2041 WG estimate of total landings 102169 122103 78392 59767 40973 42193 24083 22529 22855 21078 Agreed TAC 115000 140000 132400 81000 48600 49300 27300 27300 27300 23205
Division 7.d
Country 1997 1998 1999 2000 2001 2002 2003 2004 2005 2006 Belgium 310 239 172 110 93 51 54 47 51 80 Denmark - - - - - - - - - - France 6387 7788 . 3084 1677 1361 1730 810 986 1124 Netherlands - 19 3 4 17 6 36 14 9 9 UK (E/W/NI) 478 618 454 385 249 145 121 103 184 267 UK (Scotland) 3 1 - - - - - - - 1 UK (combined) n/a n/a n/a n/a n/a n/a n/a n/a n/a n/a Total nominal catch 7178 8665 629 3583 2036 1563 1941 974 1230 1481 Unallocated landings −135 −85 6229 −1258 −463 1576 190 40 29 −2 WG estimate of total landings 7043 8580 6858 2325 1573 3139 1231 1014 1259 1479
Subdivision 20 **
Country 1997 1998 1999 2000 2001 2002 2003 2004 2005 2006 Denmark 12159 12339 8681 7684 5900 5525 3067 3038 3019 2513 Germany 81 54 54 54 32 83 49 99 86 84 Norway 1323 1293 1146 926 762 645 825 856 759 628 Sweden 2173 1900 1909 1293 1035 897 510 495 488 372 Others - - - - - - 27 24 21 373 Danish industrial bycatch * 205 97 62 99 687 20 5 4 2 3 Total nominal catch 15736 15586 11790 9957 7729 7170 4483 4516 4375 3973 Unallocated landings −790 −255 −816 −680 −643 −316 −504 −602 −376 −715 WG estimate of total landings 14946 15331 10974 9277 7086 6854 3979 3914 3998 3258 Agreed TAC 16100 20000 19000 11600 7000 7100 3900 3900 3900 3315
ICES Advice on fishing opportunities, catch, and effort Published 14 November 2017 cod.27.47d20
ICES Advice 2017 12
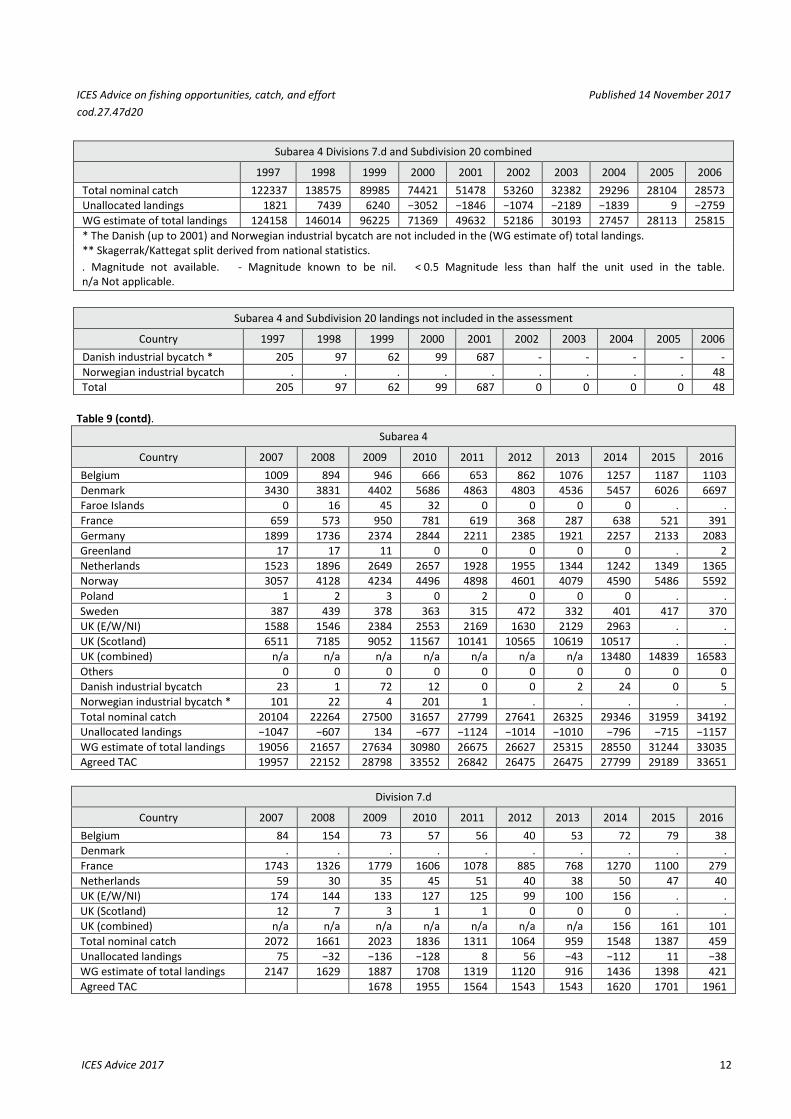
Subarea 4 Divisions 7.d and Subdivision 20 combined
1997 1998 1999 2000 2001 2002 2003 2004 2005 2006 Total nominal catch 122337 138575 89985 74421 51478 53260 32382 29296 28104 28573 Unallocated landings 1821 7439 6240 −3052 −1846 −1074 −2189 −1839 9 −2759 WG estimate of total landings 124158 146014 96225 71369 49632 52186 30193 27457 28113 25815 * The Danish (up to 2001) and Norwegian industrial bycatch are not included in the (WG estimate of) total landings. ** Skagerrak/Kattegat split derived from national statistics. . Magnitude not available. - Magnitude known to be nil. < 0.5 Magnitude less than half the unit used in the table. n/a Not applicable.
Subarea 4 and Subdivision 20 landings not included in the assessment
Country 1997 1998 1999 2000 2001 2002 2003 2004 2005 2006 Danish industrial bycatch * 205 97 62 99 687 - - - - - Norwegian industrial bycatch . . . . . . . . . 48 Total 205 97 62 99 687 0 0 0 0 48
Table 9 (contd).
Subarea 4
Country 2007 2008 2009 2010 2011 2012 2013 2014 2015 2016 Belgium 1009 894 946 666 653 862 1076 1257 1187 1103 Denmark 3430 3831 4402 5686 4863 4803 4536 5457 6026 6697 Faroe Islands 0 16 45 32 0 0 0 0 . . France 659 573 950 781 619 368 287 638 521 391 Germany 1899 1736 2374 2844 2211 2385 1921 2257 2133 2083 Greenland 17 17 11 0 0 0 0 0 . 2 Netherlands 1523 1896 2649 2657 1928 1955 1344 1242 1349 1365 Norway 3057 4128 4234 4496 4898 4601 4079 4590 5486 5592 Poland 1 2 3 0 2 0 0 0 . . Sweden 387 439 378 363 315 472 332 401 417 370 UK (E/W/NI) 1588 1546 2384 2553 2169 1630 2129 2963 . . UK (Scotland) 6511 7185 9052 11567 10141 10565 10619 10517 . . UK (combined) n/a n/a n/a n/a n/a n/a n/a 13480 14839 16583 Others 0 0 0 0 0 0 0 0 0 0 Danish industrial bycatch 23 1 72 12 0 0 2 24 0 5 Norwegian industrial bycatch * 101 22 4 201 1 . . . . . Total nominal catch 20104 22264 27500 31657 27799 27641 26325 29346 31959 34192 Unallocated landings −1047 −607 134 −677 −1124 −1014 −1010 −796 −715 −1157 WG estimate of total landings 19056 21657 27634 30980 26675 26627 25315 28550 31244 33035 Agreed TAC 19957 22152 28798 33552 26842 26475 26475 27799 29189 33651
Division 7.d
Country 2007 2008 2009 2010 2011 2012 2013 2014 2015 2016 Belgium 84 154 73 57 56 40 53 72 79 38 Denmark . . . . . . . . . . France 1743 1326 1779 1606 1078 885 768 1270 1100 279 Netherlands 59 30 35 45 51 40 38 50 47 40 UK (E/W/NI) 174 144 133 127 125 99 100 156 . . UK (Scotland) 12 7 3 1 1 0 0 0 . . UK (combined) n/a n/a n/a n/a n/a n/a n/a 156 161 101 Total nominal catch 2072 1661 2023 1836 1311 1064 959 1548 1387 459 Unallocated landings 75 −32 −136 −128 8 56 −43 −112 11 −38 WG estimate of total landings 2147 1629 1887 1708 1319 1120 916 1436 1398 421 Agreed TAC 1678 1955 1564 1543 1543 1620 1701 1961
ICES Advice on fishing opportunities, catch, and effort Published 14 November 2017 cod.27.47d20
ICES Advice 2017 13
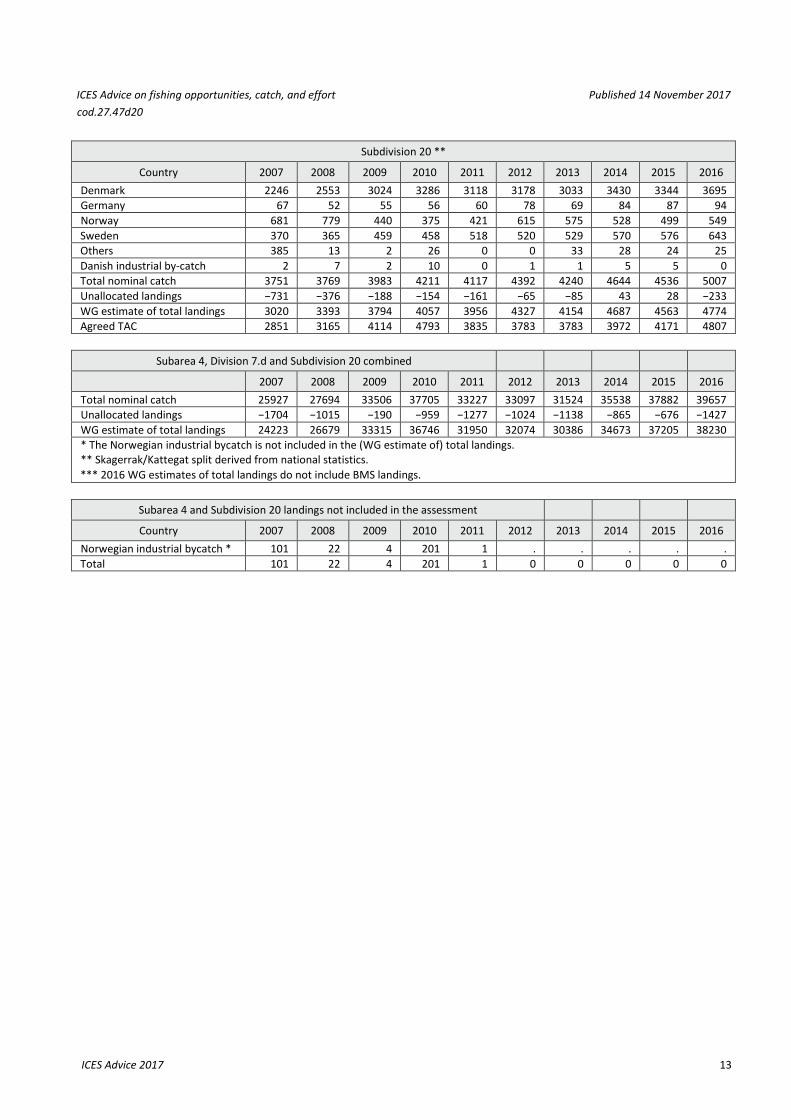
Subdivision 20 **
Country 2007 2008 2009 2010 2011 2012 2013 2014 2015 2016 Denmark 2246 2553 3024 3286 3118 3178 3033 3430 3344 3695 Germany 67 52 55 56 60 78 69 84 87 94 Norway 681 779 440 375 421 615 575 528 499 549 Sweden 370 365 459 458 518 520 529 570 576 643 Others 385 13 2 26 0 0 33 28 24 25 Danish industrial by-catch 2 7 2 10 0 1 1 5 5 0 Total nominal catch 3751 3769 3983 4211 4117 4392 4240 4644 4536 5007 Unallocated landings −731 −376 −188 −154 −161 −65 −85 43 28 −233 WG estimate of total landings 3020 3393 3794 4057 3956 4327 4154 4687 4563 4774 Agreed TAC 2851 3165 4114 4793 3835 3783 3783 3972 4171 4807
Subarea 4, Division 7.d and Subdivision 20 combined
2007 2008 2009 2010 2011 2012 2013 2014 2015 2016 Total nominal catch 25927 27694 33506 37705 33227 33097 31524 35538 37882 39657 Unallocated landings −1704 −1015 −190 −959 −1277 −1024 −1138 −865 −676 −1427 WG estimate of total landings 24223 26679 33315 36746 31950 32074 30386 34673 37205 38230 * The Norwegian industrial bycatch is not included in the (WG estimate of) total landings. ** Skagerrak/Kattegat split derived from national statistics. *** 2016 WG estimates of total landings do not include BMS landings.
Subarea 4 and Subdivision 20 landings not included in the assessment Country 2007 2008 2009 2010 2011 2012 2013 2014 2015 2016
Norwegian industrial bycatch * 101 22 4 201 1 . . . . . Total 101 22 4 201 1 0 0 0 0 0
ICES Advice on fishing opportunities, catch, and effort Published 14 November 2017 cod.27.47d20
ICES Advice 2017 14
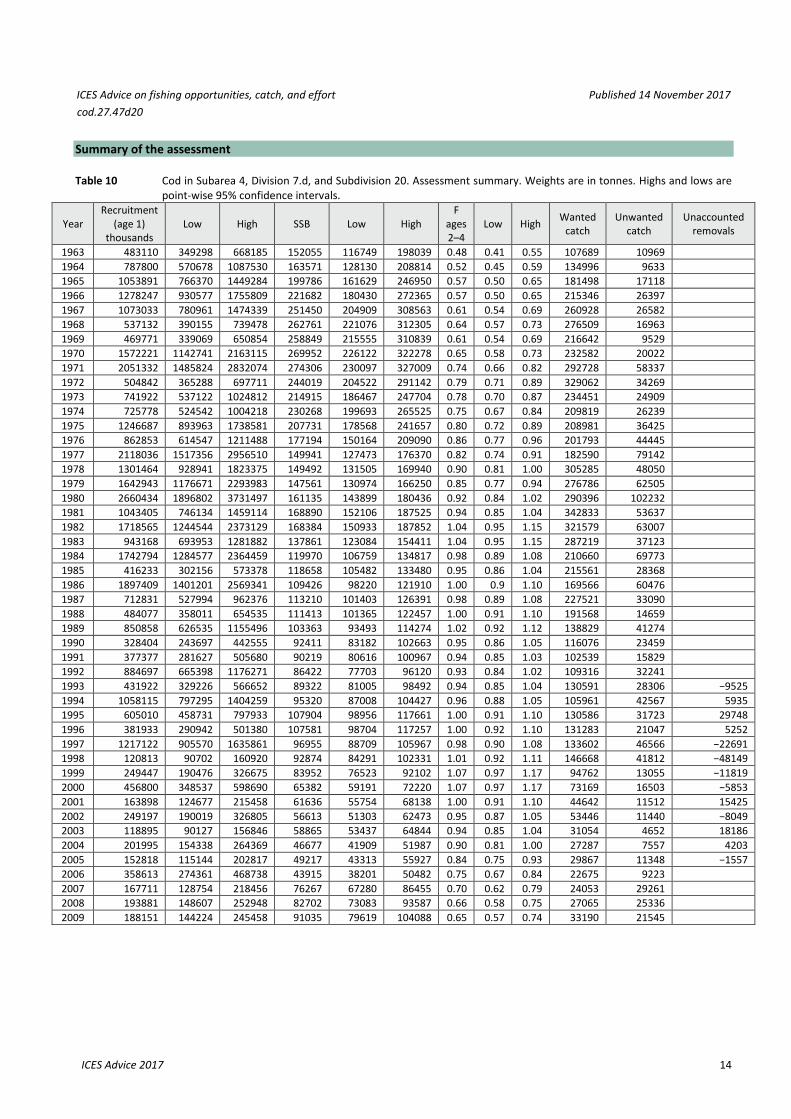
Summary of the assessment Table 10 Cod in Subarea 4, Division 7.d, and Subdivision 20. Assessment summary. Weights are in tonnes. Highs and lows are
point-wise 95% confidence intervals.
Year Recruitment
(age 1) thousands
Low High SSB Low High F
ages 2–4
Low High Wanted catch
Unwanted catch
Unaccounted removals
1963 483110 349298 668185 152055 116749 198039 0.48 0.41 0.55 107689 10969 1964 787800 570678 1087530 163571 128130 208814 0.52 0.45 0.59 134996 9633 1965 1053891 766370 1449284 199786 161629 246950 0.57 0.50 0.65 181498 17118 1966 1278247 930577 1755809 221682 180430 272365 0.57 0.50 0.65 215346 26397 1967 1073033 780961 1474339 251450 204909 308563 0.61 0.54 0.69 260928 26582 1968 537132 390155 739478 262761 221076 312305 0.64 0.57 0.73 276509 16963 1969 469771 339069 650854 258849 215555 310839 0.61 0.54 0.69 216642 9529 1970 1572221 1142741 2163115 269952 226122 322278 0.65 0.58 0.73 232582 20022 1971 2051332 1485824 2832074 274306 230097 327009 0.74 0.66 0.82 292728 58337 1972 504842 365288 697711 244019 204522 291142 0.79 0.71 0.89 329062 34269 1973 741922 537122 1024812 214915 186467 247704 0.78 0.70 0.87 234451 24909 1974 725778 524542 1004218 230268 199693 265525 0.75 0.67 0.84 209819 26239 1975 1246687 893963 1738581 207731 178568 241657 0.80 0.72 0.89 208981 36425 1976 862853 614547 1211488 177194 150164 209090 0.86 0.77 0.96 201793 44445 1977 2118036 1517356 2956510 149941 127473 176370 0.82 0.74 0.91 182590 79142 1978 1301464 928941 1823375 149492 131505 169940 0.90 0.81 1.00 305285 48050 1979 1642943 1176671 2293983 147561 130974 166250 0.85 0.77 0.94 276786 62505 1980 2660434 1896802 3731497 161135 143899 180436 0.92 0.84 1.02 290396 102232 1981 1043405 746134 1459114 168890 152106 187525 0.94 0.85 1.04 342833 53637 1982 1718565 1244544 2373129 168384 150933 187852 1.04 0.95 1.15 321579 63007 1983 943168 693953 1281882 137861 123084 154411 1.04 0.95 1.15 287219 37123 1984 1742794 1284577 2364459 119970 106759 134817 0.98 0.89 1.08 210660 69773 1985 416233 302156 573378 118658 105482 133480 0.95 0.86 1.04 215561 28368 1986 1897409 1401201 2569341 109426 98220 121910 1.00 0.9 1.10 169566 60476 1987 712831 527994 962376 113210 101403 126391 0.98 0.89 1.08 227521 33090 1988 484077 358011 654535 111413 101365 122457 1.00 0.91 1.10 191568 14659 1989 850858 626535 1155496 103363 93493 114274 1.02 0.92 1.12 138829 41274 1990 328404 243697 442555 92411 83182 102663 0.95 0.86 1.05 116076 23459 1991 377377 281627 505680 90219 80616 100967 0.94 0.85 1.03 102539 15829 1992 884697 665398 1176271 86422 77703 96120 0.93 0.84 1.02 109316 32241 1993 431922 329226 566652 89322 81005 98492 0.94 0.85 1.04 130591 28306 −9525 1994 1058115 797295 1404259 95320 87008 104427 0.96 0.88 1.05 105961 42567 5935 1995 605010 458731 797933 107904 98956 117661 1.00 0.91 1.10 130586 31723 29748 1996 381933 290942 501380 107581 98704 117257 1.00 0.92 1.10 131283 21047 5252 1997 1217122 905570 1635861 96955 88709 105967 0.98 0.90 1.08 133602 46566 −22691 1998 120813 90702 160920 92874 84291 102331 1.01 0.92 1.11 146668 41812 −48149 1999 249447 190476 326675 83952 76523 92102 1.07 0.97 1.17 94762 13055 −11819 2000 456800 348537 598690 65382 59191 72220 1.07 0.97 1.17 73169 16503 −5853 2001 163898 124677 215458 61636 55754 68138 1.00 0.91 1.10 44642 11512 15425 2002 249197 190019 326805 56613 51303 62473 0.95 0.87 1.05 53446 11440 −8049 2003 118895 90127 156846 58865 53437 64844 0.94 0.85 1.04 31054 4652 18186 2004 201995 154338 264369 46677 41909 51987 0.90 0.81 1.00 27287 7557 4203 2005 152818 115144 202817 49217 43313 55927 0.84 0.75 0.93 29867 11348 −1557 2006 358613 274361 468738 43915 38201 50482 0.75 0.67 0.84 22675 9223 2007 167711 128754 218456 76267 67280 86455 0.70 0.62 0.79 24053 29261 2008 193881 148607 252948 82702 73083 93587 0.66 0.58 0.75 27065 25336 2009 188151 144224 245458 91035 79619 104088 0.65 0.57 0.74 33190 21545
ICES Advice on fishing opportunities, catch, and effort Published 14 November 2017 cod.27.47d20
ICES Advice 2017 15
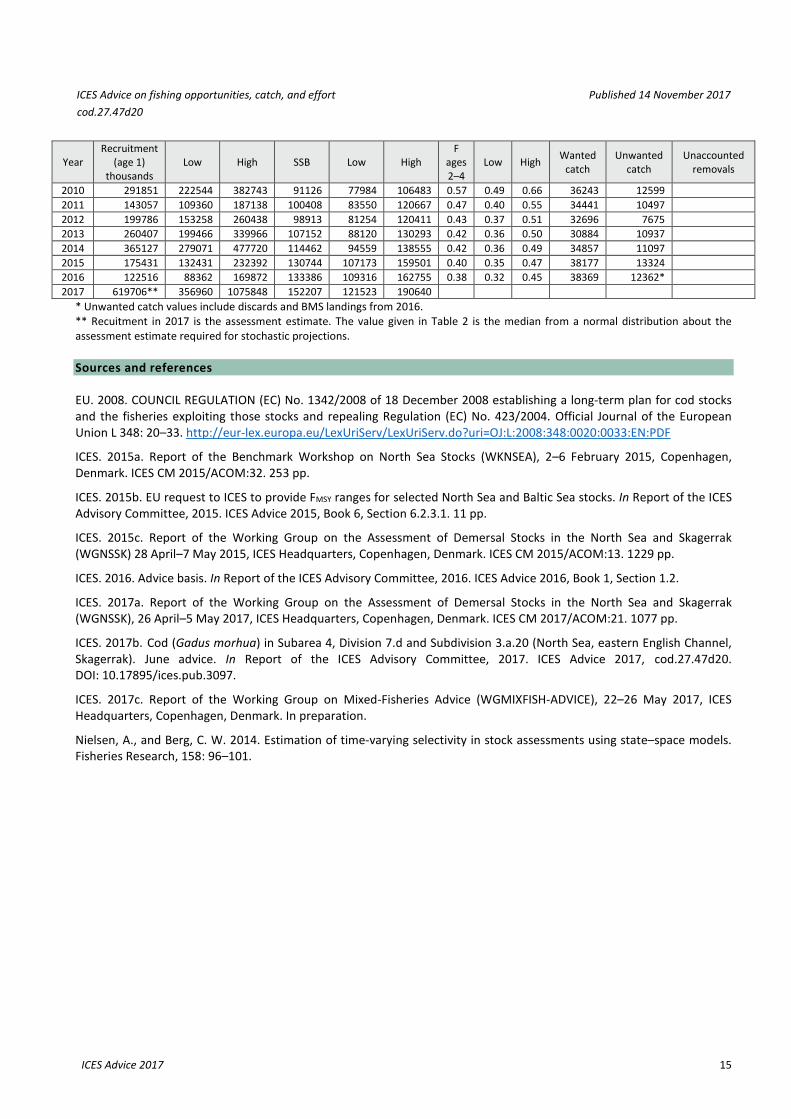
Year Recruitment
(age 1) thousands
Low High SSB Low High F
ages 2–4
Low High Wanted catch
Unwanted catch
Unaccounted removals
2010 291851 222544 382743 91126 77984 106483 0.57 0.49 0.66 36243 12599 2011 143057 109360 187138 100408 83550 120667 0.47 0.40 0.55 34441 10497 2012 199786 153258 260438 98913 81254 120411 0.43 0.37 0.51 32696 7675 2013 260407 199466 339966 107152 88120 130293 0.42 0.36 0.50 30884 10937 2014 365127 279071 477720 114462 94559 138555 0.42 0.36 0.49 34857 11097 2015 175431 132431 232392 130744 107173 159501 0.40 0.35 0.47 38177 13324 2016 122516 88362 169872 133386 109316 162755 0.38 0.32 0.45 38369 12362* 2017 619706** 356960 1075848 152207 121523 190640
* Unwanted catch values include discards and BMS landings from 2016. ** Recuitment in 2017 is the assessment estimate. The value given in Table 2 is the median from a normal distribution about the assessment estimate required for stochastic projections. Sources and references EU. 2008. COUNCIL REGULATION (EC) No. 1342/2008 of 18 December 2008 establishing a long-term plan for cod stocks and the fisheries exploiting those stocks and repealing Regulation (EC) No. 423/2004. Official Journal of the European Union L 348: 20–33. http://eur-lex.europa.eu/LexUriServ/LexUriServ.do?uri=OJ:L:2008:348:0020:0033:EN:PDF
ICES. 2015a. Report of the Benchmark Workshop on North Sea Stocks (WKNSEA), 2–6 February 2015, Copenhagen, Denmark. ICES CM 2015/ACOM:32. 253 pp.
ICES. 2015b. EU request to ICES to provide FMSY ranges for selected North Sea and Baltic Sea stocks. In Report of the ICES Advisory Committee, 2015. ICES Advice 2015, Book 6, Section 6.2.3.1. 11 pp.
ICES. 2015c. Report of the Working Group on the Assessment of Demersal Stocks in the North Sea and Skagerrak (WGNSSK) 28 April–7 May 2015, ICES Headquarters, Copenhagen, Denmark. ICES CM 2015/ACOM:13. 1229 pp.
ICES. 2016. Advice basis. In Report of the ICES Advisory Committee, 2016. ICES Advice 2016, Book 1, Section 1.2.
ICES. 2017a. Report of the Working Group on the Assessment of Demersal Stocks in the North Sea and Skagerrak (WGNSSK), 26 April–5 May 2017, ICES Headquarters, Copenhagen, Denmark. ICES CM 2017/ACOM:21. 1077 pp.
ICES. 2017b. Cod (Gadus morhua) in Subarea 4, Division 7.d and Subdivision 3.a.20 (North Sea, eastern English Channel, Skagerrak). June advice. In Report of the ICES Advisory Committee, 2017. ICES Advice 2017, cod.27.47d20. DOI: 10.17895/ices.pub.3097.
ICES. 2017c. Report of the Working Group on Mixed-Fisheries Advice (WGMIXFISH-ADVICE), 22–26 May 2017, ICES Headquarters, Copenhagen, Denmark. In preparation.
Nielsen, A., and Berg, C. W. 2014. Estimation of time-varying selectivity in stock assessments using state–space models. Fisheries Research, 158: 96–101.