Embed Size (px)
Citation preview
GGaaiinneessvviillllee RReeggiioonnaall UUttiilliittiieess
Interim Financial Statements - Unaudited
For the Period Ended December 31, 2017
Gainesville Regional Utilities Financial Statements - Unaudited
For the Period Ended December 31, 2017
Contents
Overview and Basis of Accounting 2 Financial Statements Statements of Net Position -Unaudited 4 Statements of Revenues, Expenses, and Changes in Net Position-Unaudited 7 Statements of Cash Flows – Unaudited 8 Schedules of Combined Net Revenues in Accordance with Bond Resolution-Unaudited 10 Electric Revenue Fund - Schedules of Net Revenues in Accordance with Bond Resolution-Unaudited 12 Water Revenue Fund - Schedules of Net Revenues in Accordance with Bond Resolution-Unaudited 13 Wastewater Revenue Fund - Schedules of Net Revenues in Accordance with Bond Resolution-Unaudited 14 Gas Revenue Fund - Schedules of Net Revenues in Accordance with Bond Resolution-Unaudited 15 Telecommunications Revenue Fund – Schedule of Net Revenues in Accordance with Bond Resolution-Unaudited 16 Supplementary Information Fuel Adjustment Levelization 18 Purchased Gas Adjustment (PGA) Levelization 19

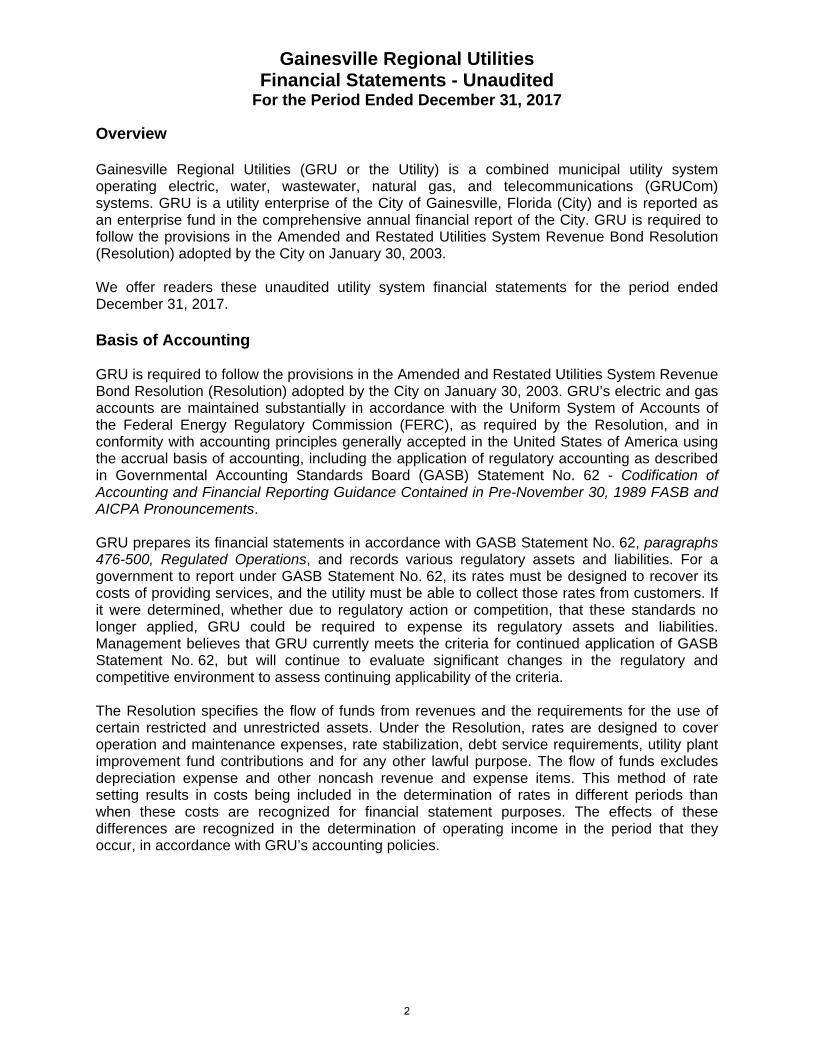
Overview and Basis of Accounting
1
Gainesville Regional Utilities Financial Statements - Unaudited
For the Period Ended December 31, 2017 Overview Gainesville Regional Utilities (GRU or the Utility) is a combined municipal utility system operating electric, water, wastewater, natural gas, and telecommunications (GRUCom) systems. GRU is a utility enterprise of the City of Gainesville, Florida (City) and is reported as an enterprise fund in the comprehensive annual financial report of the City. GRU is required to follow the provisions in the Amended and Restated Utilities System Revenue Bond Resolution (Resolution) adopted by the City on January 30, 2003. We offer readers these unaudited utility system financial statements for the period ended December 31, 2017. Basis of Accounting GRU is required to follow the provisions in the Amended and Restated Utilities System Revenue Bond Resolution (Resolution) adopted by the City on January 30, 2003. GRU’s electric and gas accounts are maintained substantially in accordance with the Uniform System of Accounts of the Federal Energy Regulatory Commission (FERC), as required by the Resolution, and in conformity with accounting principles generally accepted in the United States of America using the accrual basis of accounting, including the application of regulatory accounting as described in Governmental Accounting Standards Board (GASB) Statement No. 62 - Codification of Accounting and Financial Reporting Guidance Contained in Pre-November 30, 1989 FASB and AICPA Pronouncements. GRU prepares its financial statements in accordance with GASB Statement No. 62, paragraphs 476-500, Regulated Operations, and records various regulatory assets and liabilities. For a government to report under GASB Statement No. 62, its rates must be designed to recover its costs of providing services, and the utility must be able to collect those rates from customers. If it were determined, whether due to regulatory action or competition, that these standards no longer applied, GRU could be required to expense its regulatory assets and liabilities. Management believes that GRU currently meets the criteria for continued application of GASB Statement No. 62, but will continue to evaluate significant changes in the regulatory and competitive environment to assess continuing applicability of the criteria. The Resolution specifies the flow of funds from revenues and the requirements for the use of certain restricted and unrestricted assets. Under the Resolution, rates are designed to cover operation and maintenance expenses, rate stabilization, debt service requirements, utility plant improvement fund contributions and for any other lawful purpose. The flow of funds excludes depreciation expense and other noncash revenue and expense items. This method of rate setting results in costs being included in the determination of rates in different periods than when these costs are recognized for financial statement purposes. The effects of these differences are recognized in the determination of operating income in the period that they occur, in accordance with GRU’s accounting policies.
2

Financial Statements
3

December 31, 2017 December 31, 2016 Change ($) Change (%)
Current assets:
29,335,522$ 58,727,328$ (29,391,806)$ (50.0%)
8,600,895 8,094,751 506,144 6.3%
11,463,332 7,254,417 4,208,915 58.0%
2,297,567 1,431,598 865,969 60.5%
40,096,672 73,636,748 (33,540,076) (45.5%)
136,138,932 190,759,989 (54,621,057) (28.6%)
- 50,288,775 (50,288,775) (100.0%)
8,988,832 5,735,066 3,253,766 56.7%
2,058,185 2,123,352 (65,167) (3.1%)
11,871,373 12,534,155 (662,782) (5.3%)
5,013,718 7,104,148 (2,090,430) (29.4%)
94,197,222 91,707,509 2,489,713 2.7%
73,141,512 56,115,877 17,025,635 30.3%
195,270,842 225,608,882 (30,338,040) (13.4%)
2,741,370,117 1,869,557,348 871,812,769 46.6%
- 1,006,808,754 (1,006,808,754) (100.0%)
(904,046,564) (860,359,642) (43,686,922) 5.1%
1,837,323,553 2,016,006,460 (178,682,907) (8.9%)
101,606,858 116,196,620 (14,589,762) (12.6%)
1,938,930,411 2,132,203,080 (193,272,669) (9.1%)
2,270,340,185 2,548,571,951 (278,231,766) (10.9%)
20,523,769 23,917,812 (3,394,043) (14.2%)
57,744,216 81,039,385 (23,295,169) (28.7%)
27,899,197 20,954,810 6,944,387 33.1%
106,167,182 125,912,007 (19,744,825) (15.7%)
2,376,507,367$ 2,674,483,958$ (297,976,591)$ (11.1%)
Continued on next page.
Gainesville Regional Utilities
Statements of Net Position - Unaudited
December 31, 2017 and 2016
Inventories:
Accounts receivable, net of allowance for uncollectible
accounts of $515,680 and $872,402, respectively
Fuel
Materials and supplies
Pension costs
6.6%44,344,944
Less: accumulated depreciation and amortization
Pollution remediation - regulatory asset
Other noncurrent assets and regulatory assets
Net capital assets
Unamortized loss on refunding of bonds
41,615,147
Accumulated decrease in fair value of hedging derivatives
2,729,797
Other assets and regulatory assets
Short term investments
Noncurrent assets:
Construction in progress
Utility plant in service
Capital lease
Long term investments
Total noncurrent assets
Capital assets:
Unamortized debt issuance costs - regulatory assets
Investment in The Energy Authority
Total current assets
Pension costs - regulatory asset
Assets
Total assets
Deferred outflows of resources:
Total deferred outflows of resources
Cash and cash equivalents
Net costs recoverable in future years - regulatory assets
Total assets and deferred outflows of resources
4
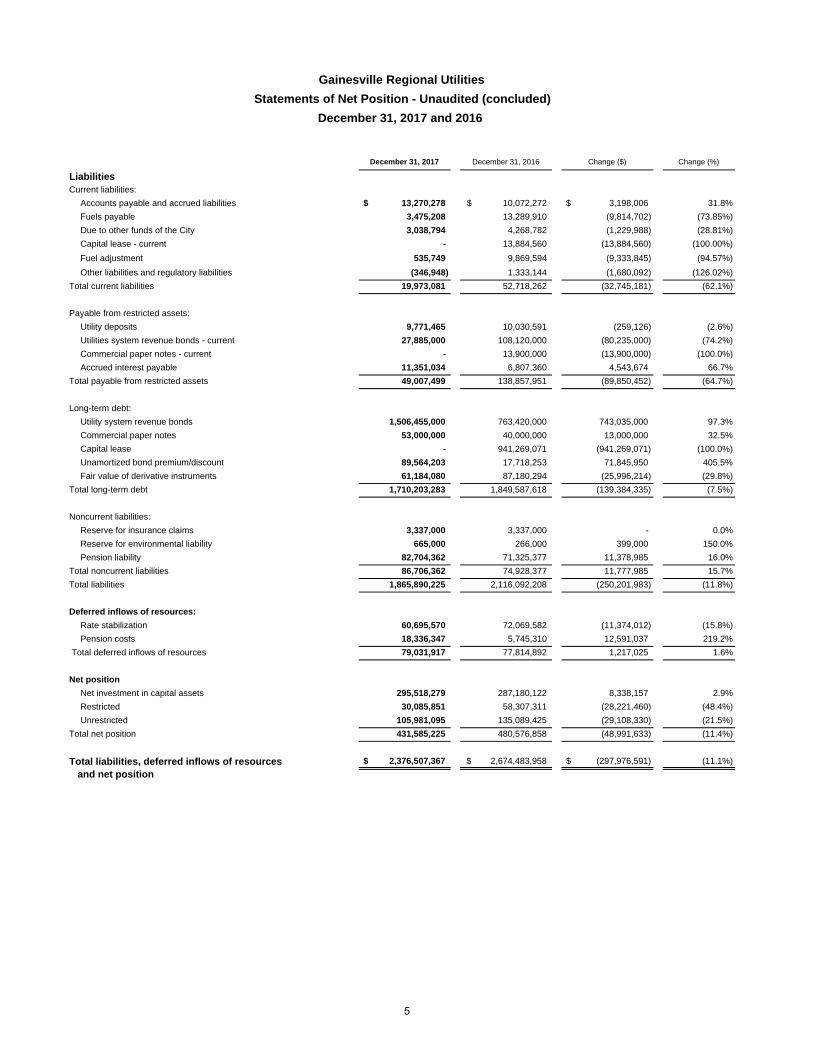
December 31, 2017 December 31, 2016 Change ($) Change (%)
13,270,278$ 10,072,272$ 3,198,006$ 31.8%
3,475,208 13,289,910 (9,814,702) (73.85%)
3,038,794 4,268,782 (1,229,988) (28.81%)
- 13,884,560 (13,884,560) (100.00%)
535,749 9,869,594 (9,333,845) (94.57%)
(346,948) 1,333,144 (1,680,092) (126.02%)
19,973,081 52,718,262 (32,745,181) (62.1%)
9,771,465 10,030,591 (259,126) (2.6%)
27,885,000 108,120,000 (80,235,000) (74.2%)
- 13,900,000 (13,900,000) (100.0%)
11,351,034 6,807,360 4,543,674 66.7%
49,007,499 138,857,951 (89,850,452) (64.7%)
1,506,455,000 763,420,000 743,035,000 97.3%
53,000,000 40,000,000 13,000,000 32.5%
- 941,269,071 (941,269,071) (100.0%)
89,564,203 17,718,253 71,845,950 405.5%
61,184,080 87,180,294 (25,996,214) (29.8%)
1,710,203,283 1,849,587,618 (139,384,335) (7.5%)
3,337,000 3,337,000 - 0.0%
665,000 266,000 399,000 150.0%
82,704,362 71,325,377 11,378,985 16.0%
86,706,362 74,928,377 11,777,985 15.7%
1,865,890,225 2,116,092,208 (250,201,983) (11.8%)
60,695,570 72,069,582 (11,374,012) (15.8%)
18,336,347 5,745,310 12,591,037 219.2%
79,031,917 77,814,892 1,217,025 1.6%
295,518,279 287,180,122 8,338,157 2.9%
30,085,851 58,307,311 (28,221,460) (48.4%)
105,981,095 135,089,425 (29,108,330) (21.5%)
431,585,225 480,576,858 (48,991,633) (11.4%)
2,376,507,367$ 2,674,483,958$ (297,976,591)$ (11.1%)
Gainesville Regional Utilities
Statements of Net Position - Unaudited (concluded)
Net position
Fair value of derivative instruments
Reserve for insurance claims
Reserve for environmental liability
Pension liability
Accounts payable and accrued liabilities
Fuels payable
Due to other funds of the City
Capital lease - current
Current liabilities:
Net investment in capital assets
Restricted
Unrestricted
Total net position
Total liabilities, deferred inflows of resources and net position
Liabilities
Total current liabilities
Other liabilities and regulatory liabilities
December 31, 2017 and 2016
Fuel adjustment
Noncurrent liabilities:
Total liabilities
Total noncurrent liabilities
Total deferred inflows of resources
Rate stabilization
Deferred inflows of resources:
Pension costs
Total long-term debt
Long-term debt:
Utility system revenue bonds
Commercial paper notes
Capital lease
Unamortized bond premium/discount
Total payable from restricted assets
Payable from restricted assets:
Utility deposits
Utilities system revenue bonds - current
Commercial paper notes - current
Accrued interest payable
5

This page is intentionally left blank
6
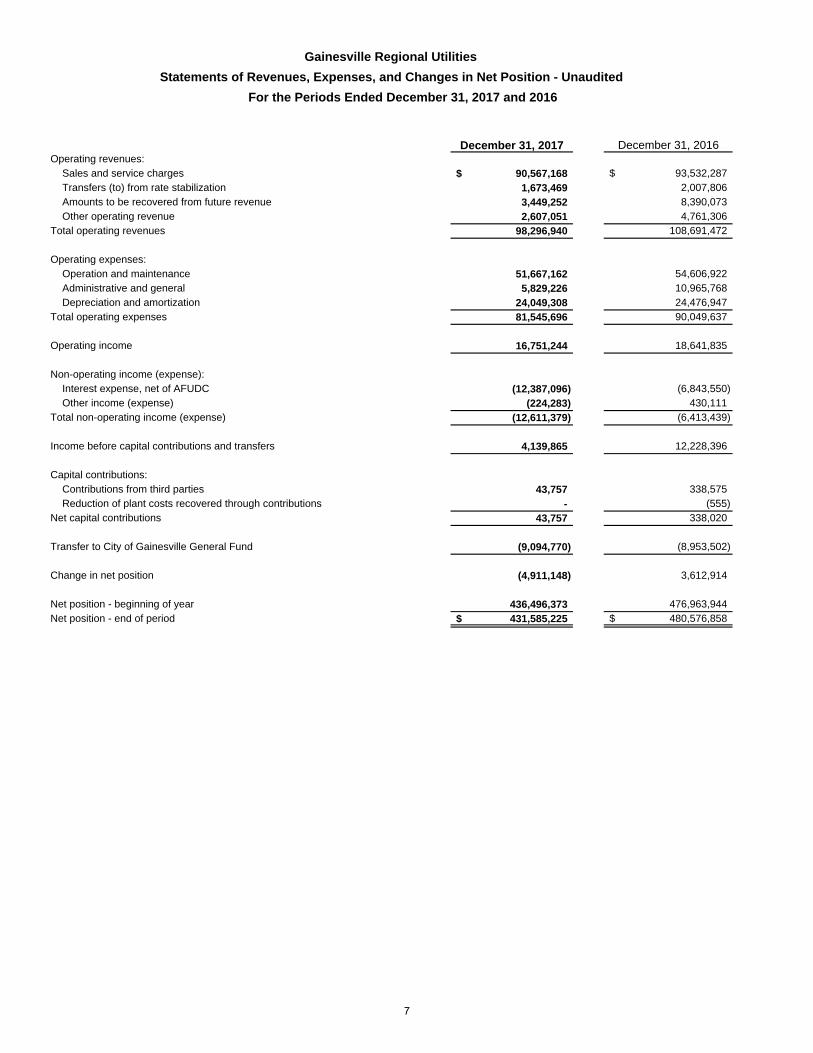
December 31, 2017 December 31, 2016
90,567,168$ 93,532,287$
1,673,469 2,007,806
3,449,252 8,390,073
2,607,051 4,761,306
98,296,940 108,691,472
51,667,162 54,606,922
5,829,226 10,965,768
24,049,308 24,476,947
81,545,696 90,049,637
16,751,244 18,641,835
(12,387,096) (6,843,550)
(224,283) 430,111
(12,611,379) (6,413,439)
4,139,865 12,228,396
43,757 338,575
- (555)
43,757 338,020
(9,094,770) (8,953,502)
(4,911,148) 3,612,914
436,496,373 476,963,944
431,585,225$ 480,576,858$
Change in net position
Net position - beginning of yearNet position - end of period
Transfer to City of Gainesville General Fund
Income before capital contributions and transfers
Contributions from third parties
Net capital contributions
Capital contributions:
Reduction of plant costs recovered through contributions
Interest expense, net of AFUDCOther income (expense)
Total non-operating income (expense)
Operating income
Gainesville Regional Utilities
Statements of Revenues, Expenses, and Changes in Net Position - Unaudited
Depreciation and amortizationTotal operating expenses
Non-operating income (expense):
For the Periods Ended December 31, 2017 and 2016
Administrative and general
Transfers (to) from rate stabilizationAmounts to be recovered from future revenueOther operating revenue
Total operating revenues
Operation and maintenanceOperating expenses:
Operating revenues:Sales and service charges
7
December 31, 2017 December 31, 2016
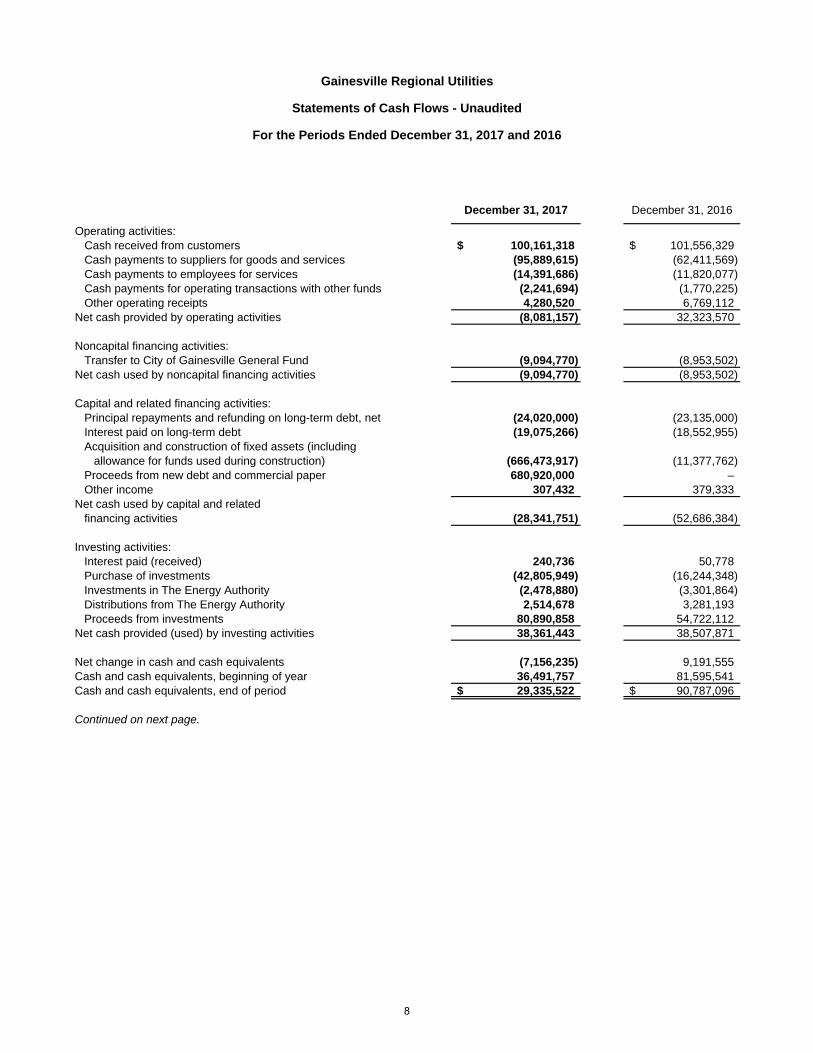
Operating activities:Cash received from customers 100,161,318$ 101,556,329$ Cash payments to suppliers for goods and services (95,889,615) (62,411,569) Cash payments to employees for services (14,391,686) (11,820,077) Cash payments for operating transactions with other funds (2,241,694) (1,770,225) Other operating receipts 4,280,520 6,769,112
Net cash provided by operating activities (8,081,157) 32,323,570
Noncapital financing activities:Transfer to City of Gainesville General Fund (9,094,770) (8,953,502)
Net cash used by noncapital financing activities (9,094,770) (8,953,502)
Capital and related financing activities:Principal repayments and refunding on long-term debt, net (24,020,000) (23,135,000) Interest paid on long-term debt (19,075,266) (18,552,955) Acquisition and construction of fixed assets (including
allowance for funds used during construction) (666,473,917) (11,377,762) Proceeds from new debt and commercial paper 680,920,000 – Other income 307,432 379,333
Net cash used by capital and relatedfinancing activities (28,341,751) (52,686,384)
Investing activities:Interest paid (received) 240,736 50,778 Purchase of investments (42,805,949) (16,244,348) Investments in The Energy Authority (2,478,880) (3,301,864) Distributions from The Energy Authority 2,514,678 3,281,193 Proceeds from investments 80,890,858 54,722,112
Net cash provided (used) by investing activities 38,361,443 38,507,871
Net change in cash and cash equivalents (7,156,235) 9,191,555 Cash and cash equivalents, beginning of year 36,491,757 81,595,541 Cash and cash equivalents, end of period 29,335,522$ 90,787,096$
Continued on next page.
Gainesville Regional Utilities
Statements of Cash Flows - Unaudited
For the Periods Ended December 31, 2017 and 2016
8
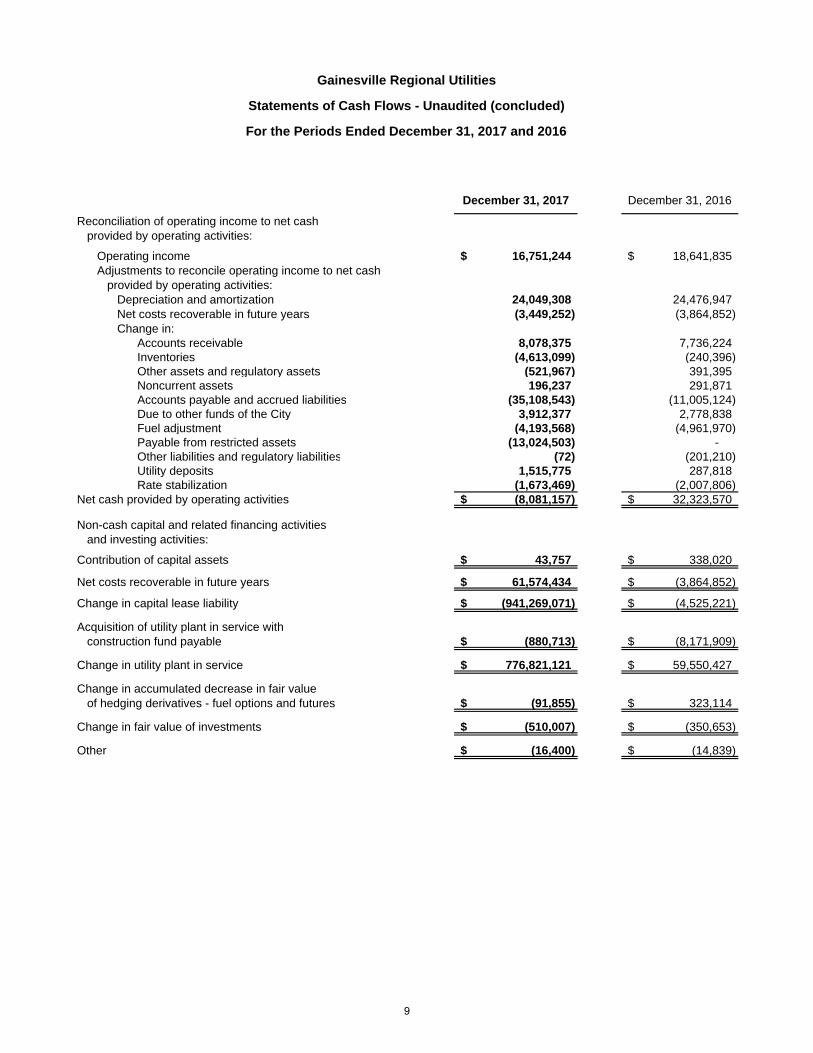
December 31, 2017 December 31, 2016
Reconciliation of operating income to net cashprovided by operating activities:
Operating income 16,751,244$ 18,641,835$ Adjustments to reconcile operating income to net cash
provided by operating activities:Depreciation and amortization 24,049,308 24,476,947 Net costs recoverable in future years (3,449,252) (3,864,852) Change in:
Accounts receivable 8,078,375 7,736,224 Inventories (4,613,099) (240,396) Other assets and regulatory assets (521,967) 391,395 Noncurrent assets 196,237 291,871 Accounts payable and accrued liabilities (35,108,543) (11,005,124) Due to other funds of the City 3,912,377 2,778,838 Fuel adjustment (4,193,568) (4,961,970) Payable from restricted assets (13,024,503) - Other liabilities and regulatory liabilities (72) (201,210) Utility deposits 1,515,775 287,818 Rate stabilization (1,673,469) (2,007,806)
Net cash provided by operating activities (8,081,157)$ 32,323,570$
Non-cash capital and related financing activitiesand investing activities:
Contribution of capital assets 43,757$ 338,020$
Net costs recoverable in future years 61,574,434$ (3,864,852)$
Change in capital lease liability (941,269,071)$ (4,525,221)$
Acquisition of utility plant in service withconstruction fund payable (880,713)$ (8,171,909)$
Change in utility plant in service 776,821,121$ 59,550,427$
Change in accumulated decrease in fair value of hedging derivatives - fuel options and futures (91,855)$ 323,114$
Change in fair value of investments (510,007)$ (350,653)$
Other (16,400)$ (14,839)$
Gainesville Regional Utilities
Statements of Cash Flows - Unaudited (concluded)
For the Periods Ended December 31, 2017 and 2016
9
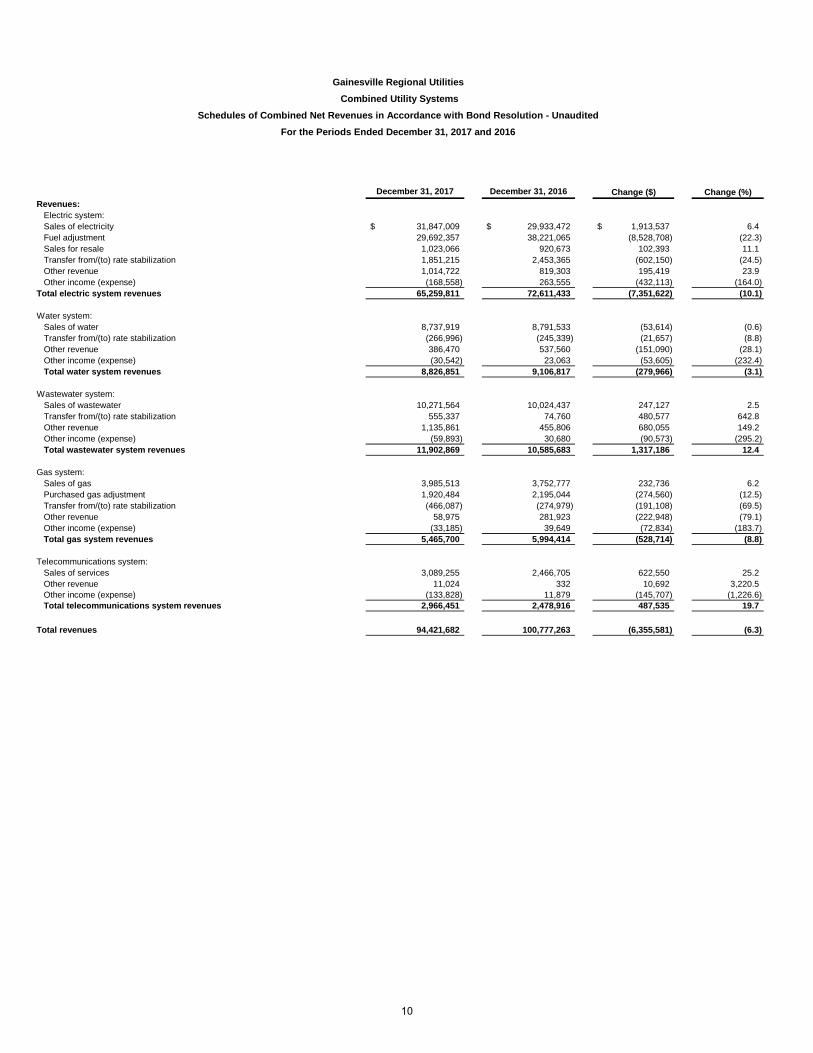
December 31, 2017 December 31, 2016 Change ($) Change (%)Revenues:
Electric system:Sales of electricity 31,847,009$ 29,933,472$ 1,913,537$ 6.4 Fuel adjustment 29,692,357 38,221,065 (8,528,708) (22.3) Sales for resale 1,023,066 920,673 102,393 11.1 Transfer from/(to) rate stabilization 1,851,215 2,453,365 (602,150) (24.5) Other revenue 1,014,722 819,303 195,419 23.9 Other income (expense) (168,558) 263,555 (432,113) (164.0)
Total electric system revenues 65,259,811 72,611,433 (7,351,622) (10.1)
Water system:Sales of water 8,737,919 8,791,533 (53,614) (0.6) Transfer from/(to) rate stabilization (266,996) (245,339) (21,657) (8.8) Other revenue 386,470 537,560 (151,090) (28.1) Other income (expense) (30,542) 23,063 (53,605) (232.4) Total water system revenues 8,826,851 9,106,817 (279,966) (3.1)
Wastewater system:Sales of wastewater 10,271,564 10,024,437 247,127 2.5 Transfer from/(to) rate stabilization 555,337 74,760 480,577 642.8 Other revenue 1,135,861 455,806 680,055 149.2 Other income (expense) (59,893) 30,680 (90,573) (295.2) Total wastewater system revenues 11,902,869 10,585,683 1,317,186 12.4
Gas system:Sales of gas 3,985,513 3,752,777 232,736 6.2 Purchased gas adjustment 1,920,484 2,195,044 (274,560) (12.5) Transfer from/(to) rate stabilization (466,087) (274,979) (191,108) (69.5) Other revenue 58,975 281,923 (222,948) (79.1) Other income (expense) (33,185) 39,649 (72,834) (183.7) Total gas system revenues 5,465,700 5,994,414 (528,714) (8.8)
Telecommunications system:Sales of services 3,089,255 2,466,705 622,550 25.2 Other revenue 11,024 332 10,692 3,220.5 Other income (expense) (133,828) 11,879 (145,707) (1,226.6) Total telecommunications system revenues 2,966,451 2,478,916 487,535 19.7
Total revenues 94,421,682 100,777,263 (6,355,581) (6.3)
For the Periods Ended December 31, 2017 and 2016
Gainesville Regional Utilities
Combined Utility Systems
Schedules of Combined Net Revenues in Accordance with Bond Resolution - Unaudited
10
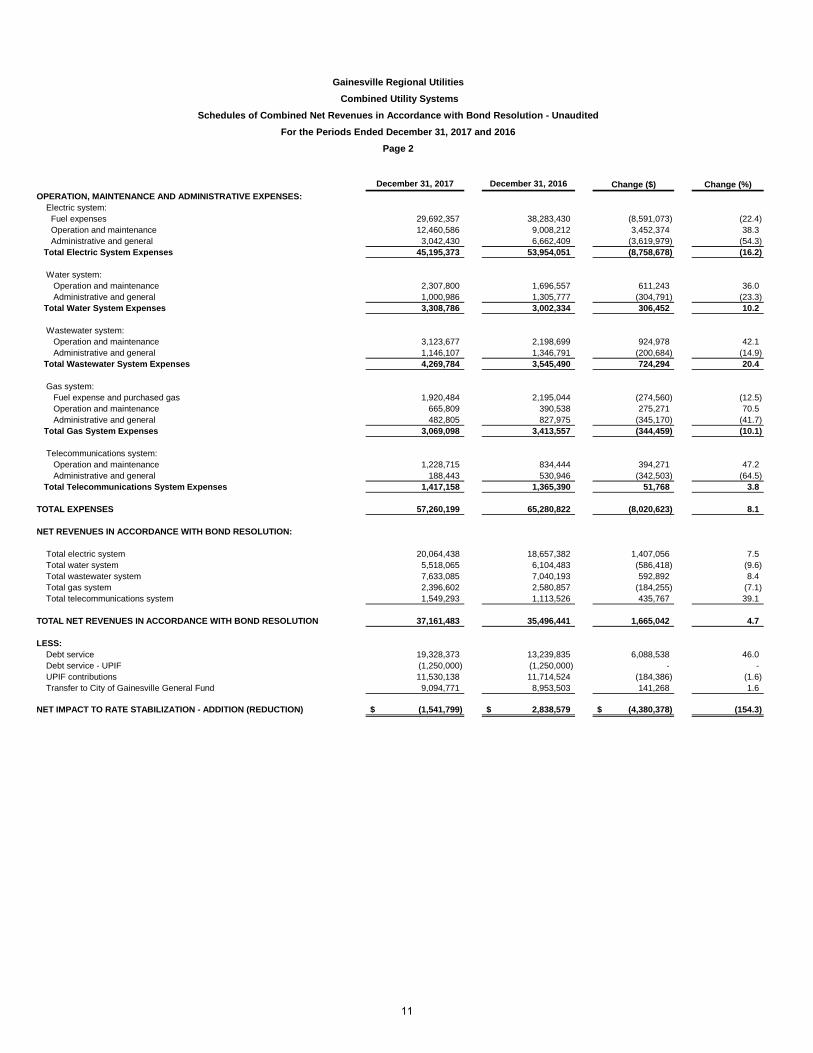
December 31, 2017 December 31, 2016 Change ($) Change (%)OPERATION, MAINTENANCE AND ADMINISTRATIVE EXPENSES:
Electric system: Fuel expenses 29,692,357 38,283,430 (8,591,073) (22.4) Operation and maintenance 12,460,586 9,008,212 3,452,374 38.3 Administrative and general 3,042,430 6,662,409 (3,619,979) (54.3)
Total Electric System Expenses 45,195,373 53,954,051 (8,758,678) (16.2)
Water system: Operation and maintenance 2,307,800 1,696,557 611,243 36.0 Administrative and general 1,000,986 1,305,777 (304,791) (23.3)
Total Water System Expenses 3,308,786 3,002,334 306,452 10.2
Wastewater system: Operation and maintenance 3,123,677 2,198,699 924,978 42.1 Administrative and general 1,146,107 1,346,791 (200,684) (14.9)
Total Wastewater System Expenses 4,269,784 3,545,490 724,294 20.4
Gas system: Fuel expense and purchased gas 1,920,484 2,195,044 (274,560) (12.5) Operation and maintenance 665,809 390,538 275,271 70.5 Administrative and general 482,805 827,975 (345,170) (41.7)
Total Gas System Expenses 3,069,098 3,413,557 (344,459) (10.1)
Telecommunications system: Operation and maintenance 1,228,715 834,444 394,271 47.2 Administrative and general 188,443 530,946 (342,503) (64.5)
Total Telecommunications System Expenses 1,417,158 1,365,390 51,768 3.8
TOTAL EXPENSES 57,260,199 65,280,822 (8,020,623) 8.1
NET REVENUES IN ACCORDANCE WITH BOND RESOLUTION:
Total electric system 20,064,438 18,657,382 1,407,056 7.5 Total water system 5,518,065 6,104,483 (586,418) (9.6) Total wastewater system 7,633,085 7,040,193 592,892 8.4 Total gas system 2,396,602 2,580,857 (184,255) (7.1) Total telecommunications system 1,549,293 1,113,526 435,767 39.1
TOTAL NET REVENUES IN ACCORDANCE WITH BOND RESOLUTION 37,161,483 35,496,441 1,665,042 4.7
LESS: Debt service 19,328,373 13,239,835 6,088,538 46.0 Debt service - UPIF (1,250,000) (1,250,000) - - UPIF contributions 11,530,138 11,714,524 (184,386) (1.6) Transfer to City of Gainesville General Fund 9,094,771 8,953,503 141,268 1.6
NET IMPACT TO RATE STABILIZATION - ADDITION (REDUCTION) (1,541,799)$ 2,838,579$ (4,380,378)$ (154.3)
Gainesville Regional Utilities
Combined Utility Systems
Schedules of Combined Net Revenues in Accordance with Bond Resolution - Unaudited
For the Periods Ended December 31, 2017 and 2016
Page 2
11
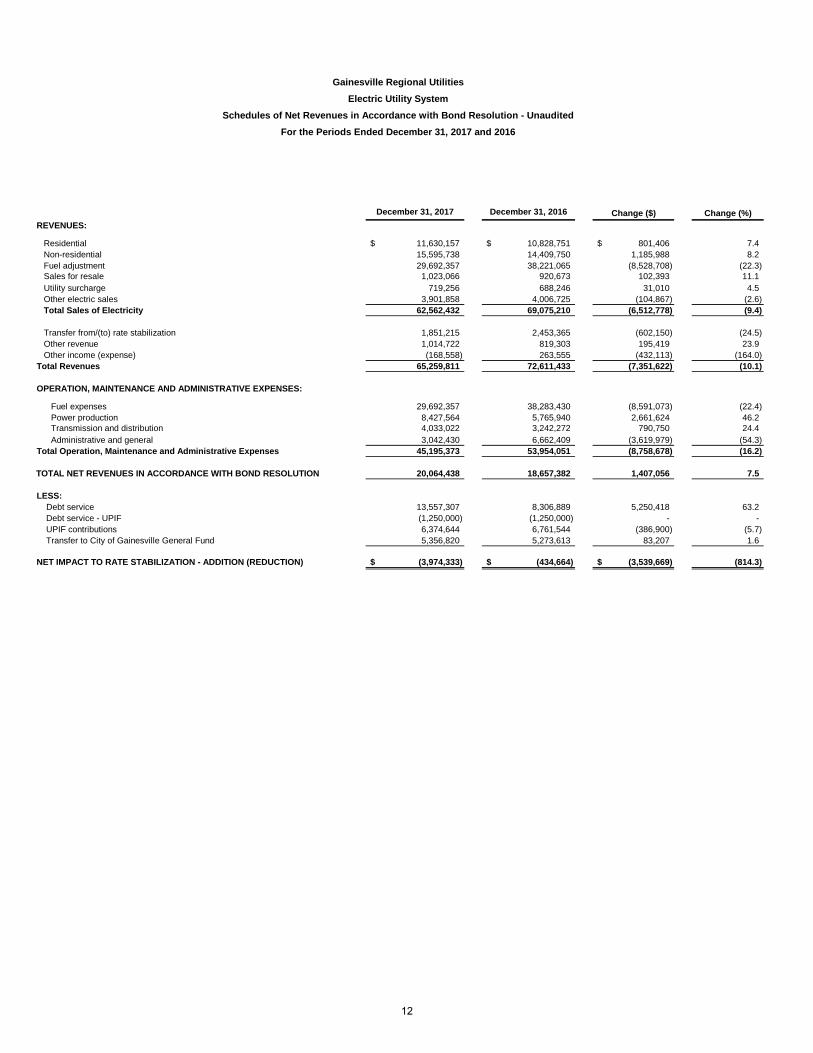
December 31, 2017 December 31, 2016 Change ($) Change (%)
REVENUES:
Residential 11,630,157$ 10,828,751$ 801,406$ 7.4 Non-residential 15,595,738 14,409,750 1,185,988 8.2 Fuel adjustment 29,692,357 38,221,065 (8,528,708) (22.3) Sales for resale 1,023,066 920,673 102,393 11.1 Utility surcharge 719,256 688,246 31,010 4.5 Other electric sales 3,901,858 4,006,725 (104,867) (2.6) Total Sales of Electricity 62,562,432 69,075,210 (6,512,778) (9.4)
Transfer from/(to) rate stabilization 1,851,215 2,453,365 (602,150) (24.5) Other revenue 1,014,722 819,303 195,419 23.9 Other income (expense) (168,558) 263,555 (432,113) (164.0)
Total Revenues 65,259,811 72,611,433 (7,351,622) (10.1)
OPERATION, MAINTENANCE AND ADMINISTRATIVE EXPENSES:
Fuel expenses 29,692,357 38,283,430 (8,591,073) (22.4) Power production 8,427,564 5,765,940 2,661,624 46.2 Transmission and distribution 4,033,022 3,242,272 790,750 24.4 Administrative and general 3,042,430 6,662,409 (3,619,979) (54.3)
Total Operation, Maintenance and Administrative Expenses 45,195,373 53,954,051 (8,758,678) (16.2)
TOTAL NET REVENUES IN ACCORDANCE WITH BOND RESOLUTION 20,064,438 18,657,382 1,407,056 7.5
LESS: Debt service 13,557,307 8,306,889 5,250,418 63.2 Debt service - UPIF (1,250,000) (1,250,000) - - UPIF contributions 6,374,644 6,761,544 (386,900) (5.7) Transfer to City of Gainesville General Fund 5,356,820 5,273,613 83,207 1.6
NET IMPACT TO RATE STABILIZATION - ADDITION (REDUCTION) (3,974,333)$ (434,664)$ (3,539,669)$ (814.3)
Gainesville Regional Utilities
Electric Utility System
Schedules of Net Revenues in Accordance with Bond Resolution - Unaudited
For the Periods Ended December 31, 2017 and 2016
12
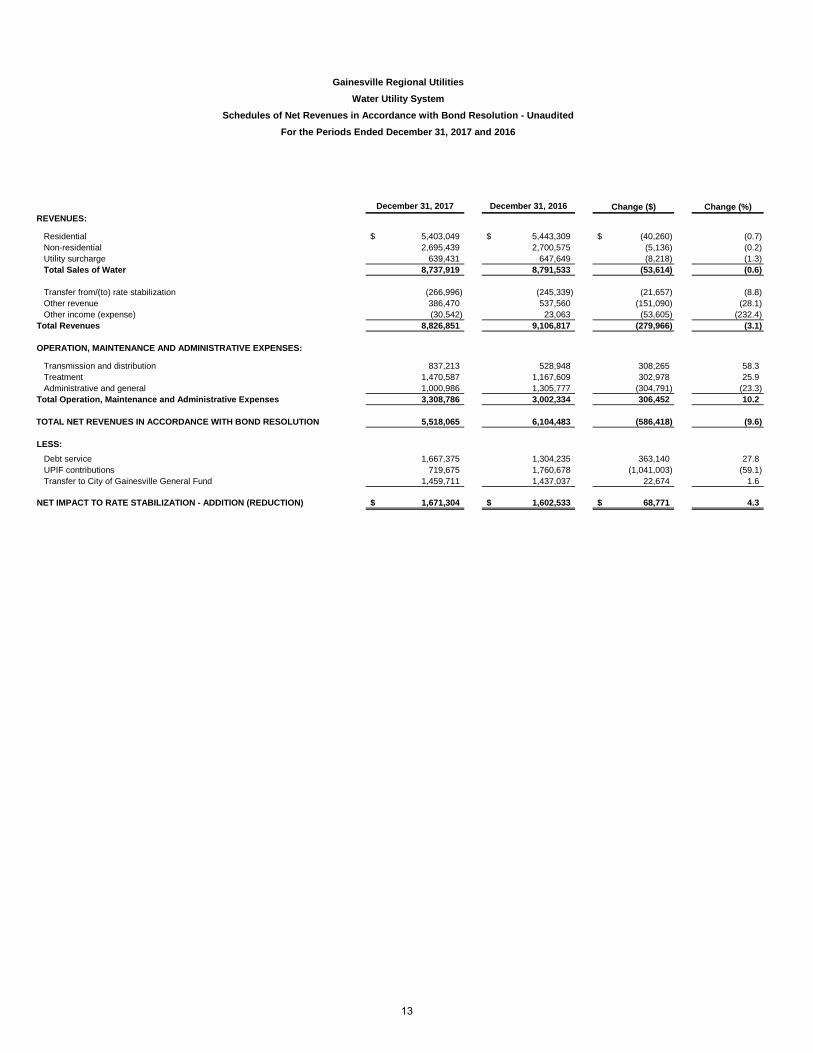
December 31, 2017 December 31, 2016 Change ($) Change (%)REVENUES:
Residential 5,403,049$ 5,443,309$ (40,260)$ (0.7) Non-residential 2,695,439 2,700,575 (5,136) (0.2) Utility surcharge 639,431 647,649 (8,218) (1.3) Total Sales of Water 8,737,919 8,791,533 (53,614) (0.6)
Transfer from/(to) rate stabilization (266,996) (245,339) (21,657) (8.8) Other revenue 386,470 537,560 (151,090) (28.1) Other income (expense) (30,542) 23,063 (53,605) (232.4)
Total Revenues 8,826,851 9,106,817 (279,966) (3.1)
OPERATION, MAINTENANCE AND ADMINISTRATIVE EXPENSES:
Transmission and distribution 837,213 528,948 308,265 58.3 Treatment 1,470,587 1,167,609 302,978 25.9 Administrative and general 1,000,986 1,305,777 (304,791) (23.3)
Total Operation, Maintenance and Administrative Expenses 3,308,786 3,002,334 306,452 10.2
TOTAL NET REVENUES IN ACCORDANCE WITH BOND RESOLUTION 5,518,065 6,104,483 (586,418) (9.6)
LESS:
Debt service 1,667,375 1,304,235 363,140 27.8 UPIF contributions 719,675 1,760,678 (1,041,003) (59.1) Transfer to City of Gainesville General Fund 1,459,711 1,437,037 22,674 1.6
NET IMPACT TO RATE STABILIZATION - ADDITION (REDUCTION) 1,671,304$ 1,602,533$ 68,771$ 4.3
For the Periods Ended December 31, 2017 and 2016
Gainesville Regional Utilities
Water Utility System
Schedules of Net Revenues in Accordance with Bond Resolution - Unaudited
13

December 31, 2017 December 31, 2016 Change ($) Change (%)REVENUES:
Residential 6,912,251$ 6,870,556$ 41,695$ 0.6 Non-residential 2,625,418 2,452,373 173,045 7.1 Utility surcharge 733,895 701,508 32,387 4.6 Total Sales of Services 10,271,564 10,024,437 247,127 2.5
Transfer from/(to) rate stabilization 555,337 74,760 480,577 642.8 Other revenue 1,135,861 455,806 680,055 149.2 Other income (expense) (59,893) 30,680 (90,573) (295.2)
Total Revenues 11,902,869 10,585,683 1,317,186 12.4
OPERATION, MAINTENANCE AND ADMINISTRATIVE EXPENSES:
Collection 1,671,110 834,013 837,097 100.4 Treatment 1,452,567 1,364,686 87,881 6.4 Administrative and general 1,146,107 1,346,791 (200,684) (14.9)
Total Operation, Maintenance and Administrative Expenses 4,269,784 3,545,490 724,294 20.4
TOTAL NET REVENUES IN ACCORDANCE WITH BOND RESOLUTION 7,633,085 7,040,193 592,892 8.4
LESS:Debt service 2,151,613 1,707,478 444,135 26.0 UPIF contributions 1,867,054 2,358,062 (491,008) (20.8) Transfer to City of Gainesville General Fund 1,837,144 1,808,608 28,536 1.6
NET IMPACT TO RATE STABILIZATION - ADDITION (REDUCTION) 1,777,274$ 1,166,045$ 611,229$ 52.4
Wastewater Utility System
For the Periods Ended December 31, 2017 and 2016
Schedules of Net Revenues in Accordance with Bond Resolution - Unaudited
Gainesville Regional Utilities
14
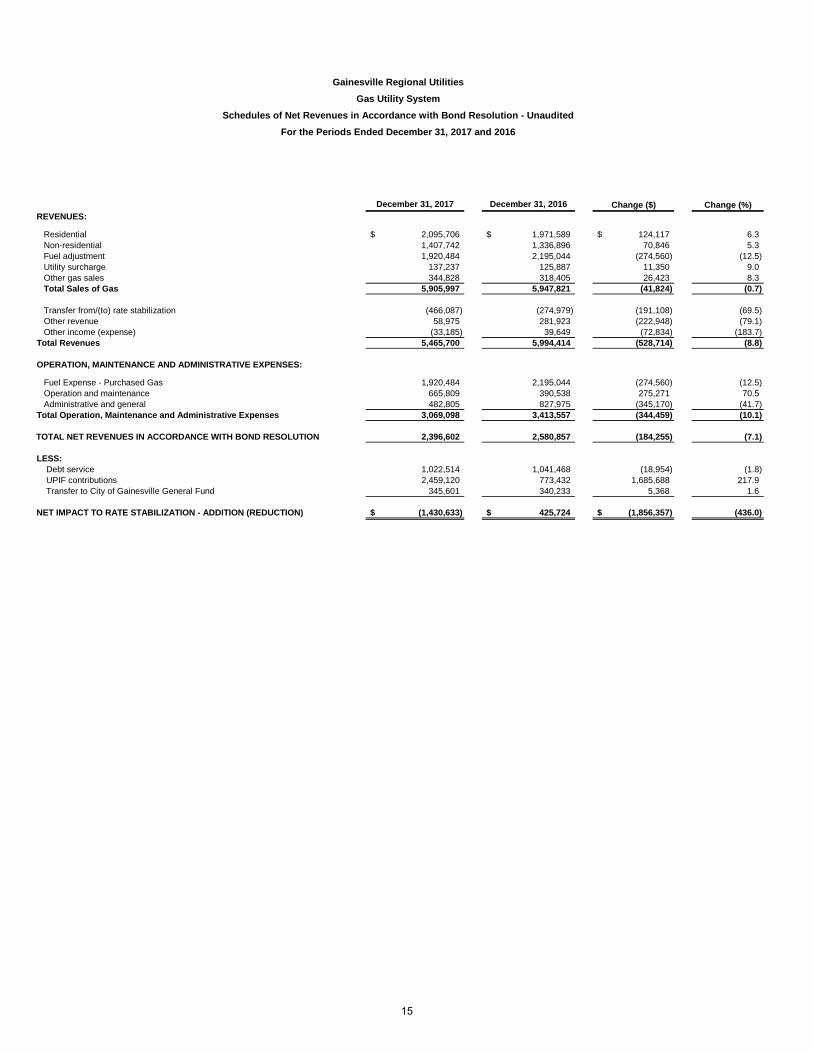
December 31, 2017 December 31, 2016 Change ($) Change (%)REVENUES:
Residential 2,095,706$ 1,971,589$ 124,117$ 6.3 Non-residential 1,407,742 1,336,896 70,846 5.3 Fuel adjustment 1,920,484 2,195,044 (274,560) (12.5) Utility surcharge 137,237 125,887 11,350 9.0 Other gas sales 344,828 318,405 26,423 8.3 Total Sales of Gas 5,905,997 5,947,821 (41,824) (0.7)
Transfer from/(to) rate stabilization (466,087) (274,979) (191,108) (69.5) Other revenue 58,975 281,923 (222,948) (79.1) Other income (expense) (33,185) 39,649 (72,834) (183.7)
Total Revenues 5,465,700 5,994,414 (528,714) (8.8)
OPERATION, MAINTENANCE AND ADMINISTRATIVE EXPENSES:
Fuel Expense - Purchased Gas 1,920,484 2,195,044 (274,560) (12.5) Operation and maintenance 665,809 390,538 275,271 70.5 Administrative and general 482,805 827,975 (345,170) (41.7)
Total Operation, Maintenance and Administrative Expenses 3,069,098 3,413,557 (344,459) (10.1)
TOTAL NET REVENUES IN ACCORDANCE WITH BOND RESOLUTION 2,396,602 2,580,857 (184,255) (7.1)
LESS: Debt service 1,022,514 1,041,468 (18,954) (1.8) UPIF contributions 2,459,120 773,432 1,685,688 217.9 Transfer to City of Gainesville General Fund 345,601 340,233 5,368 1.6
NET IMPACT TO RATE STABILIZATION - ADDITION (REDUCTION) (1,430,633)$ 425,724$ (1,856,357)$ (436.0)
Gas Utility System
Gainesville Regional Utilities
For the Periods Ended December 31, 2017 and 2016
Schedules of Net Revenues in Accordance with Bond Resolution - Unaudited
15
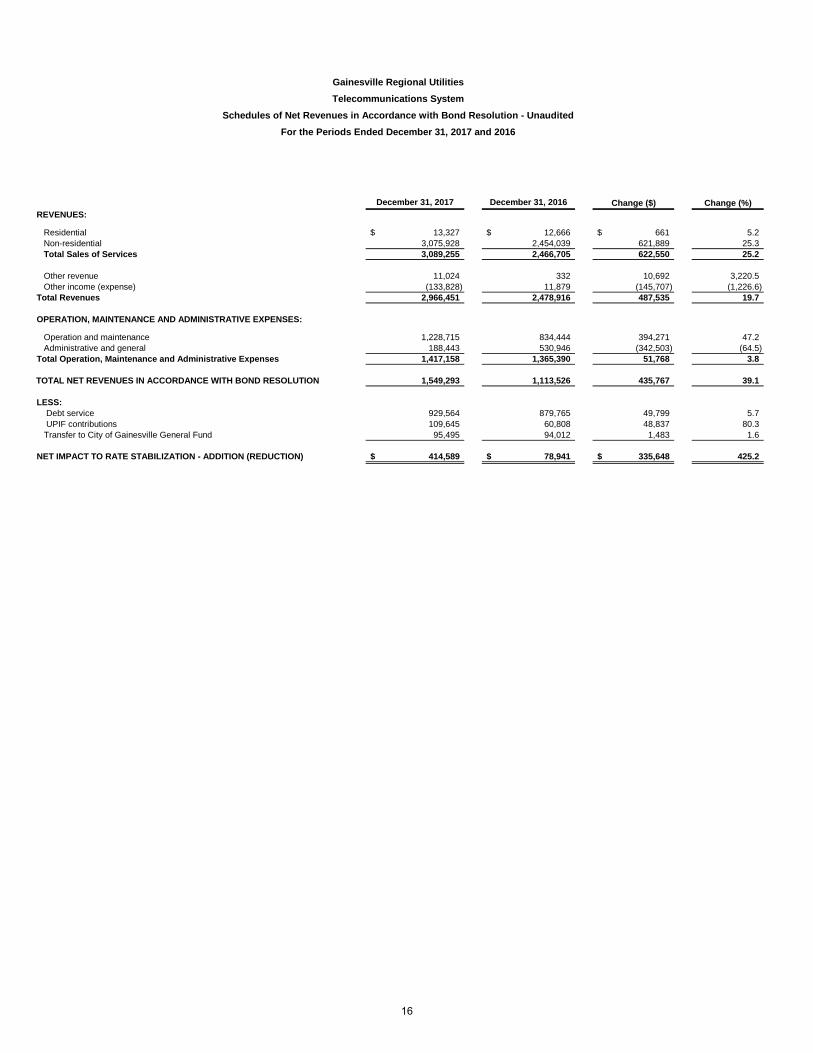
December 31, 2017 December 31, 2016 Change ($) Change (%)REVENUES:
Residential 13,327$ 12,666$ 661$ 5.2 Non-residential 3,075,928 2,454,039 621,889 25.3 Total Sales of Services 3,089,255 2,466,705 622,550 25.2
Other revenue 11,024 332 10,692 3,220.5 Other income (expense) (133,828) 11,879 (145,707) (1,226.6)
Total Revenues 2,966,451 2,478,916 487,535 19.7
OPERATION, MAINTENANCE AND ADMINISTRATIVE EXPENSES:
Operation and maintenance 1,228,715 834,444 394,271 47.2 Administrative and general 188,443 530,946 (342,503) (64.5)
Total Operation, Maintenance and Administrative Expenses 1,417,158 1,365,390 51,768 3.8
TOTAL NET REVENUES IN ACCORDANCE WITH BOND RESOLUTION 1,549,293 1,113,526 435,767 39.1
LESS: Debt service 929,564 879,765 49,799 5.7 UPIF contributions 109,645 60,808 48,837 80.3 Transfer to City of Gainesville General Fund 95,495 94,012 1,483 1.6
NET IMPACT TO RATE STABILIZATION - ADDITION (REDUCTION) 414,589$ 78,941$ 335,648$ 425.2
Schedules of Net Revenues in Accordance with Bond Resolution - Unaudited
For the Periods Ended December 31, 2017 and 2016
Gainesville Regional Utilities
Telecommunications System
16
Supplementary Data
17
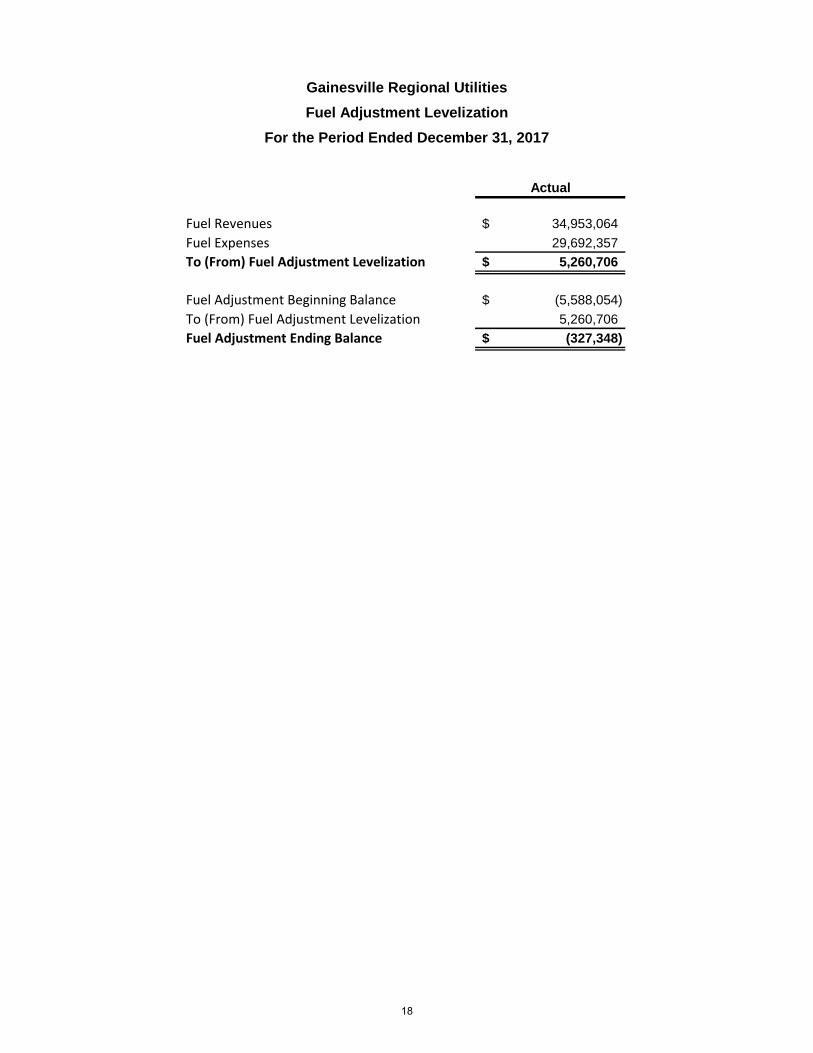
Actual
Fuel Revenues 34,953,064$
Fuel Expenses 29,692,357
To (From) Fuel Adjustment Levelization 5,260,706$
Fuel Adjustment Beginning Balance (5,588,054)$
To (From) Fuel Adjustment Levelization 5,260,706
Fuel Adjustment Ending Balance (327,348)$
For the Period Ended December 31, 2017
Gainesville Regional Utilities
Fuel Adjustment Levelization
18
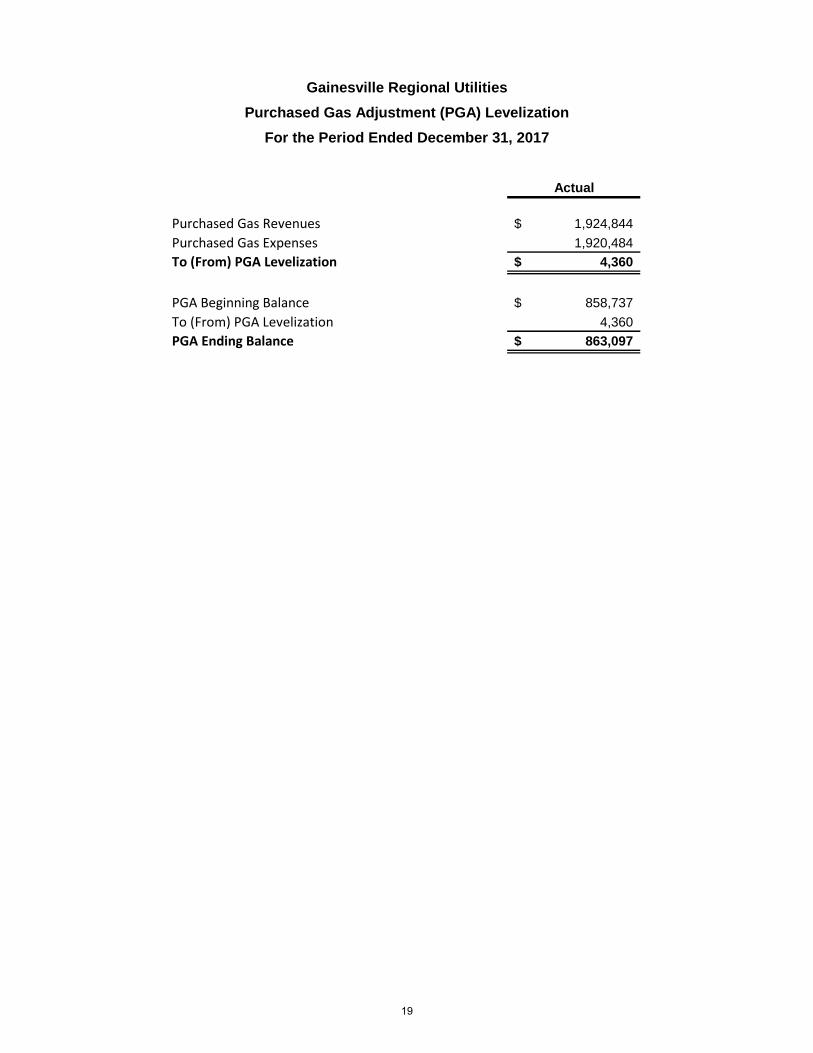
Actual
Purchased Gas Revenues 1,924,844$
Purchased Gas Expenses 1,920,484
To (From) PGA Levelization 4,360$
PGA Beginning Balance 858,737$
To (From) PGA Levelization 4,360
PGA Ending Balance 863,097$
Gainesville Regional Utilities
Purchased Gas Adjustment (PGA) Levelization
For the Period Ended December 31, 2017
19