Embed Size (px)
Citation preview
A Nutritional Evaluation and Optimisation of Infant
Foods using Microencapsulation
By
Emma Sarah Loughrill
(B.Sc. (Hons) Bioscience)
(000491971-8)
A thesis submitted in partial fulfilment of the requirements of the University of
Greenwich for the degree of Doctor of Philosophy
October, 2015
Faculty of Engineering and Science
University of Greenwich, Medway Campus
Chatham Maritime, Kent, ME4 4TB, UK
ii
DECLARATION
“I certify that this work has not been accepted in substance for any degree, and is not
concurrently being submitted for any degree other than that of Doctor of Philosophy being
studied at the University of Greenwich. I also declare that this work is the result of my own
investigations except where otherwise identified by references and that I have not plagiarised
the work of others.”
____________________________ (Emma Sarah Loughrill) (Candidate)
…………………………………………………………………………………………………
PhD Supervisors
____________________________ (Dr. N. Zand)
_____________________________ (Prof. B. Z. Chowdhry)
Date: 16/01/2016

iii
ACKNOWLEDGEMENTS
I would like to momentously thank my academic supervisors, Dr Nazanin Zand and
Prof. Babur Z. Chowdhry, for their valuable advice, support, encouragement and guidance
throughout the whole project.
In addition, I would like to thank all the staff of the Faculty of Engineering and Science, in
particular Deviyani Amin, Dr Dennis Douromis, Pesila Govinden, Dr Aurélie Bechoff,
Dudley Farman, Sharon Thompson, Dr David Wray, Dr Mushfiq Akanda, Dr Samuel Owusu-
Ware, Dr Ian Slipper, Tatianna Christides, Dr Laurence Harbige, Prof. Martin J. Snowden,
Prof. John Mitchell, Atiya Reza, Steven Williams, Alan Staple, Clifford Birchald, Dr Mark
Allen, Petra Navarro-Clark, Amanda Lewis, Nichola Hunn, Mandy Brunt, Sam Ingram, Sam
Lewis, Dr Ming Xiang and Dr Lauren Pecorino, for their support, assistance and guidance.
I would also like to thank ThermoScientific for providing me with equipment necessary for
my research.
iv
ABSTRACT
A Nutritional Evaluation of Infant Foods and Optimisation using Microencapsulation
Over recent decades the modern lifestyle dynamic has lead to an increased parental reliance
on commercially marketed complementary infant foods in the UK, which has been
highlighted by the Diet and Nutriton Survey of Infants and Young Children. The current
nutritional labelling formats for ready-to-eat complementary infant foods are a duplicate of
the legislative requirements for manufacturing of ready meals, intended for the general
population, the implication of this is that a number of important nutrients maybe limiting or
excessive, which will affect their nutritional quality and suitability as an infant food.
Furthermore nutritional databases, such as McCance and Widdowson provide limited data on
the composition of these types of food products. The European Food Safety Authority has
highlighted that nutrient intake data after six months of life is currently inadequate as well as
insufficient and urgently needs to be addressed. Therefore the nutritional content of these
food products needs to be assessed to ascertain whether or not infants are meeting dietary
requirements when consuming such products.
The aims of this study were to evaluate the nutritional suitability of infant food products
currently available on the UK market, according to the most up to date recommendations and
recent relevant legislation and to explore the microencapsulation of docasahexaenoic acid
(DHA) to optimise the nutrient content of infant food products.
New protocols were developed for the quantitative analysis of certain key nutrients including
High Pressure Liquid Chromatography (HPLC) – Charged Aerosol Detection for essential
fatty acids, HPLC and UV spectrophotometry for fat soluble vitamins A and E, competitive
enzyme immunoassay (Vitakit D™) for vitamin D and Inductively Coupled Plasma Optical
Emission Spectroscopy for essential elements (Ca, Cu, Fe, K, Mg, Na, P and Zn) in
commercial infant foods in the UK. The estimated daily intakes of these products were
compared against current dietary recommendations for infants. In addition the Ca:P ratio was
also determined in a range of commercial infant foods and compared with recommendations
in relation to bone health. Furthermore, the effects of commonly practiced re-heating
treatments used by parents were examined to establish whether different preparation methods
affected the fatty acid content of manufactured infant formula milks. Finally, through the
nutritional evaluation of these infant food products, the infant’s diet was found to be low in
v
DHA, which provided opportunities for scope and product optimisation to improve the
nutritive value of infant food products. Therefore microencapsulation of DHA was explored
as a potential way to improve the nutritional quality of infant food products.
The nutritional evaluation of the essential fatty acid content of a 6-9 month old infant’s diet
highlighted that pre-formed long chain polyunsaturated fatty acids (LCPUFA) DHA and
arachidonic acid (AA) intakes (at 23.3 mg/day and 36.7 mg/day, respectively) were below
recommendations set by the US, at 103.3 mg/day and 147.5 mg/day, respectively. This
provides scope for product optimization to improve the nutritive value of commercial infant
food products. With respect to the precursor essential fatty acids, the dietary intake of the n-6
fatty acid linoleic acid (LA) was found to be above recommendations at 3147.9 mg/day,
whereas the n-3 fatty acid α-linolenic acid (ALA) was found to be below recommendations at
296.4 mg/day, which increases the LA:ALA ratio of the diet; this may have implications for
allergy. As the fortified infant formula was identified as the major dietary contributor and due
to the fact that unsaturated fatty acids are prone to oxidation, the impact of re-heating
treatments used by parents on the fatty acid content of formula milk was investigated and a
degree of statistically significant changes were observed. In relation to the transparency of the
nutritional information declared on the labels by the manufacturers, infant formula milks
were all within the limits of EU regulations although there was a degree of significant
variation between the quantitative values analyzed in this study and the declared values on
the labels.
With regards to the vitamin A and E analysis, normal phase HPLC was employed for the
simultaneous quantification of retinyl acetate, retinyl palmitate, α-tocopherol and
γ-tocopherol; reverse phase HPLC was used for the quantification of β-carotene and UV
spectrophotometry for the quantification of carotenoids from selected meat and vegetable
‘ready-to-feed’ commercial infant meals. Based on the results of the study, the estimated total
daily intake for a 6-9 month old infant of vitamin A (retinol equivalents, RE) and vitamin E
(α-tocopherol equivalents, ATE) from both infant food and formula milk were 1.74 mg
RE/day and 10.4 mg ATE/day, respectively. These intakes exceed the recommendations set
by the Department of Health (1991). The main dietary contributor was highlighted as being
the fortified infant formula which highlights the importance of nutrient dense foods in
situations where infant formula is reduced or compromised.
vi
The study into the essential elemental content of dairy based commercial infant food products
found that the Ca:P ratio of a 7-12 month old infant’s diet was 1.49:1, which was within the
recommended range of 1-2:1. However, the level of intake for each of the elements analyzed,
with the exception of sodium, were found to be above the Recommended Nutrient Intake
(RNI) set by the Department of Health (1991), which warrants further investigation in
relation to both micronutrient interactions, and in situations where the intake of fortified
infant formula milk is compromised. In addition, as this study was the first to include
consumption of infant snack products, the level of total calorie intake was also assessed,
which indicated that energy intakes exceed recommendations set by the Scientific Advisory
Committee of Nutrition (2011) by 42%, which may have implications for obesity. This
highlights that parents need to select appropriate snack products. In relation to bone health,
vitamin D was also quantified in a range of commercial infant meals. The total dietary intake
of vitamin D3 was determined to be 9.61 μg/day, which is 137% higher than the RNI set by
the Department of Health (1991) for 7-12 month old infants. However 120% is contributed
from fortified infant formula, which may raise a cause for concern over deficiency issues, in
situations where infant formula is reduced or compromised or the infant is breastfed.
Furthermore the National Diet and Nutriton Survey have shown evidence for an increased
risk of vitamin D deficiency in all age and sex groups in the UK.
Consequently, following the nutritional evaluation of commercial infant food products, an
infant’s diet is not meeting recommendations for the pre-formed long chain polyunsaturated
fatty acids, DHA and AA. DHA may be of more significance due to endogenous production.
Therefore, two approaches have been explored for the encapsulation of DHA in the pH
dependent polymer hydroxypropyl methylcellulose acetate succinate (HPMCAS). In the first
approach direct spray drying was implemented for the microencapsulation of DHA/HPMCAS
organic solutions, while in the second approach solid lipid nano-emulsions of DHA, produced
by high pressure homogenization, were subsequently spray dried in HPMCAS aqueous
solutions. The direct spray drying approach resulted in significantly higher quantities of DHA
being encapsulated, at 2.09 g/100 g compared to 0.60 g/100 in the spray dried solid lipid
nano-emulsions. DHA stability was increased by the direct spray drying approach and the
release of DHA was analysed by a dissolution methodology. The encapsulated powders
produced by the desired method offer a source of DHA that has the potential to be
incorporated into infant foods to increase their dietary DHA consumption.
Emma Sarah Loughrill [B.Sc. (Hons)]
vii
CONTENTS
DECLARATION……………………………………………………………………………...ii
ACKNOWLEDGEMENTS…………………………………………………………………..iii
ABSTRACT…………………………………………………………………………………..iv
CONTENTS………………………………………………………………………………….vii
List of Figures………………………………………………………………………………..xii
List of Tables………………………………………………………………………………...xiv
ABBREVIATIONS………………………………………………………………………...xvii
Chapter 1: Overview of the thesis…………………………………………………………...1
1.1 Research questions………………………………………………………………………...2
1.2 Aims and objectives……………………………………………………………………….3
1.3 References…………………………………………………………………………………4
Chapter 2: Introduction……………………………………………………...………………7
2.1 Infant feeding……………………………………………………………………………...7
2.2 Essential fatty acids………………………………………………………………………17
2.2.1 Metabolism of essential fatty acids………………….………………………………..18
2.2.2 Essential fatty acids in breast milk and infant formula….……………………………22
2.2.3 LA:ALA ratio…………………………………………….…………………………...23
2.2.4 Essential fatty acids: vision and neurodevelopment……….………………………….24
2.2.5 Essential fatty acids: allergy……………………………….………………………….37
2.2.6 Essential fatty acids: bone health………………………….………………………….42
2.2.7 Essential fatty acids: cardiovascular disease and obesity….………………………….49
2.2.8 Essential fatty acid recommendations……………………….………………………..49
2.3 Fat soluble vitamins……………………………………………………………………...51
2.3.1 Vitamin A……………………………………………………….…………………….54
2.3.2 Carotenoids……………………………………………………….…………………...59
2.3.3 Vitamin E………………………………………………………….………………….61
2.4 Bone health……………………………………………………………………………….67
2.4.1 Calcium…………………………………………………………….…………………70
2.4.2 Phosphorus………………………………………………………….………………...71
2.4.3 Ca:P………………………………………………………………….………………..73
viii
2.4.4 Micronutrient interactions…………………………………………….………………73
2.4.5 Food labelling of micronutrients……………………………………….……………..74
2.4.6 Vitamin D……………………………………………………………….…………….74
2.4.6.1 Vitamin D: recommendations…………………………………………...…………78
2.4.6.2 Vitamin D: other roles……………………………………………………...………80
2.4.6.3 Vitamin D: asthma…………………………………………………………...…….81
2.4.6.4 Vitamin D: allergy……………………………………………………………...…..81
2.4.6.5 Vitamin D: brain development…………………………………………………......83
2.4.6.6 Vitamin D: diabetes……………………………………………………………...…85
2.5 Processing and storage…………………………………………………………………...86
2.6 Fortification………………………………………………………………………………88
2.7 Microencapsulation………………………………………………………………………89
2.8 Assessing dietary intake………………………………………………………………….91
2.9 References………………………………………………………………………………..92
Chapter 3: An investigation into the fatty acid content of selected fish based commercial
infant foods in the UK and the impact of commonly practiced re-heating treatments
used by parents for the preparation of infant formula milks…………………………..117
3.1 Introduction……………………………………………………………………………..117
3.2 Materials and methods………………………………………………………………….119
3.2.1 Chemicals…………………………………………………………………………....119
3.2.2 Sample collection and analysis of complementary infant foods……………………119
3.2.3 Sample collection and analysis of infant formula milk……………………………...121
3.2.4 Sample collection for nutritional labelling evaluation of infant formula milks……..122
3.2.5 HPLC–CAD analysis………………………………………………………………..122
3.2.6 Limit of Detection (LOD) and Limit of Quantification (LOQ)……………………..123
3.2.7 Quality assurance…………………………………………………………………....124
3.2.8 Statistical methods…………………………………………………………………...124
3.3 Results and discussion…………………………………………………………………..124
3.3.1 Evaluation of infant’s dietary daily intake of fatty acids in relation to
recommendations…………………………………………………………………….........124
3.3.2 Impact of commonly practiced re-heating treatments for the preparation of infant
formula milk and the transparency of the nutritional labels………………………….........128
ix
3.3.3 Labelling of infant formula milk in the UK………………………………………....131
3.4 Conclusions……………………………………………………………………………..132
3.5 References………………………………………………………………………………132
Chapter 4: Vitamin A and E content of commercial ‘ready-to-feed’ infant foods in the
UK; a cause for concern?.....................................................................................................137
4.1 Introduction……………………………………………………………………………..137
4.2 Materials and methods………………………………………………………………….140
4.2.1 Chemicals…………………………………………………………………….……...140
4.2.2 Sample Collection…………………………………………………………….……..140
4.2.3 Sample preparation for retinyl acetate, retinyl palmitate, α-tocopherol and
γ- tocopherol………………………………………………………….………………...….140
4.2.4 Sample preparation for β-Carotene and total carotenoid analysis……………….…..142
4.2.5 HPLC analysis…………………………………………………………………….…142
4.2.6 Spectrophotometer analysis……………………………………………………….…143
4.2.7 Linearity, Limit of Detection (LOD) and Limit of Quantification (LOQ)……….….143
4.2.8 Quality assurance…………………………………………………………………....145
4.2.9 Statistical methods…………………………………………………………………...145
4.3 Results and discussion…………………………………………………………………..145
4.4 Conclusions……………………………………………………………………………..152
4.5 References………………………………………………………………………………153
Chapter 5: Calcium to phosphorus ratio, essential elemental and vitamin D content of
infant foods in the UK: possible implications for bone
health……………………………………………………………………………………….157
5.1 Introduction……………………………………………………………………………..157
5.2 Materials and methods………………………………………………………………….159
5.2.1 Sample collection for essential elemental analysis……………………….…………159
5.2.1.1 Sample preparation for analysis of essential elements…………………...……….162
5.2.1.2 Preparation of standards for essential elemental analysis…………………...……163
5.2.1.3 Quality assurance for essential elemental analysis…………………………...…...163
5.2.2 Sample collection for vitamin D3 analysis……………………………………….….164
5.2.2.1 Sample preparation for analysis of vitamin D3…………………………………...164
5.2.2.2 Preparation of standards for vitamin D3 analysis……………………………...…166
x
5.2.2.3 Quality assurance for vitamin D3 analysis…………………………………...…...166
5.2.3 Estimation of Total Daily Intake……………………………………………….……167
5.2.4 Estimated Energy Intake……………………………………………………….……167
5.2.5 Statistical Analysis……………………………………………………………….….167
5.3 Results and Discussion …………………………………………………………………168
5.3.1 Essential elements…………………………………………………………………...168
5.3.2 Vitamin D………………………………………………………………………...….172
5.3.3 Estimated energy intake………………………………………………………….….175
5.4 Conclusions……………………………………………………………………………..175
5.5 References………………………………………………………………………………175
Chapter 6: Microencapsulation of docosahexaenoic acid (DHA) for potential use in
ready to feed infant foods…………………………………………………………………181
6.1 Introduction……………………………………………………………………………..181
6.2 Materials and methods………………………………………………………………….183
6.2.1 Preparation and spray drying of solid lipid nanoparticles…………………….……..184
6.2.2 Spray drying of DHA-HPMCAS microparticles……………………………….…...185
6.2.3 Fatty acid composition of encapsulated powders……………………………….…...185
6.2.4 Characterisation of the encapsulated powder…………………………………….….185
6.2.4.1 Moisture content…………………………………………………………...……...185
6.2.4.2 Oven drying…………………………………………………………………...…..186
6.2.4.3 Thermal gravimetric analysis……………………………………………………..186
6.2.4.4 Water activity……………………………………………………………...……...186
6.2.4.5 Encapsulation efficiency……………………………………………………...…..186
6.2.4.6 Scanning electron microscopy………………………………………………….....187
6.2.4.7 Particle size distribution……………………………………………………...…...187
6.2.4.8 X ray powder diffraction…………………………………………………...……..187
6.2.4.9 Fourier transform infrared…………………………………………………...……188
6.2.4.10 Differential scanning calorimetry……………………………………………......188
6.2.4.11 Stability testing……………………………………………………………...…...188
6.2.4.12 Dissolution…………………………………………………………………...….189
6.3 Results and Discussion………………………………………………………………….189
6.3.1 Methods of encapsulation…………………………………………………………....189
6.3.2 Characterisation of encapsulated powder…………………………………………....191
xi
6.3.2.1 Moisture content, water activity and encapsulation efficiency………………...…191
6.3.2.2 Scanning electron microscopy………………………………………………….....192
6.3.2.3 Particle size distribution………………………………………………………......193
6.3.2.4 X ray powder diffraction…………………………………………………...……..193
6.3.2.5 Fourier transform infrared…………………………………………………...……194
6.3.2.6 Thermal analysis: DSC and TGA……………………………………………..…..195
6.3.2.7 DHA Stability testing…………………………………………………………..…198
6.3.2.8 Dissolution…………………………………………………………………..……198
6.4 Conclusions……………………………………………………………………………..199
6.5 References………………………………………………………………………………199
Chapter 7: General Discussion……………………………………………………………203
7.1 Highlights of the essential fatty acid analysis (Chapter 3)……………………………...204
7.2 Highlights of the vitamin A and E analysis (Chapter 4)………………………………..205
7.3 Highlights of the essential elemental and vitamin D analysis (Chapter 5)……………..206
7.4 Highlights of the microencapsulation of fish oil (Chapter 6)…………………………...207
7.5 Implications of the research…………………………………………………………….207
7.6 References………………………………………………………………………………208
Chapter 8: Overall Conclusions and Future Work…...…………………………………209
8.1 Future work in relation to the current infant food market………………………………210
8.2 Future work in relation to new product development…………………………………..211
8.3 References……………………………………………………………………………....211
ADDENDUM……………………………………………………………………………….212
xii
List of Figures
Fig. 2.1 Hypothetical scheme of fat, fatty acid (ω6, ω3, trans and total) (as percentage of
calories from fat), vitamins E and C (mg/d) dietary intake changes…………………………16
Fig. 2.2 Synthesis pathways of n-6 and n-3 long chain polyunsaturated fatty acids………...19
Fig. 2.3 Representation of the major steps involved in lipid absorption……………………..22
Fig. 2.4 Variation in breast milk DHA concentrations worldwide…………………………..23
Fig. 2.5 Distribution of ALA, EPA, DHA and AA in the body……………………………...28
Fig. 2.6 Maternal DHA supplementation and effects on breast milk DHA and AA
concentrations………………………………………………………………………………...28
Fig. 2.7 DHA accumulation in the infant brain during the first year of life…………………35
Fig. 2.8 Inflammatory mediators derived from AA, EPA and DHA………………………...38
Fig. 2.9 Forms of vitamin A and their conversion pathways………………………………...54
Fig. 2.10 Schematic diagram of retinoid absorption, transport, and metabolism……………55
Fig. 2.11 Different forms of vitamin E………………………………………………………62
Fig. 2.12 Vitamin E in cell membranes………………………………………………………63
Fig. 2.13 Absorption and excretion of vitamin E…………………………………………….64
Fig. 2.14 Regulation of phosphorus………………………………………………………….72
Fig. 2.15 Metabolism and regulation of vitamin D…………………………………………..76
Fig. 2.16 Morphology of different types of microparticles……………………..……………91
Fig. 3.1 HPLC-CAD chromatogram of fatty acids…………………………………………123
Fig. 4.1 HPLC chromatogram of retinyl palmitate, retinyl acetate, α-tocopherol and
γ-tocopherol………………………………………………………..………………………..144
Fig. 4.2 HPLC chromatogram of β-carotene………………………………………………..144
xiii
Fig. 6.1 SEM micrographs of fish oil encapsulated powder………………………………..192
Fig. 6.2 PSD distribution of fish oil encapsulated powder…………………………………193
Fig. 6.3 XRPD spectra of HPMCAS and fish oil encapsulated powder……………………194
Fig. 6.4 FTIR spectra of fish oil, HPMCAS and corresponding spray dried encapsulated
powder………………………………………………………………………………………195
Fig. 6.5 Overlay of the DSC data observed for HPMCAS, fish oil and encapsulated
powder………………………………………………………………………………………196
Fig. 6.6 TGA curve overlay of HPMCAS and encapsulated powder product……………...198
xiv
List of Tables
Table 2.1 Breast milk, cow’s milk and nutritional composition of leading UK brands of first
infant milks …………………………………………………………………………………..11
Table 2.2 Fat content of human milk and cow’s milk……………………………………….13
Table 2.3 Common dietary sources of n-3 and n-6 essential fatty acids…………………….21
Table 2.4 Studies assessing the effect of the LA:ALA in infant formulas with effects on
blood composition and visual function in term infants………………………………………25
Table 2.5 Expert positions for DHA and AA levels in term infant formulas………………..27
Table 2.6 Studies assessing the effect of DHA +/- AA supplementation on visual and
neurodevelopment in term infants during infancy…………………………………………...29
Table 2.7 Fatty acid studies in term infant’s effects on allergy and infection……………….43
Table 2.8 Institute of Medicine and Food and Agriculture Organisation recommended dietary
intakes of total fat and fatty acids during infancy……………………………………………50
Table 2.9 Actual intakes recommended for infant formula/diet……………………………..50
Table 2.10 Vitamin functions, sources and recommendations………………………………52
Table 2.11 Conversion factors for the different forms of vitamin A into retinol equivalents.58
Table 2.12 Conversion factors for vitamin E activity in α-tocopherol equivalents………….67
Table 2.13 Mineral function, sources and recommendations………………………………..68
Table 2.14 Examples of micronutrient interactions………………………………………….74
Table 2.15 Studies assessing the effects of vitamin D during infancy on atopic diseases…..84
Table 3.1 Infant complementary food sample characteristics……………………………...120
Table 3.2 Range, Limit of Detection (LOD) and Limit of Quantification (LOQ) for EPA,
ALA, DHA, AA and LA……………………………………………………………………124
Table 3.3 Concentration of fatty acids in four brands of commercial ‘ready to feed’
complementary infant foods in the UK (mean ± SD)………………………………………125
xv
Table 3.4 Evaluation of total daily dietary intake of fatty acids by an infant aged 6-9 months
old, based on a standard feeding regime composed of commercial ‘ready-to-feed’ infant
foods and formula milk in relation to recommended total daily intakes……………………127
Table 3.5 Concentration of fatty acids in infant formula milk subjected to different re-heating
treatments (mean ± SD) and concentrations stated on the manufacturer’s label…………...129
Table 3.6 Fatty acid characteristics of 6+ months follow on RTF infant formula available on
the UK market………………………………………………………………………………131
Table 4.1 Infant complementary food sample characteristics……………………………...141
Table 4.2 Linearity, Limit of Detection (LOD) and Limit of Quantification (LOQ) of vitamin
A and E……………………………………………………………………………………...143
Table 4.3 Concentration of vitamin A and E in commercial ‘ready to feed’ infant foods in the
UK intended for consumption for 7 month + old infant (mean ± SD)……………………...146
Table 4.4 Conversion factors for the different forms of vitamin A into retinol equivalents.147
Table 4.5 Total daily intake of vitamin A (RE) and vitamin E (α-TE) by an infant aged 6-9
months old, based on gastric capacity of an 8 month old infant and a standard feeding regime
composed of commercial ‘ready to feed’ infant food products and infant formula milk…..149
Table 5.1 Ingredients and characteristics of commercial infant food samples for essential
elemental analysis…………………………………………………………………………..160
Table 5.2 CEM MARS 5®, (XP-1500 vessels) microwave digestion conditions for essential
elemental analysis…………………………………………………………………………..162
Table 5.3 ICPOES instrument operating parameters applied for determination of essential
elements……………………………………………………………………………………..163
Table 5.4 Measured results (mean (n = 5) and RSD), certified values (mean ± uncertainty)
and % recovery for Certified Reference Material (NCS ZC73009: wheat) to determine quality
assurance of ICPOES method for essential elemental analysis………………………….....164
Table 5.5 Ingredient and characteristics of commercial infant foods for vitamin D3
analysis……………………………………………………………………………………...165
xvi
Table 5.6 Concentration of essential elements (Ca, P, Fe, Zn, Mg, K, Na and Cu) in
commercial infant foods determined by ICPOES (mean (n=3) and SEM, standard error of
mean)………………………………………………………………………………………..169
Table 5.7 Total daily intake of essential elements (Ca, P, Fe, Zn, Mg, K, Na, Cu) by an infant
age 7-12 months old, based on the gastric capacity of an 8 month old infant and the standard
feeding regime composed of commercial infant food products and infant formula milk in
relation to the recommended nutrient intakes (RNI)………………………………………..170
Table 5.8 Concentration of vitamin D3 in commercial infant foods (mean (n=3) and SEM,
standard error of mean)……………………………………………………………………..173
Table 5.9 Total daily intake of vitamin D3 by an infant aged 7-12 month old, based on the
gastric capacity of an 8 month old and a standard feeding regime composed of commercial
infant food products and infant formula milk in relation to the recommended nutrient intake
(RNI)………………………………………………………………………………………..174
Table 6.1 Comparison of the fatty acid composition of fish oil encapsulated powders
produced by different encapsulation methodologies………………………………………..190
Table 6.2 DHA content, solid yield % and DHA encapsulation efficiency (EE) of
encapsulated powders produced by different methodologies……………………………….190
Table 6.3 Mean temperatures at the peak maxima and energies associated with the processes
detected by DSC analysis…………………………………………………………………...197
xvii
ABBREVIATIONS
Abbreviation Description
AA Arachidonic Acid
AI Actual Intake
ALA α-Linolenic acid
ANOVA Analysis of Variance
ATE α-Tocopherol Equivalents
ATR Attenuated Total Reflectance
BCMO -Carotene Monooxygenase
BHA Butylated Hydroxyanisole
BHT Butylated Hydroxytoluene
Ca:P Calcium-to-Phosphorus Ratio
CAD Charged Aerosol Detector
COMA Committee of Medical Aspects of Food and Nutrition Policy
COX Cyclooxygenase
CRBP Cellular Retinol Binding Protein
D2 Ergocalciferol
D3 Cholecalciferol
DGLA Dihomo γ-Linolenic Acid
DHA Docosahexaenoic Acid
DNSIYC Diet and Nutrition Survey of Infants and Young Children
DOH Department of Health
DRI Dietary Reference Intake
DSC Differential Scanning Calorimetry
EAR Estimated Average Requirement
EEI Estimated Energy Intake
EFSA European Food Safety Authority
ELISA Enzyme Linked Immunosorbent Assay
ELSD Evaporative Light Scattering Detection
EPA Eicosapentaenoic Acid
ESPGHAN European Society for Paediatric Gastroenterology Hepatology and Nutrition
FADS Fatty Acid Desaturase

xviii
FAO Food and Agriculture Organisation
FGF Fibroblast Growth Factor
FTIR Fourier Transform Infrared
GLA γ-Linolenic Acid
HPMCAS Hydroxy Propyl Methyl Cellulose Acetate Succinate
ICPOES Inductively Coupled Plasma Optical Emission Spectroscopy
IDA Iron Deficiency Anaemia
IFN Interferon
Ig Immunoglobulin
IL Interleukin
IOM Institute of Medicine
LA Linoleic Acid
LCPUFA Long Chain Polyunsaturated Fatty Acids
LOD Limit of Detection
LOQ Limit of Quantification
LOX Lipoxygenase
LRNI Lower Reference Nutrient Intake
LT Leukotrienes
MTBE Methyl Tert-Butyl Ether
NDNS National Diet and Nutrition Survey
NFᴋB Nuclear Factor Kappa B
NHANES National Health and Nutrition Examination Survey
NIH National Institute of Health
NP-HPLC Normal Phase High Performance Liquid Chromatography
NPT Sodium/phosphate co-transporter
PE Petroleum Ether
PG Prostaglandins
PPAR Peroxisome Proliferator Activated Receptor
PSD Particle Size Distribution
PTH Parathyroid Hormone
PUFA Polyunsaturated Fatty Acids
RAE Retinol Activity Equivalents
RAR Retinoic Acid Receptor

xix
RBP Retinol Binding Protein
RDA Recommended Daily Allowance
RE Retinol Equivalents
RNI Recommended Nutrient Intake
RP-HPLC Reverse Phase High Performance Liquid Chromatography
RSD Relative Standard Deviation
RTF Ready-to-Feed
RXR Retinoid X Receptor
S/N Signal to Noise
SD Standard Deviation
SEM Standard Error of Mean
SEM Scanning Electron Microscopy
SLN Solid Lipid Nanoparticles
T h T Helper
T reg Regulatory T cell
TGA Thermal Gravimetric Analysis
TGF Transforming Growth Factor
THF Tetrahydrofuran
TNF Tumour Necrosis Factor
α-TTP α-Tocopherol Transport Protein
TX Thromboxane
UL Tolerable Upper Intake Level
VDR Vitamin D Receptor
VEP Visual Evoked Potential
WHO World Health Organisation
XRDP X Ray Powder Diffraction
1
Chapter 1
Overview of the thesis
Pregnancy, lactation and infancy are specific times in life when essential nutrients are
indispensable and where their requirements are different to any other life stages to support
rapid growth and development (Bryhn, 2006). With foetal life and childhood being periods of
rapid growth and development, an imbalanced nutrient supply at this age may alter body
structure and function in a way that increases the risk of chronic disease (Scientific Advisory
Committee on Nutrition, 2011). During the first 4-5 months of life the weight of an infant
doubles, this results in a relatively high requirement of energy and nutrients/kg of body
weight; which are proportionally higher than at any other time during life (Scientific
Committee on Food, 2003). Growth and development is absolutely dependent on an adequate
supply of energy and nutrients which are sufficient to match the variable needs of the infant
as growth progresses, with any limitation in nutrient supply likely to constrain the pace and
pattern of development (Scientific Advisory Committee on Nutrition, 2011).
Based on extensive scientific evidence, the World Health Organisation (World Health
Organisation, 2004) recommends exclusive breastfeeding for the first 6 months of life (Food
Standards Agency, 2008). At around 6 months, infants require more iron, energy and other
nutrients which breast milk can no longer supply independently. The Department of Health
therefore recommends that solid foods or complementary foods are introduced at 6 months of
age; along with the continuation of breastfeeding or the use of an appropriate breast milk
substitute (Caroli, et al., 2012). Complementary or weaning foods are semi-solid or solid
foods used to transition an infant from the sole source of breast milk or infant formula to an
adult diet (Bond, et al., 2005). Weaning is the gradual introduction of beverages and foods
other than breast milk or infant formula, which should result in the consumption of foods that
are nutritionally balanced and supply the essential micro and macro nutrients required for the
optimal growth and development of an infant (Schwartz, et al., 2011).
The Diet and Nutrition Survey of Infants and Young Children has identified that 58% of
children who are fed foods other than milk have eaten a commercial baby or toddler meal
(Lennox et al., 2013), indicating that commercial ready-made baby meals are important
contributors to the infant’s nutrient supply. The use of ready-made baby foods is most
common between 5-10 months (McAndrew, et al., 2012). An increasing number of mothers
2
feed their infants with industrially processed infant foods and in recent years the baby food
market and the range of products has grown significantly. The first year of an infant’s life is a
sensitive period for the development of the nervous, reproductive, digestive, respiratory and
immune systems. Therefore the nutritional quality of commercial infant foods urgently needs
to be assessed in order to evaluate whether they are meeting the infants nutritional
requirements at a critical life stage (Pandelova, et al, 2012).
In addition, there is currently no clear and complete analytical nutritional data available for
ready to feed complementary infant foods in the UK. The nutritional database used in the
UK, McCance and Widdowson, contains limited data on the composition of complementary
infant foods, in addition the analytical techniques and nutrient data contained may now be
outdated. It is essential that food composition tables are regularly updated with the current
foods available on the market, especially with the regular introduction of new foods to the
market (Food Standards Agency, 2002).
Establishing the current intake of nutrients in infancy is a priority step to issuing dietary
guidelines (Nissensohn, et al., 2011). The European Food Safety Authority has highlighted
that nutrient intake data after 6 months of age is insufficient in most European countries
(EFSA, 2009). Observational studies have raised a cause for concern over later health
consequences bought about by deficient or excessive nutrient intakes during infancy (Caroli,
et al., 2012). A major health challenge in developed countries such as Europe and the United
States is the rising prevalence of diet related diseases including obesity, type 2 diabetes,
cardiovascular disease and cancer, which emphasises the need to assess the effects of specific
nutrients in early life and their contribution to chronic diseases in later life (Friedl, et al.,
2014; Schwartz, et al., 2011).
1.1 Research Questions
The issues that this study will address are:
1. What is the content of essential fatty acids, vitamins A, E and D and essential
elements (with special attention to the calcium to phosphorus ratio (Ca:P) in relation
to bone health) in selected commercial infant foods currently available in the UK?
2. Are the nutrient compositions of commercial infant foods assessed in line with the
current nutritional guidelines set for infants?
3
3. What is the effect of common heat treatment practices used by parents for the
preparation of infant formula milk on the essential fatty acid content of formula milk
products?
4. Can microencapsulation of fish oil offer protection against degradation of essential
fatty acids and offer a source of DHA that can be used to fortify infant food products?
1.2 Aims and Objectives
This study aims to:
1. Evaluate the nutritional suitability of infant food products currently available on the
UK market, according to the most up to date recommendations and recent relevant
legislation, with careful consideration of contemporary aspects of infant nutrition,
such as nutritional quality, allergens and essential fatty acids.
2. Explore the microencapsulation of essential fatty acids to optimise the nutrient
content of ‘ready-to-feed’ infant food products.
The objectives of the studies reported in this thesis are as follows:
1. To quantitatively establish the concentration of essential fatty acids (Chapter 3),
vitamins A, E (Chapter 4) and D and essential elements (Chapter 5) in commercially
prepared infant foods in the UK and compare estimated daily intakes of these
products against current dietary recommendations for infants.
2. Examine the effects of commonly practiced re-heating treatments used by parents on
essential fatty acids in manufactured infant formula milks (Chapter 3).
3. Establish the Ca:P ratio in a range of commercially prepared infant foods currently
sold in the UK and compare to recommendations in relation to bone health (Chapter
5).
4. Explore the microencapsulation of essential fatty acids using two approaches: direct
spray drying and solid lipid nano-emulsions produced by high pressure
homogenization, subsequently spray dried, followed by characterisation using
moisture content, water activity, encapsulation efficiency, particle size distribution,
scanning electron microscopy, X-ray powder diffraction, Fourier-transform infrared,
differential scanning calorimetry, thermogravimetric analysis, dissolution and stability
testing (Chapter 6).
4
In summary this project will develop new protocols for the quantitative analysis of certain
key nutrients including High Pressure Liquid Chromatography (HPLC) – Charged Aerosol
detection for essential fatty acids, HPLC and UV spectrophotometry for vitamins A and E,
competitive enzyme immunoassay (Vitakit D™) for vitamin D and Inductively Coupled
Plasma Optical Emission Spectroscopy for essential elements (Ca, Cu, Fe, K, Mg, Na, P and
Zn) in commercial infant foods in the UK. The results from the quantitative analysis will be
used to evaluate the total daily intake of nutrients based upon the consumption of commercial
‘ready to feed’ infant foods and infant formula. An evaluation of the nutritional quality of
these products in relation to nutritional requirements for infants will then be undertaken. In
addition the Ca:P ratio was also determined in a range of commercial infant foods and
compared with recommendations in relation to bone health. Furthermore, the effect of home
processing methods used by parents for the preparation of infant formulas will also be
evaluated to determine any nutrient losses due to certain thermal processes, focusing in
particular on the essential fatty acid content. Finally microencapsulation of essential fatty
acids will be explored to improve the nutritional quality of infant food products.
1.3 References
Bond, B., Fernandez, D. R., VanderJagt, D. J., Williams, M., Huang, Y.-S., Chuang, L.-T.,
Millson, M., Andrews, R., & Glew, R. H. (2005). Fatty acid, amino acid and trace mineral
analysis of three complementary foods from Jos, Nigeria. Journal of Food Composition and
Analysis, 18(7), 675-690.
Bryhn, Morten (2006). Polyunsaturated fatty acids in infant nutrition. Pronova Biocare,
EPAX AS.
Caroli, M., Mele, R. M., Tomaselli, M. A., Cammisa, M., Longo, F., & Attolini, E. (2012).
Complementary feeding patterns in Europe with a special focus on Italy. Nutritional
Metabolism and Cardiovascular Disease, 22(10), 813-8.
Committee on Toxicity (2003). COT statement on metals in infant food. COT statement
2003/02. Available at: http://cot.food.gov.uk.
EFSA (2009). Scientific Opinion on the appropraite age for the introduction of
complementary feeding of infants. EFSA Journal, 7(12): 1423.
5
Friedl, K. E., Rowe, S., Bellows, L. L., Johnson, S. L., Hetherington, M. M., de Froidmont-
Gortz, I., Lammens, V., & Hubbard, V. S. (2014). Report of an EU-US symposium on
understanding nutrition-related consumer behaviour: strategies to promote a lifetime of
healthy food choices. Journal of Nutrition Education and Behaviour, 46(5), 445-50.
Food Standards Agency (2002). McCance and Widdowson’s The Composition of Foods
integrated dataset user document. Available at: http://food.gov.uk.
Food Standards Agency (2008). Your baby: feeding your baby in the first year. Available at:
http://food.gov.uk.
Lennox, A., Sommerville, J., Ong, K., Henderson, H. & Allen, R. (2013). Diet and nutrition
survey of infants and young children, 2011. Public Health England, 1-107.
McAndrew, F., Thompson, J., Fellows, L., Large, A., Speed, M., & Renfrew, M. (2012).
Infant Feeding Survey 2010. NHS, health and social care information centre.
Nissensohn, M., Daniel Fuentes Lugo, J, D. A., Hermoso, M., Koletzko, B., & Serra Majem,
L. (2011). Report on actual nutrient intake of infants in the European countries. Academics
Paediatrics: Eurreca.
Pandelova, M., Lopez, W. L., Michalke, B., & Schramm, K. W. (2012). Ca, Cd, Cu, Fe, Hg,
Mn, Ni, Pb, Se, and Zn contents in baby foods from the EU market: Comparison of assessed
infant intakes with the present safety limits for minerals and trace elements. Journal of Food
Composition and Analysis, 27(2), 120-127.
Schwartz, C., Scholtens, P. A., Lalanne, A., Weenen, H., & Nicklaus, S. (2011).
Development of healthy eating habits early in life. Review of recent evidence and selected
guidelines. Appetite, 57(3), 796-807.
Scientific Advisory Committee on Nutrition (2011). SACN Early Life Nutrition Report.
SACN: reports and positions statements, Public Health England.
Scientific Committee on Food (2003). Report of the Scientific Committee on Food on the
Revision of Essential Requirements of Infant Formulae and Follow-on Formulae.
SCF/CS/NUT/IF/65. European Commission.

6
World Health Organisation (2004). Food and Health in Europe: a new basis for action.
European Series 96. WHO regional publications.
7
Chapter 2
Introduction
2.1 Infant Feeding
Early life nutrition can influence long term health and play a role in the development of
chronic disease in later life. The European Food Safety Authority (EFSA) has highlighted
that nutrient intake data after 6 months of age is currently insufficient and inadequate in
European countries (EFSA, 2009). Observational studies have identified a cause for concern
over later health consequences resulting from deficient or excessive nutrient intake during
infancy (Caroli, et al., 2012). A major health challenge in developed countries, such as
Europe and the United States is the rising prevalence of diet related diseases including
obesity, type 2 diabetes, cardiovascular disease and cancer, which emphasises the need to
assess the effects of specific nutrients in early life and their contribution to chronic diseases
in later life (Friedl, et al., 2014; Schwartz, et al., 2011).
Foetal life and childhood are periods of rapid growth and development and an imbalanced
nutrient supply at this age may alter body structure and function in a way that increases the
risk of chronic disease (Scientific Advisory Committee on Nutrition, 2011). The weight of an
infant doubles in the first 4-5 months, which results in a relatively high requirement of energy
and nutrients/kg of body weight; which are proportionally higher than at any other time
during life (Scientific Committee on Food, 2003). Experimental studies in animals have
identified critical periods in early development when an alteration in the nutrient supply may
alter structure and function irreversibly, which is known as nutritional programming. Early
nutrient supply also influences both the composition and distribution of tissues deposited
during growth and the achievement of optimal functional and metabolic capacity of the whole
body at a cellular level. Growth and development is absolutely dependent on an adequate
supply of energy and nutrients which are sufficient to match the variable needs of an infant as
growth progresses, with any limitation in nutrient supply likely to constrain the pace and
pattern of development (Scientific Advisory Committee on Nutrition, 2011). The metabolic
requirements of an infant are counterintuitive with their limited capacity to compensate for
unbalanced nutrient supplies due to infant’s having small body stores of nutrients and
immature homeostatic mechanisms (Scientific Committee on Food, 2003). Furthermore,
infants may not be able to synthesise enough of certain nutrients due to insufficient amount of
8
certain substrates related to the limited capacity of certain metabolic synthesis pathways;
therefore, they are required from the diet (Thompkinson & Kharb, 2007).
After birth infants receive either breast milk or infant formula meaning that their nutritional
intake is solely dependent on the nutritional composition of these milks which should provide
the infant with sufficient macro and micro nutrients (Schwartz, et al., 2011). Breastfeeding
has been associated with numerous health benefits for both the infant and mother; for the
infant a reduction in lower respiratory and gastrointestinal infections and otitis media
occurrence, cognitive and behavioural advantages and obesity reduction; and for the mother
lower incidence of certain cancers have been observed (McAndrew, et al., 2012). Breast milk
is a biological fluid and the best form of nutrition for infants, as it provides all the nutrients in
a form that is easily absorbed that an infant requires for healthy growth and development
during the first 6 months of life. Breast milk contains proteins such as lactoferrin, which
binds to iron to prevent bacteria utilising it, immunoglobulins and macrophages to protect the
infant against infection, fatty acids, growth factors, anti-viral factors, anti-bacterial substances
and living white blood cells (Crawley & Westland, 2014). Based on extensive scientific
evidence the World Health Organisation (WHO) recommends exclusive breastfeeding for the
first 6 months of life, with infant formula being the only alternative to breast milk suitable for
infants during the first year of life (Food Standards Agency, 2008). Around 6 months infants
require more iron, energy and other nutrients which breast milk can no longer supply
independently. Therefore the Department of Health (DOH) recommends that solid foods or
complementary foods are introduced at 6 months of age; along with the continuation of
breastfeeding or the use of an appropriate breast milk substitute. The introduction of solid
foods before 6 months when the neuromuscular co-ordination and gut and kidney maturation
are insufficient is thought to increase the risk of infection and allergy development (Caroli, et
al., 2012).
Numerous risk factors have also been associated with early introduction of complementary
feeding (<6 months), which include mothers that smoke, mothers who have not breastfed,
infants who have been introduced to formula milk early in life, rapid weight gain in the first 6
weeks, low socioeconomic status and parents perception that the infant is hungry. Although
recommendations focus on the age of introduction to solid foods; information regarding the
quality and amount of solid foods is limited (Caroli, et al., 2012).
9
During the first year of life many physiological changes occur that allow the infant to
consume foods of varying composition and texture. As the infant’s mouth, tongue and
digestive tract mature the infant shifts from being able to suckle, swallow and take in liquid
foods to being able to chew and consume a variety of different solid complementary foods
(US Department of Agriculture, 2009). Complementary or weaning foods are semi-solid or
solid foods used to transition an infant from the sole source of breast milk or infant formula
to an adult diet (Bond, et al., 2005). Weaning is the gradual introduction of beverages and
foods other than breast milk or infant formula, which should result in the consumption of
foods that are nutritionally balanced and supply the essential micro and macro nutrients
required for optimal growth and development of an infant. Different countries have different
weaning practices, for instance many European authorities have agreed that complementary
feeding between 4 – 6 months is safe (Schwartz, et al., 2011). Furthermore complementary
foods in the UK are labelled from 4 months, which produces confusion for parents (The
Association of UK Dietetics, 2013). Food preferences in early life have been tracked into
adulthood, which can impact on the development of eating habits for both long and short term
(Schwartz, et al., 2011).
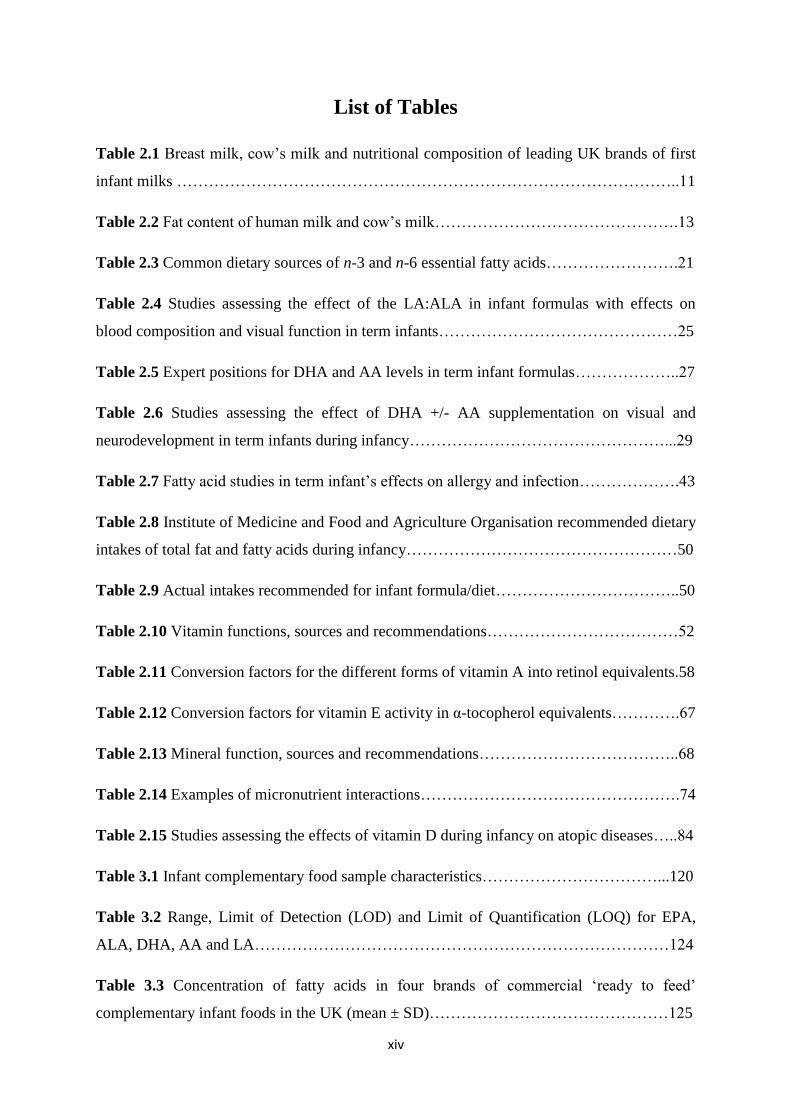
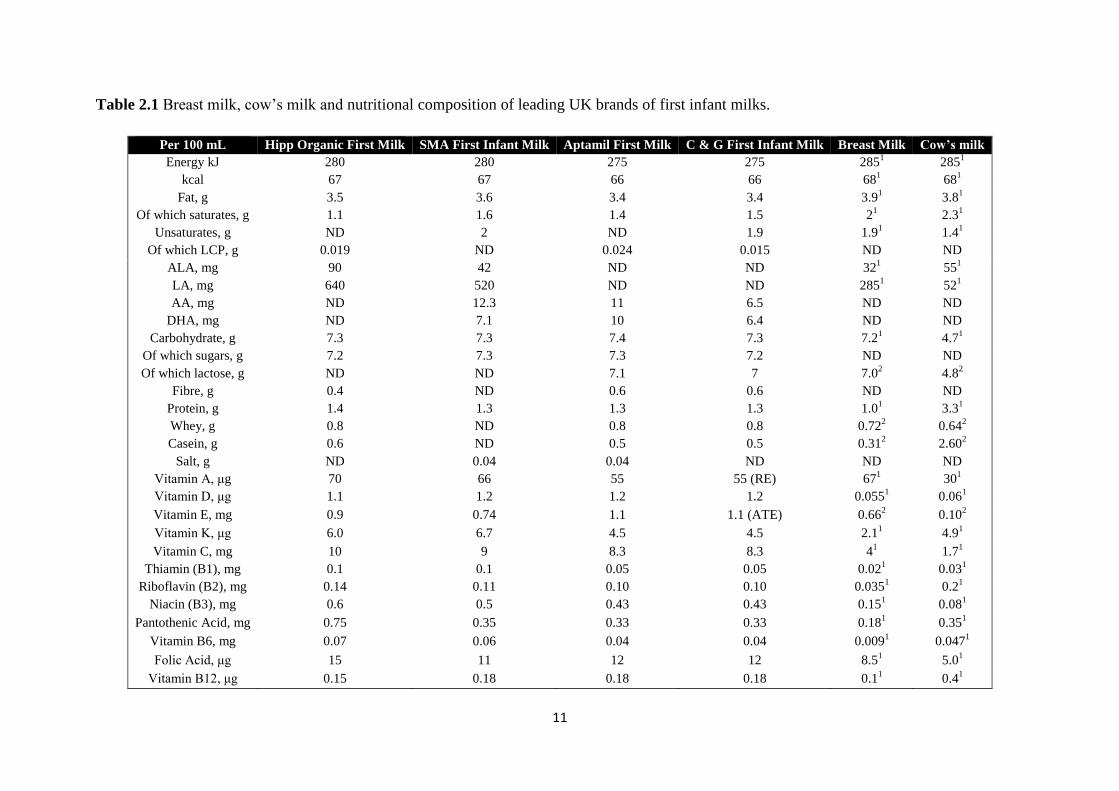
Infant formula aims to provide formulations which have the compositional and biochemical
characteristics similar to breast milk; the data in Table 2.1 shows the composition of breast
milk, cow’s milk and ready to feed first infant milks available in the UK and the data in
Table 2.2 compares the fat content of breast milk and cow’s milk (Thompkinson & Kharb,
2007). Major differences remain between breast milk and infant formula due to the fact that
the exact chemical properties of breast milk are still unknown and therefore cannot be
reproduced; breast milk contains over 300 components whereas infant formula only contains
about 75. In addition breast milk composition changes over time and in response to the
mothers feeding habits, therefore the mother’s diet is also important to consider. Furthermore
breast milk contains the mother’s antibodies and other defensive factors which cannot be
added to manufacture infant formula. Issues also arise due to the manufacturing of infant
formula; such as storage, delivery and quality control problems. Infant formula composition
must comply with the infant formula and follow on formula regulations 2007 (Department of
Health, 2013). As some vitamins and minerals are more easily absorbed from breast milk
(such as calcium and zinc) they will or can be added in higher concentrations to infant
formula to compensate for this. Also certain vitamins are known to deteriorate during storage,
so may also be added in higher concentrations. The Royal College of Nursing recommends
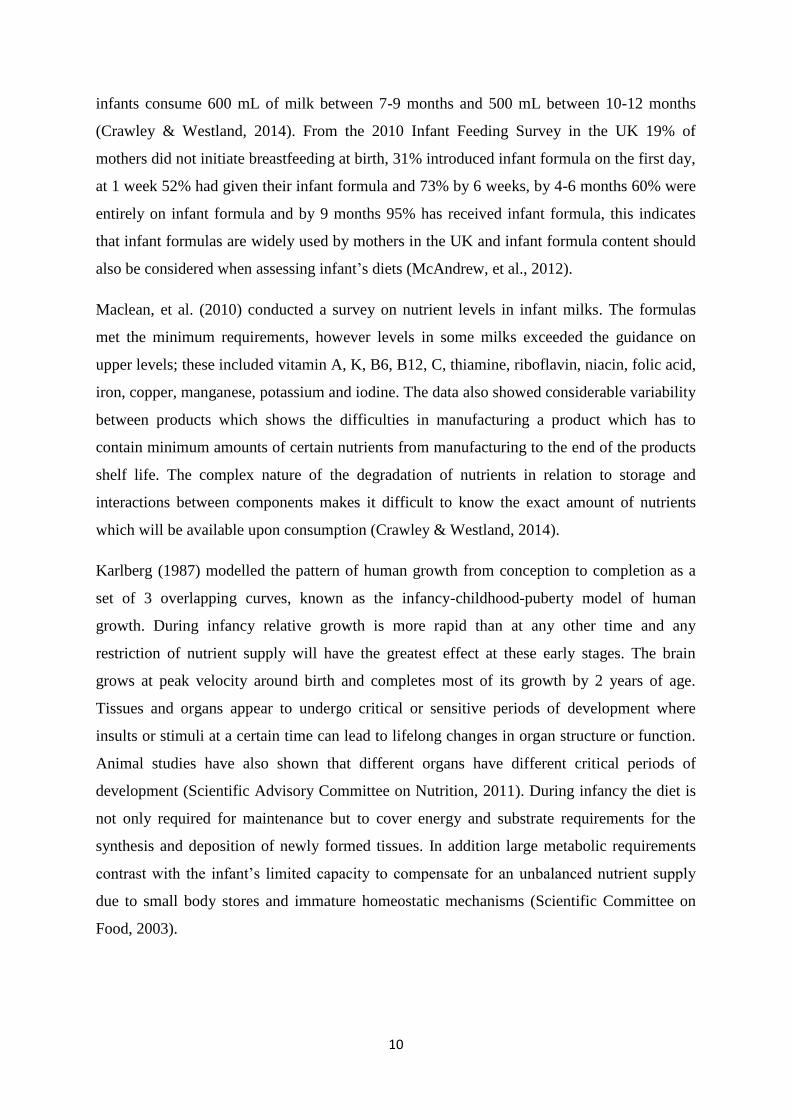
10
infants consume 600 mL of milk between 7-9 months and 500 mL between 10-12 months
(Crawley & Westland, 2014). From the 2010 Infant Feeding Survey in the UK 19% of
mothers did not initiate breastfeeding at birth, 31% introduced infant formula on the first day,
at 1 week 52% had given their infant formula and 73% by 6 weeks, by 4-6 months 60% were
entirely on infant formula and by 9 months 95% has received infant formula, this indicates
that infant formulas are widely used by mothers in the UK and infant formula content should
also be considered when assessing infant’s diets (McAndrew, et al., 2012).
Maclean, et al. (2010) conducted a survey on nutrient levels in infant milks. The formulas
met the minimum requirements, however levels in some milks exceeded the guidance on
upper levels; these included vitamin A, K, B6, B12, C, thiamine, riboflavin, niacin, folic acid,
iron, copper, manganese, potassium and iodine. The data also showed considerable variability
between products which shows the difficulties in manufacturing a product which has to
contain minimum amounts of certain nutrients from manufacturing to the end of the products
shelf life. The complex nature of the degradation of nutrients in relation to storage and
interactions between components makes it difficult to know the exact amount of nutrients
which will be available upon consumption (Crawley & Westland, 2014).
Karlberg (1987) modelled the pattern of human growth from conception to completion as a
set of 3 overlapping curves, known as the infancy-childhood-puberty model of human
growth. During infancy relative growth is more rapid than at any other time and any
restriction of nutrient supply will have the greatest effect at these early stages. The brain
grows at peak velocity around birth and completes most of its growth by 2 years of age.
Tissues and organs appear to undergo critical or sensitive periods of development where
insults or stimuli at a certain time can lead to lifelong changes in organ structure or function.
Animal studies have also shown that different organs have different critical periods of
development (Scientific Advisory Committee on Nutrition, 2011). During infancy the diet is
not only required for maintenance but to cover energy and substrate requirements for the
synthesis and deposition of newly formed tissues. In addition large metabolic requirements
contrast with the infant’s limited capacity to compensate for an unbalanced nutrient supply
due to small body stores and immature homeostatic mechanisms (Scientific Committee on
Food, 2003).
11
Table 2.1 Breast milk, cow’s milk and nutritional composition of leading UK brands of first infant milks.
Per 100 mL Hipp Organic First Milk SMA First Infant Milk Aptamil First Milk C & G First Infant Milk Breast Milk Cow’s milk
Energy kJ 280 280 275 275 2851 285
1
kcal 67 67 66 66 681 68
1
Fat, g 3.5 3.6 3.4 3.4 3.91 3.8
1
Of which saturates, g 1.1 1.6 1.4 1.5 21 2.3
1
Unsaturates, g ND 2 ND 1.9 1.91 1.4
1
Of which LCP, g 0.019 ND 0.024 0.015 ND ND
ALA, mg 90 42 ND ND 321 55
1
LA, mg 640 520 ND ND 2851 52
1
AA, mg ND 12.3 11 6.5 ND ND
DHA, mg ND 7.1 10 6.4 ND ND
Carbohydrate, g 7.3 7.3 7.4 7.3 7.21 4.7
1
Of which sugars, g 7.2 7.3 7.3 7.2 ND ND
Of which lactose, g ND ND 7.1 7 7.02 4.8
2
Fibre, g 0.4 ND 0.6 0.6 ND ND
Protein, g 1.4 1.3 1.3 1.3 1.01 3.3
1
Whey, g 0.8 ND 0.8 0.8 0.722 0.64
2
Casein, g 0.6 ND 0.5 0.5 0.312 2.60
2
Salt, g ND 0.04 0.04 ND ND ND
Vitamin A, μg 70 66 55 55 (RE) 671 30
1
Vitamin D, μg 1.1 1.2 1.2 1.2 0.0551 0.06
1
Vitamin E, mg 0.9 0.74 1.1 1.1 (ATE) 0.662 0.10
2
Vitamin K, μg 6.0 6.7 4.5 4.5 2.11 4.9
1
Vitamin C, mg 10 9 8.3 8.3 41 1.7
1
Thiamin (B1), mg 0.1 0.1 0.05 0.05 0.021 0.03
1
Riboflavin (B2), mg 0.14 0.11 0.10 0.10 0.0351 0.2
1
Niacin (B3), mg 0.6 0.5 0.43 0.43 0.151 0.08
1
Pantothenic Acid, mg 0.75 0.35 0.33 0.33 0.181 0.35
1
Vitamin B6, mg 0.07 0.06 0.04 0.04 0.0091 0.047
1
Folic Acid, μg 15 11 12 12 8.51 5.0
1
Vitamin B12, μg 0.15 0.18 0.18 0.18 0.11 0.4
1
12
Per 100 mL Hipp Organic First Milk SMA First Infant Milk Aptamil First Milk C & G First Infant Milk Breast Milk Cow’s milk
Biotin, μg 2.5 2 1.5 1.5 0.41 3.5
1
Sodium, mg 30 16 17 18 181 48
1
Potassium, mg 62 65 66 68 52.51 157
1
Chloride, mg 44 43 41 41 421 102
1
Calcium, mg 52 42 49 50 281 120
1
Phosphorus, mg 31 24 27 28 141 92
1
Magnesium, mg 5 4.5 5 5 3.51 12
1
Iron, mg 0.5 0.64 0.5 0.55 0.031 0.046
1
Zinc, mg 0.7 0.6 0.5 0.5 0.121 0.35
1
Copper, mg 0.04 0.03 0.04 0.04 0.0251 0.01
1
Manganese, μg 10 10 6 7.5 ND ND
Fluoride, mg 0.01 <0.005 <0.003 <0.003 ND ND
Selenium, μg 1.4 1.4 1.2 1.5 ND ND
Iodine, μg 13 10 13 12 72 ND
L-carnitine, mg ND 1 1.1 0.9 ND ND
Choline, mg 10 10 11.1 10 9.02 13.0
2
Inositol, mg 5 4.5 3.5 3.3 392 13
2
Taurine, mg ND 4.7 5.9 5.3 ND ND
Nucleotides, mg ND 2.6 3.2 3.2 ND ND
IgA, mg 0 0 0 0 1481 ND
IgM, mg 0 0 0 0 11 ND
IgG, mg 0 0 0 0 11 ND
Lactoferrin, mg 0 0 0 0 1502 Trace
2
Alpha lactalbumin, g 0 0 0 0 0.152 0.12
2
Beta lactoglobulin, g 0 0 0 0 ND 0.32
Lysozyme, g 0 0 0 0 0.052 Trace
2
Serum albumin, g 0 0 0 0 0.052 0.03
2
1. International Union of Food Science and Technology, 2000-2010, 2. Thompkinson & Kharb, 2007, AA - arachidonic acid, ALA - α-linolenic acid, ATE - α-tocopherol equivalents, , DHA -
docosahexaenoic acid, , LA - linoleic acid, LCP - long chain polyunsaturated fatty acids, ND – no data, RE - retinol equivalents
13
Table 2.2 Fat content of human milk and cow’s milk (Journal of Tropical Paediatrics, 2014).
Per 100 mL of milk Human Milk Cow’s milk
Fat, g 4.2 3.9
Cholesterol, mg 16 14
Total saturated fatty acids, mg 2001 2330
Butyric 4:0, mg 0 118
Caporic 6:0, mg 0 74
Caprylic 8:0, mg Trace 44
Capric 10:0, mg 54 103
Lauric 12:0, mg 213 129
Myristic 14:0, mg 290 413
Palmitic 16:0, mg 1051 959
Stearic 18:0, mg 393 413
Total monounsaturated fatty acids, mg 1612 1244
Myristoleic 14:1, mg Trace 52
Palmitoleic 16:1, mg 160 100
Oleic 18:1, mg 1408 1026
Total polyunsaturated fatty acids, mg 317 107
Linoleic acid 18:2, mg 285 52
α-Linolenic acid 18:3, mg 32 55
The National Diet and Nutrition Survey (NDNS) evaluates the diet, nutrient intake and
nutrient status of the population over 18 months in the UK (Public Health England, 2014).
However there is a lack of national data on dietary intake and nutritional status of infants
younger than 18 months from this survey (Scientific Advisory Committee on Nutrition,
2011). The Infant Feeding Survey has been carried out every 5 years since 1975 to assess the
incidence, prevalence and duration of breast feeding and other feeding practices used by
mothers in the UK on infants aged between 4-10 weeks up to 10 months (McAndrew, et al.,
2012). Establishing current intake of nutrients in infancy is a priority step to issuing dietary
guidelines. There is however debate over which method is best to collect data related to
nutrient intake in the paediatric population; food frequency questionnaires and weighted food
records are commonly used (Nissensohn, et al., 2011). Over the last 50 years breast feeding
rates in the UK have been amongst the lowest in the world. The results from the latest Infant
Feeding Survey 2010 indicates that mothers in the UK are breastfeeding their babies for
longer; with ⅓ of mothers breastfeeding at 6 months in 2010 compared to only ¼ in 2005.
However only 1/100 breastfed exclusively for 6 months, which is the current
recommendation set by the DOH. Initial breast feeding has also increased; 62% in 1990, 76%
in 2005 and 81% 2010. A higher incidence of breastfeeding was found to be associated with
older mothers (>30 years), ethnic minority groups, higher education (left >18 years of age),
14
managerial or professional occupation and living in the least deprived areas (McAndrew, et
al., 2012).
In addition the Infant Feeding Survey showed that 51% of infants were introduced to solid
foods by 4 months in 2005; however, in 2010 this reduced to 30% which indicated that more
mothers were following recommendations. However by 5 months 75% of mothers had
introduced solid foods and by 6 months 94% had been introduced; which indicates that only
6% are following the DOH recommendation to introduce solids at 6 months. The diet and
nutrition survey of infants and young children (DNSIYC) 2011 has identified that 58% of
children who are fed foods other than milk have eaten a commercial baby or toddler meal
(Lennox et al., 2013), indicating that ready-made baby meals are important contributors to an
an infant’s nutrient supply. The use of ready-made baby foods is most common between 5-10
months. Most frequent foods that are first introduced are fruit and cereals. In England baby
rice is the commonest first food (74%) (McAndrew, et al., 2012). However local food
traditions will also influence solid food consumption (Caroli, et al., 2012).
After 6 months vitamin drops are recommended for breastfeeding infants or infants receiving
less than 500 mL of infant formula per day containing vitamin A, C and D (Food Standards
Agency, 2008). Data from the infant feeding survey indicates that a small percentage (<15%)
are actually receiving these supplements which may suggest that many infants may be
receiving insufficient intakes of these particular vitamins (McAndrew, et al., 2012).
Pregnancy, lactation and infancy are specific times in life when essential nutrients are
indispensable and where most requirements are different to any other life stages to support
the rapid growth and development (Bryhn, 2006). Most infant nutrient intake
recommendations are based on the nutrient composition of breast milk of healthy well-
nourished mothers (Hoffman, et al., 2009). This may be inadequate due to differing
bioavailability’s of nutrients between those present in breast milk and infant formula, as well
as breast milk composition varying across the course of lactation, the composition varying
between each individual and the variability in the volume of milk (Powers, 1997).
Establishing precise daily requirements of nutrients is difficult as there is considerable
individual variation. Adult recommendations are based on observational intakes in healthy
populations, nutrient balance studies and laboratory blood and tissue status associated with a
particular level of intake, activity of an enzyme or functional marker of adequacy (Shergill-
Bonner, 2013). There is a need to develop biological, physiological and clinical markers of a
15
defined specific function. This requires a better understanding of the absorption and
metabolism of nutrients specific to the infant population (Powers, 1997). Furthermore many
European countries have established their own dietary recommendations, which on the
macronutrient level are comparable, however, with regards to the micronutrient level large
differences exist and alignment is necessary. Most of the current guidelines on
complementary feeding are not evidence based; further research is required to clarify the
effects of specific foods or nutrients on growth, development and metabolic status
(Nissensohn, et al., 2011).
The total amount of nutrients in a food does not reflect the amount that is available for the
body to utilise (Watzke, 1998). Bioavailability is the proportion of a nutrient that can be
utilised for normal bodily functions; both physiological and dietary factors influence nutrient
bioavailability (Food Standards Agency, 2002). Bioavailability can be divided into 3 phases;
phase 1 availability for absorption, phase 2 and 3 retention in the body and utilization in the
body dependent on homeostatic control and physiological needs of the individual. Dietary
factors include the physical form of the nutrient within the food structure, ease with which the
nutrient can be released from the food structure, chemical form of the nutrient, solubility in
the lumen and the presence of enhancers and inhibitors of absorption, presence of competitive
inhibitors for transport binding proteins or absorption sites and competitive interactions
between nutrients. Physiological factors include gastric acidity, luminal redox state, intestinal
secretions, the individual’s nutrient status, anabolic demands, endocrine effects, genetics, gut
micro flora and disease state. Nutritional bioavailability cannot be evaluated in isolation, but
must take into account the overall composition of the diet (Watzke, 1998).
Over the past 10,000 years major changes have occurred in our diet, however, our genes have
not changed. Nutrition is classed as an environmental factor. The interaction of genetics and
environment, nature and nurture is the foundation for health and disease. For instance genes
affect nutrient absorption, metabolism and excretion; and also nutrients can affect the
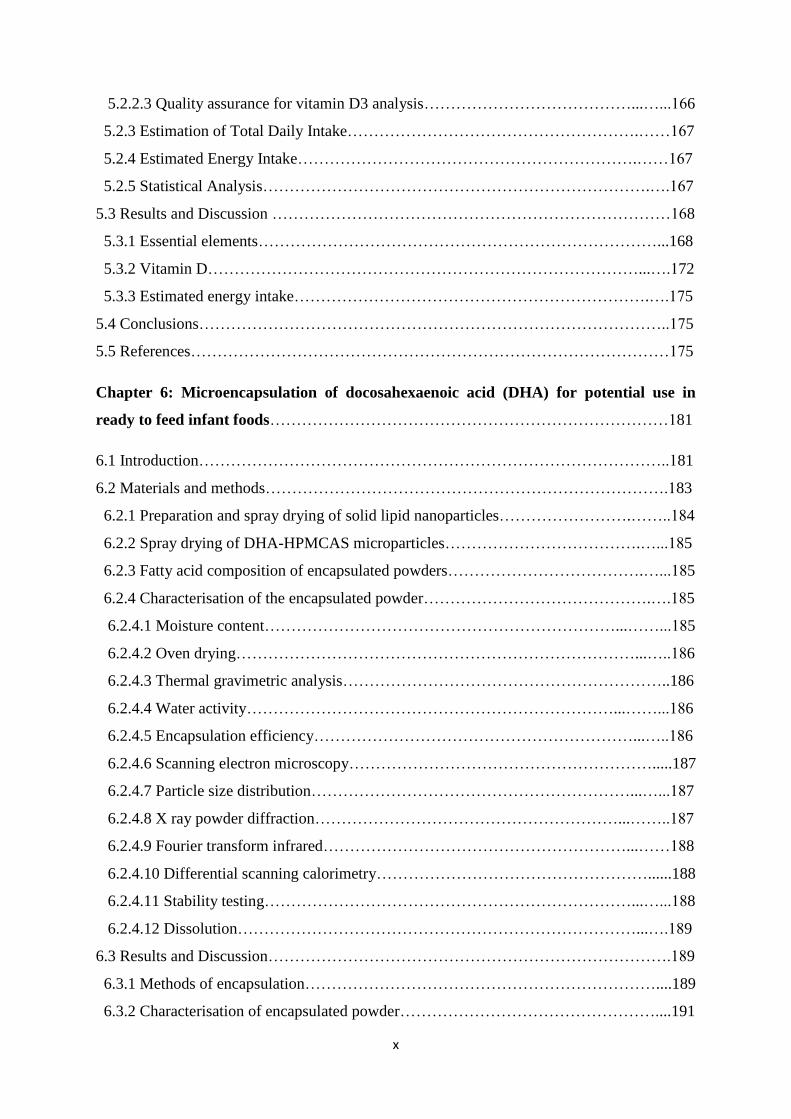
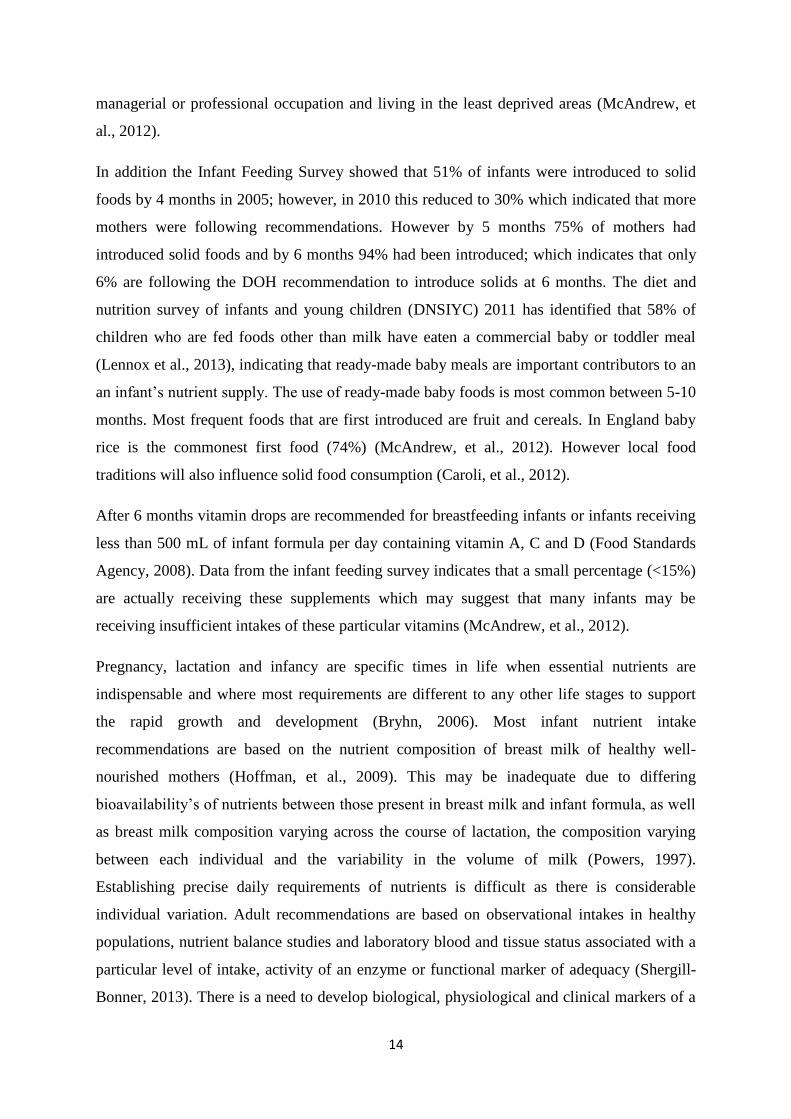
expression of genes (Simopoulos, 2002). The data in Fig. 2.1 illustrates some of the changes
that have occurred in our diets.
16
Figure 2.1 Hypothetical scheme of fat, fatty acid (ω6, ω3, trans and total) (as percentage of
calories from fat), vitamins E and C (mg/d) dietary intake changes (Simopoulos, 2002).
The composition of commercial infant foods can be very different to the diet of the general
population and therefore information is required to establish the levels of nutrients present in
these food groups. Furthermore the range of commercial infant foods is constantly growing
and changing (Committee on Toxicity, 2003). An increasing number of mothers feed their
infants with industrially processed infant foods and in recent years the baby food market and
the range of products has grown significantly. The first year of an infant’s life is a sensitive
period for the development of the nervous, reproductive, digestive, respiratory and immune
systems. Therefore the composition of nutrient intake of an infant is critical (Pandelova, et
al., 2012).
There is currently no clear and complete analytical nutritional data available for ‘ready-to-
feed’ complementary infant foods in the UK. The nutritional database in the UK, McCance
and Widdowson contains limited data on the composition of complementary infant foods, in
addition the analytical techniques and nutrient data contained may now be outdated. It is
essential that food composition tables are regularly updated with the current foods available
on the market, especially with the regular introduction of new foods to the market (Food
Standards Agency, 2002).
17
There are many sources of information for mothers regarding infant feeding; such as baby
food company websites, blogs, e-forums and books written by mothers; these sources of
information often provide recommendations and recipes which are often nutritionally
inadequate for the infant’s needs (Caroli, et al., 2012).
In summary with numerous diseases being diet related and evidence to associate early infant
feeding with long term health outcomes the nutrient intake of an infant’s diet is of paramount
significance. In addition the lack of data concerning infant’s nutrient intake means that it
urgently needs to be evaluated. Furthermore as commercial weaning foods are increasingly
being incorporated into the infant’s diet and nutritional databases lack nutrient content for
these particular products, their nutritional adequacy for the rapidly developing infant needs to
be assessed.
2.2 Essential Fatty Acids
Over the past two decades there has been a drastic change in the fatty acid composition of the
diets in industrialised countries with increased intakes in the n-6 fatty acid linoleic acid (LA);
this is mainly due to the replacement of saturated fats (from butter and lard) with plant based
polyunsaturated fatty acids (PUFA) (from vegetable oils) in an attempt to lower plasma
cholesterol (Gibson, et al., 2011). However, at the time the implications this would have on n-
3 fatty acid metabolism were not considered (Innis, 2008). These changes in diet have been
paralleled to the increased rates of numerous diseases that involve inflammatory responses
such as cardiovascular disease, obesity, inflammatory diseases and certain psychiatric
disorders (Wall, et al., 2010).
Dietary fat is the predominant source of fuel energy for infants, supplying 40-60% of the
energy for the first 6 months of life which is gradually reduced to 30-35% by 3 years (Uauy
& Dangour, 2009). Both breast milk and the majority of infant formulas provide around 50%
of energy as fat. Dietary lipids provide essential fatty acids that are necessary for the
absorption of fat soluble vitamins and cholesterol and are also carriers of flavours and
contribute to the satiety value (Thompkinson & Kharb, 2007). Traditionally the main focus of
research has been upon the total amount of fat in the diet; however it has now been
recognised that the quality of dietary lipids in early life can impact on infant growth and
development and contribute to long term health consequences (Uauy & Dangour, 2009).
Hansen, et al. (1963) firmly established the essentiality of LA in normal infant nutrition, with
essential fatty acid deficiency causing dryness and thickening of the skin and growth
18
faltering. The roles of other essential fatty acids are still being established however their
presence in breast milk indicates essential roles for infant development (Uauy & Dangour,
2006).
PUFA are important structural components of all cell membranes and organelles, they can
influence membrane fluidity and the behaviour of membrane bound enzymes and receptors.
They are also important for a wide variety of other functions including blood pressure, blood
clotting, development and function of brain and nervous systems and regulating inflammatory
responses (Wall, et al., 2010). Long chain polyunsaturated fatty acids (LCPUFA) are
precursors for eicosanoid and docosanoid production for the formation of prostaglandins
(PG), prostacyclins, thromboxanes (TX), leukotrienes (LT), resolvins and neuropectins (Uauy
& Dangour, 2009). The types of fat in the diet will influence the body composition and
ultimately its function and health (Morse, 2012).
2.2.1 Metabolism of Essential Fatty Acids
PUFA contain at least 2 double bonds, they are classified as n-3 or n-6 depending on the
location of the last double bond relative to the terminal end of the molecule (Wall, et al.,
2010). Humans must obtain the essential fatty acids α-linolenic acid (ALA) 18:3 (n-3) and
LA 18:2 (n-6) from dietary sources as they lack Δ-15 and Δ-12 desaturase enzymes to
produce them. ALA is then metabolised by Δ-6 desaturation, elongation and Δ-5 desaturation
to form eicosapentaenoic acid (EPA) 20:5 (n-3) in the endoplasmic reticulum; LA is also
metabolised by the same enzymes to form arachidonic acid (AA) 20:4 (n-6) (Innis, 2008);
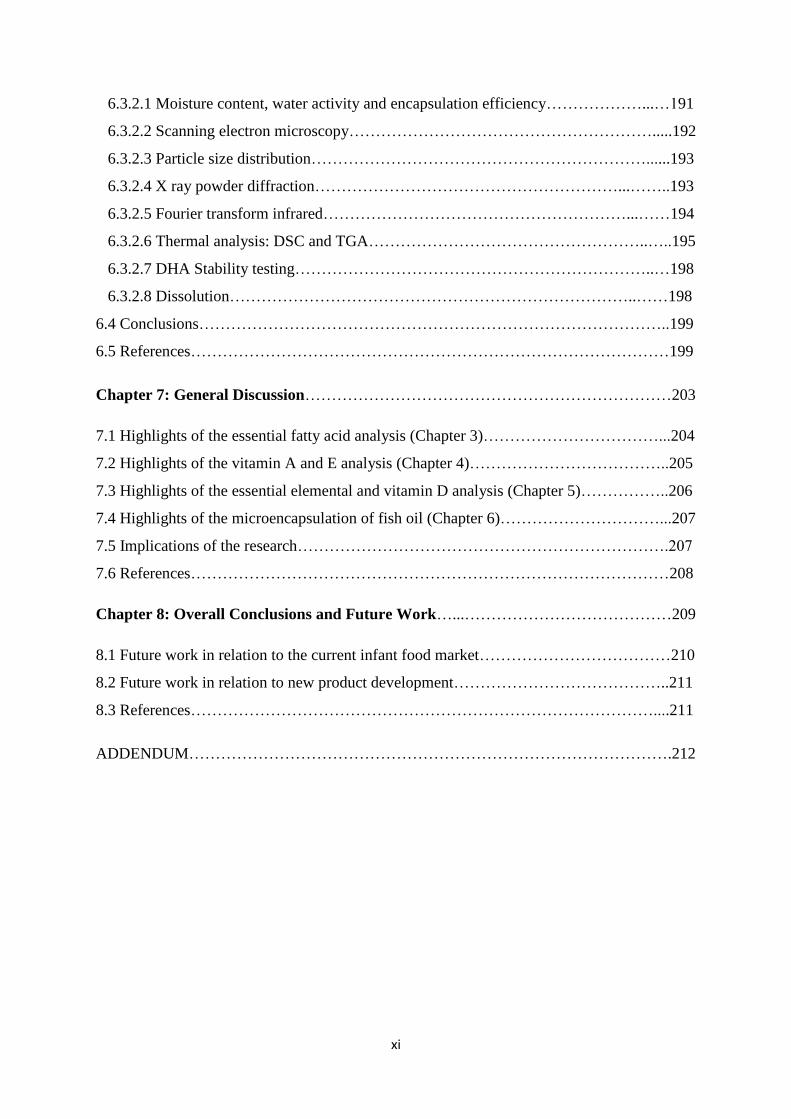
Fig. 2.2 illustrates essential fatty acid metabolism. The synthesis of docosahexaenoic acid
(DHA) 22:6 (n-3) requires a second Δ-6 desaturase step and β oxidation in the peroxisomes.
The Δ-5 and Δ-6 desaturases and elongases exhibit higher affinity to metabolize the n-3 fatty
acids (Wall, et al., 2010). Fatty acid desaturase (FADS1 and FADS2) enzymes are
responsible for the expression of the Δ-5 and Δ-6 desaturase enzymes and polymorphisms of
these enzymes may alter the conversion capability of an individual (Janssen & Kiliaan,
2014). The majority of PUFA conversion takes place in the liver (Guesnet & Alessandri,
2011). In addition micronutrients such as iron, zinc, vitamin B6 and vitamin E are required
for the conversion (Shek, et al., 2012).
19
Figure 2.2 Synthesis pathways of n-6 and n-3 long chain polyunsaturated fatty acids (Minich,
1999). AA – arachidonic acid, ADA – adrenic acid, ALA – -linolenic acid, DGLA –
dihomo-gamma-linolenic acid, DHA – docosahexaenoic acid, DPA – docosapentaenoic acid,
EPA – eicosapentaenoic acid, GLA – -linolenic acid, LA – linoleic acid.
Endogenous synthesis of LCPUFA from essential fatty acid precursors is inefficient and can
vary widely among individuals, approaching zero for certain LCPUFA in some infants.
Stable isotope tracer studies have indicated 0.2-8% for EPA and <0.05 – 4% for DHA from
ALA; <0.1% for AA from LA (Heaton, et al., 2013). This suggests that LCPUFA may need
to be supplied in their pre-formed source in the infant’s diet as conversion from their fatty
acid precursors is potentially insufficient. There are various areas of evidence that support
inefficiency of conversion in infants. For instance, β oxidation of ALA is used for energy
rather than conversion to DHA (Innis, 2008) and ALA has a higher affinity for the Δ-6
desaturase enzyme compared to tetracosapentaenoic acid during the conversion to DHA
(Gibson, et al., 2011). High levels of LA in the diet generally result in low n-3 LCPUFA
status, due to simple competitive inhibition. The synthesis of AA is not subject to the same
regulatory steps as the synthesis of DHA which requires a second Δ-6 desaturase step and
β-oxidation, meaning that synthesis of DHA will be more affected by the inefficient
conversion pathway (Makrides, et al., 2000). The fatty acid desaturation pathways are
20
saturated when the concentration of LA exceeds 3% of total energy; and infant formulas will
typically provide more than 3% LA (Innis, 2008). Synthesis of LCPUFA may also be
influenced by genetic polymorphisms; therefore a direct dietary supply may be required,
which has already been shown to be successful in infants (Agostoni, et al., 2009); for
example numerous studies have indicated that DHA status in the blood is responsive to the
content of DHA within the diet regardless of the precursor ALA content of the diet (Hoffman,
et al., 2009). Conversion depends on the intake of other fatty acids along with the LA:ALA
ratio of the diet (Heaton, et al., 2013).
ALA is found mainly in plant oils, including canola, soybean and from walnuts, green leafy
vegetables and flaxseed (Heaton, et al., 2013). Whereas LA is widely distributed in the
Western diet and found in plant oils such as sunflower, safflower and corn oils along with
cereals, animal fat and wholegrain bread, Table 2.3 shows food sources of essential fatty
acids (Wall, et al., 2010). The low dietary intakes of n-3 LCPUFA, EPA and DHA, in
Western nations are a concern due to their limited availability in the diet. In particular there
are few plant sources of DHA and EPA, which may in particular affect vegetarian
populations. The synthesis of DHA occurs in phytoplankton and animals but not in plants,
therefore DHA is absent in foods of plant origin (Innis, 2008). Infants mainly obtain them
from oily fish, fish oil supplements, breast milk and fortified infant formulas (Heaton, et al.,
2013). Essential fatty acids are present in all natural lipid structures but are relatively more
common in the storage lipids of plants and of marine animals rather than land animals
(Department of Health, 1991). The fatty acid content of meat is dependent on the breed,
feeding regime, age of slaughter and weight of the animal (Nudda, et al., 2011). Animal feed
grains are often high in LA which produces animals high in LA available for meat
consumption (Simopoulos, 2002). From an analysis of Italian baby foods, DHA and AA were
not detected in beef, veal, chicken or turkey products (Nudda, et al., 2011). Therefore
assessment of commercial ‘ready-to-feed’ infant foods in the UK is required.
Most if not all fish contain at least trace amounts of methyl mercury, which is a neurotoxin
that can harm the nervous system; a developing infant’s nervous system can be particularly
sensitive to it. Substantial evidence over the last decade has shown that fish consumption
during pregnancy can benefit the development of the nervous system; whether this is due to
the n-3 content or other nutrients remains unclear (Food and Drug Administration, 2014).
Fish and eggs are natural sources of DHA however due to allergy issues tend to be introduced
later into the infant’s diet (Agostoni, et al., 2009). Furthermore many women in Western
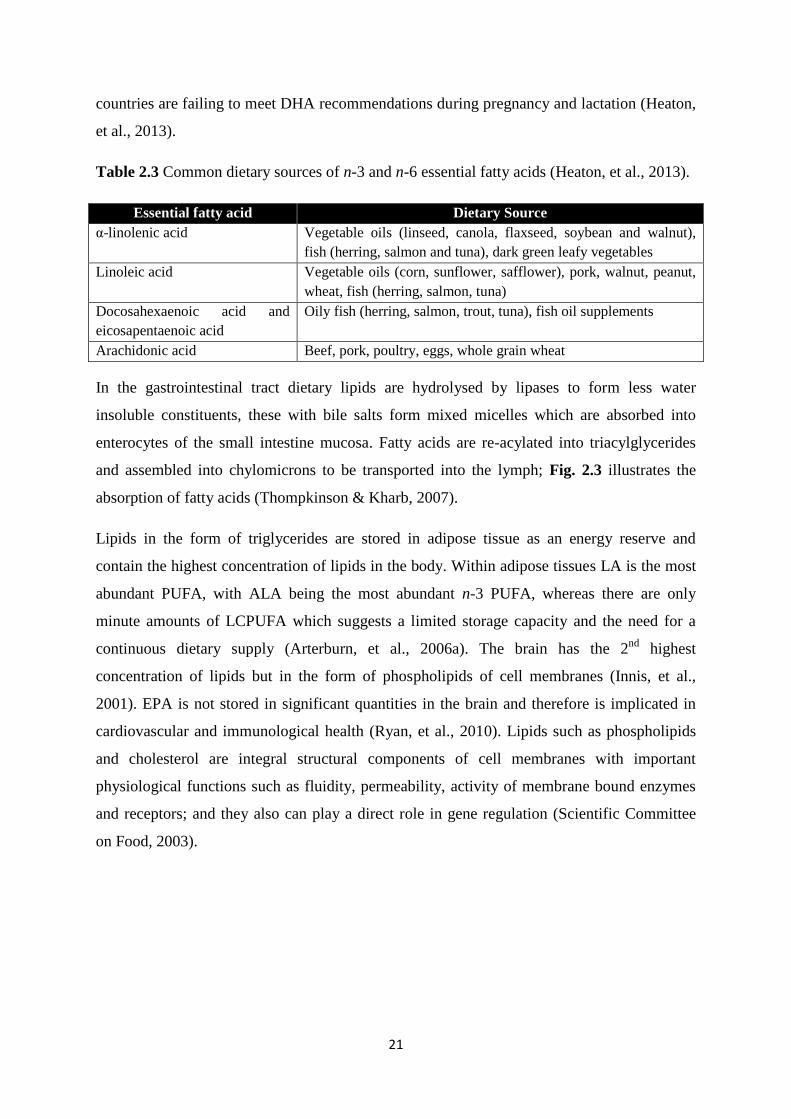
21
countries are failing to meet DHA recommendations during pregnancy and lactation (Heaton,
et al., 2013).
Table 2.3 Common dietary sources of n-3 and n-6 essential fatty acids (Heaton, et al., 2013).
Essential fatty acid Dietary Source
α-linolenic acid Vegetable oils (linseed, canola, flaxseed, soybean and walnut),
fish (herring, salmon and tuna), dark green leafy vegetables
Linoleic acid Vegetable oils (corn, sunflower, safflower), pork, walnut, peanut,
wheat, fish (herring, salmon, tuna)
Docosahexaenoic acid and
eicosapentaenoic acid
Oily fish (herring, salmon, trout, tuna), fish oil supplements
Arachidonic acid Beef, pork, poultry, eggs, whole grain wheat
In the gastrointestinal tract dietary lipids are hydrolysed by lipases to form less water
insoluble constituents, these with bile salts form mixed micelles which are absorbed into
enterocytes of the small intestine mucosa. Fatty acids are re-acylated into triacylglycerides
and assembled into chylomicrons to be transported into the lymph; Fig. 2.3 illustrates the
absorption of fatty acids (Thompkinson & Kharb, 2007).
Lipids in the form of triglycerides are stored in adipose tissue as an energy reserve and
contain the highest concentration of lipids in the body. Within adipose tissues LA is the most
abundant PUFA, with ALA being the most abundant n-3 PUFA, whereas there are only
minute amounts of LCPUFA which suggests a limited storage capacity and the need for a
continuous dietary supply (Arterburn, et al., 2006a). The brain has the 2nd
highest
concentration of lipids but in the form of phospholipids of cell membranes (Innis, et al.,
2001). EPA is not stored in significant quantities in the brain and therefore is implicated in
cardiovascular and immunological health (Ryan, et al., 2010). Lipids such as phospholipids
and cholesterol are integral structural components of cell membranes with important
physiological functions such as fluidity, permeability, activity of membrane bound enzymes
and receptors; and they also can play a direct role in gene regulation (Scientific Committee
on Food, 2003).
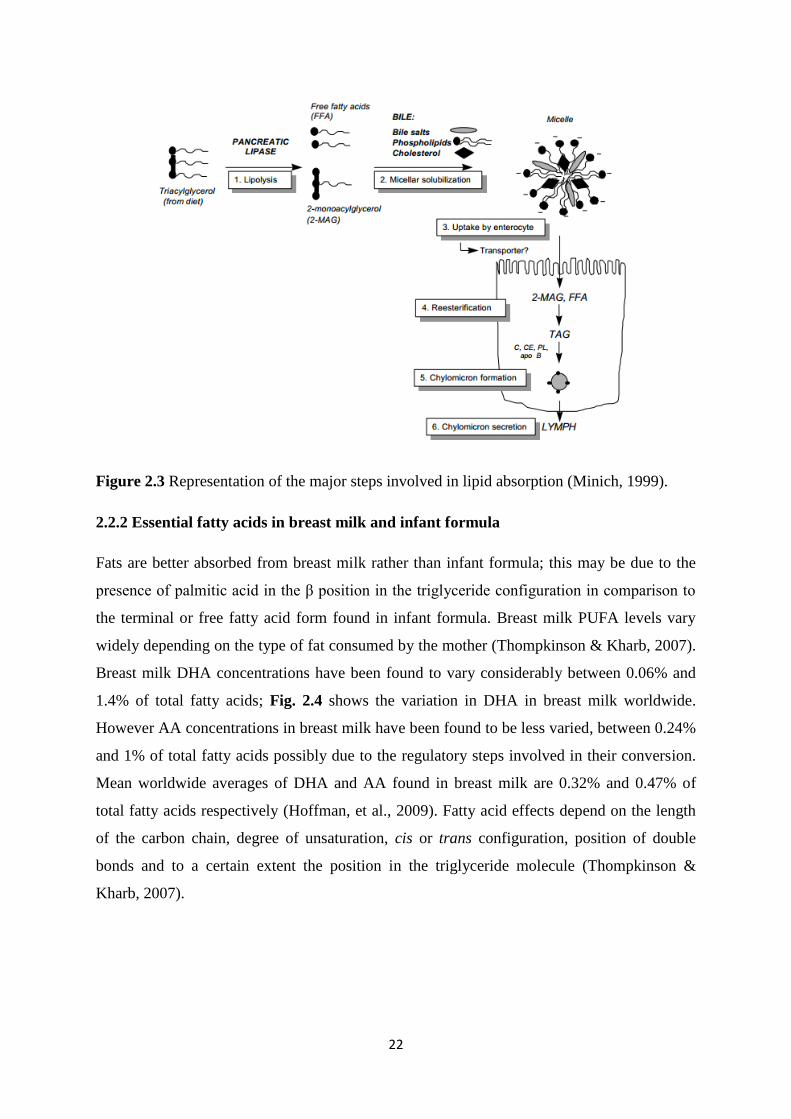
22
Figure 2.3 Representation of the major steps involved in lipid absorption (Minich, 1999).
2.2.2 Essential fatty acids in breast milk and infant formula
Fats are better absorbed from breast milk rather than infant formula; this may be due to the
presence of palmitic acid in the β position in the triglyceride configuration in comparison to
the terminal or free fatty acid form found in infant formula. Breast milk PUFA levels vary
widely depending on the type of fat consumed by the mother (Thompkinson & Kharb, 2007).
Breast milk DHA concentrations have been found to vary considerably between 0.06% and
1.4% of total fatty acids; Fig. 2.4 shows the variation in DHA in breast milk worldwide.
However AA concentrations in breast milk have been found to be less varied, between 0.24%
and 1% of total fatty acids possibly due to the regulatory steps involved in their conversion.
Mean worldwide averages of DHA and AA found in breast milk are 0.32% and 0.47% of
total fatty acids respectively (Hoffman, et al., 2009). Fatty acid effects depend on the length
of the carbon chain, degree of unsaturation, cis or trans configuration, position of double
bonds and to a certain extent the position in the triglyceride molecule (Thompkinson &
Kharb, 2007).
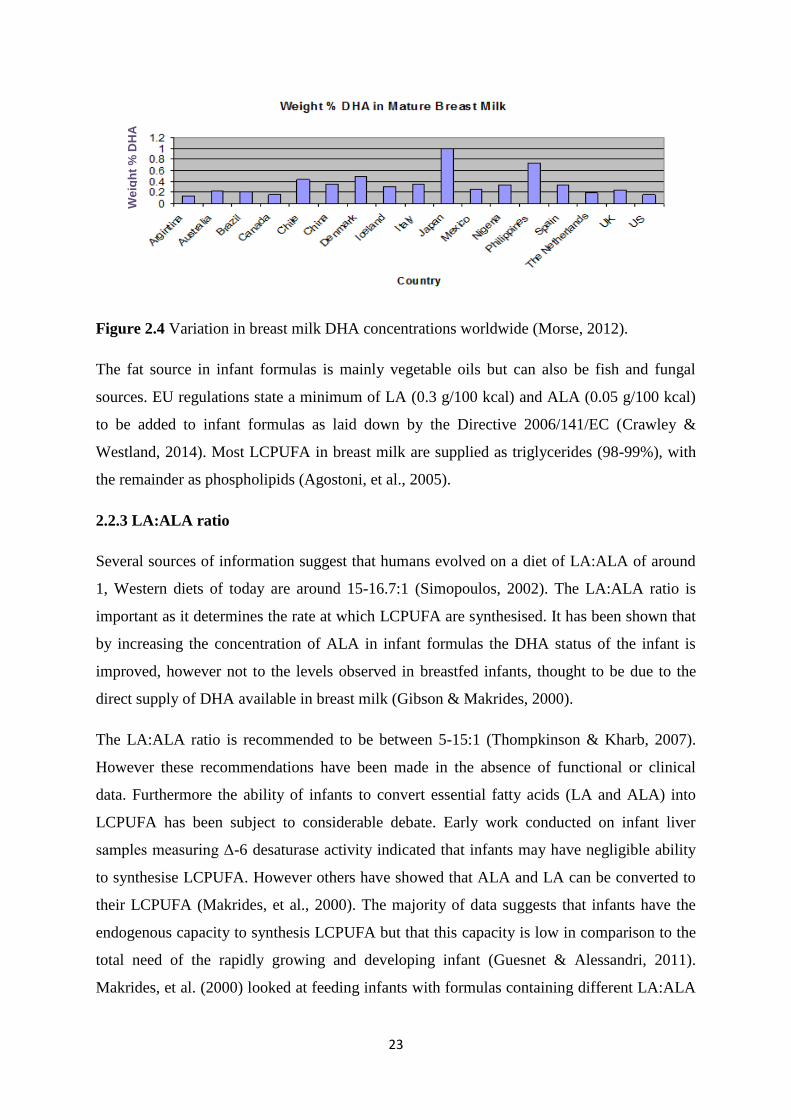
23
Figure 2.4 Variation in breast milk DHA concentrations worldwide (Morse, 2012).
The fat source in infant formulas is mainly vegetable oils but can also be fish and fungal
sources. EU regulations state a minimum of LA (0.3 g/100 kcal) and ALA (0.05 g/100 kcal)
to be added to infant formulas as laid down by the Directive 2006/141/EC (Crawley &
Westland, 2014). Most LCPUFA in breast milk are supplied as triglycerides (98-99%), with
the remainder as phospholipids (Agostoni, et al., 2005).
2.2.3 LA:ALA ratio
Several sources of information suggest that humans evolved on a diet of LA:ALA of around
1, Western diets of today are around 15-16.7:1 (Simopoulos, 2002). The LA:ALA ratio is
important as it determines the rate at which LCPUFA are synthesised. It has been shown that
by increasing the concentration of ALA in infant formulas the DHA status of the infant is
improved, however not to the levels observed in breastfed infants, thought to be due to the
direct supply of DHA available in breast milk (Gibson & Makrides, 2000).
The LA:ALA ratio is recommended to be between 5-15:1 (Thompkinson & Kharb, 2007).
However these recommendations have been made in the absence of functional or clinical
data. Furthermore the ability of infants to convert essential fatty acids (LA and ALA) into
LCPUFA has been subject to considerable debate. Early work conducted on infant liver
samples measuring Δ-6 desaturase activity indicated that infants may have negligible ability
to synthesise LCPUFA. However others have showed that ALA and LA can be converted to
their LCPUFA (Makrides, et al., 2000). The majority of data suggests that infants have the
endogenous capacity to synthesis LCPUFA but that this capacity is low in comparison to the
total need of the rapidly growing and developing infant (Guesnet & Alessandri, 2011).
Makrides, et al. (2000) looked at feeding infants with formulas containing different LA:ALA
We
igh
t %
DH
A
24
ratios (10:1 and 5:1) along with breastfed infants to assess infant growth, fatty acid status and
visual evoked potential (VEP) acuity. Infants fed the 5:1 formula had higher DHA in plasma
and erythrocyte phospholipids, but this was still observed to be less than breastfed infants.
There was no difference seen with respect to infant growth or VEP acuity at 16 and 34 weeks.
Studies have shown that the LA:ALA ratio needs to be below 6:1 to improve DHA status in
formula fed infants, studies varying the LA:ALA in infant formula are shown in Table 2.4.
Furthermore the feeding of infants after 6 months with adequate ALA but with no DHA does
not sustain the same cerebral accretion of DHA as breastfed infants (Guesnet & Alessandri,
2011). This suggests that the LA:ALA ratio does have an impact on LCPUFA status in
infancy however to reach the same status as breastfed infants a direct dietary supply is
required. In addition even though DHA status was increased this did not have any functional
effects with regards to growth or vision. Increased DHA status needs to be associated with a
functional outcome to have relevance in infant growth and development. Adequate growth is
an important indicator of health in infants, however meta-analysis have shown that LCPUFA
have no effect on weight, length or head circumference (Makrides, et al., 2005). The effect of
LCPUFA, especially DHA and AA, in relation to benefits on infant’s vision and
neurodevelopment have given mixed results and will be discussed in the following chapters.
2.2.4 Essential fatty acids: vision and neurodevelopment
The concentration of DHA has been found to be higher in the plasma, erythrocyte membranes
and brains (from autopsies of infants) of breastfed infants or infants fed with DHA
supplemented infant formula compared to those fed infant formula only containing the
precursors (LA and ALA) (Hoffman, et al., 2009; Thompkinson & Kharb, 2007). This
suggests that infants require DHA to be provided in its pre-formed source. In breastfed
infants a higher mental ability, differences in visual function and neurodevelopment have
been observed in comparison to un-supplemented formula fed infants, this is thought to be
due to the differences in DHA content (Agostoni, et al., 2009). The question over whether a
dietary supply of DHA and/or AA is advantageous for visual or cognitive development have
been debated for numerous years (Hoffman, et al., 2009).
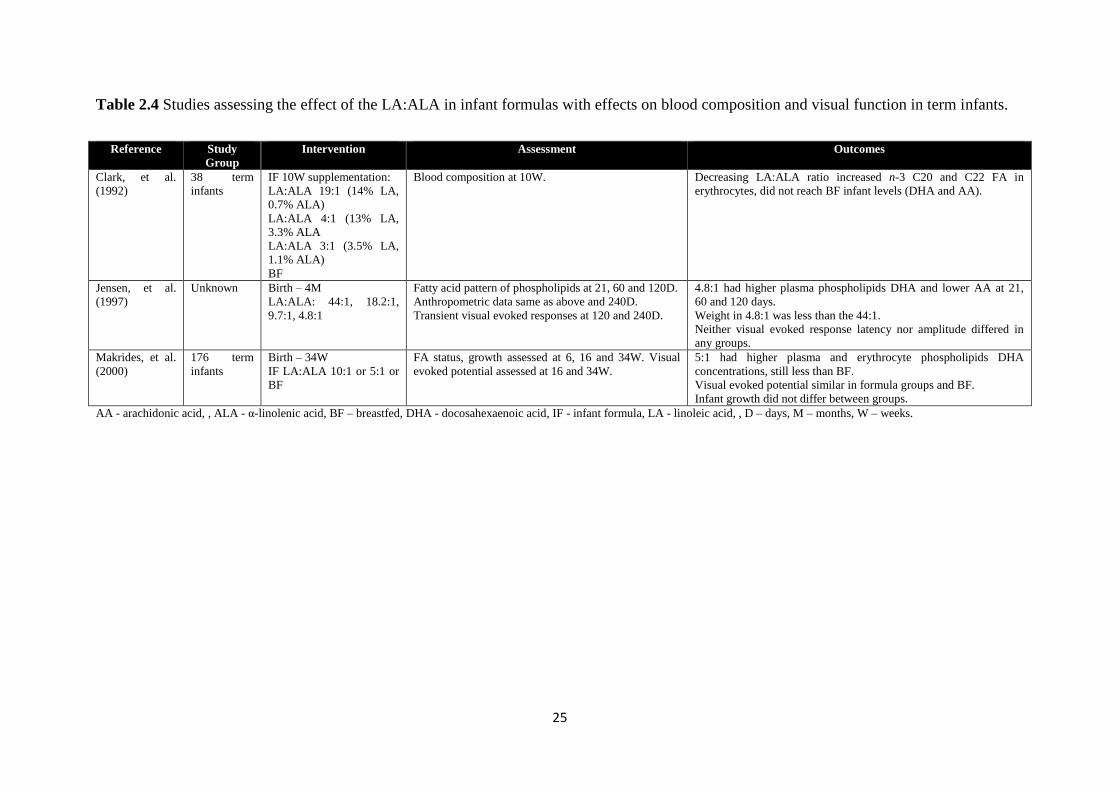
25
Table 2.4 Studies assessing the effect of the LA:ALA in infant formulas with effects on blood composition and visual function in term infants.
Reference Study
Group
Intervention Assessment Outcomes
Clark, et al.
(1992)
38 term
infants
IF 10W supplementation:
LA:ALA 19:1 (14% LA,
0.7% ALA)
LA:ALA 4:1 (13% LA,
3.3% ALA
LA:ALA 3:1 (3.5% LA,
1.1% ALA)
BF
Blood composition at 10W. Decreasing LA:ALA ratio increased n-3 C20 and C22 FA in
erythrocytes, did not reach BF infant levels (DHA and AA).
Jensen, et al.
(1997)
Unknown Birth – 4M
LA:ALA: 44:1, 18.2:1,
9.7:1, 4.8:1
Fatty acid pattern of phospholipids at 21, 60 and 120D.
Anthropometric data same as above and 240D.
Transient visual evoked responses at 120 and 240D.
4.8:1 had higher plasma phospholipids DHA and lower AA at 21,
60 and 120 days.
Weight in 4.8:1 was less than the 44:1.
Neither visual evoked response latency nor amplitude differed in
any groups.
Makrides, et al.
(2000)
176 term
infants
Birth – 34W
IF LA:ALA 10:1 or 5:1 or
BF
FA status, growth assessed at 6, 16 and 34W. Visual
evoked potential assessed at 16 and 34W.
5:1 had higher plasma and erythrocyte phospholipids DHA
concentrations, still less than BF.
Visual evoked potential similar in formula groups and BF.
Infant growth did not differ between groups.
AA - arachidonic acid, , ALA - α-linolenic acid, BF – breastfed, DHA - docosahexaenoic acid, IF - infant formula, LA - linoleic acid, , D – days, M – months, W – weeks.
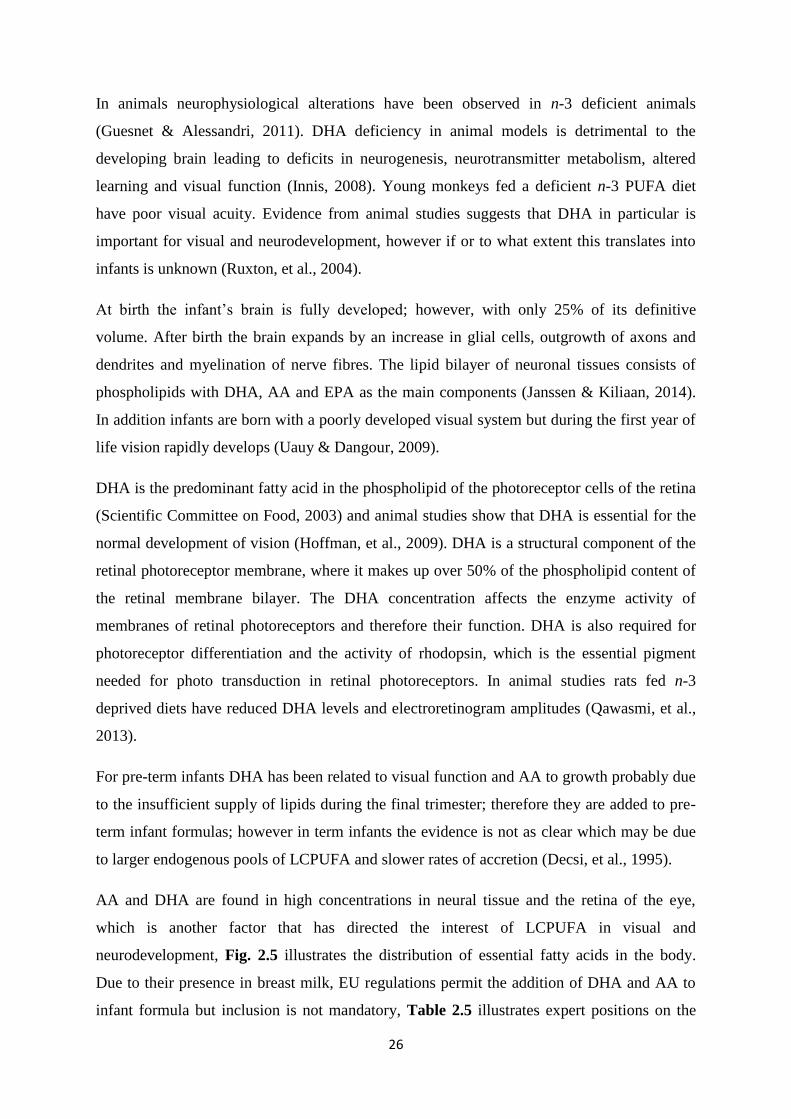
26
In animals neurophysiological alterations have been observed in n-3 deficient animals
(Guesnet & Alessandri, 2011). DHA deficiency in animal models is detrimental to the
developing brain leading to deficits in neurogenesis, neurotransmitter metabolism, altered
learning and visual function (Innis, 2008). Young monkeys fed a deficient n-3 PUFA diet
have poor visual acuity. Evidence from animal studies suggests that DHA in particular is
important for visual and neurodevelopment, however if or to what extent this translates into
infants is unknown (Ruxton, et al., 2004).
At birth the infant’s brain is fully developed; however, with only 25% of its definitive
volume. After birth the brain expands by an increase in glial cells, outgrowth of axons and
dendrites and myelination of nerve fibres. The lipid bilayer of neuronal tissues consists of
phospholipids with DHA, AA and EPA as the main components (Janssen & Kiliaan, 2014).
In addition infants are born with a poorly developed visual system but during the first year of
life vision rapidly develops (Uauy & Dangour, 2009).
DHA is the predominant fatty acid in the phospholipid of the photoreceptor cells of the retina
(Scientific Committee on Food, 2003) and animal studies show that DHA is essential for the
normal development of vision (Hoffman, et al., 2009). DHA is a structural component of the
retinal photoreceptor membrane, where it makes up over 50% of the phospholipid content of
the retinal membrane bilayer. The DHA concentration affects the enzyme activity of
membranes of retinal photoreceptors and therefore their function. DHA is also required for
photoreceptor differentiation and the activity of rhodopsin, which is the essential pigment
needed for photo transduction in retinal photoreceptors. In animal studies rats fed n-3
deprived diets have reduced DHA levels and electroretinogram amplitudes (Qawasmi, et al.,
2013).
For pre-term infants DHA has been related to visual function and AA to growth probably due
to the insufficient supply of lipids during the final trimester; therefore they are added to pre-
term infant formulas; however in term infants the evidence is not as clear which may be due
to larger endogenous pools of LCPUFA and slower rates of accretion (Decsi, et al., 1995).
AA and DHA are found in high concentrations in neural tissue and the retina of the eye,
which is another factor that has directed the interest of LCPUFA in visual and
neurodevelopment, Fig. 2.5 illustrates the distribution of essential fatty acids in the body.
Due to their presence in breast milk, EU regulations permit the addition of DHA and AA to
infant formula but inclusion is not mandatory, Table 2.5 illustrates expert positions on the
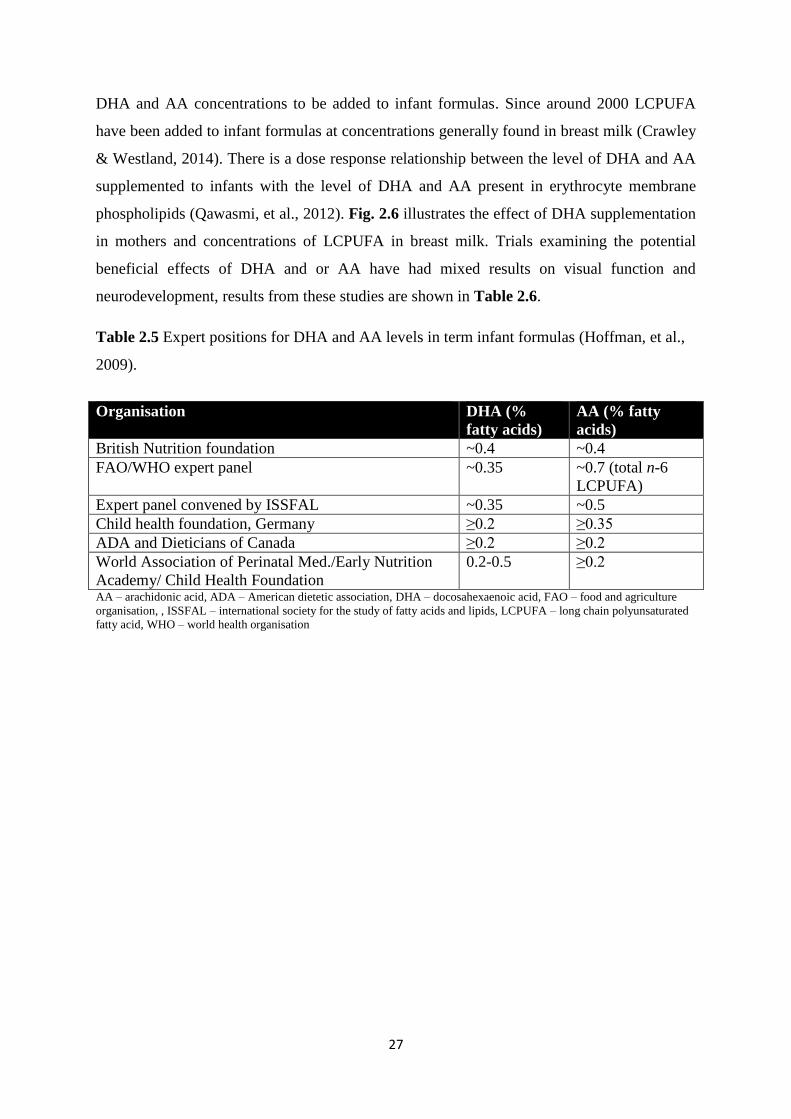
27
DHA and AA concentrations to be added to infant formulas. Since around 2000 LCPUFA
have been added to infant formulas at concentrations generally found in breast milk (Crawley
& Westland, 2014). There is a dose response relationship between the level of DHA and AA
supplemented to infants with the level of DHA and AA present in erythrocyte membrane
phospholipids (Qawasmi, et al., 2012). Fig. 2.6 illustrates the effect of DHA supplementation
in mothers and concentrations of LCPUFA in breast milk. Trials examining the potential
beneficial effects of DHA and or AA have had mixed results on visual function and
neurodevelopment, results from these studies are shown in Table 2.6.
Table 2.5 Expert positions for DHA and AA levels in term infant formulas (Hoffman, et al.,
2009).
Organisation DHA (%
fatty acids)
AA (% fatty
acids)
British Nutrition foundation ~0.4 ~0.4
FAO/WHO expert panel ~0.35 ~0.7 (total n-6
LCPUFA)
Expert panel convened by ISSFAL ~0.35 ~0.5
Child health foundation, Germany ≥0.2 ≥0.35
ADA and Dieticians of Canada ≥0.2 ≥0.2
World Association of Perinatal Med./Early Nutrition
Academy/ Child Health Foundation
0.2-0.5 ≥0.2
AA – arachidonic acid, ADA – American dietetic association, DHA – docosahexaenoic acid, FAO – food and agriculture
organisation, , ISSFAL – international society for the study of fatty acids and lipids, LCPUFA – long chain polyunsaturated
fatty acid, WHO – world health organisation
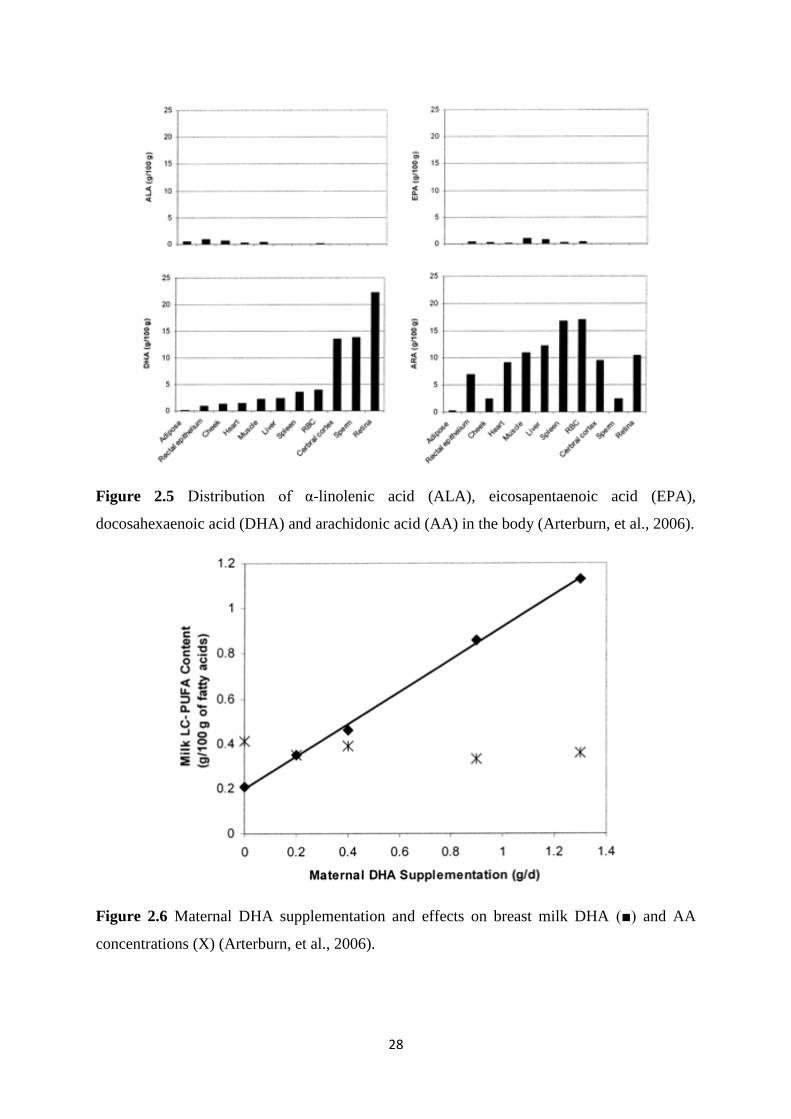
28
Figure 2.5 Distribution of α-linolenic acid (ALA), eicosapentaenoic acid (EPA),
docosahexaenoic acid (DHA) and arachidonic acid (AA) in the body (Arterburn, et al., 2006).
Figure 2.6 Maternal DHA supplementation and effects on breast milk DHA (■) and AA
concentrations (X) (Arterburn, et al., 2006).
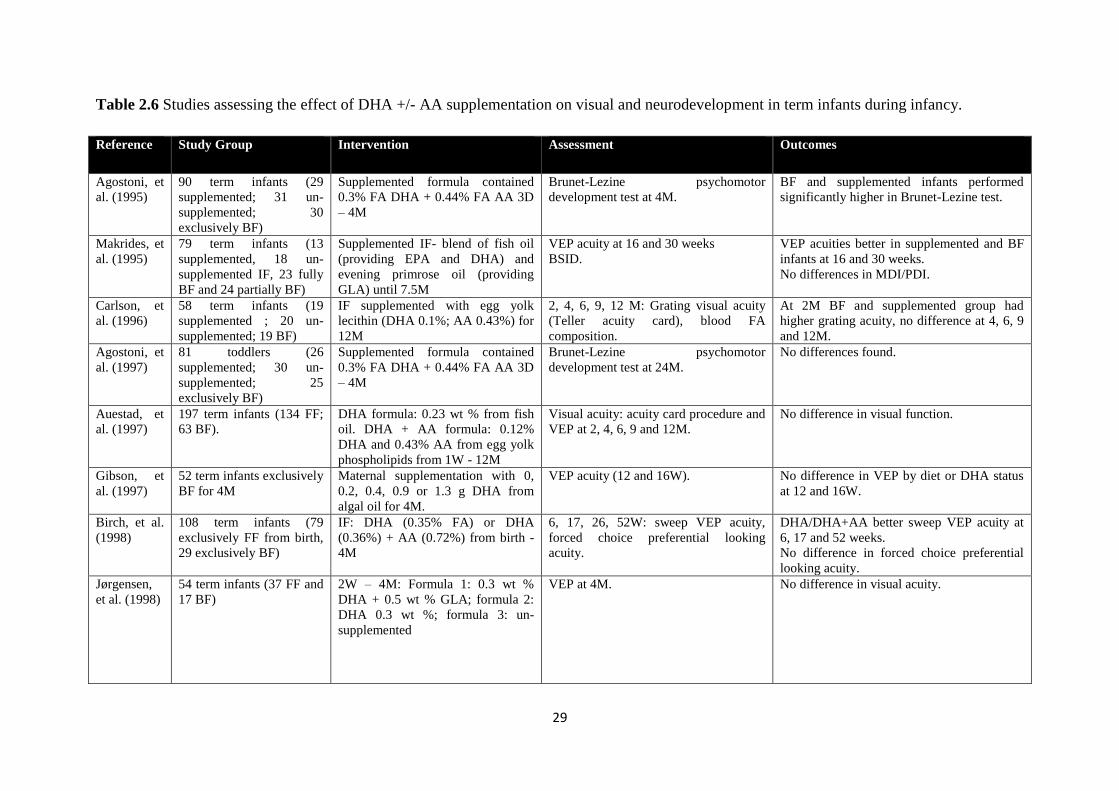
29
Table 2.6 Studies assessing the effect of DHA +/- AA supplementation on visual and neurodevelopment in term infants during infancy.
Reference Study Group Intervention Assessment Outcomes
Agostoni, et
al. (1995)
90 term infants (29
supplemented; 31 un-
supplemented; 30
exclusively BF)
Supplemented formula contained
0.3% FA DHA + 0.44% FA AA 3D
– 4M
Brunet-Lezine psychomotor
development test at 4M.
BF and supplemented infants performed
significantly higher in Brunet-Lezine test.
Makrides, et
al. (1995)
79 term infants (13
supplemented, 18 un-
supplemented IF, 23 fully
BF and 24 partially BF)
Supplemented IF- blend of fish oil
(providing EPA and DHA) and
evening primrose oil (providing
GLA) until 7.5M
VEP acuity at 16 and 30 weeks
BSID.
VEP acuities better in supplemented and BF
infants at 16 and 30 weeks.
No differences in MDI/PDI.
Carlson, et
al. (1996)
58 term infants (19
supplemented ; 20 un-
supplemented; 19 BF)
IF supplemented with egg yolk
lecithin (DHA 0.1%; AA 0.43%) for
12M
2, 4, 6, 9, 12 M: Grating visual acuity
(Teller acuity card), blood FA
composition.
At 2M BF and supplemented group had
higher grating acuity, no difference at 4, 6, 9
and 12M.
Agostoni, et
al. (1997)
81 toddlers (26
supplemented; 30 un-
supplemented; 25
exclusively BF)
Supplemented formula contained
0.3% FA DHA + 0.44% FA AA 3D
– 4M
Brunet-Lezine psychomotor
development test at 24M.
No differences found.
Auestad, et
al. (1997)
197 term infants (134 FF;
63 BF).
DHA formula: 0.23 wt % from fish
oil. DHA + AA formula: 0.12%
DHA and 0.43% AA from egg yolk
phospholipids from 1W - 12M
Visual acuity: acuity card procedure and
VEP at 2, 4, 6, 9 and 12M.
No difference in visual function.
Gibson, et
al. (1997)
52 term infants exclusively
BF for 4M
Maternal supplementation with 0,
0.2, 0.4, 0.9 or 1.3 g DHA from
algal oil for 4M.
VEP acuity (12 and 16W).
No difference in VEP by diet or DHA status
at 12 and 16W.
Birch, et al.
(1998)
108 term infants (79
exclusively FF from birth,
29 exclusively BF)
IF: DHA (0.35% FA) or DHA
(0.36%) + AA (0.72%) from birth -
4M
6, 17, 26, 52W: sweep VEP acuity,
forced choice preferential looking
acuity.
DHA/DHA+AA better sweep VEP acuity at
6, 17 and 52 weeks.
No difference in forced choice preferential
looking acuity.
Jørgensen,
et al. (1998)
54 term infants (37 FF and
17 BF)
2W – 4M: Formula 1: 0.3 wt %
DHA + 0.5 wt % GLA; formula 2:
DHA 0.3 wt %; formula 3: un-
supplemented
VEP at 4M. No difference in visual acuity.
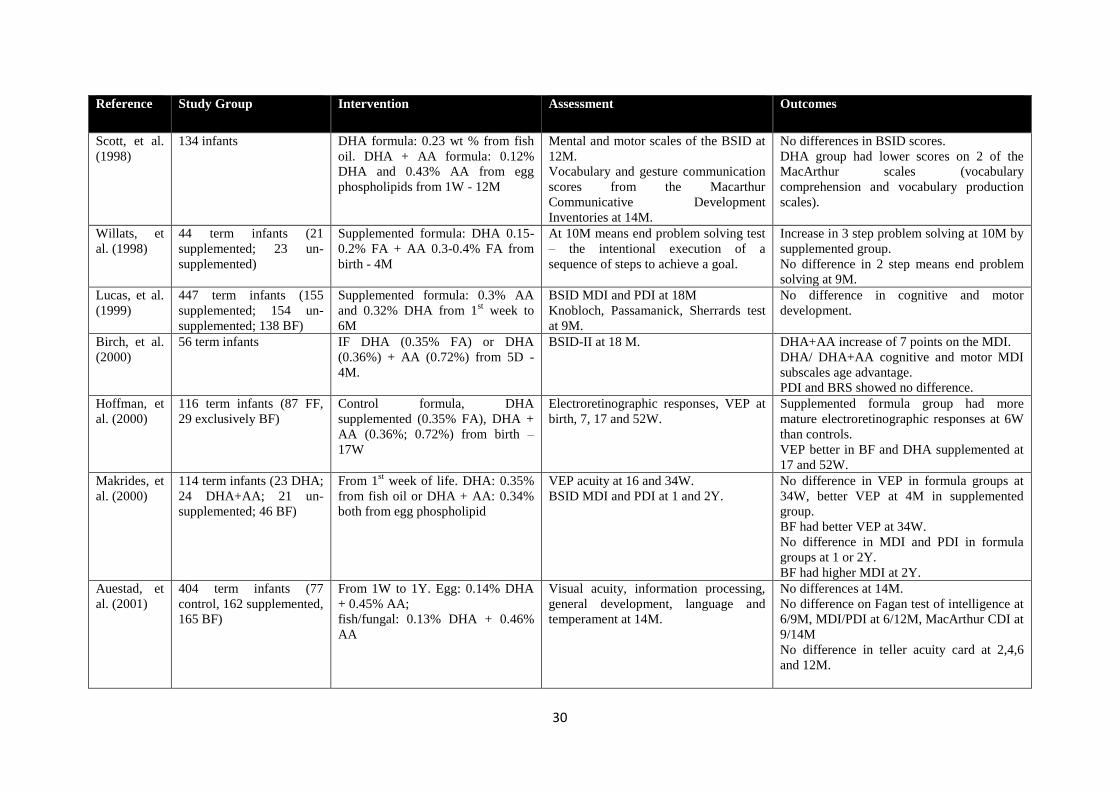
30
Reference Study Group Intervention Assessment Outcomes
Scott, et al.
(1998)
134 infants DHA formula: 0.23 wt % from fish
oil. DHA + AA formula: 0.12%
DHA and 0.43% AA from egg
phospholipids from 1W - 12M
Mental and motor scales of the BSID at
12M.
Vocabulary and gesture communication
scores from the Macarthur
Communicative Development
Inventories at 14M.
No differences in BSID scores.
DHA group had lower scores on 2 of the
MacArthur scales (vocabulary
comprehension and vocabulary production
scales).
Willats, et
al. (1998)
44 term infants (21
supplemented; 23 un-
supplemented)
Supplemented formula: DHA 0.15-
0.2% FA + AA 0.3-0.4% FA from
birth - 4M
At 10M means end problem solving test
– the intentional execution of a
sequence of steps to achieve a goal.
Increase in 3 step problem solving at 10M by
supplemented group.
No difference in 2 step means end problem
solving at 9M.
Lucas, et al.
(1999)
447 term infants (155
supplemented; 154 un-
supplemented; 138 BF)
Supplemented formula: 0.3% AA
and 0.32% DHA from 1st week to
6M
BSID MDI and PDI at 18M
Knobloch, Passamanick, Sherrards test
at 9M.
No difference in cognitive and motor
development.
Birch, et al.
(2000)
56 term infants IF DHA (0.35% FA) or DHA
(0.36%) + AA (0.72%) from 5D -
4M.
BSID-II at 18 M. DHA+AA increase of 7 points on the MDI.
DHA/ DHA+AA cognitive and motor MDI
subscales age advantage.
PDI and BRS showed no difference.
Hoffman, et
al. (2000)
116 term infants (87 FF,
29 exclusively BF)
Control formula, DHA
supplemented (0.35% FA), DHA +
AA (0.36%; 0.72%) from birth –
17W
Electroretinographic responses, VEP at
birth, 7, 17 and 52W.
Supplemented formula group had more
mature electroretinographic responses at 6W
than controls.
VEP better in BF and DHA supplemented at
17 and 52W.
Makrides, et
al. (2000)
114 term infants (23 DHA;
24 DHA+AA; 21 un-
supplemented; 46 BF)
From 1st week of life. DHA: 0.35%
from fish oil or DHA + AA: 0.34%
both from egg phospholipid
VEP acuity at 16 and 34W.
BSID MDI and PDI at 1 and 2Y.
No difference in VEP in formula groups at
34W, better VEP at 4M in supplemented
group.
BF had better VEP at 34W.
No difference in MDI and PDI in formula
groups at 1 or 2Y.
BF had higher MDI at 2Y.
Auestad, et
al. (2001)
404 term infants (77
control, 162 supplemented,
165 BF)
From 1W to 1Y. Egg: 0.14% DHA
+ 0.45% AA;
fish/fungal: 0.13% DHA + 0.46%
AA
Visual acuity, information processing,
general development, language and
temperament at 14M.
No differences at 14M.
No difference on Fagan test of intelligence at
6/9M, MDI/PDI at 6/12M, MacArthur CDI at
9/14M
No difference in teller acuity card at 2,4,6
and 12M.
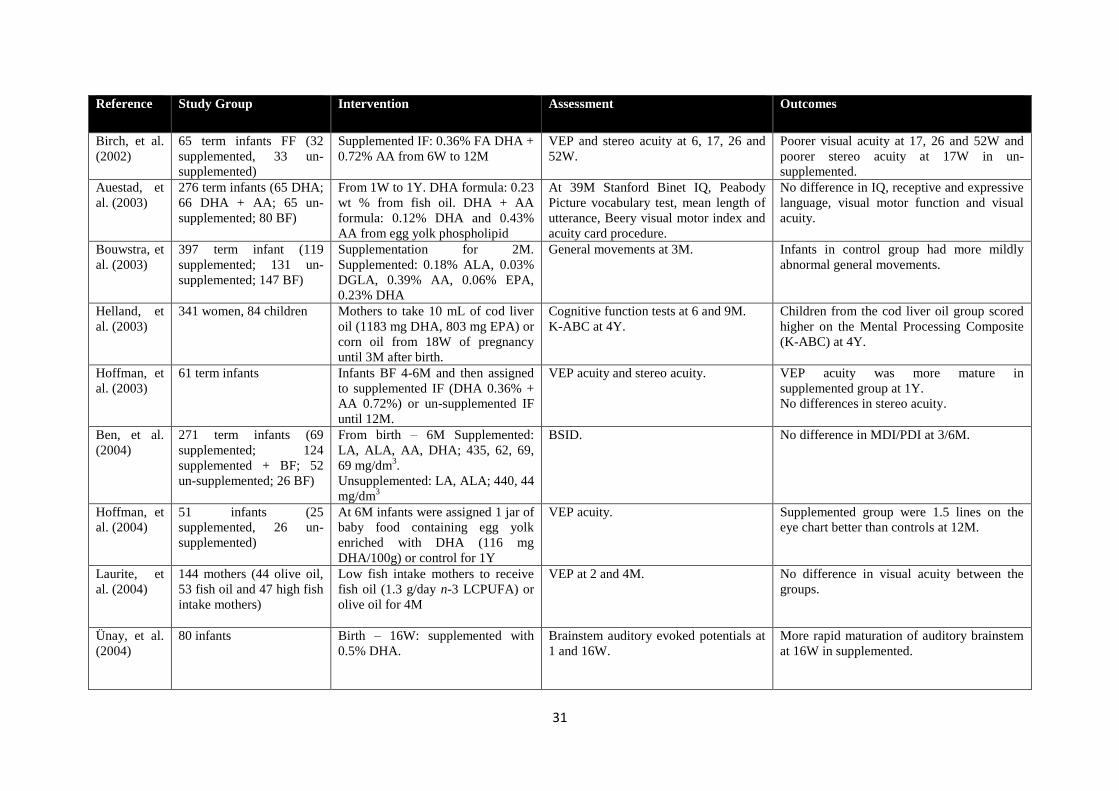
31
Reference Study Group Intervention Assessment Outcomes
Birch, et al.
(2002)
65 term infants FF (32
supplemented, 33 un-
supplemented)
Supplemented IF: 0.36% FA DHA +
0.72% AA from 6W to 12M
VEP and stereo acuity at 6, 17, 26 and
52W.
Poorer visual acuity at 17, 26 and 52W and
poorer stereo acuity at 17W in un-
supplemented.
Auestad, et
al. (2003)
276 term infants (65 DHA;
66 DHA + AA; 65 un-
supplemented; 80 BF)
From 1W to 1Y. DHA formula: 0.23
wt % from fish oil. DHA + AA
formula: 0.12% DHA and 0.43%
AA from egg yolk phospholipid
At 39M Stanford Binet IQ, Peabody
Picture vocabulary test, mean length of
utterance, Beery visual motor index and
acuity card procedure.
No difference in IQ, receptive and expressive
language, visual motor function and visual
acuity.
Bouwstra, et
al. (2003)
397 term infant (119
supplemented; 131 un-
supplemented; 147 BF)
Supplementation for 2M.
Supplemented: 0.18% ALA, 0.03%
DGLA, 0.39% AA, 0.06% EPA,
0.23% DHA
General movements at 3M. Infants in control group had more mildly
abnormal general movements.
Helland, et
al. (2003)
341 women, 84 children Mothers to take 10 mL of cod liver
oil (1183 mg DHA, 803 mg EPA) or
corn oil from 18W of pregnancy
until 3M after birth.
Cognitive function tests at 6 and 9M.
K-ABC at 4Y.
Children from the cod liver oil group scored
higher on the Mental Processing Composite
(K-ABC) at 4Y.
Hoffman, et
al. (2003)
61 term infants Infants BF 4-6M and then assigned
to supplemented IF (DHA 0.36% +
AA 0.72%) or un-supplemented IF
until 12M.
VEP acuity and stereo acuity. VEP acuity was more mature in
supplemented group at 1Y.
No differences in stereo acuity.
Ben, et al.
(2004)
271 term infants (69
supplemented; 124
supplemented + BF; 52
un-supplemented; 26 BF)
From birth – 6M Supplemented:
LA, ALA, AA, DHA; 435, 62, 69,
69 mg/dm3.
Unsupplemented: LA, ALA; 440, 44
mg/dm3
BSID. No difference in MDI/PDI at 3/6M.
Hoffman, et
al. (2004)
51 infants (25
supplemented, 26 un-
supplemented)
At 6M infants were assigned 1 jar of
baby food containing egg yolk
enriched with DHA (116 mg
DHA/100g) or control for 1Y
VEP acuity. Supplemented group were 1.5 lines on the
eye chart better than controls at 12M.
Laurite, et
al. (2004)
144 mothers (44 olive oil,
53 fish oil and 47 high fish
intake mothers)
Low fish intake mothers to receive
fish oil (1.3 g/day n-3 LCPUFA) or
olive oil for 4M
VEP at 2 and 4M. No difference in visual acuity between the
groups.
Ünay, et al.
(2004)
80 infants Birth – 16W: supplemented with
0.5% DHA.
Brainstem auditory evoked potentials at
1 and 16W.
More rapid maturation of auditory brainstem
at 16W in supplemented.
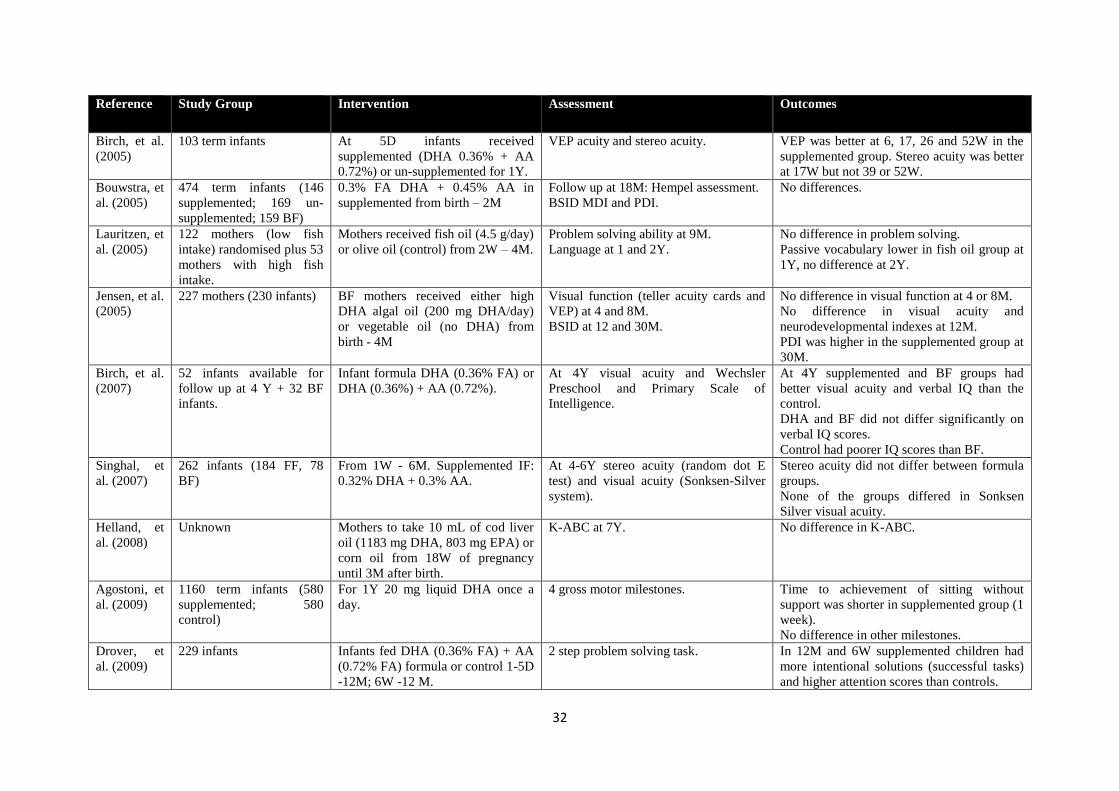
32
Reference Study Group Intervention Assessment Outcomes
Birch, et al.
(2005)
103 term infants At 5D infants received
supplemented (DHA 0.36% + AA
0.72%) or un-supplemented for 1Y.
VEP acuity and stereo acuity. VEP was better at 6, 17, 26 and 52W in the
supplemented group. Stereo acuity was better
at 17W but not 39 or 52W.
Bouwstra, et
al. (2005)
474 term infants (146
supplemented; 169 un-
supplemented; 159 BF)
0.3% FA DHA + 0.45% AA in
supplemented from birth – 2M
Follow up at 18M: Hempel assessment.
BSID MDI and PDI.
No differences.
Lauritzen, et
al. (2005)
122 mothers (low fish
intake) randomised plus 53
mothers with high fish
intake.
Mothers received fish oil (4.5 g/day)
or olive oil (control) from 2W – 4M.
Problem solving ability at 9M.
Language at 1 and 2Y.
No difference in problem solving.
Passive vocabulary lower in fish oil group at
1Y, no difference at 2Y.
Jensen, et al.
(2005)
227 mothers (230 infants)
BF mothers received either high
DHA algal oil (200 mg DHA/day)
or vegetable oil (no DHA) from
birth - 4M
Visual function (teller acuity cards and
VEP) at 4 and 8M.
BSID at 12 and 30M.
No difference in visual function at 4 or 8M.
No difference in visual acuity and
neurodevelopmental indexes at 12M.
PDI was higher in the supplemented group at
30M.
Birch, et al.
(2007)
52 infants available for
follow up at 4 Y + 32 BF
infants.
Infant formula DHA (0.36% FA) or
DHA (0.36%) + AA (0.72%).
At 4Y visual acuity and Wechsler
Preschool and Primary Scale of
Intelligence.
At 4Y supplemented and BF groups had
better visual acuity and verbal IQ than the
control.
DHA and BF did not differ significantly on
verbal IQ scores.
Control had poorer IQ scores than BF.
Singhal, et
al. (2007)
262 infants (184 FF, 78
BF)
From 1W - 6M. Supplemented IF:
0.32% DHA + 0.3% AA.
At 4-6Y stereo acuity (random dot E
test) and visual acuity (Sonksen-Silver
system).
Stereo acuity did not differ between formula
groups.
None of the groups differed in Sonksen
Silver visual acuity.
Helland, et
al. (2008)
Unknown Mothers to take 10 mL of cod liver
oil (1183 mg DHA, 803 mg EPA) or
corn oil from 18W of pregnancy
until 3M after birth.
K-ABC at 7Y. No difference in K-ABC.
Agostoni, et
al. (2009)
1160 term infants (580
supplemented; 580
control)
For 1Y 20 mg liquid DHA once a
day.
4 gross motor milestones. Time to achievement of sitting without
support was shorter in supplemented group (1
week).
No difference in other milestones.
Drover, et
al. (2009)
229 infants Infants fed DHA (0.36% FA) + AA
(0.72% FA) formula or control 1-5D
-12M; 6W -12 M.
2 step problem solving task. In 12M and 6W supplemented children had
more intentional solutions (successful tasks)
and higher attention scores than controls.
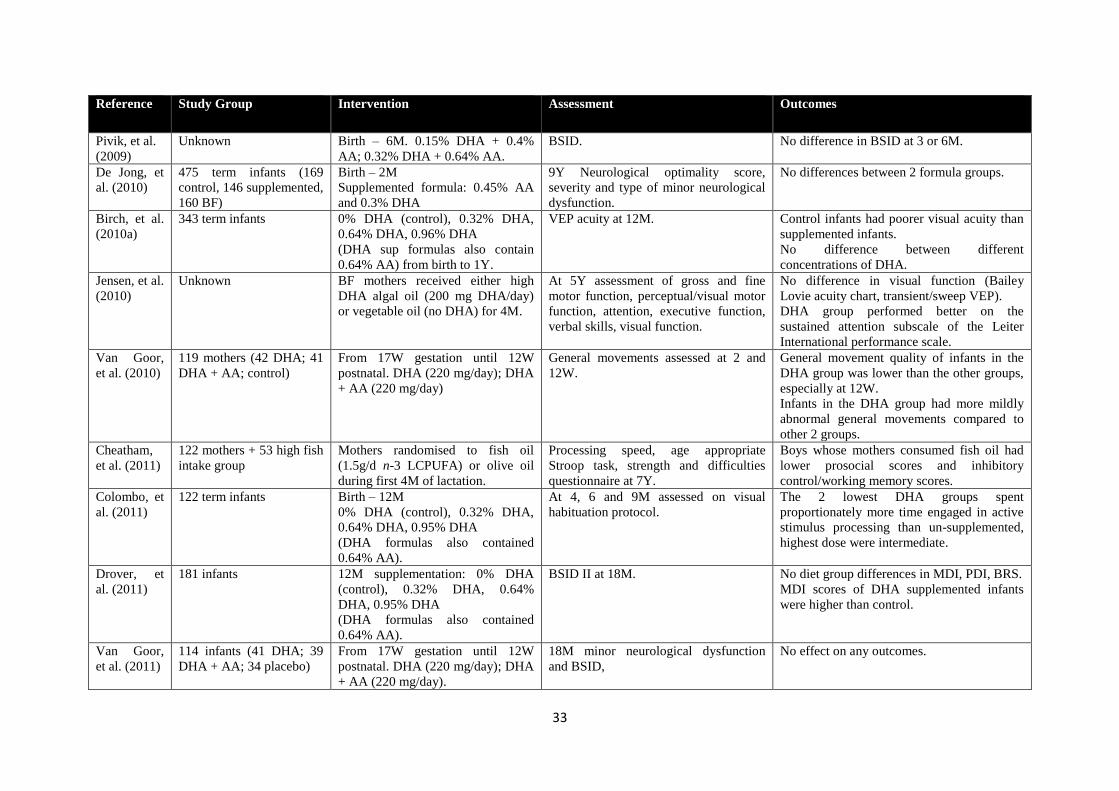
33
Reference Study Group Intervention Assessment Outcomes
Pivik, et al.
(2009)
Unknown
Birth – 6M. 0.15% DHA + 0.4%
AA; 0.32% DHA + 0.64% AA.
BSID. No difference in BSID at 3 or 6M.
De Jong, et
al. (2010)
475 term infants (169
control, 146 supplemented,
160 BF)
Birth – 2M
Supplemented formula: 0.45% AA
and 0.3% DHA
9Y Neurological optimality score,
severity and type of minor neurological
dysfunction.
No differences between 2 formula groups.
Birch, et al.
(2010a)
343 term infants 0% DHA (control), 0.32% DHA,
0.64% DHA, 0.96% DHA
(DHA sup formulas also contain
0.64% AA) from birth to 1Y.
VEP acuity at 12M. Control infants had poorer visual acuity than
supplemented infants.
No difference between different
concentrations of DHA.
Jensen, et al.
(2010)
Unknown BF mothers received either high
DHA algal oil (200 mg DHA/day)
or vegetable oil (no DHA) for 4M.
At 5Y assessment of gross and fine
motor function, perceptual/visual motor
function, attention, executive function,
verbal skills, visual function.
No difference in visual function (Bailey
Lovie acuity chart, transient/sweep VEP).
DHA group performed better on the
sustained attention subscale of the Leiter
International performance scale.
Van Goor,
et al. (2010)
119 mothers (42 DHA; 41
DHA + AA; control)
From 17W gestation until 12W
postnatal. DHA (220 mg/day); DHA
+ AA (220 mg/day)
General movements assessed at 2 and
12W.
General movement quality of infants in the
DHA group was lower than the other groups,
especially at 12W.
Infants in the DHA group had more mildly
abnormal general movements compared to
other 2 groups.
Cheatham,
et al. (2011)
122 mothers + 53 high fish
intake group
Mothers randomised to fish oil
(1.5g/d n-3 LCPUFA) or olive oil
during first 4M of lactation.
Processing speed, age appropriate
Stroop task, strength and difficulties
questionnaire at 7Y.
Boys whose mothers consumed fish oil had
lower prosocial scores and inhibitory
control/working memory scores.
Colombo, et
al. (2011)
122 term infants Birth – 12M
0% DHA (control), 0.32% DHA,
0.64% DHA, 0.95% DHA
(DHA formulas also contained
0.64% AA).
At 4, 6 and 9M assessed on visual
habituation protocol.
The 2 lowest DHA groups spent
proportionately more time engaged in active
stimulus processing than un-supplemented,
highest dose were intermediate.
Drover, et
al. (2011)
181 infants 12M supplementation: 0% DHA
(control), 0.32% DHA, 0.64%
DHA, 0.95% DHA
(DHA formulas also contained
0.64% AA).
BSID II at 18M. No diet group differences in MDI, PDI, BRS.
MDI scores of DHA supplemented infants
were higher than control.
Van Goor,
et al. (2011)
114 infants (41 DHA; 39
DHA + AA; 34 placebo)
From 17W gestation until 12W
postnatal. DHA (220 mg/day); DHA
+ AA (220 mg/day).
18M minor neurological dysfunction
and BSID,
No effect on any outcomes.
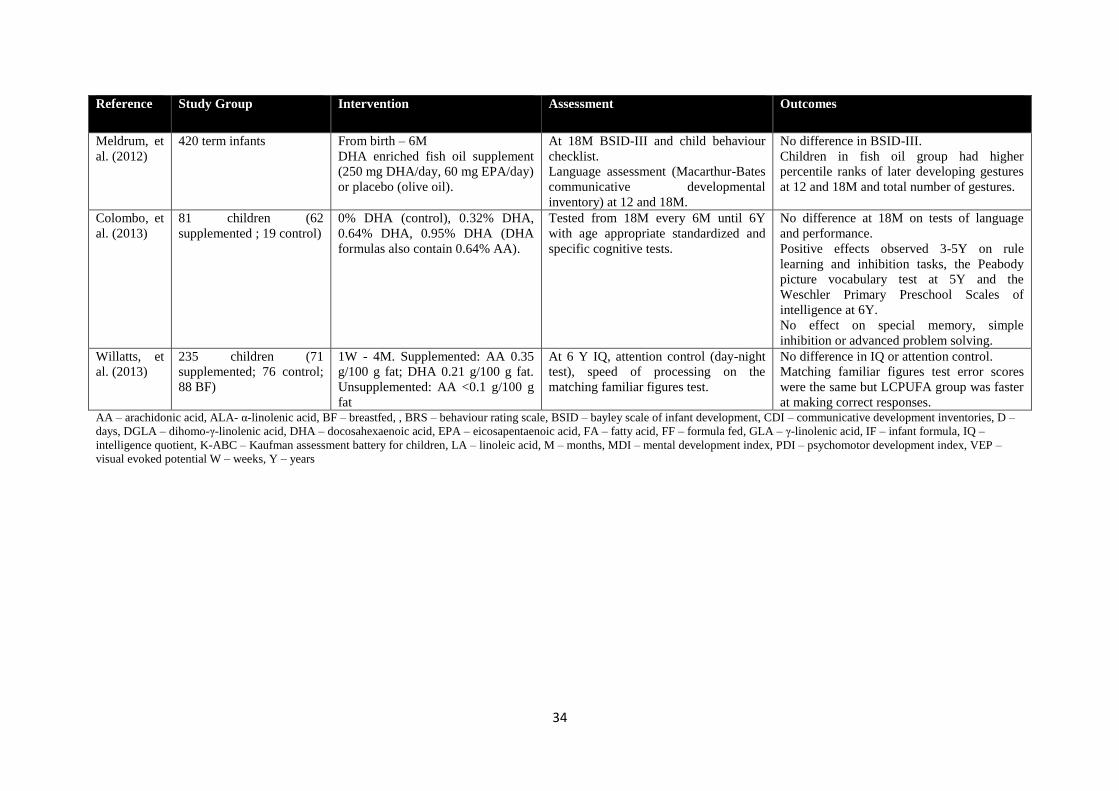
34
Reference Study Group Intervention Assessment Outcomes
Meldrum, et
al. (2012)
420 term infants From birth – 6M
DHA enriched fish oil supplement
(250 mg DHA/day, 60 mg EPA/day)
or placebo (olive oil).
At 18M BSID-III and child behaviour
checklist.
Language assessment (Macarthur-Bates
communicative developmental
inventory) at 12 and 18M.
No difference in BSID-III.
Children in fish oil group had higher
percentile ranks of later developing gestures
at 12 and 18M and total number of gestures.
Colombo, et
al. (2013)
81 children (62
supplemented ; 19 control)
0% DHA (control), 0.32% DHA,
0.64% DHA, 0.95% DHA (DHA
formulas also contain 0.64% AA).
Tested from 18M every 6M until 6Y
with age appropriate standardized and
specific cognitive tests.
No difference at 18M on tests of language
and performance.
Positive effects observed 3-5Y on rule
learning and inhibition tasks, the Peabody
picture vocabulary test at 5Y and the
Weschler Primary Preschool Scales of
intelligence at 6Y.
No effect on special memory, simple
inhibition or advanced problem solving.
Willatts, et
al. (2013)
235 children (71
supplemented; 76 control;
88 BF)
1W - 4M. Supplemented: AA 0.35
g/100 g fat; DHA 0.21 g/100 g fat.
Unsupplemented: AA <0.1 g/100 g
fat
At 6 Y IQ, attention control (day-night
test), speed of processing on the
matching familiar figures test.
No difference in IQ or attention control.
Matching familiar figures test error scores
were the same but LCPUFA group was faster
at making correct responses. AA – arachidonic acid, ALA- α-linolenic acid, BF – breastfed, , BRS – behaviour rating scale, BSID – bayley scale of infant development, CDI – communicative development inventories, D –
days, DGLA – dihomo-γ-linolenic acid, DHA – docosahexaenoic acid, EPA – eicosapentaenoic acid, FA – fatty acid, FF – formula fed, GLA – γ-linolenic acid, IF – infant formula, IQ –
intelligence quotient, K-ABC – Kaufman assessment battery for children, LA – linoleic acid, M – months, MDI – mental development index, PDI – psychomotor development index, VEP –
visual evoked potential W – weeks, Y – years
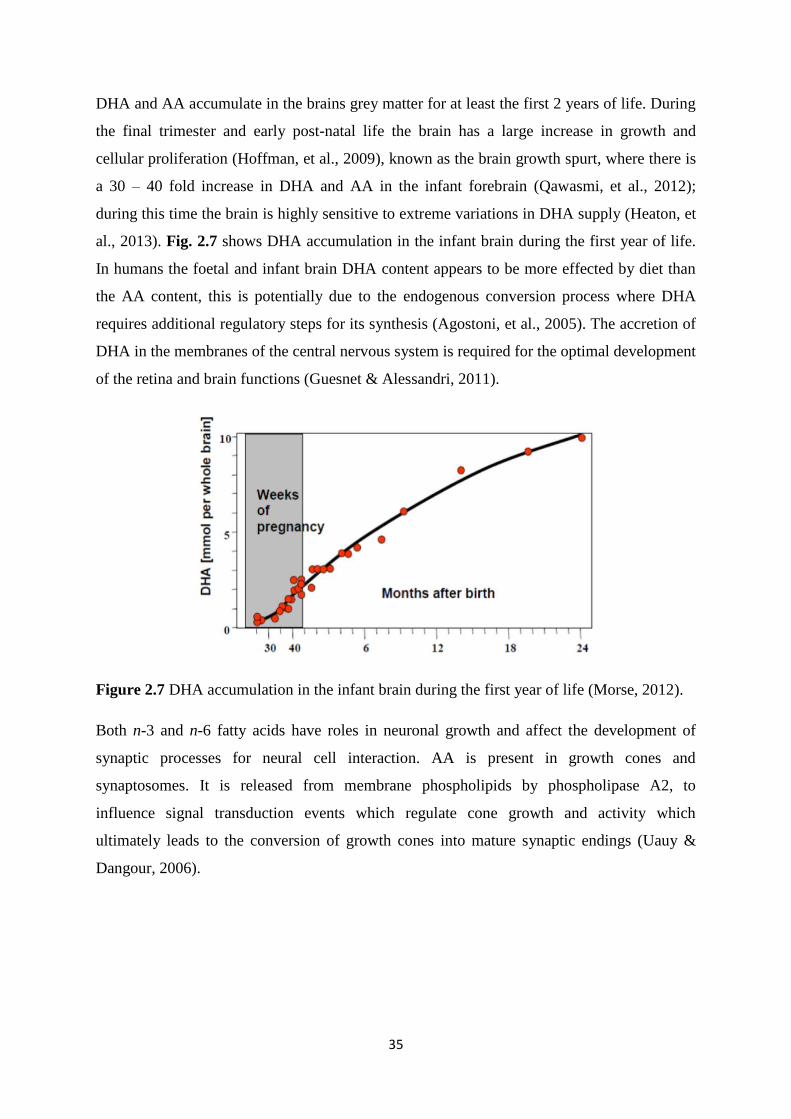
35
DHA and AA accumulate in the brains grey matter for at least the first 2 years of life. During
the final trimester and early post-natal life the brain has a large increase in growth and
cellular proliferation (Hoffman, et al., 2009), known as the brain growth spurt, where there is
a 30 – 40 fold increase in DHA and AA in the infant forebrain (Qawasmi, et al., 2012);
during this time the brain is highly sensitive to extreme variations in DHA supply (Heaton, et
al., 2013). Fig. 2.7 shows DHA accumulation in the infant brain during the first year of life.
In humans the foetal and infant brain DHA content appears to be more effected by diet than
the AA content, this is potentially due to the endogenous conversion process where DHA
requires additional regulatory steps for its synthesis (Agostoni, et al., 2005). The accretion of
DHA in the membranes of the central nervous system is required for the optimal development
of the retina and brain functions (Guesnet & Alessandri, 2011).
Figure 2.7 DHA accumulation in the infant brain during the first year of life (Morse, 2012).
Both n-3 and n-6 fatty acids have roles in neuronal growth and affect the development of
synaptic processes for neural cell interaction. AA is present in growth cones and
synaptosomes. It is released from membrane phospholipids by phospholipase A2, to
influence signal transduction events which regulate cone growth and activity which
ultimately leads to the conversion of growth cones into mature synaptic endings (Uauy &
Dangour, 2006).
36
The concentration of LCPUFA can alter neuronal membrane fluidity and physical structures
of neurons. Both n-3 and n-6 fatty acids are implicated in the production and activity of
several neurotransmitters, such as dopamine and serotonin; effect synaptic transmission and
substrate binding to membrane receptors. Neurite outgrowth in hippocampal neurons is
enhanced by DHA; this may promote learning due to the hippocampus being a critical region
for memory formation. DHA has many roles in the structure of the brain and its function,
with the potential to effect neurodevelopment and performance (Heaton, et al., 2013).
Variations in study design may have caused the conflicting results from LCPUFA
supplementation studies, shown in Table 2.6. Factors that may influence the variation in
results include the duration of supplementation, sources of LCPUFA, concentration of
LCPUFA supplementation, age that intervention was commenced, age of infant at time of
assessment, population characteristics, genetic differences in fatty acid metabolism, other
intakes of fatty acids in the maternal and infant diet, infants DHA status at birth and the test
method used to assess visual or neurodevelopment as they may not be sensitive enough to
evaluate infant development (Guesnet & Alessandri, 2011). Confounding factors may also
influence results, for example social economic status has been positively associated with
maternal and infant IQ and decision to breast feed (Heaton, et al., 2013). Furthermore factors
influencing brain development are complex and multifactorial with numerous potential
confounders; such as birth weight, parental education, socio economic status, smoking, DHA
levels at birth and PUFA ratios (Agostoni, et al., 2005). It has been suggested that trials using
formulas close to the worldwide average are more likely to yield positive results. Also there
is some clinical evidence to suggest that an AA:DHA ratio greater than 1:1 is associated with
improved cognitive outcomes. Lastly trials involving PUFA may require sufficient amounts
of vitamin E, as unsaturation is highly susceptible to peroxidation (Ruxton, et al., 2004).
There are other key micronutrients that have been implicated in brain development in early
life such as folate, retinol, iodine, iron, zinc and copper which may also be important to
assess when evaluating brain development (Uauy & Dangour, 2006).
ADHD, schizophrenia, autism, depression, dyslexia and anxiety have also been associated
with n-3 PUFA deficiency; thought to be due to a reduction in neurotransmission processes,
for instance involving dopamine and serotonin (Janssen & Kiliaan, 2014; Riediger, et al.,
2009).
37
2.2.5 Essential fatty acids: allergy
Foetal and neonatal periods are key times for immunological adaptation. Components of both
the innate and acquired immune systems are present at birth, but in reduced amounts and at
reduced activities. Therefore the infant is regarded as immunocompetent but
immunologically naïve. The infant must down regulate the predominant T helper (Th) 2 state
which is present at birth, which is believed to be a hall mark for allergy development. The
regulation of tolerance and active immune responses are critical to health and failure to
regulate these responses can lead to recurrent infections, inflammatory diseases and allergic
reactions (Gottrand, 2008).
The idea that n-3 LCPUFA are protective against allergic diseases initially arose from
epidemiological evidence that Greenland Eskimos have a low prevalence of asthma; which is
thought to be a consequence of their diets containing large amounts of oily fish and seafood
which are rich in n-3 LCPUFA. n-3 PUFA have generally been regarded as having anti-
inflammatory roles whilst n-6 PUFA are regarded as having pro-inflammatory roles (Calder
& Miles, 2000). It has therefore been suggested that there is a link between the n-3 and n-6
PUFA in allergic disease. PUFA act via several mechanisms to modulate immune function.
n-3 PUFA may alter the Th cell balance by inhibiting cytokine production, immunoglobulin
(Ig) E synthesis and Th 2 differentiation. In addition they can alter membrane composition,
eicosanoid metabolism and gene expression (Shek, et al., 2012). Furthermore observational
studies have linked low levels of LCPUFA in breast milk to increased risk of infant atopy
(Gottrand, 2008).
The belief that n-6 LCPUFA are pro-inflammatory stems from the classic role of membrane
phospholipid liberated AA being a precursor for cyclooxygenase (COX) and lipoxygenase
(LOX) enzymes (Harbige, 2003). COX and LOX are present in epithelial and inflammatory
cells which give rise to different mediators depending on the substrates present, which in turn
will regulate the severity and length of the inflammatory response (Shek, et al., 2012). AA
can act as a substrate for COX for the formation of 2 series PG and TX, LOX for the
formation of 4 series LT and cytochrome P450 monooxygenases to form 19 and 20-
hydroxyeicosatetraenoic acid, shown in Fig. 2.8. PGE2 has been discussed extensively for its
roles in inflammation. EPA and DHA can replace AA in cell membranes, which reduces the
conversion of AA derived eicosanoids. EPA is a substrate for COX and 5-LOX; producing 3
series PG and 5 series LT; which are less potent than AA derived eicosanoids (Calder &
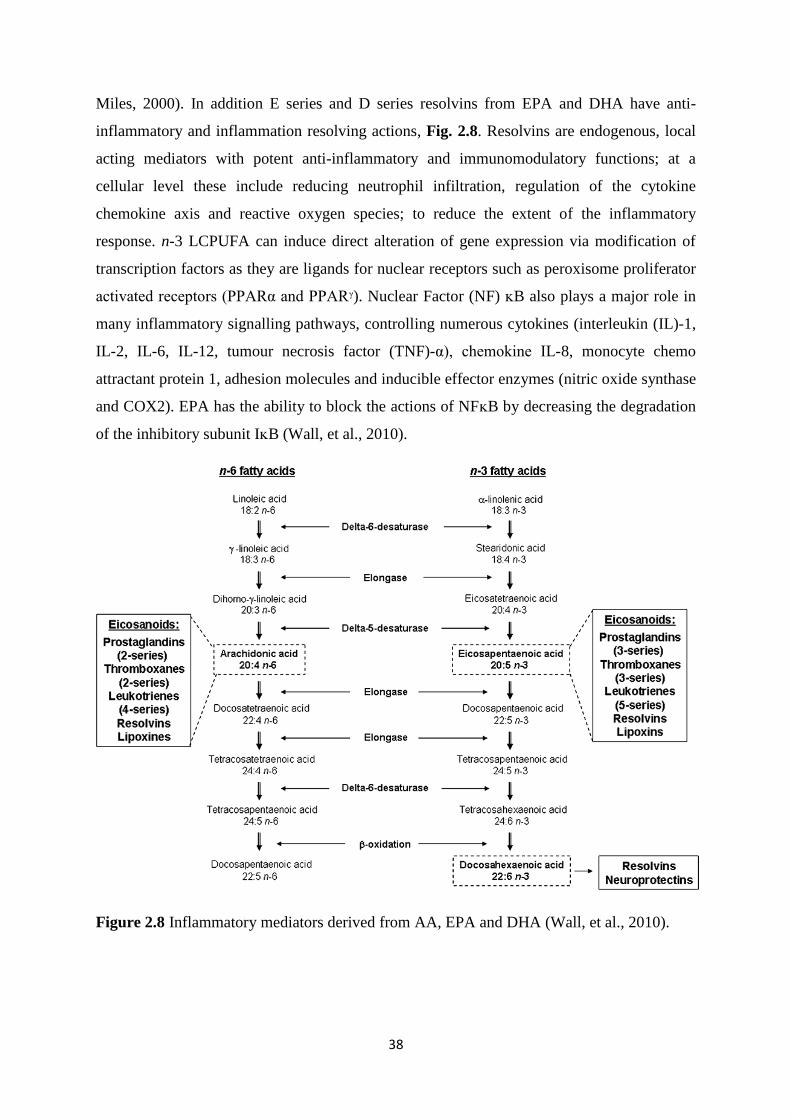
38
Miles, 2000). In addition E series and D series resolvins from EPA and DHA have anti-
inflammatory and inflammation resolving actions, Fig. 2.8. Resolvins are endogenous, local
acting mediators with potent anti-inflammatory and immunomodulatory functions; at a
cellular level these include reducing neutrophil infiltration, regulation of the cytokine
chemokine axis and reactive oxygen species; to reduce the extent of the inflammatory
response. n-3 LCPUFA can induce direct alteration of gene expression via modification of
transcription factors as they are ligands for nuclear receptors such as peroxisome proliferator
activated receptors (PPARα and PPARᵞ). Nuclear Factor (NF) ᴋB also plays a major role in
many inflammatory signalling pathways, controlling numerous cytokines (interleukin (IL)-1,
IL-2, IL-6, IL-12, tumour necrosis factor (TNF)-α), chemokine IL-8, monocyte chemo
attractant protein 1, adhesion molecules and inducible effector enzymes (nitric oxide synthase
and COX2). EPA has the ability to block the actions of NFᴋB by decreasing the degradation
of the inhibitory subunit IᴋB (Wall, et al., 2010).
Figure 2.8 Inflammatory mediators derived from AA, EPA and DHA (Wall, et al., 2010).
39
Mechanisms by which n-3 and n-6 fatty acids may potentially affect the development of
allergy are extensive. n-3 fatty acids, depending on the level of intake, reduce the pro-
inflammatory cytokines TNF-α, IL-1α, IL-1β, IL-2, IL-6 and IL-8 (Harbige, 2003; Calder, et
al., 2006). By altering the membrane phospholipid AA/EPA ratio in favour of EPA the
production of TXB2, PGE2 and LTB4 are decreased and the production of LTC5, LTB5 and
TXB3 are increased (Calder, et al., 2006). n-3 LCPUFA can also affect the expression of cell
surface molecules, such as CD25 (IL-2 receptor) and adhesion molecules such as intracellular
adhesion molecule 1, vascular cell adhesion molecule 1 and lymphocyte function associated
antigen on lymphocytes and monocytes (Harbige, 2003). EPA and DHA can inhibit the
inflammatory cascade of Toll-like receptors and TNF-α signalling through the G-protein
coupled receptor (GPR120) activation thus elevating intracellular calcium and activation of
extracellular signal-regulated kinase cascade (Oh, et al., 2010). Platelet activating factor can
also be reduced by fish oil feeding and neutrophil chemotaxis can be inhibited by
chemotaxin-stimulated inositol triphosphate (Sperling, 1998) and DHA gives rise to the
protectins DP1 (Calder, 2012). n-6 fatty acids can alter the DGLA/AA ratio giving rise to an
increase in anti-inflammatory PGE1 and decrease LTB4 and in some cases decrease PGE2.
Increased PGJ2 by γ-linolenic acid (GLA) 18:3 (n-6) feeding has anti-inflammatory effects
and with the lipoxins, such as LTA4 have resolving-like effects. GLA feeding has also been
shown to increase anti-inflammatory transforming growth factor (TGF) β production and
reduce IL-1β and monocyte chemotactic protein 1 (Harbige, 2003; Xiang, et al., 2010).
Furthermore reduced adhesion molecule expression, such as CD62+, CD36+ and CD54+ on
T cells and monocytes has been observed with GLA feeding (Xiang, et al., 2010). There is
also evidence that n-3 and n-6 fatty acids can affect tolerance induction and via their
membrane phospholipid incorporation and metabolites may also affect gut permeability and
closure (Harbige & Fisher, 2001).
PGE2 acts on T lymphocytes to reduce the formation of Th1 cytokines (interferon (IFN) γ and
IL-2) with no effect on IL-4 and IL-5 production. IL-4 can promote the synthesis of IgE
which may lead to allergic sensitization (Black & Sharpe, 1997). PGE2 has been found to be
immunosuppressive at high concentrations whereas at low concentrations it is required for
normal T cell function (Gottrand, 2008). It has also been suggested to be protective against
airway inflammation and re-exposure to allergens. It inhibits 5-LOX which down regulates
LT production and induces 15-LOX which produces lipoxin A4 which has anti-inflammatory
roles (Kremmyda, et al., 2011). Therefore it seems that PG such as PGE2 may have dual roles
40
in allergy. Furthermore the AA metabolite PGJ2 has potent anti-inflammatory effects on
inflammatory cytokines (Harbige, 2003). Dihomo-γ-linolenic acid (DGLA) 20:3 (n-6) is also
a substrate for COX producing PGE1 and 15-LOX which produces 15-hydroxyDGLA.
15-HydroxyDGLA inhibits 5 and 12-LOX producing an anti-inflammatory response. DGLA
can also decrease lymphocyte responsiveness and suppress the production of IL-2, IL-1β and
TNF-α (Calder & Miles, 2000).
Wright & Bolton, (1989) observed higher proportions of LA and lower amounts of DGLA in
the breast milk lipids of mothers of children with atopic eczema. In agreement with Ioppi, et
al. (1994), Thijs, et al. (2000) found lower levels of AA in the breast milk of atopic mothers
compared with non-atopic mothers. Thijs, et al. (2000) also found that supplementation of
atopic mothers with GLA, which bypasses the rate limiting ∆6 desaturase step, increased
DGLA but not AA in breast milk. Low n-6 breast milk fatty acids in atopic mothers were also
reported by Duchen, et al. (2000) and low AA levels were found in a study by Johansson, et
al. (2011). In the Netherlands an intervention study in infants with a maternal history of atopy
were supplemented with n-6 rich borage oil (100 mg GLA/day) or sunflower oil as placebo,
for the first 6 months of life. Although the use of sunflower oil is questionable because it
contains the precursor n-6 PUFA LA, the results did not show any difference in total IgE and
positive serum IgE food allergen tests. There was also no association between the presence of
atopic dermatitis and supplementation at 1 year. GLA, DGLA and AA were higher in the
plasma phospholipids of the intervention group. This study was conducted due to the finding
that low concentrations of n-6 LCPUFA in umbilical cord blood may precede the
development of atopic dermatitis, potentially due to reduced conversion of LA to GLA by Δ6
desaturase (Van Gool, et al., 2003). It has also been observed that mothers of atopic infants
have lower concentrations of n-6 LCPUFA in their breast milk. It is important to consider
that if levels of n-6 LCPUFA are lower in certain allergic individuals then reducing the n-6
content in the diet may cause detrimental effects.
There have also been published reports of lower n-3 LCPUFA in the breast milk of atopic
mothers (Duchen, et al., 2000; Hoppu, et al., 2005; Johansson, et al., 2011) whilst some
studies have found no differences between breast milk n-6 and n-3 fatty acids from atopic and
non-atopic mothers (Lauritzen, et al., 2006; Wijga, et al., 2002). Thus most, but not all
studies, have found changes in the n-6 and n-3 LCPUFA in the breast milk of atopic mothers.
Cord blood n-3 and n-6 LCPUFA have also been shown to be lower in several studies (Beck,
et al., 2000). However total n-3 LCPUFA and total n-6 LCPUFA from cord serum
41
phospholipids were found to be higher in subjects who later went on to develop respiratory
allergy or atopic eczema compared to controls that did not develop allergy (Barman, et al.,
2013). Furthermore no association could be confirmed between the FADS1 and FASD2 gene
polymorphism and eczema (Rzehak, et al., 2010). It is however possible that the
abnormalities in breast milk fatty acids reported in some studies may be related to other
factors. For example zinc is known to be an important factor in the desaturation of the
precursor fatty acid LA to AA and the conversion of LA to AA is normally correlated in
breast milk (Xiang, et al., 2007). To our knowledge there have been no published studies of
breast milk zinc and fatty acids levels in atopic mothers.
Maternal fish intake during pregnancy has consistently demonstrated a protective effect on
atopic disease and allergy in infants and children (Best, et., 2015). However when fish intake
has been studied during infancy the effects have been inconsistent, nevertheless many studies
have demonstrated protective effects. Fish oil supplementation studies in infants have caused
a higher n-3 LCPUFA status; however, currently it is unclear what clinical significance this
has. Fish studies have provided more promising outcomes, possibly due to other nutrients
being present in comparison to fish oil intervention studies (Shek, et al., 2012). Table 2.7
summarises the fatty acid intervention studies that have been conducted in term infants with
effects on allergy.
There have been numerous epidemiological based studies looking at fish intake during
infancy and its effects on allergic outcomes. If the hypothesis that a lower consumption of n-3
LCPUFA plays a role in the rise in allergy then higher intakes from foods containing n-3
LCPUFA such as fish, seafood or fish oil supplementation should clinically alleviate allergic
outcomes. There is some evidence to support this hypothesis however other studies have
given contradictory outcomes.
There are numerous limitations to the studies conducted so far. In many of the studies there is
a distinct lack of information on the type of fish consumed and the actual consumption, thus
the dietary intake of various n-3 LCPUFA is likely to vary considerably between these
studies. However Jong, et al (2012) concluded that the amount of fish consumed had no
effect on the study outcome. Whereas contradictory conclusions on the type of fish have been
noted; Alm, et al. (2009) found no effect with the type of fish consumed, whereas Storro, et
al. (2010) found that oily fish showed a stronger association. Furthermore, if the effects from
studies are due to the n-3 LCPUFA content of the fish then the type of fish would be expected
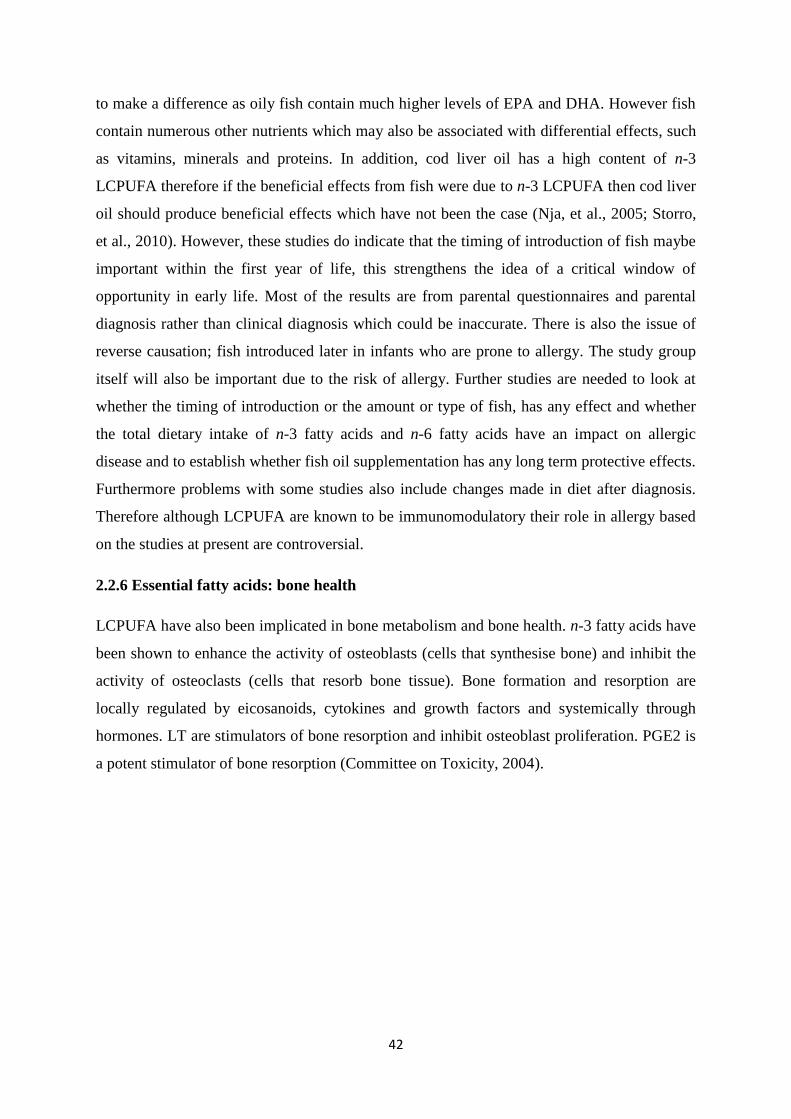
42
to make a difference as oily fish contain much higher levels of EPA and DHA. However fish
contain numerous other nutrients which may also be associated with differential effects, such
as vitamins, minerals and proteins. In addition, cod liver oil has a high content of n-3
LCPUFA therefore if the beneficial effects from fish were due to n-3 LCPUFA then cod liver
oil should produce beneficial effects which have not been the case (Nja, et al., 2005; Storro,
et al., 2010). However, these studies do indicate that the timing of introduction of fish maybe
important within the first year of life, this strengthens the idea of a critical window of
opportunity in early life. Most of the results are from parental questionnaires and parental
diagnosis rather than clinical diagnosis which could be inaccurate. There is also the issue of
reverse causation; fish introduced later in infants who are prone to allergy. The study group
itself will also be important due to the risk of allergy. Further studies are needed to look at
whether the timing of introduction or the amount or type of fish, has any effect and whether
the total dietary intake of n-3 fatty acids and n-6 fatty acids have an impact on allergic
disease and to establish whether fish oil supplementation has any long term protective effects.
Furthermore problems with some studies also include changes made in diet after diagnosis.
Therefore although LCPUFA are known to be immunomodulatory their role in allergy based
on the studies at present are controversial.
2.2.6 Essential fatty acids: bone health
LCPUFA have also been implicated in bone metabolism and bone health. n-3 fatty acids have
been shown to enhance the activity of osteoblasts (cells that synthesise bone) and inhibit the
activity of osteoclasts (cells that resorb bone tissue). Bone formation and resorption are
locally regulated by eicosanoids, cytokines and growth factors and systemically through
hormones. LT are stimulators of bone resorption and inhibit osteoblast proliferation. PGE2 is
a potent stimulator of bone resorption (Committee on Toxicity, 2004).
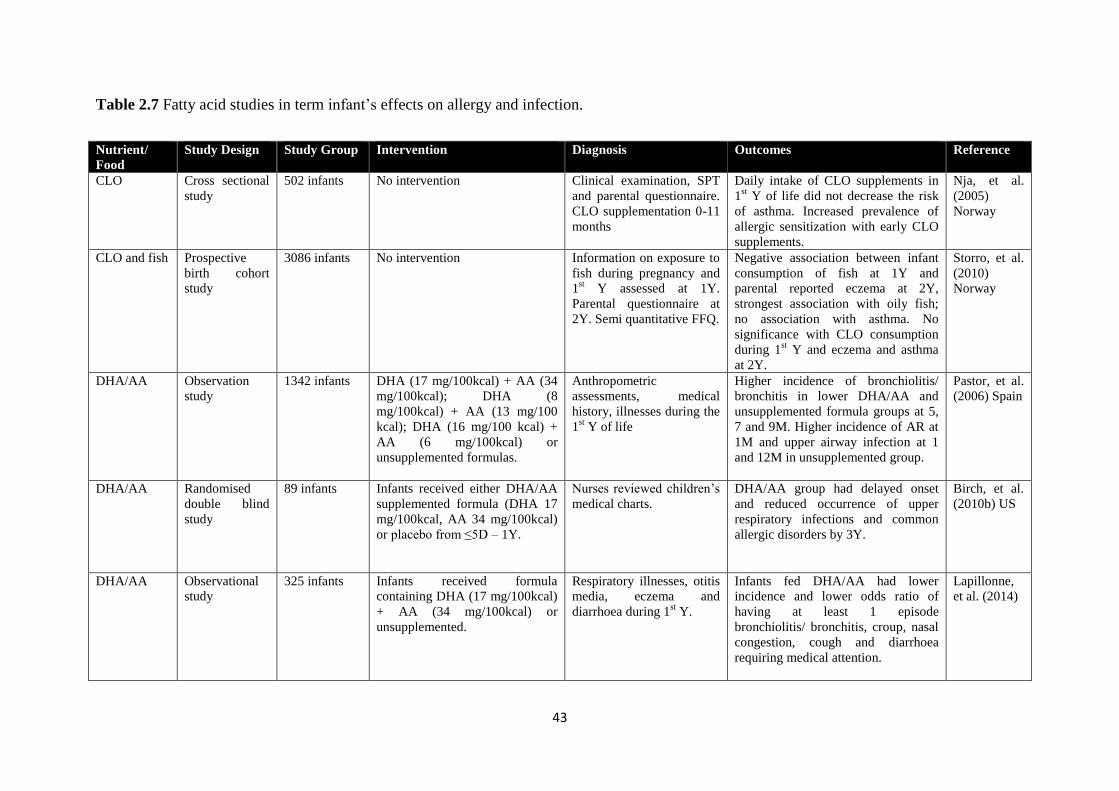
43
Table 2.7 Fatty acid studies in term infant’s effects on allergy and infection.
Nutrient/
Food
Study Design Study Group Intervention Diagnosis Outcomes Reference
CLO Cross sectional
study
502 infants No intervention Clinical examination, SPT
and parental questionnaire.
CLO supplementation 0-11
months
Daily intake of CLO supplements in
1st Y of life did not decrease the risk
of asthma. Increased prevalence of
allergic sensitization with early CLO
supplements.
Nja, et al.
(2005)
Norway
CLO and fish Prospective
birth cohort
study
3086 infants No intervention Information on exposure to
fish during pregnancy and
1st Y assessed at 1Y.
Parental questionnaire at
2Y. Semi quantitative FFQ.
Negative association between infant
consumption of fish at 1Y and
parental reported eczema at 2Y,
strongest association with oily fish;
no association with asthma. No
significance with CLO consumption
during 1st Y and eczema and asthma
at 2Y.
Storro, et al.
(2010)
Norway
DHA/AA Observation
study
1342 infants DHA (17 mg/100kcal) + AA (34
mg/100kcal); DHA (8
mg/100kcal) + AA (13 mg/100
kcal); DHA (16 mg/100 kcal) +
AA (6 mg/100kcal) or
unsupplemented formulas.
Anthropometric
assessments, medical
history, illnesses during the
1st Y of life
Higher incidence of bronchiolitis/
bronchitis in lower DHA/AA and
unsupplemented formula groups at 5,
7 and 9M. Higher incidence of AR at
1M and upper airway infection at 1
and 12M in unsupplemented group.
Pastor, et al.
(2006) Spain
DHA/AA Randomised
double blind
study
89 infants Infants received either DHA/AA
supplemented formula (DHA 17
mg/100kcal, AA 34 mg/100kcal)
or placebo from ≤5D – 1Y.
Nurses reviewed children’s
medical charts.
DHA/AA group had delayed onset
and reduced occurrence of upper
respiratory infections and common
allergic disorders by 3Y.
Birch, et al.
(2010b) US
DHA/AA Observational
study
325 infants Infants received formula
containing DHA (17 mg/100kcal)
+ AA (34 mg/100kcal) or
unsupplemented.
Respiratory illnesses, otitis
media, eczema and
diarrhoea during 1st Y.
Infants fed DHA/AA had lower
incidence and lower odds ratio of
having at least 1 episode
bronchiolitis/ bronchitis, croup, nasal
congestion, cough and diarrhoea
requiring medical attention.
Lapillonne,
et al. (2014)
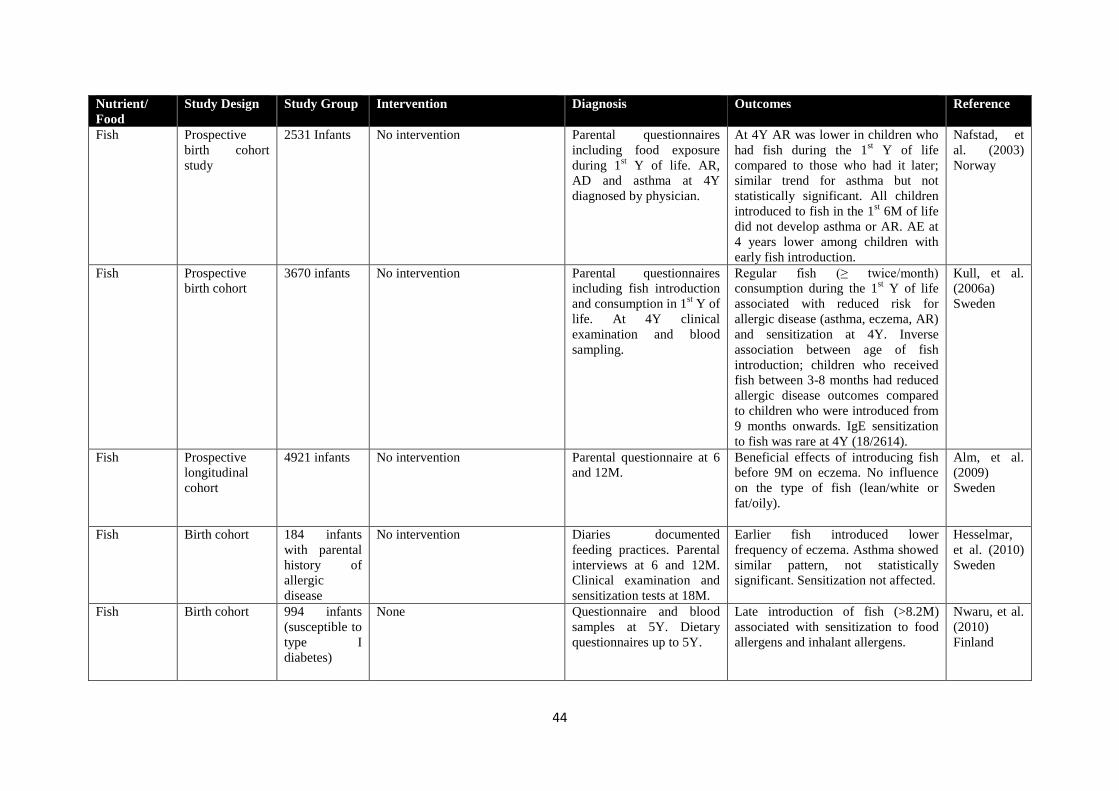
44
Nutrient/
Food
Study Design Study Group Intervention Diagnosis Outcomes Reference
Fish Prospective
birth cohort
study
2531 Infants No intervention Parental questionnaires
including food exposure
during 1st Y of life. AR,
AD and asthma at 4Y
diagnosed by physician.
At 4Y AR was lower in children who
had fish during the 1st Y of life
compared to those who had it later;
similar trend for asthma but not
statistically significant. All children
introduced to fish in the 1st 6M of life
did not develop asthma or AR. AE at
4 years lower among children with
early fish introduction.
Nafstad, et
al. (2003)
Norway
Fish Prospective
birth cohort
3670 infants No intervention Parental questionnaires
including fish introduction
and consumption in 1st Y of
life. At 4Y clinical
examination and blood
sampling.
Regular fish (≥ twice/month)
consumption during the 1st Y of life
associated with reduced risk for
allergic disease (asthma, eczema, AR)
and sensitization at 4Y. Inverse
association between age of fish
introduction; children who received
fish between 3-8 months had reduced
allergic disease outcomes compared
to children who were introduced from
9 months onwards. IgE sensitization
to fish was rare at 4Y (18/2614).
Kull, et al.
(2006a)
Sweden
Fish Prospective
longitudinal
cohort
4921 infants No intervention Parental questionnaire at 6
and 12M.
Beneficial effects of introducing fish
before 9M on eczema. No influence
on the type of fish (lean/white or
fat/oily).
Alm, et al.
(2009)
Sweden
Fish Birth cohort 184 infants
with parental
history of
allergic
disease
No intervention Diaries documented
feeding practices. Parental
interviews at 6 and 12M.
Clinical examination and
sensitization tests at 18M.
Earlier fish introduced lower
frequency of eczema. Asthma showed
similar pattern, not statistically
significant. Sensitization not affected.
Hesselmar,
et al. (2010)
Sweden
Fish Birth cohort 994 infants
(susceptible to
type I
diabetes)
None Questionnaire and blood
samples at 5Y. Dietary
questionnaires up to 5Y.
Late introduction of fish (>8.2M)
associated with sensitization to food
allergens and inhalant allergens.
Nwaru, et al.
(2010)
Finland
45
Nutrient/
Food
Study Design Study Group Intervention Diagnosis Outcomes Reference
Fish Birth cohort 1293 infants
(susceptible to
type 1
diabetes)
None Structured dietary
questionnaires up to 2Y.
Persistent asthma and AR
assessed at 5Y by
questionnaire.
Early introduction of fish showed a
dose dependent association with
decreased risk of AR.
Virtanen, et
al. (2010)
Finland
Fish Prospective
longitudinal
cohort study
4496 infants No intervention Parental postal
questionnaires at 6, 12M
and 4.5Y.
Risk of AR at 4.5Y reduced by fish
introduction before 9M.
Alm, et al.
(2011)
Sweden
Fish Prospective
longitudinal
cohort study
4496 infants No intervention Parental postal
questionnaires at 6, 12M
and 4.5Y.
Introduction of fish before 9M
reduced the risk of recurrent wheeze
at 4.5Y.
Goksor, et
al. (2011)
Sweden
Fish Population
based birth
cohort
7210 infants No intervention 12 and 14M timing of
introduction of fish
assessed. Semi quantitative
FFQ at 14M to look at fish
consumption. Physician
interview for asthma like
symptoms assessed at 36
and 48M.
Fish introduction at 6-12M associated
with lower risk of wheeze at 48M
compared to later introduction.
Introduction of fish before 6M
associated with increased risk of
wheeze at 48M. Amount of fish not
associated with asthma like symptoms
at 36/48M.
Jong, et al.
(2012)
Netherlands
Fish Birth cohort 3781 infants
(susceptible to
Type 1
diabetes)
None Dietary questionnaires up
to 2Y. At 5Y questionnaire
on allergy history and
blood sample for IgE
analysis.
Introduction to fish <9M inversely
associated with asthma, especially
atopic asthma, AR and atopic
sensitization.
Nwaru, et al.
(2013)
Finland
Fish Prospective
birth cohort
3285 infants No intervention Parental questionnaires,
clinical examination and
blood sampling.
Children who consumed fish
regularly (≥2-3/M) in the 1st Y had
reduced risk of asthma, rhinitis and
eczema compared to those who had
irregular intakes (≤1/M).
Magnusson,
et al. (2013)
Sweden
Fish Prospective
study
256 infants
with family
history of
allergy (parent
or sibling)
3 intervention groups: dietary
counselling + probiotic (LB
rhamnosus), dietary intervention
+ placebo (microcrystalline
cellulose and dextrose
anhydrate), control + placebo.
Semi structured interviews
up to 4Y. Food diary about
introduction of
complementary foods.
SPT. Physician
examination for eczema.
Introduction of fish > 7M, compared
to before increased atopic eczema.
After controlling for parental
perceptions the results were no longer
significant.
Niinivirta, et
al. (2014)
Finland
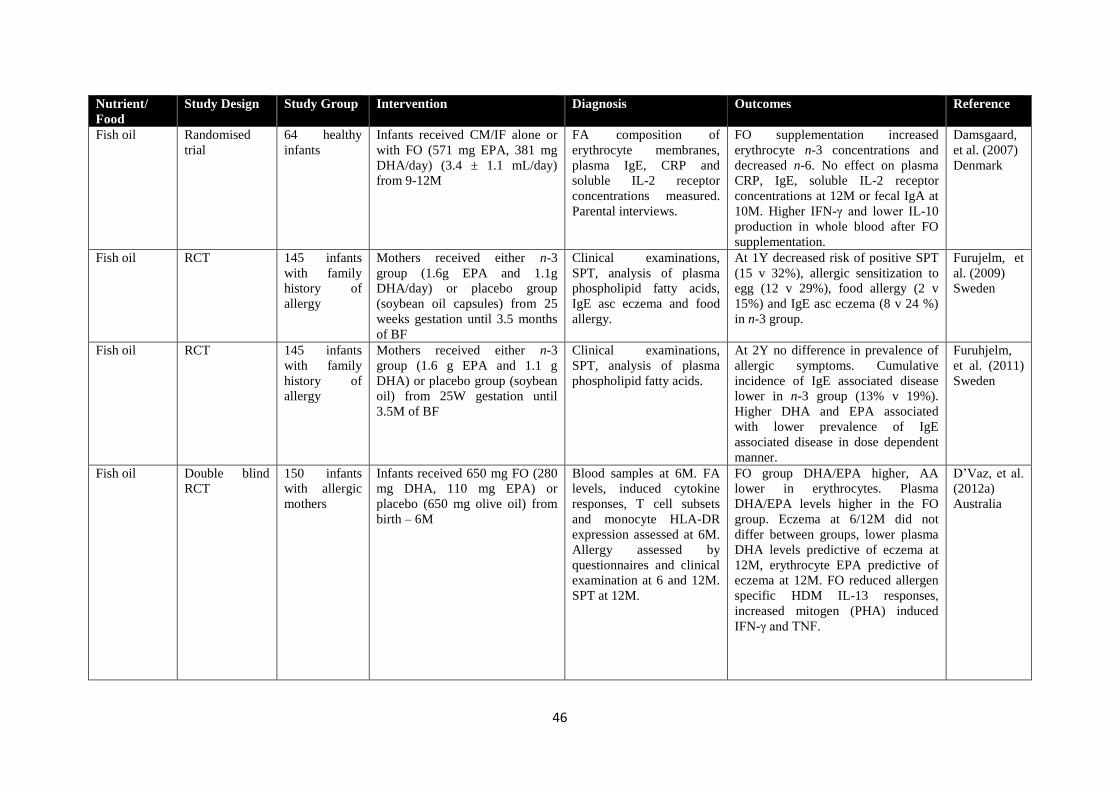
46
Nutrient/
Food
Study Design Study Group Intervention Diagnosis Outcomes Reference
Fish oil Randomised
trial
64 healthy
infants
Infants received CM/IF alone or
with FO (571 mg EPA, 381 mg
DHA/day) (3.4 ± 1.1 mL/day)
from 9-12M
FA composition of
erythrocyte membranes,
plasma IgE, CRP and
soluble IL-2 receptor
concentrations measured.
Parental interviews.
FO supplementation increased
erythrocyte n-3 concentrations and
decreased n-6. No effect on plasma
CRP, IgE, soluble IL-2 receptor
concentrations at 12M or fecal IgA at
10M. Higher IFN-γ and lower IL-10
production in whole blood after FO
supplementation.
Damsgaard,
et al. (2007)
Denmark
Fish oil RCT 145 infants
with family
history of
allergy
Mothers received either n-3
group (1.6g EPA and 1.1g
DHA/day) or placebo group
(soybean oil capsules) from 25
weeks gestation until 3.5 months
of BF
Clinical examinations,
SPT, analysis of plasma
phospholipid fatty acids,
IgE asc eczema and food
allergy.
At 1Y decreased risk of positive SPT
(15 v 32%), allergic sensitization to
egg (12 v 29%), food allergy (2 v
15%) and IgE asc eczema (8 v 24 %)
in n-3 group.
Furujelm, et
al. (2009)
Sweden
Fish oil RCT 145 infants
with family
history of
allergy
Mothers received either n-3
group (1.6 g EPA and 1.1 g
DHA) or placebo group (soybean
oil) from 25W gestation until
3.5M of BF
Clinical examinations,
SPT, analysis of plasma
phospholipid fatty acids.
At 2Y no difference in prevalence of
allergic symptoms. Cumulative
incidence of IgE associated disease
lower in n-3 group (13% v 19%).
Higher DHA and EPA associated
with lower prevalence of IgE
associated disease in dose dependent
manner.
Furuhjelm,
et al. (2011)
Sweden
Fish oil Double blind
RCT
150 infants
with allergic
mothers
Infants received 650 mg FO (280
mg DHA, 110 mg EPA) or
placebo (650 mg olive oil) from
birth – 6M
Blood samples at 6M. FA
levels, induced cytokine
responses, T cell subsets
and monocyte HLA-DR
expression assessed at 6M.
Allergy assessed by
questionnaires and clinical
examination at 6 and 12M.
SPT at 12M.
FO group DHA/EPA higher, AA
lower in erythrocytes. Plasma
DHA/EPA levels higher in the FO
group. Eczema at 6/12M did not
differ between groups, lower plasma
DHA levels predictive of eczema at
12M, erythrocyte EPA predictive of
eczema at 12M. FO reduced allergen
specific HDM IL-13 responses,
increased mitogen (PHA) induced
IFN-γ and TNF.
D’Vaz, et al.
(2012a)
Australia
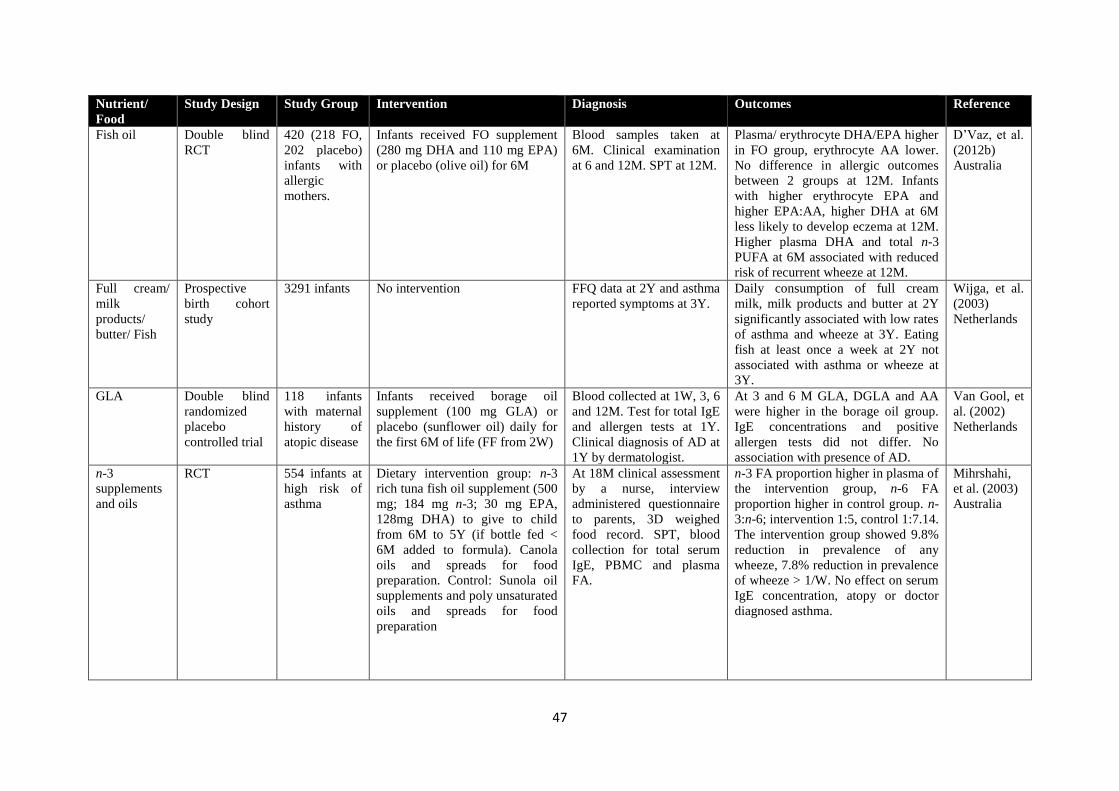
47
Nutrient/
Food
Study Design Study Group Intervention Diagnosis Outcomes Reference
Fish oil Double blind
RCT
420 (218 FO,
202 placebo)
infants with
allergic
mothers.
Infants received FO supplement
(280 mg DHA and 110 mg EPA)
or placebo (olive oil) for 6M
Blood samples taken at
6M. Clinical examination
at 6 and 12M. SPT at 12M.
Plasma/ erythrocyte DHA/EPA higher
in FO group, erythrocyte AA lower.
No difference in allergic outcomes
between 2 groups at 12M. Infants
with higher erythrocyte EPA and
higher EPA:AA, higher DHA at 6M
less likely to develop eczema at 12M.
Higher plasma DHA and total n-3
PUFA at 6M associated with reduced
risk of recurrent wheeze at 12M.
D’Vaz, et al.
(2012b)
Australia
Full cream/
milk
products/
butter/ Fish
Prospective
birth cohort
study
3291 infants No intervention FFQ data at 2Y and asthma
reported symptoms at 3Y.
Daily consumption of full cream
milk, milk products and butter at 2Y
significantly associated with low rates
of asthma and wheeze at 3Y. Eating
fish at least once a week at 2Y not
associated with asthma or wheeze at
3Y.
Wijga, et al.
(2003)
Netherlands
GLA Double blind
randomized
placebo
controlled trial
118 infants
with maternal
history of
atopic disease
Infants received borage oil
supplement (100 mg GLA) or
placebo (sunflower oil) daily for
the first 6M of life (FF from 2W)
Blood collected at 1W, 3, 6
and 12M. Test for total IgE
and allergen tests at 1Y.
Clinical diagnosis of AD at
1Y by dermatologist.
At 3 and 6 M GLA, DGLA and AA
were higher in the borage oil group.
IgE concentrations and positive
allergen tests did not differ. No
association with presence of AD.
Van Gool, et
al. (2002)
Netherlands
n-3
supplements
and oils
RCT 554 infants at
high risk of
asthma
Dietary intervention group: n-3
rich tuna fish oil supplement (500
mg; 184 mg n-3; 30 mg EPA,
128mg DHA) to give to child
from 6M to 5Y (if bottle fed <
6M added to formula). Canola
oils and spreads for food
preparation. Control: Sunola oil
supplements and poly unsaturated
oils and spreads for food
preparation
At 18M clinical assessment
by a nurse, interview
administered questionnaire
to parents, 3D weighed
food record. SPT, blood
collection for total serum
IgE, PBMC and plasma
FA.
n-3 FA proportion higher in plasma of
the intervention group, n-6 FA
proportion higher in control group. n-
3:n-6; intervention 1:5, control 1:7.14.
The intervention group showed 9.8%
reduction in prevalence of any
wheeze, 7.8% reduction in prevalence
of wheeze > 1/W. No effect on serum
IgE concentration, atopy or doctor
diagnosed asthma.
Mihrshahi,
et al. (2003)
Australia
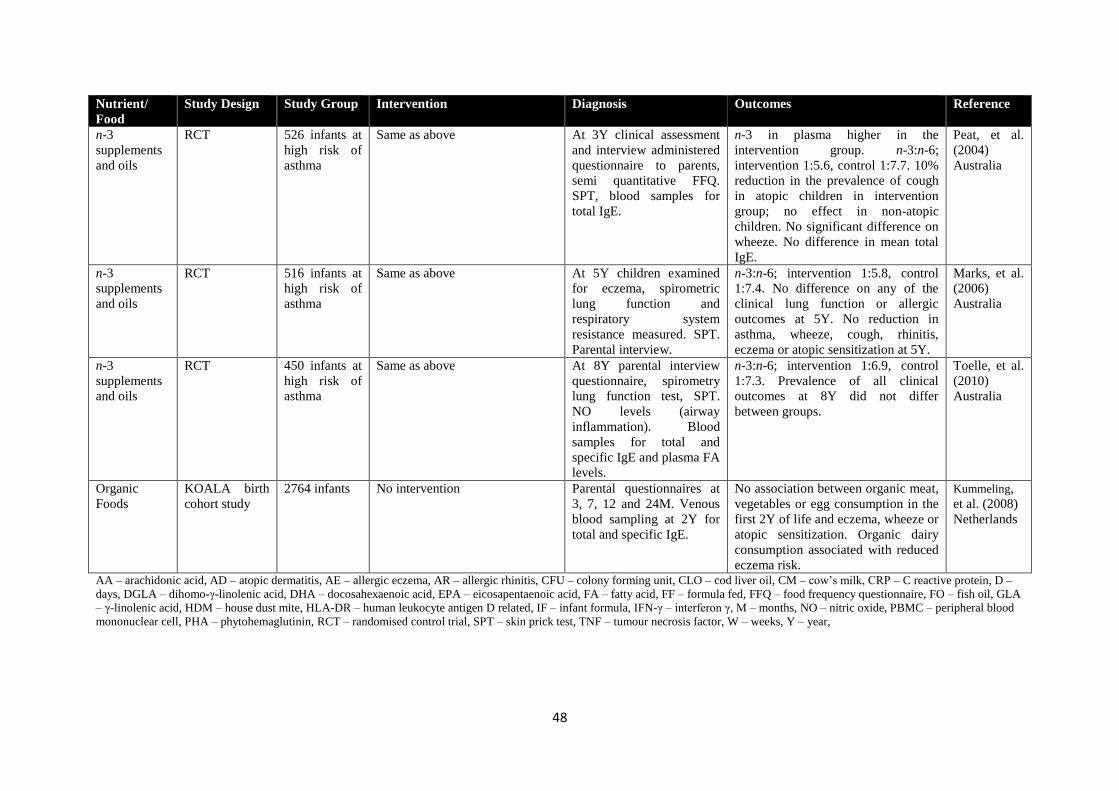
48
Nutrient/
Food
Study Design Study Group Intervention Diagnosis Outcomes Reference
n-3
supplements
and oils
RCT 526 infants at
high risk of
asthma
Same as above At 3Y clinical assessment
and interview administered
questionnaire to parents,
semi quantitative FFQ.
SPT, blood samples for
total IgE.
n-3 in plasma higher in the
intervention group. n-3:n-6;
intervention 1:5.6, control 1:7.7. 10%
reduction in the prevalence of cough
in atopic children in intervention
group; no effect in non-atopic
children. No significant difference on
wheeze. No difference in mean total
IgE.
Peat, et al.
(2004)
Australia
n-3
supplements
and oils
RCT 516 infants at
high risk of
asthma
Same as above At 5Y children examined
for eczema, spirometric
lung function and
respiratory system
resistance measured. SPT.
Parental interview.
n-3:n-6; intervention 1:5.8, control
1:7.4. No difference on any of the
clinical lung function or allergic
outcomes at 5Y. No reduction in
asthma, wheeze, cough, rhinitis,
eczema or atopic sensitization at 5Y.
Marks, et al.
(2006)
Australia
n-3
supplements
and oils
RCT 450 infants at
high risk of
asthma
Same as above At 8Y parental interview
questionnaire, spirometry
lung function test, SPT.
NO levels (airway
inflammation). Blood
samples for total and
specific IgE and plasma FA
levels.
n-3:n-6; intervention 1:6.9, control
1:7.3. Prevalence of all clinical
outcomes at 8Y did not differ
between groups.
Toelle, et al.
(2010)
Australia
Organic
Foods
KOALA birth
cohort study
2764 infants No intervention Parental questionnaires at
3, 7, 12 and 24M. Venous
blood sampling at 2Y for
total and specific IgE.
No association between organic meat,
vegetables or egg consumption in the
first 2Y of life and eczema, wheeze or
atopic sensitization. Organic dairy
consumption associated with reduced
eczema risk.
Kummeling,
et al. (2008)
Netherlands
AA – arachidonic acid, AD – atopic dermatitis, AE – allergic eczema, AR – allergic rhinitis, CFU – colony forming unit, CLO – cod liver oil, CM – cow’s milk, CRP – C reactive protein, D –
days, DGLA – dihomo-γ-linolenic acid, DHA – docosahexaenoic acid, EPA – eicosapentaenoic acid, FA – fatty acid, FF – formula fed, FFQ – food frequency questionnaire, FO – fish oil, GLA
– γ-linolenic acid, HDM – house dust mite, HLA-DR – human leukocyte antigen D related, IF – infant formula, IFN-γ – interferon γ, M – months, NO – nitric oxide, PBMC – peripheral blood
mononuclear cell, PHA – phytohemaglutinin, RCT – randomised control trial, SPT – skin prick test, TNF – tumour necrosis factor, W – weeks, Y – year,
49
2.2.7 Essential fatty acids: cardiovascular and obesity
In early studies, Greenland Eskimos were found to have lower cardiovascular disease risk,
thought to be due to their high fish intake, which is rich in n-3 LCPUFA. Furthermore
Japanese populations consume more fish than North America and they have lower rates of
myocardial infarction and atherosclerosis (Wall, et al., 2010). Individual’s cardiovascular
disease risk profile in later life is influenced by dietary habits in childhood (Uauy & Dangour,
2009). n-6 fatty acids also have the ability to promote the differentiation of pre-adipocytes
and exposure to high intakes during the period of fat cell formation either in utero or infancy
has the potential to cause excess fat deposition which could lead to obesity (Gibson, et al.,
2011). Forsyth, et al. (2003) conducted a study evaluating DHA and AA supplemented infant
formula and found lower blood pressure at 6 years of age.
Research has shown that either by increasing EPA though increasing the dietary ratio of n-
3:n-6 or by directly increasing dietary intake with EPA or DHA reduces the incidence of
numerous chronic diseases which involve inflammatory responses, such as cardiovascular
disease (Wall, et al., 2010).
2.2.8 Essential fatty acid recommendations
The human need for dietary PUFA is unquestioned but accurate definition of requirements is
needed. Most expert nutrition committees have based fatty acid recommendations on the
composition present in breast milk, the Institute of Medicine and the Food and Agriculture
Organisation recommendations are shown in Table 2.8 and suggested Actual Intakes (AI) for
infant formula and diet illustrated in Table 2.9. Recommendations for LCPUFA are difficult
to determine as they can be synthesized from precursors. Furthermore there are no plasma
concentrations or clinical tests recognised for LCPUFA deficiency or insufficiency. There is
a need to associate a functional outcome to a LCPUFA status for recommendations to be
made. An absence of LA in the diet results in growth retardation and dermatological
abnormalities and its essentiality has been recognised for many years (Gibson & Makrides,
2000). DHA may be more important for direct dietary supply due to its reduced endogenous
conversion from its precursor compared to other LCPUFA.
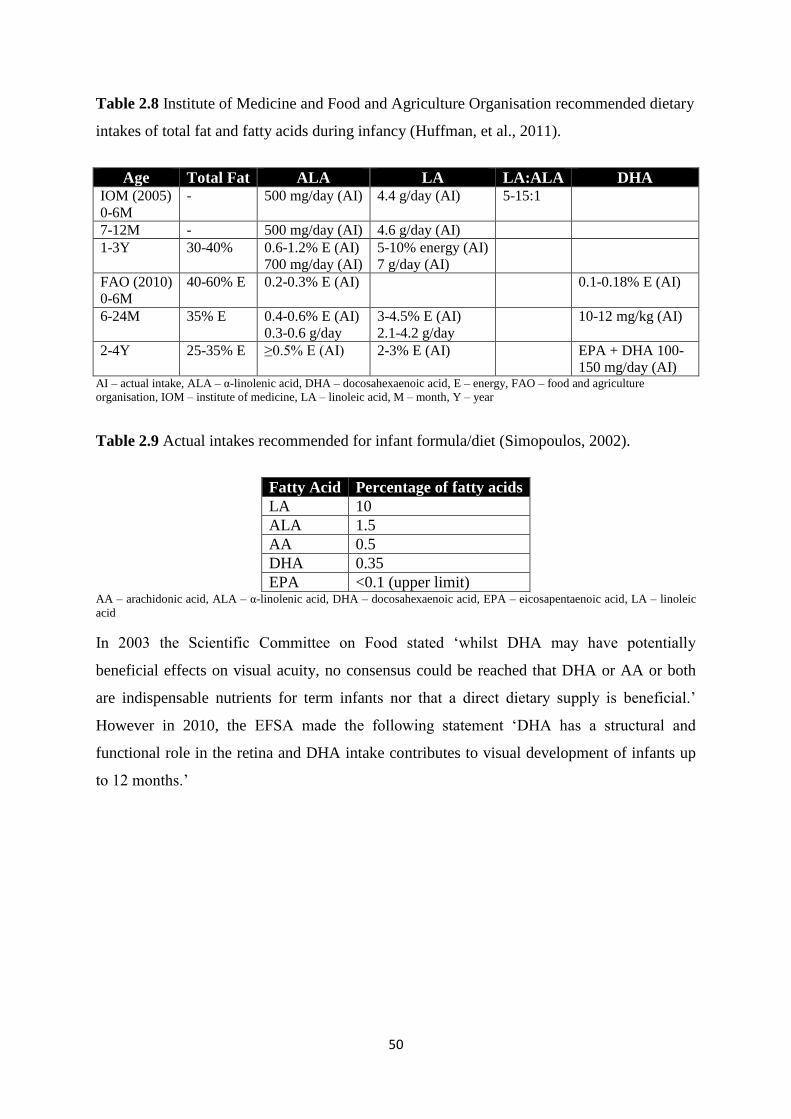
50
Table 2.8 Institute of Medicine and Food and Agriculture Organisation recommended dietary
intakes of total fat and fatty acids during infancy (Huffman, et al., 2011).
Age Total Fat ALA LA LA:ALA DHA IOM (2005)
0-6M
- 500 mg/day (AI) 4.4 g/day (AI) 5-15:1
7-12M - 500 mg/day (AI) 4.6 g/day (AI)
1-3Y 30-40% 0.6-1.2% E (AI)
700 mg/day (AI)
5-10% energy (AI)
7 g/day (AI)
FAO (2010)
0-6M
40-60% E 0.2-0.3% E (AI) 0.1-0.18% E (AI)
6-24M 35% E 0.4-0.6% E (AI)
0.3-0.6 g/day
3-4.5% E (AI)
2.1-4.2 g/day
10-12 mg/kg (AI)
2-4Y 25-35% E ≥0.5% E (AI) 2-3% E (AI) EPA + DHA 100-
150 mg/day (AI) AI – actual intake, ALA – α-linolenic acid, DHA – docosahexaenoic acid, E – energy, FAO – food and agriculture
organisation, IOM – institute of medicine, LA – linoleic acid, M – month, Y – year
Table 2.9 Actual intakes recommended for infant formula/diet (Simopoulos, 2002).
Fatty Acid Percentage of fatty acids
LA 10
ALA 1.5
AA 0.5
DHA 0.35
EPA <0.1 (upper limit) AA – arachidonic acid, ALA – α-linolenic acid, DHA – docosahexaenoic acid, EPA – eicosapentaenoic acid, LA – linoleic
acid
In 2003 the Scientific Committee on Food stated ‘whilst DHA may have potentially
beneficial effects on visual acuity, no consensus could be reached that DHA or AA or both
are indispensable nutrients for term infants nor that a direct dietary supply is beneficial.’
However in 2010, the EFSA made the following statement ‘DHA has a structural and
functional role in the retina and DHA intake contributes to visual development of infants up
to 12 months.’
51
2.3 Fat Soluble Vitamins
Vitamins are indispensable micronutrients which have numerous important roles and regulate
many biochemical functions within the body. There are 13 vitamins in total; vitamin A, D, E
and K are lipid soluble vitamins and can be stored in the body; whilst the others are water
soluble vitamins and cannot be stored in the body and therefore require a daily supply, the
functions and recommended intakes are shown in Table 2.10. Lipid soluble vitamins are
stored in fat deposits in the body, such as adipose tissue. High intakes over time should be
treated with caution as they may lead to tissue accumulation (Thompkinson & Kharb, 2007).
Vitamins are either not synthesised by the body or synthesized in inadequate amounts so are
therefore required from the diet (Fellows, 2009)
Vitamin A has functions in cell and tissue differentiation, vision and immunity. Vitamin E
primarily protects cell membranes from lipid peroxidation and has antioxidant roles. Vitamin
D’s main role has traditionally been related to bone health; however other potential functions
are now emerging. Vitamin K has blood clotting functions, (Fellows, 2009).
In the 1991/1992 NDNS half of toddlers (1.5-3 years) were receiving below Recommended
Nutrient Intake (RNI) for vitamin A, with 8% below the Lower Reference Nutrient Intake
(LRNI). However from the most recent NDNS there has been a drastic change, with
excessive feeding. At least 75% of boys over 7 months and 78% of girls are above the 50th
percentile for weight compared against the UK WHO growth standards (Lennox et al., 2013).
Consequently diet alone now provides close to or above the RNI for all vitamins, with the
exception of vitamin D (Public Health England, 2014). For the purpose of this thesis vitamin
A, D and E will be discussed in the following sections.
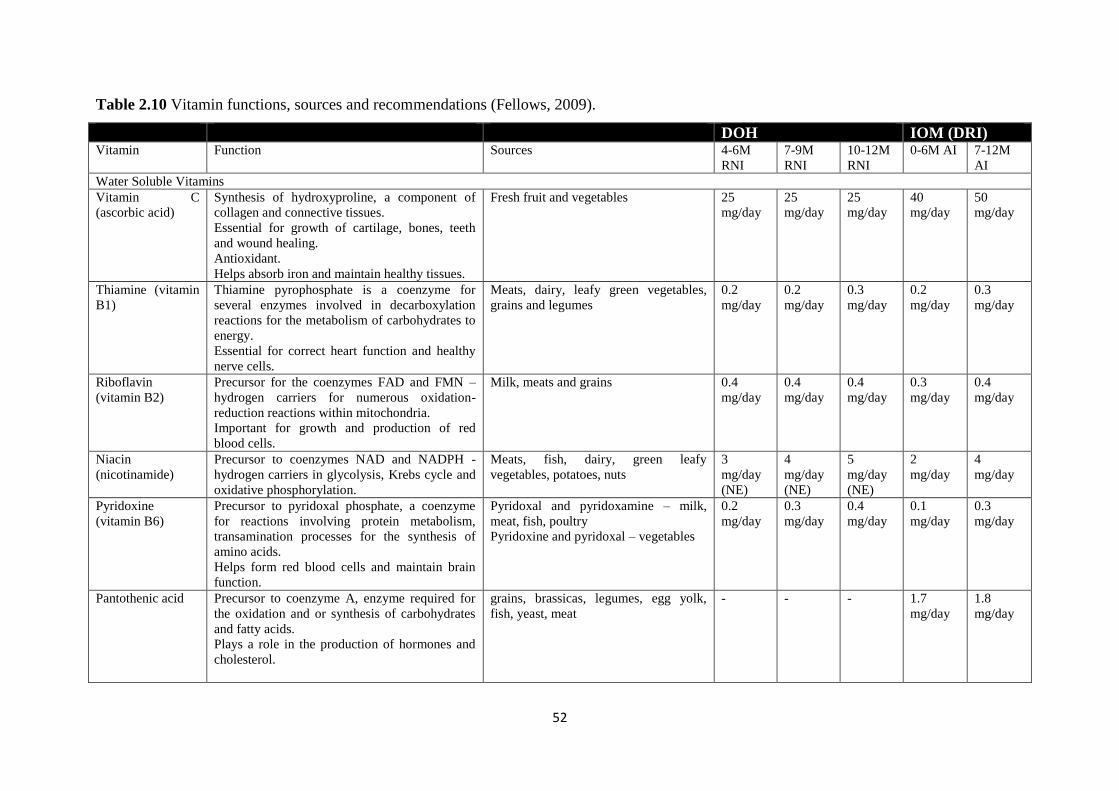
52
Table 2.10 Vitamin functions, sources and recommendations (Fellows, 2009).
DOH IOM (DRI) Vitamin Function Sources 4-6M
RNI
7-9M
RNI
10-12M
RNI
0-6M AI 7-12M
AI
Water Soluble Vitamins
Vitamin C
(ascorbic acid)
Synthesis of hydroxyproline, a component of
collagen and connective tissues.
Essential for growth of cartilage, bones, teeth
and wound healing.
Antioxidant.
Helps absorb iron and maintain healthy tissues.
Fresh fruit and vegetables 25
mg/day
25
mg/day
25
mg/day
40
mg/day
50
mg/day
Thiamine (vitamin
B1)
Thiamine pyrophosphate is a coenzyme for
several enzymes involved in decarboxylation
reactions for the metabolism of carbohydrates to
energy.
Essential for correct heart function and healthy
nerve cells.
Meats, dairy, leafy green vegetables,
grains and legumes
0.2
mg/day
0.2
mg/day
0.3
mg/day
0.2
mg/day
0.3
mg/day
Riboflavin
(vitamin B2)
Precursor for the coenzymes FAD and FMN –
hydrogen carriers for numerous oxidation-
reduction reactions within mitochondria.
Important for growth and production of red
blood cells.
Milk, meats and grains 0.4
mg/day
0.4
mg/day
0.4
mg/day
0.3
mg/day
0.4
mg/day
Niacin
(nicotinamide)
Precursor to coenzymes NAD and NADPH -
hydrogen carriers in glycolysis, Krebs cycle and
oxidative phosphorylation.
Meats, fish, dairy, green leafy
vegetables, potatoes, nuts
3
mg/day
(NE)
4
mg/day
(NE)
5
mg/day
(NE)
2
mg/day
4
mg/day
Pyridoxine
(vitamin B6)
Precursor to pyridoxal phosphate, a coenzyme
for reactions involving protein metabolism,
transamination processes for the synthesis of
amino acids.
Helps form red blood cells and maintain brain
function.
Pyridoxal and pyridoxamine – milk,
meat, fish, poultry
Pyridoxine and pyridoxal – vegetables
0.2
mg/day
0.3
mg/day
0.4
mg/day
0.1
mg/day
0.3
mg/day
Pantothenic acid Precursor to coenzyme A, enzyme required for
the oxidation and or synthesis of carbohydrates
and fatty acids.
Plays a role in the production of hormones and
cholesterol.
grains, brassicas, legumes, egg yolk,
fish, yeast, meat
- - - 1.7
mg/day
1.8
mg/day
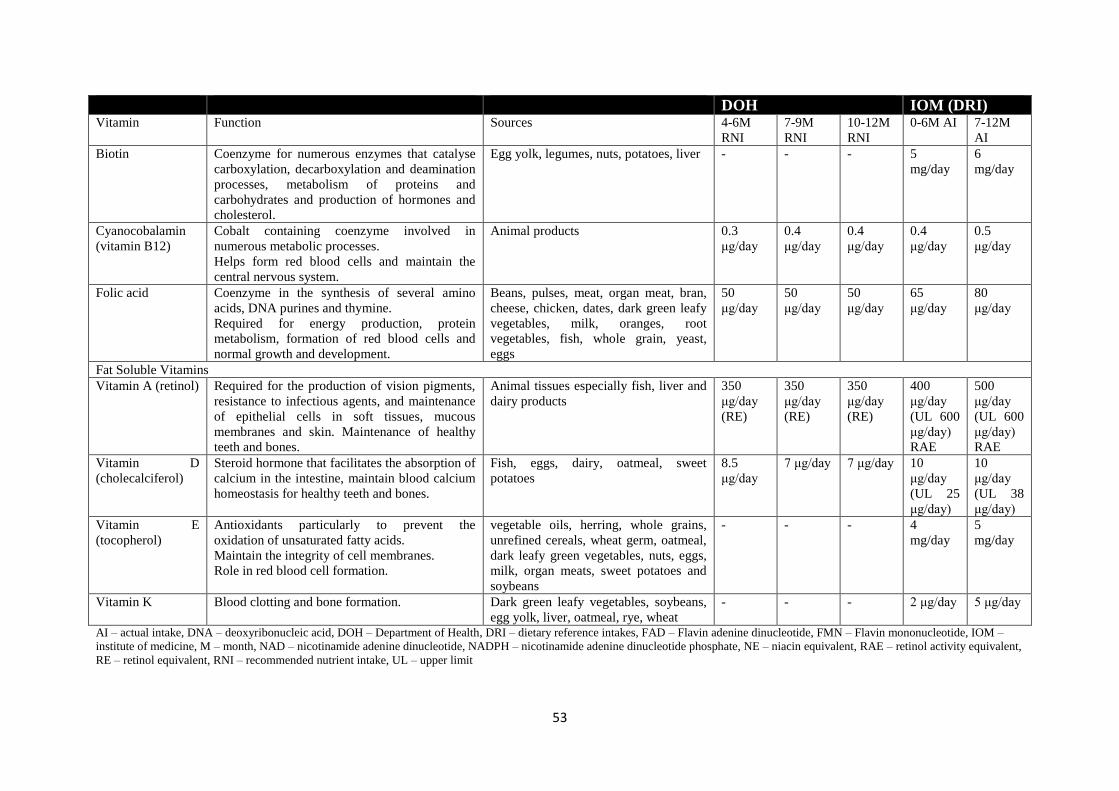
53
DOH IOM (DRI) Vitamin Function Sources 4-6M
RNI
7-9M
RNI
10-12M
RNI
0-6M AI 7-12M
AI
Biotin Coenzyme for numerous enzymes that catalyse
carboxylation, decarboxylation and deamination
processes, metabolism of proteins and
carbohydrates and production of hormones and
cholesterol.
Egg yolk, legumes, nuts, potatoes, liver - - - 5
mg/day
6
mg/day
Cyanocobalamin
(vitamin B12)
Cobalt containing coenzyme involved in
numerous metabolic processes.
Helps form red blood cells and maintain the
central nervous system.
Animal products 0.3
μg/day
0.4
μg/day
0.4
μg/day
0.4
μg/day
0.5
μg/day
Folic acid Coenzyme in the synthesis of several amino
acids, DNA purines and thymine.
Required for energy production, protein
metabolism, formation of red blood cells and
normal growth and development.
Beans, pulses, meat, organ meat, bran,
cheese, chicken, dates, dark green leafy
vegetables, milk, oranges, root
vegetables, fish, whole grain, yeast,
eggs
50
μg/day
50
μg/day
50
μg/day
65
μg/day
80
μg/day
Fat Soluble Vitamins
Vitamin A (retinol) Required for the production of vision pigments,
resistance to infectious agents, and maintenance
of epithelial cells in soft tissues, mucous
membranes and skin. Maintenance of healthy
teeth and bones.
Animal tissues especially fish, liver and
dairy products
350
μg/day
(RE)
350
μg/day
(RE)
350
μg/day
(RE)
400
μg/day
(UL 600
μg/day)
RAE
500
μg/day
(UL 600
μg/day)
RAE
Vitamin D
(cholecalciferol)
Steroid hormone that facilitates the absorption of
calcium in the intestine, maintain blood calcium
homeostasis for healthy teeth and bones.
Fish, eggs, dairy, oatmeal, sweet
potatoes
8.5
μg/day
7 μg/day 7 μg/day 10
μg/day
(UL 25
μg/day)
10
μg/day
(UL 38
μg/day)
Vitamin E
(tocopherol)
Antioxidants particularly to prevent the
oxidation of unsaturated fatty acids.
Maintain the integrity of cell membranes.
Role in red blood cell formation.
vegetable oils, herring, whole grains,
unrefined cereals, wheat germ, oatmeal,
dark leafy green vegetables, nuts, eggs,
milk, organ meats, sweet potatoes and
soybeans
- - - 4
mg/day
5
mg/day
Vitamin K Blood clotting and bone formation. Dark green leafy vegetables, soybeans,
egg yolk, liver, oatmeal, rye, wheat
- - - 2 μg/day 5 μg/day
AI – actual intake, DNA – deoxyribonucleic acid, DOH – Department of Health, DRI – dietary reference intakes, FAD – Flavin adenine dinucleotide, FMN – Flavin mononucleotide, IOM –
institute of medicine, M – month, NAD – nicotinamide adenine dinucleotide, NADPH – nicotinamide adenine dinucleotide phosphate, NE – niacin equivalent, RAE – retinol activity equivalent,
RE – retinol equivalent, RNI – recommended nutrient intake, UL – upper limit
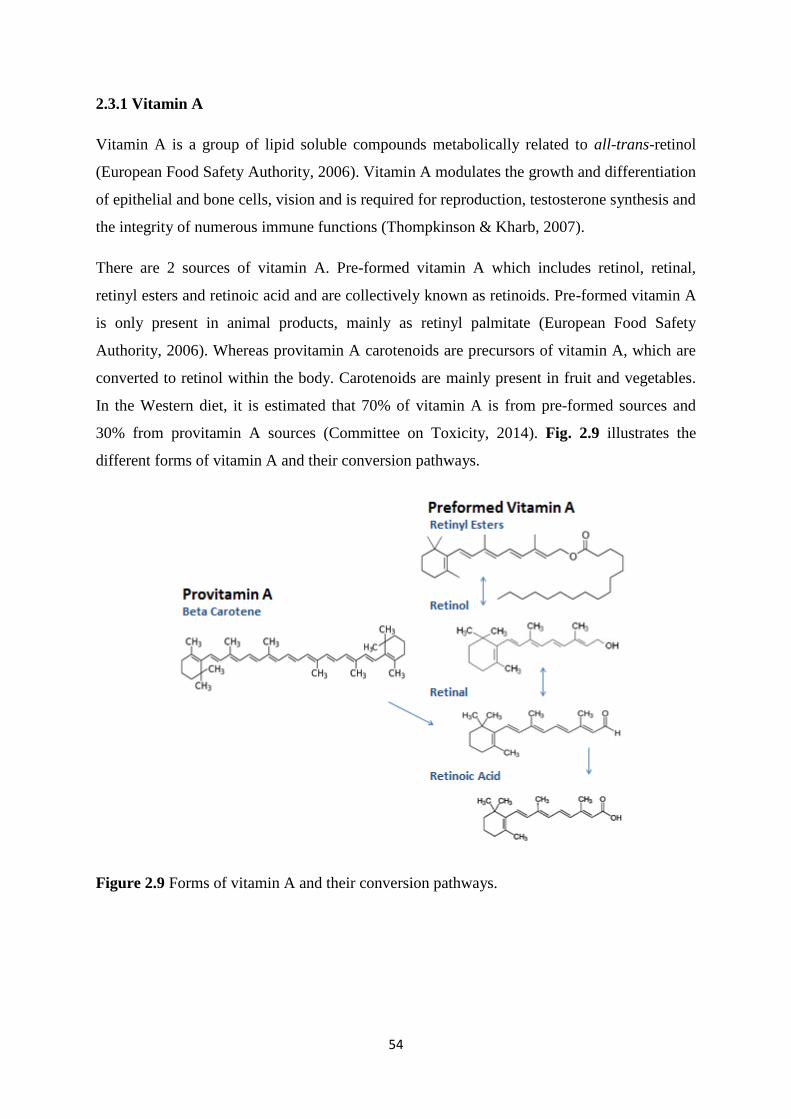
54
2.3.1 Vitamin A
Vitamin A is a group of lipid soluble compounds metabolically related to all-trans-retinol
(European Food Safety Authority, 2006). Vitamin A modulates the growth and differentiation
of epithelial and bone cells, vision and is required for reproduction, testosterone synthesis and
the integrity of numerous immune functions (Thompkinson & Kharb, 2007).
There are 2 sources of vitamin A. Pre-formed vitamin A which includes retinol, retinal,
retinyl esters and retinoic acid and are collectively known as retinoids. Pre-formed vitamin A
is only present in animal products, mainly as retinyl palmitate (European Food Safety
Authority, 2006). Whereas provitamin A carotenoids are precursors of vitamin A, which are
converted to retinol within the body. Carotenoids are mainly present in fruit and vegetables.
In the Western diet, it is estimated that 70% of vitamin A is from pre-formed sources and
30% from provitamin A sources (Committee on Toxicity, 2014). Fig. 2.9 illustrates the
different forms of vitamin A and their conversion pathways.
Figure 2.9 Forms of vitamin A and their conversion pathways.
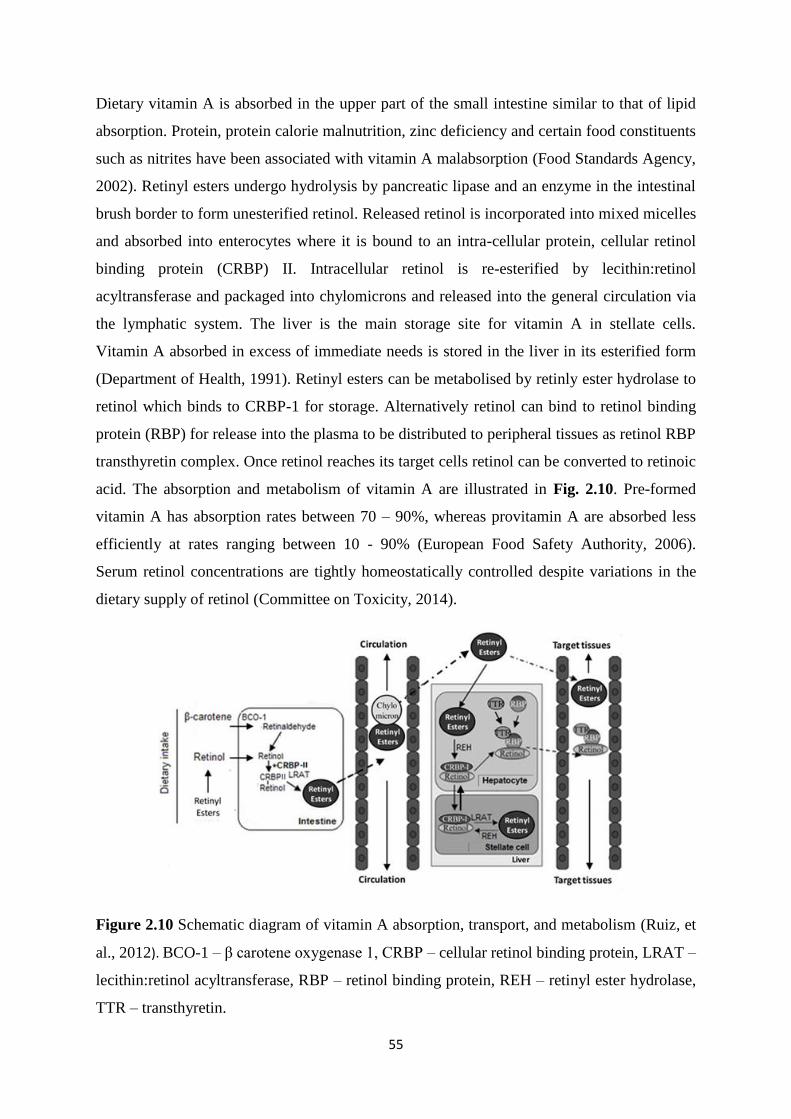
55
Dietary vitamin A is absorbed in the upper part of the small intestine similar to that of lipid
absorption. Protein, protein calorie malnutrition, zinc deficiency and certain food constituents
such as nitrites have been associated with vitamin A malabsorption (Food Standards Agency,
2002). Retinyl esters undergo hydrolysis by pancreatic lipase and an enzyme in the intestinal
brush border to form unesterified retinol. Released retinol is incorporated into mixed micelles
and absorbed into enterocytes where it is bound to an intra-cellular protein, cellular retinol
binding protein (CRBP) II. Intracellular retinol is re-esterified by lecithin:retinol
acyltransferase and packaged into chylomicrons and released into the general circulation via
the lymphatic system. The liver is the main storage site for vitamin A in stellate cells.
Vitamin A absorbed in excess of immediate needs is stored in the liver in its esterified form
(Department of Health, 1991). Retinyl esters can be metabolised by retinly ester hydrolase to
retinol which binds to CRBP-1 for storage. Alternatively retinol can bind to retinol binding
protein (RBP) for release into the plasma to be distributed to peripheral tissues as retinol RBP
transthyretin complex. Once retinol reaches its target cells retinol can be converted to retinoic
acid. The absorption and metabolism of vitamin A are illustrated in Fig. 2.10. Pre-formed
vitamin A has absorption rates between 70 – 90%, whereas provitamin A are absorbed less
efficiently at rates ranging between 10 - 90% (European Food Safety Authority, 2006).
Serum retinol concentrations are tightly homeostatically controlled despite variations in the
dietary supply of retinol (Committee on Toxicity, 2014).
Figure 2.10 Schematic diagram of vitamin A absorption, transport, and metabolism (Ruiz, et
al., 2012). BCO-1 – β carotene oxygenase 1, CRBP – cellular retinol binding protein, LRAT –
lecithin:retinol acyltransferase, RBP – retinol binding protein, REH – retinyl ester hydrolase,
TTR – transthyretin.
56
Retinol can be oxidised to retinal by the actions of cytosolic and microsomal retinol
dehydrogenases (alcohol dehydrogenase); and retinal can be converted back to retinol (retinal
reductase). Retinal can be irreversibly oxidised to retinoic acid by retinalaldehyde
dehydrogenase and cytochrome P450 enzymes (European Food Safety Authority, 2006).
Retinoic acid is transported to cells via cellular retinoic acid binding protein to interact with
nuclear receptors (Committee on Toxicity, 2014). Retinoic acid regulates gene expression by
binding to specific nuclear receptors, retinoic acid receptors (RAR) and retinoid X receptors
(RXR); upon ligand binding nuclear receptors bind to specific response elements on DNA.
Activated receptors bind with themselves, with each other and other receptors of the same
superfamily (vitamin D receptor (VDR), thyroid hormone receptor, PPAR) (European Food
Safety Authority, 2006).
After cellular uptake and binding to specific cytosolic proteins retinol acts as a ligand and
activator of several nuclear receptors; modulating gene expression and regulating the
synthesis of proteins and enzymes (Scientific Committee on Food, 2003).
Retinal is the chromophore of rhodopsin, which is the visual pigment of cone cells of the
pigmented epithelium of the retina. The photo induced isomerization of 11-cis retinal into all-
trans retinal is the initial event in the photo transduction cascade, which results in the
production of a signal to the ocular nerves (European Food Safety Authority, 2006). Retinoic
acid maintains normal differentiation of the cornea in the eye, therefore is also important for
vision (Committee on Toxicity, 2012).
Rodent studies have linked vitamin A nutrition and altered retinoid signalling with cognitive
behaviour due to retinoid receptors being located within the hippocampus of the brain, which
is an area that is important for memory. Retinoids control the differentiation of neurons and a
role in memory and sleep has been suggested (Benton, 2008). Bone health has also been
linked to vitamin A, as both vitamin A receptors and the VDR will compete for dimerization
with RXR, affecting the influence of vitamin D on bone mineralization and calcium uptake
(European Food Safety Authority, 2006).
Vitamin A has been reported to have an important role in inducing the expression of the gut
homing chemokine CCR9 and α4β7 integrin during T cell activation; impaired gut immune
responses in early infancy may contribute to the development of atopic sensitization. In vitro
retinoic acid can inhibit IL-4 mediated proliferation and IgE production by B cells. Retinoic
acid is also required by dendritic cells for the induction of forkhead box P3 regulatory T cells
57
(T reg) from CD4+ T cells and is a regulator of the induction of IgA secretion (Cunningham-
Rundles, et al., 2009). Pesonen, et al. (2007) looked at plasma retinol concentrations of
Finnish infants and their subsequent development of allergic symptoms in childhood and
adulthood; they found that lower retinol concentrations at 2 months were inversely correlated
with positive skin prick tests at 5 and 20 years and allergic symptoms at 20 years. Infants in
the study received 1000 IU/day of vitamin A which is the national recommended dose in
Finland for infants, therefore dietary deficiency of vitamin A was unlikely. The infants in the
study were all on a similar diet (exclusive breastfeeding) at the time that retinol differences
were measured. It is possible, therefore, that a new-born infant with low concentrations of
retinol could cause CD4+ T cell homing to the gut to be inhibited, which could cause Th1 type
responses to become weak and produce an environment favourable towards the development
of allergic sensitization.
Vitamin A deficiency is common in young children in developing countries resulting in
blindness and infant mortality (Department of Health, 1991). However in developed countries
such as the UK deficiency does not appear to be an issue according to the NDNS, where
excess intakes may pose more of a threat to health. Mean intakes of vitamin A from food
sources were close to or above the RNI for all age groups, the major contributor being milk
and milk products (Public Health England, 2014). Also in the US 35% of toddlers exceed the
Tolerable Upper Intake Level (UL) (600 μg retinol activity equivalent/day), which was
additionally found to be consistent with results from the National Health and Nutrition
Examination Survey III survey (Butte, et al., 2010). Classical symptoms of vitamin A
deficiency include night blindness, xerophthalmia, growth retardation, skin disorders and
impaired immune function. Hypervitaminosis can occur when the capacity of the stellate cells
is saturated or when the amount of vitamin A in plasma exceeds the capacity of the RBP.
High intakes of pre-formed vitamin A can be toxic, however high intakes from provitamin A
such as β-carotene have not been found to cause toxicity but can lead to a yellow appearance.
Clinical features of toxicity include anorexia, bulging fontanelles which are caused by
increased cerebrospinal fluid volume, drowsiness, lethargy, irritability, vomiting, raised
intracranial pressure, alopecia, bone and joint pain, hepatotoxicity, anaemia, photophobia,
conjunctivitis and skin desquamation. It can also decrease vitamin C storage, antagonise the
action of vitamin K’s blood clotting functions and have anti-thyroid effects (Committee on
Toxicity, 2014). Toxicity of vitamin A usually arises from chronic ingestion over a period of
time, which will build up stocks that exceed the livers ability to destroy or store them. A
58
relationship has been found between high intakes of vitamin A during pregnancy and birth
defects in infants (Department of Health, 1991).
In the UK vitamin A requirements are expressed as retinol equivalents (RE), which takes into
account the activity of different forms of vitamin A in comparison to retinol activity, Table
2.11 shows the conversion factors of the different forms of vitamin A (Food Standards
Agency, 2002). Vitamin A recommendations for infants are based on concentrations from
breast milk as breastfed infants do not show signs of vitamin A deficiency. The breast milk of
well-nourished women in Europe ranges between 40-70 μg RE/100 mL. Infant and follow on
formula regulations allow 60-180 μg RE/100 mL to be added (Committee on Toxicity, 2014).
Retinol, retinyl acetate and retinyl palmitate are used in infant formula (Thompkinson &
Kharb, 2007).
Table 2.11 Conversion factors for the different forms of vitamin A into retinol equivalents
(Food Standards Agency, 2002).
Vitamin A Retinol Equivalents
1 μg Retinyl palmitate 0.55 μg RE
1 μg Retinyl acetate 0.87 μg RE
1 μg β carotene 0.17 μg RE
1 μg other carotenoids 0.083 μg RE RE – retinol equivalents
Retinol is teratogenic (Department of Health, 1991). In the UK Pregnant women are advised
not to consume liver or liver products as they contain large amounts of retinol which can be
harmful to the baby, furthermore infants over 6 months are advised not to have more than 1
portion of liver per week (Committee on Toxicity, 2014).
During food processing retinoids and carotenoids can undergo isomerization due to exposure
with acids, heat and light. Thermal treatment can either cause isomerization from trans to cis
isomers or oxidation. However heating can also promote carotenoid absorption, possibly due
to the release of carotenoids from its matrix. Homogenization of foods can also improve the
availability of carotenoids. Processing methods such as dehydration, blanching and canning
can cause either oxidation or isomerization of carotenoids (Klein & Kurilich, 2000). However
retinol and carotenoids have been found to be relatively stable throughout most cooking
procedures with industrial food processes such as pasteurization and sterilization generally
only resulting in small losses (Committee on Toxicity, 2012).
59
2.3.2 Carotenoids
β-Carotene and carotenoids are isoprenoid compounds which are not synthesised in animals,
but biosynthesised in plants and microorganisms. Around 700 naturally occurring carotenoids
have been identified, with around 10% being present in the human diet and around 50 having
provitamin A activity. The predominant carotenoids present in human plasma are β-carotene,
α-carotene, lycopene, lutein and β-cryptoxanthin (European Food Safety Authority, 2006).
The carotenoid β-carotene has the most vitamin A activity as it can be converted into 2 retinal
molecules and it is also widely available in the diet (Committee on Toxicity, 2014).
β-Carotene is a hydrocarbon (C40H56). Carotenoids which contain at least one unsubstituted
β-ionone ring and a polyene chain are potential precursors of vitamin A. Carotenoid functions
include radical quenching, antioxidant and anti-carcinogenic activities and regulators of cell
function. Carotenoids can act as free radical and reactive species scavengers. They have been
reported to modulate cytochrome P450 metabolism, inhibit AA metabolism and inhibit
chromosome instability (European Food Safety Authority, 2006). Epidemiological studies
have associated high carotenoid intake with lower cancer and cardiovascular disease
incidence (Scientific Committee on Food, 2006).
Initially β-carotene is dissolved in lipid droplets in the stomach and passes into the duodenum
where it is taken up into micelles (Committee on Toxicity, 2014). β-Carotene is absorbed in
the intestine via passive diffusion of mixed micelles, which have been formed during fat
digestion in the presence of bile acids, Fig. 2.10 (European Food Safety Authority, 2006).
Like retinol provitamin A are taken up by enterocytes (Committee on Toxicity, 2014). In
general the types and amounts in the plasma reflect those in the diet. In the literature the
absorption of β-carotene varies widely between 10-90%, with the most critical step being the
release from the food matrix into the lipid phase and solubilization within mixed micelles.
They are transported in association with lipoproteins with similar distribution to cholesterol.
The adipose tissue and liver are the main storage sites for carotenoids (European Food Safety
Authority, 2006).
60
In mammalian tissues β-carotene can be cleaved mainly at the central double bond (C15,15’)
to yield 2 retinal molecules; which can either be reduced to retinol or further oxidised to
retinoic acid. Alternatively a non-central cleavage at eccentric double bonds to form retinoids
or apo-B-carotenoids can occur (European Food Safety Authority, 2006). Carotenoids are
converted to retinal by β-carotene monooxygenase (BCMO) 1; they can also be converted to
apocarotenal by BCMO2, which is subsequently converted to apro carotenoic acid and finally
retinoic acid (Committee on Toxicity, 2014).
The bioavailability of carotenoids is dependent on the food structure, species of carotenoid,
linkages to alkyl groups, amount of carotenoid present in the food, matrix properties of the
plant the carotenoid is contained in, nutritional status of the individual, genetics and food
preparation method (Committee on Toxicity, 2014). For example cooking and chopping of
foods containing carotenoids may enhance their absorption due to increasing the ease that
carotenoids are extracted from the food matrix (Food Standards Agency, 2002).
One study among smokers and asbestos workers associated an increase in lung cancer with
high dose of β-carotene supplements. However the toxicity of carotenoids differs to that of
retinoids and they are not considered to be toxic due to reduction in their conversion when
vitamin A levels are high (European Food Safety Authority, 2006).
The rate of absorption and bioequivalence to retinol of β-carotene and other carotenoids is
unknown in infants (Scientific Committee on Food, 2003), partly due to varied release of
carotenoids from different food matrixes and different processing effects, along with the
biological effects of absorption and conversion. Therefore there is insufficient evidence to set
recommendations for carotenoids and conversion factors should be used with caution
(Department of Health, 1991).
61
2.3.3 Vitamin E
There are 8 naturally occurring fat soluble compounds, known as tocochromanols, with
vitamin E activity which exhibit antioxidant activity and are nutritionally essential; Fig. 2.11
illustrates the 8 different forms of vitamin E. There are 2 types of tocochromonals:
tocopherols (α, β, γ and δ) and tocotrienols (α, β, γ and δ), which are biologically less potent.
The basic structural unit is composed of a chroman ring system (2-methyl-6-
hydroxychroman) with an isoprenoid side chain of 16 carbon atoms. α, β, γ and δ differ in
number and position of the methyl substituents on the chroman ring. Tocopherols differ to
tocotrienols by having a saturated side chain. The presence of the phenolic hydroxyl group is
important for vitamin E’s antioxidant activity. α-tocopherol is the most active isomer and
accounts for the majority of vitamin E present in human tissues, followed by β, γ and then δ.
Animal models and epidemiological studies have suggested that vitamin E may protect
against cancer and prevention of coronary heart disease (European Food Safety Authority,
2006).
Vitamin E is synthesised by plants, one of the richest sources being plant oils. The most
biologically active form of vitamin E is α-tocopherol, which is also the most abundant form
in the European diet due to the use of olive and sunflower oil. Whereas in the US diet
γ-tocopherol is the most abundant form of vitamin E due to the use of soybean and corn oil.
The least abundant forms of vitamin E in foods are the tocotrienols (Stone, et al., 2003).
The biological activity of vitamin E is mainly related to its antioxidant properties and acts as
a major lipid soluble antioxidant in membranes. The first vitamin E deficiency state was
clearly demonstrated in premature infants with clinical states displaying haemolytic anaemia,
thrombocytosis and oedema (Department of Health, 1991).
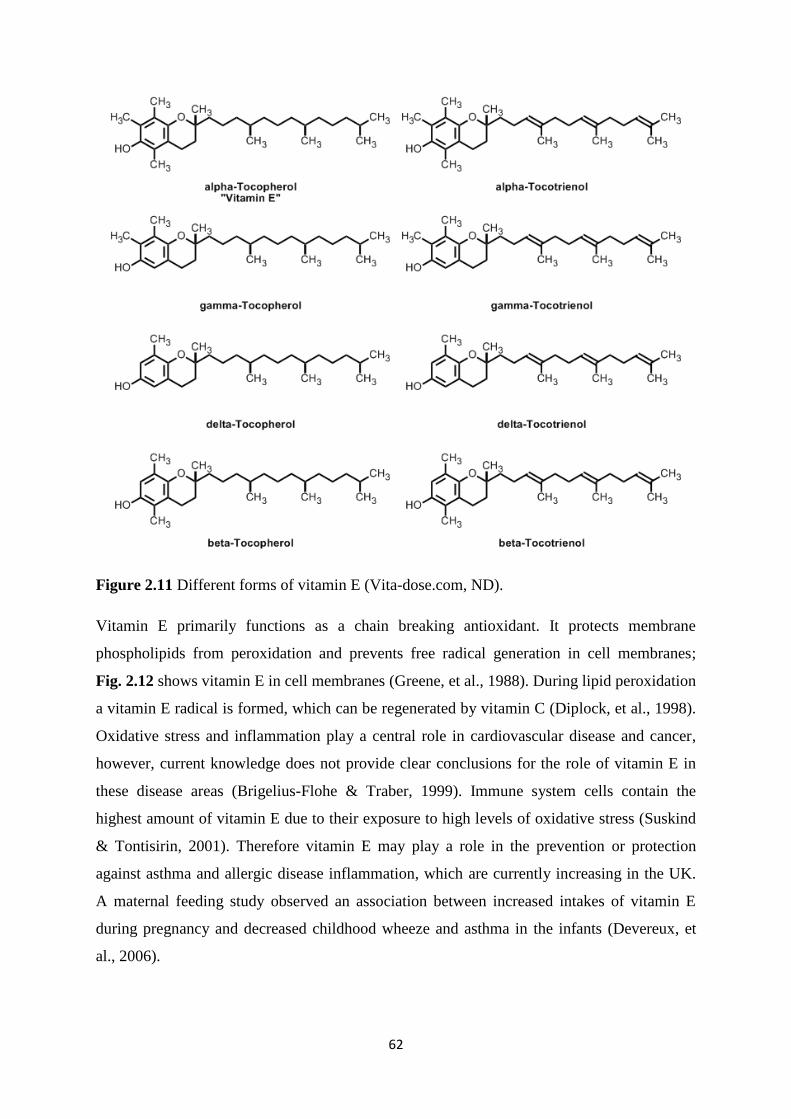
62
Figure 2.11 Different forms of vitamin E (Vita-dose.com, ND).
Vitamin E primarily functions as a chain breaking antioxidant. It protects membrane
phospholipids from peroxidation and prevents free radical generation in cell membranes;
Fig. 2.12 shows vitamin E in cell membranes (Greene, et al., 1988). During lipid peroxidation
a vitamin E radical is formed, which can be regenerated by vitamin C (Diplock, et al., 1998).
Oxidative stress and inflammation play a central role in cardiovascular disease and cancer,
however, current knowledge does not provide clear conclusions for the role of vitamin E in
these disease areas (Brigelius-Flohe & Traber, 1999). Immune system cells contain the
highest amount of vitamin E due to their exposure to high levels of oxidative stress (Suskind
& Tontisirin, 2001). Therefore vitamin E may play a role in the prevention or protection
against asthma and allergic disease inflammation, which are currently increasing in the UK.
A maternal feeding study observed an association between increased intakes of vitamin E
during pregnancy and decreased childhood wheeze and asthma in the infants (Devereux, et
al., 2006).

63
Figure 2.12 Vitamin E in cell membranes (Papas, 1999).
Absorption of vitamin E in the lumen part of the small intestine into enterocytes is via passive
diffusion which finally enters the circulation via the lymphatic system (European Food Safety
Authority, 2008). Vitamin E is absorbed with lipids, which are subsequently packed into
chylomicrons and transported to the liver (Brigelius-Flohe & Traber, 1999). After passage
through the liver α-tocopherol transport protein (α-TTP) selects α-tocopherol (Stone, et al.,
2003). Intestinal absorption of fat soluble vitamins depends on pancreatic function, biliary
secretions to form micelles and transfer across the intestinal membrane. Dietary vitamin E is
absorbed in the small intestine following its uptake into mixed micelles, which requires the
presence of bile acids and pancreatic enzymes to form monoglycerides that are incorporated
into micelles. Prior to absorption vitamin E esters need to be hydrolysed by the action of bile
salt stimulated lipase or pancreatic lipolytic activity. The absorption of vitamin E appears to
be passive with no specific carrier; Fig. 2.13 illustrates the absorption and excretion of
vitamin E (Thompkinson & Kharb, 2007). After absorption tocopherols are incorporated into
triglyceride rich proteins, such as lipoproteins, chylomicrons and very low density
lipoproteins. After triglyceride lipolysis most circulating vitamin E is found in cholesterol
rich lipoproteins, such as low density lipoproteins and high density lipoproteins allowing
uptake into tissues (Scientific Committee on Food, 2003). Absorption of vitamin E varies
widely in the literature between 20-80%, which is highly dependent on the dose and lipid
content of the diet. High pectin, wheat bran and PUFA intakes reduce vitamin E absorption
(Food Standards Agency, 2002). Nearly all of the vitamin E absorbed across the intestinal
mucosa is free tocopherol which can be transported via the lymphatic system into the blood
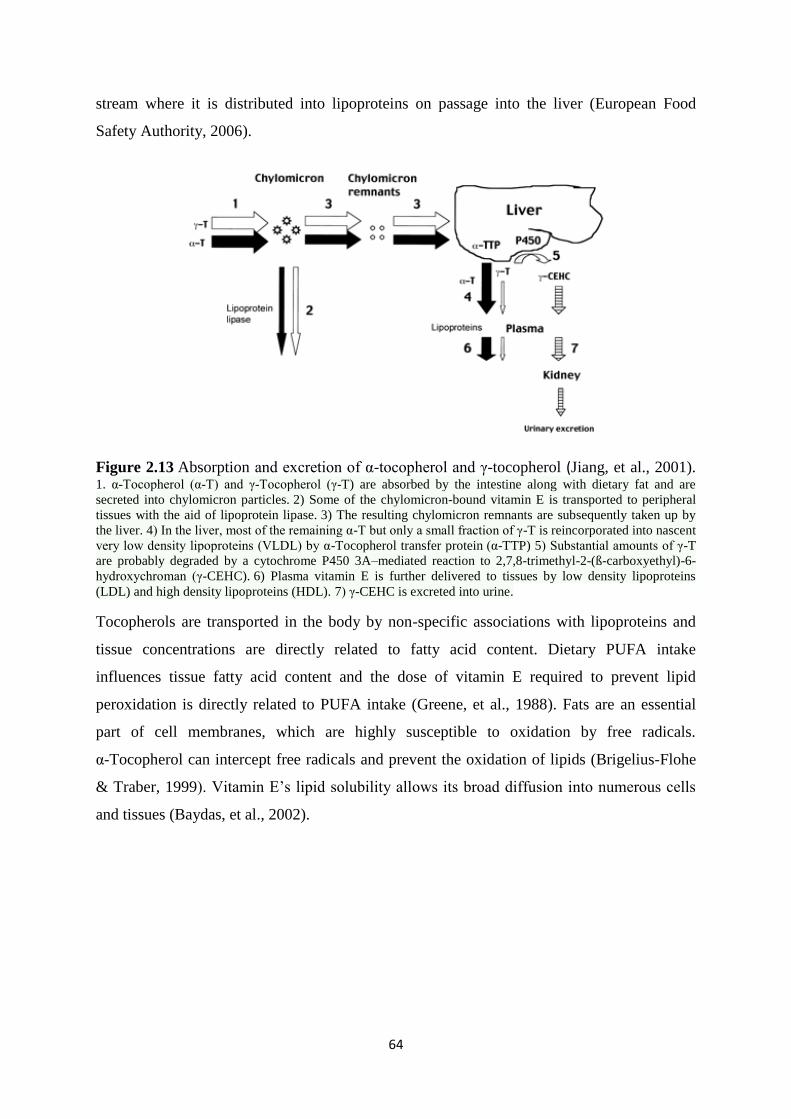
64
stream where it is distributed into lipoproteins on passage into the liver (European Food
Safety Authority, 2006).
Figure 2.13 Absorption and excretion of α-tocopherol and γ-tocopherol (Jiang, et al., 2001). 1. α-Tocopherol (α-T) and γ-Tocopherol (γ-T) are absorbed by the intestine along with dietary fat and are
secreted into chylomicron particles. 2) Some of the chylomicron-bound vitamin E is transported to peripheral
tissues with the aid of lipoprotein lipase. 3) The resulting chylomicron remnants are subsequently taken up by
the liver. 4) In the liver, most of the remaining α-T but only a small fraction of γ-T is reincorporated into nascent
very low density lipoproteins (VLDL) by α-Tocopherol transfer protein (α-TTP) 5) Substantial amounts of γ-T
are probably degraded by a cytochrome P450 3A–mediated reaction to 2,7,8-trimethyl-2-(ß-carboxyethyl)-6-
hydroxychroman (γ-CEHC). 6) Plasma vitamin E is further delivered to tissues by low density lipoproteins
(LDL) and high density lipoproteins (HDL). 7) γ-CEHC is excreted into urine.
Tocopherols are transported in the body by non-specific associations with lipoproteins and
tissue concentrations are directly related to fatty acid content. Dietary PUFA intake
influences tissue fatty acid content and the dose of vitamin E required to prevent lipid
peroxidation is directly related to PUFA intake (Greene, et al., 1988). Fats are an essential
part of cell membranes, which are highly susceptible to oxidation by free radicals.
α-Tocopherol can intercept free radicals and prevent the oxidation of lipids (Brigelius-Flohe
& Traber, 1999). Vitamin E’s lipid solubility allows its broad diffusion into numerous cells
and tissues (Baydas, et al., 2002).
65
Less attention has been focused on γ-tocopherol; however it may also be important to human
health and possesses unique features that differ from the roles of α-tocopherol. It is mainly
metabolised to γ-CEHC which has been shown to have natriuretic activity in the kidney.
Blood levels of γ-tocopherol in general are ten times lower than α-tocopherol levels due to
the selectivity of α-TTP for α-tocopherol and it also possesses lower antioxidant activity due
to its structure. However γ-tocopherol appears to be better at trapping electrophiles, such as
reactive nitrogen species (Jiang, et al., 2001).
Processing of foods, such as drying in the presence of air and sunlight, addition of organic
acids, milling and refining, irradiation and canning have been shown to reduce the vitamin E
content; along with high temperatures, prolonged storage and high moisture content. Seasonal
changes in vitamin E levels have also been shown in food products (Eitenmiller & Lee,
2004). Therefore the actual content of vitamin E in commercial infant foods may vary due to
processing and seasonality of products used for production.
Vitamin E deficiency is a major cause for concern in preterm or low birth weight infants,
where excessive production of free radicals can cause broncho-pulmonary dysplasia,
intraventricular haemorrhage and retinopathy due to the low antioxidant status. It has also
been well documented that placental transfer of vitamin E is limited, with cord blood levels
of infants being lower than maternal blood (Baydas, et al., 2002). In addition intestinal
absorption of vitamin E is impaired in premature infants (Davis, 1972). Furthermore the
developing nervous system appears to be sensitive to vitamin E deficiency (Brigelius-Flohe
& Traber, 1999). Although there is evidence that excess vitamin E is harmful all such data
originates from supplementation studies in preterm infants (Powers, 1997).
The bioavailability and metabolism of vitamin E is largely unclear; however factors have
been identified that will affect vitamin E within the body; such as the food matrix and the
amount and type of fat (Borel, et al., 2013).
The NDNS from 2008/2009 – 2010/2011 indicated that mean intakes of vitamins (including
vitamin E) either met or exceeded the recommended nutrient intake (Public Health England,
2014). In the US vitamin E intakes exceed the recommended adequate intakes for vitamin E
in infants below 12 months, however after 12 months they appear to be below the
recommended adequate intakes (Butte, et al., 2010). This may be due to the reduction in milk
intake and increase intake of complementary foods.
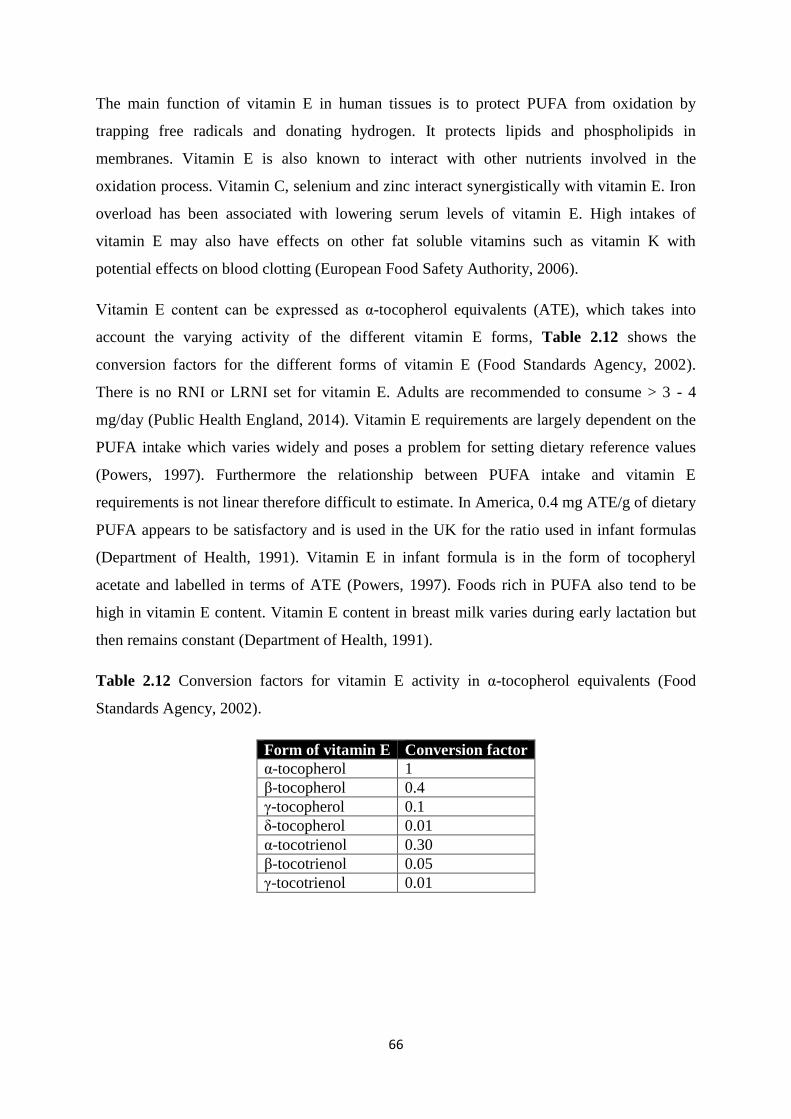
66
The main function of vitamin E in human tissues is to protect PUFA from oxidation by
trapping free radicals and donating hydrogen. It protects lipids and phospholipids in
membranes. Vitamin E is also known to interact with other nutrients involved in the
oxidation process. Vitamin C, selenium and zinc interact synergistically with vitamin E. Iron
overload has been associated with lowering serum levels of vitamin E. High intakes of
vitamin E may also have effects on other fat soluble vitamins such as vitamin K with
potential effects on blood clotting (European Food Safety Authority, 2006).
Vitamin E content can be expressed as α-tocopherol equivalents (ATE), which takes into
account the varying activity of the different vitamin E forms, Table 2.12 shows the
conversion factors for the different forms of vitamin E (Food Standards Agency, 2002).
There is no RNI or LRNI set for vitamin E. Adults are recommended to consume > 3 - 4
mg/day (Public Health England, 2014). Vitamin E requirements are largely dependent on the
PUFA intake which varies widely and poses a problem for setting dietary reference values
(Powers, 1997). Furthermore the relationship between PUFA intake and vitamin E
requirements is not linear therefore difficult to estimate. In America, 0.4 mg ATE/g of dietary
PUFA appears to be satisfactory and is used in the UK for the ratio used in infant formulas
(Department of Health, 1991). Vitamin E in infant formula is in the form of tocopheryl
acetate and labelled in terms of ATE (Powers, 1997). Foods rich in PUFA also tend to be
high in vitamin E content. Vitamin E content in breast milk varies during early lactation but
then remains constant (Department of Health, 1991).
Table 2.12 Conversion factors for vitamin E activity in α-tocopherol equivalents (Food
Standards Agency, 2002).
Form of vitamin E Conversion factor
α-tocopherol 1
β-tocopherol 0.4
γ-tocopherol 0.1
δ-tocopherol 0.01
α-tocotrienol 0.30
β-tocotrienol 0.05
γ-tocotrienol 0.01
67
2.4 Bone Health
Micronutrients are essential dietary components; 30 are essential and cannot be synthesised
by the body on a daily basis therefore they are required from dietary sources; Table 2.13
shows examples of micronutrients, their functions and dietary requirements. Micronutrients
have a wide range of biochemical functions which are fundamental in the homeostatic
regulation of bodily function, physiological functioning, metabolic pathways and normal
growth and development (Shergill-Bonner, 2013). They are grouped into major minerals
(>100 mg/day required from the diet) and trace elements (<100 mg/day required from the
diet) (Fellows, 2009). Both low intakes and reduced bioavailability can lead to deficiencies of
micronutrients (Melø, et al., 2008).
During the first year of life an infant requires adequate intake of both calcium and
phosphorus for the rapid growth and development of teeth and bones. Calcium and
phosphorus are the main components of hydroxyapatite which is the major constituent of
teeth and bones. In addition the dietary intake of vitamin D and other micronutrients, such as
magnesium, are involved in bone health and their intakes at this crucial stage of life will be of
great importance.
68
Table 2.13 Mineral function, sources and recommendations (Fellows, 2009).
DOH IOM (DRI)
Mineral Properties and functions Sources 4-6M
RNI
7-9M
RNI
10-12M
RNI
0-6M AI 7-12M AI
Calcium Maintains blood electrolyte balance, structure and rigidity
of bones and teeth. Involved in blood clotting,
transmission of impulses from nerves to muscles,
regulation of PTH and heartbeat, functioning of muscles,
skin, soft tissues and circulatory, digestive, enzymatic and
immune systems.
Dairy, molasses, nuts,
cereals, fruits, tofu,
seafood’s, green leafy
vegetables, seaweeds
13.1
mmol/d
525
mg/day
13.1
mmol/day
525
mg/day
13.1
mmol/day
525
mg/day
200
mg/day
(UL 1000
mg/day)
260
mg/day
(UL 1500
mg/day)
Copper Numerous protein and enzymes contain copper, some
essential for the utilisation of iron. Involved in protein
metabolism, respiration, healing and formation of myelin
sheaths that protect nerve fibres. Blood antioxidant.
Combines with zinc and vitamin C to form elastin and
formation of bones and red blood cells.
Avocado, barley,
cauliflower, nuts, lamb,
oranges, organ meats,
raisins, salmon, legumes,
green leafy vegetables,
soybeans
5
umol/day
0.3
mg/day
5
umol/day
0.3
mg/day
5
umol/day
0.3
mg/day
200
ug/day
220 ug/day
Iodine Functioning of the immune system, brain and thyroid
gland. Involved in the conversion of carotene to vitamin A,
protein and cholesterol synthesis.
Iodised salts, seafood’s,
asparagus, fish, garlic,
beans, mushrooms, sesame
seeds, soybeans, spinach
0.5
umol/day
60 ug/day
0.5
umol/day
60 ug/day
0.5
umol/day
60 ug/day
110
ug/day
130 ug/day
Iron Required for the production of haemoglobin, myoglobin,
certain enzymes, oxygenation of red blood cells, healthy
growth and resistance to disease, healthy immune system
and energy.
Liver, red meat, dark green
leafy vegetables, eggs,
seafood, fish, dates,
legumes, peaches, pears,
pumpkins, raisins, rice,
wheat bran, sesame seeds
and soybeans
80
umol/day
4.3
mg/day
140
umol/day
7.8
mg/day
140
umol/day
7.8
mg/day
0.27
mg/day
(UL 40
mg/day)
11 mg/day
(RDA)
(UL 40
mg/day)
Magnesium Essential for enzyme activity and protein synthesis. Assists
in calcium and potassium uptake to maintain blood
electrolyte balance. Important role in bone formation,
carbohydrate and mineral metabolism, functioning of
arteries, bones, cells, digestive, immune and reproductive
systems heart, nerves and teeth. Extracellular magnesium
role in maintenance of electrical potentials of nerve and
muscle membranes and transmission of nerve impulses to
muscles.
Dairy, fruits, fish, meat,
seafood, garlic, lima beans,
sesame seeds, tofu, green
leafy vegetables, whole
grains
2.5
mmol/day
60 mg/day
3.2
mmol/day
75 mg/day
3.3
mmol/day
80 mg/day
30 mg/day 75 mg/day
69
DOH IOM (DRI)
Mineral Properties and functions Sources 4-6M
RNI
7-9M
RNI
10-12M
RNI
0-6M AI 7-12M AI
Phosphorus Essential component of bone and to utilise vitamins to
metabolise food and maintain electrolyte balance, correct
functioning of brain cells, circulatory and digestive
systems, eyes, liver, muscles, nerves, teeth and bones.
Most foods especially
asparagus, maize, dairy,
eggs, fish, fruits, garlic,
sunflower seeds, meats,
wheat bran and whole grains
13.1
mmol/day
400
mg/day
13.1
mmol/day
400
mg/day
13.1
mmol/day
400
mg/day
100
mg/day
275
mg/day
Potassium Important in a balance with sodium for cellular
metabolism and regulating transfer of nutrients to cells,
maintaining blood pressure and electrolyte balance,
transmitting electrochemical impulses. Correct functioning
of blood, endocrine, digestive and nervous systems, heart,
kidneys, muscle and skin.
Dairy, fish, fruit, meat,
poultry, vegetables, whole
grains, beans, nuts, potatoes,
wheat bran, yams
22
mmol/day
850
mg/day
18
mmol/day
700
mg/day
18
mmol/day
700
mg/day
0.4 g/day 0.7 g/day
Selenium Antioxidant that protects all cell membranes enhances
immune system. Required with vitamin E for production
of antibodies, binding of toxic metals, amino acid
metabolism and promotion of growth and fertility.
Production of prostaglandins. Enzyme co factor for
glutathione peroxidase.
Seafood’s, organ meats,
cereals
0.2
umol/day
13 ug/day
0.1
umol/day
10 ug/day
0.1
umol/day
10 ug/day
15 ug/day
(UL 45
ug/day)
20 ug/day
(UL 60
ug/day)
Sodium With potassium for maintaining cellular water balance and
blood electrolyte balance/pH. Required for stomach,
lymphatic system, nerve and muscle function.
Most foods 12
mmol/day
280
mg/day
14
mmol/day
320
mg/day
15
mmol/day
350
mg/day
0.12 g/day 0.37 g/day
Zinc Needed to maintain required functioning of immune
system, thymus and spleen, maintaining concentrations of
vitamin E in the blood, correct functioning of blood,
bones, eyes, heart, joints, liver and prostate gland.
Component of insulin and many enzymes involved in
metabolism of phosphorus and proteins.
Fish, meats, seafood, whole
grains, liver, egg yolks,
beans, mushrooms, nuts,
pumpkin seeds, sardines,
soybeans, wheat germ
60
umol/day
4 mg/day
75
umol/day
5 mg/day
75
umol/day
5 mg/day
2 mg/day
(UL 4
mg/day)
3 mg/day
(RDA)
(UL 5
mg/day)
AI – actual intake, DOH – Department of Health, DRI – dietary reference intake, PTH – parathyroid hormone, RDA – recommended daily allowance, RNI – recommended nutrient allowance,
UL – tolerable upper intake level
70
2.4.1 Calcium
Calcium is the 5th
most abundant element in the human body. Over 99% of calcium in the
body is located in the bones and teeth, mainly as hydroxyapatite Ca5(PO4)3(OH), with less
than 1% present in soft tissues and bodily fluids (European Food Safety Authority, 2006).
Calcium is a vital mineral for the developing infant and is the most abundant mineral in the
human body. Calcium is transported through the placenta to the foetus during pregnancy,
where the largest amount of foetal accumulation is during the 3rd
trimester. Calcium is
important for intracellular metabolism, bone growth, blood clotting, nerve conduction,
muscle contraction and cardiac functions. Bone calcium accretion and accumulation is
positive during the first 18 years of life, being highest in the first year. During the first 6
months of life bone mass accretion is directly related to mineral intake. Calcium accretion
and bone mineralization are greatest during the first year of life and many nutritionists’
believe that early bone mass accumulation is important for preventing poor childhood growth
and later adult osteoporosis (Bass & Chan, 2006).
The bone mineral provides structure and strength to the body and a reservoir of calcium to
maintain the constant concentration within the blood. Cell surface calcium sensing receptors
maintain a constant calcium concentration in the extracellular fluid and blood. Calcium is
present in the blood in 3 different forms; free Ca2+
ions, bound to protein or complexed to
citrate, phosphate, sulphate or carbonate. Ionised calcium is kept within narrow limits via the
action of parathyroid hormone (PTH), calcitriol (1,25(OH)2D) and calcitonin. Intracellular
calcium varies between tissues and is predominantly bound to intracellular membrane
structures or contained in special storage vesicles. Intracellular calcium rises due to stimuli
interacting with cell surface receptors, which activates different responses including hormone
or neurotransmitter release and muscle contraction (European Food Safety Authority, 2006).
Within cells calcium acts as a second messenger to modulate the transmission of hormonal
signals and regulating enzyme function (Thompkinson & Kharb, 2007).
Reduced serum calcium levels are sensed by the parathyroid gland and result in the secretion
of PTH. PTH actions on the bone cause resorption of calcium and phosphorus by stimulating
osteoblasts (bone synthesising cells) to release factors to increase osteoclasts (cells that
induce resorption of bone) number and activity. In the kidney PTH increases calcium
resorption and also up regulates 1-α-hydroxylase which results in an increase in 1,25(OH)2D.
1,25(OH)2D increases the intestinal absorption of calcium by stimulating the biosynthesis of
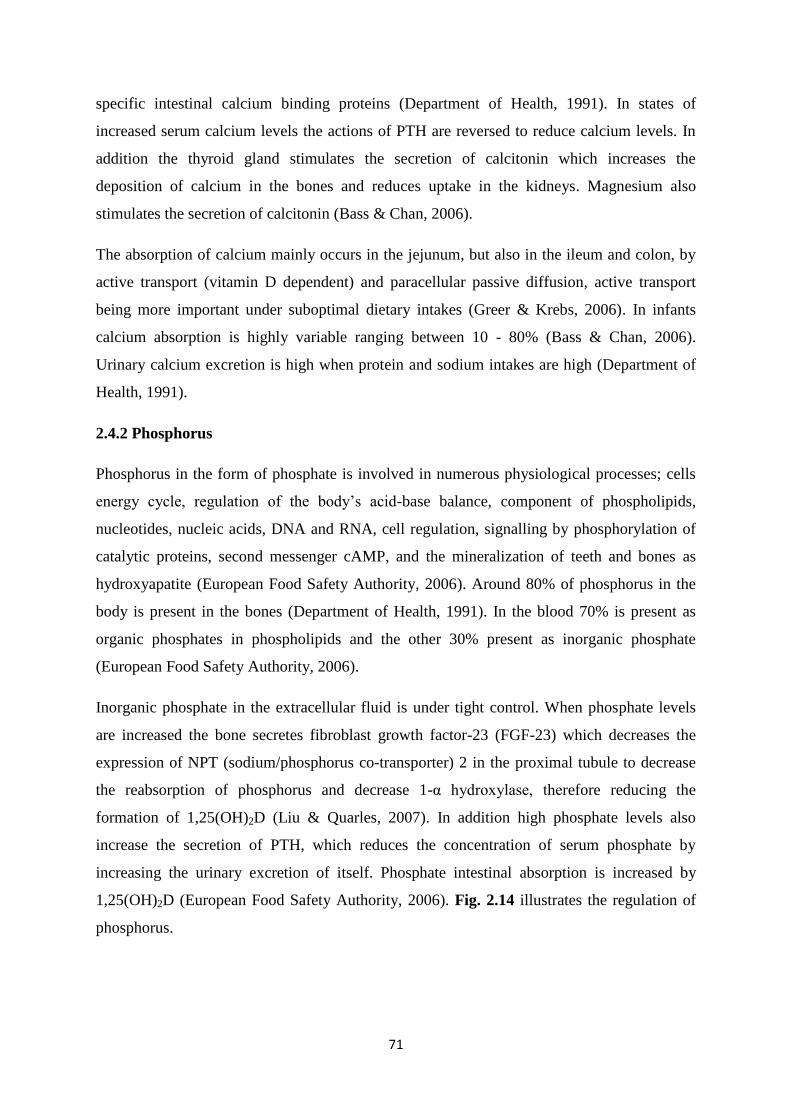
71
specific intestinal calcium binding proteins (Department of Health, 1991). In states of
increased serum calcium levels the actions of PTH are reversed to reduce calcium levels. In
addition the thyroid gland stimulates the secretion of calcitonin which increases the
deposition of calcium in the bones and reduces uptake in the kidneys. Magnesium also
stimulates the secretion of calcitonin (Bass & Chan, 2006).
The absorption of calcium mainly occurs in the jejunum, but also in the ileum and colon, by
active transport (vitamin D dependent) and paracellular passive diffusion, active transport
being more important under suboptimal dietary intakes (Greer & Krebs, 2006). In infants
calcium absorption is highly variable ranging between 10 - 80% (Bass & Chan, 2006).
Urinary calcium excretion is high when protein and sodium intakes are high (Department of
Health, 1991).
2.4.2 Phosphorus
Phosphorus in the form of phosphate is involved in numerous physiological processes; cells
energy cycle, regulation of the body’s acid-base balance, component of phospholipids,
nucleotides, nucleic acids, DNA and RNA, cell regulation, signalling by phosphorylation of
catalytic proteins, second messenger cAMP, and the mineralization of teeth and bones as
hydroxyapatite (European Food Safety Authority, 2006). Around 80% of phosphorus in the
body is present in the bones (Department of Health, 1991). In the blood 70% is present as
organic phosphates in phospholipids and the other 30% present as inorganic phosphate
(European Food Safety Authority, 2006).
Inorganic phosphate in the extracellular fluid is under tight control. When phosphate levels
are increased the bone secretes fibroblast growth factor-23 (FGF-23) which decreases the
expression of NPT (sodium/phosphorus co-transporter) 2 in the proximal tubule to decrease
the reabsorption of phosphorus and decrease 1-α hydroxylase, therefore reducing the
formation of 1,25(OH)2D (Liu & Quarles, 2007). In addition high phosphate levels also
increase the secretion of PTH, which reduces the concentration of serum phosphate by
increasing the urinary excretion of itself. Phosphate intestinal absorption is increased by
1,25(OH)2D (European Food Safety Authority, 2006). Fig. 2.14 illustrates the regulation of
phosphorus.
72
Figure 2.14 Regulation of phosphorus (Farrow & White, 2010). FGF23 - fibroblast growth
factor, Npt2a/c (sodium/phosphorus co-transporter) Pi- phosphate, PTH – parathyroid
hormone.
In infants 65-90% of phosphorus is absorbed. Absorption is mainly in the jejunum by a
saturable, active transport mechanism facilitated by 1,25(OH)2D and also by passive
diffusion. Excretion of phosphorus is mainly via the kidney. The majority of phosphorus
reabsorption occurs in the proximal tubule in the kidney via the type 2 NPT2 co transporter;
high phosphorus intake can result in the down regulation of the transporter so that more
phosphorus is excreted, vice versa (European Food Safety Authority, 2006).
Phosphorus requirements are conventionally set as equal to calcium in terms of mass.
Therefore recommendations are made so that phosphorus is equal to calcium in mmol
(Department of Health, 1991).
73
2.4.3 Ca:P
It has been suggested that the ratio of Ca:P is important for proper bone growth and
development in infancy (Sax, 2001). Inadequate intake of calcium and phosphorus in infancy
has been associated with the pathogenesis of bone disease in infants. Infants have a lower
renal excretion capacity and therefore have higher serum organic phosphate values, which
favours skeletal mineralization; however high levels adversely affect bone accretion. During
infancy at a time of rapid growth the Ca:P may be important to enable optimal growth
(European Food Safety Authority, 2006). In breast milk the Ca:P is normally around 2:1
(Thompkinson & Kharb, 2007).
Excessive phosphorus intakes (1-1.5 g/d) with low Ca:P molar ratio (1:3) alter calcium
metabolism causing hypocalcaemia (low serum calcium) and secondary hyperparathyroidism
(high PTH) (Department of Health, 1991). The Ca:P ratio is important for infants and should
be between 1-2:1 (weight/weight) (Koletzko, et al., 2005)
2.4.4 Micronutrient Interactions
Micronutrient intakes cannot be assessed independently due to numerous interactions that
occur between them, for instance the formation of insoluble complexes and competition for
absorption sites. The physico-chemical form of metal ions also has an important influence on
the absorption within the body. Foods contain a large number of ligands for metal ions,
including proteins, amino acids, carbohydrates, lipids, peptides and organic ions some of
which can form insoluble complexes, whereas others can make the mineral more absorbable
(Watzke, 1998). Table 2.14 shows examples of micronutrient interactions.
It is evident that calcium, phosphorus and magnesium are essential for bone health. However
it is also important to take into consideration other dietary factors which may affect the
utilisation of micronutrients and therefore their intakes are also required to be assessed.
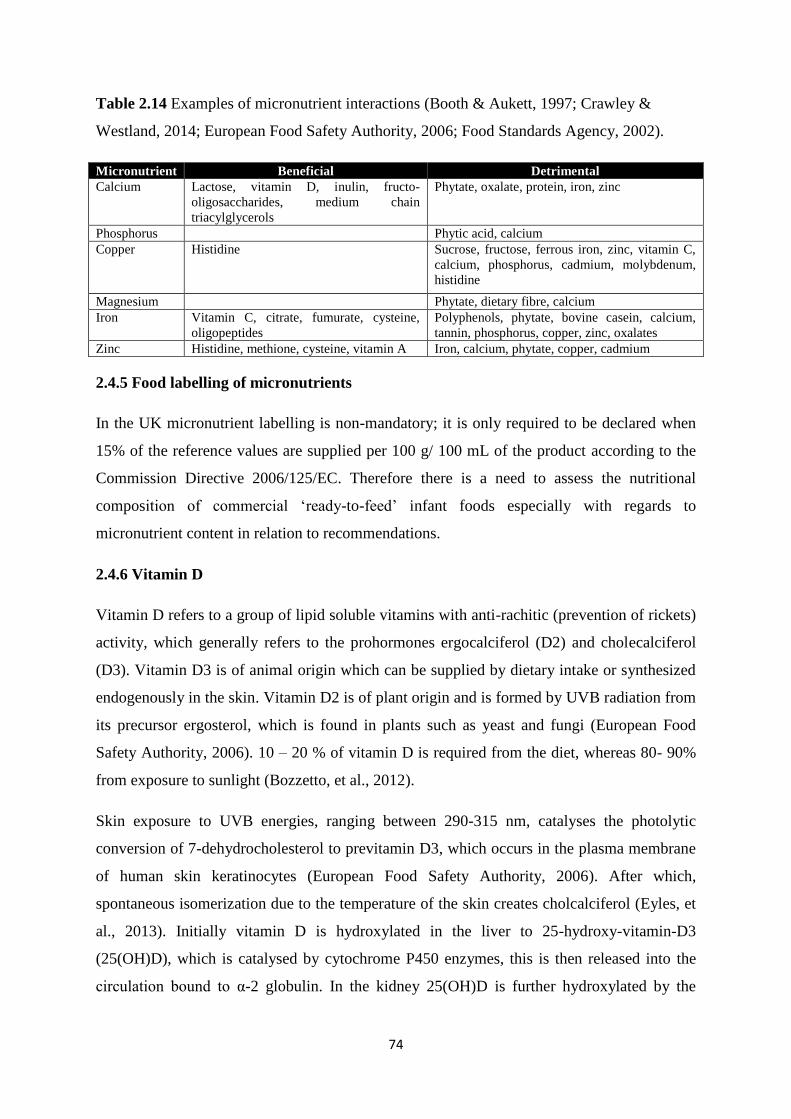
74
Table 2.14 Examples of micronutrient interactions (Booth & Aukett, 1997; Crawley &
Westland, 2014; European Food Safety Authority, 2006; Food Standards Agency, 2002).
Micronutrient Beneficial Detrimental
Calcium Lactose, vitamin D, inulin, fructo-
oligosaccharides, medium chain
triacylglycerols
Phytate, oxalate, protein, iron, zinc
Phosphorus Phytic acid, calcium
Copper Histidine Sucrose, fructose, ferrous iron, zinc, vitamin C,
calcium, phosphorus, cadmium, molybdenum,
histidine
Magnesium Phytate, dietary fibre, calcium
Iron Vitamin C, citrate, fumurate, cysteine,
oligopeptides
Polyphenols, phytate, bovine casein, calcium,
tannin, phosphorus, copper, zinc, oxalates
Zinc Histidine, methione, cysteine, vitamin A Iron, calcium, phytate, copper, cadmium
2.4.5 Food labelling of micronutrients
In the UK micronutrient labelling is non-mandatory; it is only required to be declared when
15% of the reference values are supplied per 100 g/ 100 mL of the product according to the
Commission Directive 2006/125/EC. Therefore there is a need to assess the nutritional
composition of commercial ‘ready-to-feed’ infant foods especially with regards to
micronutrient content in relation to recommendations.
2.4.6 Vitamin D
Vitamin D refers to a group of lipid soluble vitamins with anti-rachitic (prevention of rickets)
activity, which generally refers to the prohormones ergocalciferol (D2) and cholecalciferol
(D3). Vitamin D3 is of animal origin which can be supplied by dietary intake or synthesized
endogenously in the skin. Vitamin D2 is of plant origin and is formed by UVB radiation from
its precursor ergosterol, which is found in plants such as yeast and fungi (European Food
Safety Authority, 2006). 10 – 20 % of vitamin D is required from the diet, whereas 80- 90%
from exposure to sunlight (Bozzetto, et al., 2012).
Skin exposure to UVB energies, ranging between 290-315 nm, catalyses the photolytic
conversion of 7-dehydrocholesterol to previtamin D3, which occurs in the plasma membrane
of human skin keratinocytes (European Food Safety Authority, 2006). After which,
spontaneous isomerization due to the temperature of the skin creates cholcalciferol (Eyles, et
al., 2013). Initially vitamin D is hydroxylated in the liver to 25-hydroxy-vitamin-D3
(25(OH)D), which is catalysed by cytochrome P450 enzymes, this is then released into the
circulation bound to α-2 globulin. In the kidney 25(OH)D is further hydroxylated by the
75
mitochondrial enzyme 1-α hydroxylase (CYP27B1) into calcitriol (1,25(OH)2D), which is the
biologically active form of vitamin D (Thompkinson & Kharb, 2007). Magnesium is also
required as a cofactor for vitamin D metabolising enzymes. 1,25(OH)2D is transported in the
body bound to vitamin D binding protein (European Food Safety Authority, 2006). The
concentration of 1,25(OH)2D is subject to various regulatory mechanisms; synthesis and
concentration are increased in the plasma due to poor availability of calcium and phosphorus
and high PTH concentrations; on the other hand it is reduced under conditions of sufficient
calcium and phosphorus and by its own concentration (Scientific Committee on Food, 2003).
24-hydroxylase (CYP24A1) is the major catabolic mitochondrial enzyme for both 25(OH)D
and 1,25(OH)2D (European Food Safety Authority, 2006). Fig. 2.15 illustrates the
metabolism of vitamin D and its regulatory mechanisms.
In the mid 1600’s numerous children living in crowded and polluted industrialised cities in
northern Europe developed a bone deforming disease now known as rickets which had
classical characteristics of deformed legs, growth retardation, bending of the spine and weak
and toneless muscles. In 1822 Sniadecki recognised the importance of sun exposure for the
prevention and cure of rickets. Followed by Palm in the 1980’s recommending sun baths to
prevent rickets and in 1919 Huldschinski found that exposing children to UV radiation was
effective at treating rickets (Wacker & Holick, 2013). During the past decade there has been a
resurgence of vitamin D deficiency worldwide (Perez-Rossello, et al., 2012).
The primary physiological role of vitamin D has been to maintain extracellular calcium ion
levels, playing a crucial role in the development and maintenance of a healthy skeleton
throughout life (Wacker & Holick, 2013).
Vitamin D is absorbed from dietary sources in the duodenum and jejunum. Fat soluble
vitamins such as vitamin D are emulsified by bile for absorption; therefore adequate bile
secretions are required for vitamin D absorption (Bass & Chan, 2006). Only a few food
sources contain vitamin D3 naturally in quantities to make an impact on intake, these include
fish liver, fish liver oils, fatty fish and egg yolks; this is one of the reasons why countries
fortify (European Food Safety Authority, 2006).
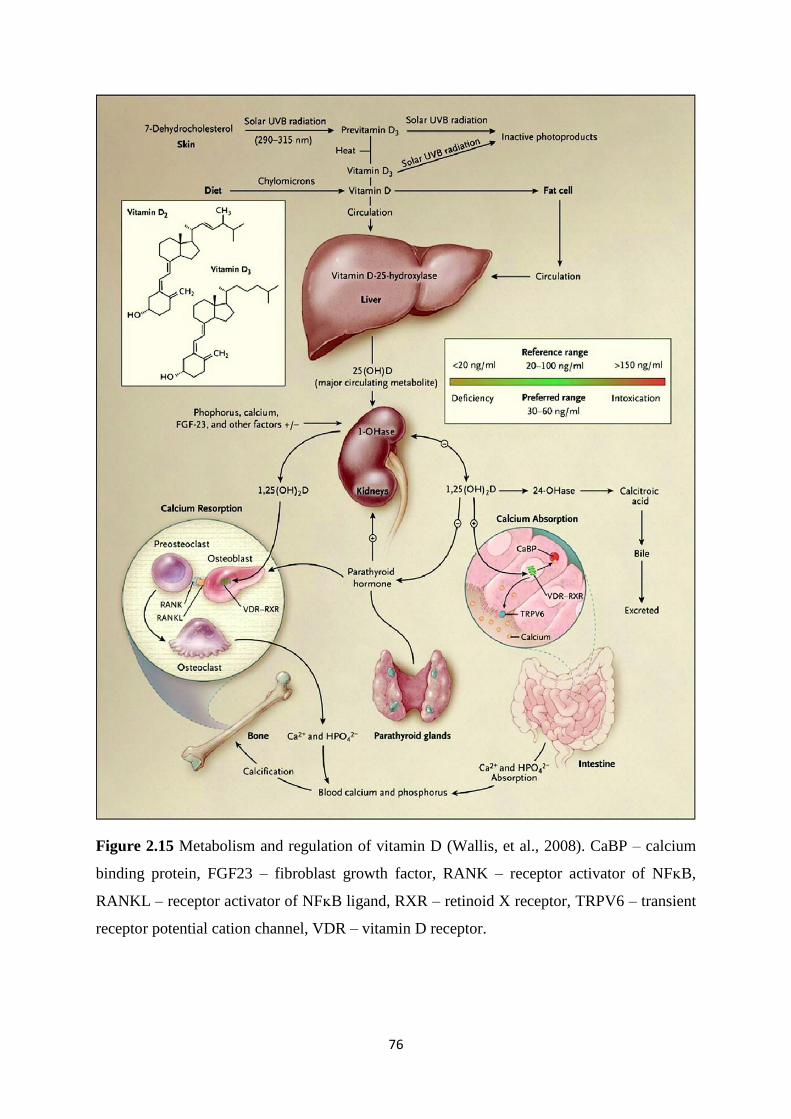
76
Figure 2.15 Metabolism and regulation of vitamin D (Wallis, et al., 2008). CaBP – calcium
binding protein, FGF23 – fibroblast growth factor, RANK – receptor activator of NFᴋB,
RANKL – receptor activator of NFᴋB ligand, RXR – retinoid X receptor, TRPV6 – transient
receptor potential cation channel, VDR – vitamin D receptor.
77
In the small intestines 1, 25(OH)2D enhances the absorption of calcium and phosphorus. It
also decreases the secretion of PTH and can enhance the mobilisation of calcium and
phosphorus from the bone at times of calcium deprivation (European Food Safety Authority,
2006), by binding to the VDR in osteoblasts biochemical signals are released which lead to
the formation of mature osteoclasts. Osteoclasts release collagenases and hydrogen chloride
to dissolve the matrix and mineral to release calcium into the blood. When vitamin D levels
are low calcium absorption is insufficient to satisfy the requirements of bone health and for
most metabolic functions and neuromuscular activity (Holick, 2006). 1,25(OH)2D also results
in the secretion of FGF-23 from the bone which reduces the reabsorption of phosphorus in
the kidneys and also decreases the concentration of 1-α hydroxylase and thus its own
production (Liu & Quarles, 2007).
1,25(OH)2D is a steroid and binds to genomic receptors in the intestinal epithelial cells and
increases the synthesis of the calcium binding protein, calbindin. Increased levels of calbindin
will bind a larger proportion of intracellular calcium, which will decrease the intracellular
ionized calcium levels, causing a gradient change between the intestinal lumen and intestinal
epithelial cell; therefore calcium will diffuse intracellularly and cause an increase in calcium
absorption. In the bone, 1,25(OH)2D increases the differentiation of precursor cells to
osteoclasts to mobilize calcium and phosphorus from the bone (Bass & Chan, 2006).
1,25(OH)2D induces bone formation by regulation of matrix proteins, including osteocalcin,
osteopontin, alkaline phosphatase, matrix gla proteins and collagen; and mineral apposition.
1,25(OH)2D can act as a ligand and bind to the steroid nuclear receptor; VDR. Following
ligand binding the VDR heterodimerises with RXR (antagonistic effects with vitamin A); this
then binds to vitamin D response elements in vitamin D regulated genes. Numerous genes
can be both up and down regulated (European Food Safety Authority, 2006).
Vitamin D deficiency impairs the absorption of calcium and phosphorus; resulting in poor
mineralization of the skeleton (Scientific Advisory Committee on Nutrition, 2011), which can
cause growth disturbances, bone abnormalities and muscle weakness (Powers, 1997).
Vitamin D deficiency is clinically associated with lower serum ionized calcium levels and
increased PTH levels (Wacker & Holick, 2013). This alters the Ca:P product in the bone and
decreases mineralization of collagen with the development of osteomalacia or rickets in the
immature skeleton. Decreased bone mineralization leads to thinning of the cortical bone,
coarse trabeculation and diffuse radiolucency (Perez-Rossello, et al., 2012). Vitamin D
deficiency during skeletal maturation disrupts chondrocyte maturation and inhibits the normal
78
mineralization of the growth plates, which causes widening of the epiphyseal plates at the end
of long bones and bulging of costochondral junctions. The inadequate Ca:P product results in
poor mineralization making the skeleton less rigid (Holick, 2006). Insufficient vitamin D
during infancy can result in reduced bone mineralization, slower growth, bone deformities
and increased risk of fractures (Grant & Holick, 2005).
There are numerous factors that contribute to the vitamin D status of an individual. The
season, time spent outdoors, dress (coverage by clothing), skin pigment (melanin content),
geographical altitude (>37° North and <37° south) and use of sunscreen will all effect the
amount of vitamin D that can be produced through the skin. Dietary intake of vitamin D will
be affected by the consumption of foods containing vitamin D, fortified foods, supplements
and the concentrations in breast milk and infant formula. Lastly body mass index and the
amount of body fat has also been inversely associated with serum 25(OH)D levels, likely to
be due to the sequestration of body fat compartments (Holick, 2006).
2.4.6.1 Vitamin D: Recommendations
Vitamin D recommendations vary widely between countries (Thompkinson & Kharb, 2007).
This in part is due to the differences in UVB exposure between countries (European Food
Safety Authority, 2006). Current vitamin D requirements are based upon calcium absorption
and bone health. In breast milk vitamin D is present as D2, D3 and 25(OH)D and unlike the
majority of other recommendations for infants the concentrations present in breast milk are
not classed as the gold standard and mothers are advised to take supplements (Powers, 1997).
In breast milk the concentration of vitamin D varies widely between 0.1-1.2 ug/L in the
literature which can also vary considerably due to season (European Food Safety Authority,
2006).
In the 1930’s milk, soda and bread were fortified with vitamin D; however after several cases
of presumed vitamin D intoxication in infants during the 1950’s, the UK implemented strict
regulations limiting the vitamin D fortification to margarine (Wacker & Holick, 2013).
Infant formula is fortified with vitamin D mainly in the form of vitamin D3 in the UK
(Crawley & Westland, 2014). 25(OH)D plasma concentration is the conventional method
used to assess vitamin D status (Powers, 1997). Serum 25(OH)D concentrations < 30 nmol/L
(12 ng/mL) are considered to be vitamin D deficient and associated with the development of
rickets; however much debate over the concentration to determine deficiency has been
79
debated in the literature (European Food Safety Authority, 2006). Insufficiency has been
associated with serum concentrations of 25(OH)D between 30-50 nmol/L (12-20 ng/ml) and
adequacy associated with 50 nmol/L (20 ng/ml). Vitamin D insufficiency was termed in the
1980’s as subjects with sub optimal vitamin D status in the absence of rachitic bone disease.
Some studies have also described a U shaped association between 25(OH)D levels and poor
health outcomes (Jones, et al., 2012).
According to the most recent NDNS there is evidence of an increased risk of vitamin D
deficiency in all age and sex groups. Twenty seven percent of preschool childrens (aged
between 1.5-3 years) mean intakes of vitamin D were found to be below the RNI.
Furthermore 7.5% of pre-school children were found to be below the threshold for vitamin D
adequacy, measured by 25(OH)D. The major dietary contributor of vitamin D, being from
milk and milk products, most of which are typically fortified (Public Health England, 2014).
Vitamin D3 is the main form used to fortify foods worldwide (European Food Safety
Authority, 2006). Until recently vitamin D2 and D3 were believed to be equipotent based on
anti-rachitic findings, however there is now evidence to suggest that the two forms may vary
in their bioefficacy. For instance vitamin D3 has been found to be more effective at raising
the 25(OH)D levels, however other studies have shown conflicting results (O’Mahony, et al.,
2011).
Infants and toddlers are a population that are highly susceptible to vitamin D deficiency for
numerous reasons. Breast feeding without supplementation, toddlers drinking juice rather
than milk, more time spent indoors and infants often in blankets (reduced cutaneous vitamin
D synthesis) are all contributing factors (Perez-Rossello, et al., 2012). Furthermore there is no
UV radiation of the appropriate wavelength in Britain between October and March. Vitamin
D intakes usually decline during weaning as most weaning foods are low in vitamin D;
except those that are fortified. Between 6 months to 3 years infants and toddlers are
particularly vulnerable to vitamin D depletion due to the high rate of calcium deposition in
the bone (Department of Health, 1991).
80
2.4.6.2 Vitamin D: other roles
The primary and well established role of vitamin D is to maintain intra and extra cellular
calcium concentrations and its essentiality for the development and maintenance of a
mineralized skeleton. In the last couple of decades numerous functions other than those of
mineral metabolism have been identified. Vitamin D affects cell differentiation and
proliferation, plays a role in the process of insulin secretion and 1,25(OH)2D regulates the
transcription of numerous genes (European Food Safety Authority, 2006). Vitamin D
deficiency has been associated with psoriasis, multiple sclerosis, inflammatory bowel disease,
diabetes, hypertension, cardiovascular disease, metabolic syndrome and various cancers
(O’Mahony, et al., 2011).
There is a historical link between vitamin D and innate immune function from the use of cod
liver oil for tuberculosis. Individuals with lower 25(OH)D may be less able to support
monocyte induction of antibacterial activity and therefore put the individual at risk of
infection. Vitamin D can influence the innate response to pathogens via effects on antigen
presentation by macrophages and dendritic cells. Treatment with 1,25(OH)2D inhibits
dendritic cell maturation, suppresses antigen presentation and promotes tolerogenic T cell
responses. T and B cells express the VDR. 1,25(OH)2D has anti-proliferative effects. In vitro,
1,25(OH)2D has been shown to inhibit Th1 cytokine production and induce Th2 cytokine
production. Vitamin D has been shown to inhibit IL-17 from Th17 secreting cells.
1,25(OH)2D also induces T reg which suppress the immune responses of other T cell
functions (Jones, et al., 2012).
In 1969 the nuclear VDR was discovered which motivated a vast amount of research.
Furthermore the VDR was found to be in at least 38 human tissues and organs and controls
over 900 genes. The VDR is a phosphoprotein which enables a variety of biological functions
upon binding by 1,25(OH)2D and subsequent regulation of gene expression (O’Mahony, et
al., 2011). The presence of VDR in other tissues suggests that vitamin D may also be
important for other non-skeletal processes (Holick, 2006).
81
2.4.6.3 Vitamin D: Asthma
Epidemiological evidence suggests that low serum 25(OH)D is associated with a higher risk
of upper and lower respiratory infections in children. Vitamin D has potent
immunomodulatory properties. It exerts its action on cells of the innate immune system to
inhibit pro-inflammatory cytokine production and induce antimicrobial peptide synthesis.
Vitamin D also modulates the adaptive immune system by direct effects on T cell activation
and on the phenotype and function of antigen presenting cells (Bozzetto, et al., 2012).
Many studies report a protective effect of vitamin D against asthma however, some suggest
that vitamin D is a risk factor for asthma and atopy (Bozzetto, et al., 2012). Birth cohort
studies in Boston, Scotland, Japan and Finland have shown that maternal dietary intake of
vitamin D during pregnancy is inversely related to wheeze, recurrent wheeze and asthma in
early childhood (Paul, et al., 2012).
2.4.6.4 Vitamin D: Allergy
The vitamin D receptor and vitamin D metabolizing enzymes have been identified in immune
cells. Vitamin D can induce T reg production (Litonjua, 2009). Vitamin D3 inhibits T cell
proliferation, in particular Th1 cells, macrophages and Th17 cells; and can amplify
CD4+CD25
+ T reg cells to increase production of IL-10 (Peroni, et al., 2011). Vitamin D
induces a shift towards the allergic Th2 response; reducing secretion of IL-2 and IFN-γ and
increasing secretion of IL-4 (Hypönnen, et al., 2004). In addition animal models and studies
in human foetal tissue show that vitamin D plays a role in the growth and maturation of the
foetal lung (Litonjua, 2009).
A prospective Swedish birth cohort study looked at the relationship between low (0.6-13
μg/day) and high (13.2-25.1 μg/day) vitamin D3 intake in infancy and atopic disease at 6
years. Infants in the study were recommended to take 400 IU/day of vitamin D3 from 6
weeks to 2 years. The study found that in the group with a higher intake of vitamin D3, atopic
manifestations were more prevalent (Bäck, et al., 2009). A Finnish study conducted by
Hypönnen, et al. (2004) assessed vitamin D supplementation in infancy and found that the
prevalence of allergic conditions at 31 years was higher in those who received vitamin D
supplementation regularly compared to those who received it irregularly or not at all during
the 1st year of life. In this particular study the vitamin D content was considerably higher than
the RNI, at 2000 IU/day. The actual intakes as well as the recommended intakes vary
82
between countries and can make it difficult to compare studies. However both studies
published in relation to high vitamin D intake in infancy suggest a detrimental effect on
allergy development.
Kull, et al. (2006b) conducted a study in Sweden looking at early life supplementation of
vitamin A and D in different forms; infants supplemented with vitamin A and D in the water
soluble form in the 1st year of life had an almost 2 fold increased risk for asthma, food
hypersensitivity and IgE sensitization to common allergens at 4 years compared to
supplements in peanut oil. This suggests that the forms in which vitamins are administered is
important, possibly due to differences in delivery and absorption.
In New Zealand Camargo, et al. (2010) found an inverse relationship between cord blood
levels of 25(OH)D at birth and risk of wheezing by 5 years, however there was no effect on
incidence of asthma. Allen, et al. (2013) found that 1 year old Australian born infants with
vitamin D insufficiency were 3 times more likely to have egg allergy, 11 times more likely to
have peanut allergy and overall more likely to have multiple food allergies. It has been
suggested that vitamin D insufficiency in a critical developmental period increases the
susceptibility to colonization with abnormal intestinal microbial pathogens which contribute
to abnormal intestinal barrier permeability and excess exposure to dietary antigens.
Breast milk has lower concentrations of vitamin D than formula; therefore it is important for
investigators to assess how the infant is being fed during any study. The above findings
suggest a double edged sword phenomenon of vitamin D; where potentially both excess and
deficient levels causing adverse immunological effects. A study by Rothers, et al. (2011)
assessed cord blood levels of 25(OH)D in Tuscon infants and found that both low
(<50 nmol/L) and high (≥100 nmol/L) concentrations were associated with higher IgE and
increased aeroallergen sensitization at 5 years. In addition high 25(OH)D was associated with
increased skin prick tests at 5 years but there was no association linked to allergic rhinitis or
asthma (Rothers, et al., 2011). Furthermore it is difficult to compare vitamin D studies in
different countries due to different levels of sunlight and dietary exposure, which is therefore
important to consider when studying the effects of vitamin D. From an immunological
prospective increasing vitamin D should decrease Th1 responses and increase Th2 responses,
theoretically likely therefore to increase atopic disease. It has been observed that countries
further from the equator and therefore exposure to lower UV radiation have higher paediatric
admissions to hospital for food allergy related events (Allen, et al., 2013). Table 2.15
83
summarises the findings from vitamin D studies in term infants and the effect on atopic
disease.
2.4.6.5 Vitamin D: Brain Development
Vitamin D has also been implicated in brain development and mental health (Morse, 2012).
Vitamin D deficiency in early life has effects on neuronal differentiation, axonal connectivity,
dopamine ontogeny and brain structure and function. Schizophrenia is considered a
neurodevelopmental disorder and those born in winter and spring and at higher altitudes have
increased risk of developing schizophrenia (Eyles, et al., 2013). A study in England has also
linked birth seasonality to bipolar disorder (Grant & Holick, 2005). Therefore vitamin D may
also play a role in mental development and disorders.
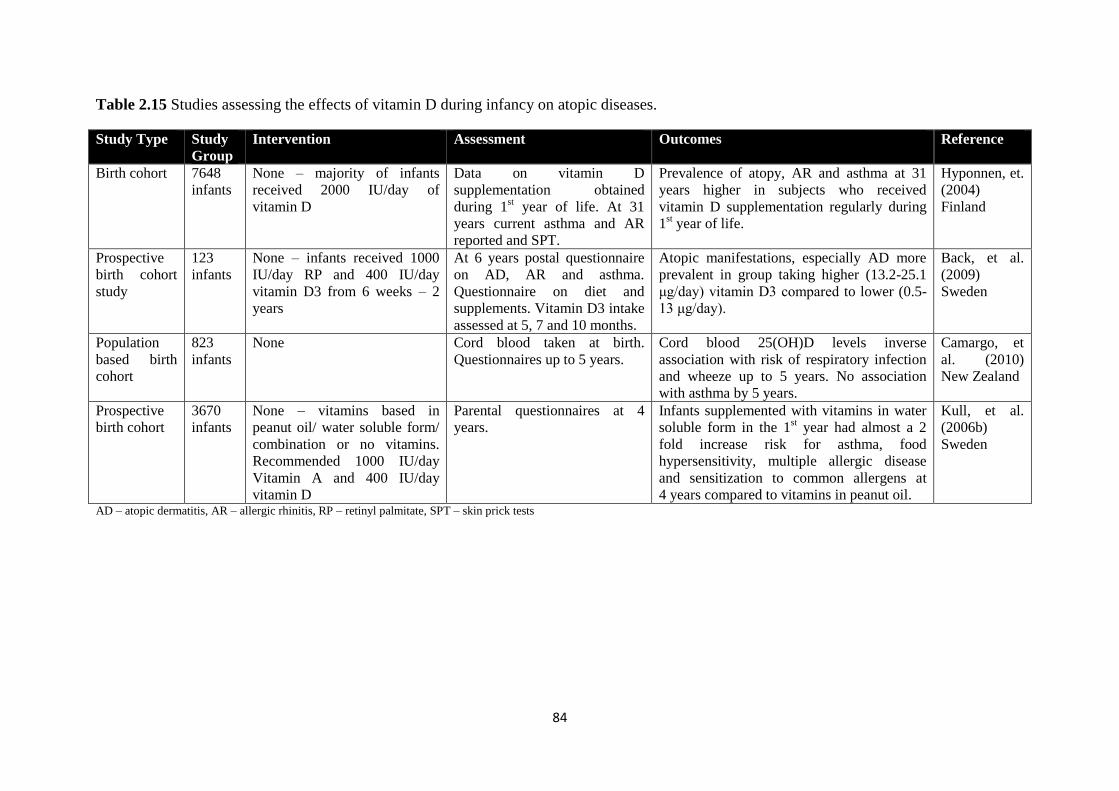
84
Table 2.15 Studies assessing the effects of vitamin D during infancy on atopic diseases.
Study Type Study
Group
Intervention Assessment Outcomes Reference
Birth cohort 7648
infants
None – majority of infants
received 2000 IU/day of
vitamin D
Data on vitamin D
supplementation obtained
during 1st year of life. At 31
years current asthma and AR
reported and SPT.
Prevalence of atopy, AR and asthma at 31
years higher in subjects who received
vitamin D supplementation regularly during
1st year of life.
Hyponnen, et.
(2004)
Finland
Prospective
birth cohort
study
123
infants
None – infants received 1000
IU/day RP and 400 IU/day
vitamin D3 from 6 weeks – 2
years
At 6 years postal questionnaire
on AD, AR and asthma.
Questionnaire on diet and
supplements. Vitamin D3 intake
assessed at 5, 7 and 10 months.
Atopic manifestations, especially AD more
prevalent in group taking higher (13.2-25.1
μg/day) vitamin D3 compared to lower (0.5-
13 μg/day).
Back, et al.
(2009)
Sweden
Population
based birth
cohort
823
infants
None Cord blood taken at birth.
Questionnaires up to 5 years.
Cord blood 25(OH)D levels inverse
association with risk of respiratory infection
and wheeze up to 5 years. No association
with asthma by 5 years.
Camargo, et
al. (2010)
New Zealand
Prospective
birth cohort
3670
infants
None – vitamins based in
peanut oil/ water soluble form/
combination or no vitamins.
Recommended 1000 IU/day
Vitamin A and 400 IU/day
vitamin D
Parental questionnaires at 4
years.
Infants supplemented with vitamins in water
soluble form in the 1st year had almost a 2
fold increase risk for asthma, food
hypersensitivity, multiple allergic disease
and sensitization to common allergens at
4 years compared to vitamins in peanut oil.
Kull, et al.
(2006b)
Sweden
AD – atopic dermatitis, AR – allergic rhinitis, RP – retinyl palmitate, SPT – skin prick tests
85
2.4.6.6 Vitamin D: Diabetes
Vitamin D may play a role in glucose metabolism and the development of both type 1 and
type 2 diabetes mellitus. Epidemiological evidence suggests a link between exposure to
vitamin D in early life and development of type 1 diabetes mellitus. Animal studies have
shown that 1,25(OH)2D plays an essential role in the normal secretion of insulin. Vitamin D
deficiency has been associated with poor B cell function. In a type 2 diabetes mellitus model
low vitamin D levels have been observed. In humans glucose intolerance and
hyperinsulinaemic responses in oral glucose tolerance tests have been associated with low
vitamin D concentrations; in addition a positive correlation between circulating 25(OH)D and
insulin sensitivity has been observed (Flores, 2005). Sufficient levels of 25(OH)D in infants
appear to greatly reduce the risk of type 1 diabetes mellitus and VDR alleles have been
associated with the risk of type 1 diabetes mellitus (Grant & Holick, 2005).
There is some evidence to suggest that increasing vitamin D intake in infancy may reduce the
development of type 1 diabetes mellitus. Vitamin D has also been associated with several
contributing factors associated with the development of type 2 diabetes mellitus, such as
pancreatic B cell function, insulin sensitivity and systemic inflammation (Kulie, et al., 2009).
B islet cells express the VDR and respond to 1,25(OH)2D by increasing insulin production
(Holick, 2006).
The VDR is expressed in pancreatic B cells and 1,25(OH)2D stimulates the secretion of
insulin. Vitamin D status also improves insulin sensitivity by up regulating insulin receptors.
Ecological studies have also associated the prevalence of auto immune disease with latitude.
There is an inverse association between maternal 25(OH)D and type 1 diabetes mellitus risk.
Furthermore supplementation with vitamin D during the first year of life has been associated
with a reduction in type 1 diabetes mellitus in later life; however other studies have shown no
effect (Wacker & Holick, 2013).
Therefore as national feeding surveys have indicated that there is evidence for an increased
risk of vitamin D deficiency in all age and sex groups in the UK, which will partly be due to
limited foods being rich in vitamin D. In particular, for infants, mother’s breast milk is an
insufficient source of vitamin D. It is vital to assess the infant’s vitamin D dietary intake due
to its primary role in the growth and development of bones and with mounting evidence to
suggest roles in numerous other major disease areas.
86
2.5 Processing and Storage
The food industry has mainly been concerned with food hygiene in relation to food
manufacture. Where traditionally heat treatments, such as pasteurization and sterilization, are
used to inactivate harmful micro-organisms to make a food product safe to eat for consumers.
However food processing treatments can lead to a loss of nutrients and deterioration of
organoleptic properties (Chemat, et al., 2011). The main functions of food preservation are to
extend the shelf life of food products, remove and inactivate toxins or microbes in foods with
maintaining the original sensory and nutritional properties as high as possible. Therefore
there needs to be a balance between food safety and nutritional quality (Henry & Heppell,
2002).
Food spoilage can be defined in a number of ways; the food is no longer acceptable due to
changes in sensory properties, the number or activity of pathogenic micro-organisms make
them unsafe to eat or when deterioration of one or more nutrients no longer has its declared
nutritional value. In most countries there is a legal requirement to identify the best before,
sell-by or use by date on food products. In Europe the Food Labelling Directive
(2000/13/EEC) requires most pre-packed foods to carry a minimum durability on the
packaging. The best before date indicates when a food will retain its optimum condition,
whereas use by labelling is employed for foods that are microbiologically highly perishable
and are likely to cause a danger to health (Fellows, 2009).
Numerous studies have reported variable and in some cases substantial losses of nutrients in
foods due to physical removal, chemical reactions during postharvest, industrial processes,
storage and domestic preparation (International Union of Food Science and Technology,
2000-2010).
The nutritional content in plant sources at harvest can vary due to the variety of cultivar,
maturity stage, geographical or climate effects, agricultural practices and soil composition.
Furthermore the nutritional content in animal sources can also vary depending on breed and
age of animal, composition of the feed and breeding practices (International Union of Food
Science and Technology, 2000-2010). Therefore the nutritional content of foods can vary
from the beginning of production depending on numerous factors relating to the ingredients
used before any processing has even occurred.
87
The heating of foods can destroy microbes and inactivate enzymes and toxins.
Microorganisms and enzymes are primarily responsible for food deterioration. Conventional
thermal processes kill vegetative microorganisms and some spores and inactivate enzymes
(Chemat, et al., 2011). Thermal processing has long been known to cause significant losses of
vitamins. Higher temperatures and longer exposure times decrease the retention of nutrients
(International Union of Food Science and Technology, 2000-2010). Nutrients can be
sensitive to pH, oxygen, moisture, light and heat (Henry, et al., 2009). Thermal processing
can also cause isomerization of certain nutrients, for example trans to cis β-carotene, which
can affect the function of nutrients within the body (Rickman, et al., 2007).
Pasteurization kills most microorganisms, whereas sterilization is a more severe process and
destroys all microorganisms (Food a Fact of Life, 2015). Pasteurization and sterilization are
the most common techniques used to inactivate microorganisms; however treatment
temperature and time tend to be proportional to nutrients lost (Chemat, et al., 2011).
The physical removal of certain nutrients such as vitamins, carotenoids and flavonoids can
occur if the peel is discarded during preparation, due to nutrients being highly concentrated in
certain regions. Grinding and fractionation in the milling of cereal grains causes major losses
of vitamins and minerals due to the removal of the embryo and bran in the process, where
they are concentrated. In plant tissues vitamins are protected, actions such as cutting,
chopping and shredding can destroy this protection and increase exposure to oxidation
(International Union of Food Science and Technology, 2000-2010).
Transport and storage can also lead to losses in nutrients due to exposure to temperature, and
light. Furthermore losses also tend to decrease over then length of storage time. Processing
results in the most nutrient losses, whereas storage in comparison, has fewer losses,
potentially due to modified atmosphere packaging (exclusion of oxygen), storage at low
temperatures (slower reaction rates) and protection from light (International Union of Food
Science and Technology, 2000-2010).
Minerals are not destroyed by exposure to heat, light, oxidising agents or extreme pH, and
losses due to processing, storage and cooking are minimal. They are however removed by
leeching and physical removal (International Union of Food Science and Technology, 2000-
2010). Water soluble vitamins can also be leeched into water during processing (Kalt, 2005).
On the other hand lipid soluble vitamins are not significantly lost to leeching, but are
sensitive to oxidation (Department of Health, 2011).
88
Home preparation of foods with heat treatments such as microwaving, boiling, steaming,
freezing and deep frying can also affect nutrient content (International Union of Food Science
and Technology, 2000-2010).
Non-thermal processing technologies such as high pressure processing and high intensity
pulsed electric field processing have been reported to inactivate microorganisms without the
adverse thermal effects (International Union of Food Science and Technology, 2000-2010).
However new processing techniques such as food irradiation, high pressure processing,
ohmic heating and pulse electromagnetic techniques have not been used extensively due to
high costs, lack of regulatory approval and consumer acceptance (Chemat, et al., 2011).
Studies that have looked at the effects of certain processing methods on nutrients have often
given variable results (Rickman, et al., 2007). In addition the wide variation of processing
methods used on foods and their parameters, such as temperature and time of exposure has
made it difficult to draw clear conclusions. Therefore it is essential to assess the effects that
processing and storage have on the nutrient content of foods, as if they are having a
detrimental effect and resulting in substantial nutrient losses this will affect the actual intake
which could lead to nutritional deficiencies. If this is the case then methods may need to be
employed to protect certain nutrients against losses. For infants this will be particularly
important as the limited volume of food that they can consume needs to satisfy adequate
nutritional requirements for optimal growth and development. Both infant foods and infant
formula need to be assessed.
2.6 Fortification
There is now great interest to improve health and wellbeing in the form of dietary means by
consumers, public health organisations and the medical community mainly due to increased
rates of adverse, diet related health conditions in Western societies which cause huge social
and economic costs (Kalt, 2005). Food fortification has been used by the food industry for
over 50 years. Fortified or enriched foods are foods that have one or more nutrients added to
them to maintain, improve or enhance the quality of a diet consumed by a specific population
(Henry & Heppell, 2002). Fortification is an effective, efficient and sustainable alternative to
control and reduce the health consequences of micronutrient deficiencies (Shamah &
Villalpando, 2006). Furthermore it can also be used to restore nutrients lost during processing
(Department of Health, 2011).
89
In developing countries micronutrient deficiencies are a public health problem especially for
infants and children during the first 2 years of life. Iron deficiency has resulted in anaemia
and vitamin A deficiency has been associated with higher rates of infection and mortality
(Eichler, et al., 2012).
There has been numerous fortification programmes implemented worldwide. For example
vitamin D in milk for the prevention of rickets, thiamine and niacin in wheat and cereals for
beriberi and pellagra, iodization of salt for mental retardation, iron for anaemia, vitamin A for
vision and infections and zinc for growth and infections (Shamah & Villalpando, 2006).
The food used for fortification must be consumed by the population in adequate quantities
and on a regular basis to reach required intakes. There must also be a low risk of excessive
consumption. The nutrient added must be well absorbed and utilised (bioavailability) by the
body, with a balance between enhancers and inhibitors of absorption and cause minimal
effects on other nutrients within the diet with no changes to organoleptic properties.
Furthermore the cost of a fortified product should be low so that it is available to a wide
population. Other nutritional substances can also be added to foods that are considered to be
beneficial for health, such as probiotics, omega 3’s and taurine (Shamah & Villalpando,
2006).
2.7 Microencapsulation
Microencapsulation generally refers to a process where a core material (active agent) is
entrapped within a shell or coating (wall material) or embedded in a homogenous or
heterogeneous matrix (Gharsallaoui, et al., 2007). It has also been defined as a technology of
packaging, solids, liquids or gases in small capsules that release their contents at a controlled
rate over prolonged periods and under specific conditions. The particles produced are
typically a few nm – mm in diameter. In the food industry functional compounds are added to
food products, these compounds are typically highly susceptible to environmental, processing
or gastrointestinal conditions, therefore encapsulation aims to effectively protect them
(Nedovic, et al., 2011).
90
There are numerous reasons and benefits to encapsulating food ingredients, such as (Nedovic,
et al., 2011):
To provide protection against degradation of the core material i.e. from oxygen and
water.
To provide a physical barrier between sensitive bioactive core materials and the
environment.
Prevent undesirable interactions with the food matrix.
Prevent the loss of flavour.
Controlled release of the core material.
Mask undesirable tastes and aromas.
Increase bioavailability.
Stabilize food ingredients.
Improve stability of the final food product during storage and processing.
Modification of the original material to improve physical characteristics, i.e. easier
handling.
The wall material used for the shell or coating must be food grade, biodegradable, must not
react with the active agent and have the ability to form a barrier between the internal phase
and surroundings. Polysaccharides, lipids and proteins can be used as wall materials
(Nedovic, et al., 2011).
The encapsulation technique most commonly used in the food industry is spray drying as it is
flexible, continuous and economical. Other techniques used include spray chilling, spray
cooling, coacervation, fluid-bed coating, freeze-drying, melt extrusion, melt injection and
extrusion methods (Gharsallaoui, et al., 2007). There are also more expensive techniques
such as molecular inclusion in cyclodextrins and liposomal vesicles which are less commonly
used (Nedovic, et al., 2011). The physico chemical properties of the core, the composition of
the wall materials and microencapsulation technique used will determine the type of particles
produced, Fig. 2.16 (Gharsallaoui, et al., 2007).
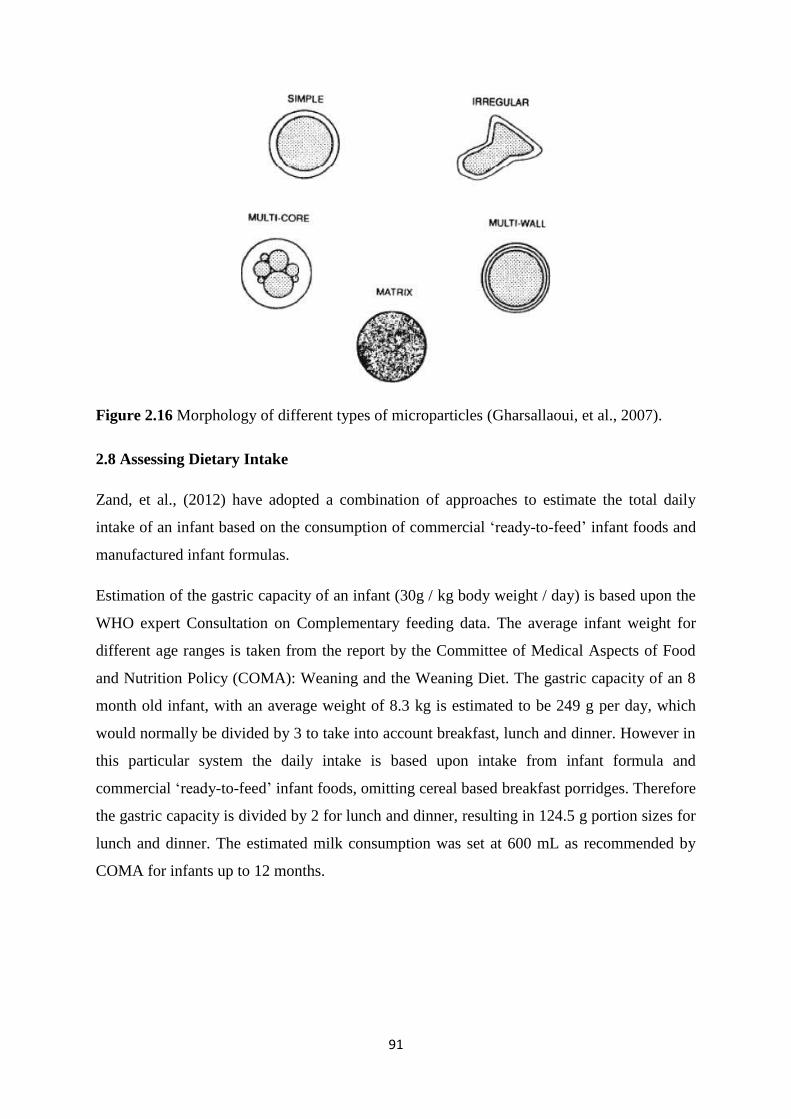
91
Figure 2.16 Morphology of different types of microparticles (Gharsallaoui, et al., 2007).
2.8 Assessing Dietary Intake
Zand, et al., (2012) have adopted a combination of approaches to estimate the total daily
intake of an infant based on the consumption of commercial ‘ready-to-feed’ infant foods and
manufactured infant formulas.
Estimation of the gastric capacity of an infant (30g / kg body weight / day) is based upon the
WHO expert Consultation on Complementary feeding data. The average infant weight for
different age ranges is taken from the report by the Committee of Medical Aspects of Food
and Nutrition Policy (COMA): Weaning and the Weaning Diet. The gastric capacity of an 8
month old infant, with an average weight of 8.3 kg is estimated to be 249 g per day, which
would normally be divided by 3 to take into account breakfast, lunch and dinner. However in
this particular system the daily intake is based upon intake from infant formula and
commercial ‘ready-to-feed’ infant foods, omitting cereal based breakfast porridges. Therefore
the gastric capacity is divided by 2 for lunch and dinner, resulting in 124.5 g portion sizes for
lunch and dinner. The estimated milk consumption was set at 600 mL as recommended by
COMA for infants up to 12 months.
92
Consequently the total daily intake will be calculated by adding the contribution of a
particular nutrient from 600 mL of infant formula and 124.5 g of the nutrient for lunch and
dinner from the experimental analysis of commercial ‘ready-to-feed’ infant foods. This value
can then be compared to recommendations to assess whether the infant is deficient, in excess
or meeting requirements.
2.9 References
Allen, K. J., Koplin, J. J., Ponsonby, A. L., Gurrin, L. C., Wake, M., Vuillermin, P., Martin,
P., Matheson, M., Lowe, A., Robinson, M., Tey, D., Osborne, N. J., Dang, T., Tina Tan, H.
T., Thiele, L., Anderson, D., Czech, H., Sanjeevan, J., Zurzolo, G., Dwyer, T., Tang, M. L.,
Hill, D., & Dharmage, S. C. (2013). Vitamin D insufficiency is associated with challenge-
proven food allergy in infants. Journal of Allergy Clinical Immunology, 131(4), 1109-16.
Agostoni, C., Brunetti, I., & Marco, A. D. (2005). Polyunsaturated fatty acids in human milk
and neurological development in breastfed infants. Current Paediatric Reviews, 1(1), 25-30.
Agostoni, C., Trojan, S., Bellu, R., Riva, E., Bruzzese, M. G., & Giovannini, M. (1997.).
Developmental quotient at 24 months and fatty acid composition of diet in early infancy: a
follow up study. Archives of Disease in Childhood, 76(5), 421-4.
Agostoni, C., Trojan, S., Bellu, R., Riva, E., & Giovannini, M. (1995). Neurodevelopmental
quotient of healthy term infants at 4 months and feeding practice: the role of long-chain
polyunsaturated fatty acids. Paediatric Research, 38(2), 262-6.
Agostoni, C., Zuccotti, G. V., Radaelli, G., Besana, R., Podesta, A., Sterpa, A., Rottoli, A.,
Riva, E., & Giovannini, M. (2009). Docosahexaenoic acid supplementation and time at
achievement of gross motor milestones in healthy infants: a randomized, prospective, double-
blind, placebo-controlled trial. American Journal of Clinical Nutrition, 89(1), 64-70.
Alm, B., Aberg, N., Erdes, L., Mollborg, P., Pettersson, R., Norvenius, S. G., Goksor, E., &
Wennergren, G. (2009). Early introduction of fish decreases the risk of eczema in infants.
Archives of Disease in Childhood, 94(1), 11-5.
Alm, B., Goksor, E., Thengilsdottir, H., Pettersson, R., Mollborg, P., Norvenius, G., Erdes,
L., Aberg, N., & Wennergren, G. (2011). Early protective and risk factors for allergic rhinitis
at age 4(1/2) yr. Paediatric Allergy and Immunology, 22(4), 398-404.
93
Auestad, N., Halter, R., Hall, R. T., Blatter, M., Bogle, M. L., Burks, W., Erickson, J. R.,
Fitzgerald, K. M., Dobson, V., Innis, S. M., Singer, L. T., Montalto, M. B., Jacobs, J. R., Qiu,
W., & Bornstein, M. H. (2001). Growth and development in term infants fed long-chain
polyunsaturated fatty acids: a double-masked, randomized, parallel, prospective, multivariate
study. Paediatrics, 108(2), 372-81.
Auestad, N., Montalto, M. B., Hall, R. T., Fitzgerald, K. M., Wheeler, R. E., Connor, W. E.,
Neuringer, M., Connor, S. L., Taylor, J. A., & Hartmann, E. E. (1997). Visual acuity,
erythrocyte fatty acid composition, and growth in term infants fed formulas with long chain
polyunsaturated fatty acids for one year. Ross Paediatric Lipid Study. Paediatric Research,
41(1), 1-10.
Auestad, N., Scott, D. T., Janowsky, J. S., Jacobsen, C., Carroll, R. E., Montalto, M. B.,
Halter, R., Qiu, W., Jacobs, J. R., Connor, W. E., Connor, S. L., Taylor, J. A., Neuringer, M.,
Fitzgerald, K. M., & Hall, R. T. (2003). Visual, cognitive, and language assessments at 39
months: a follow-up study of children fed formulas containing long-chain polyunsaturated
fatty acids to 1 year of age. Paediatrics, 112(3 Pt 1), 177-83.
Arterburn, L. M., Hall, E. B., & Oken, H. (2006a). Distribution, interconversion, and dose
response of n-3 fatty acids in humans. American Journal of Clinical Nutrition, 83(6 Suppl),
1467s-1476s.
Back, O., Blomquist, H. K., Hernell, O., & Stenberg, B. (2009). Does vitamin D intake
during infancy promote the development of atopic allergy? Acta Dermato-Venereologica,
89(1), 28-32.
Barman, M., Johansson, S., Hesselmar, B., Wold, A. E., Sandberg, A. S., & Sandin, A.
(2013). High levels of both n-3 and n-6 long-chain polyunsaturated fatty acids in cord serum
phospholipids predict allergy development. PLoS One, 8(7), 67920.
Bass, J. K., & Chan, G. M. (2006). Calcium nutrition and metabolism during infancy.
Nutrition, 22(10), 1057-66.
Baydas, G., Karatas, F., Gursu, M. F., Bozkurt, H. A., Ilhan, N., Yasar, A., & Canatan, H.
(2002). Antioxidant vitamin levels in term and preterm infants and their relation to maternal
vitamin status. Archives of Medical Research, 33(3), 276-80.
94
Beck, M., Zelczak, G., & Lentze, M. J. (2000). Abnormal fatty acid composition in umbilical
cord blood of infants at high risk of atopic disease. Acta Paediatrica, 89(3), 279-84.
Ben, X. M., Zhou, X. Y., Zhao, W. H., Yu, W. L., Pan, W., Zhang, W. L., Wu, S. M., Van
Beusekom, C. M., & Schaafsma, A. (2004). Growth and development of term infants fed
with milk with long-chain polyunsaturated fatty acid supplementation. Chinese Medical
Journal (Engl), 117(8), 1268-70.
Benton, D., (2008). Micronutrient status, cognition and behavioural problems in childhood.
European Journal of Nutrition, 47 Suppl 3, 38-50.
Best, K.P., Gold, M., Kennedy, D., Martin, J., & Makrides, M. (2015). Omega-3 long-chain
PUFA intake during pregnancy and allergic disease outcomes in the offspring: a systematic
review and meta-analysis of observational studies and randomized controlled trials. The
American Journal of Clinical Nutrition, p.ajcn111104.
Birch, E. E., Carlson, S. E., Hoffman, D. R., Fitzgerald-Gustafson, K. M., Fu, V. L., Drover,
J. R., Castaneda, Y. S., Minns, L., Wheaton, D. K., Mundy, D., Marunycz, J., & Diersen-
Schade, D. A. (2010a). The DIAMOND (DHA Intake and Measurement of Neural
Development) Study: a double-masked, randomized controlled clinical trial of the maturation
of infant visual acuity as a function of the dietary level of docosahexaenoic acid. American
Journal of Clinical Nutrition, 91(4), 848-59.
Birch, E. E., Castaneda, Y. S., Wheaton, D. H., Birch, D. G., Uauy, R. D., & Hoffman, D. R.
(2005). Visual maturation of term infants fed long-chain polyunsaturated fatty acid-
supplemented or control formula for 12 months. American Journal of Clinical Nutrition,
81(4), 871-9.
Birch, E. E., Garfield, S., Castaneda, Y., Hughbanks-Wheaton, D., Uauy, R., & Hoffman, D.
(2007). Visual acuity and cognitive outcomes at 4 years of age in a double-blind, randomized
trial of long-chain polyunsaturated fatty acid-supplemented infant formula. Early Human
Development, 83(5), 279-84.
95
Birch, E. E., Garfield, S., Hoffman, D. R., Uauy, R., & Birch, D. G. (2000). A randomized
controlled trial of early dietary supply of long-chain polyunsaturated fatty acids and mental
development in term infants. Developmental Medicine and Children Neurology, 42(3), 174-
81.
Birch, E. E., Hoffman, D. R., Castañeda, Y. S., Fawcett, S. L., Birch, D. G., & Uauy, R. D.
(2002). A randomized controlled trial of long-chain polyunsaturated fatty acid
supplementation of formula in term infants after weaning at 6 wk of age. The American
Journal of Clinical Nutrition, 75(3), 570-580.
Birch, E. E., Hoffman, D. R., Uauy, R., Birch, D. G., & Prestidge, C. (1998). Visual acuity
and the essentiality of docosahexaenoic acid and arachidonic acid in the diet of term infants.
Paediatric Research, 44(2), 201-9.
Birch, E. E., Khoury, J. C., Berseth, C. L., Castaneda, Y. S., Couch, J. M., Bean, J., Tamer,
R., Harris, C. L., Mitmesser, S. H., & Scalabrin, D. M. (2010b). The impact of early nutrition
on incidence of allergic manifestations and common respiratory illnesses in children. Journal
of Paediatrics, 156(6), 902-6.
Black, P. N., & Sharpe, S. (1997). Dietary fat and asthma: is there a connection? European
Respiratory Journal, 10(1), 6-12.
Bond, B., Fernandez, D. R., VanderJagt, D. J., Williams, M., Huang, Y.-S., Chuang, L.-T.,
Millson, M., Andrews, R., & Glew, R. H. (2005). Fatty acid, amino acid and trace mineral
analysis of three complementary foods from Jos, Nigeria. Journal of Food Composition and
Analysis, 18(7), 675-690.
Booth, I. W., & Aukett, M. A. (1997). Iron deficiency anaemia in infancy and early
childhood. Archives of Disease in Childhood, 76(6), 549-53.
Borel, P., Preveraud, D., & Desmarchelier, C. (2013). Bioavailability of vitamin E in humans:
an update. Nutrition Reviews, 71(6), 319-31.
Bouwstra, H., Dijck-Brouwer, D. A. J., Boehm, G., Boersma, E. R., Muskiet, F. A. J., &
Hadders-Algra, M. (2005). Long-chain polyunsaturated fatty acids and neurological
developmental outcome at 18 months in healthy term infants. Acta Pædiatrica, 94(1), 26-32.
96
Bouwstra, H., Dijck-Brouwer, D. J., Wildeman, J. A., Tjoonk, H. M., van der Heide, J. C.,
Boersma, E. R., Muskiet, F. A., & Hadders-Algra, M. (2003). Long-chain polyunsaturated
fatty acids have a positive effect on the quality of general movements of healthy term infants.
The American Journal of Clinical Nutrition, 78(2), 313-318.
Bozzetto, S., Carraro, S., Giordano, G., Boner, A., & Baraldi, E. (2012). Asthma, allergy and
respiratory infections: the vitamin D hypothesis. Allergy, 67(1), 10-7.
Brigelius-Flohe, R., & Traber, M. G. (1999). Vitamin E: function and metabolism. FASEB
Journal, 13(10), 1145-55.
Bryhn, Morten (2006). Polyunsaturated fatty acids in infant nutrition. Pronova Biocare,
EPAX AS.
Butte, N. F., Fox, M. K., Briefel, R. R., Siega-Riz, A. M., Dwyer, J. T., Deming, D. M., &
Reidy, K. C. (2010). Nutrient intakes of US infants, toddlers, and pre-schoolers meet or
exceed dietary reference intakes. Journal of the American Dietetic Association, 110(12
Suppl), S27-37.
Calder, P. C. (2012). Mechanisms of Action of (n-3) Fatty Acids. The Journal of Nutrition,
142(3), 592S-599S.
Calder, P. C., Krauss-Etschmann, S., de Jong, E. C., Dupont, C., Frick, J. S., Frokiaer, H.,
Heinrich, J., Garn, H., Koletzko, S., Lack, G., Mattelio, G., Renz, H., Sangild, P. T.,
Schrezenmeir, J., Stulnig, T. M., Thymann, T., Wold, A. E., & Koletzko, B. (2006). Early
nutrition and immunity - progress and perspectives. British Journal of Nutrition, England:
774-90.
Calder, P. C., & Miles, E. A. (2000). Fatty acids and atopic disease. Paediatric Allergy and
Immunology, 11 Suppl 13, 29-36.
Camargo, C. A., Ingham, T., Wickens, K., Thadhani, R., Silvers, K. M., Epton, M. J., Town,
G. I., Pattemore, P. K., Espinola, J. A., & Crane, J. (2011). Cord-blood 25-hydroxyvitamin D
levels and risk of respiratory infection, wheezing and asthma. Paediatrics, 127(1), e180-e187.
97
Carlson, S. E., Ford, A. J., Werkman, S. H., Peeples, J. M., & Koo, W. W. (1996). Visual
acuity and fatty acid status of term infants fed human milk and formulas with and without
docosahexaenoate and arachidonate from egg yolk lecithin. Paediatric Research, 39(5), 882-
8.
Caroli, M., Mele, R. M., Tomaselli, M. A., Cammisa, M., Longo, F., & Attolini, E. (2012).
Complementary feeding patterns in Europe with a special focus on Italy. Nutrition,
Metabolism and Cardiovascular Disease, 22(10), 813-8.
Cheatham, C. L., Nerhammer, A. S., Asserhoj, M., Michaelsen, K. F., & Lauritzen, L. (2011).
Fish oil supplementation during lactation: effects on cognition and behaviour at 7 years of
age. Lipids, 46(7), 637-45.
Chemat, F., Zill E. H., & Khan, M. K. (2011). Applications of ultrasound in food technology:
Processing, preservation and extraction. Ultrasonics Sonochemistry, 18(4), 813-835.
Clark, K. J., Makrides, M., Neumann, M. A., & Gibson, R. A. (1992). Determination of the
optimal ratio of linoleic acid to alpha-linolenic acid in infant formulas. Journal of
Paediatrics, 120(4 Pt 2), S151-8.
Colombo, J., Carlson, S. E., Cheatham, C. L., Fitzgerald-Gustafson, K. M., Kepler, A., &
Doty, T. (2011). Long-chain polyunsaturated fatty acid supplementation in infancy reduces
heart rate and positively affects distribution of attention. Paediatric Research, 70(4), 406-10.
Colombo, J., Carlson, S. E., Cheatham, C. L., Shaddy, D. J., Kerling, E. H., Thodosoff, J. M.,
Gustafson, K. M., & Brez, C. (2013). Long-term effects of LCPUFA supplementation on
childhood cognitive outcomes. The American Journal of Clinical Nutrition.
Committee on Toxicity (2003). COT statement on metals in infant food. COT statement
2003/02. Available at: http://cot.food.gov.uk.
Committee on Toxicity (2004). SACN advice on fish consumption benefits and risks.
London: TSO. Available at: http://cot.food.gov.uk.
Committee on Toxicity (2012). Second draft statement on the potential risks from high levels
of vitamin A in the infant diet. COT of chemicals in food, consumer products and the
environment. TOX/2012/41. Available at: http://cot.food.gov.uk.
98
Committee on Toxicity (2014). Statement on the potential risks from high levels of vitamin A
in the infant diet. COT of chemicals in food, consumer products and the environment. COT
statement 2013/03. Available at: http://cot.food.gov.uk.
Crawley, H., & Westland, S. (2014). Infant Milks in the UK: A Practical Guide for Health
Professionals. First steps nutrition trust.
Cunningham-Rundles, S., Lin, H., Ho-Lin, D., Dnistrian, A., Cassileth, B. R., & Perlman, J.
M. (2009). Role of nutrients in the development of neonatal immune response. Nutrition
Reviews, 67 Suppl 2, S152-63.
D'Vaz, N., Meldrum, S. J., Dunstan, J. A., Lee-Pullen, T. F., Metcalfe, J., Holt, B. J.,
Serralha, M., Tulic, M. K., Mori, T. A., & Prescott, S. L. (2012a). Fish oil supplementation in
early infancy modulates developing infant immune responses. Clinical and Experimental
Allergy, 42(8), 1206-16.
D'Vaz, N., Meldrum, S. J., Dunstan, J. A., Martino, D., McCarthy, S., Metcalfe, J., Tulic, M.
K., Mori, T. A., & Prescott, S. L. (2012b). Postnatal fish oil supplementation in high-risk
infants to prevent allergy: randomized controlled trial. Paediatrics, 130(4), 674-82.
Damsgaard, C. T., Lauritzen, L., Kjaer, T. M., Holm, P. M., Fruekilde, M. B., Michaelsen, K.
F., & Frokiaer, H. (2007) 'Fish oil supplementation modulates immune function in healthy
infants', Journal of Nutrition, 137(4), 1031-6.
Davis, K. C. (1972). Vitamin E: adequacy of infant diets. American Journal of Clinical
Nutrition, 25(9), 933-8.
De Jong, C., Kikkert, H. K., Fidler, V., & Hadders-Algra, M. (2010). The Groningen
LCPUFA study: no effect of postnatal long-chain polyunsaturated fatty acids in healthy term
infants on neurological condition at 9 years. British Journal of Nutrition, 104(4), 566-72.
Decsi, T., Thiel, I., & Koletzko, B. (1995). Essential fatty acids in full term infants fed breast
milk or formula. Archives of Disease in Childhood Fetal and Neonatal Ed, 72(1), F23-8.
Department of Health (1991). Dietary Reference Values for Food Energy and Nutrients for
the United Kingdom: Report of the Panel on Dietary Reference Values of the Committee on
Medical Aspects of Food Policy, H.M. Stationery Office.
99
Department of Health (2013). DH Guidance Notes on the Infant Formula and Follow-on
Formula Regulations 2007. Available at: http://www.dh.gov.uk/publications.
Department of Health (2011). Fortified Foods. Guidance on compliance with European
regulation (EC) No 1925/2006 on the addition of vitamins and minerals and certain other
substances to foods. Available at: http://www.dh.gov.uk/publications.
Devereux, G., Turner, S. W., Craig, L. C., McNeill, G., Martindale, S., Harbour, P. J., Helms,
P. J., & Seaton, A. (2006). Low maternal vitamin E intake during pregnancy is associated
with asthma in 5-year-old children. American Journal of Respiratory and Critical Care
Medicine, 174(5), 499-507.
Diplock, A. T., Charleux, J. L., Crozier-Willi, G., Kok, F. J., Rice-Evans, C., Roberfroid, M.,
Stahl, W., & Vina-Ribes, J. (1998). Functional food science and defence against reactive
oxidative species. British Journal of Nutrition, 80 Suppl 1, S77-112.
Drover, J., Hoffman, D. R., Castaneda, Y. S., Morale, S. E., & Birch, E. E. (2009). Three
randomized controlled trials of early long-chain polyunsaturated Fatty Acid supplementation
on means-end problem solving in 9-month-olds. Child Development, 80(5), 1376-84.
Drover, J. R., Hoffman, D. R., Castaneda, Y. S., Morale, S. E., Garfield, S., Wheaton, D. H.,
& Birch, E. E. (2011). Cognitive function in 18-month-old term infants of the DIAMOND
study: a randomized, controlled clinical trial with multiple dietary levels of docosahexaenoic
acid. Early Hum Development, 87(3), 223-30.
Duchen, K., Casas, R., Fageras-Bottcher, M., Yu, G., & Bjorksten, B. (2000). Human milk
polyunsaturated long-chain fatty acids and secretory immunoglobulin A antibodies and early
childhood allergy. Paediatric Allergy and Immunology, 11(1), 29-39.
EFSA (2009). Scientific Opinion on the appropraite age for the introduction of
complementary feeding of infants. EFSA Journal, 7(12): 1423.
Eichler, K., Wieser, S., Rüthemann, I., & Brügger, U. (2012). Effects of micronutrient
fortified milk and cereal food for infants and children: a systematic review. BMC Public
Health C7 - 506, 12(1), 1-13.
100
Eitenmiller, R., & Lee, J. (2004). Vitamin E Food Chemistry, Composition, and Analysis.
NY, USA: Marcel Dekker Ink.
European Food Safety Authority (2006). Tolerable upper intake levels for vitamins and
minerals. Scientific Committee on Food. Scientific panel on dietetic products, nutrition and
allergies. Available at: http://www.efsa.eu.int.
European Food Safety Authority (2008). Scientific Opinion of the Panel on food additives,
flavourings, processing aids and materials in contact with food on a request from the
Commission on mixed tocopherols, tocotrienol tocopherol and tocotrienols as sources for
vitamin E. The EFSA Journal 640, 1-34.
Eyles, D. W., Burne, T., H. & McGrath, J. J. (2013). Vitamin D, effects on brain
development, adult brain function and the links between low levels of vitamin D and
neuropsychiatric disease. Frontiers in Neuroendocrinology, 34(1), 47-64.
Farrow, E. G., & White, K. E. (2010). Recent advances in renal phosphate handling. Nature
Reviews Nephrology, 6(4), 207-17.
Fellows, P. J. (2009). Food Processing Technology: Principles and Practice, Third edition.
Elsevier Science.
Flores, M. (2005). A role of vitamin D in low-intensity chronic inflammation and insulin
resistance in type 2 diabetes mellitus? Nutritional Research Reviews, 18(2), 175-82.
Food a Fact of Life, 2015. Pasteurization, sterilization and irradiation. Available at:
http://www.foodafactoflife.org.uk/
Food and Drug Administration (2014). Quantitative Assessment of the Net Effects from
Eating Commercial Fish on Fetal Neurodevelopment (As Measured by IQ and also by Early
Age Verbal Development in Children). Available at: http://www.fda.gov.
Food Standards Agency (2002). McCance and Widdowson’s The Composition of Foods
integrated dataset user document. Available at: http://food.gov.uk.
Food Standards Agency (2008). Your baby: feeding your baby in the first year. Available at:
http://food.gov.uk.
101
Forsyth, J. S., Willatts, P., Agostoni, C., Bissenden, J., Casaer, P., & Boehm, G. (2003). Long
chain polyunsaturated fatty acid supplementation in infant formula and blood pressure in later
childhood: follow up of a randomised controlled trial. BMJ: British Medical Journal,
326(7396), 953-953.
Friedl, K. E., Rowe, S., Bellows, L. L., Johnson, S. L., Hetherington, M. M., de Froidmont-
Gortz, I., Lammens, V., & Hubbard, V. S. (2014). Report of an EU-US symposium on
understanding nutrition-related consumer behaviour: strategies to promote a lifetime of
healthy food choices. Journal of Nutritional Education and Behaviour, 46(5), 445-50.
Furuhjelm, C., Warstedt, K., Fageras, M., Falth-Magnusson, K., Larsson, J., Fredriksson, M.,
& Duchen, K. (2011). Allergic disease in infants up to 2 years of age in relation to plasma
omega-3 fatty acids and maternal fish oil supplementation in pregnancy and lactation.
Paediatric Allergy and Immunology, 22(5), 505-14.
Furuhjelm, C., Warstedt, K., Larsson, J., Fredriksson, M., Böttcher, M. F., Fälth‐Magnusson,
K., & Duchén, K. (2009). Fish oil supplementation in pregnancy and lactation may decrease
the risk of infant allergy. Acta paediatrica, 98(9), 1461-1467.
Gharsallaoui, A., Roudaut, G., Chambin, O., Voilley, A., & Saurel, R. (2007). Applications
of spray-drying in microencapsulation of food ingredients: An overview. Food Research
International, 40(9), 1107-1121.
Gibson, R. A., & Makrides, M. (2000). n-3 Polyunsaturated fatty acid requirements of term
infants. The American Journal of Clinical Nutrition, 71(1), 251s-255s.
Gibson, R. A., Muhlhausler, B., & Makrides, M. (2011). Conversion of linoleic acid and
alpha-linolenic acid to long-chain polyunsaturated fatty acids (LCPUFAs), with a focus on
pregnancy, lactation and the first 2 years of life. Maternal and Child Nutrition, 7 Suppl 2, 17-
26.
Gibson, R. A., Neumann, M. A., & Makrides, M. (1997). Effect of increasing breast milk
docosahexaenoic acid on plasma and erythrocyte phospholipid fatty acids and neural indices
of exclusively breastfed infants. European Journal of Clinical Nutrition, 51(9), 578-84.
102
Goksor, E., Alm, B., Thengilsdottir, H., Pettersson, R., Aberg, N., & Wennergren, G. (2011).
Preschool wheeze - impact of early fish introduction and neonatal antibiotics. Acta
Paediatrica, 100(12), 1561-6.
Gottrand, F. (2008). Long-chain polyunsaturated fatty acids influence the immune system of
infants. Journal of Nutrition, 138(9), 1807s-1812s.
Grant, W. B., & Holick, M. F. (2005). Benefits and requirements of vitamin D for optimal
health: a review. Alternative Medicine Review, 10(2), 94-111.
Greer, F. R., & Krebs, N. F. (2006). Optimizing bone health and calcium intakes of infants,
children, and adolescents. Paediatrics, 117(2), 578-85.
Greene, H. L., Hambidge, K. M., Schanler, R., & Tsang, R. C. (1988). Guidelines for the use
of vitamins, trace elements, calcium, magnesium, and phosphorus in infants and children
receiving total parenteral nutrition: report of the Subcommittee on Paediatric Parenteral
Nutrient Requirements from the Committee on Clinical Practice Issues of the American
Society for Clinical Nutrition. American Journal of Clinical Nutrition, 48(5), 1324-42.
Guesnet, P., & Alessandri, J. M. (2011). Docosahexaenoic acid (DHA) and the developing
central nervous system (CNS) - Implications for dietary recommendations. Biochimie, 93(1),
7-12.
Hansen, A. E., Wiese, H. F., Boelsche, A. N., Haggard, M. E., Adam, D. J. D., & Davis, H.
(1963). Role of linoleic acid in infant nutrition: Clinical and Chemical Study of 428 Infants
Fed on Milk Mixtures Varying in Kind and Amount of Fat. Paediatrics, 31(1), 171-192.
Harbige, L. S. (2003). Fatty acids, the immune response, and autoimmunity: a question of n-6
essentiality and the balance between n-6 and n-3. Lipids, 38(4), 323-41.
Harbige, L. S., & Fisher, B. A. C. (2001). Dietary fatty acid modulation of mucosally-
induced tolerogenic immune responses. Proceedings of the Nutrition Society, 60(04), 449-
456.
Heaton, A. E., Meldrum, S. J., Foster, J. K., Prescott, S. L., & Simmer, K. (2013). Does
docosahexaenoic acid supplementation in term infants enhance neurocognitive functioning in
infancy? Frontiers in Human Neuroscience, 7.
103
Helland, I. B., Smith, L., Blomen, B., Saarem, K., Saugstad, O. D., & Drevon, C. A. (2008).
Effect of supplementing pregnant and lactating mothers with n-3 very-long-chain fatty acids
on children's IQ and body mass index at 7 years of age. Paediatrics, 122(2), 472-9.
Helland, I. B., Smith, L., Saarem, K., Saugstad, O. D., & Drevon, C. A. (2003). Maternal
supplementation with very-long-chain n-3 fatty acids during pregnancy and lactation
augments children's IQ at 4 years of age. Paediatrics, 111(1), 39-44.
Henry, C. J., & Heppell, N. (2002). Nutritional losses and gains during processing: future
problems and issues. Proceedings of the Nutrition Society, 61(1), 145-8.
Hesselmar, B., Saalman, R., Rudin, A., Adlerberth, I., & Wold, A. (2010). Early fish
introduction is associated with less eczema, but not sensitization, in infants. Acta Paediatrica,
99(12), 1861-7.
Hoffman, D. R., Birch, E. E., Birch, D. G., Uauy, R., Castañeda, Y. S., Lapus, M. G., &
Wheaton, D. H. (2000). Impact of Early Dietary Intake and Blood Lipid Composition of
Long-Chain Polyunsaturated Fatty Acids on Later Visual Development. Journal of
Paediatric Gastroenterology and Nutrition, 31(5), 540-553.
Hoffman, D. R., Birch, E. E., Castaneda, Y. S., Fawcett, S. L., Wheaton, D. H., Birch, D. G.,
& Uauy, R. (2003). Visual function in breast-fed term infants weaned to formula with or
without long-chain polyunsaturates at 4 to 6 months: a randomized clinical trial. Journal of
Paediatrics, 142(6), 669-77.
Hoffman, D. R., Boettcher, J. A., & Diersen-Schade, D. A. (2009). Toward optimizing vision
and cognition in term infants by dietary docosahexaenoic and arachidonic acid
supplementation: a review of randomized controlled trials. Prostaglandins, Leukotrienes and
Essential Fatty Acids, 81(2-3), 151-8.
Hoffman, D. R., Theuer, R. C., Castañeda, Y. S., Wheaton, D. H., Bosworth, R. G.,
O’Connor, A. R., Morale, S. E., Wiedemann, L. E., & Birch, E. E. (2004). Maturation of
Visual Acuity Is Accelerated in Breast-Fed Term Infants Fed Baby Food Containing DHA-
Enriched Egg Yolk. The Journal of Nutrition, 134(9), 2307-2313.
104
Hoppu, U., Rinne, M., Salo-Vaananen, P., Lampi, A. M., Piironen, V., & Isolauri, E. (2005).
Vitamin C in breast milk may reduce the risk of atopy in the infant. European Journal of
Clinical Nutrition, 59(1), 123-8.
Holick, M. F. (2006). High prevalence of vitamin D inadequacy and implications for health.
Mayo Clinic Proceedings, 81(3), 353-73.
Huffman, S. L., Harika, R. K., Eilander, A., & Osendarp, S. J. (2011). Essential fats: how do
they affect growth and development of infants and young children in developing countries? A
literature review. Maternal and Child Nutrition, 7 Suppl 3, 44-65.
Hypponen, E., Sovio, U., Wjst, M., Patel, S., Pekkanen, J., Hartikainen, A. L., & Jarvelinb,
M. R. (2004). Infant vitamin D supplementation and allergic conditions in adulthood:
northern Finland birth cohort 1966. Annals of New York Academy Sciences, 1037, 84-95.
Innis, S. M. (2008). Dietary omega 3 fatty acids and the developing brain. Brain Research,
1237, 35-43.
Innis, S. M., Gilley, J., & Werker, J. (2001). Are human milk long-chain polyunsaturated
fatty acids related to visual and neural development in breast-fed term infants? Journal of
Paediatrics, 139(4), 532-8.
International Union of Food Science and Technology (2000-2010). Effects of processing and
storage on micronutrients and bioactive compounds. Available at:
http://elearning.iufost.org/all-courses.
Ioppi, M., Businco, L., Arcese, G., Ziruolo, G., & Nisini, R. (1994). Cord blood mononuclear
leukocytes of neonates at risk of atopy have a deficiency of arachidonic acid. Journal of
Investigational Allergology and Clinical Immunology, 4(6), 272-6.
Janssen, C. I., & Kiliaan, A. J. (2014). Long-chain polyunsaturated fatty acids (LCPUFA)
from genesis to senescence: the influence of LCPUFA on neural development, aging, and
neurodegeneration. Progress in Lipid Research, 53, 1-17.
Jensen, C. L., Prager, T. C., Fraley, J. K., Chen, H., Anderson, R. E., & Heird, W. C. (1997).
Effect of dietary linoleic/alpha-linolenic acid ratio on growth and visual function of term
infants. Journal of Paediatrics, 131(2), 200-9.
105
Jensen, C. L., Voigt, R. G., Llorente, A. M., Peters, S. U., Prager, T. C., Zou, Y. L., Rozelle,
J. C., Turcich, M. R., Fraley, J. K., Anderson, R. E., & Heird, W. C. (2010). Effects of early
maternal docosahexaenoic acid intake on neuropsychological status and visual acuity at five
years of age of breast-fed term infants. Journal of Paediatrics, 157(6), 900-5.
Jensen, C. L., Voigt, R. G., Prager, T. C., Zou, Y. L., Fraley, J. K., Rozelle, J. C., Turcich, M.
R., Llorente, A. M., Anderson, R. E., & Heird, W. C. (2005). Effects of maternal
docosahexaenoic acid intake on visual function and neurodevelopment in breastfed term
infants. American Journal of Clinical Nutrition, 82(1), 125-32.
Jiang, Q., Christen, S., Shigenaga, M. K., & Ames, B. N. (2001). γ-Tocopherol, the major
form of vitamin E in the US diet, deserves more attention. The American Journal of Clinical
Nutrition, 74(6), 714-722.
Johansson, S., Wold, A. E., & Sandberg, A. S. (2011). Low breast milk levels of long-chain
n-3 fatty acids in allergic women, despite frequent fish intake. Clinical and Experimental
Allergy, 41(4), 505-15.
Jones, A. P., Tulic, M. K., Rueter, K., & Prescott, S. L. (2012). Vitamin D and allergic
disease: sunlight at the end of the tunnel? Nutrients, 4(1), 13-28.
Jørgensen, M. H., Hølmer, G., Lund, P., Hernell, O., & Michaelsen, K. F. (1998). Effect of
Formula Supplemented with Docosahexaenoic Acid and γ-Linolenic Acid on Fatty Acid
Status and Visual Acuity in Term Infants. Journal of Paediatric Gastroenterology and
Nutrition, 26(4), 412-421.
Journal of Tropical Paediatrics (2014). Mother and Child Nutrition in the Tropics and
Subtropics. Breast feeding. Oxford Journals.
Kalt, W. (2005). Effects of Production and Processing Factors on Major Fruit and Vegetable
Antioxidants. Journal of Food Science, 70(1), R11-R19.
Karlberg, J. (1987). On the modelling of human growth. Statistics in medicine,6(2), 185-192.
Klein, B. P., & Kurilich, A. C. (2000). Processing Effects on Dietary Antioxidants from Plant
Foods. HortScience, 35(4), 580-584.
106
Koletzko, B., Baker, S., Cleghorn, G., Neto, U. F., Gopalan, S., Hernell, O., Hock, Q. S.,
Jirapinyo, P., Lonnerdal, B., Pencharz, P., Pzyrembel, H., Ramirez-Mayans, J., Shamir, R.,
Turck, D., Yamashiro, Y., & Zong-Yi, D. (2005). Global standard for the composition of
infant formula: recommendations of an ESPGHAN coordinated international expert group. J
Paediatric Gastroenterology and Nutrition, 41(5), 584-99.
Kremmyda, L. S., Vlachava, M., Noakes, P. S., Diaper, N. D., Miles, E. A., & Calder, P. C.
(2011). Atopy risk in infants and children in relation to early exposure to fish, oily fish, or
long-chain omega-3 fatty acids: a systematic review. Clinical Reviews in Allergy and
Immunology, 41(1), 36-66.
Kulie, T., Groff, A., Redmer, J., Hounshell, J., & Schrager, S. (2009). Vitamin D: an
evidence-based review. Journal of the American Board of Family Medicine, 22(6), 698-706.
Kull, I., Bergstrom, A., Lilja, G., Pershagen, G., & Wickman, M. (2006a). Fish consumption
during the first year of life and development of allergic diseases during childhood. Allergy,
61(8), 1009-15.
Kull, I., Bergstrom, A., Melen, E., Lilja, G., van Hage, M., Pershagen, G., & Wickman, M.
(2006b). Early-life supplementation of vitamins A and D, in water-soluble form or in peanut
oil, and allergic diseases during childhood. Journal of Allergy and Clinical Immunology,
118(6), 1299-304.
Kummeling, I., Thijs, C., Huber, M., van de Vijver, L. P., Snijders, B. E., Penders, J., Stelma,
F., van Ree, R., van den Brandt, P. A., & Dagnelie, P. C. (2008). Consumption of organic
foods and risk of atopic disease during the first 2 years of life in the Netherlands. British
Journal of Nutrition, England: 598-605.
Lapillonne, A., Pastor, N., Zhuang, W., & Scalabrin, D. M. (2014). Infants fed formula with
added long chain polyunsaturated fatty acids have reduced incidence of respiratory illnesses
and diarrhoea during the first year of life. BMC Paediatrics, 14, 168.
Lauritzen, L., Halkjaer, L. B., Mikkelsen, T. B., Olsen, S. F., Michaelsen, K. F., Loland, L.,
& Bisgaard, H. (2006). Fatty acid composition of human milk in atopic Danish mothers.
American Journal of Clinical Nutrition, 84(1), 190-6.
107
Lauritzen, L., Jorgensen, M. H., Mikkelsen, T. B., Skovgaard l, M., Straarup, E. M., Olsen, S.
F., Hoy, C. E., & Michaelsen, K. F. (2004). Maternal fish oil supplementation in lactation:
effect on visual acuity and n-3 fatty acid content of infant erythrocytes. Lipids, 39(3), 195-
206.
Lauritzen, L., Jorgensen, M. H., Olsen, S. F., Straarup, E. M., & Michaelsen, K. F. (2005).
Maternal fish oil supplementation in lactation: effect on developmental outcome in breast-fed
infants. Reproduction Nutrition Development, 45(5), 535-47.
Lennox, A., J, Sommerville., Ong, K., Henderson, H., & Allen, R. (2013). Diet and nutrition
survey of infants and young children, 2011. Public Health England, 1-107.
Litonjua, A. A. (2009). Childhood asthma may be a consequence of vitamin D deficiency.
Current Opinion in Allergy and Clinical Immunology, 9(3), 202-7.
Liu, S., & Quarles, L. D. (2007). How fibroblast growth factor 23 works. Journal of the
American Society of Nephrology, 18(6), 1637-47.
Lucas, A., Stafford, M., Morley, R., Abbott, R., Stephenson, T., MacFadyen, U., Elias-Jones,
A., & Clements, H. (1999). Efficacy and safety of long-chain polyunsaturated fatty acid
supplementation of infant-formula milk: a randomised trial. Lancet, 354(9194), 1948-54.
MacLean, W.C., Van Dael, P., Clemens, R., Davies, J., Underwood, E., O’Risky, L., Rooney,
D., & Schrijver, J. (2010). Upper levels of nutrients in infant formulas: Comparison of
analytical data with the revised Codex infant formula standard. Journal of Food Composition
and analysis, 23(1), 44-53.
Magnusson, J., Kull, I., Rosenlund, H., Håkansson, N., Wolk, A., Melén, E., Wickman, M.,
& Bergström, A. (2013). Fish consumption in infancy and development of allergic disease up
to age 12 y. The American Journal of Clinical Nutrition, 97(6), 1324-1330.
Makrides, M., Gibson, R. A., Udell, T., Ried, K., & the International LCPUFA Investigators.
(2005). Supplementation of infant formula with long-chain polyunsaturated fatty acids does
not influence the growth of term infants. The American Journal of Clinical Nutrition, 81(5),
1094-1101.
108
Makrides, M., Neumann, M., Simmer, K., Pater, J., & Gibson, R. (1995). Are long-chain
polyunsaturated fatty acids essential nutrients in infancy? Lancet, 345(8963), 1463-8.
Makrides, M., Neumann, M. A., Jeffrey, B., Lien, E. L., & Gibson, R. A. (2000). A
randomized trial of different ratios of linoleic to α-linolenic acid in the diet of term infants:
effects on visual function and growth. The American Journal of Clinical Nutrition, 71(1),
120-129.
Makrides, M., Neumann, M. A., Simmer, K., & Gibson, R. A. (2000). A critical appraisal of
the role of dietary long-chain polyunsaturated fatty acids on neural indices of term infants: a
randomized, controlled trial. Paediatrics, 105(1 Pt 1), 32-8.
Marks, G. B., Mihrshahi, S., Kemp, A. S., Tovey, E. R., Webb, K., Almqvist, C., Ampon, R.
D., Crisafulli, D., Belousova, E. G., Mellis, C. M., Peat, J. K., & Leeder, S. R. (2006).
Prevention of asthma during the first 5 years of life: a randomized controlled trial. Journal of
Allergy and Clinical Immunology, United States: 53-61.
McAndrew, F., Thompson, J., Fellows, L., Large, A., Speed, M., & Renfrew, M. (2012).
Infant Feeding Survey 2010. NHS, health and social care information centre.
Meldrum, S. J., D'Vaz, N., Simmer, K., Dunstan, J. A., Hird, K., & Prescott, S. L. (2012).
Effects of high-dose fish oil supplementation during early infancy on neurodevelopment and
language: a randomised controlled trial. British Journal of Nutrition, 108(8), 1443-54.
Melo, R., Gellein, K., Evje, L., & Syversen, T. (2008). Minerals and trace elements in
commercial infant food. Food and Chemical Toxicology, 46(10), 3339-42.
Mihrshahi, S., Peat, J. K., Marks, G. B., Mellis, C. M., Tovey, E. R., Webb, K., Britton, W.
J., & Leeder, S. R. (2003). Eighteen-month outcomes of house dust mite avoidance and
dietary fatty acid modification in the Childhood Asthma Prevention Study (CAPS). Journal
of Allergy and Clinical Immunology, 111(1), 162-8.
Minich, D.M. (1999). Essential fatty acid absorption and metabolism. PhD thesis, University
of Groningen.
109
Morse, N. L. (2012). Benefits of Docosahexaenoic Acid, Folic Acid, Vitamin D and Iodine
on Foetal and Infant Brain Development and Function Following Maternal Supplementation
during Pregnancy and Lactation. Nutrients, 4(7), 799-840.
Nafstad, P., Nystad, W., Magnus, P., & Jaakkola, J. J. (2003). Asthma and allergic rhinitis at
4 years of age in relation to fish consumption in infancy. Journal of Asthma, 40(4), 343-8.
Nedovic, V., Kalusevic, A., Manojlovic, V., Levic, S., & Bugarski, B. (2011). An overview
of encapsulation technologies for food applications. Procedia Food Science, 1(0), 1806-1815.
Niinivirta, K., Isolauri, E., Nermes, M. & Laitinen, K. (2014). Timing of complementary
feeding and the risk of atopic eczema. Acta Paediatrica, 103(2), 168-73.
Nissensohn, M., Daniel Fuentes Lugo, J. D.-A., Hermoso, M., Koletzko, B., & Serra Majem,
L. (2011). Report on actual nutrient intake of infants in the European countries, Academics
Paediatrics: Eurreca.
Nja, F., Nystad, W., Lodrup Carlsen, K. C., Hetlevik, O., & Carlsen, K. H. (2005). Effects of
early intake of fruit or vegetables in relation to later asthma and allergic sensitization in
school-age children. Acta Paediatrica, 94(2), 147-54.
Nudda, A., McGuire, M. K., Battacone, G., Manca, M. G., Boe, R., & Pulina, G. (2011).
Documentation of fatty acid profiles in lamb meat and lamb-based infant foods. Journal of
Food Science, 76(2), H43-7.
Nwaru, B. I., Erkkola, M., Ahonen, S., Kaila, M., Haapala, A.-M., Kronberg-Kippilä, C.,
Salmelin, R., Veijola, R., Ilonen, J., Simell, O., Knip, M., & Virtanen, S. M. (2010). Age at
the Introduction of Solid Foods During the First Year and Allergic Sensitization at Age 5
Years. Paediatrics, 125(1), 50-59.
Nwaru, B. I., Takkinen, H. M., Niemela, O., Kaila, M., Erkkola, M., Ahonen, S., Haapala, A.
M., Kenward, M. G., Pekkanen, J., Lahesmaa, R., Kere, J., Simell, O., Veijola, R., Ilonen, J.,
Hyoty, H., Knip, M., & Virtanen, S. M. (2013). Timing of infant feeding in relation to
childhood asthma and allergic diseases. Journal of Allergy and Clinical Immunology, 131(1),
78-86.
110
O'Mahony, L., Stepien, M., Gibney, M. J., Nugent, A. P., & Brennan, L. (2011). The
potential role of vitamin D enhanced foods in improving vitamin D status. Nutrients, 3(12),
1023-41.
Oh, D. Y., Talukdar, S., Bae, E. J., Imamura, T., Morinaga, H., Fan, W., Li, P., Lu, W. J.,
Watkins, S. M., & Olefsky, J. M. (2010). GPR120 is an omega-3 fatty acid receptor
mediating potent anti-inflammatory and insulin-sensitizing effects. Cell, 142(5), 687-98.
Pandelova, M., Lopez, W. L., Michalke, B., & Schramm, K.-W. (2012). Ca, Cd, Cu, Fe, Hg,
Mn, Ni, Pb, Se, and Zn contents in baby foods from the EU market: Comparison of assessed
infant intakes with the present safety limits for minerals and trace elements. Journal of Food
Composition and Analysis, 27(2), 120-127.
Papas, A. (1999). The vitamin E factor - summary and review. American Nutrition
Association, 37(1).
Pastor, N., Soler, B., Mitmesser, S. H., Ferguson, P., & Lifschitz, C. (2006). Infants fed
docosahexaenoic acid- and arachidonic acid-supplemented formula have decreased incidence
of bronchiolitis/bronchitis the first year of life. Clinical Paediatrics (Phila), 45(9), 850-5.
Paul, G., Brehm, J. M., Alcorn, J. F., Holguin, F., Aujla, S. J., & Celedon, J. C. (2012).
Vitamin D and asthma. American Journal of Respiratory and Critical Care Medicine, 185(2),
124-32.
Peat, J. K., Mihrshahi, S., Kemp, A. S., Marks, G. B., Tovey, E. R., Webb, K., Mellis, C. M.,
& Leeder, S. R. (2004). Three-year outcomes of dietary fatty acid modification and house
dust mite reduction in the Childhood Asthma Prevention Study. Journal of Allergy and
Clinical Immunology, 114(4), 807-13.
Perez-Rossello, J. M., Feldman, H. A., Kleinman, P. K., Connolly, S. A., Fair, R. A., Myers,
R. M., & Gordon, C. M. (2012). Rachitic changes, demineralization, and fracture risk in
healthy infants and toddlers with vitamin D deficiency. Radiology, 262(1), 234-41.
Peroni, D. G., Piacentini, G. L., Cametti, E., Chinellato, I., & Boner, A. L. (2011).
Correlation between serum 25-hydroxyvitamin D levels and severity of atopic dermatitis in
children. British Journal of Dermatology, 164(5), 1078-82.
111
Pesonen, M., Kallio, M. J., Siimes, M. A., & Ranki, A. (2007). Retinol concentrations after
birth are inversely associated with atopic manifestations in children and young adults.
Clinical and Experimental Allergy, 37(1), 54-61.
Pivik, R. T., Dykman, R. A., Jing, H., Gilchrist, J. M., & Badger, T. M. (2009). Early infant
diet and the omega 3 fatty acid DHA: effects on resting cardiovascular activity and
behavioural development during the first half-year of life. Developmental Neuropsychology,
34(2), 139-58.
Powers, H. J. (1997). Vitamin requirements for term infants: considerations for infant
formulae. Nutritional Research Reviews, 10(1), 1-33.
Public Health England (2014). National Diet and Nutrition Survey. Results from Years 1, 2, 3
and 4 (combined) of the Rolling Programme (2008/2009 – 2011/2012). Food Standards
Agency. Available at: https://www.gov.uk.
Qawasmi, A., Landeros-Weisenberger, A., & Bloch, M. H. (2013). Meta-analysis of
LCPUFA supplementation of infant formula and visual acuity. Paediatrics, 131(1), 262-72.
Qawasmi, A., Landeros-Weisenberger, A., Leckman, J. F., & Bloch, M. H. (2012). Meta-
analysis of long-chain polyunsaturated fatty acid supplementation of formula and infant
cognition. Paediatrics, 129(6), 1141-9.
Rickman, J. C., Bruhn, C. M., & Barrett, D. M. (2007). Nutritional comparison of fresh,
frozen, and canned fruits and vegetables II. Vitamin A and carotenoids, vitamin E, minerals
and fiber. Journal of the Science of Food and Agriculture, 87(7), 1185-1196.
Riediger, N. D., Othman, R. A., Suh, M., & Moghadasian, M. H. (2009). A systemic review
of the roles of n-3 fatty acids in health and disease. Journal of the American Dietetic
Association, 109(4), 668-79.
Rothers, J., Wright, A. L., Stern, D. A., Halonen, M. & Camargo, C. A., Jr. (2011). Cord
blood 25-hydroxyvitamin D levels are associated with aeroallergen sensitization in children
from Tucson, Arizona. Journal of Allergy and Clinical Immunology, 128(5), 1093-9.
Ruiz, F. X., Porté, S., Parés, X., & Farrés, J. (2012). Biological role of aldo-keto redutases in
retinoic acid biosynthesis and signalling. Frontiers in Pharmacology, 3, article 58, 1-13.
112
Ruxton, C. H., Reed, S. C., Simpson, M. J., & Millington, K. J. (2004). The health benefits of
omega-3 polyunsaturated fatty acids: a review of the evidence. Journal of Human Nutrition
and Dietetics, 17(5), 449-59.
Rzehak, P., Thijs, C., Standl, M., Mommers, M., Glaser, C., Jansen, E., Klopp, N.,
Koppelman, G. H., Singmann, P., Postma, D. S., Sausenthaler, S., Dagnelie, P. C., van den
Brandt, P. A., Koletzko, B., & Heinrich, J. (2010). Variants of the FADS1 FADS2 gene
cluster, blood levels of polyunsaturated fatty acids and eczema in children within the first 2
years of life. PLoS One, 5(10), 13261.
Ryan, A. S., Astwood, J. D., Gautier, S., Kuratko, C. N., Nelson, E. B., & Salem, N., Jr.
(2010). Effects of long-chain polyunsaturated fatty acid supplementation on
neurodevelopment in childhood: a review of human studies. Prostaglandins, Leukotrienes
and Essential Fatty Acids, 82(4-6), 305-14.
Sax, L. (2001). The Institute of Medicine’s “Dietary Reference Intake” for phosphorus: a
critical perspective. Journal of the American College of Nutrition, 20(4), 271-278.
Scientific Advisory Committee on Nutrition (2011). SACN Early Life Nutrition Report.
SACN: reports and positions statements, Public health England.
Scientific Committee on Food (2003). Report of the Scientific Committee on Food on the
Revision of Essential Requirements of Infant Formulae and Follow-on Formulae.
SCF/CS/NUT/IF/65. European Commission.
Schwartz, C., Scholtens, P. A., Lalanne, A., Weenen, H., & Nicklaus, S. (2011).
Development of healthy eating habits early in life. Review of recent evidence and selected
guidelines. Appetite, 57(3), 796-807.
Scott, D. T., Janowsky, J. S., Carroll, R. E., Taylor, J. A., Auestad, N., & Montalto, M. B.
(1998). Formula Supplementation With Long-chain Polyunsaturated Fatty Acids: Are There
Developmental Benefits? Paediatrics, 102(5), 59.
Shamah, T., & Villalpando, S. (2006). The role of enriched foods in infant and child
nutrition. British Journal of Nutrition, 96 Suppl 1, S73-7.

113
Shek, L. P., Chong, M. F., Lim, J. Y., Soh, S. E., & Chong, Y. S. (2012). Role of dietary
long-chain polyunsaturated fatty acids in infant allergies and respiratory diseases. Clinical
and Developmental Immunology, 2012, 730568.
Shergill-Bonner, R. (2013). Micronutrients. Paediatrics and Child Health, 23(8), 331-336.
Simopoulos, A. P. (2002). The importance of the ratio of omega-6/omega-3 essential fatty
acids. Biomedicine & Pharmacotherapy, 56(8), 365-379.
Singhal, A., Morley, R., Cole, T. J., Kennedy, K., Sonksen, P., Isaacs, E., Fewtrell, M., Elias-
Jones, A., Stephenson, T., & Lucas, A. (2007). Infant nutrition and stereoacuity at age 4-6 y.
American Journal of Clinical Nutrition, 85(1), 152-9.
Sperling, R. I. (1998). The effects of dietary n-3 polyunsaturated fatty acids on neutrophils.
Proceedings of the Nutrition Society, 57(4), 527-34.
Stone, W. L., LeClair, I., Ponder, T., Baggs, G., & Reis, B. B. (2003). Infants discriminate
between natural and synthetic vitamin E. American Journal of Clinical Nutrition, 77(4), 899-
906.
Storro, O., Oien, T., Dotterud, C. K., Jenssen, J. A., & Johnsen, R. (2010). A primary health-
care intervention on pre- and postnatal risk factor behaviour to prevent childhood allergy. The
Prevention of Allergy among Children in Trondheim (PACT) study. BMC Public Health, 10,
443.
Suskind, R. M., & Tontisirin, K. (2001). Nutrition, Immunity, and infection in Infants and
Children, USA: Lippincott Williams & Wilkins.
The Association of UK Dietetics (2013). Complementary Feeding: Introduction of solid
foods to an infant’s diet. British Dietetic Association. Available at: https://www.bda.uk.com.
Toelle, B. G., Ng, K. K., Crisafulli, D., Belousova, E. G., Almqvist, C., Webb, K., Tovey, E.
R., Kemp, A. S., Mellis, C. M., Leeder, S. R., Marks, G. B., & Childhood Asthma Prevention
Team. (2010). Eight-year outcomes of the Childhood Asthma Prevention Study. Journal of
Allergy and Clinical Immunology, United States: 388-9.
114
Thijs, C., Houwelingen, A., Poorterman, I., Mordant, A., & van den Brandt, P. (2000).
Essential fatty acids in breast milk of atopic mothers: comparison with non-atopic mothers,
and effect of borage oil supplementation. European Journal of Clinical Nutrition, 54(3), 234-
8.
Thompkinson, D. K., & Kharb, S. (2007). Aspects of Infant Food Formulation.
Comprehensive Reviews in Food Science and Food Safety, 6(4), 79-102.
Uauy, R., & Dangour, A. D. (2006). Nutrition in brain development and aging: role of
essential fatty acids. Nutrition Reviews, 64(5 Pt 2), S24-33; discussion S72-91.
Uauy, R., & Dangour, A. D. (2009). Fat and fatty acid requirements and recommendations
for infants of 0-2 years and children of 2-18 years. Annals of Nutrition and Metabolism, 55(1-
3), 76-96.
Ünay, B., Sarıcı, S. Ü., Ulaş, Ü. H., Akın, R., Alpay, F., & Gökçay, E. (2004). Nutritional
effects on auditory brainstem maturation in healthy term infants. Archives of Disease in
Childhood - Fetal and Neonatal Edition, 89(2), F177-F179.
US Department of Agriculture (2009). Infant Nutrition and Feeding: A guide for use in the
WIC and CSF programs. Available at: http://fnic.nal.usda.gov.
Van Gool, C. J., Thijs, C., Henquet, C. J., van Houwelingen, A. C., Dagnelie, P. C.,
Schrander, J., Menheere, P. P., & van den Brandt, P. A. (2003). Gamma-linolenic acid
supplementation for prophylaxis of atopic dermatitis--a randomized controlled trial in infants
at high familial risk. American Journal of Clinical Nutrition, 77(4), 943-51.
Van Goor, S. A., Dijck-Brouwer, D. A., Doornbos, B., Erwich, J. J., Schaafsma, A., Muskiet,
F. A., & Hadders-Algra, M. (2010). Supplementation of DHA but not DHA with arachidonic
acid during pregnancy and lactation influences general movement quality in 12-week-old
term infants. British Journal of Nutrition, 103(2), 235-42.
Van Goor, S. A., Dijck-Brouwer, D. A., Erwich, J. J., Schaafsma, A., & Hadders-Algra, M.
(2011). The influence of supplemental docosahexaenoic and arachidonic acids during
pregnancy and lactation on neurodevelopment at eighteen months. Prostaglandins,
Leukotrienes and Essential Fatty Acids, 84(5-6), 139-46.
115
Virtanen, S. M., Kaila, M., Pekkanen, J., Kenward, M. G., Uusitalo, U., Pietinen, P.,
Kronberg-Kippila, C., Hakulinen, T., Simell, O., Ilonen, J., Veijola, R., & Knip, M. (2010).
Early introduction of oats associated with decreased risk of persistent asthma and early
introduction of fish with decreased risk of allergic rhinitis. British Journal of Nutrition,
103(2), 266-73.
Vita-dose.com (ND). The Structure of Vitamin E and Related Compounds. Available:
http://www.vita-dose.com/structure-of-vitamin-e.html.
Wacker, M., & Holick, M. F. (2013). Vitamin D—Effects on skeletal and extra skeletal
health and the need for supplementation. Nutrients, 5(1), 111-148.
Wall, R., Ross, R. P., Fitzgerald, G. F., & Stanton, C. (2010). Fatty acids from fish: the anti-
inflammatory potential of long-chain omega-3 fatty acids. Nutritional Reviews, 68(5), 280-9.
Wallis, D. E., Penckofer, S., & Sizemore, G. W. (2008). The "sunshine deficit" and
cardiovascular disease. Circulation, 118(14), 1476-85.
Watzke, H. J. (1998). Impact of processing on bioavailability examples of minerals in foods.
Trends in Food Science & Technology, 9(8–9), 320-327.
Wijga, A. H., Smit, H. A., Kerkhof, M., de Jongste, J. C., Gerritsen, J., Neijens, H. J.,
Boshuizen, H. C., & Brunekreef, B. (2003). Association of consumption of products
containing milk fat with reduced asthma risk in pre-school children: the PIAMA birth cohort
study. Thorax, 58(7), 567-72.
Willatts, P., Forsyth, J. S., DiModugno, M. K., Varma, S., & Colvin, M. (1998). Effect of
long-chain polyunsaturated fatty acids in infant formula on problem solving at 10 months of
age. Lancet, 352(9129), 688-91.
Willatts, P., Forsyth, S., Agostoni, C., Casaer, P., Riva, E., & Boehm, G. (2013). Effects of
long-chain PUFA supplementation in infant formula on cognitive function in later childhood.
The American Journal of Clinical Nutrition, 98(2), 536S-542S.
Wright, S., & Bolton, C. (1989). Breast milk fatty acids in mothers of children with atopic
eczema. British Journal of Nutrition, 62(3), 693-7.
116
World Health Organisation (2004). Food and health in Europe: a new basis for action.
European Series 96. WHO regional publications.
Xiang, M., Harbige, L. S., & Zetterstrom, R. (2007). Breast milk levels of zinc and omega-6
polyunsaturated fatty acids and growth of healthy Chinese infants. Acta Paediatrica, 96(3),
387-90.
Xiang, M., Pinto, E., Rahman, M. A., Leach, M., & Harbige, L. S. (2010). Decreased
monocyte chemoattractant protein 1 and relationship with 15-deoxy Δ12,14-prostaglandin J2
in gamma-linolenic acid supplemented healthy subjects. Proceedings of the Nutrition Society,
69.
Zand, N., Chowdhry, B. Z., Pullen, F. S., Snowden, M. J., & Tetteh, J., (2012). Simultaneous
determination of riboflavin and pyridoxine by UHPLC/LC-MS in UK commercial infant
meal food products. Food Chemistry, 135(4), 2743-9.
117
Chapter 3
An investigation into the fatty acid content of selected fish based
commercial infant foods in the UK and the impact of commonly
practiced re-heating treatments used by parents for the
preparation of infant formula milks
3.1 Introduction
Traditionally lipids have been considered as a major contributor to dietary energy, however
recently the importance of the nature of dietary lipids ingested during infancy has been
highlighted (Innis, 2007). Long chain polyunsaturated fatty acids (LCPUFA) are thought to
be a specific dietary requirement during infancy due to a rapid rate of physiological and
immunological development (Department of Health, 1991). Currently research has focused
upon the LCPUFA, arachidonic acid (AA) and docosahexaenoic acid (DHA) for their
essentiality and roles in the visual and brain development of infants (Simmer, et al., 2011). In
addition, with the rise in the prevalence of allergies during recent years, a particular interest
has also been focused on n-3 LCPUFA, such as eicosapentaenoic acid (EPA) and DHA for
their possible protective roles in restricting the development of allergic disease (Calder &
Miles, 2000).
Humans must obtain the essential fatty acids α-linolenic acid (ALA) 18:3 (n-3) and linoleic
acid (LA) 18:2 (n-6) from dietary sources as they lack Δ-15 and Δ-12 desaturase enzymes.
ALA is then metabolised by Δ-6 desaturation, elongation and Δ-5 desaturation to form EPA
20:5 (n-3); LA is metabolised by the same enzymes to form AA 20:4 (n-6) (Innis, 2008). The
synthesis of DHA 22:6 (n-3) however requires a second Δ-6 desaturase step and β-oxidation.
There is, however, much evidence to suggest that during infancy conversion of the essential
fatty acid precursors (ALA and LA) into LCPUFA is insufficient due to the immaturity of the
desaturase and elongase enzymes and therefore meeting the essential daily requirements
through pre-formed dietary sources for infants is paramount (Makrides, et al., 2000).
118
Several randomized controlled infant formula milk supplementation trials have demonstrated
that infant feeding with DHA levels similar to the worldwide average (0.32% of fatty acids)
and AA levels higher than DHA provide visual and cognitive benefits to infants (Birch et al.,
2010). Expert bodies now recommend that infants who do not receive breast milk should
receive infant formula milk supplemented with DHA and AA (Hoffman, et al., 2009).
In the UK exclusive breastfeeding is recommended for the first 6 months of an infant’s life,
with the only suitable substitute being infant formula milk. From the diet and nutrition survey
of infants and young children (DNSIYC) conducted in 2011, 87-89% of infants aged 4-11
months are being given a type of infant formula milk. After 6 months complementary infant
foods are recommended to be introduced. The DNSIYC has also identified that 58% of
children who are fed foods other than milk have eaten a commercial baby or toddler meal
(Lennox, et al., 2013). The results from the DNSIYC indicate that infant formula milk and
commercial baby and toddler meals are major dietary contributors to an infant’s nutritional
intake; therefore these products need to be assessed for their nutritional adequacy.
Furthermore there is currently no clear and complete analytical nutritional data available for
commercial ‘ready-to-feed’ complementary infant foods in the UK. The nutritional database
used in the UK, McCance and Widdowson contains limited data on the composition of
complementary infant foods, in addition the analytical techniques and nutrient data contained
may now be outdated. It is essential that food composition tables are regularly updated with
the current foods available on the market, especially with the regular introduction of new
infant food products to the market (Food Standards Agency, 2015).
The oxidation of lipids is induced by oxygen in the presence of initiators including heat, free
radicals, light, photosensitizing pigments and metal ions through sequential free radical chain
reaction mechanisms. Numerous compounds can be formed during these reactions such as
hydroperoxides and conjugated dienes (Martínez-Yusta, et al., 2014). Alterations in food
products due to lipid oxidation can deteriorate the quality of the product both in terms of
sensory and nutritional characteristics and can generate undesirable compounds which can
have effects on human health. In particular unsaturated fatty acids are especially susceptible
to oxidation (Santos-Fandila, et al., 2014). Infant formula milks are recommended to be
served warm to the infant; meaning they will typically be subjected to a heat treatment prior
to being given to the infant. Therefore it is important to assess any effect that a particular heat
treatment has on the fatty acid content of the infant formula milk.
119
The study herein, aims to investigate the following.
a) Investigate the polyunsaturated fatty acid content of commercial ‘ready-to-feed’
complementary infant foods available on the UK market in order to evaluate whether they are
nutritionally adequate in relation to recommendations for a 6-9 month old infant, also taking
into consideration the consumption of infant formula milk.
b) Assess whether commonly practiced re-heating treatments used for the preparation of
infant formula milks by parents affect the polyunsaturated fatty acid content of infant formula
milk.
c) Examine the transparency of nutritional labels, by comparing the analytically quantified
concentrations of polyunsaturated fatty acids in infant formula milk to those provided on the
packaging.
d) Evaluate the content of polyunsaturated fatty acids in four infant formula milk brands
available on the UK market based on their nutritional label.
3.2 Materials and methods
3.2.1 Chemicals
Linolenic acid, linoleic acid, arachidonic acid, docosahexaenoic acid and eicosapentaenoic
acid, butylated hydroxytoluene (BHT), and butylated hydroxyanisole (BHA) were obtained
from Sigma Aldrich (Bellefonte, PA). HPLC-grade acetone, acetonitrile, tetrahydrofuran,
formic acid, absolute ethanol, isopropanol, methanol and laboratory reagent grade chloroform
and potassium hydroxide (KOH) were purchased from Fisher (UK).
3.2.2 Sample collection and analysis of complementary infant foods
Four fish-based commercial ‘ready-to-feed’ complementary infant food samples
representative of the four leading brands in the UK (Statista, 2008a) were selected from
leading supermarkets (Statista, 2008b) between June and July 2014. The main ingredients of
the baby food samples and their characteristics are presented in Table 3.1. Three independent
replicates were analyzed before the use by date of the product and within one month of
purchase. The samples were stored unopened at room temperature, similar to their
distribution and market environment.
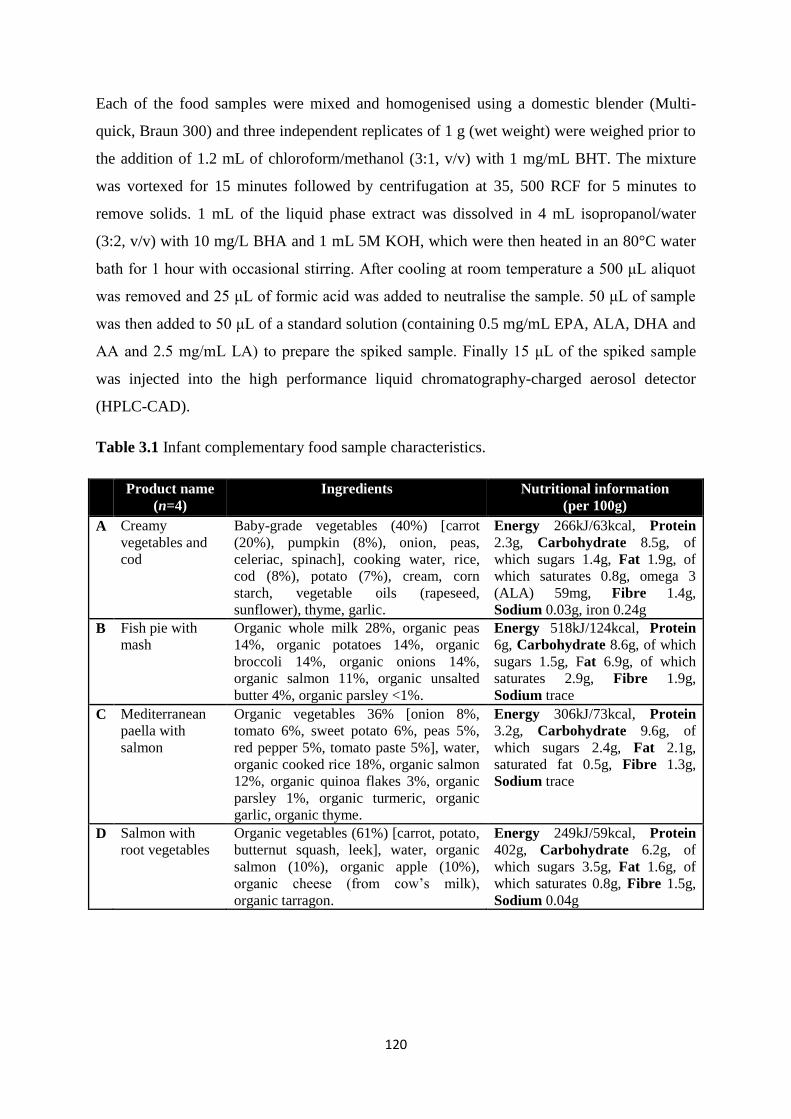
120
Each of the food samples were mixed and homogenised using a domestic blender (Multi-
quick, Braun 300) and three independent replicates of 1 g (wet weight) were weighed prior to
the addition of 1.2 mL of chloroform/methanol (3:1, v/v) with 1 mg/mL BHT. The mixture
was vortexed for 15 minutes followed by centrifugation at 35, 500 RCF for 5 minutes to
remove solids. 1 mL of the liquid phase extract was dissolved in 4 mL isopropanol/water
(3:2, v/v) with 10 mg/L BHA and 1 mL 5M KOH, which were then heated in an 80°C water
bath for 1 hour with occasional stirring. After cooling at room temperature a 500 μL aliquot
was removed and 25 μL of formic acid was added to neutralise the sample. 50 μL of sample
was then added to 50 μL of a standard solution (containing 0.5 mg/mL EPA, ALA, DHA and
AA and 2.5 mg/mL LA) to prepare the spiked sample. Finally 15 μL of the spiked sample
was injected into the high performance liquid chromatography-charged aerosol detector
(HPLC-CAD).
Table 3.1 Infant complementary food sample characteristics.
Product name
(n=4)
Ingredients Nutritional information
(per 100g)
A Creamy
vegetables and
cod
Baby-grade vegetables (40%) [carrot
(20%), pumpkin (8%), onion, peas,
celeriac, spinach], cooking water, rice,
cod (8%), potato (7%), cream, corn
starch, vegetable oils (rapeseed,
sunflower), thyme, garlic.
Energy 266kJ/63kcal, Protein
2.3g, Carbohydrate 8.5g, of
which sugars 1.4g, Fat 1.9g, of
which saturates 0.8g, omega 3
(ALA) 59mg, Fibre 1.4g,
Sodium 0.03g, iron 0.24g
B Fish pie with
mash
Organic whole milk 28%, organic peas
14%, organic potatoes 14%, organic
broccoli 14%, organic onions 14%,
organic salmon 11%, organic unsalted
butter 4%, organic parsley <1%.
Energy 518kJ/124kcal, Protein
6g, Carbohydrate 8.6g, of which
sugars 1.5g, Fat 6.9g, of which
saturates 2.9g, Fibre 1.9g,
Sodium trace
C Mediterranean
paella with
salmon
Organic vegetables 36% [onion 8%,
tomato 6%, sweet potato 6%, peas 5%,
red pepper 5%, tomato paste 5%], water,
organic cooked rice 18%, organic salmon
12%, organic quinoa flakes 3%, organic
parsley 1%, organic turmeric, organic
garlic, organic thyme.
Energy 306kJ/73kcal, Protein
3.2g, Carbohydrate 9.6g, of
which sugars 2.4g, Fat 2.1g,
saturated fat 0.5g, Fibre 1.3g,
Sodium trace
D Salmon with
root vegetables
Organic vegetables (61%) [carrot, potato,
butternut squash, leek], water, organic
salmon (10%), organic apple (10%),
organic cheese (from cow’s milk),
organic tarragon.
Energy 249kJ/59kcal, Protein
402g, Carbohydrate 6.2g, of
which sugars 3.5g, Fat 1.6g, of
which saturates 0.8g, Fibre 1.5g,
Sodium 0.04g
121
3.2.3 Sample collection and analysis of infant formula milk
A single brand of infant follow-on-formula milk was selected for the quantitative analysis in
both the ready-to-feed (RTF) and the powdered form, in order to determine the impact of
preparation methods on fatty acid content of formula milks. The selected infant formula milk
was suitable for an infant aged 6 months + and available in the supermarkets in the UK
between June and July 2014. The selection of this particular brand was based on the inclusion
of ALA, LA, DHA and AA content being present on the nutritional label of the infant
formula milk, where other brands on the UK market did not provide such information. Three
independent replicates were analyzed before the use by date of the product within one month
of purchase. The selected infant formula milk was stored, unopened, at room temperature,
similar to their distribution and market environment.
Four different commonly practiced re-heating treatment methods of the selected infant
formula milk were assessed, which are commonly practiced by parents and in accordance
with the manufacturer’s instructions including:
a) Control RTF infant formula milk had no heat treatment applied prior to analysis.
b) Heated RTF infant formula milk was prepared by placing the bottle of RTF infant formula
milk in previously boiled water (15 minutes after boiling) as advised by the manufacturer.
The infant formula milk reached a maximum temperature of 50 ± 0.5°C, which was left to
cool down to 37°C prior to analysis.
c) Microwaved RTF infant formula milk was prepared by microwaving 120 mL of RTF
infant formula milk for 30 seconds, which reached a maximum temperature of 50 ± 0.5°C,
which was left to cool down to 37°C prior to analysis. It is important to note that this type of
preparation method is not advised by manufacturers; however it is commonly used by parents
for the preparation of infant formula milk and therefore its inclusion is warranted.
d) Powdered infant formula milk was prepared by reconstituting 6 scoops of powdered milk
to 180 mL of previously boiled water at the temperature of 88 ± 0.5°C as advised by the
manufacturer. The reconstituted infant formula milk reached a maximum temperature of 81 ±
0.5°C and was cooled down to 37°C after being subjected to running cold water.
It is important to mention that a control could not be used for the powdered form of the brand
of infant formula milk selected as it would not dissolve in cold water.
122
Samples from each of the different preparation methods were left to cool to 37°C prior to
analysis, the recommended temperature for the consumption of milk by infants. 1 mL of each
sample was dissolved in 5 mL isopropanol/water (3:2, v:v) with 10 mg/L BHA and 1 mL 5 M
KOH, which were then heated in an 80°C water bath for 1 hour with occasional stirring.
After cooling at room temperature a 500 μL aliquot was removed and 25 μL of formic acid
was added to neutralize the sample prior to 15 μL being injected into the HPLC-CAD.
3.2.4 Sample collection for nutritional labelling evaluation of infant formula milks
Four of the leading brands of follow-on infant formula milk available at leading supermarkets
in the UK were also selected for nutritional evaluation based on the information provided on
the nutritional labels with respect to fatty acid content.
3.2.5 HPLC–CAD analysis
A reverse phase (RP) HPLC-CAD methodology was employed for the analysis of fatty acids
in this study (Acworth, et al., 2011). CAD has successfully been used for the detection of
various different lipids (Lisa, et al., 2007; Moreau, 2006; 2009; Plante, et al., 2009). CAD
offers low detection limits, a dynamic range over four orders of magnitude, good
reproducibility, gradient compatibility, and similar analyte responses for non-volatile species
independent of chemical structure. Lipids typically lack chromophores and therefore do not
exhibit any significant response to UV absorption. CAD and evaporative light scattering
detection (ELSD) involve similar nebulisation stages with different methods of detection;
however CAD avoids the complex mixture of light scattering mechanisms which creates a
limited dynamic range and non-uniformity of responses using ELSD detection. Furthermore
CAD is typically ten times more sensitive compared to ELSD. With respect to gas
chromatography analysis, fatty acids require derivatisation and auto-oxidation of fatty acids
may be an issue, in addition to thermal degradation of certain lipids (Plante et al., 2009).
An Agilent 1200 series RP-HPLC system was used for the analysis, equipped with a
quaternary pump, thermostated autosampler set to 15°C, and a Thermo
Scientific™
Dionex™
Corona™
ultra RS™
Charged Aerosol Detector. An Acclaim™ C30
column (250 x 3 mm), with a 3 μm particle size from Thermo Scientific (UK) was used for
analysis.
123
Separation was performed at 30°C using a gradient system consisting of Mobile phase A
[water, formic acid, mobile phase B (900:3.6:100)], Mobile phase B [acetone, acetonitrile,
tetrahydrofuran, formic acid (675:225:100:4)] at a flow rate of 0.5 mL/min. The gradient
system used had a A:B starting composition of 29:71 (v/v), respectively, which was gradually
increased over 20 minutes to reach 73% B. At 20 minutes the composition was changed to
95% B and held at this composition for 10 minutes. Finally the composition of B was
decreased back to its original composition of 71% for 10 minutes with a stop time at 40
minutes. Injection volume of 15 μL, nebulizer temperature of 15°C and the corona filter set to
high was used for analysis. The retention time for the fatty acids were 9.8, 10.2, 11.8, 12.7
and13.6 min for EPA, ALA, DHA, AA and LA, respectively (shown in Fig. 3.1).
Figure 3.1 HPLC-CAD chromatogram of fatty acids: EPA (9.772 min), ALA (10.238 min),
DHA (11.778 min), AA (12.735 min) and LA (13.547 min).
3.2.6 Limit of Detection (LOD) and Limit of Quantification (LOQ)
Six different standard solutions of EPA, ALA, DHA, AA (0.02 – 2 mg/mL) and LA (0.1 – 10
mg/mL) were prepared following dilution of stock solution (10 mg/mL) using absolute
ethanol with 1 mg/mL BHT. Calibration curves were fitted using the power function. The
limit of detection (LOD) and limit of quantification (LOQ) were determined using the signal-
to-noise ratio (S/N) of the lowest three concentrations (Table 3.2).
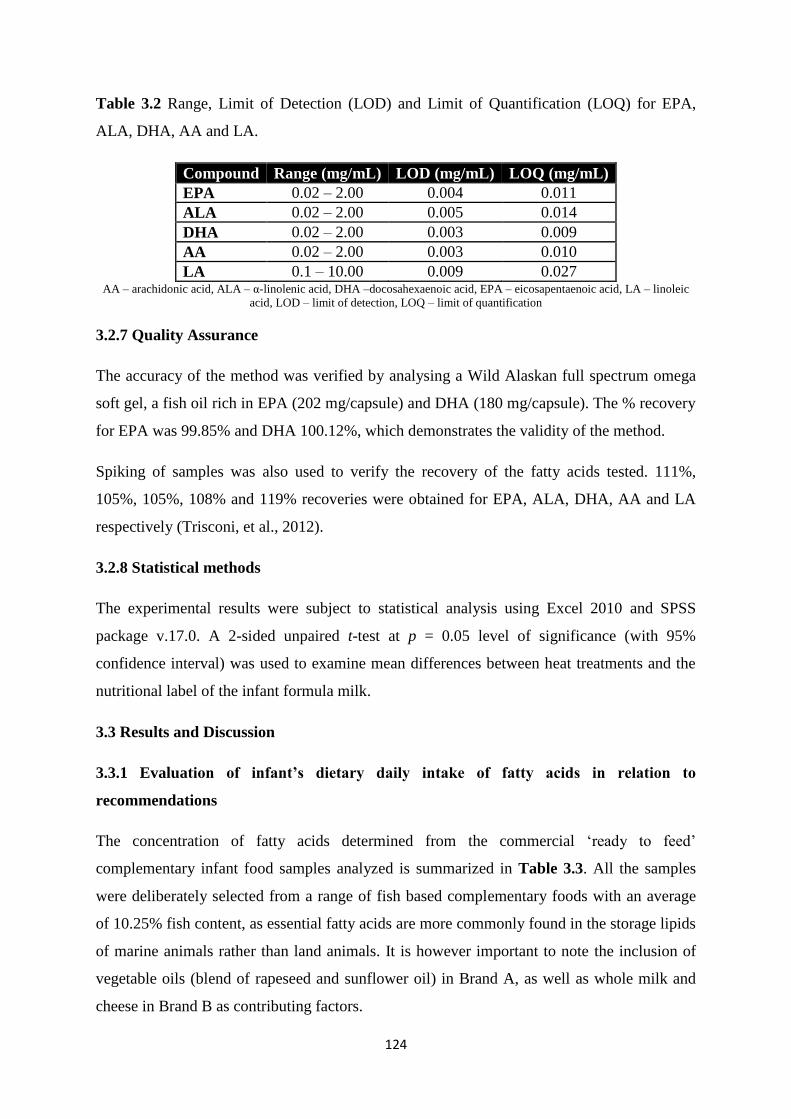
124
Table 3.2 Range, Limit of Detection (LOD) and Limit of Quantification (LOQ) for EPA,
ALA, DHA, AA and LA.
Compound Range (mg/mL) LOD (mg/mL) LOQ (mg/mL)
EPA 0.02 – 2.00 0.004 0.011
ALA 0.02 – 2.00 0.005 0.014
DHA 0.02 – 2.00 0.003 0.009
AA 0.02 – 2.00 0.003 0.010
LA 0.1 – 10.00 0.009 0.027 AA – arachidonic acid, ALA – α-linolenic acid, DHA –docosahexaenoic acid, EPA – eicosapentaenoic acid, LA – linoleic
acid, LOD – limit of detection, LOQ – limit of quantification
3.2.7 Quality Assurance
The accuracy of the method was verified by analysing a Wild Alaskan full spectrum omega
soft gel, a fish oil rich in EPA (202 mg/capsule) and DHA (180 mg/capsule). The % recovery
for EPA was 99.85% and DHA 100.12%, which demonstrates the validity of the method.
Spiking of samples was also used to verify the recovery of the fatty acids tested. 111%,
105%, 105%, 108% and 119% recoveries were obtained for EPA, ALA, DHA, AA and LA
respectively (Trisconi, et al., 2012).
3.2.8 Statistical methods
The experimental results were subject to statistical analysis using Excel 2010 and SPSS
package v.17.0. A 2-sided unpaired t-test at p = 0.05 level of significance (with 95%
confidence interval) was used to examine mean differences between heat treatments and the
nutritional label of the infant formula milk.
3.3 Results and Discussion
3.3.1 Evaluation of infant’s dietary daily intake of fatty acids in relation to
recommendations
The concentration of fatty acids determined from the commercial ‘ready to feed’
complementary infant food samples analyzed is summarized in Table 3.3. All the samples
were deliberately selected from a range of fish based complementary foods with an average
of 10.25% fish content, as essential fatty acids are more commonly found in the storage lipids
of marine animals rather than land animals. It is however important to note the inclusion of
vegetable oils (blend of rapeseed and sunflower oil) in Brand A, as well as whole milk and
cheese in Brand B as contributing factors.
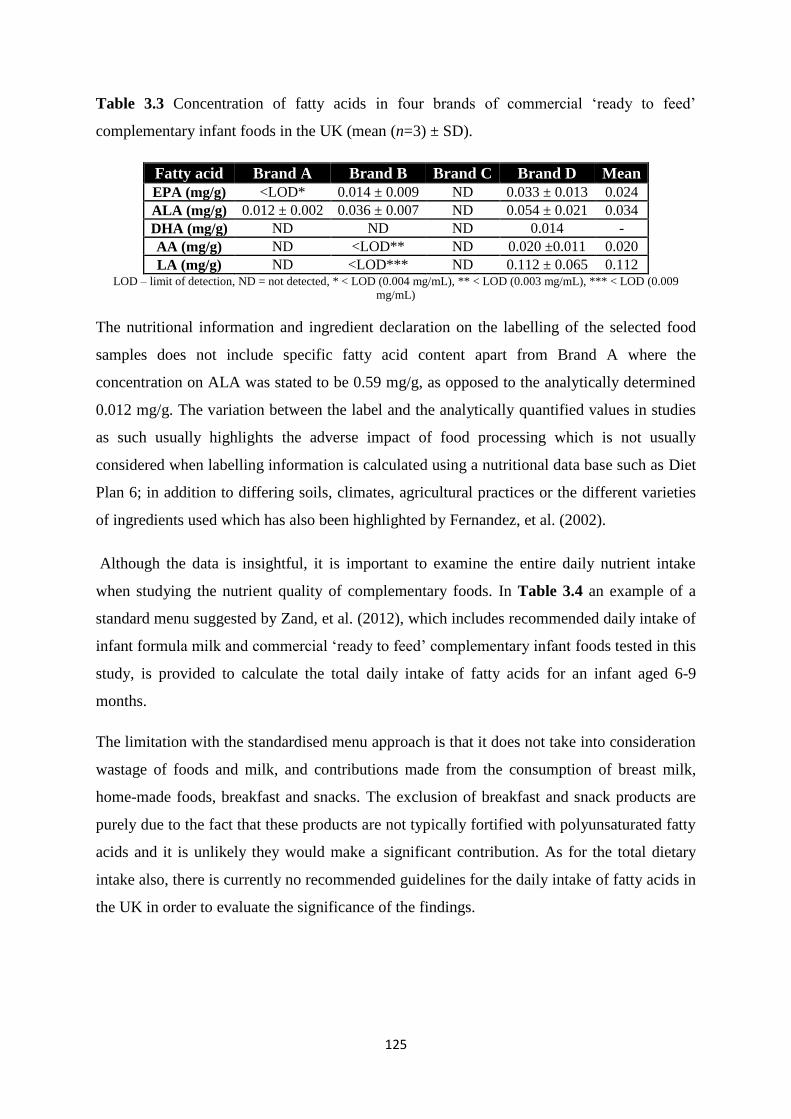
125
Table 3.3 Concentration of fatty acids in four brands of commercial ‘ready to feed’
complementary infant foods in the UK (mean (n=3) ± SD).
Fatty acid Brand A Brand B Brand C Brand D Mean
EPA (mg/g) <LOD* 0.014 ± 0.009 ND 0.033 ± 0.013 0.024
ALA (mg/g) 0.012 ± 0.002 0.036 ± 0.007 ND 0.054 ± 0.021 0.034
DHA (mg/g) ND ND ND 0.014 -
AA (mg/g) ND <LOD** ND 0.020 ±0.011 0.020
LA (mg/g) ND <LOD*** ND 0.112 ± 0.065 0.112 LOD – limit of detection, ND = not detected, * < LOD (0.004 mg/mL), ** < LOD (0.003 mg/mL), *** < LOD (0.009
mg/mL)
The nutritional information and ingredient declaration on the labelling of the selected food
samples does not include specific fatty acid content apart from Brand A where the
concentration on ALA was stated to be 0.59 mg/g, as opposed to the analytically determined
0.012 mg/g. The variation between the label and the analytically quantified values in studies
as such usually highlights the adverse impact of food processing which is not usually
considered when labelling information is calculated using a nutritional data base such as Diet
Plan 6; in addition to differing soils, climates, agricultural practices or the different varieties
of ingredients used which has also been highlighted by Fernandez, et al. (2002).
Although the data is insightful, it is important to examine the entire daily nutrient intake
when studying the nutrient quality of complementary foods. In Table 3.4 an example of a
standard menu suggested by Zand, et al. (2012), which includes recommended daily intake of
infant formula milk and commercial ‘ready to feed’ complementary infant foods tested in this
study, is provided to calculate the total daily intake of fatty acids for an infant aged 6-9
months.
The limitation with the standardised menu approach is that it does not take into consideration
wastage of foods and milk, and contributions made from the consumption of breast milk,
home-made foods, breakfast and snacks. The exclusion of breakfast and snack products are
purely due to the fact that these products are not typically fortified with polyunsaturated fatty
acids and it is unlikely they would make a significant contribution. As for the total dietary
intake also, there is currently no recommended guidelines for the daily intake of fatty acids in
the UK in order to evaluate the significance of the findings.
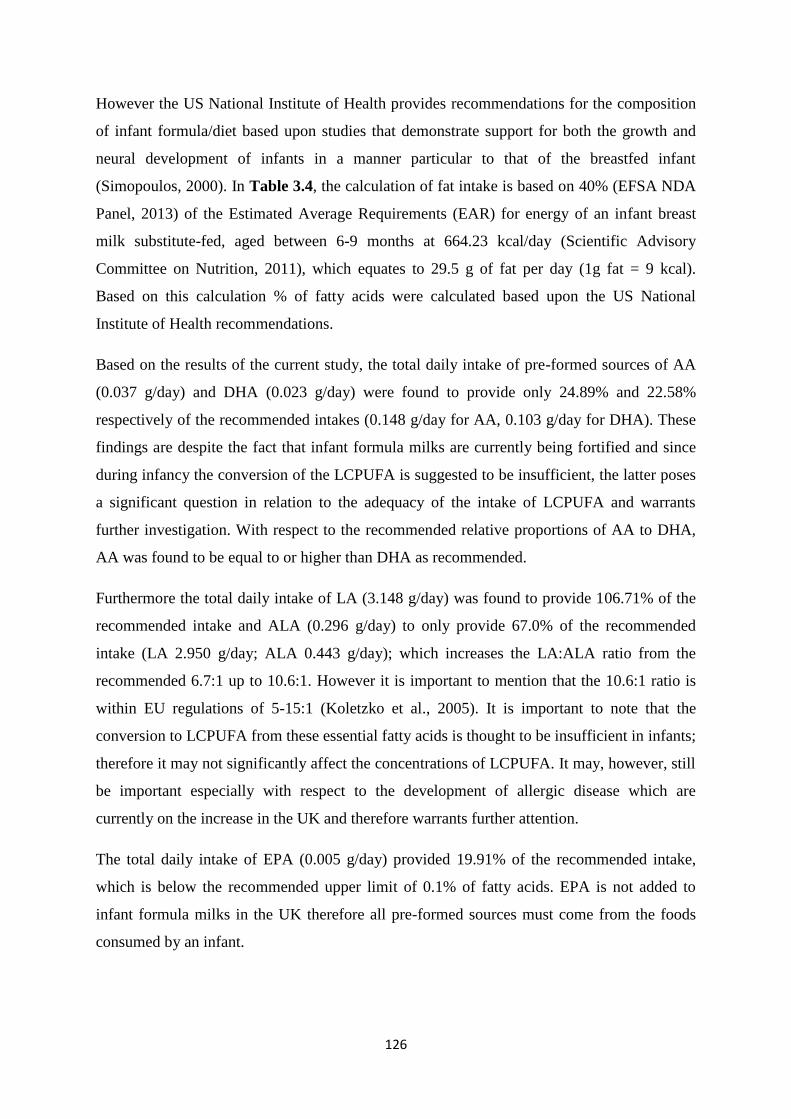
126
However the US National Institute of Health provides recommendations for the composition
of infant formula/diet based upon studies that demonstrate support for both the growth and
neural development of infants in a manner particular to that of the breastfed infant
(Simopoulos, 2000). In Table 3.4, the calculation of fat intake is based on 40% (EFSA NDA
Panel, 2013) of the Estimated Average Requirements (EAR) for energy of an infant breast
milk substitute-fed, aged between 6-9 months at 664.23 kcal/day (Scientific Advisory
Committee on Nutrition, 2011), which equates to 29.5 g of fat per day (1g fat = 9 kcal).
Based on this calculation % of fatty acids were calculated based upon the US National
Institute of Health recommendations.
Based on the results of the current study, the total daily intake of pre-formed sources of AA
(0.037 g/day) and DHA (0.023 g/day) were found to provide only 24.89% and 22.58%
respectively of the recommended intakes (0.148 g/day for AA, 0.103 g/day for DHA). These
findings are despite the fact that infant formula milks are currently being fortified and since
during infancy the conversion of the LCPUFA is suggested to be insufficient, the latter poses
a significant question in relation to the adequacy of the intake of LCPUFA and warrants
further investigation. With respect to the recommended relative proportions of AA to DHA,
AA was found to be equal to or higher than DHA as recommended.
Furthermore the total daily intake of LA (3.148 g/day) was found to provide 106.71% of the
recommended intake and ALA (0.296 g/day) to only provide 67.0% of the recommended
intake (LA 2.950 g/day; ALA 0.443 g/day); which increases the LA:ALA ratio from the
recommended 6.7:1 up to 10.6:1. However it is important to mention that the 10.6:1 ratio is
within EU regulations of 5-15:1 (Koletzko et al., 2005). It is important to note that the
conversion to LCPUFA from these essential fatty acids is thought to be insufficient in infants;
therefore it may not significantly affect the concentrations of LCPUFA. It may, however, still
be important especially with respect to the development of allergic disease which are
currently on the increase in the UK and therefore warrants further attention.
The total daily intake of EPA (0.005 g/day) provided 19.91% of the recommended intake,
which is below the recommended upper limit of 0.1% of fatty acids. EPA is not added to
infant formula milks in the UK therefore all pre-formed sources must come from the foods
consumed by an infant.
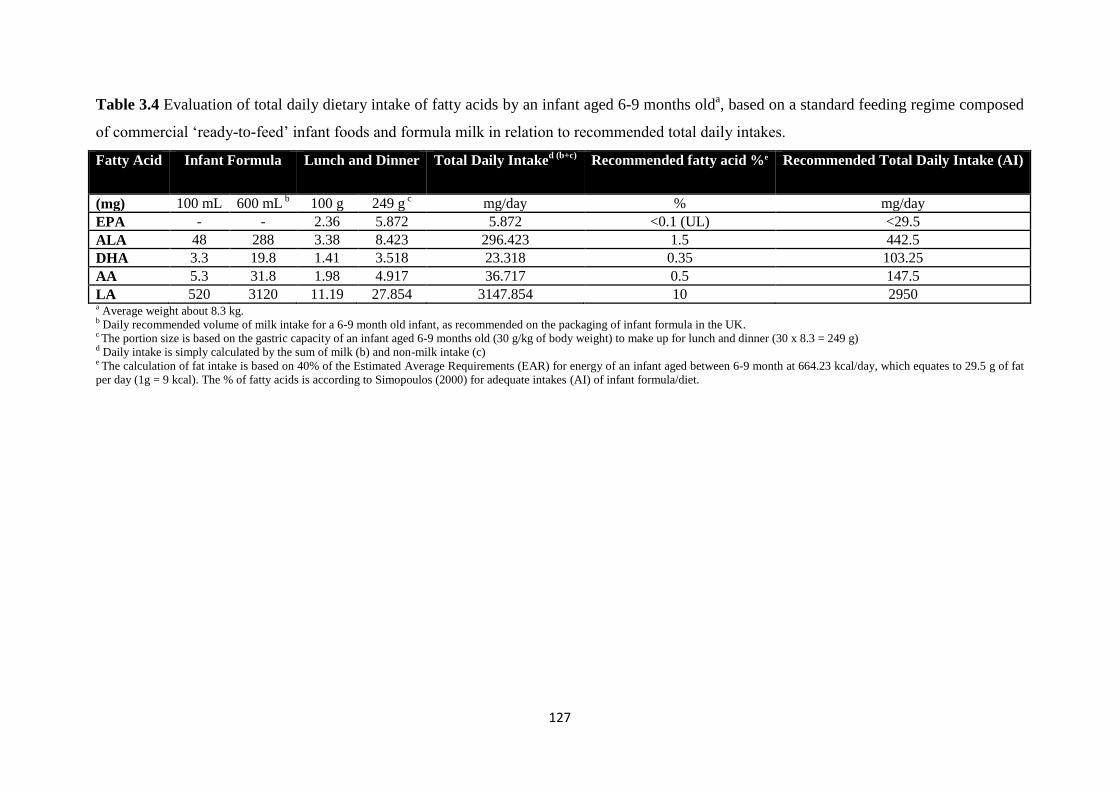
127
Table 3.4 Evaluation of total daily dietary intake of fatty acids by an infant aged 6-9 months olda, based on a standard feeding regime composed
of commercial ‘ready-to-feed’ infant foods and formula milk in relation to recommended total daily intakes.
Fatty Acid Infant Formula Lunch and Dinner Total Daily Intaked (b+c)
Recommended fatty acid %e
Recommended Total Daily Intake (AI)
(mg) 100 mL 600 mL b 100 g 249 g
c mg/day % mg/day
EPA - - 2.36 5.872 5.872 <0.1 (UL) <29.5
ALA 48 288 3.38 8.423 296.423 1.5 442.5
DHA 3.3 19.8 1.41 3.518 23.318 0.35 103.25
AA 5.3 31.8 1.98 4.917 36.717 0.5 147.5
LA 520 3120 11.19 27.854 3147.854 10 2950 a Average weight about 8.3 kg. b Daily recommended volume of milk intake for a 6-9 month old infant, as recommended on the packaging of infant formula in the UK. c The portion size is based on the gastric capacity of an infant aged 6-9 months old (30 g/kg of body weight) to make up for lunch and dinner (30 x 8.3 = 249 g)
d Daily intake is simply calculated by the sum of milk (b) and non-milk intake (c) e The calculation of fat intake is based on 40% of the Estimated Average Requirements (EAR) for energy of an infant aged between 6-9 month at 664.23 kcal/day, which equates to 29.5 g of fat
per day (1g = 9 kcal). The % of fatty acids is according to Simopoulos (2000) for adequate intakes (AI) of infant formula/diet.
128
Formula milk alone provides 0% of EPA, 65.09% of ALA, 19.18% of DHA, 21.56% of AA
and 105.76% of LA in the infant’s daily diet. The contribution from commercial ‘ready to
feed’ complementary infant foods (249 g per day) in this study were found to be low with
only 19.91% contribution from EPA, 1.90% ALA, 3.41% DHA, 3.33% AA and 0.94% LA.
To meet the recommended requirements the intake from sources other than infant formula
milk need to provide 100% of EPA, 34.92% of ALA, 80.82% of DHA, 78.44% of AA, with
no contribution of LA. This is clearly not being met from the commercial ‘ready to feed’
complementary infant foods tested in this study. This may become an issue if milk intake is
compromised or when infants consume less infant formula milk which is the case after the
first year of life. Therefore parents may need to choose fortified food products to meet
requirements. This also provides opportunities and scope for product optimization to improve
the nutritive value of commercial infant food products.
The LA intakes found to be above recommendations may in part be due to the use of cooking
oils containing high levels of the n-6 fatty acid LA as well as grain based animal feeds rich in
LA. In addition low intakes of oily fish rich in long chain n-3 fatty acids in the infant’s diet
could offer some explanation for the lower intakes of n-3 LCPUFA (Simopoulos, 2000).
3.3.2 Impact of commonly practiced re-heating treatments for the preparation of infant
formula milk and the transparency of the nutritional labels
Infant formula milk has been identified as the main source of essential fatty acids in an
infant’s diet, it is therefore important to consider the detrimental impact which processing or
domestic preparation of the infant formula milk could impose both on the quantity and also
the quality of the daily intake, for instance oxidation and isomerization of the long chains of
unsaturated fatty acids. The second part of this study was to investigate the commonly
practiced re-heating treatments used by parents for the preparation of infant formula milk and
its effects on fatty acid content.
The concentration of fatty acids for each re-heating treatment is shown in Table 3.5. The data
shows a significant 12.62% decrease in the concentration of LA in the control RTF formula
milk to the heated RTF formula milk (p = 0.04). There was also a significant decrease of
22.22% in ALA and 15.24% decrease in LA from the microwaved RTF treatment to the
heated RTF treatment (p = 0.002; p = 0.01 respectively). Overal microwaving appears to be
least influential on the retention of fatty acids, which may be due to the shortened length of
time that the formula milk is subjected to elevated temperatures. These findings indicate that
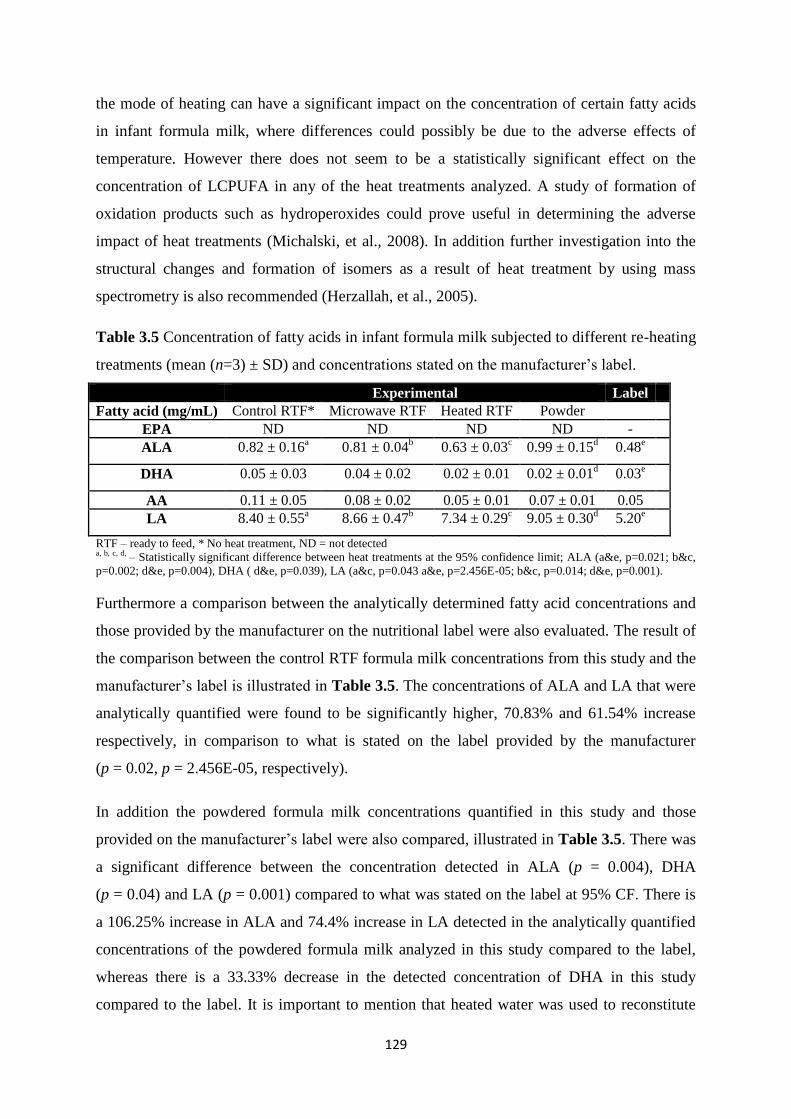
129
the mode of heating can have a significant impact on the concentration of certain fatty acids
in infant formula milk, where differences could possibly be due to the adverse effects of
temperature. However there does not seem to be a statistically significant effect on the
concentration of LCPUFA in any of the heat treatments analyzed. A study of formation of
oxidation products such as hydroperoxides could prove useful in determining the adverse
impact of heat treatments (Michalski, et al., 2008). In addition further investigation into the
structural changes and formation of isomers as a result of heat treatment by using mass
spectrometry is also recommended (Herzallah, et al., 2005).
Table 3.5 Concentration of fatty acids in infant formula milk subjected to different re-heating
treatments (mean (n=3) ± SD) and concentrations stated on the manufacturer’s label.
Experimental Label
Fatty acid (mg/mL) Control RTF* Microwave RTF Heated RTF Powder
EPA ND ND ND ND -
ALA 0.82 ± 0.16a
0.81 ± 0.04b
0.63 ± 0.03c 0.99 ± 0.15
d 0.48
e
DHA 0.05 ± 0.03 0.04 ± 0.02 0.02 ± 0.01 0.02 ± 0.01d
0.03e
AA 0.11 ± 0.05 0.08 ± 0.02 0.05 ± 0.01 0.07 ± 0.01 0.05
LA 8.40 ± 0.55a
8.66 ± 0.47b
7.34 ± 0.29c 9.05 ± 0.30
d 5.20
e
RTF – ready to feed, * No heat treatment, ND = not detected a, b, c, d, – Statistically significant difference between heat treatments at the 95% confidence limit; ALA (a&e, p=0.021; b&c,
p=0.002; d&e, p=0.004), DHA ( d&e, p=0.039), LA (a&c, p=0.043 a&e, p=2.456E-05; b&c, p=0.014; d&e, p=0.001).
Furthermore a comparison between the analytically determined fatty acid concentrations and
those provided by the manufacturer on the nutritional label were also evaluated. The result of
the comparison between the control RTF formula milk concentrations from this study and the
manufacturer’s label is illustrated in Table 3.5. The concentrations of ALA and LA that were
analytically quantified were found to be significantly higher, 70.83% and 61.54% increase
respectively, in comparison to what is stated on the label provided by the manufacturer
(p = 0.02, p = 2.456E-05, respectively).
In addition the powdered formula milk concentrations quantified in this study and those
provided on the manufacturer’s label were also compared, illustrated in Table 3.5. There was
a significant difference between the concentration detected in ALA (p = 0.004), DHA
(p = 0.04) and LA (p = 0.001) compared to what was stated on the label at 95% CF. There is
a 106.25% increase in ALA and 74.4% increase in LA detected in the analytically quantified
concentrations of the powdered formula milk analyzed in this study compared to the label,
whereas there is a 33.33% decrease in the detected concentration of DHA in this study
compared to the label. It is important to mention that heated water was used to reconstitute
130
the powdered infant formula milk. An un-heated control using cold water could not be used
as the powder would not fully dissolve. Therefore effects could be due to the heat treatment
used to prepare the infant formula milk.
The majority of fatty acids precursors (ALA and LA) are obtained from the infant formula
milk in an infant’s diet, 65.09% and 105.76%, respectively (Table 3.4); therefore, any
detrimental effects arising from preparation using elevated temperatures could have an
impact on the nutritional adequacy of the infant’s diet and subsequent development. It is
important to be aware that infant formula milk provides 5.76% over the recommended LA
intake and it is necessary to be aware that the Western diet is known to already be higher in
LA and lower in n-3 polyunsaturated fatty acids. This could have an impact on allergy
development. High proportions of AA and DHA are required to be supplied by the diet
(78.44% and 80.82% respectively), which based on this study is not being met by the
contribution from commercial ‘ready to feed’ complementary infant foods. This could have
detrimental effects on the infant’s cognitive and visual development. If recommendations are
to be met complementary infant foods may need to be fortified with LCPUFA.
Fatty acids can have major differences in both physical and biological characteristics
depending on their isomers being cis or trans. The cis formation is mainly used for metabolic
and structural purposes. It has been observed that the trans formation is less absorbed in
comparison to its cis counterpart. Unsaturated fatty acids from vegetable oil and most animal
sources adopt the cis formation. The synthesis of LCPUFA may be impaired by trans fatty
acids, this is important to consider for infants growth and development. Recently there has
been increased interest in trans fatty acids as they have been linked to cardiovascular disease
(Uauy & Castillo, 2003). High temperatures make fats susceptible to direct isomerization
(Department of Health, 1991). One of the limitations with this study was the fact that the
mass based detection of compounds in this study (CAD) was not useful in determining the
types of isomers. However a study using gas chromatography mass spectrometry by Precht,
et al. (1999) looked at the isomerization of milk fats with heating; strongest isomerization
effects were found after heating at 300°C, however at 200°C only slight changes were
observed. Temperatures did not exceed 90°C in the heat treatments used to prepare infant
formula milks in this study; therefore cis and trans isomerization should be low, if any in the
treatments used to make up infant formula milks by parents.
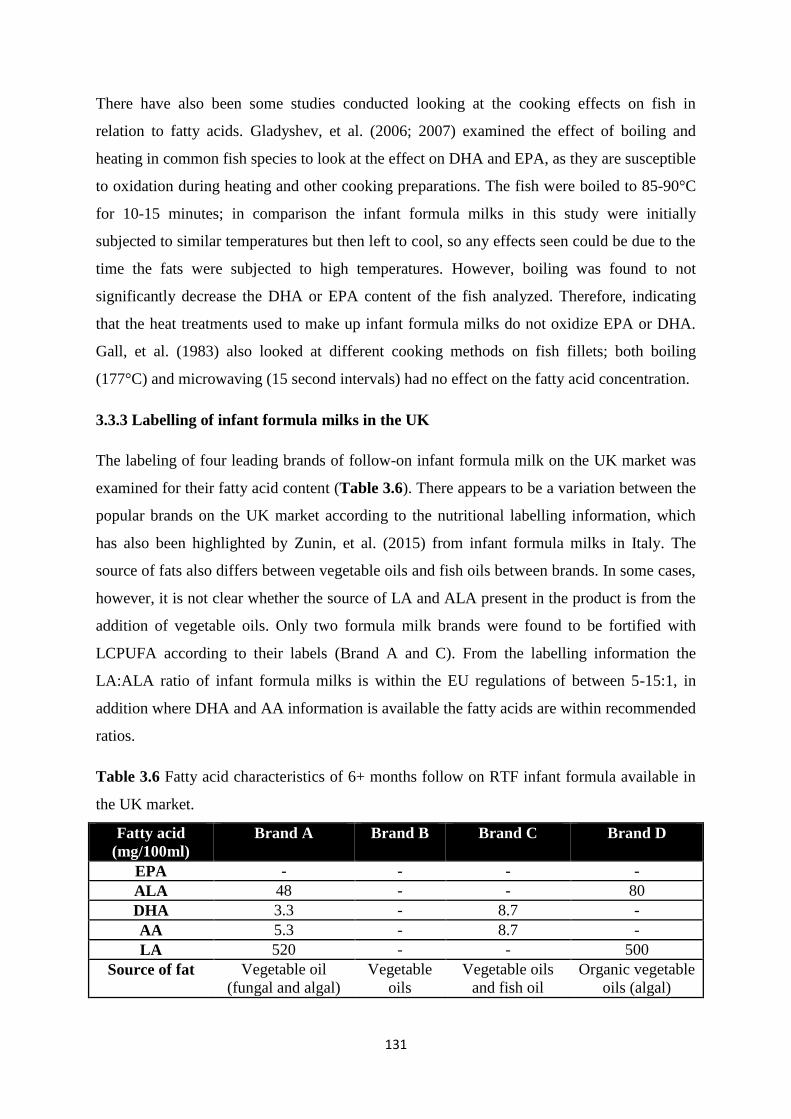
131
There have also been some studies conducted looking at the cooking effects on fish in
relation to fatty acids. Gladyshev, et al. (2006; 2007) examined the effect of boiling and
heating in common fish species to look at the effect on DHA and EPA, as they are susceptible
to oxidation during heating and other cooking preparations. The fish were boiled to 85-90°C
for 10-15 minutes; in comparison the infant formula milks in this study were initially
subjected to similar temperatures but then left to cool, so any effects seen could be due to the
time the fats were subjected to high temperatures. However, boiling was found to not
significantly decrease the DHA or EPA content of the fish analyzed. Therefore, indicating
that the heat treatments used to make up infant formula milks do not oxidize EPA or DHA.
Gall, et al. (1983) also looked at different cooking methods on fish fillets; both boiling
(177°C) and microwaving (15 second intervals) had no effect on the fatty acid concentration.
3.3.3 Labelling of infant formula milks in the UK
The labeling of four leading brands of follow-on infant formula milk on the UK market was
examined for their fatty acid content (Table 3.6). There appears to be a variation between the
popular brands on the UK market according to the nutritional labelling information, which
has also been highlighted by Zunin, et al. (2015) from infant formula milks in Italy. The
source of fats also differs between vegetable oils and fish oils between brands. In some cases,
however, it is not clear whether the source of LA and ALA present in the product is from the
addition of vegetable oils. Only two formula milk brands were found to be fortified with
LCPUFA according to their labels (Brand A and C). From the labelling information the
LA:ALA ratio of infant formula milks is within the EU regulations of between 5-15:1, in
addition where DHA and AA information is available the fatty acids are within recommended
ratios.
Table 3.6 Fatty acid characteristics of 6+ months follow on RTF infant formula available in
the UK market.
Fatty acid
(mg/100ml)
Brand A Brand B Brand C Brand D
EPA - - - -
ALA 48 - - 80
DHA 3.3 - 8.7 -
AA 5.3 - 8.7 -
LA 520 - - 500
Source of fat Vegetable oil
(fungal and algal)
Vegetable
oils
Vegetable oils
and fish oil
Organic vegetable
oils (algal)
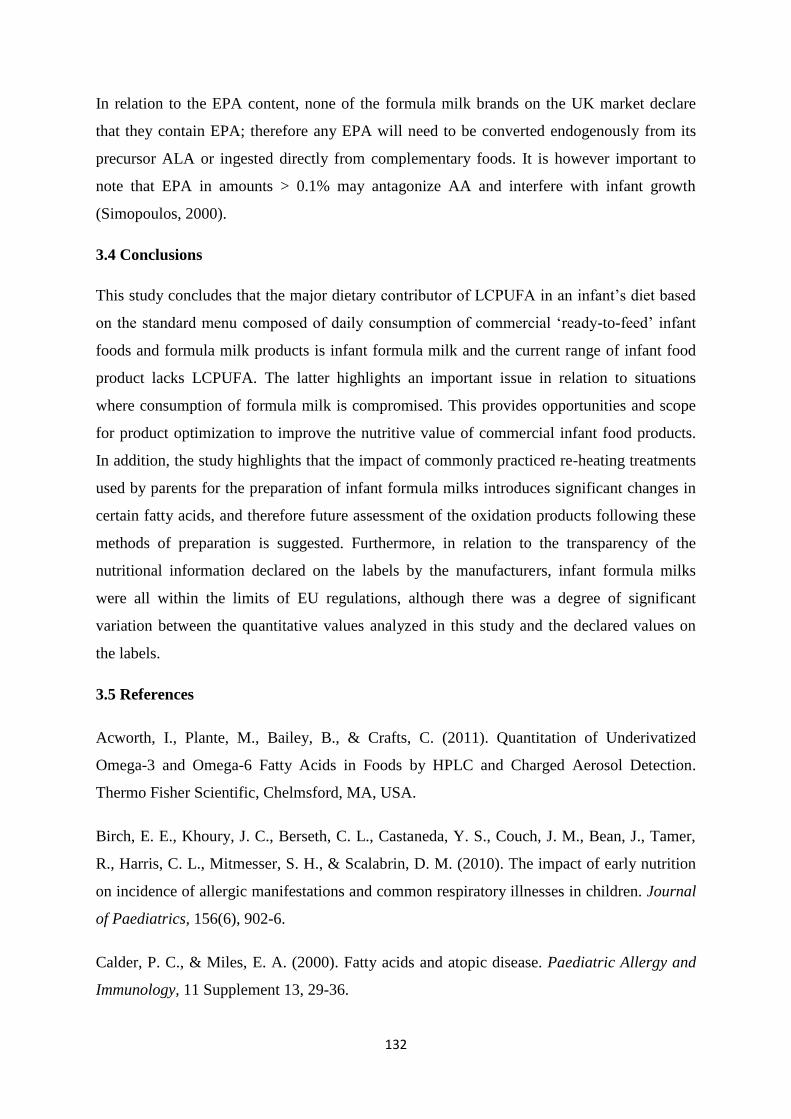
132
In relation to the EPA content, none of the formula milk brands on the UK market declare
that they contain EPA; therefore any EPA will need to be converted endogenously from its
precursor ALA or ingested directly from complementary foods. It is however important to
note that EPA in amounts > 0.1% may antagonize AA and interfere with infant growth
(Simopoulos, 2000).
3.4 Conclusions
This study concludes that the major dietary contributor of LCPUFA in an infant’s diet based
on the standard menu composed of daily consumption of commercial ‘ready-to-feed’ infant
foods and formula milk products is infant formula milk and the current range of infant food
product lacks LCPUFA. The latter highlights an important issue in relation to situations
where consumption of formula milk is compromised. This provides opportunities and scope
for product optimization to improve the nutritive value of commercial infant food products.
In addition, the study highlights that the impact of commonly practiced re-heating treatments
used by parents for the preparation of infant formula milks introduces significant changes in
certain fatty acids, and therefore future assessment of the oxidation products following these
methods of preparation is suggested. Furthermore, in relation to the transparency of the
nutritional information declared on the labels by the manufacturers, infant formula milks
were all within the limits of EU regulations, although there was a degree of significant
variation between the quantitative values analyzed in this study and the declared values on
the labels.
3.5 References
Acworth, I., Plante, M., Bailey, B., & Crafts, C. (2011). Quantitation of Underivatized
Omega-3 and Omega-6 Fatty Acids in Foods by HPLC and Charged Aerosol Detection.
Thermo Fisher Scientific, Chelmsford, MA, USA.
Birch, E. E., Khoury, J. C., Berseth, C. L., Castaneda, Y. S., Couch, J. M., Bean, J., Tamer,
R., Harris, C. L., Mitmesser, S. H., & Scalabrin, D. M. (2010). The impact of early nutrition
on incidence of allergic manifestations and common respiratory illnesses in children. Journal
of Paediatrics, 156(6), 902-6.
Calder, P. C., & Miles, E. A. (2000). Fatty acids and atopic disease. Paediatric Allergy and
Immunology, 11 Supplement 13, 29-36.
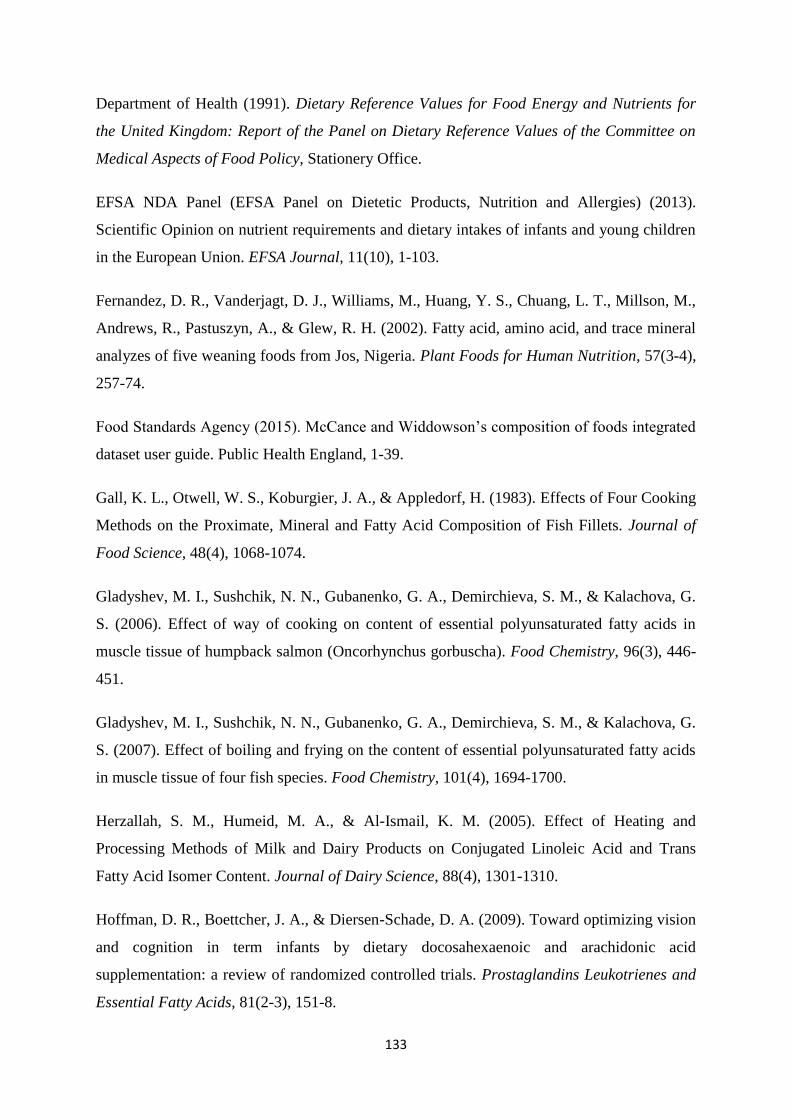
133
Department of Health (1991). Dietary Reference Values for Food Energy and Nutrients for
the United Kingdom: Report of the Panel on Dietary Reference Values of the Committee on
Medical Aspects of Food Policy, Stationery Office.
EFSA NDA Panel (EFSA Panel on Dietetic Products, Nutrition and Allergies) (2013).
Scientific Opinion on nutrient requirements and dietary intakes of infants and young children
in the European Union. EFSA Journal, 11(10), 1-103.
Fernandez, D. R., Vanderjagt, D. J., Williams, M., Huang, Y. S., Chuang, L. T., Millson, M.,
Andrews, R., Pastuszyn, A., & Glew, R. H. (2002). Fatty acid, amino acid, and trace mineral
analyzes of five weaning foods from Jos, Nigeria. Plant Foods for Human Nutrition, 57(3-4),
257-74.
Food Standards Agency (2015). McCance and Widdowson’s composition of foods integrated
dataset user guide. Public Health England, 1-39.
Gall, K. L., Otwell, W. S., Koburgier, J. A., & Appledorf, H. (1983). Effects of Four Cooking
Methods on the Proximate, Mineral and Fatty Acid Composition of Fish Fillets. Journal of
Food Science, 48(4), 1068-1074.
Gladyshev, M. I., Sushchik, N. N., Gubanenko, G. A., Demirchieva, S. M., & Kalachova, G.
S. (2006). Effect of way of cooking on content of essential polyunsaturated fatty acids in
muscle tissue of humpback salmon (Oncorhynchus gorbuscha). Food Chemistry, 96(3), 446-
451.
Gladyshev, M. I., Sushchik, N. N., Gubanenko, G. A., Demirchieva, S. M., & Kalachova, G.
S. (2007). Effect of boiling and frying on the content of essential polyunsaturated fatty acids
in muscle tissue of four fish species. Food Chemistry, 101(4), 1694-1700.
Herzallah, S. M., Humeid, M. A., & Al-Ismail, K. M. (2005). Effect of Heating and
Processing Methods of Milk and Dairy Products on Conjugated Linoleic Acid and Trans
Fatty Acid Isomer Content. Journal of Dairy Science, 88(4), 1301-1310.
Hoffman, D. R., Boettcher, J. A., & Diersen-Schade, D. A. (2009). Toward optimizing vision
and cognition in term infants by dietary docosahexaenoic and arachidonic acid
supplementation: a review of randomized controlled trials. Prostaglandins Leukotrienes and
Essential Fatty Acids, 81(2-3), 151-8.
134
Innis, S. M. (2007). Fatty acids and early human development. Early Human Development,
83(12), 761-766.
Innis, S. M. (2008). Dietary omega 3 fatty acids and the developing brain. Brain Research,
1237(0), 35-43.
Koletzko, B., Baker, S., Cleghorn, G., Neto, U. F., Gopalan, S., Hernell, O., Hock, Q. S.,
Jirapinyo, P., Lonnerdal, B., Pencharz, P., Pzyrembel, H., Ramirez-Mayans, J., Shamir, R.,
Turck, D., Yamashiro, Y., & Zong-Yi, D. (2005). Global standard for the composition of
infant formula: recommendations of an ESPGHAN coordinated international expert group.
Journal of Paediatric Gastroenterology and Nutrition, 41(5), 584-99.
Lennox, A., Sommerville, J., Ong, K., Henderson, H., & Allen, R. (2013). Diet and nutrition
survey of infants and young children, 2011. Public Health England, 1-107.
Lisa, M., Lynen, F., Holčapek, M., & Sandra, P. (2007). Quantitation of triacylglycerols from
plant oils using charged aerosol detection with gradient compensation. Journal of
Chromatography A, 1176(1), 135-142.
Makrides, M., Neumann, M. A., Jeffrey, B., Lien, E. L., & Gibson, R. A. (2000). A
randomized trial of different ratios of linoleic to α-linolenic acid in the diet of term infants:
effects on visual function and growth. The American Journal of Clinical Nutrition, 71(1),
120-129.
Martínez-Yusta, A., Goicoechea, E., & Guillén, M. D. (2014). A Review of Thermo-
Oxidative Degradation of Food Lipids Studied by 1H NMR Spectroscopy: Influence of
Degradative Conditions and Food Lipid Nature, Comprehensive Reviews in Food Science and
Food Safety, 13(5), 838-859.
Michalski, M. C., Calzada, C., Makino, A., Michaud, S., & Guichardant, M. (2008).
Oxidation products of polyunsaturated fatty acids in infant formulas compared to human
milk-a preliminary study. Molecular Nutrition and Food Research, 52(12), 1478-85.
Moreau, R. A. (2006). The analysis of lipids via HPLC with a charged aerosol detector.
Lipids, 41(7), 727-34.
135
Moreau, R. A. (2009). Lipid analysis via HPLC with a charged aerosol detector. Lipid
Technology, 21(8-9), 191-194.
Plante, M., Bailey, B., & Acworth, I. (2009). The use of charged aerosol detection with
HPLC for the measurement of lipids. Lipidomics Springer, 469-482.
Precht, D., Molkentin, J., & Vahlendieck, M. (1999). Influence of the heating temperature on
the fat composition of milk fat with emphasis on cis-/trans-isomerization. Food / Nahrung,
43(1), 25-33.
Santos-Fandila, A., Camino-Sánchez, F., & Zafra-Gómez, A. (2014). Degradation Markers in
Nutritional Products a Review. Austin Journal of Analytical Pharmaceutical Chemistry, 1(1),
1005.
Scientific Advisory Committee on Nutrition (2011). SACN Dietary Reference Values for
Energy. Public Health England, 1-228.
Simmer, K., Patole, S. K., & Rao, S. C. (2011). Long-chain polyunsaturated fatty acid
supplementation in infants born at term. Cochrane Database System Reviews, (12),
Cd000376. DOI: 10.1002/14651858.CD000376.pub2.
Simopoulos, A. P. (2000). Human Requirement for N-3 Polyunsaturated Fatty Acids. Poultry
Science, 79(7), 961-970.
Statista (2008a). Brands of baby and junior foods ranked by number of users in the United
Kingdom (UK) in 2014 (in 1,000 people). Available at:
http://www.statista.com/statistics/303901/leading-baby-and-junior-food-brands-in-the-uk/.
Statista (2008b). Market share of grocery stores in Great Britain for 12 weeks ending July 19,
2015. Available at: http://www.statista.com/statistics/279900/grocery-market-share-in-the-
united-kingdom-uk/.
Trisconi, M. J., Campos-Gimenez, E., Jaudzems, G., & Dowell, D. (2012). Determination of
vitamin A in infant formula and adult nutritionals by UPLC-UV: First Action 2011.07.
Journal of AOAC International, 95(2), 301-6.
Uauy, R., & Castillo, C. (2003). Lipid requirements of infants: implications for nutrient
composition of fortified complementary foods. Journal of Nutrition, 133(9), 2962s-72s.

136
Zand, N., Chowdhry, B. Z., Pullen, F. S., Snowden, M. J., & Tetteh, J. (2012). Simultaneous
determination of riboflavin and pyridoxine by UHPLC/LC-MS in UK commercial infant
meal food products. Food Chemistry, 135(4), 2743-9.
Zunin, P., Boggia, R., Turrini, F., & Leardi, R. (2015). Total and “free” lipids in commercial
infant formulas: Fatty acid composition and their stability to oxidation. Food Chemistry,
173(0), 332-338.
137
Chapter 4
Vitamin A and E content of commercial infant foods in the UK: a
cause for concern?
4.1 Introduction
Vitamin A consists of a group of lipid soluble vitamins that have an important role in growth
and development, vision and immune function. Dietary vitamin A is obtained from two
sources: pre-formed vitamin A and provitamin A. Pre-formed vitamin A includes retinol,
retinal, retinoic acid and retinyl esters, which are available from animal sources mainly in the
form of retinyl esters. Conversely provitamin A’s are precursors of vitamin A in the form of
carotenoids, which are available from plant derived sources (Department of Health, 1991).
Plants synthesise hundreds of carotenoids, however only some act as vitamin A precursors.
β-Carotene is the most important carotenoid due to its increased vitamin A activity compared
to other carotenoids and its widespread availability in the diet. The increased vitamin A
activity of β-carotene is due to its conversion into two retinal molecules. Absorption rates of
pre-formed vitamin A range between 70 – 90%, whereas provitamin A are absorbed less
efficiently at rates ranging between 20 – 50% (Preedy, 2012).
Vitamin E is another group of lipid soluble vitamins consisting of eight isomers: four
tocopherols (α, β, γ and δ) and four tocotrienols (α, β, γ and δ). The most biologically active
form of vitamin E is α-tocopherol, which is also the most abundant form present in the
European diet due to the use of olive and sunflower oil (Wagner, et al., 2004).
Vitamin E primarily functions as a chain breaking antioxidant. It protects membrane
phospholipids from peroxidation and prevents free radical generation in cell membranes
(Greene, et al., 1988). α-Tocopherol can intercept free radicals and prevent the oxidation of
the lipids in cell membrane (Baydas, et al., 2002). Immune system cells contain the most
vitamin E due to their exposure to high levels of oxidative stress (Suskina & Tontisirin,
2001). Therefore, vitamin E may play a role in the prevention or protection against asthma
and allergic disease inflammation, which currently are increasing in the UK. A maternal
feeding study observed an association between increased intakes of vitamin E during
pregnancy and decreased childhood wheeze and asthma (Devereux, et al., 2006). Oxidative
stress and inflammation may have a role in cardiovascular disease and cancer however the
138
current knowledge on the role of vitamin E in in these diseases is not conclusive (Lee et al.,
2005).
Dietary polyunsaturated fatty acid (PUFA) intake influences tissue fatty acid content and the
dose of vitamin E required to prevent lipid peroxidation is directly related to PUFA intake
(Greene, et al., 1988). The bioavailability and metabolism of vitamin E is largely unclear and
ranges between 10 - 79%; nevertheless factors have been identified that will affect vitamin E
uptake and utilisation within the body such as the food matrix and the amount and type of fat
(Borel, et al., 2013).
During food processing, retinoids and carotenoids can undergo isomerization due to exposure
with acids, heat and light. Thermal treatments can either cause isomerization, from trans to
cis, or oxidation. However, heating can also promote carotenoid absorption, possibly due to
the release of carotenoids from its matrix. Homogenization of foods can also improve the
availability of carotenoids. Processing methods such as dehydration, blanching and canning
can cause either oxidation or isomerization of carotenoids (Klein & Kurilich, 2000). However
retinol and carotenoids have been found to be relatively stable throughout most cooking
procedures with industrial food processes such as pasteurization and sterilization generally
only resulting in small losses (Committee on Toxicity, 2012). Processing of foods, such as
drying in the presence of air and sunlight, addition of organic acids, milling and refining,
irradiation and canning have been shown to reduce vitamin E content of foods, along with
high temperatures, prolonged storage and high moisture contents. Seasonal changes in
vitamin E levels have also been shown in food products (Eitenmiller & Lee, 2004). Therefore
the actual content of vitamin E in commercial infant foods may vary due to processing and
seasonality of products used for production.
The diet and nutrition survey of infants and young children (DNSIYC) has identified that
58% of children who are fed foods other than milk have eaten a commercial baby or toddler
meal (Lennox, et al., 2013). These results indicate that commercial baby and toddler meals
are major dietary contributors to an infant’s nutritional intake, therefore these products need
to be assessed for their nutritional adequacy. Furthermore there is currently no clear and
complete analytical nutritional data available for commercial ‘ready-to-feed’ complementary
infant foods in the UK. The nutritional database in the UK, McCance and Widdowson,
contains limited data on the composition of commercial infant foods, in addition the
analytical techniques and nutrient data contained may now be outdated. It is essential that
139
food composition tables are regularly updated with the current foods available on the market
(Food Standards Agency, 2015).
The DNSIYC has shown that mean intakes of vitamin A and E are close to or in excess of the
Recommended Nutrient Intake (RNI) (Lennox, et al., 2013). Furthermore in the US 35% of
toddlers exceed the Tolerable Upper Intake Level (UL) of 600 μg/day for vitamin A and
vitamin E intakes were found to exceed the recommended adequate intakes of infants below
12 months (Butte, et al., 2010).
Vitamin A deficiency is common in developing countries with common symptoms to include
visual impairments (Department of Health, 1991). However, in developed countries such as
the UK, excess vitamin A intakes may be more of an issue. Excess retinol can cause liver and
bone damage, hair loss, double vision, vomiting and headaches. It can also decrease vitamin
C storage, antagonise the action of vitamin K’s blood clotting function and have anti-thyroid
effects (Committee on Toxicity, 2014). Toxicity usually arises from chronic ingestion, which
exceeds the ability of the liver to store of metabolise excess vitamin A.
High vitamin E intakes could potentially have antagonistic effects on the other fat soluble
vitamins such as vitamin A, D and K in relation to absorption. It has been observed that
infants have low vitamin K levels and studies have indicated that individuals with low
vitamin K levels should not be consuming excessive vitamin E due to blood clotting effects
(Diplock, et al., 1998). High intakes of vitamin E could cause pro-oxidant effects due to the
production of α-tocopherol radicals, however if antioxidant systems are balanced for example
by the sparing effect of vitamin C detrimental effects will not be exhibited (Rietjens, et al.,
2002). However vitamin E is one of the least toxic vitamins and no evidence of negative side
effects of vitamin E that occurs naturally in foods has been observed (Eitenmiller & Lee,
2004).
This study assessed the intake of vitamin A (pre-formed vitamin A, retinyl palmitate and
retinyl acetate and provitamin A, β-carotene and total carotenoid content as retinol
equivalents, RE) and vitamin E (α-tocopherol and γ-tocopherol as α-tocopherol equivalents,
α-TE) based on a diet consisting of commercial ‘ready-to-feed’ infant foods and infant
formula in the form of a standardized menu as suggested by Zand, et al., (2012), and the
results were compared with current recommendations to assess the adequacy of intake.
140
4.2 Materials and methods
4.2.1 Chemicals
Retinyl acetate, retinyl palmitate, β-carotene, methyl tert-butyl ether (MTBE), α-tocopherol
and γ-tocopherol were obtained from Sigma-Aldrich (Poole, UK). The reference material
(ERM – BD600) was purchased from the Institute for Reference Materials and Measurements
for Certified Reference materials (Geel, Belgium). High performance liquid chromatography
(HPLC)-grade iso-hexane, ethyl acetate, absolute ethanol, methanol, tetrahydrofuran (THF),
and laboratory reagent grade sodium chloride (NaCl), petroleum ether (PE) (bp 40-60°C) and
anhydrous sodium sulphate were obtained from Fisher Scientific (Loughborough, UK).
4.2.2 Sample collection
Eight different baby food samples were obtained from leading supermarkets in the UK
between June and July 2014. The samples represented four popular brands available on the
market (Statista, 2008). All brands were represented by two different product categories: (i)
meat based and (ii) vegetable based. The main ingredients of the baby food samples and their
characteristics are presented in Table 4.1. Three independent replicates of all samples were
analyzed. The samples were stored unopened at room temperature, similar to their
distribution and market environment.
4.2.3 Sample preparation for retinyl acetate, retinyl palmitate, and α-tocopherol and
γ-tocopherol analysis
Each of the food samples were mixed and homogenized using a domestic blender (Multi-
quick, Braun 3000) and three independent replicates of 1 g (wet weight) were transferred into
a centrifuge tube. The samples were then treated according to the methods described by
Chávez-Servín, et al. (2006). Three millilitres of absolute ethanol were added and the mixture
shaken mechanically for 3 minutes prior to adding 1 mL of hexane and the mixture was
shaken for a further minute. The samples were then left to stand for 5 minutes, after which 3
mL of saturated NaCl was added to aid solvent separation. Samples were inverted manually
before being centrifuged for 5 minutes at 3000 rpm at room temperature. The hexane phase
was recovered and directly filtered through a 0.22 μm nylon filter and collected in a 1 mL
amber glass vial. 0.4 mL of sample was spiked with 0.4 mL of a standard solution prior to
20 μL being injected into the HPLC system.
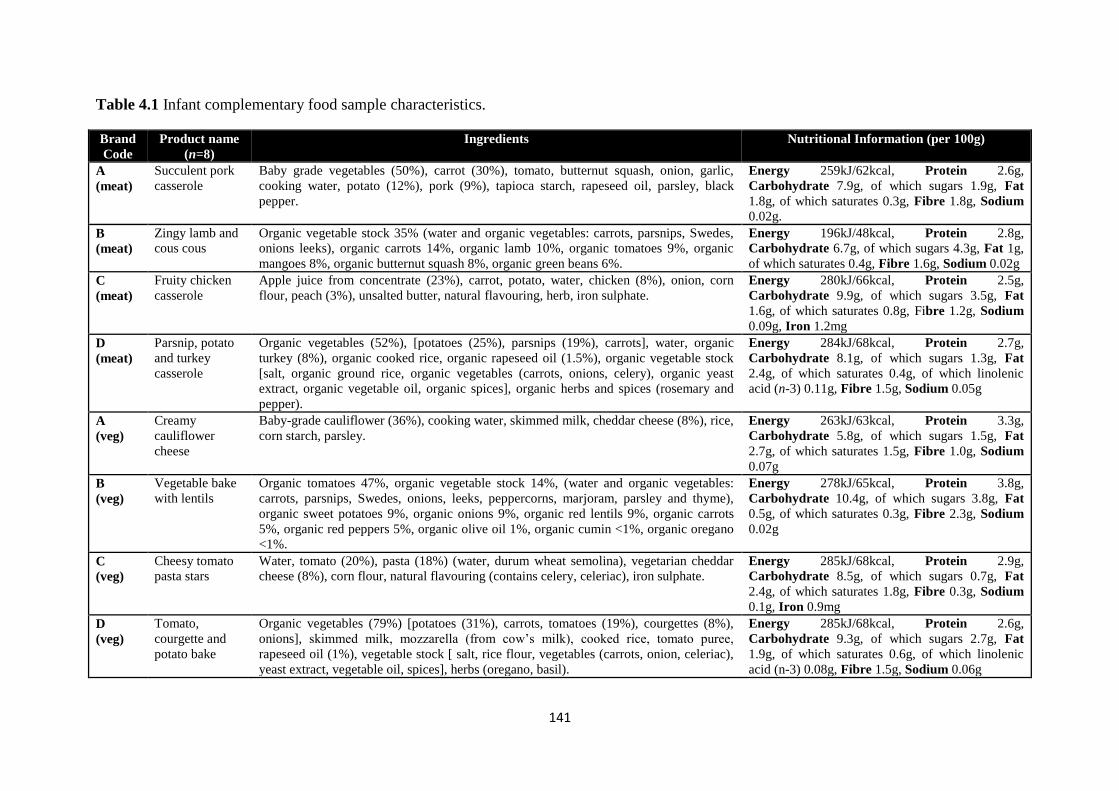
141
Table 4.1 Infant complementary food sample characteristics.
Brand
Code
Product name
(n=8)
Ingredients Nutritional Information (per 100g)
A
(meat)
Succulent pork
casserole
Baby grade vegetables (50%), carrot (30%), tomato, butternut squash, onion, garlic,
cooking water, potato (12%), pork (9%), tapioca starch, rapeseed oil, parsley, black
pepper.
Energy 259kJ/62kcal, Protein 2.6g,
Carbohydrate 7.9g, of which sugars 1.9g, Fat
1.8g, of which saturates 0.3g, Fibre 1.8g, Sodium
0.02g.
B
(meat)
Zingy lamb and
cous cous
Organic vegetable stock 35% (water and organic vegetables: carrots, parsnips, Swedes,
onions leeks), organic carrots 14%, organic lamb 10%, organic tomatoes 9%, organic
mangoes 8%, organic butternut squash 8%, organic green beans 6%.
Energy 196kJ/48kcal, Protein 2.8g,
Carbohydrate 6.7g, of which sugars 4.3g, Fat 1g,
of which saturates 0.4g, Fibre 1.6g, Sodium 0.02g
C
(meat)
Fruity chicken
casserole
Apple juice from concentrate (23%), carrot, potato, water, chicken (8%), onion, corn
flour, peach (3%), unsalted butter, natural flavouring, herb, iron sulphate.
Energy 280kJ/66kcal, Protein 2.5g,
Carbohydrate 9.9g, of which sugars 3.5g, Fat
1.6g, of which saturates 0.8g, Fibre 1.2g, Sodium
0.09g, Iron 1.2mg
D
(meat)
Parsnip, potato
and turkey
casserole
Organic vegetables (52%), [potatoes (25%), parsnips (19%), carrots], water, organic
turkey (8%), organic cooked rice, organic rapeseed oil (1.5%), organic vegetable stock
[salt, organic ground rice, organic vegetables (carrots, onions, celery), organic yeast
extract, organic vegetable oil, organic spices], organic herbs and spices (rosemary and
pepper).
Energy 284kJ/68kcal, Protein 2.7g,
Carbohydrate 8.1g, of which sugars 1.3g, Fat
2.4g, of which saturates 0.4g, of which linolenic
acid (n-3) 0.11g, Fibre 1.5g, Sodium 0.05g
A
(veg)
Creamy
cauliflower
cheese
Baby-grade cauliflower (36%), cooking water, skimmed milk, cheddar cheese (8%), rice,
corn starch, parsley.
Energy 263kJ/63kcal, Protein 3.3g,
Carbohydrate 5.8g, of which sugars 1.5g, Fat
2.7g, of which saturates 1.5g, Fibre 1.0g, Sodium
0.07g
B
(veg)
Vegetable bake
with lentils
Organic tomatoes 47%, organic vegetable stock 14%, (water and organic vegetables:
carrots, parsnips, Swedes, onions, leeks, peppercorns, marjoram, parsley and thyme),
organic sweet potatoes 9%, organic onions 9%, organic red lentils 9%, organic carrots
5%, organic red peppers 5%, organic olive oil 1%, organic cumin <1%, organic oregano
<1%.
Energy 278kJ/65kcal, Protein 3.8g,
Carbohydrate 10.4g, of which sugars 3.8g, Fat
0.5g, of which saturates 0.3g, Fibre 2.3g, Sodium
0.02g
C
(veg)
Cheesy tomato
pasta stars
Water, tomato (20%), pasta (18%) (water, durum wheat semolina), vegetarian cheddar
cheese (8%), corn flour, natural flavouring (contains celery, celeriac), iron sulphate.
Energy 285kJ/68kcal, Protein 2.9g,
Carbohydrate 8.5g, of which sugars 0.7g, Fat
2.4g, of which saturates 1.8g, Fibre 0.3g, Sodium
0.1g, Iron 0.9mg
D
(veg)
Tomato,
courgette and
potato bake
Organic vegetables (79%) [potatoes (31%), carrots, tomatoes (19%), courgettes (8%),
onions], skimmed milk, mozzarella (from cow’s milk), cooked rice, tomato puree,
rapeseed oil (1%), vegetable stock [ salt, rice flour, vegetables (carrots, onion, celeriac),
yeast extract, vegetable oil, spices], herbs (oregano, basil).
Energy 285kJ/68kcal, Protein 2.6g,
Carbohydrate 9.3g, of which sugars 2.7g, Fat
1.9g, of which saturates 0.6g, of which linolenic
acid (n-3) 0.08g, Fibre 1.5g, Sodium 0.06g
142
4.2.4 Sample preparation for β-carotene and total carotenoid analysis
The samples were treated according to the methods described by HarvestPlus (Rodriguez-
Amaya & Kimura, 2004). Each of the food samples was mixed and homogenized using a
domestic blender (Multi-quick, Braun 3000) and 3 independent replicates between 0.5-2.5 g
(wet weight) were weighed. Fifty millilitres of THF:methanol (1:1) was added to the sample
for 5 minutes, which was then homogenized using a polytron for 1 minute and subsequently
filtered through a porosity 2-sintered glass funnel under vacuum and rinsed with
THF:methanol until there was no colour left in the filtrate. Twenty millilitres of PE was
added to a 500 mL separating funnel, the extracts were then poured into the separating
funnel, followed by 50 mL of 10% NaCl to aid separation. After washing thrice with 200 mL
of deionised water the upper PE phase which contained the extract was collected in a 100 mL
flask. The PE phase was then dewatered by the addition of anhydrous sodium sulphate, then
filtered into a 50 mL volumetric flask through glass wool and made up with PE. At this stage
spectrophotometer readings were analyzed for total carotenoid content. Twenty millilitres of
extract were collected in a glass vial and brought to dryness using nitrogen. Prior to injection
into the HPLC 0.5 mL of THF:methanol (1:1) was added to reconstitute the dried sample,
finally 5 μL of reconstituted sample was injected into the HPLC system.
4.2.5 HPLC analysis
An Agilent 1200 series normal phase high performance liquid chromatography (NP-HPLC)
system was used, equipped with an isocratic pump, thermostated austosampler set to 6°C and
multiple wavelength detector. A Pinnacle II silica short narrow-bore column (50 mm x 2.1
mm I.D.), with a 3 μm particle size from Restek (Bellefonte, USA) was used for the analysis.
Separation was performed at 30°C using an isocratic mixture of 0.5% ethyl acetate in hexane,
delivered at a flow rate of 0.4 mL/min. Detection for α and γ-tocopherol was at 296 nm
whereas detection of retinyl acetate and retinyl palmitate was at 326 nm. The injection
volume was 20 μL and total run time for each routine injection was 30 minutes. Retention
times for retinyl palmitate, retinyl acetate, α-tocopherol and γ-tocopherol were 1.1 minutes,
2.2 minutes, 3.5 minutes and 8.3 minutes respectively (Fig. 4.1).
For the analysis of β-carotene an Agilent 1200 series reverse phase high performance liquid
chromatography (RP-HPLC) system was used equipped with a quaternary pump,
thermostated autosampler and diode array detector. A YMC C30 column (250 mm x 4.6 mm)
with a 5µm particle size from YMC (Europe GmbH) was used for the analysis. Separation
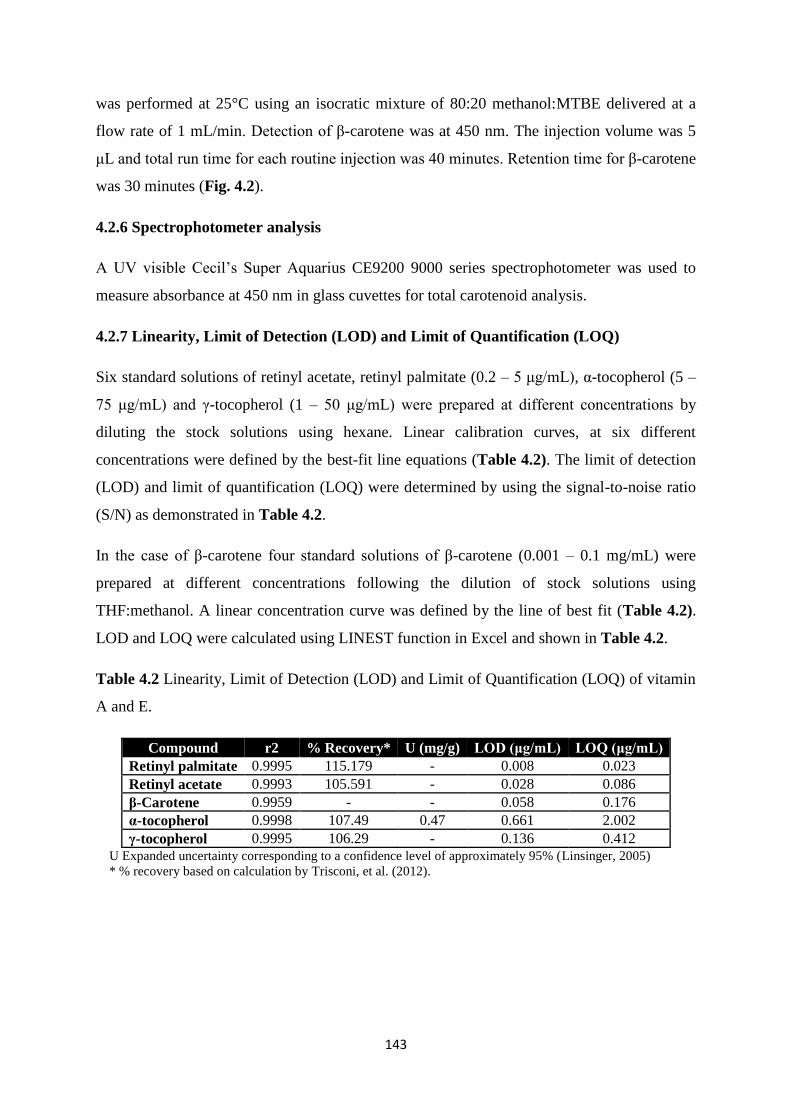
143
was performed at 25°C using an isocratic mixture of 80:20 methanol:MTBE delivered at a
flow rate of 1 mL/min. Detection of β-carotene was at 450 nm. The injection volume was 5
μL and total run time for each routine injection was 40 minutes. Retention time for β-carotene
was 30 minutes (Fig. 4.2).
4.2.6 Spectrophotometer analysis
A UV visible Cecil’s Super Aquarius CE9200 9000 series spectrophotometer was used to
measure absorbance at 450 nm in glass cuvettes for total carotenoid analysis.
4.2.7 Linearity, Limit of Detection (LOD) and Limit of Quantification (LOQ)
Six standard solutions of retinyl acetate, retinyl palmitate (0.2 – 5 μg/mL), α-tocopherol (5 –
75 μg/mL) and γ-tocopherol (1 – 50 μg/mL) were prepared at different concentrations by
diluting the stock solutions using hexane. Linear calibration curves, at six different
concentrations were defined by the best-fit line equations (Table 4.2). The limit of detection
(LOD) and limit of quantification (LOQ) were determined by using the signal-to-noise ratio
(S/N) as demonstrated in Table 4.2.
In the case of β-carotene four standard solutions of β-carotene (0.001 – 0.1 mg/mL) were
prepared at different concentrations following the dilution of stock solutions using
THF:methanol. A linear concentration curve was defined by the line of best fit (Table 4.2).
LOD and LOQ were calculated using LINEST function in Excel and shown in Table 4.2.
Table 4.2 Linearity, Limit of Detection (LOD) and Limit of Quantification (LOQ) of vitamin
A and E.
Compound r2 % Recovery* U (mg/g) LOD (μg/mL) LOQ (μg/mL)
Retinyl palmitate 0.9995 115.179 - 0.008 0.023
Retinyl acetate 0.9993 105.591 - 0.028 0.086
β-Carotene 0.9959 - - 0.058 0.176
α-tocopherol 0.9998 107.49 0.47 0.661 2.002
γ-tocopherol 0.9995 106.29 - 0.136 0.412
U Expanded uncertainty corresponding to a confidence level of approximately 95% (Linsinger, 2005)
* % recovery based on calculation by Trisconi, et al. (2012).
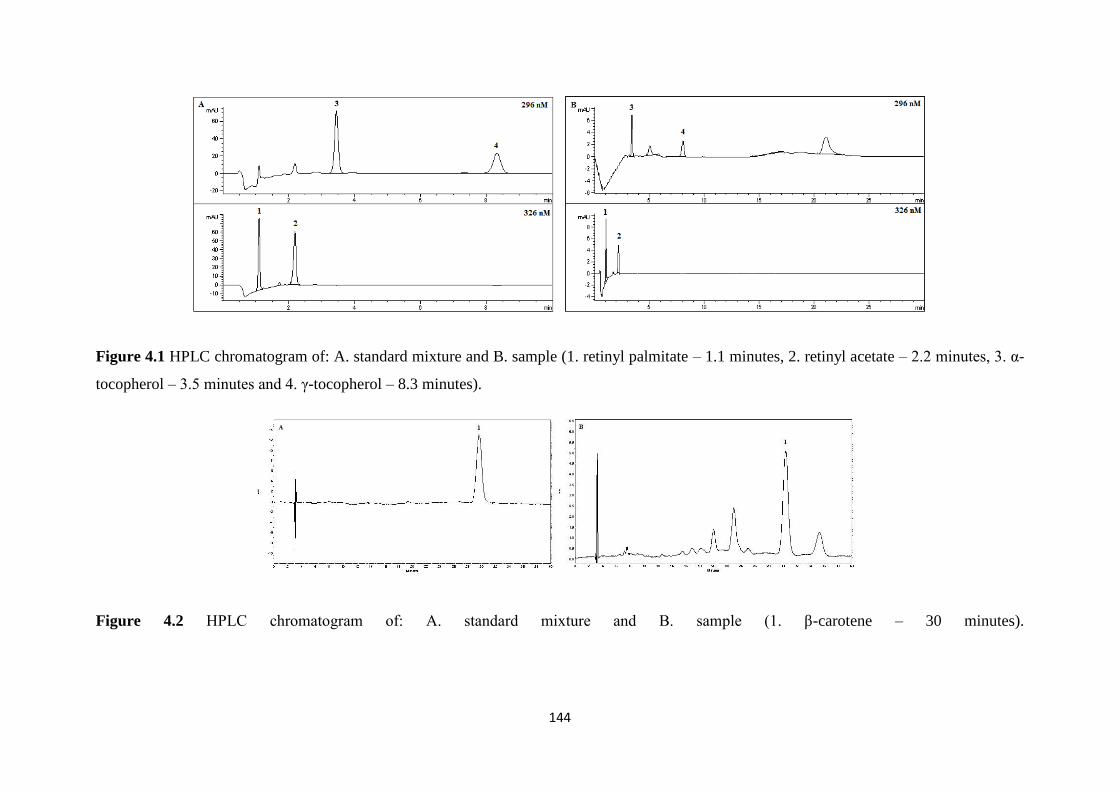
144
Figure 4.1 HPLC chromatogram of: A. standard mixture and B. sample (1. retinyl palmitate – 1.1 minutes, 2. retinyl acetate – 2.2 minutes, 3. α-
tocopherol – 3.5 minutes and 4. γ-tocopherol – 8.3 minutes).
Figure 4.2 HPLC chromatogram of: A. standard mixture and B. sample (1. β-carotene – 30 minutes).
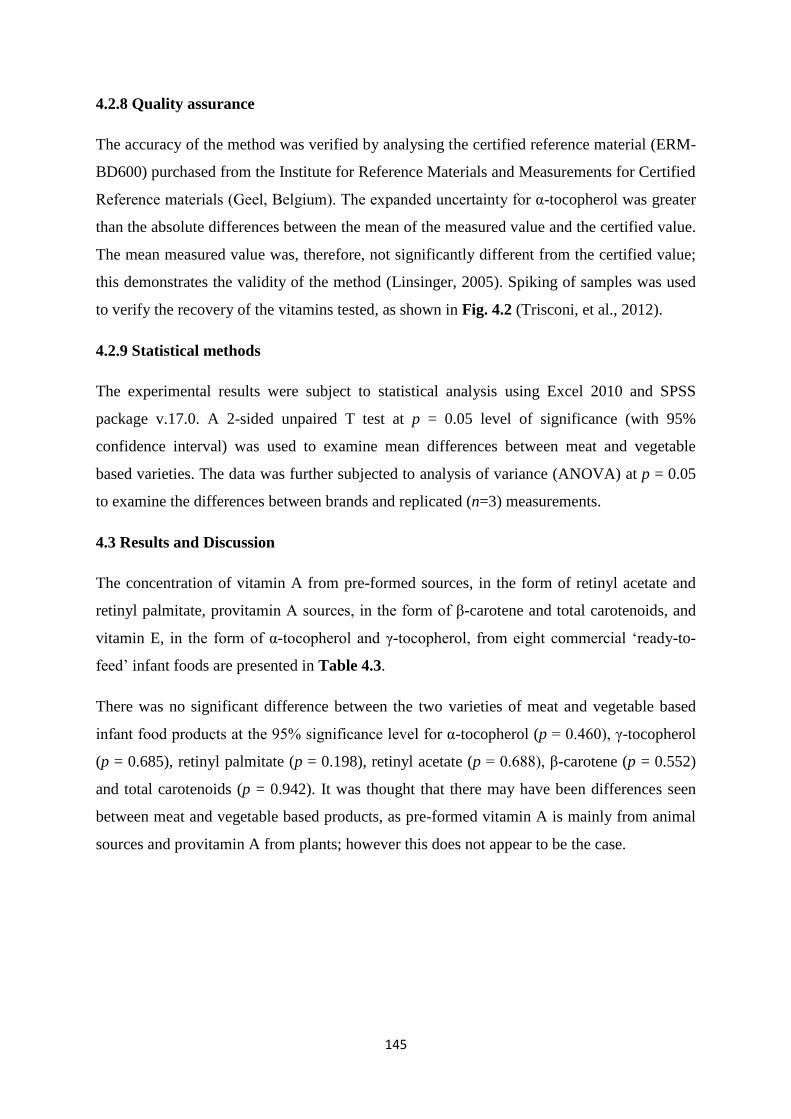
145
4.2.8 Quality assurance
The accuracy of the method was verified by analysing the certified reference material (ERM-
BD600) purchased from the Institute for Reference Materials and Measurements for Certified
Reference materials (Geel, Belgium). The expanded uncertainty for α-tocopherol was greater
than the absolute differences between the mean of the measured value and the certified value.
The mean measured value was, therefore, not significantly different from the certified value;
this demonstrates the validity of the method (Linsinger, 2005). Spiking of samples was used
to verify the recovery of the vitamins tested, as shown in Fig. 4.2 (Trisconi, et al., 2012).
4.2.9 Statistical methods
The experimental results were subject to statistical analysis using Excel 2010 and SPSS
package v.17.0. A 2-sided unpaired T test at p = 0.05 level of significance (with 95%
confidence interval) was used to examine mean differences between meat and vegetable
based varieties. The data was further subjected to analysis of variance (ANOVA) at p = 0.05
to examine the differences between brands and replicated (n=3) measurements.
4.3 Results and Discussion
The concentration of vitamin A from pre-formed sources, in the form of retinyl acetate and
retinyl palmitate, provitamin A sources, in the form of β-carotene and total carotenoids, and
vitamin E, in the form of α-tocopherol and γ-tocopherol, from eight commercial ‘ready-to-
feed’ infant foods are presented in Table 4.3.
There was no significant difference between the two varieties of meat and vegetable based
infant food products at the 95% significance level for α-tocopherol (p = 0.460), γ-tocopherol
(p = 0.685), retinyl palmitate (p = 0.198), retinyl acetate (p = 0.688), β-carotene (p = 0.552)
and total carotenoids (p = 0.942). It was thought that there may have been differences seen
between meat and vegetable based products, as pre-formed vitamin A is mainly from animal
sources and provitamin A from plants; however this does not appear to be the case.
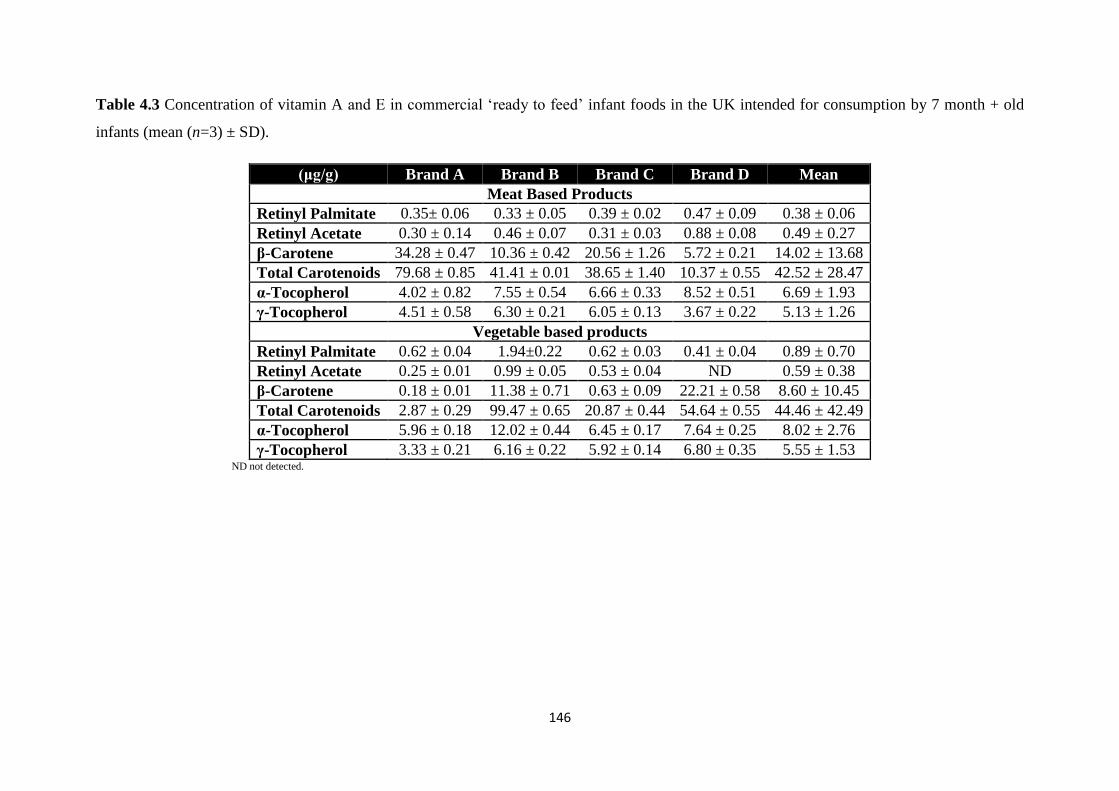
146
Table 4.3 Concentration of vitamin A and E in commercial ‘ready to feed’ infant foods in the UK intended for consumption by 7 month + old
infants (mean (n=3) ± SD).
(μg/g) Brand A Brand B Brand C Brand D Mean
Meat Based Products
Retinyl Palmitate 0.35± 0.06 0.33 ± 0.05 0.39 ± 0.02 0.47 ± 0.09 0.38 ± 0.06
Retinyl Acetate 0.30 ± 0.14 0.46 ± 0.07 0.31 ± 0.03 0.88 ± 0.08 0.49 ± 0.27
β-Carotene 34.28 ± 0.47 10.36 ± 0.42 20.56 ± 1.26 5.72 ± 0.21 14.02 ± 13.68
Total Carotenoids 79.68 ± 0.85 41.41 ± 0.01 38.65 ± 1.40 10.37 ± 0.55 42.52 ± 28.47
α-Tocopherol 4.02 ± 0.82 7.55 ± 0.54 6.66 ± 0.33 8.52 ± 0.51 6.69 ± 1.93
γ-Tocopherol 4.51 ± 0.58 6.30 ± 0.21 6.05 ± 0.13 3.67 ± 0.22 5.13 ± 1.26
Vegetable based products
Retinyl Palmitate 0.62 ± 0.04 1.94±0.22 0.62 ± 0.03 0.41 ± 0.04 0.89 ± 0.70
Retinyl Acetate 0.25 ± 0.01 0.99 ± 0.05 0.53 ± 0.04 ND 0.59 ± 0.38
β-Carotene 0.18 ± 0.01 11.38 ± 0.71 0.63 ± 0.09 22.21 ± 0.58 8.60 ± 10.45
Total Carotenoids 2.87 ± 0.29 99.47 ± 0.65 20.87 ± 0.44 54.64 ± 0.55 44.46 ± 42.49
α-Tocopherol 5.96 ± 0.18 12.02 ± 0.44 6.45 ± 0.17 7.64 ± 0.25 8.02 ± 2.76
γ-Tocopherol 3.33 ± 0.21 6.16 ± 0.22 5.92 ± 0.14 6.80 ± 0.35 5.55 ± 1.53 ND not detected.
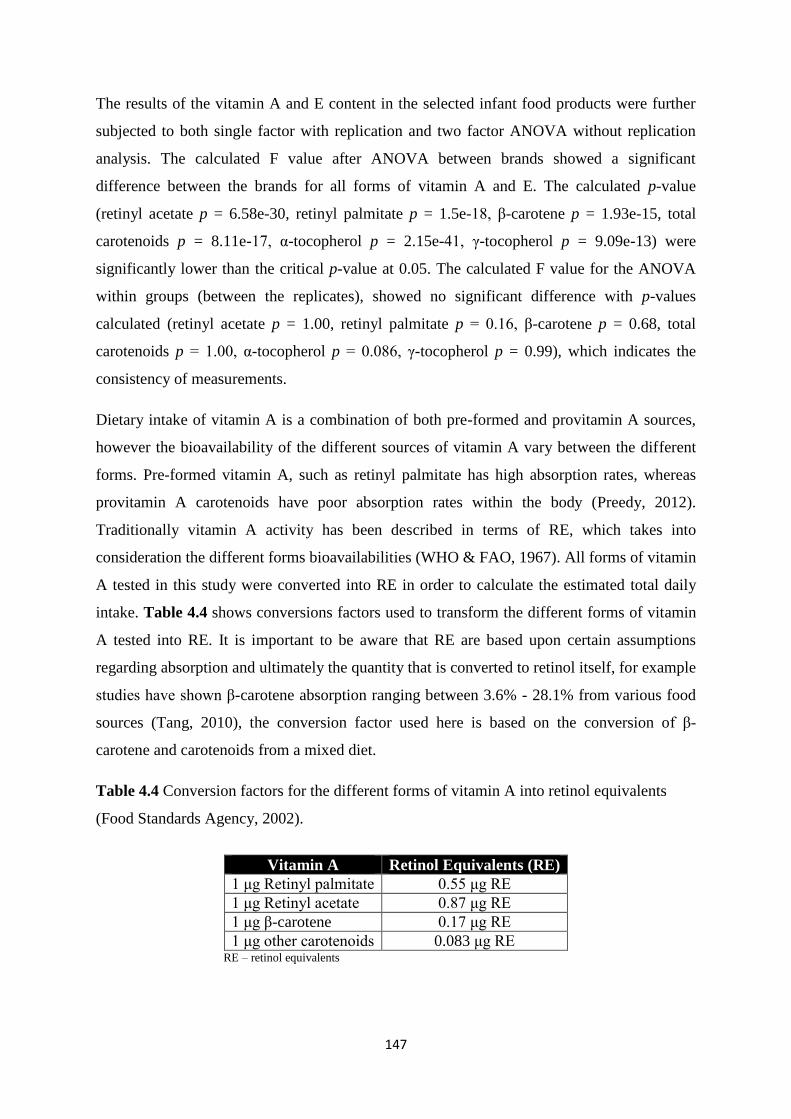
147
The results of the vitamin A and E content in the selected infant food products were further
subjected to both single factor with replication and two factor ANOVA without replication
analysis. The calculated F value after ANOVA between brands showed a significant
difference between the brands for all forms of vitamin A and E. The calculated p-value
(retinyl acetate p = 6.58e-30, retinyl palmitate p = 1.5e-18, β-carotene p = 1.93e-15, total
carotenoids p = 8.11e-17, α-tocopherol p = 2.15e-41, γ-tocopherol p = 9.09e-13) were
significantly lower than the critical p-value at 0.05. The calculated F value for the ANOVA
within groups (between the replicates), showed no significant difference with p-values
calculated (retinyl acetate p = 1.00, retinyl palmitate p = 0.16, β-carotene p = 0.68, total
carotenoids p = 1.00, α-tocopherol p = 0.086, γ-tocopherol p = 0.99), which indicates the
consistency of measurements.
Dietary intake of vitamin A is a combination of both pre-formed and provitamin A sources,
however the bioavailability of the different sources of vitamin A vary between the different
forms. Pre-formed vitamin A, such as retinyl palmitate has high absorption rates, whereas
provitamin A carotenoids have poor absorption rates within the body (Preedy, 2012).
Traditionally vitamin A activity has been described in terms of RE, which takes into
consideration the different forms bioavailabilities (WHO & FAO, 1967). All forms of vitamin
A tested in this study were converted into RE in order to calculate the estimated total daily
intake. Table 4.4 shows conversions factors used to transform the different forms of vitamin
A tested into RE. It is important to be aware that RE are based upon certain assumptions
regarding absorption and ultimately the quantity that is converted to retinol itself, for example
studies have shown β-carotene absorption ranging between 3.6% - 28.1% from various food
sources (Tang, 2010), the conversion factor used here is based on the conversion of β-
carotene and carotenoids from a mixed diet.
Table 4.4 Conversion factors for the different forms of vitamin A into retinol equivalents
(Food Standards Agency, 2002).
Vitamin A Retinol Equivalents (RE)
1 μg Retinyl palmitate 0.55 μg RE
1 μg Retinyl acetate 0.87 μg RE
1 μg β-carotene 0.17 μg RE
1 μg other carotenoids 0.083 μg RE RE – retinol equivalents
148
The vitamin E potential of foods can be expressed as α-TE (Jiang, et al., 2001). In the UK
vitamin E is expressed as α-TE on the labelling of infant formula, therefore α-TE are used to
represent the vitamin E content of the infant’s diet for this particular study. Based on the
vitamin E potential, 1 mg of α-tocopherol is equal to 1 mg of α-TE and 1 mg of γ-tocopherol
is equal to 0.1 mg of α-TE. The γ-tocopherol content of the selected samples therefore was
converted to α-TE in order to represent the true value in calculation of the total daily intake,
shown in Table 4.5.
It is essential to examine the entire nutrient daily intake when assessing the nutrient quality of
complementary foods. To estimate the total daily dietary intake of an infant based on the
consumption of commercial ‘ready-to-feed’ infant foods and infant formula a standardised
menu has been derived, as suggested by Zand, et al. (2012) and based on the manufacturers
feeding recommendations in Table 4.5. The volume of ingested meals was based upon the
gastric capacity of an infant (30 g/kg body weight/day) in accordance with the Committee of
Medical Aspect of food and nutrition policy (COMA) Weaning and Weaning Diet report
(1994). Furthermore the estimated milk consumption used in the standard menu was 600 mL,
which is advised by COMA, for infants up to 12 months.
The recommended nutrient intake (RNI) of vitamin A for infants is based upon the amount
present in breast milk from well-nourished, healthy mothers and is set at 350 μg/day for a
7-12 month old infant. The Department of Health (DOH) also recommends that regular daily
intakes of vitamin A should not exceed 900 μg/day for infants. From the standardised menu
used in this study the infant’s diet exceeds the recommended upper intake dose by 193% and
exceeds the RNI by 497%. This could cause numerous negative effects for the infant. The
vitamin A contribution from infant formula (396 μg) already exceeds the RNI by 13%. The
form of vitamin A in infant formula will be from pre-formed sources of vitamin A, retinol
and retinyl esters (Koletzko, et al., 2005).
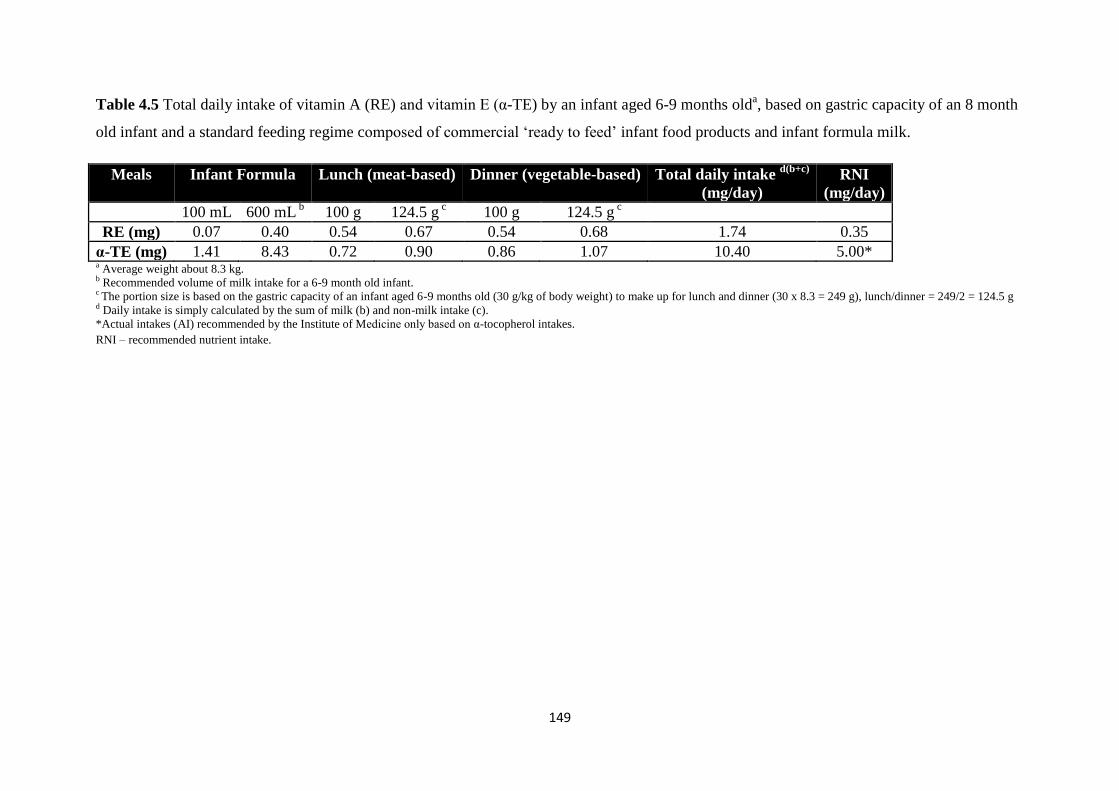
149
Table 4.5 Total daily intake of vitamin A (RE) and vitamin E (α-TE) by an infant aged 6-9 months olda, based on gastric capacity of an 8 month
old infant and a standard feeding regime composed of commercial ‘ready to feed’ infant food products and infant formula milk.
Meals Infant Formula Lunch (meat-based) Dinner (vegetable-based) Total daily intake d(b+c)
(mg/day)
RNI
(mg/day)
100 mL 600 mL b
100 g 124.5 g c 100 g 124.5 g
c
RE (mg) 0.07 0.40 0.54 0.67 0.54 0.68 1.74 0.35
α-TE (mg) 1.41 8.43 0.72 0.90 0.86 1.07 10.40 5.00* a Average weight about 8.3 kg. b Recommended volume of milk intake for a 6-9 month old infant. c The portion size is based on the gastric capacity of an infant aged 6-9 months old (30 g/kg of body weight) to make up for lunch and dinner (30 x 8.3 = 249 g), lunch/dinner = 249/2 = 124.5 g d Daily intake is simply calculated by the sum of milk (b) and non-milk intake (c).
*Actual intakes (AI) recommended by the Institute of Medicine only based on α-tocopherol intakes.
RNI – recommended nutrient intake.
150
Vitamin A toxicity is related to pre-formed vitamin A content not from provitamin A sources.
More research is needed to establish whether subclinical vitamin A toxicity is a concern in
certain populations, possibly in infants. However the majority of the food based vitamin A in
this study is provided by carotenoids (β-carotene and total carotenoids), which are thought to
have less negative effects than the pre-formed vitamin A types: retinyl acetate and retinyl
palmitate. This may be partly because carotenoids are not stored in the liver like retinol, but
are deposited throughout the body in fat cells, adrenal glands and other fatty tissues in
addition to their different absorption and conversion rates. However, when only pre-formed
vitamin A intake is considered in the infant’s diet, food sources contribute 58.3% of the RNI,
this may become a deficiency issue for the infant when milk intake is compromised or when
milk intake is reduced after the first year of life. Furthermore when the carotenoid content is
removed from the standardised menu the total daily intake is reduced to 600 μg RE, which is
below the upper intake recommendation but still higher than the RNI. National diet and
nutrition survey data indicate that intakes are also above the RNI (Public Health England,
2014). However due to the lack of knowledge concerning toxicity and bioavailability of the
different vitamin A forms in infant’s further investigations are required.
Breast milk concentrations of vitamin A vary widely: 150 μg/L – 1100 μg/L of pre-formed
vitamin A, dependent on maternal diet and vitamin A status (Thompkinson & Kharb, 2007).
Therefore if the infant is being breastfed then the mother’s diet is also essential for the
infant’s nutritional status. If the infant receives human milk with a high vitamin A
concentration then vitamin A intakes from pre-formed sources will be higher than those
calculated in this study (1100 μg/L = 660 μg/600 mL). At the other end of the spectrum if an
infant is consuming human milk low in vitamin A, then deficiency issues may arise (150
μg/L = 90 μg/600 mL).
It is important to mention that in 2001 the Food and Nutrition Board in the USA introduced a
new conversion factor for vitamin A, retinol activity equivalents (RAE) due to changes in
knowledge of carotenoid bioconversion, where the RAE of β-carotene was defined as 12 μg
instead of 6 μg (Food and Nutrition Board, Institute of Medicine, 2001). Infant formula in the
UK, expresses vitamin A content in RE, therefore in this study RE were employed to express
the vitamin A content of the infants diet. There is a large debate over the bioavailability of
carotenoids as their bioavailability is dependent on numerous factors including type of food
matrix, amount of fat ingested and food processing methods. Although carotenoids with
provitamin A activity are precursors of vitamin A excess intake has not been associated with
151
vitamin A toxicity in humans due to carotene conversion being regulated by vitamin A status.
However high intakes should still be approached with caution due to human studies
conducted in the 1990’s in smokers who had been previously exposed to asbestos taking high
doses of β-carotene being associated with increased risk of lung cancer (Tanvetyanon &
Bepler, 2008). To date there is insufficient scientific evidence to set a tolerable upper intake
level for β-carotene and further research is required. Furthermore as the equivalence factors
for both retinol and carotenoids are unknown in infants they may not be adequate (Koletzko,
et al., 2005).
As vitamin E requirements are based on PUFA intakes it is difficult to set up dietary
reference values as the range of PUFA intakes in the UK varies widely therefore acceptable
ranges of intake are more acceptable than a fixed level. In addition the relationship between
PUFA intake and vitamin E requirements is not linear. Some committees, however, in other
countries such as the US have calculated vitamin E requirements from the PUFA content of
the diet as 0.4 mg α-TE/g of dietary PUFA, which is also used in the UK for fortification of
infant formulas (Department of Health, 1991).
Based upon the UK guidelines for fat intake and vitamin E requirements being 0.4 mg α-TE/g
dietary PUFA, for a 7-12 month infant, the recommended daily intake based on PUFA intake
at 6% of total energy is 5.625 g/day. Based on this assumption infants aged 7 – 12 months
require 2.25 mg/day of α-TE. The US Institute of Medicine recommended an actual intake for
infants aged 7-12 months of 5 mg/day of α-tocopherol, rather than α-TE (Food and Nutrition
Board, Institute of Medicine, 2000). Taking into consideration that the major contributor of
vitamin E is γ-tocopherol in the US diet this does not appear to take into account other forms
of the vitamin that may potentially be important for human health. It is also higher than the
UK recommendations even for adults (3-4 mg/day).
From the finding of this study, however, it appears that the majority of vitamin E is provided
by the infant formula which is in the form of α-tocopheryl acetate, with only a small
concentration (18.9%) contributed from commercial ‘ready-to-feed’ infant foods. It is also
apparent from national feeding studies in the US that after one year of life vitamin E intake is
inadequate, which may be explained by the reduction in infant formula (Butte, et al., 2010). It
is important to highlight that breast milk contains less vitamin E than infant formula,
0.66 mg/100 mL, compared to 1.4 mg/100 ml (Thompkinson & Kharb, 2007). Therefore
breastfed infants will be closer to meeting the recommended intakes for infants aged 7 to 12
152
months. However breast milk concentrations will vary due to the maternal diet and the
vitamin E status of the mother. Hence if milk intake is compromised, reduced or breast milk
concentrations are low then there may be a cause for concern over the adequacy of the
infant’s diet in meeting vitamin E requirements.
Moreover, the bioavailability of vitamin E is currently largely unclear with studies ranging
from 10 – 79%. This highlights the importance of undertaking further research in order to
understand the absorption, metabolism efficacy of the different forms of vitamin E and its
antioxidant properties and non-antioxidant properties (Borel, et al., 2013).
The main limitations from calculating the vitamin intake in this manner is that it is unlikely to
represent the actual amount of consumption that is ingested and retained by the infant. It does
not take into consideration wastage and fails to take into account any contribution from breast
milk, snacks or homemade foods.
4.4 Conclusions
The concentration of vitamin A (retinyl acetate, retinyl palmitate and β-carotene) and E (α
and γ-tocopherol) was quantitatively determined by HPLC. The estimated total daily intake
of vitamin A converted into RE from the consumption of a combination of commercial
complementary infant foods and infant formula, based on the standardised menu used in this
study, was found to be in excess with respect to the upper intake levels for infants of 900 μg
RE/day. It is worth mentioning that the contribution of vitamin A from infant formula alone
was found to be 396 μg RE which exceeds the RNI of 350 μg RE for infants from 7 - 12
months of age by 13%. The remaining vitamin A content of the diet was mainly from
carotenoids (β-carotene and total carotenoids) which are considered to be less harmful.
However further studies into the bioavailability of the different forms of vitamin A in infants
and the effects of excess intake are necessary. Pre-formed vitamin A food sources contributed
58.3% of the RNI, therefore if the contribution from milk intake is reduced, deficiency may
become an issue and parents should be aware of the impact that the reduction in fortified
infant formula use may have on the nutritional composition of an infant’s diet.
The total daily intake of vitamin E based upon a diet consisting of complementary ready-to-
feed infant foods and infant formula provided a vitamin E intake of 10.4 mg/day of α-TE,
which exceeds the recommended adequate intakes of 5 mg/day α-tocopherol set by the US.
However 81% of vitamin E was provided from infant formula with a minor contribution from
153
infant food products, which may become a concern when milk intake is compromised or
reduced as it is after the first year of life.
4.5 References
Baydas, G., Karatas, F., Gursu, M. F., Bozkurt, H. A., Ilhan, N., Yasar, A., & Canatan, H.
(2002). Antioxidant vitamin levels in term and preterm infants and their relation to maternal
vitamin status. Archives of Medical Research, 33(3), 276-80.
Borel, P., Preveraud, D., & Desmarchelier, C. (2013). Bioavailability of vitamin E in humans:
an update. Nutrition Reviews, 71(6), 319-31.
Butte, N. F., Fox, M. K., Briefel, R. R., Siega-Riz, A. M., Dwyer, J. T., Deming, D. M., &
Reidy, K. C. (2010). Nutrient intakes of US infants, toddlers, and pre-schoolers meet or
exceed dietary reference intakes. Journal of American Dietetic Association, 110 (12
Supplement), S27-37.
Chávez-Servín, J. L., Castellote, A. I., & Lopez-Sabater, M. C. (2006). Simultaneous analysis
of Vitamins A and E in infant milk-based formulae by normal-phase high-performance liquid
chromatography-diode array detection using a short narrow-bore column. Journal of
Chromatography A, 1122(1-2), 138-43.
Committee on Toxicity (2012). Second draft statement on the potential risks from high levels
of vitamin A in the infant diet. COT of chemicals in food, consumer products and the
environment. TOX/2012/41. Available at: http://cot.food.gov.uk.
Committee on Toxicity (2014). Statement on the potential risks from high levels of vitamin A
in the infant diet. COT of chemicals in food, consumer products and the environment. COT
statement 2013/03. Available at: http://cot.food.gov.uk.
Department of Health (1991). Dietary Reference Values for Food Energy and Nutrients for
the United Kingdom: Report of the Panel on Dietary Reference Values of the Committee on
Medical Aspects of Food Policy, Stationery Office.
Devereux, G., Turner, S. W., Craig, L. C., McNeill, G., Martindale, S., Harbour, P. J., Helms,
P. J., & Seaton, A. (2006). Low maternal vitamin E intake during pregnancy is associated
with asthma in 5-year-old children. American Journal of Respiratory and Critical Care
Medicine, 174(5), 499-507.
154
Diplock, A. T., Charleux, J. L., Crozier-Willi, G., Kok, F. J., Rice-Evans, C., Roberfroid, M.,
Stahl, W., & Vina-Ribes, J. (1998). Functional food science and defence against reactive
oxidative species. British Journal of Nutrition, 80 Supplement 1, S77-112.
Eitenmiller, R., & Lee, J. (2004). Vitamin E Food Chemistry, Composition, and Analysis,
NY, USA: Marcel Dekker Ink.
Food and Nutrition Board, Institute of Medicine (2000). Dietary Reference Intakes for
Vitamin C, Vitamin E, Selenium, and Carotenoids. Washington, D.C.: National Academy
Press.
Food and Nutrition Board, Institute of Medicine (2001). Dietary Reference Intakes for
Vitamin A, Vitamin K, Arsenic, Boron, Chromium, Copper, Iodine, Iron, Manganese,
Molybdenum, Nickel, Silicon, Vanadium, and Zinc. Washington, D.C.: National Academy
Press.
Food Standards Agency (2015). McCance and Widdowson’s composition of foods integrated
dataset user guide. Public Health England, 1-39.
Greene, H. L., Hambidge, K. M., Schanler, R., & Tsang, R. C. (1988). Guidelines for the use
of vitamins, trace elements, calcium, magnesium, and phosphorus in infants and children
receiving total parenteral nutrition: report of the Subcommittee on Paediatric Parenteral
Nutrient Requirements from the Committee on Clinical Practice Issues of the American
Society for Clinical Nutrition. American Journal of Clinical Nutrition, 48(5), 1324-42.
Jiang, Q., Christen, S., Shigenaga, M. K., & Ames, B. N. (2001). Gamma-tocopherol, the
major form of vitamin E in the US diet, deserves more attention. American Journal of
Clinical Nutrition, 74(6), 714-22.
Klein, B. P., & Kurilich, A. C. (2000). Processing Effects on Dietary Antioxidants from Plant
Foods. HortScience, 35(4), 580-584.
Koletzko, B., Baker, S., Cleghorn, G., Neto, U. F., Gopalan, S., Hernell, O., Hock, Q. S.,
Jirapinyo, P., Lonnerdal, B., Pencharz, P., Pzyrembel, H., Ramirez-Mayans, J., Shamir, R.,
Turck, D., Yamashiro, Y., & Zong-Yi, D. (2005). Global standard for the composition of
infant formula: recommendations of an ESPGHAN coordinated international expert group.
Journal of Paediatric Gastroenterology and Nutrition, 41(5), 584-99.
155
Lennox, A., Sommerville, J., Ong, K., Henderson, H., & Allen, R. (2013). Diet and nutrition
survey of infants and young children, 2011. Public Health England, 1-107.
Lee, I. M., Cook, N. R., Gaziano, J. M., Gordon, D., Ridker, P. M., Manson, J. E.,
Hennekens, C. H., & Buring, J. E. (2005). Vitamin E in the primary prevention of
cardiovascular disease and cancer: the Women's Health Study: a randomized controlled trial.
Journal of the American Medical Association, 294(1), 56-65.
Linsinger, T. (2005). Comparison of a measurement result with the certified value. ERM
European Commission. Geel, Belgium.
Preedy, V. R. (2012). Vitamin A and Carotenoids: Chemistry, Analysis, Function and Effects,
Cambridge, UK: The Royal Society of Chemistry.
Public Health England (2014). National Diet and Nutrition Survey. Results from Years 1, 2, 3
and 4 (combined) of the Rolling Programme (2008/2009 – 2011/2012). Food Standards
Agency. Available at: https://www.gov.uk.
Rietjens, I. M., Boersma, M. G., Haan, L., Spenkelink, B., Awad, H. M., Cnubben, N. H., van
Zanden, J. J., Woude, H., Alink, G. M., & Koeman, J. H. (2002). The pro-oxidant chemistry
of the natural antioxidants vitamin C, vitamin E, carotenoids and flavonoids. Environmental
Toxicology and Pharmacology, 11(3-4), 321-33.
Rodriguez-Amaya, D. B., Kimura, M., International Food Policy Institute & Centro
Internacional de Agricultua Tropical (2004). HarvestPlus Handbook for Carotenoid Analysis,
International Food Policy Research Institute.
Suskind, R. M., & Tontisirin, K. (2001). Nutrition, Immunity, and infection in Infants and
Children, USA: Lippincott Williams & Wilkins.
Statista (2008). Brands of baby and junior foods ranked by number of users in the United
Kingdom (UK) in 2014 (in 1,000 people). Available at:
http://www.statista.com/statistics/303901/leading-baby-and-junior-food-brands-in-the-uk/.
Tang, G. (2010). Bioconversion of dietary provitamin A carotenoids to vitamin A in humans.
American Journal of Clinical Nutrition, 91(5), 1468s-1473s.
156
Tanvetyanon, T., & Bepler, G. (2008). Beta-carotene in multivitamins and the possible risk of
lung cancer among smokers versus former smokers: a meta-analysis and evaluation of
national brands. Cancer, 113(1), 150-7.
Thompkinson, D. K., & Kharb, S. (2007). Aspects of Infant Food Formulation.
Comprehensive Reviews in Food Science and Food Safety, 6(4), 79-102.
Trisconi, M. J., Campos-Gimenez, E., Jaudzems, G., & Dowell, D. (2012). Determination of
vitamin A in infant formula and adult nutritionals by UPLC-UV: First Action 2011.07.
Journal of AOAC International, 95(2), 301-6.
Wagner, K. H., Kamal-Eldin, A., & Elmadfa, I. (2004). Gamma-tocopherol-an
underestimated vitamin? Annals of Nutrition and Metabolism, 48(3), 169-88.
WHO and FAO (1967). Requirements of vitamin A, thiamine, riboflavin and niacin: report of
a joint FAO/WHO expert group, Rome, Italy, 6-17 September 1965.
Zand, N., Chowdhry, B. Z., Pullen, F. S., Snowden, M. J., & Tetteh, J. (2012). Simultaneous
determination of riboflavin and pyridoxine by UHPLC/LC-MS in UK commercial infant
meal food products. Food Chemistry, 135(4), 2743-9.
157
Chapter 5
Calcium to phosphorus ratio, essential elemental and vitamin D
content of infant foods in the UK: possible implications for bone
health
5.1 Introduction
Infancy is a time of rapid growth and development during which infants require the correct
types and amounts of specific nutrients to ensure optimal growth and development. Typically
full term neonates will double their birth weight by 5 months and treble it by the end of the
first year of life, in addition to increasing their body length by 25 cm (Gokhale & Kirschner,
2003). During the first year of life bone mineralization and calcium accretion are greatest
(Bass & Chan, 2006). It has been suggested that the calcium to phosphorus ratio (Ca:P) is
important for bone growth and development during infancy (Sax, 2001). It is believed that
bone mass accumulation in infancy is essential for the prevention of poor childhood growth
and adult osteoporosis (Bass & Chan, 2006).
The optimal homeostasis of calcium, phosphorus and magnesium is essential for the
formation of the structural matrix of bone; with 99% of calcium and 85% of phosphate
present in bone as microcrystalline apatite (National Health and Medical Research Council,
2006). The maintenance of the optimal homeostasis of calcium and phosphorus is also
dependent on absorption in the intestine, skeletal accretion and re-absorption and excretion in
urine, in addition to vitamin D status and dietary intake (Bozzetti & Tagliabue, 2009).
Extremely low calcium intakes of infants have been associated with rickets, even though
classically the disease is caused by a nutritional vitamin D deficiency. High phosphorus
intakes have been suggested to contribute to hypocalcaemia (low serum calcium levels) and
fractures in children (Abrams & Atkinson, 2003), this may in part be due to the actions of
parathyroid hormone (PTH) causing resorption of calcium and phosphate from the bone,
however further studies are required to evaluate the relationship and mechanisms underlying
this proposed effect.
158
The Ca:P may be an important determinant of calcium absorption and retention due to the
regulatory mechanisms which control calcium and phosphorus homeostasis within the body
(Bass & Chan, 2006). Animal studies have shown that low Ca:P diets cause low bone
densities (Sax, 2001). Common practice is to have a Ca:P molar ratio between 1:1 and 2:1
(Koletzko, et al., 2005). Hypothetically low Ca:P may adversely affect calcium balance
which subsequently may increase the risk of bone fracture and osteoporosis. Typical Western
diets are abundant in phosphorus however calcium intake may be too low (Kemi, et al.,
2006). A high dietary phosphorus intake is suggested to have negative effects on bone
through increased PTH secretion, as high serum PTH concentration increases bone resorption
and decreases bone formation (Kemi, et al., 2010).
Other food derivatives can also affect the bio-availability of calcium, for example zinc and
iron (Hallberg, 1998). Therefore it is important to consider the inter-relation of the nutrients
in the diet (Fairweather-Tait & Teucher, 2002).
Formula milk has higher concentrations of calcium and phosphorus but with lower bio-
availabilities of both nutrients compared to human milk (Bozzetti & Tagliabue, 2009). In
breast milk the Ca:P is approximately 2:1, with similar ratios in infant formulas; however
absolute quantities are higher in infant formulas to account for the differing bioavailabilities.
Breast milk calcium levels remain constant over the first year; however the phosphorus
content decreases over the course of lactation (Bass & Chan, 2006).
In addition, Vitamin D is also important during phases of rapid growth and bone
mineralization as in infancy, to ensure optimal calcium balance (Thompkinson & Kharb,
2007). Deficiency of vitamin D in children results in rickets, characterised by skeletal
deformity and muscle weakness. Hypovitaminosis D (deficiency of vitamin D) is caused by a
combination of inadequate exposure to UVB radiation and dietary supply. There is a limited
supply of natural sources of dietary vitamin D, the highest contributors being fatty fish and
eggs. Currently in the UK fortification of foods with vitamin D is practised under regulation
(EC) no 1925/2006, including breakfast cereals and infant formula products, with mandatory
fortification of margarine products (Department of Health, 2011).
Pregnant women, breastfeeding mothers and infants are recommended to use vitamin D
supplements, however according to the 2010 Infant Feeding Survey only 14% of infants aged
8-10 months were taking vitamin D supplements along with 33% of mothers taking vitamin
D supplements at this age. Infant levels of vitamin D usually decline at the weaning period as
159
most foods and cow’s milk are low in vitamin D. Between 6 months and 3 years infants and
toddlers have an increased need for adequate vitamin D levels due to the high rate at which
calcium is being laid down in the bone; they are also susceptible to vitamin D deficiency due
to restricted exposure to UVB radiation from limited outdoor physical activity in day-care
centres, low concentrations present in breast milk and limited intake of vitamin D rich dietary
sources (McAndrew, et al., 2012).
The 2008/2009 – 2010/2011 National Diet and Nutrition Survey (NDNS) survey observed an
increased risk of vitamin D deficiency in all age groups of the survey, 7.5% in the
1.5 – 3 year old group had serum 25(OH)D levels below 25 nmol/L, a level below which
increases the risk of rickets and osteomalacia. Furthermore mean intakes of vitamin D from
food sources were well below the recommended nutrient intake (RNI) for the 1.5 – 3 year old
age group (Food Standards Agency, 2015).
This primary study investigates the ratio of Ca:P in conjunction with vitamin D and other
essential elements (Cu, Fe, K, Mg, Na, Zn) in a range of commercial infant food products
(including infant breakfast and snack products and infant ready meals) in the UK. The
quantitative data was further evaluated, based on a standardised menu approach, to calculate
the total daily intake of the nutrients analysed for an infant aged 7-12 months and intakes
were compared against the Recommended Nutrient Intake (RNI), to ascertain the nutritional
adequacy. Finally, as the study is the first to include consumption of infant snack products,
the level of total calorie intake is also calculated in order to assess estimated energy intake
(EEI).
5.2 Materials and methods
5.2.1 Sample collection for essential elemental analysis
A selected number of dairy based commercial infant food products representative of the four
leading brands available on the UK market for infants aged 7-12 months, including eight
ready to feed infant meals, four infant snacks and one infant breakfast, were obtained from
leading supermarkets during June and July 2014. The declared ingredients of all samples and
their characteristics are presented in Table 5.1. Three independent replicates of each sample
were analyzed from different food packages which were purchased from different leading
supermarkets in the UK. Samples were stored unopened at room temperature to match the
market environment.
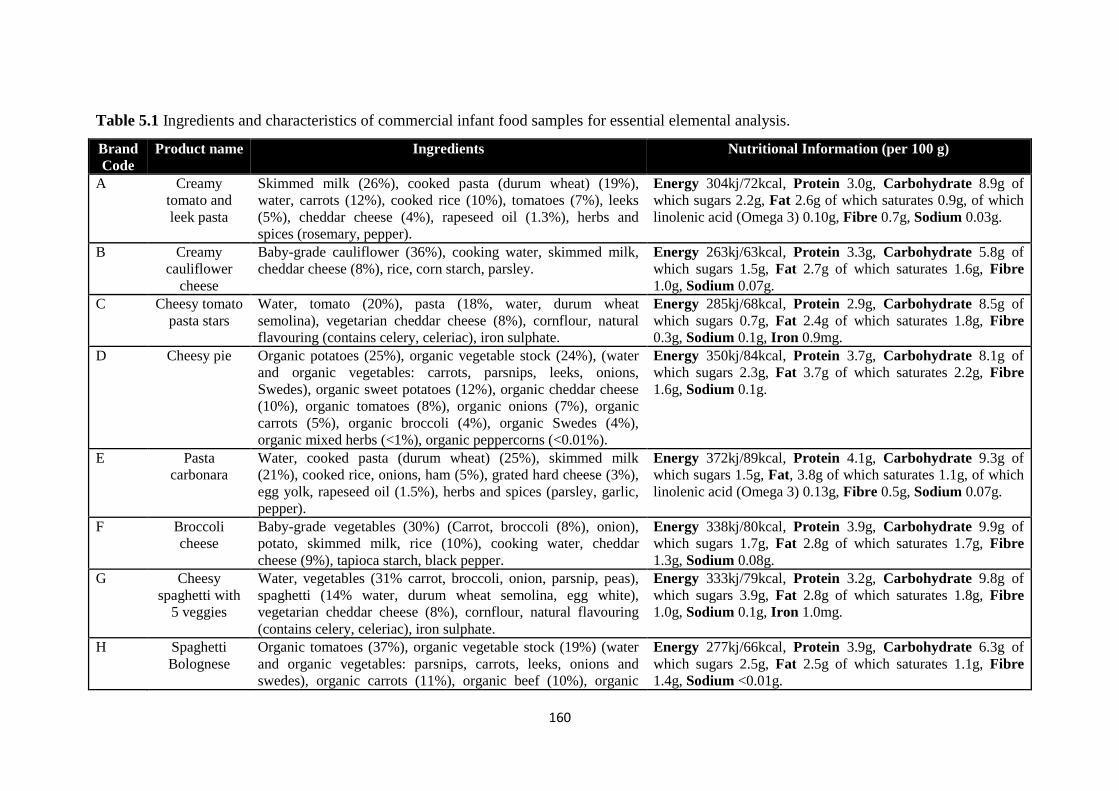
160
Table 5.1 Ingredients and characteristics of commercial infant food samples for essential elemental analysis.
Brand
Code
Product name Ingredients Nutritional Information (per 100 g)
A Creamy
tomato and
leek pasta
Skimmed milk (26%), cooked pasta (durum wheat) (19%),
water, carrots (12%), cooked rice (10%), tomatoes (7%), leeks
(5%), cheddar cheese (4%), rapeseed oil (1.3%), herbs and
spices (rosemary, pepper).
Energy 304kj/72kcal, Protein 3.0g, Carbohydrate 8.9g of
which sugars 2.2g, Fat 2.6g of which saturates 0.9g, of which
linolenic acid (Omega 3) 0.10g, Fibre 0.7g, Sodium 0.03g.
B Creamy
cauliflower
cheese
Baby-grade cauliflower (36%), cooking water, skimmed milk,
cheddar cheese (8%), rice, corn starch, parsley.
Energy 263kj/63kcal, Protein 3.3g, Carbohydrate 5.8g of
which sugars 1.5g, Fat 2.7g of which saturates 1.6g, Fibre
1.0g, Sodium 0.07g.
C Cheesy tomato
pasta stars
Water, tomato (20%), pasta (18%, water, durum wheat
semolina), vegetarian cheddar cheese (8%), cornflour, natural
flavouring (contains celery, celeriac), iron sulphate.
Energy 285kj/68kcal, Protein 2.9g, Carbohydrate 8.5g of
which sugars 0.7g, Fat 2.4g of which saturates 1.8g, Fibre
0.3g, Sodium 0.1g, Iron 0.9mg.
D Cheesy pie Organic potatoes (25%), organic vegetable stock (24%), (water
and organic vegetables: carrots, parsnips, leeks, onions,
Swedes), organic sweet potatoes (12%), organic cheddar cheese
(10%), organic tomatoes (8%), organic onions (7%), organic
carrots (5%), organic broccoli (4%), organic Swedes (4%),
organic mixed herbs (<1%), organic peppercorns (<0.01%).
Energy 350kj/84kcal, Protein 3.7g, Carbohydrate 8.1g of
which sugars 2.3g, Fat 3.7g of which saturates 2.2g, Fibre
1.6g, Sodium 0.1g.
E Pasta
carbonara
Water, cooked pasta (durum wheat) (25%), skimmed milk
(21%), cooked rice, onions, ham (5%), grated hard cheese (3%),
egg yolk, rapeseed oil (1.5%), herbs and spices (parsley, garlic,
pepper).
Energy 372kj/89kcal, Protein 4.1g, Carbohydrate 9.3g of
which sugars 1.5g, Fat, 3.8g of which saturates 1.1g, of which
linolenic acid (Omega 3) 0.13g, Fibre 0.5g, Sodium 0.07g.
F Broccoli
cheese
Baby-grade vegetables (30%) (Carrot, broccoli (8%), onion),
potato, skimmed milk, rice (10%), cooking water, cheddar
cheese (9%), tapioca starch, black pepper.
Energy 338kj/80kcal, Protein 3.9g, Carbohydrate 9.9g of
which sugars 1.7g, Fat 2.8g of which saturates 1.7g, Fibre
1.3g, Sodium 0.08g.
G Cheesy
spaghetti with
5 veggies
Water, vegetables (31% carrot, broccoli, onion, parsnip, peas),
spaghetti (14% water, durum wheat semolina, egg white),
vegetarian cheddar cheese (8%), cornflour, natural flavouring
(contains celery, celeriac), iron sulphate.
Energy 333kj/79kcal, Protein 3.2g, Carbohydrate 9.8g of
which sugars 3.9g, Fat 2.8g of which saturates 1.8g, Fibre
1.0g, Sodium 0.1g, Iron 1.0mg.
H Spaghetti
Bolognese
Organic tomatoes (37%), organic vegetable stock (19%) (water
and organic vegetables: parsnips, carrots, leeks, onions and
swedes), organic carrots (11%), organic beef (10%), organic
Energy 277kj/66kcal, Protein 3.9g, Carbohydrate 6.3g of
which sugars 2.5g, Fat 2.5g of which saturates 1.1g, Fibre
1.4g, Sodium <0.01g.
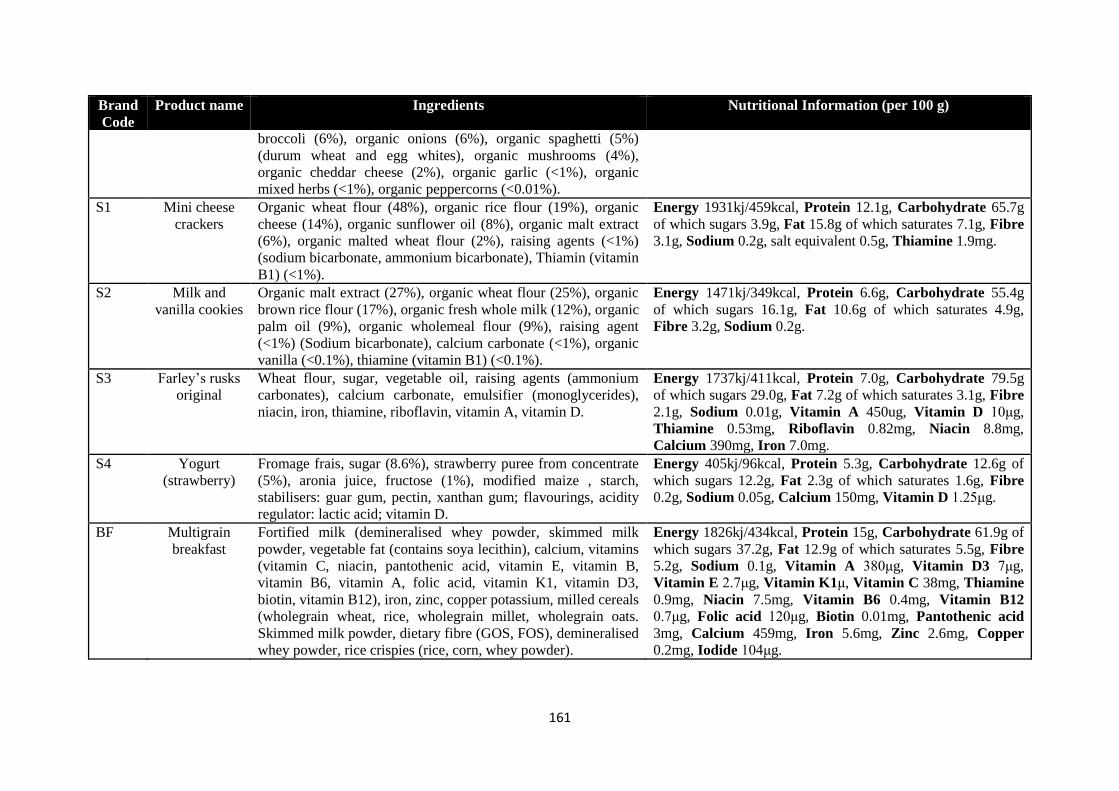
161
Brand
Code
Product name Ingredients Nutritional Information (per 100 g)
broccoli (6%), organic onions (6%), organic spaghetti (5%)
(durum wheat and egg whites), organic mushrooms (4%),
organic cheddar cheese (2%), organic garlic (<1%), organic
mixed herbs (<1%), organic peppercorns (<0.01%).
S1 Mini cheese
crackers
Organic wheat flour (48%), organic rice flour (19%), organic
cheese (14%), organic sunflower oil (8%), organic malt extract
(6%), organic malted wheat flour (2%), raising agents (<1%)
(sodium bicarbonate, ammonium bicarbonate), Thiamin (vitamin
B1) (<1%).
Energy 1931kj/459kcal, Protein 12.1g, Carbohydrate 65.7g
of which sugars 3.9g, Fat 15.8g of which saturates 7.1g, Fibre
3.1g, Sodium 0.2g, salt equivalent 0.5g, Thiamine 1.9mg.
S2 Milk and
vanilla cookies
Organic malt extract (27%), organic wheat flour (25%), organic
brown rice flour (17%), organic fresh whole milk (12%), organic
palm oil (9%), organic wholemeal flour (9%), raising agent
(<1%) (Sodium bicarbonate), calcium carbonate (<1%), organic
vanilla (<0.1%), thiamine (vitamin B1) (<0.1%).
Energy 1471kj/349kcal, Protein 6.6g, Carbohydrate 55.4g
of which sugars 16.1g, Fat 10.6g of which saturates 4.9g,
Fibre 3.2g, Sodium 0.2g.
S3 Farley’s rusks
original
Wheat flour, sugar, vegetable oil, raising agents (ammonium
carbonates), calcium carbonate, emulsifier (monoglycerides),
niacin, iron, thiamine, riboflavin, vitamin A, vitamin D.
Energy 1737kj/411kcal, Protein 7.0g, Carbohydrate 79.5g
of which sugars 29.0g, Fat 7.2g of which saturates 3.1g, Fibre
2.1g, Sodium 0.01g, Vitamin A 450ug, Vitamin D 10μg,
Thiamine 0.53mg, Riboflavin 0.82mg, Niacin 8.8mg,
Calcium 390mg, Iron 7.0mg.
S4 Yogurt
(strawberry)
Fromage frais, sugar (8.6%), strawberry puree from concentrate
(5%), aronia juice, fructose (1%), modified maize , starch,
stabilisers: guar gum, pectin, xanthan gum; flavourings, acidity
regulator: lactic acid; vitamin D.
Energy 405kj/96kcal, Protein 5.3g, Carbohydrate 12.6g of
which sugars 12.2g, Fat 2.3g of which saturates 1.6g, Fibre
0.2g, Sodium 0.05g, Calcium 150mg, Vitamin D 1.25μg.
BF Multigrain
breakfast
Fortified milk (demineralised whey powder, skimmed milk
powder, vegetable fat (contains soya lecithin), calcium, vitamins
(vitamin C, niacin, pantothenic acid, vitamin E, vitamin B,
vitamin B6, vitamin A, folic acid, vitamin K1, vitamin D3,
biotin, vitamin B12), iron, zinc, copper potassium, milled cereals
(wholegrain wheat, rice, wholegrain millet, wholegrain oats.
Skimmed milk powder, dietary fibre (GOS, FOS), demineralised
whey powder, rice crispies (rice, corn, whey powder).
Energy 1826kj/434kcal, Protein 15g, Carbohydrate 61.9g of
which sugars 37.2g, Fat 12.9g of which saturates 5.5g, Fibre
5.2g, Sodium 0.1g, Vitamin A 380μg, Vitamin D3 7μg,
Vitamin E 2.7μg, Vitamin K1μ, Vitamin C 38mg, Thiamine
0.9mg, Niacin 7.5mg, Vitamin B6 0.4mg, Vitamin B12
0.7μg, Folic acid 120μg, Biotin 0.01mg, Pantothenic acid
3mg, Calcium 459mg, Iron 5.6mg, Zinc 2.6mg, Copper
0.2mg, Iodide 104μg.
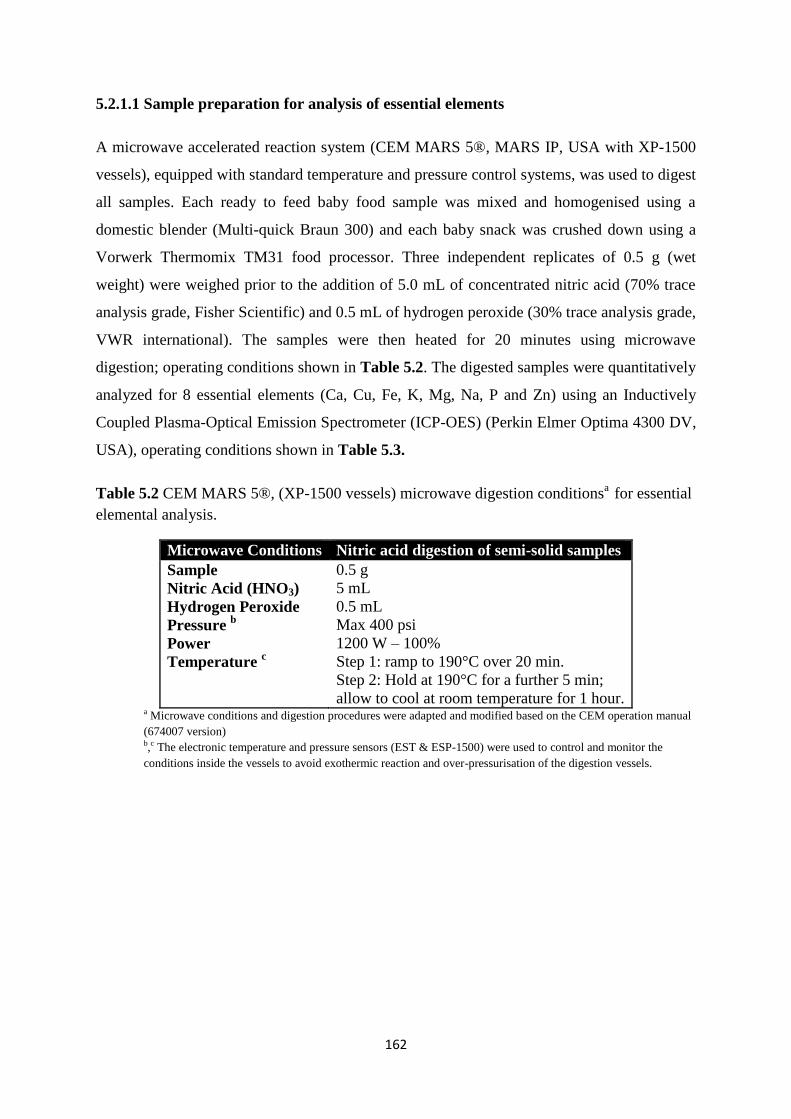
162
5.2.1.1 Sample preparation for analysis of essential elements
A microwave accelerated reaction system (CEM MARS 5®, MARS IP, USA with XP-1500
vessels), equipped with standard temperature and pressure control systems, was used to digest
all samples. Each ready to feed baby food sample was mixed and homogenised using a
domestic blender (Multi-quick Braun 300) and each baby snack was crushed down using a
Vorwerk Thermomix TM31 food processor. Three independent replicates of 0.5 g (wet
weight) were weighed prior to the addition of 5.0 mL of concentrated nitric acid (70% trace
analysis grade, Fisher Scientific) and 0.5 mL of hydrogen peroxide (30% trace analysis grade,
VWR international). The samples were then heated for 20 minutes using microwave
digestion; operating conditions shown in Table 5.2. The digested samples were quantitatively
analyzed for 8 essential elements (Ca, Cu, Fe, K, Mg, Na, P and Zn) using an Inductively
Coupled Plasma-Optical Emission Spectrometer (ICP-OES) (Perkin Elmer Optima 4300 DV,
USA), operating conditions shown in Table 5.3.
Table 5.2 CEM MARS 5®, (XP-1500 vessels) microwave digestion conditionsa
for essential
elemental analysis.
Microwave Conditions Nitric acid digestion of semi-solid samples
Sample
Nitric Acid (HNO3)
Hydrogen Peroxide
Pressure b
Power
Temperature c
0.5 g
5 mL
0.5 mL
Max 400 psi
1200 W – 100%
Step 1: ramp to 190°C over 20 min.
Step 2: Hold at 190°C for a further 5 min;
allow to cool at room temperature for 1 hour. a Microwave conditions and digestion procedures were adapted and modified based on the CEM operation manual
(674007 version) b,c The electronic temperature and pressure sensors (EST & ESP-1500) were used to control and monitor the
conditions inside the vessels to avoid exothermic reaction and over-pressurisation of the digestion vessels.
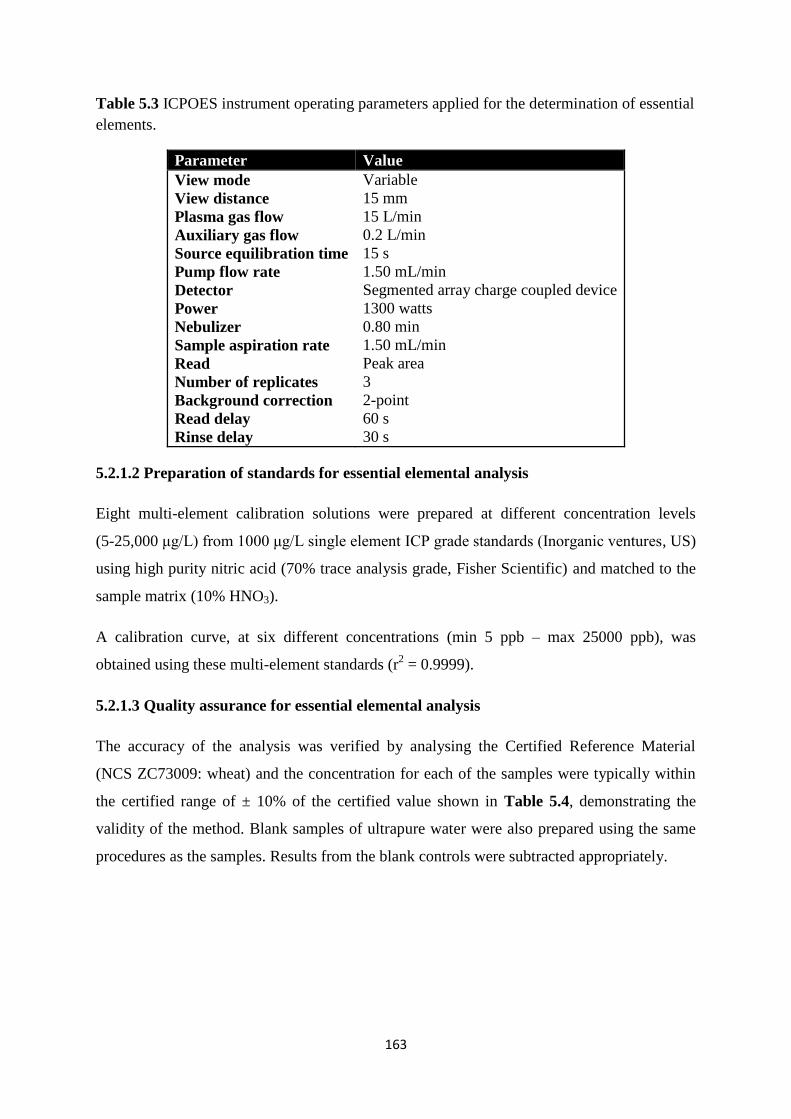
163
Table 5.3 ICPOES instrument operating parameters applied for the determination of essential
elements.
Parameter Value
View mode
View distance
Plasma gas flow
Auxiliary gas flow
Source equilibration time
Pump flow rate
Detector
Power
Nebulizer
Sample aspiration rate
Read
Number of replicates
Background correction
Read delay
Rinse delay
Variable
15 mm
15 L/min
0.2 L/min
15 s
1.50 mL/min
Segmented array charge coupled device
1300 watts
0.80 min
1.50 mL/min
Peak area
3
2-point
60 s
30 s
5.2.1.2 Preparation of standards for essential elemental analysis
Eight multi-element calibration solutions were prepared at different concentration levels
(5-25,000 μg/L) from 1000 μg/L single element ICP grade standards (Inorganic ventures, US)
using high purity nitric acid (70% trace analysis grade, Fisher Scientific) and matched to the
sample matrix (10% HNO3).
A calibration curve, at six different concentrations (min 5 ppb – max 25000 ppb), was
obtained using these multi-element standards (r2 = 0.9999).
5.2.1.3 Quality assurance for essential elemental analysis
The accuracy of the analysis was verified by analysing the Certified Reference Material
(NCS ZC73009: wheat) and the concentration for each of the samples were typically within
the certified range of ± 10% of the certified value shown in Table 5.4, demonstrating the
validity of the method. Blank samples of ultrapure water were also prepared using the same
procedures as the samples. Results from the blank controls were subtracted appropriately.
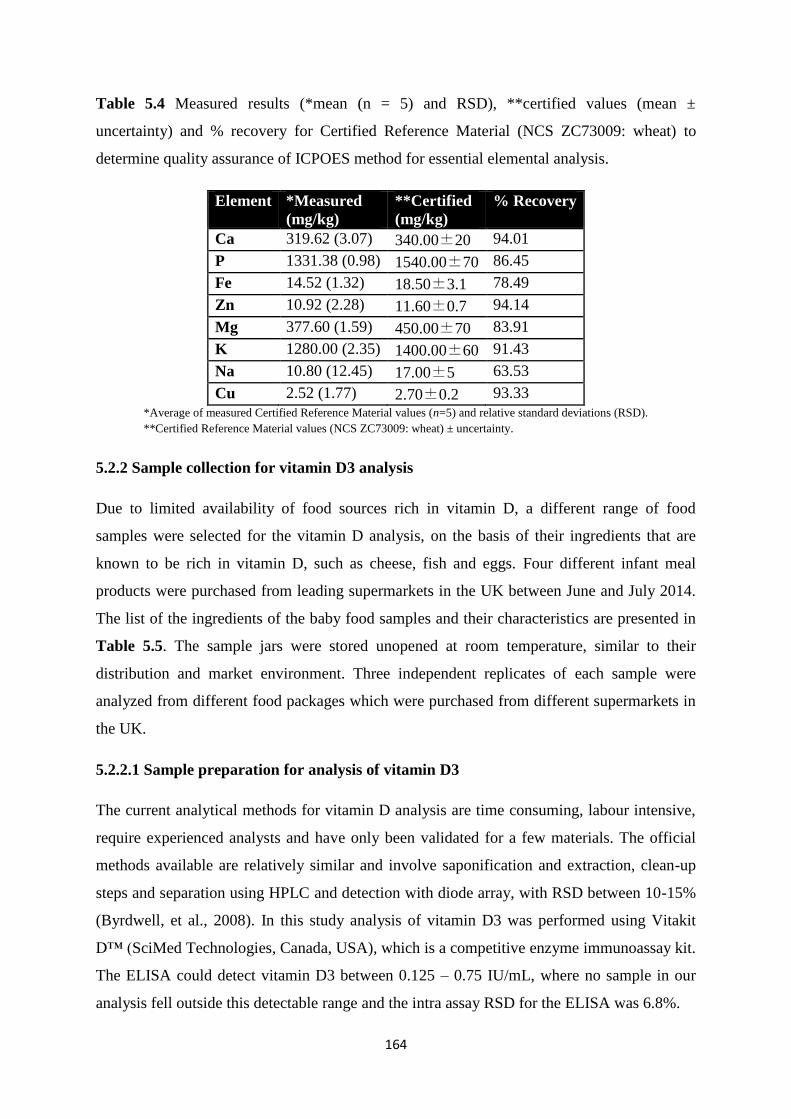
164
Table 5.4 Measured results (*mean (n = 5) and RSD), **certified values (mean ±
uncertainty) and % recovery for Certified Reference Material (NCS ZC73009: wheat) to
determine quality assurance of ICPOES method for essential elemental analysis.
Element *Measured
(mg/kg)
**Certified
(mg/kg)
% Recovery
Ca 319.62 (3.07) 340.00±20 94.01
P 1331.38 (0.98) 1540.00±70 86.45
Fe 14.52 (1.32) 18.50±3.1 78.49
Zn 10.92 (2.28) 11.60±0.7 94.14
Mg 377.60 (1.59) 450.00±70 83.91
K 1280.00 (2.35) 1400.00±60 91.43
Na 10.80 (12.45) 17.00±5 63.53
Cu 2.52 (1.77) 2.70±0.2 93.33
*Average of measured Certified Reference Material values (n=5) and relative standard deviations (RSD).
**Certified Reference Material values (NCS ZC73009: wheat) ± uncertainty.
5.2.2 Sample collection for vitamin D3 analysis
Due to limited availability of food sources rich in vitamin D, a different range of food
samples were selected for the vitamin D analysis, on the basis of their ingredients that are
known to be rich in vitamin D, such as cheese, fish and eggs. Four different infant meal
products were purchased from leading supermarkets in the UK between June and July 2014.
The list of the ingredients of the baby food samples and their characteristics are presented in
Table 5.5. The sample jars were stored unopened at room temperature, similar to their
distribution and market environment. Three independent replicates of each sample were
analyzed from different food packages which were purchased from different supermarkets in
the UK.
5.2.2.1 Sample preparation for analysis of vitamin D3
The current analytical methods for vitamin D analysis are time consuming, labour intensive,
require experienced analysts and have only been validated for a few materials. The official
methods available are relatively similar and involve saponification and extraction, clean-up
steps and separation using HPLC and detection with diode array, with RSD between 10-15%
(Byrdwell, et al., 2008). In this study analysis of vitamin D3 was performed using Vitakit
D™ (SciMed Technologies, Canada, USA), which is a competitive enzyme immunoassay kit.
The ELISA could detect vitamin D3 between 0.125 – 0.75 IU/mL, where no sample in our
analysis fell outside this detectable range and the intra assay RSD for the ELISA was 6.8%.
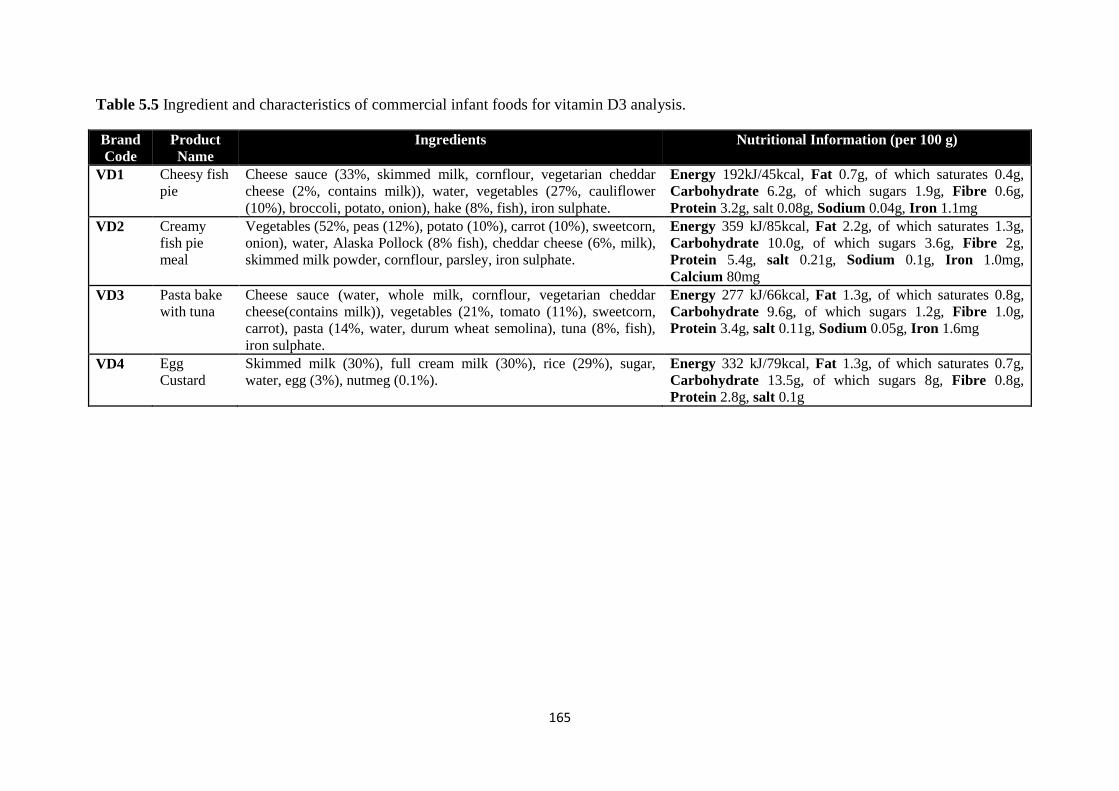
165
Table 5.5 Ingredient and characteristics of commercial infant foods for vitamin D3 analysis.
Brand
Code
Product
Name
Ingredients Nutritional Information (per 100 g)
VD1 Cheesy fish
pie
Cheese sauce (33%, skimmed milk, cornflour, vegetarian cheddar
cheese (2%, contains milk)), water, vegetables (27%, cauliflower
(10%), broccoli, potato, onion), hake (8%, fish), iron sulphate.
Energy 192kJ/45kcal, Fat 0.7g, of which saturates 0.4g,
Carbohydrate 6.2g, of which sugars 1.9g, Fibre 0.6g,
Protein 3.2g, salt 0.08g, Sodium 0.04g, Iron 1.1mg
VD2 Creamy
fish pie
meal
Vegetables (52%, peas (12%), potato (10%), carrot (10%), sweetcorn,
onion), water, Alaska Pollock (8% fish), cheddar cheese (6%, milk),
skimmed milk powder, cornflour, parsley, iron sulphate.
Energy 359 kJ/85kcal, Fat 2.2g, of which saturates 1.3g,
Carbohydrate 10.0g, of which sugars 3.6g, Fibre 2g,
Protein 5.4g, salt 0.21g, Sodium 0.1g, Iron 1.0mg,
Calcium 80mg
VD3 Pasta bake
with tuna
Cheese sauce (water, whole milk, cornflour, vegetarian cheddar
cheese(contains milk)), vegetables (21%, tomato (11%), sweetcorn,
carrot), pasta (14%, water, durum wheat semolina), tuna (8%, fish),
iron sulphate.
Energy 277 kJ/66kcal, Fat 1.3g, of which saturates 0.8g,
Carbohydrate 9.6g, of which sugars 1.2g, Fibre 1.0g,
Protein 3.4g, salt 0.11g, Sodium 0.05g, Iron 1.6mg
VD4 Egg
Custard
Skimmed milk (30%), full cream milk (30%), rice (29%), sugar,
water, egg (3%), nutmeg (0.1%).
Energy 332 kJ/79kcal, Fat 1.3g, of which saturates 0.7g,
Carbohydrate 13.5g, of which sugars 8g, Fibre 0.8g,
Protein 2.8g, salt 0.1g
166
Each of the food samples were diluted with deionised water to a fat content of 1-3%, then
mixed and homogenised using a domestic blender (Multi-quick, Braun 300) and three
independent replicates of 1 g (wet weight) were weighed prior to the addition of 0.55 g of
potassium hydroxide (laboratory reagent grade, Fisher Scientific) into 15 mL centrifuge
tubes. The tubes were gently mixed and left uncapped for 2 minutes in the dark. The tubes
were then capped and incubated in the dark for 4 minutes, followed by 2 minutes of vigorous
shaking; this step was repeated twice. 2 mL of hexane (HPLC grade, Fisher Scientific) were
then added to the tubes, which were then capped and shaken vigorously for another 2 minutes
in the dark. Centrifugation at 3500 RCF for 10 minutes at room temperature was then
performed. 200 μL of the upper organic phase was transferred to an amber screw cap glass
vial.
10 μL of calibrators, extracted samples and controls were pipetted into the ELISA plate
accordingly. The plate was shaken for 8 minutes on a plate shaker (180 ± 10 rpm) to
evaporate the hexane. 60 μL of assay buffer was added to each well and mixed gently for 30
seconds. A lid was placed over the plate and shaken for 5 minutes (180 ± 10 rpm). 60 μL of
anti-vitamin D3 conjugate with HRP diluted in conjugate diluent were added to each well and
gently mixed for 20 seconds. The plate was covered and shaken for 10 minutes in the dark
(180 ± 10 rpm). A Labtech LT-3000 microplate washer was used to wash the plate 6 times
with 380 μL/well of distilled water. After washing the plate was tapped against absorbant
paper until no trace of water was visible on the paper. 60 μL of substrate was added to each
well and gently mixed for 10 seconds. The plate was then incubated in the dark for 5 minutes.
Finally 60 μL of stopping solution (0.2M H2SO4) was added to the plate and gently mixed for
10 seconds. A Microplate Reader (Thermo Multiskan Ascent 96 & 384 well) was used to
measure the absorbance at 450 nm immediately.
5.2.2.2 Preparation of standards for vitamin D3 analysis
Five different concentrations of vitamin D were supplied with the kit; ranging from 0 – 0.75
IU/mL. A calibration curve was obtained with a correlation coefficient of 0.9814.
5.2.2.3 Quality assurance for vitamin D3 analysis
Two control concentrations were supplied with the VitaKit D; 0.2 and 0.6 IU/mL.
Analytically obtained concentrations were typically ± 10%, demonstrating validity of the
method.
167
5.2.3 Estimation of Total Daily Intake
A standardised menu approach has been implemented to estimate the total daily intake of an
infant aged 7-12 months, as proposed by Zand, et al. (2012a), taking into consideration the
consumption of commercial infant foods tested in this study and commercial infant formula
contribution. Using the gastric capacity of an infant (30 g/kg body weight/day) with the
average weight of an eight month old infant (8.3 kg), an infant requires 249 g/day from foods.
With respect to the elemental analysis, the gastric capacity has been divided by four to allow
25% for breakfast (62.25 g), 50% for lunch and dinner (124.5 g) and a further 25% for snacks
(62.25 g), based on the consumption of infant food products described in the sample
collection for essential elemental analysis section. The estimated amount for milk
consumption has been set to 600 mL as recommended by the manufacturer’s labelling of
infant formula. The concentrations of elements and vitamin D from infant formula have not
been analytically quantified in this study; the values have been calculated based on average
concentrations provided by the manufacturer’s label from leading brands of infant formula
available in the UK. The total daily intake is finally calculated by adding the contribution
from infant formula and from the foods analyzed in this study, this value can then be
compared against the RNI to ascertain whether infants are meeting recommendations based
on the proposed standardised menu.
5.2.4 Estimated Energy Intake
The daily EEI was calculated based on the nutritional labelling information provided by the
manufacturer, for infant food products from the sample collection for essential elemental
analysis section and commercial infant formula. Taking into consideration the energy
contribution from the commercial infant formula (600 mL), 62.25 g for breakfast and snack
products and 124.5 g for infant meal products to ascertain whether infants are meeting energy
requirements (Estimated Average Requirements, EAR) based on the proposed standardised
menu.
5.2.5 Statistical Analysis
The experimental results were subject to statistical analysis using Excel 2010. Means with the
standard error of mean of the data are presented.
168
5.3 Results and Discussion
5.3.1 Essential elements
This primary study investigates the Ca:P ratio of an infant’s diet based on the consumption of
commercial complementary infant foods. The concentration of eight essential elements, in
eight different infant food products, four different infant snacks and one infant breakfast
product, targeted for infants aged 7-12 months, were determined using ICP-OES. The results
obtained are presented as per 100 g of the food samples in Table 5.6.
Although the data is insightful, it is important to examine the entire daily nutrient intake
when studying the nutrient quality of complementary infant foods in order to ascertain the
suitability of these products in relation to dietary recommendations. Therefore the results
shown in Table 5.6 were further analyzed to estimate the total daily intake of a 7-12 month
old infant based on a standard feeding regime suggested by Zand, et al. (2012a), which is
demonstrated in Table 5.7. The total daily intake in Table 5.7 is based on the formula milk
contribution of an infant (600 mL) as well as the gastric capacity of an average 8 month old
infant (30 g/kg of body weight) in order to ascertain the nutritional value of these products in
relation to the RNI. The gastric capacity of an 8 month old infant, with an average weight of
approximately 8.3 kg is estimated to be 249 g per day, which ideally should be divided by
three to make up breakfast, lunch and dinner (Zand, et al., 2012b). In this particular study the
gastric capacity has been divided by four to allow 25% for breakfast (62.25 g), 50% for lunch
and dinner (124.5 g) and a further 25% for snacks (62.25 g).
The calculated Ca:P ratio of the diet was found to be 1.49:1 (Table 5.7), which is within the
recommended range of 1:1 – 2:1 (weight/weight) by the European Society for Paediatric
Gastroenterology Hepatology and Nutrition (ESPGHAN) to ensure optimal bone health and
development (Koletzko, et al., 2005). However, the estimated total daily intake for calcium
and phosphorus was 924 and 618 mg/day respectively (Table 5.7); which equates to 176%
and 155% above the RNI respectively. It is important to note that the aforementioned is in
agreement with previous studies carried out by Skinner, et al. (1997), Butte, et al.
(2010) and
Melo, et al. (2008). In these studies, the estimated daily intakes of calcium and phosphorus
are also shown to be above the RNI. The study herein however demonstrates the highest
value for the calcium and phosphorous intake, which could be due to inclusion of infant
snack products being investigated for the first time.
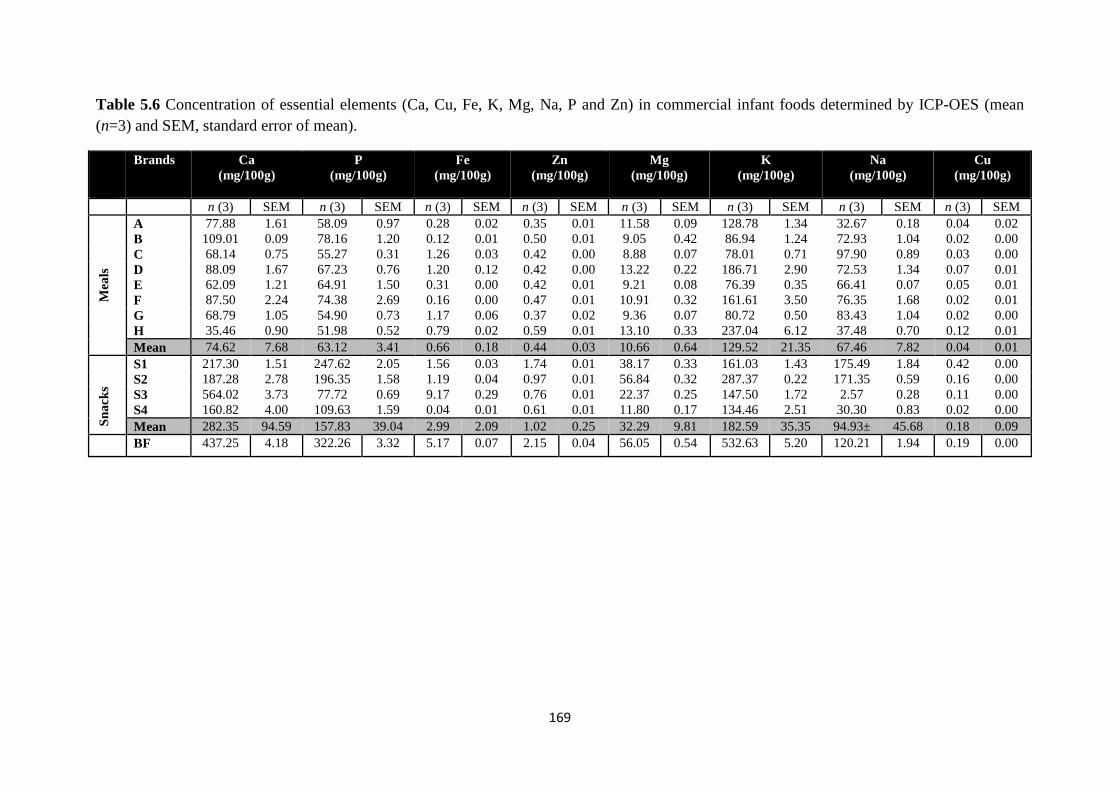
169
Table 5.6 Concentration of essential elements (Ca, Cu, Fe, K, Mg, Na, P and Zn) in commercial infant foods determined by ICP-OES (mean
(n=3) and SEM, standard error of mean).
Brands Ca
(mg/100g)
P
(mg/100g)
Fe
(mg/100g)
Zn
(mg/100g)
Mg
(mg/100g)
K
(mg/100g)
Na
(mg/100g)
Cu
(mg/100g)
n (3) SEM n (3) SEM n (3) SEM n (3) SEM n (3) SEM n (3) SEM n (3) SEM n (3) SEM
Mea
ls
A 77.88 1.61 58.09 0.97 0.28 0.02 0.35 0.01 11.58 0.09 128.78 1.34 32.67 0.18 0.04 0.02
B 109.01 0.09 78.16 1.20 0.12 0.01 0.50 0.01 9.05 0.42 86.94 1.24 72.93 1.04 0.02 0.00
C 68.14 0.75 55.27 0.31 1.26 0.03 0.42 0.00 8.88 0.07 78.01 0.71 97.90 0.89 0.03 0.00
D 88.09 1.67 67.23 0.76 1.20 0.12 0.42 0.00 13.22 0.22 186.71 2.90 72.53 1.34 0.07 0.01
E 62.09 1.21 64.91 1.50 0.31 0.00 0.42 0.01 9.21 0.08 76.39 0.35 66.41 0.07 0.05 0.01
F 87.50 2.24 74.38 2.69 0.16 0.00 0.47 0.01 10.91 0.32 161.61 3.50 76.35 1.68 0.02 0.01
G 68.79 1.05 54.90 0.73 1.17 0.06 0.37 0.02 9.36 0.07 80.72 0.50 83.43 1.04 0.02 0.00
H 35.46 0.90 51.98 0.52 0.79 0.02 0.59 0.01 13.10 0.33 237.04 6.12 37.48 0.70 0.12 0.01
Mean 74.62 7.68 63.12 3.41 0.66 0.18 0.44 0.03 10.66 0.64 129.52 21.35 67.46 7.82 0.04 0.01
Sn
ack
s
S1 217.30 1.51 247.62 2.05 1.56 0.03 1.74 0.01 38.17 0.33 161.03 1.43 175.49 1.84 0.42 0.00
S2 187.28 2.78 196.35 1.58 1.19 0.04 0.97 0.01 56.84 0.32 287.37 0.22 171.35 0.59 0.16 0.00
S3 564.02 3.73 77.72 0.69 9.17 0.29 0.76 0.01 22.37 0.25 147.50 1.72 2.57 0.28 0.11 0.00
S4 160.82 4.00 109.63 1.59 0.04 0.01 0.61 0.01 11.80 0.17 134.46 2.51 30.30 0.83 0.02 0.00
Mean 282.35 94.59 157.83 39.04 2.99 2.09 1.02 0.25 32.29 9.81 182.59 35.35 94.93± 45.68 0.18 0.09
BF 437.25 4.18 322.26 3.32 5.17 0.07 2.15 0.04 56.05 0.54 532.63 5.20 120.21 1.94 0.19 0.00
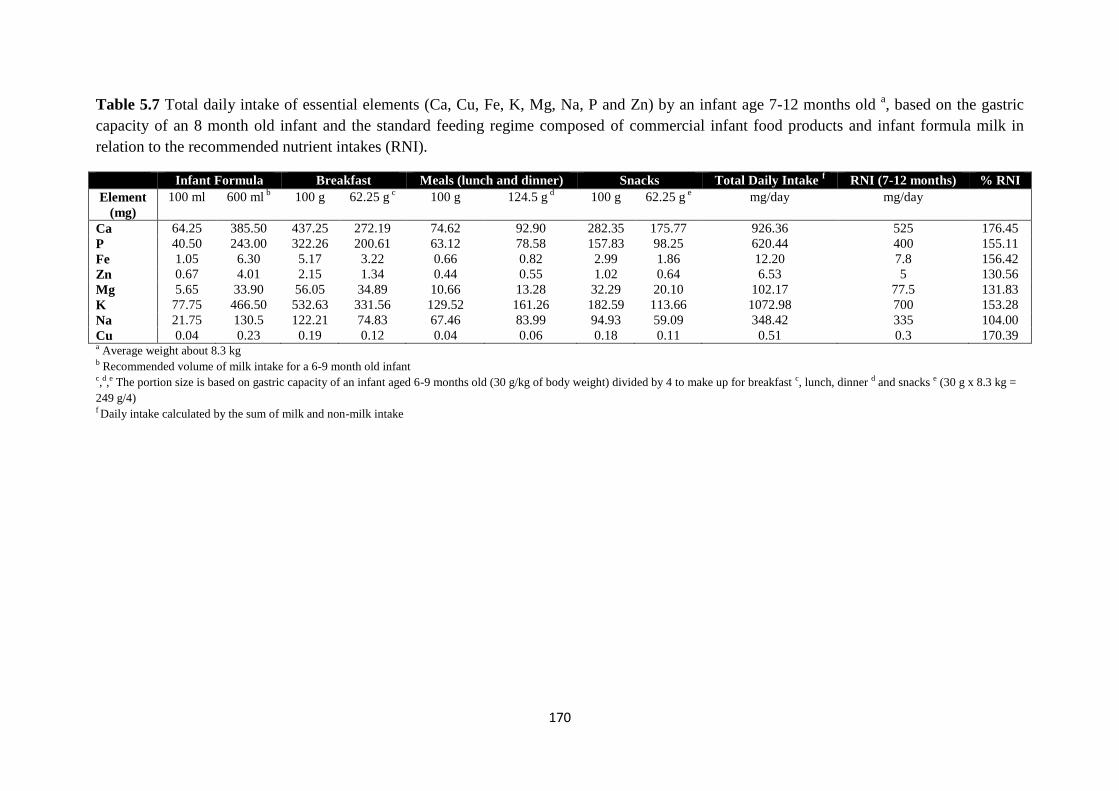
170
Table 5.7 Total daily intake of essential elements (Ca, Cu, Fe, K, Mg, Na, P and Zn) by an infant age 7-12 months old a, based on the gastric
capacity of an 8 month old infant and the standard feeding regime composed of commercial infant food products and infant formula milk in
relation to the recommended nutrient intakes (RNI).
Infant Formula Breakfast Meals (lunch and dinner) Snacks Total Daily Intake f RNI (7-12 months) % RNI
Element
(mg) 100 ml 600 ml
b 100 g 62.25 g c 100 g 124.5 g
d 100 g 62.25 g e mg/day mg/day
Ca 64.25 385.50 437.25 272.19 74.62 92.90 282.35 175.77 926.36 525 176.45 P 40.50 243.00 322.26 200.61 63.12 78.58 157.83 98.25 620.44 400 155.11 Fe 1.05 6.30 5.17 3.22 0.66 0.82 2.99 1.86 12.20 7.8 156.42 Zn 0.67 4.01 2.15 1.34 0.44 0.55 1.02 0.64 6.53 5 130.56 Mg 5.65 33.90 56.05 34.89 10.66 13.28 32.29 20.10 102.17 77.5 131.83 K 77.75 466.50 532.63 331.56 129.52 161.26 182.59 113.66 1072.98 700 153.28 Na 21.75 130.5 122.21 74.83 67.46 83.99 94.93 59.09 348.42 335 104.00 Cu 0.04 0.23 0.19 0.12 0.04 0.06 0.18 0.11 0.51 0.3 170.39 a Average weight about 8.3 kg b Recommended volume of milk intake for a 6-9 month old infant c,d,e The portion size is based on gastric capacity of an infant aged 6-9 months old (30 g/kg of body weight) divided by 4 to make up for breakfast c, lunch, dinner d and snacks e (30 g x 8.3 kg =
249 g/4) f Daily intake calculated by the sum of milk and non-milk intake
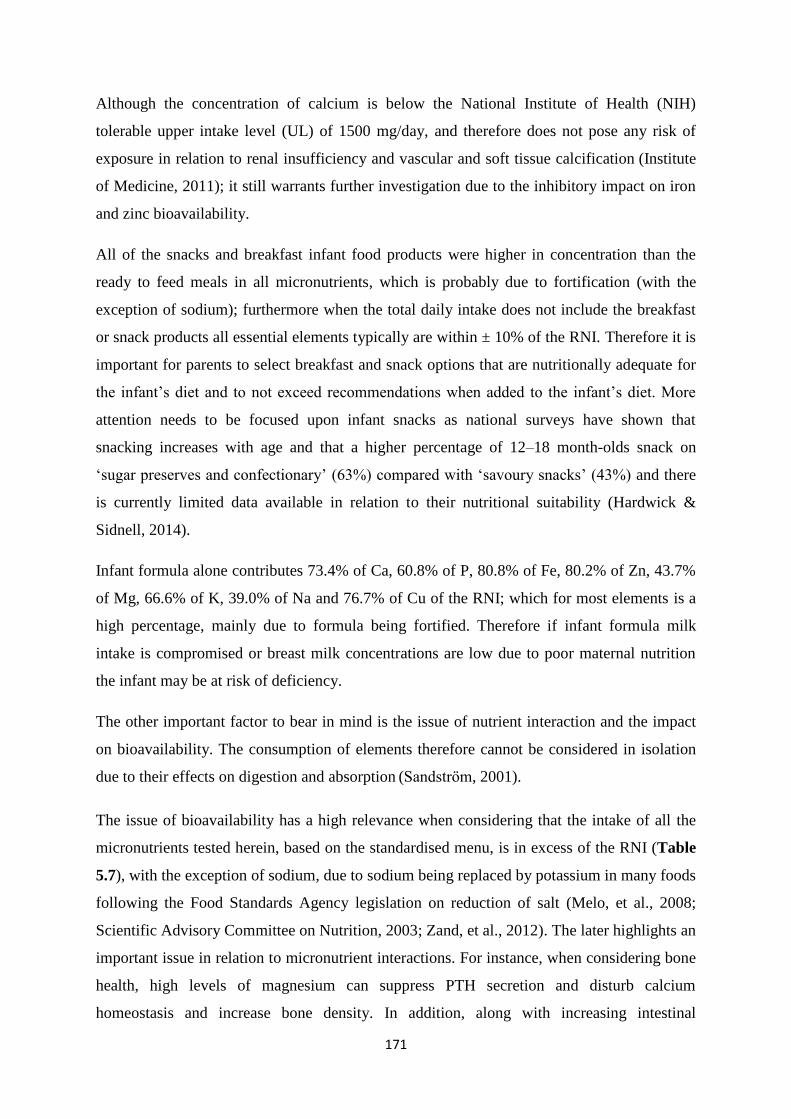
171
Although the concentration of calcium is below the National Institute of Health (NIH)
tolerable upper intake level (UL) of 1500 mg/day, and therefore does not pose any risk of
exposure in relation to renal insufficiency and vascular and soft tissue calcification (Institute
of Medicine, 2011); it still warrants further investigation due to the inhibitory impact on iron
and zinc bioavailability.
All of the snacks and breakfast infant food products were higher in concentration than the
ready to feed meals in all micronutrients, which is probably due to fortification (with the
exception of sodium); furthermore when the total daily intake does not include the breakfast
or snack products all essential elements typically are within ± 10% of the RNI. Therefore it is
important for parents to select breakfast and snack options that are nutritionally adequate for
the infant’s diet and to not exceed recommendations when added to the infant’s diet. More
attention needs to be focused upon infant snacks as national surveys have shown that
snacking increases with age and that a higher percentage of 12–18 month-olds snack on
‘sugar preserves and confectionary’ (63%) compared with ‘savoury snacks’ (43%) and there
is currently limited data available in relation to their nutritional suitability (Hardwick &
Sidnell, 2014).
Infant formula alone contributes 73.4% of Ca, 60.8% of P, 80.8% of Fe, 80.2% of Zn, 43.7%
of Mg, 66.6% of K, 39.0% of Na and 76.7% of Cu of the RNI; which for most elements is a
high percentage, mainly due to formula being fortified. Therefore if infant formula milk
intake is compromised or breast milk concentrations are low due to poor maternal nutrition
the infant may be at risk of deficiency.
The other important factor to bear in mind is the issue of nutrient interaction and the impact
on bioavailability. The consumption of elements therefore cannot be considered in isolation
due to their effects on digestion and absorption (Sandstrӧm, 2001).
The issue of bioavailability has a high relevance when considering that the intake of all the
micronutrients tested herein, based on the standardised menu, is in excess of the RNI (Table
5.7), with the exception of sodium, due to sodium being replaced by potassium in many foods
following the Food Standards Agency legislation on reduction of salt (Melo, et al., 2008;
Scientific Advisory Committee on Nutrition, 2003; Zand, et al., 2012). The later highlights an
important issue in relation to micronutrient interactions. For instance, when considering bone
health, high levels of magnesium can suppress PTH secretion and disturb calcium
homeostasis and increase bone density. In addition, along with increasing intestinal
172
absorption of calcium and phosphorus, vitamin D also enhances intestinal absorption of
magnesium; whereas phosphate and calcium can reduce the absorption of magnesium (Ilich
& Kerstetter, 2000).
On the other hand, increasing calcium consumption may negatively affect the absorption of
iron, which may impact on the occurrence of iron deficiency anaemia (IDA) (Hallberg, 1998).
Between 6-9 months full term infants are at risk of IDA due to inadequate iron stores and
therefore require iron from their diet (Domellöf, et al., 2014). Studies have reported lower
iron absorption in infants when iron supplements have been given with milk compared to
water (Heinrich, et al., 1975) and juice
(Abrams, et al., 1996). However Dalton, et al. (1997)
found no effect of calcium and phosphorus supplementation on iron status or iron deficiency
in full term infants fed iron fortified formula between 6-15 months. It is important to mention
that products C, G, S3 and BF show high iron content, which is due to fortification of these
products as illustrated in Table 5.1. In addition brands D and H also show a high iron
content, these products are from an organic product range. The unfortified infant food
products only contribute approximately 20% of iron in comparison to their fortified
counterparts for the meal intake. This may be important for parents when selecting
appropriate meals for infants. Furthermore, although less clear; calcium is believed to also
reduce zinc absorption. A reduction in iron and zinc absorption may cause impaired
neurophysiological functions (Sandstead, 2000). Excessive iron and zinc intake may also
have a counter-effect on copper (Sandstrӧm, 2001). Although iron intake in this study is
below the NIH UL (40 mg/day), zinc on the other hand is above (5 mg/day). However copper
intake from this study is also above recommendations and at present there is no UL set for
copper (Trumbo, et al., 2001).
The extent to which the excess intakes observed in this study will affect bioavailability is
unknown and knowledge of the mechanisms involved is relatively limited and needs further
attention, especially during infancy (Rosado, 2003).
5.3.2 Vitamin D
The concentrations of vitamin D in selected complementary infant foods tested in this study
are presented in Table 5.8. The total daily intake of vitamin D, again based on the
standardised menu proposed by Zand, et al. (2012a) was 9.66 μg/day, which is 138% above
RNI set at 7 μg/day for 7-12 month old infants and illustrated in Table 5.9, which is below
the UL of 38 ug/day set by NIH (Institute of Medicine, 2011). It is important to mention that
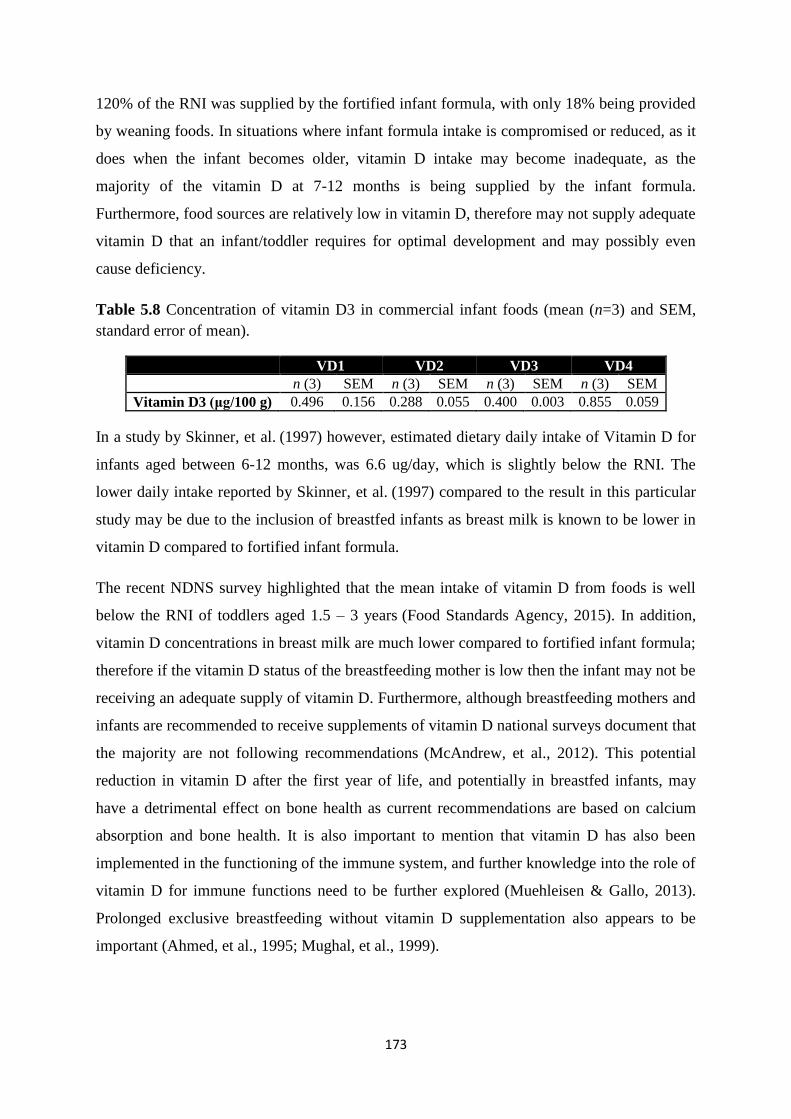
173
120% of the RNI was supplied by the fortified infant formula, with only 18% being provided
by weaning foods. In situations where infant formula intake is compromised or reduced, as it
does when the infant becomes older, vitamin D intake may become inadequate, as the
majority of the vitamin D at 7-12 months is being supplied by the infant formula.
Furthermore, food sources are relatively low in vitamin D, therefore may not supply adequate
vitamin D that an infant/toddler requires for optimal development and may possibly even
cause deficiency.
Table 5.8 Concentration of vitamin D3 in commercial infant foods (mean (n=3) and SEM,
standard error of mean).
VD1 VD2 VD3 VD4
n (3) SEM n (3) SEM n (3) SEM n (3) SEM
Vitamin D3 (μg/100 g) 0.496 0.156 0.288 0.055 0.400 0.003 0.855 0.059
In a study by Skinner, et al. (1997) however, estimated dietary daily intake of Vitamin D for
infants aged between 6-12 months, was 6.6 ug/day, which is slightly below the RNI. The
lower daily intake reported by Skinner, et al. (1997) compared to the result in this particular
study may be due to the inclusion of breastfed infants as breast milk is known to be lower in
vitamin D compared to fortified infant formula.
The recent NDNS survey highlighted that the mean intake of vitamin D from foods is well
below the RNI of toddlers aged 1.5 – 3 years (Food Standards Agency, 2015). In addition,
vitamin D concentrations in breast milk are much lower compared to fortified infant formula;
therefore if the vitamin D status of the breastfeeding mother is low then the infant may not be
receiving an adequate supply of vitamin D. Furthermore, although breastfeeding mothers and
infants are recommended to receive supplements of vitamin D national surveys document that
the majority are not following recommendations (McAndrew, et al., 2012). This potential
reduction in vitamin D after the first year of life, and potentially in breastfed infants, may
have a detrimental effect on bone health as current recommendations are based on calcium
absorption and bone health. It is also important to mention that vitamin D has also been
implemented in the functioning of the immune system, and further knowledge into the role of
vitamin D for immune functions need to be further explored (Muehleisen & Gallo, 2013).
Prolonged exclusive breastfeeding without vitamin D supplementation also appears to be
important (Ahmed, et al., 1995; Mughal, et al., 1999).
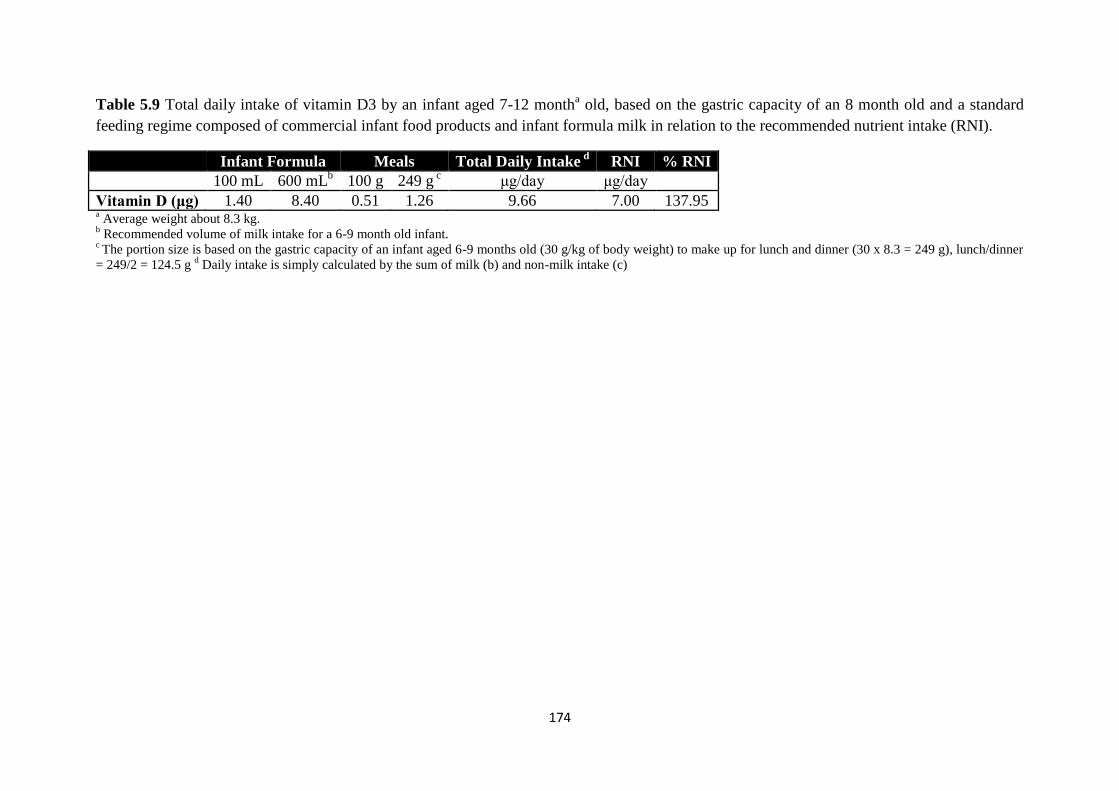
174
Table 5.9 Total daily intake of vitamin D3 by an infant aged 7-12 montha old, based on the gastric capacity of an 8 month old and a standard
feeding regime composed of commercial infant food products and infant formula milk in relation to the recommended nutrient intake (RNI).
Infant Formula Meals Total Daily Intake d
RNI % RNI
100 mL 600 mLb 100 g 249 g
c μg/day μg/day
Vitamin D (μg) 1.40 8.40 0.51 1.26 9.66 7.00 137.95 a Average weight about 8.3 kg.
b Recommended volume of milk intake for a 6-9 month old infant.
c The portion size is based on the gastric capacity of an infant aged 6-9 months old (30 g/kg of body weight) to make up for lunch and dinner (30 x 8.3 = 249 g), lunch/dinner
= 249/2 = 124.5 g d Daily intake is simply calculated by the sum of milk (b) and non-milk intake (c)
175
5.3.3 Estimated energy intake
The breakfast and snack infant food products appear to be a good source of micronutrients,
however it is also important to consider the contributions made on an energy level from these
products. Based upon the nutritional labels provided by the manufacturer, the products from
the essential elemental analysis section have been assessed for their contribution to energy.
For a 7-12 month old infant the EAR for energy is 687 kcal/day based on a diet of mixed
feeding (Scientific Advisory Committee on Nutrition, 2011). In Table 5.1 S1, S2 and S3 are
all biscuit based snack products which contribute a 28% higher energy contribution compared
to S4 which is a yogurt product. Breakfast and snacks contribute a total portion size of 62.25
g/day each, which equates to 39% and 30% of the EAR for energy for breakfast and snacks,
respectively. Similarly, a portion size of 124.5 g of commercial ready to feed meals provides
14% and 600 mL of infant formula provides 59% of the EAR for energy. Based on these
observations, the total daily intake for energy will exceed the EAR by 42% which highlights
an important issue in relation to excess calorie intake and the risk of obesity. The diet and
nutrition survey of infants and young children highlights that at least 75% of boys over 7
months and 78% of girls are above the 50th
percentile for weight compared against the UK
WHO growth standards (Department of Health, 2013), which highlights that parents must be
aware of the energy contribution that infant foods contribute and select products which
provide good sources of micronutrients for optimal growth and development without over
consumption of macronutrients (Gidding, et al., 2006).
It is important to note that one of the limitations associated with this study are that it is
unlikely to represent the actual amount of consumption that is ingested and retained by the
infant as it does not take into consideration wastage and fails to take into account any
contribution from breast milk or homemade foods.
5.4 Conclusions
This primary study investigates the ratio of Ca:P in conjunction with vitamin D and other
essential elements (Cu, Fe, K, Mg, Na, Zn) in a range of commercial infant food products in
the UK. In addition, as this study is the first to include consumption of infant snack products,
the level of total calorie intake is also calculated in order to assess total daily energy intake.
The Ca:P ratio of the infant’s diet based on the standard feeding regime used in this study
equates to 1.49:1, which is within the recommended range of 1.1 – 2:1 recommended by
176
ESPGHAN. However the actual total daily intakes of calcium and phosphorus were 176%
and 155% above the RNI respectively. The implication of excess intake of micronutrients
warrants further investigation for long term health effects.
The total dietary intake of vitamin D3 was determined to be 9.61 μg/day, which is 137%
above the RNI. However 120% is contributed from the fortified infant formula. As weaning
foods are typically low in vitamin D unless they are fortified and breast milk concentrations
are typically low, vitamin D deficiency may arise when infant formula consumption is
reduced, which is the case after the first year of life.
Finally the estimated energy intake, from consumption of the products tested herein, is
estimated to contribute to a high calorie intake, which poses a possible impact on obesity.
5.5 References
Abrams, S. A., & Atkinson, S. A. (2003). Calcium, magnesium, phosphorus and vitamin D
fortification of complementary foods. Journal of Nutrition, 133, 2994-2999.
Abrams, S. A., O'Brien, K. O., Wen, J., Liang, L. K., & Stuff, J.E. (1996). Absorption by 1-
year-old children of an iron supplement given with cow's milk or juice. Paediatric Research,
39, 171-175.
Ahmed, I., Atiq, M., Iqbal, J., Khurshid, M., & Whittaker, P. (1995). Vitamin D deficiency
rickets in breast-fed infants presenting with hypocalcaemic seizures. Acta Pædiatrica, 84,
941-942.
Bass, J. K., & Chan, G. M. (2006). Calcium nutrition and metabolism during infancy.
Nutrition Journal, 22, 1057-1066.
Bozzetti, V., & Tagliabue, P. (2009). Metabolic Bone Disease in preterm newborn: an update
on nutritional issues. Italian Journal of Paediatrics, 35, 20.
Butte, N. F., Fox, M. K., Briefel, R. R., Siega-Riz, A. M., Dwyer, J. T., Deming, D. M., &
Reidy, K. C. (2010). Nutrient intakes of US infants, toddlers, and preschoolers meet or
exceed dietary reference intakes. Journal of American Dietetic Association, 110, S27-37.
177
Byrdwell, C.W., DeVries, J., Exler, J., Harnly, J. M., Holden, J. M., Holick, M. F., Hollis, B.
W., Horst, R. L., Lada, M., Lemar, L. E., Patterson, K. Y., Philips, K. M., Tarrago-Trani, M.
T., & Wolf, W. R. (2008). Analyzing vitamin D in foods and supplements: methodologic
challenges. American Journal of Clinical Nutrition, 88, 5545-5575.
Dalton, M. A., Sargent, J. D., O'connor, G., Olmstead, E. M., & Klein, R. Z. (1997). Calcium
and phosphorus supplementation of iron-fortified infant formula: no effect on iron status of
healthy full-term infants. American Journal of Clinical Nutrition, 65, 921-926.
Department of Health (2011). Fortified Foods: Guidance to compliance with European
Regulation (EC) No. 1925/2006 on the addition of vitamins and minerals and certain other
substances to food. Department of Health: England.
Department of Health (2013) Diet and nutrition survey of infants and young children, 2011.
FSA & Public Health England: England.
Domellöf, M., Braegger, C., Campoy, C., Colomb, V., Decsi, T., Fewtrell, M., Hojsak, I.,
Mihatsch, W., Molgaard, C., & Shamir, R. (2014). Iron requirements of infants and toddlers.
Journal of Paediatric Gastroenterology and Nutrition, 58, 119-129.
Fairweather-Tait S. J., & Teucher, B. (2002). Iron and calcium bioavailability of fortified
foods and dietary supplements. Nutrition Reviews, 60, 360-367.
Food Standards Agency (2014). National Diet and Nutrition Survey Results from Years 1, 2,
3 and 4 (combined) of the Rolling Programme (2008/2009 – 2011/2012). Public Health
England: London.
Gidding, S. S., Dennison, B. A., Birch, L. L., Daniels, S. R., Gilman, M. W., Lichtenstein, A.
H., Rattay, K. T., Steinberger, J., Stettler, N., & Van Horn, L. (2006). Dietary
recommendations for children and adolescents: a guide for practitioners. Paediatrics, 117,
544-559.
Gokhale, R., & Kirschner, B. S. (2003). Assessment of growth and nutrition. Best Practice
and Research Clinical Gastroenterology, 17, 153-162.
Hallberg, L. (1998). Does calcium interfere with iron absorption? American Journal of
Clinical Nutrition, 68, 3-4.
178
Hardwick, J., & Sidnell, A. (2014). Infant nutrition–diet between 6 and 24 months,
implications for paediatric growth, overweight and obesity. Nutrition Bulletin, 39, 354-363.
Heinrich, H., Gabbe, E., Whang, D., Bender-Götze, C., & Schäfer, K. H. (1975). Ferrous and
hemoglobin-59 Fe absorption from supplemented cow milk in infants with normal and
depleted iron stores. Z Kinderheilkd 120, 251-258.
Ilich, J. Z., & Kerstetter, J. E. (2000). Nutrition in bone health revisited: a story beyond
calcium. Journal of the American College of Nutrition, 19, 715-737.
Institute of Medicine (2011). Committee to review dietary reference intakes for vitamin D
and calcium. Washington DC, National Academies Press: US.
Kemi, V. E., Karkkainen, M. U., & Lamberg-Allardt, C. J. (2006). High phosphorus intakes
acutely and negatively affect Ca and bone metabolism in a dose-dependent manner in healthy
young females. British Journal of Nutrition, 96, 545-552.
Kemi, V. E., Karkkainen, M. U., Rita, H. J., Laaksonen, M. M., Outila, T. A., & Lamberg-
Allardt, C. J. (2010). Low calcium:phosphorus ratio in habitual diets affects serum
parathyroid hormone concentration and calcium metabolism in healthy women with adequate
calcium intake. British Journal of Nutrition, 103, 561-568.
Koletzko, B., Baker, S., Cleghorn, G., Neto, U. F., Gopalan, S., Hernell, O., Hock, Q. S.,
Jirapinyo, P., Lonnerdal, B., Pencharz, P., Pzyrembel, H., Ramirez-Mayans, J., Shamir, R.,
Turck, D., Yamashiro, Y., & Zong-Yi, D. (2005). Global standard for the composition of
infant formula: recommendations of an ESPGHAN coordinated international expert group.
Journal of Paediatric Gastroenterology and Nutrition, 41, 584-599.
McAndrew, F., Thompson, J., Fellows, L., Large, A., Speed, M., & Renfrew, M. (2012).
Infant Feeding Survey 2010. Leeds: Health and Social Care Information Centre.
Melo, R., Gellein, K., Evje, L., & Syversen, T. (2008). Minerals and trace elements in
commercial infant food. Food and Chemical Toxicology, 46, 3339-3342.
Muehleisen, B., & Gallo, R. L. (2013). Vitamin D in allergic disease: shedding light on a
complex problem. Journal of Allergy and Clinical Immunology, 131, 324-329.
179
Mughal, M., Salama, H., Greenaway, T., Laing, I., & Mawer, E. B. (1999). Lesson of the
week: florid rickets associated with prolonged breast feeding without vitamin D
supplementation. British Medical Journal, 318, 39.
National Health and Medical Research Council (2006). Nutrient reference values for
Australia and New Zealand: Including recommended dietary intakes. Ministry of Health:
Australian Government.
Rosado, J. L. (2003). Zinc and copper: proposed fortification levels and recommended zinc
compounds. Journal of Nutrition, 133, 2985S-2989S.
Sandstead, H. H. (2000). Causes of iron and zinc deficiencies and their effects on brain.
Journal of Nutrition, 130, 347S-349S.
Sandstrӧm, B. (2001). Micronutrient interactions: effects on absorption and bioavailability.
British Journal of Nutrition, 85, S181-S185.
Sax, L. (2001). The Institute of Medicine’s “Dietary Reference Intake” for phosphorus: a
critical perspective. Journal of the American College of Nutrition, 20, 271-278.
Scientific Advisory Committee on Nutrition (2003). Salt and Health. TSO: Norwich.
Scientific Advisory Committee on Nutrition (2011). SACN Dietary Reference Values for
Energy. SACN: reports and position papers, Public Health England.
Skinner, J. D., Carruth, B. R., Houck, K. S.., Coletta, F., Cotter, R., Ott, D., & Mcleod, M.
(1997). Longitudinal study of nutrient and food intakes of infants aged 2 to 24 months.
Journal of the American Dietetic Association, 97, 496-504.
Thompkinson, D. K., & Kharb, S. (2007). Aspects of Infant Food Formulation.
Comprehensive Reviews in Food Science and Food Safety, 6, 79-102.
Trumbo, P., Yates, A. A., Schlicker, S., & Poos, M. (2001). Dietary Reference Intakes:
Vitamin A, Vitamin K, Arsenic, Boron, Chromium, Copper, Iodine, Iron, Manganese,
Molybdenum, Nickel, Silicon, Vanadium, and Zinc. Journal of the American Dietetic
Association, 101, 294-301.

180
Zand, N., Chowdhry, B. Z., Pullen, F. S., Snowden, M. J., & Tetteh, J. (2012a). Simultaneous
determination of riboflavin and pyridoxine by UHPLC/LC-MS in UK commercial infant
meal food products. Food Chemistry, 135, 2743-2749.
Zand, N., Chowdhry, B. Z., Wray, D., Pullen, F. S., & Snowden, M. J. (2012b). Elemental
content of commercial ‘ready to-feed’ poultry and fish based infant foods in the UK. Food
Chemistry, 135, 2796-2801.
181
Chapter 6
Microencapsulation of docosahexaenoic acid (DHA) for potential
use in ready to feed infant foods
6.1 Introduction
During infancy long chain polyunsaturated fatty acids (LCPUFA) are thought to be a specific
dietary requirement due to the rapid rate of physiological and immunological development
(Lapillonne, et al., 2014). Docosahexaenoic acid (DHA) 22:6 n-3 is the most abundant n-3
fatty acid in the central nervous system and is specifically concentrated within membrane
lipids of the grey matter within the brain and the visual elements of the retina. Some
intervention and epidemiological studies have associated low plasma and blood cell lipid
DHA concentrations with increased risk of poor visual and neural development in infants
(Bouwstra, et al., 2003; Dunstan, et al., 2006; Helland, et al., 2003; Hibbeln, et al., 2007;
Innis & Friesen, 2008; Innis, et al., 2001; Oken, et al., 2005; Uauy & Danqour, 2006;
Williams, et al., 2001).
In the Western diet the consumption of n-3 LCPUFA, eicosapentaenoic acid (EPA) 20:5 n-3
and DHA, is below recommended levels. Furthermore conversion in the body from the
precursor α-linoleic acid (18:3 n-3) does not appear to overcome this deficiency (Vongsvivut,
et al., 2012). A preliminary study to evaluate the total daily intake of essential fatty acids in
an infant’s diet based on the consumption of fortified infant formula and commercial ‘ready-
to-feed’ complementary infant foods in the UK indicates that infants are not meeting the
requirements for LCPUFA, in particular DHA (Loughrill & Zand, 2016). This may have
implications for brain and visual development, as well as inflammatory and immune
functions. Furthermore due to there being limited food sources rich in DHA, infant food
products may need to be fortified to meet current legislative requirements (Innis, 2008).
Fish oil is a rich source of n-3 LCPUFA, especially DHA and EPA, and is currently the main
commercial source for nutritional supplements and food fortification of these LCPUFA
(Vongsvivut, et al., 2012). However LCPUFA are highly susceptible to oxidative
deterioration during food processing and storage, which limits their use in food products due
to off-flavour and odour production. In addition, the primary oxidation products,
hydroperoxides, are considered to be toxic (Kagami, et al., 2003). Microencapsulation can be
182
used as a method to protect the LCPUFA against oxidation so as to enable their successful
incorporation into food products (Vongsvivut, et al., 2012).
Encapsulation is a rapidly developing area of technology with great potential in the food
industry. The process involves small particles of core material being packaged within a wall
material to form microparticles, the wall is designed to protect the core from deterioration
and release it under desired conditions (Kagami, et al., 2003). In particular for fish oils
encapsulation can also offer improved handling properties of the oil, allow easy storage and
mask the taste or odour of the core to offer improved palatability of the product (Botrel, et al.,
2014). Spray drying is a common technique used to encapsulate oils in the food industry
(Jafari, et al., 2008). Furthermore microencapsulation of materials that are susceptible to
oxidation has been shown to significantly hinder oxidation (Kagami, et al., 2003).
Fish oils have been encapsulated using a range of technologies in the literature, including
fluidized bed coating, spray dried emulsions and single and multi-core complex coacervation
(Vongsvivut, et al., 2012). Spray drying is the most commonly used technology in the food
industry due to its low cost and ready availability of equipment (Aghbashlo, et al., 2012) and
has therefore been used in this study for the microencapsulation of fish oil.
Recently nano-emulsions have attracted pronounced attention in various industrial fields
(Jafari, et al., 2008). The core material in the nano-size range will be encapsulated into the
matrix of micron-size powder particles. Jafari, et al. (2008) have shown microfluidization to
be an efficient emulsification technique to form fish oil encapsulated powders; this technique
will be employed for the production of lipid nano-emulsions followed by spray drying to
form the encapsulated powder.
Many of the spray dried fish oil formulations on the market and in the literature use water
soluble polymers as wall materials, which are not compatible with aqueous based food
products, as the fish oil would be released from the microparticles within the food product
prior to consumption. Hydroxy propyl methyl cellulose acetate succinate (HPMCAS) is a
water insoluble polymer, which is available in three commercially available grades (L, M and
H grades) which differ in their acetyl and succinoyl content and vary in their pH solubility. It
was originally developed as an enteric polymer for aqueous dispersion coating. The enteric
coating prevents dissolution of the core in acidic pH (Sarode, et al., 2014). In addition to the
polymer being water insoluble to prevent fish oil release in aqueous based food products,
HPMCAS also offers encapsulation of the fish oil under certain pH conditions. In particular
183
to this study, infant foods are typically within the pH range of 3-4; therefore the fish oil will
remain encapsulated in the food product and be released within the intestine for absorption
after consumption. Therefore HPMCAS has been employed as the polymer for coating in this
study.
The objectives of this study are to:
a) Develop a microencapsulated fish oil product using HPMCAS as the wall material which
can be used for the fortification of DHA in infant food products.
b) Explore two methodologies for the microencapsulation of fish oil; 1) microfluidization to
form nano-emulsions which will be subsequently spray dried in HPMCAS and 2) directly
spray dried fish oil in HPMCAS; both products from 1) and 2) will be referred to in this study
as encapsulated powder.
c) Undertake an evaluation of the two methodologies used for the production of spray dried
encapsulated powders, including DHA content, solid yield % and DHA encapsulation
efficiency, to determine the most appropriate method of production.
d) Characterize the microencapsulated fish oil powder produced by the most appropriate
method identified in c), using various techniques; including moisture content, water activity,
encapsulation efficiency, particle size distribution (PSD), scanning electron microscopy
(SEM), X ray powder diffraction (XRPD), Fourier transform infrared (FTIR), differential
scanning calorimetry (DSC) and thermal gravimetric analysis (TGA). In addition the stability
of the encapsulated DHA will be compared to its un-encapsulated fish oil counterpart. Finally
pH dependent release of DHA will be assessed under simulated gastric and intestinal
dissolution conditions.
6.2 Materials and Methods
Fish oil (Baby’s DHA) was purchased from Nordics Naturals (Watsonville, California);
containing 9 kcal, 1 g of fat, 210 mg of omega 3 fatty acids, 70 mg of EPA and 97 mg of
DHA per mL of fish oil. The polymer HPMCAS (AS-LG) was supplied by Shin-Etsu
Chemical Co., Ltd (Tokyo, Japan). Tristearin and Poloxamer 188 solution (Pluronic F68)
were purchased from Sigma Aldrich (Bellefonte, PA). Acetone, methanol and hexane (HPLC
grade) were purchased from Fisher UK. All other general chemicals used in this study were
of analytical grade.
184
6.2.1 Preparation and spray drying of solid lipid nanoparticles
The lipid (tristearin) phase (1 g) was fully melted at 75°C and dispersed with heated fish oil
(2 mL). The aqueous surfactant solution was prepared by adding surfactant (Pluronic F68, 0.5
g) to 50 mL pre-heated deionised water (75°C). A pre-emulsion was formed by mixing the
hot lipid phase with the aqueous surfactant solution and held at 75°C using an IKA® T25
digital Ultra Turrax® (Germany) at high speed for 5 min. The crude dispersion was
processed through a Micro DeBEE (B.E.E. International Inc. Easton, MA) high pressure
homogenizer at 75°C and 15,000 psi for 10 minutes. The Micro DeBEE was heated (75°C)
prior to homogenization. The emulsion was left to cool down at room temperature whilst
stirring. The produced solid lipid nanoparticles (SLN) were stored at 5°C prior to spray
drying.
The polymer (HPMCAS, 2.5g) was dissolved in 200 mL of deionised water and the pH was
adjusted to 6.5 using sodium hydroxide, which was subsequently filtered to remove any
remaining particulates. 14.5 mL of the fish oil SLN was added to the polymer solution to
make feed solutions. SLN encapsulation in HPMCAS was achieved by using a Buchi mini
spray dryer (B-290, Switzerland). Operating parameters were: inlet temperature, 160°C; feed
rate, 7%; aspirator, 85%; compressed air, 40%. Yields of the spray-drying process were 40-
45%.
The solid yield was calculated as the ratio of the encapsulated powder weight collected after
every spray-drying experiment to the initial amount of solids in the sprayed dispersion
volume (Martinez et al., 2015).
The solid yield % was calculated as follows:
Collected encapsulated powder weight (g)/ initial amount of solids (g) x 100
185
6.2.2 Spray drying of DHA-HPMCAS microparticles
5.0 g of the polymer (HPMCAS) was added to 250 mL of acetone/methanol (5:1, v/v) whilst
stirring until completely dissolved. Fish oil (1.5 g) was then progressively added to the
polymer solution whilst stirring to make feed solutions. DHA/HPMCAS microparticles were
produced using a Buchi mini spray dryer (B-290, Switzerland). Operating parameters were:
inlet temperature, 78°C; feed rate, 17%; aspirator, 85%; compressed air, 40%. Yields of the
spray-drying process were between 50 – 60%.
6.2.3 Fatty acid composition of encapsulated powders
The two encapsulated powders produced by the different methodologies were analyzed by
ILS laboratories (Derbyshire, UK) for fatty acid composition. Briefly, after the removal of the
extracting solvent, the extracted fat is saponified with methanolic sodium hydroxide, to form
soaps with the liberated fatty acids. Upon acidification, the free acids undergo an acid
catalysed esterification reaction to form methyl esters of the respective fatty acids. These
methyl esters are finally extracted into hexane and the fatty acid profile is determined using
capillary gas chromatography using a flame ionisation detector. The DHA encapsulation
efficiency was calculated as follows:
DHA in encapsulated powder (g)/ DHA added initially (g) x 100
6.2.4 Characterisation of the encapsulated powder
Following the evaluation of the two approaches to produce fish oil encapsulated powders
based on solid yield %, DHA encapsulation efficiency and DHA content, the most
appropriate methodology was selected and the selected encapsulated powder characterised
using the following techniques.
6.2.4.1 Moisture Content
The moisture content of the encapsulated powder was determined using two methods, oven
drying and TGA.
186
6.2.4.2 Oven Drying
Two grams of the generated encapsulated powder was dried in a Thermo Scientific Heraeus®
oven (Germany) at 70°C for 24 hours (Aghbashlo et al., 2012). Weight measurements were
performed using an AAA, 250 L balance (Mettler Toledo, China) with a precision of
± 0.0001 g.
The moisture content was calculated as follows:
Wet weight of sample (g) – Weight of sample after drying (g) x 100
Wet weight of sample (g)
6.2.4.3 Thermal Gravimetric Analysis
The moisture content and physicochemical properties of the polymer (HPMCAS) and
encapsulated powder samples were analyzed using TA Instruments’ TGA Q5000 (UK). A
sample weight of 2.7 ± 0.6 mg was heated from ambient temperature to 600 °C in aluminium
pans at 10 °C/min, under nitrogen atmosphere at a flow rate of 25 mL/min. Results were
analyzed using TA universal analysis software.
6.2.4.4 Water Activity
The water activity of the encapsulated powder was measured using an Aqua Lab Dew Point
water activity meter 4TE (USA).
6.2.4.5 Encapsulation Efficiency
The amount of un-encapsulated oil was immediately measured to calculate the encapsulation
efficiency after production by spray drying. Hexane (15 mL) was added to 1.5 g of the
encapsulated powder, followed by shaking of the mixture for 2 minutes. The suspension was
then filtered through a Whatman no.1 filter paper, the residue was rinsed three times with 20
mL hexane. The filtrate solution containing the extracted oil was then transferred to a
Fistreem vacuum oven (UK) until evaporation of the solvent, finally for complete
evaporation the residue was dried for 1 hour in a Thermo Scientific Heraeus® oven
(Germany) at 70°C. The amount of surface oil was calculated by the difference in initial and
final weights of slurry container (Aghbashlo, et al., 2012; Carneiro, et al., 2013).
187
The encapsulation efficiency was calculated as follows:
TO-SO / TO x 100
TO: Total oil, SO: Surface oil
In this study no total oil analysis was performed assuming that all the initial oil was retained
in the powder due to it being non-volatile, furthermore depositions of the unbound oil on the
dryer wall and degradation of the oil during spray drying was ignored.
6.2.4.6 Scanning Electron Microscopy
The encapsulated powder was sputter coated with chromium using a K575X Turbo-Pumped
Chromium Sputter Coater (Quorum Technologies Ltd, UK). The morphological features were
observed using a Hitachi SU 830 cold-cathode Field Emission Gun Scanning Electron
Microscope (Japan) with an accelerated voltage of 1 kV and magnification of x1000-20,000.
6.2.4.7 Particle Size Distribution
The particle size distribution of the encapsulated material was measured using a Mastersizer
2000 (Malvern instruments) and results were analyzed using Mastersizer 2000 analysis
software.
6.2.4.8 X ray Powder Diffraction
The crystalline state of HPMCAS and the encapsulated powder was evaluated using a D8
Advance X-ray Diffractometer (Bruker, Germany) using Cu Kα radiation at 40 kV and
40 mA. Samples were analyzed at angles from 3 to 40o in 2θ with an increment of 0.03
o and a
counting time of 0.5 seconds per step. Data was collected using DIFFRAC plus XRD
Commander Version 2.6.1 software (Bruker-AXS) (ICDD, 2008).
188
6.2.4.9 Fourier Transform Infrared
FTIR spectra of fish oil, HPMCAS and the produced encapsulated powder were obtained on
a Spectrum Two FTIR spectrophotometer (Perkin Elmer, UK) coupled with an attenuated
total reflectance (ATR) accessory (Perkin Elmer, UK). The crystal was washed with iso-
propanol between each sampling. The background spectrum was obtained by measuring the
empty chamber. A resolution of 4 cm-1
was used and the ATR spectra were averaged on 10
scans. The scanning range was 450 to 4000 cm−1
. Results were analyzed using Perkin Elmer
spectrum analysis software.
6.2.4.10 Differential Scanning Calorimetry
The thermophysical properties of the fish oil, HPMCAS and the encapsulated powder were
studied using TA Instruments’ Q2000 DSC (UK) equipped with a refrigerated cooling system
under nitrogen atmosphere (50 mL/min) in hermetic aluminium pans with a single pin-hole in
the lid. 2.1 ± 0.5 mg of HPMCAS and encapsulated powder and 6.6 ± 0.7 mg of fish oil were
cooled and held isothermal for 2 minutes at -90°C and heated to 100°C for fish oil and 200°C
for HPMCAS and the encapsulated powder at 10°C/min. Results were analyzed using TA
universal analysis software.
6.2.4.11 Stability Testing
For the stability tests, a comparison between the loss of DHA from un-encapsulated fish oil
and microencapsulated fish oil were assessed. The encapsulated powder and un-encapsulated
fish oil were sealed in brown glass containers and stored either at room temperature or at
40°C in a Thermo Scientific Heraeus® oven (Germany), in order to accelerate oxidation, for
one week. After one week all samples were analyzed for DHA content.
189
6.2.4.12 Dissolution
The dissolution was carried out at 37°C by adding 2 g of the encapsulated powder into 500
mL of acidic dissolution medium (0.1 mol/L HCl) to mimic the stomach environment for 2
hours or phosphate buffer (PBS pH 6.8) to mimic the intestinal environment until completely
dissolved, both stages were agitated using a IKA Werke magnetic hot plate stirrer (Radley
Discovery Technologies, Germany). The time required for the encapsulated powder to
completely dissolve in the intestinal environment was recorded. After dissolution an aliquot
of the dissolution media was centrifuged at 3000 rpm for 5 minutes to remove any
encapsulated material and the supernatant was analyzed for DHA content.
6.3 Results and Discussion
6.3.1 Methods of Encapsulation
Two different production methodologies were employed for the production of fish oil spray
dried encapsulated powders. Firstly, SLN of encapsulated fish oil were subsequently spray
dried in HPMCAS and secondly solid dispersions of fish oil and polymer (HPMCAS) were
directly spray dried. Following production by spray drying solid yield % was calculated and
the encapsulated powders were analyzed for DHA content in order to determine the DHA
encapsulation efficiency (Table 6.2). Table 6.1 illustrates the fatty acid composition of the
two formulations. Table 6.2 shows that the concentration of DHA is 3.5 times greater in the
directly spray dried production method compared to the spray dried nano-emulsion technique.
Due to these results the encapsulated powder produced by the directly spray dried production
method was taken forward for further characterisation due to the fact that less of the
microencapsulated material would need to be added to the final food product for fortification.
In addition the process offered higher yield production and a much greater DHA
encapsulation efficiency (Table 6.2). Finally the directly spray dried method was less time
consuming and more cost effective.
190
Table 6.1 Comparison of the fatty acid composition of fish oil encapsulated powders
produced by different encapsulation methodologies.
Fatty Acid Spray dried
(g/100 g sample)
Spray dried nano-emulsion
(g/100 g sample)
Saturated fatty acids
Myristic acid 0.83 0.39
Palmitic acid 2.13 1.43
Stearic acid 0.44 1.75
Arachic acid 0.01 0.02
Unsaturated fatty acids
Palmitoleic acid 1.85 0.67
Petroselaidic acid 0.06 0.03
Oleic acid 4.02 1.34
Linoleic acid 0.48 0.16
Gamma linolenic acid 0.05 0.01
Linolenic acid 0.44 0.14
Dihomo-linolenic acid 0.02 0.01
Arachidonic acid 0.21 0.06
EPA 1.64 0.50
DPA 0.19 0.06
DHA 2.09 0.60
Total saturated acids 3.41 3.61
Total unsaturated acids 11.03 3.58
Mono-unsaturates (cis) 5.87 2.01
Mono-unsaturates (trans) 0.06 0.03
Poly-unsaturates (cis) 5.10 1.54
Total trans acids 0.06 0.03
Total omega 3 4.36 1.30
Total omega 6 0.74 0.24
Total omega 9 4.02 1.34
Table 6.2 DHA content, solid yield % and DHA encapsulation efficiency (EE) of
encapsulated powders produced by different methodologies.
Production Method DHA (g/100g) Solid yield % DHA EE%
Directly spray dried 2.09 54 93
Spray dried nano-emulsion 0.60 42 38
191
6.3.2 Characterisation of the encapsulated powder
6.3.2.1 Moisture content, water activity and encapsulation efficiency
The encapsulated powder produced by the selected production method of directly spray dried
fish oil in HPMCAS was characterised according to the methods explained previously in
Section 6.2.4.
The moisture content of the encapsulated powder was determined to be 1.11% using the oven
drying method and 1.39% using TGA which is under the minimum specification of 3-4% for
most dried powders used in the food industry. The moisture content of the polymer HPMCAS
determined by TGA was higher at 2.19%. Moisture content is well known to have a
significant effect on the lipid stability. It has been observed that low water contents are
usually associated with low water activities, which might prevent lipid oxidation (Klaypradit
& Huang, 2008). The water activity (aw) of the encapsulated powder was found to be 0.324,
which again is within the ideal range of 0.2–0.4 for storage stability in lipid oxidation as
reported elsewhere (Rockland & Beuchat, 1987; Rükold, et al., 2001).
During the spray drying process of the oil, the encapsulation efficiency is an important
outcome, which can be determined indirectly by extracting the un-encapsulated oil. The
surface oil or un-encapsulated oil is the amount of oil that is non-encapsulated. This can
determine the quality of the microparticles as the surface oil is prone to oxidation, which may
subsequently lead to the development of off flavours and affect the quality and shelf life of
the product (Drusch & Berg, 2008). Encapsulation efficiency is dependent on many factors,
including the nature of the encapsulated material, composition of the blend of coating
material, homogeneity of dried slurry and spray drying parameters (Roccia, et al., 2014). The
percentage of surface oil of the encapsulated powder was determined to be 12.4%.
Another important parameter to consider is the ratio of wall material to core in the
encapsulated powder, where it is generally accepted that a 2-4 (w/w) wall material to core
ratio should be suitable for most applications. A ratio below 2 could lead to an unacceptable
increase in surface oil, while a ratio greater than 4 could result in a powder with very low oil
content, which is not desirable for food applications (Gallarado, et al., 2013). The wall
material to core ratio in this particular study was (5 g HPMCAS: 1.5 g fish oil) 3.33:1, which
is within the recommended range.
192
6.3.2.2 Scanning Electron Microscopy
Fig. 6.1 illustrates the SEM images of the encapsulated powder, showing no apparent cracks
or pores, which are necessary to protect the core material from oxygen and undesired release
of oil droplets to the surface of particles, which is an advantage, since it suggests that
capsules have lower permeability to gases, increasing protection and retention of the fish oil.
In addition, the encapsulated powder appears wrinkled, with concave surfaces and in a
variety of sizes which is typical of powders produced by spray drying. This type of
morphology has also been observed by Kolinowski, et al. (2004) and Davidov-Pardo, et al.
(2008) when encapsulating fish oils. The formation of hollow particles can be explained by
the formation of a vacuole inside the particles, immediately after the crust development. This
crust inflates when the particle temperature exceeds the local ambient boiling point and the
vapour pressure within the vacuole rises above the local ambient pressure (Nijdam &
Langrish, 2006). The lack of pores on the encapsulated powder surface was related to the
good encapsulation efficiency obtained in the experimental design and the low surface oil
content was a consequence of a continuous wall surface (Roccia, et al., 2014).
Figure 6.1 SEM micrographs of fish oil encapsulated powder using varying magnifications
(x1k – 20k).
193
3.2.3 Particle Size Distribution
Fig. 6.2 shows the PSD of the encapsulated powder measured through the light scattering
properties of the product. The particle size varied from d(0.1) 3.366 to d(0.9) 18.204 μm,
with a median particle size of d(0.5) 7.435 μm. The span value observed was 1.996, a relative
span less than 2 is normally considered as a narrow distribution in spray drying (Gottlieb &
Schwartzbach, 2004). A high span value would indicate a wide size distribution and a high
polydispersity (Dubey & Parikh, 2004).
Figure 6.2 PSD of fish oil encapsulated powder (range: d(0.1) 3.366 – d(0.9) 18.204 μM;
median d(0.5) 7.435 μM).
6.3.2.4 X ray Powder Diffraction
XRPD was applied to identify the degree of crystallinity in the polymer (HPMCAS) and
encapsulated powder. In general, a crystalline material presents sharp peaks while amorphous
products provide a broader peak pattern (Caparino, et al., 2012). As shown in Fig. 6.3, the
polymer HPMCAS and the encapsulated powder exhibited an amorphous structure with
minimum organisation based on the occurrence of large diffuse peaks. It is known that
amorphous solids are in general more soluble and more hygroscopic (Botrel, et al., 2014). An
amorphous nature dictates higher dissolution profiles as the amorphous form has a higher
degree of disorder (higher free energy) (Al-Obaidi & Buckton, 2009).
Particle Size Distribution
0.1 1 10 100 1000 3000
Particle Size (µm)
0
2
4
6
8
10
Volu
me (
%)
Averaged Result, 26 February 2015 10:06:26
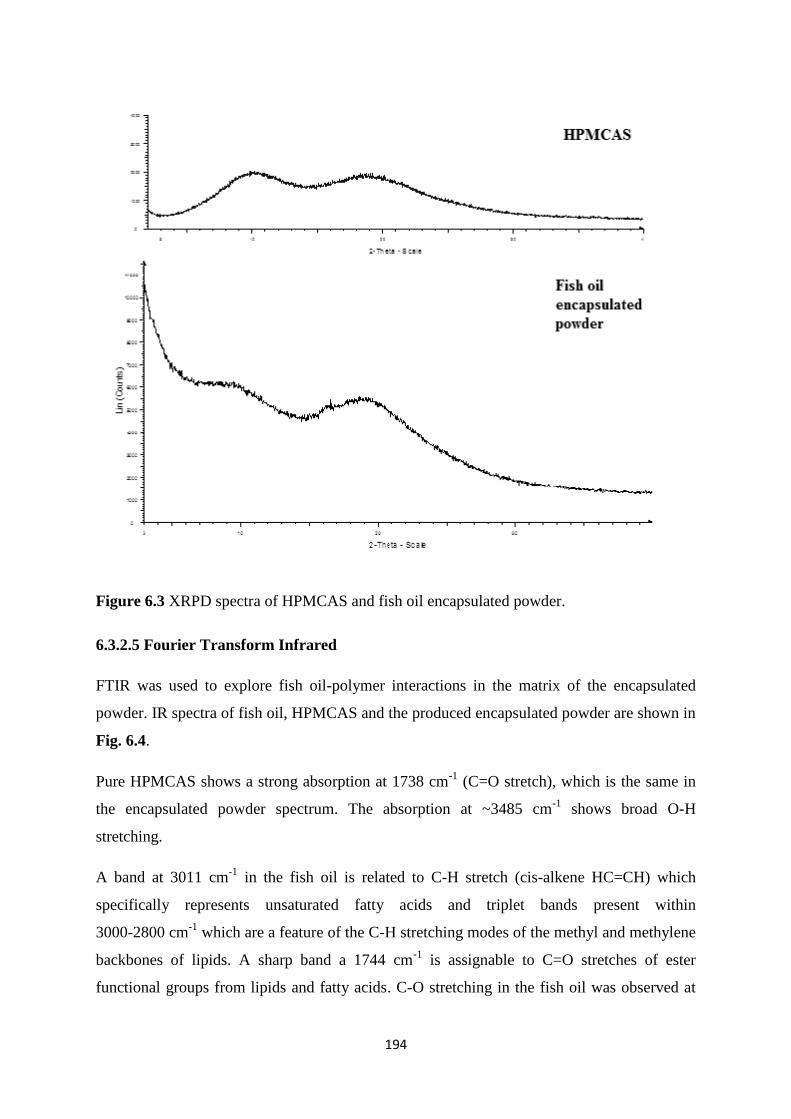
194
Figure 6.3 XRPD spectra of HPMCAS and fish oil encapsulated powder.
6.3.2.5 Fourier Transform Infrared
FTIR was used to explore fish oil-polymer interactions in the matrix of the encapsulated
powder. IR spectra of fish oil, HPMCAS and the produced encapsulated powder are shown in
Fig. 6.4.
Pure HPMCAS shows a strong absorption at 1738 cm-1
(C=O stretch), which is the same in
the encapsulated powder spectrum. The absorption at ~3485 cm-1
shows broad O-H
stretching.
A band at 3011 cm-1
in the fish oil is related to C-H stretch (cis-alkene HC=CH) which
specifically represents unsaturated fatty acids and triplet bands present within
3000-2800 cm-1
which are a feature of the C-H stretching modes of the methyl and methylene
backbones of lipids. A sharp band a 1744 cm-1
is assignable to C=O stretches of ester
functional groups from lipids and fatty acids. C-O stretching in the fish oil was observed at
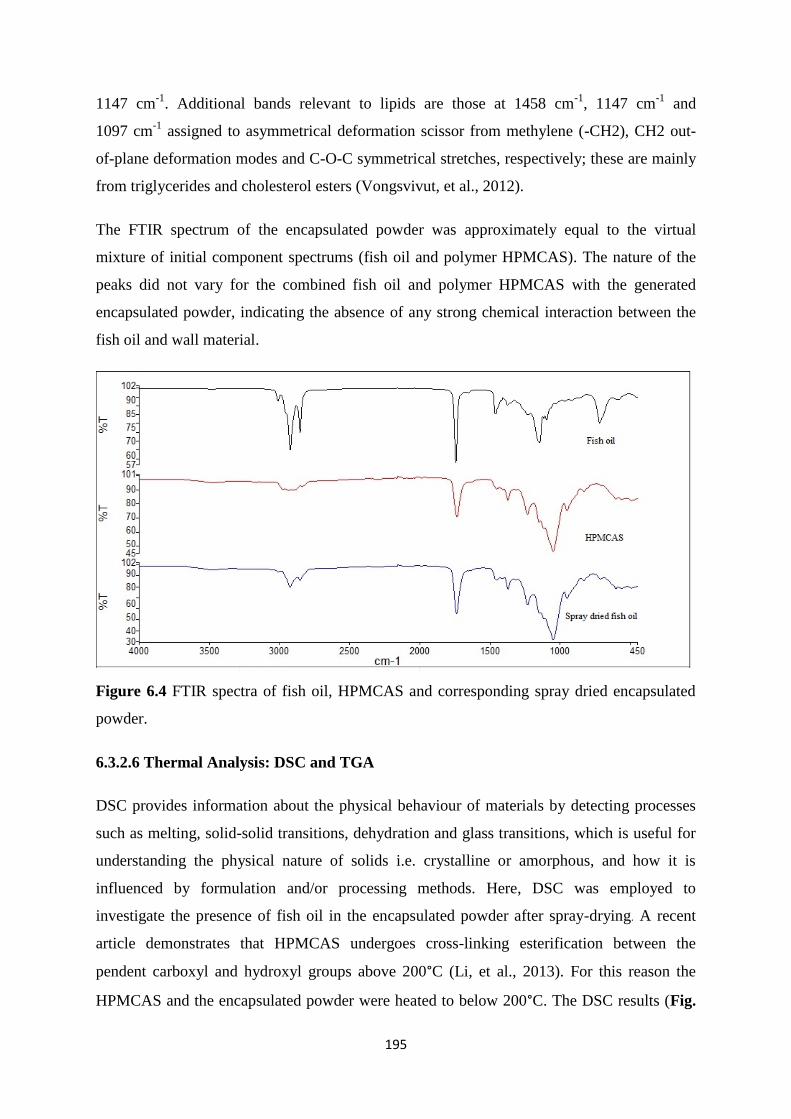
195
1147 cm-1
. Additional bands relevant to lipids are those at 1458 cm-1
, 1147 cm-1
and
1097 cm-1
assigned to asymmetrical deformation scissor from methylene (-CH2), CH2 out-
of-plane deformation modes and C-O-C symmetrical stretches, respectively; these are mainly
from triglycerides and cholesterol esters (Vongsvivut, et al., 2012).
The FTIR spectrum of the encapsulated powder was approximately equal to the virtual
mixture of initial component spectrums (fish oil and polymer HPMCAS). The nature of the
peaks did not vary for the combined fish oil and polymer HPMCAS with the generated
encapsulated powder, indicating the absence of any strong chemical interaction between the
fish oil and wall material.
Figure 6.4 FTIR spectra of fish oil, HPMCAS and corresponding spray dried encapsulated
powder.
6.3.2.6 Thermal Analysis: DSC and TGA
DSC provides information about the physical behaviour of materials by detecting processes
such as melting, solid-solid transitions, dehydration and glass transitions, which is useful for
understanding the physical nature of solids i.e. crystalline or amorphous, and how it is
influenced by formulation and/or processing methods. Here, DSC was employed to
investigate the presence of fish oil in the encapsulated powder after spray-drying. A recent
article demonstrates that HPMCAS undergoes cross-linking esterification between the
pendent carboxyl and hydroxyl groups above 200°C (Li, et al., 2013). For this reason the
HPMCAS and the encapsulated powder were heated to below 200°C. The DSC results (Fig.
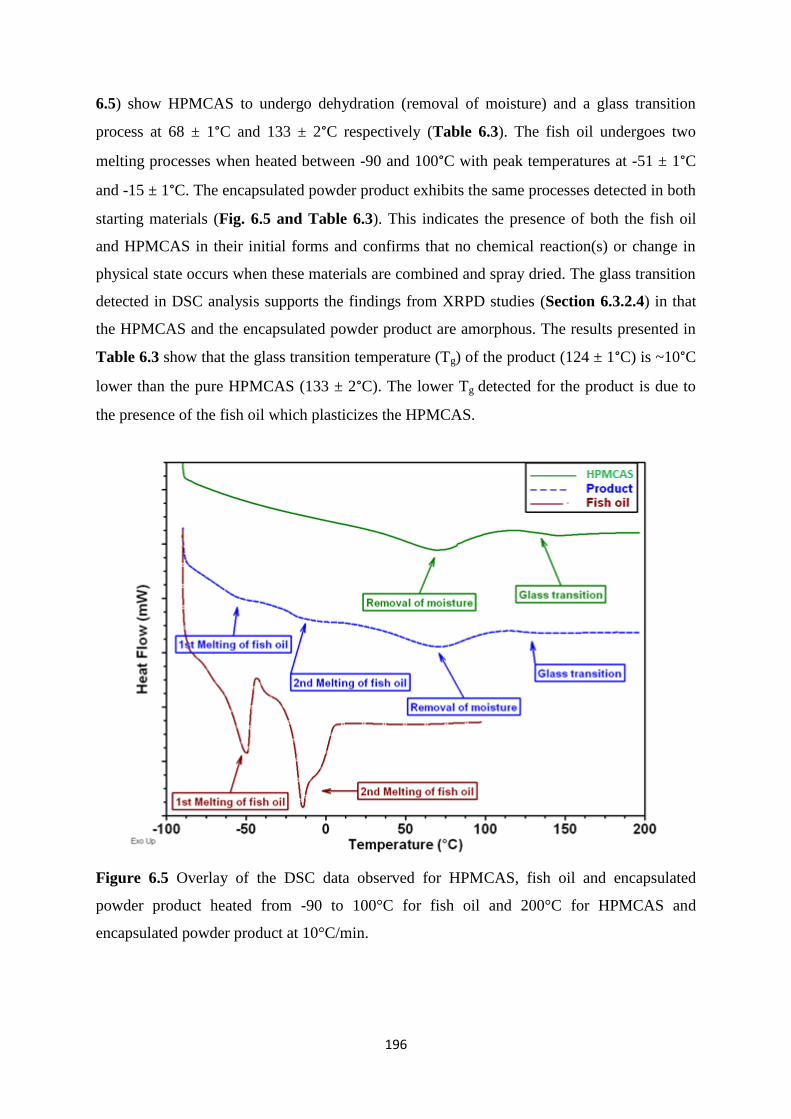
196
6.5) show HPMCAS to undergo dehydration (removal of moisture) and a glass transition
process at 68 ± 1°C and 133 ± 2°C respectively (Table 6.3). The fish oil undergoes two
melting processes when heated between -90 and 100°C with peak temperatures at -51 ± 1°C
and -15 ± 1°C. The encapsulated powder product exhibits the same processes detected in both
starting materials (Fig. 6.5 and Table 6.3). This indicates the presence of both the fish oil
and HPMCAS in their initial forms and confirms that no chemical reaction(s) or change in
physical state occurs when these materials are combined and spray dried. The glass transition
detected in DSC analysis supports the findings from XRPD studies (Section 6.3.2.4) in that
the HPMCAS and the encapsulated powder product are amorphous. The results presented in
Table 6.3 show that the glass transition temperature (Tg) of the product (124 ± 1°C) is ~10°C
lower than the pure HPMCAS (133 ± 2°C). The lower Tg detected for the product is due to
the presence of the fish oil which plasticizes the HPMCAS.
Figure 6.5 Overlay of the DSC data observed for HPMCAS, fish oil and encapsulated
powder product heated from -90 to 100°C for fish oil and 200°C for HPMCAS and
encapsulated powder product at 10°C/min.
197
Table 6.3 Mean temperatures at the peak maxima and energies associated with the processes
detected in DSC analysis.
Sample Melting process Dehydration process Glass transition
1 2
°C ΔH (J/g) °C ΔH (J/g) °C ΔH (J/g) °C ΔCp (J/(g.°C))
Fish oil -51 ± 1 43 ± 3 -15 ± 1 54 ± 5 - - - -
HPMCAS - - - - 68 ± 1 53 ± 4 133 ± 2 0.11 ± 0.02
Product -56 ± 1 4 ± 1 -14 ± 1 6 ± 1 67 ± 1 42 ± 2 124 ± 1 0.08 ± 0.01
The TGA results for HPMCAS and the encapsulated powder product are presented in Fig. 6.6
and show that both the polymer and encapsulated powder product undergo the same three
processes when heated from ambient temperature to 600°C with a total percentage weight
loss in each sample of 96 ± 1 %. This demonstrates that no chemical changes of the starting
materials occurred during the formulation. The 1st weight loss process (below 100°C) is a
dehydration process in which 2.2 ± 0.1 % of moisture is removed for HPMCAS and
1.4 ± 0.1 % for the product, indicating lower moisture content in the encapsulated powder
product. The 2nd
weight loss (277 ± 2°C) is likely to be the removal of water molecules as a
result of the cross-linking esterification reaction of the HPMCAS reported above 200°C (Li,
et al., 2013). Following this process the samples decompose (3rd
weight loss process). The
peak temperature of this decomposition process is higher for the encapsulated powder
product (372 ± 1°C) than the HPMCAS (362 ± 1°C). The higher decomposition temperature
detected for the encapsulated powder product is possibly the result of the fish oil acting as a
protective layer around the HPMCAS. As such greater amount of heat is required to reach the
temperature at which the HPMCAS decomposes.
Thermal analysis results demonstrate that the starting materials did not undergo changes in
their physical state and no chemical reaction(s) occurred during the formulation of the
encapsulated powder. In addition, the increase in decomposition temperature observed for the
encapsulated powder product suggests the fish oil forms a protective layer around the
HPMCAS, indicating good encapsulation as inferred from the FTIR analysis (Section
6.3.2.5).
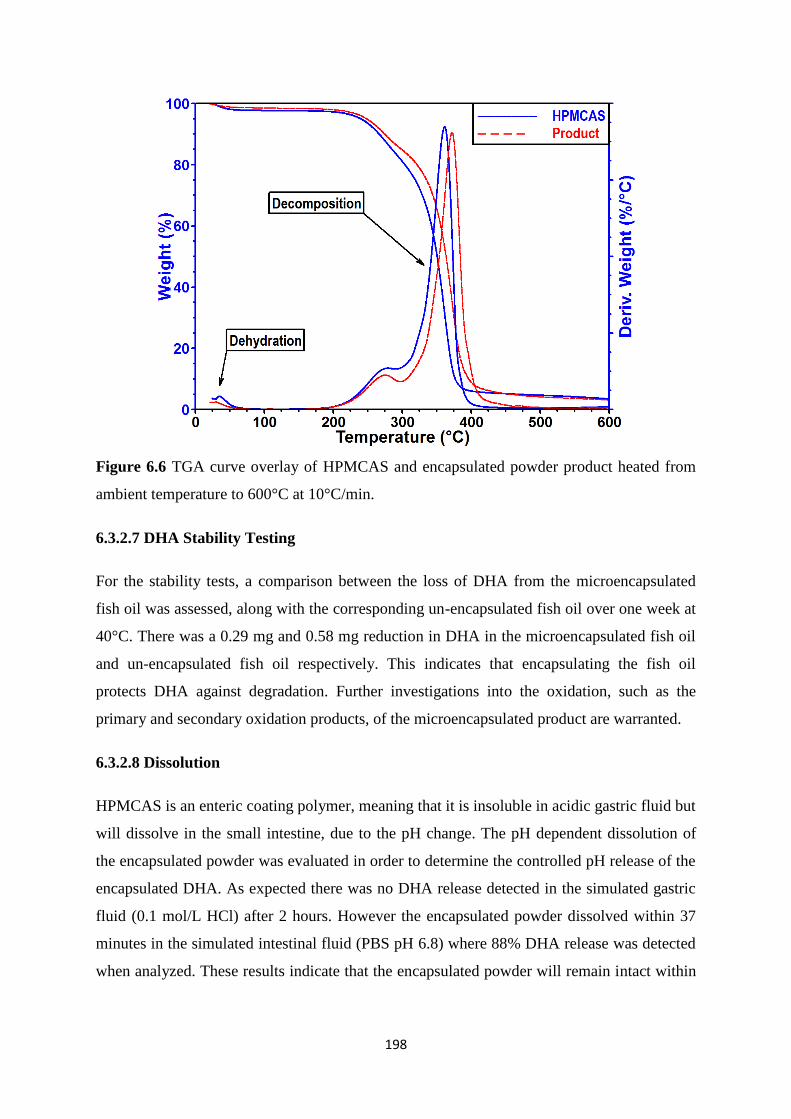
198
Figure 6.6 TGA curve overlay of HPMCAS and encapsulated powder product heated from
ambient temperature to 600°C at 10°C/min.
6.3.2.7 DHA Stability Testing
For the stability tests, a comparison between the loss of DHA from the microencapsulated
fish oil was assessed, along with the corresponding un-encapsulated fish oil over one week at
40°C. There was a 0.29 mg and 0.58 mg reduction in DHA in the microencapsulated fish oil
and un-encapsulated fish oil respectively. This indicates that encapsulating the fish oil
protects DHA against degradation. Further investigations into the oxidation, such as the
primary and secondary oxidation products, of the microencapsulated product are warranted.
6.3.2.8 Dissolution
HPMCAS is an enteric coating polymer, meaning that it is insoluble in acidic gastric fluid but
will dissolve in the small intestine, due to the pH change. The pH dependent dissolution of
the encapsulated powder was evaluated in order to determine the controlled pH release of the
encapsulated DHA. As expected there was no DHA release detected in the simulated gastric
fluid (0.1 mol/L HCl) after 2 hours. However the encapsulated powder dissolved within 37
minutes in the simulated intestinal fluid (PBS pH 6.8) where 88% DHA release was detected
when analyzed. These results indicate that the encapsulated powder will remain intact within
199
the food product and after ingestion through the stomach and release DHA in the intestine at
the site of absorption.
6.4 Conclusions
A directly spray dried fish oil technique has proven beneficial as a production method over a
spray dried nano-emulsion of fish oil in terms of DHA content, DHA encapsulation
efficiency and solid yield %. The use of the encapsulated powder produced would offer
protection against degradation as well as masking the odour and taste to offer palatability of
the product. The encapsulated powder may therefore offer a source of DHA with the potential
to be incorporated into infant foods to meet recommendations (Food and Agriculture
Organisation, 2010). Further work into the storage stability and the effects of the
incorporation of the encapsulated powder into the food product are required.
6.5 References
Aghbashlo, M., Mobli, H., Madadlou, A., & Rafiee, S. (2012). The correlation of wall
material composition with flow characteristics and encapsulation behaviour of fish oil
emulsion. Food Research International, 49(1), 379-388.
Al-Obaidi, H., & Buckton, G. (2009). Evaluation of griseofulvin binary and ternary solid
dispersions with HPMCAS. AAPS PharmSciTech, 10(4), 1172-1177.
Botrel, D. A., Fernandes, R. V. D. V., Borges, S. V., & Yoshida, M. I. (2014). Influence of
wall matrix systems on the properties of spray-dried microparticles containing fish oil. Food
Research International, 62, 344-352.
Bouwstra, H., Dijck-Brouwer, D. J., Wildeman, J. A., Tjoonk, H. M., van der Heide, J. C.,
Boersma, E. R., Muskiet, F. A., & Hadders-Algra, M. (2003). Long-chain polyunsaturated
fatty acids have a positive effect on the quality of general movements of healthy term infants.
The American Journal of Clinical Nutrition, 78(2), 313-318.
Caparino, O., Tang, J., Nindo, C., Sablani, S., Powers, J., & Fellman, J. (2012). Effect of
drying methods on the physical properties and microstructures of mango (Philippine.
Carabao’var.) powder. Journal of Food Engineering, 111(1), 135-148.
200
Carneiro, H. C., Tonon, R. V., Grosso, C. R., & Hubinger, M. D. (2013). Encapsulation
efficiency and oxidative stability of flaxseed oil microencapsulated by spray drying using
different combinations of wall materials. Journal of Food Engineering, 115(4), 443-451.
Davidov-Pardo, G., Roccia, P., Salgado, D., Leon, A., & Pedroza-Islas, R. (2008). Utilization
of different wall materials to microencapsulate fish oil evaluation of its behaviour in bread
products. American Journal of Food Technology, 3, 384-393.
Drusch, S., & Berg, S. (2008). Extractable oil in microcapsules prepared by spray-drying:
localisation, determination and impact on oxidative stability. Food Chemistry, 109(1), 17-24.
Dubey, R., & Parikh, R. (2004). Solid dosage Studies of PLGA Microspheres.
Pharmaceutical Technology Europe, 16(5), 23-34.
Dunstan, J.A., Simmer, K., Dixon, G., & Prescott, S.L. (2006). Cognitive assessment at 2½
years following fish oil supplementation in pregnancy: a randomized controlled
trial. Archives of Disease in Childhood-Fetal and Neonatal Edition. ED. 93, F45–50.
Food and Agriculture Organization of the United Nations (2010). Fats and fatty acids in
human nutrition: Report of an expert consultation. FAO Food and Nutrition Paper 91. Rome
Gallardo, G., Guida, L., Martinez, V., López, M. C., Bernhardt, D., Blasco, R., Pedroza-Islas,
R., & Hermida, L. G. (2013). Microencapsulation of linseed oil by spray drying for functional
food application. Food Research International, 52(2), 473-482.
Gottlieb, N., & Schwartzbach, C. (2004). Development of an internal mixing two-fluid nozzle
by systematic variation of internal parts. 19th Annual Meeting of ILASS (Europe) Conference
Proceedings, Nottingham, UK, 97.
Helland, I.B., Smith, L., Saarem, K., Saugstad, O.D., & Drevon, C.A. (2003). Maternal
supplementation with very-long-chain n-3 fatty acids during pregnancy and lactation
augments children’s IQ at 4 years of age. Pediatrics, 111(1), 39-44.
Hibbeln, J.R., Nieminen, L.R., Blasbalg, T.L., Riggs, J.A., & Lands, W.E. (2006). Healthy
intakes of n−3 and n−6 fatty acids: estimations considering worldwide diversity. The
American Journal of Clinical Nutrition, 83(6), 1483-1493.
201
Innis, S. M. (2008). Dietary omega 3 fatty acids and the developing brain. Brain Research,
1237, 35-43.
Innis, S.M., & Friesen, R.W. (2008). Essential n−3 fatty acids in pregnant women and early
visual acuity maturation in term infants. The American Journal of Clinical Nutrition, 87(3),
548-557.
Innis, S.M., Gilley, J., & Werker, J. (2001). Are human milk long-chain polyunsaturated fatty
acids related to visual and neural development in breast-fed term infants? The Journal of
Paediatrics, 139(4), 532-538.
Jafari, S. M., Assadpoor, E., Bhandari, B., & He, Y. (2008). Nano-particle encapsulation of
fish oil by spray drying. Food Research International, 41(2), 172-183.
Kagami, Y., Sugimura, S., Fujishima, N., Matsuda, K., Kometani, T., & Matsumura, Y.
(2003). Oxidative stability, structure, and physical characteristics of microcapsules formed by
spray drying of fish oil with protein and dextrin wall materials. Journal of Food Science,
68(7), 2248-2255.
Klaypradit, W., & Huang, Y. W. (2008). Fish oil encapsulation with chitosan using ultrasonic
atomizer. LWT-Food Science and Technology, 41(6), 1133-1139.
Kolanowski, W., Laufenberg, G., & Kunz, B. (2004). Fish oil stabilisation by
microencapsulation with modified cellulose. International journal of food sciences and
nutrition, 55(4), 333-343.
Lapillonne, A., Pastor, N., Zhuang, W., & Scalabrin, D.M. (2014). Infants fed formula with
added long chain polyunsaturated fatty acids have reduced incidence of respiratory illnesses
and diarrhea during the first year of life. BMC pediatrics, 14(1), 168.
Li, B., Konecke, S., Harich, K., Wegiel, L., Taylor, L. S., & Edgar, K. J. (2013). Solid
dispersion of quercetin in cellulose derivative matrices influences both solubility and
stability. Carbohydrate polymers, 92(2), 2033-2040.
Loughrill, E., & Zand, N. (2016). An investigation into the fatty acid content of selected fish-
based commercial infant foods in the UK and the impact of commonly practiced re-heating
treatments used by parents for the preparation of infant formula milks. Food Chemistry, 197,
783-789.
202
Martínez, M., Curti, M., Roccia, P., Llabot, J., Penci, M., Bodoira, R., & Ribotta, P. (2015).
Oxidative stability of walnut (Juglans regia L.) and chia (Salvia hispanica L.) oils
microencapsulated by spray drying. Powder Technology, 270, 271-277.
Nijdam, J., & Langrish, T. (2006). The effect of surface composition on the functional
properties of milk powders. Journal of Food Engineering, 77(4), 919-925.
Oken, E., Wright, R.O., Kleinman, K.P., Bellinger, D., Amarasiriwardena, C.J., Hu, H., Rich-
Edwards, J.W., & Gillman, M.W. (2005). Maternal fish consumption, hair mercury, and
infant cognition in a US cohort. Environmental Health Perspectives, 1376-1380.
Roccia, P., Martínez, M. L., Llabot, J. M., & Ribotta, P. D. (2014). Influence of spray-drying
operating conditions on sunflower oil powder qualities. Powder Technology, 254, 307-313.
Rockland, L. B., & Beuchat, L. R. (1987) Water activity: theory and applications to food, M.
Dekker.
Rückold, S., Grobecker, K. H., & Isengard, H. D. (2000). Determination of the contents of
water and moisture in milk powder. Fresenius' Journal of Analytical Chemistry, 368(5), 522-
527.
Sarode, A. L., Obara, S., Tanno, F. K., Sandhu, H., Iyer, R., & Shah, N. (2014). Stability
assessment of hypromellose acetate succinate (HPMCAS) NF for application in hot melt
extrusion (HME). Carbohydrate polymers, 101, 146-153.
Uauy, R., & Dangour, A.D. (2006). Nutrition in brain development and aging: role of
essential fatty acids. Nutrition Reviews, 64(5), 524–533.
Vongsvivut, J., Heraud, P., Zhang, W., Kralovec, J. A., McNaughton, D., & Barrow, C. J.
(2012). Quantitative determination of fatty acid compositions in micro-encapsulated fish-oil
supplements using Fourier transform infrared (FTIR) spectroscopy. Food Chemistry, 135(2),
603-609.
Williams, C., Birch, E.E., Emmett, P.M., & Northstone, K. (2001). Stereoacuity at age 3.5 y
in children born full-term is associated with prenatal and postnatal dietary factors: a report
from a population–based cohort study. The American Journal of Clinical Nutrition, 73(2),
316-322.
203
Chapter 7
General Discussion
Growth and development are absolutely dependent on an adequate supply of energy and
nutrients which are sufficient to match the variable needs of the infant as growth progresses,
with any limitation in nutrient supply likely to constrain the pace and pattern of development
(Scientific Advisory Committee on Nutrition, 2011). Observational studies have raised a
cause for concern over later health consequences implicated by deficient or excessive nutrient
intake during infancy (Caroli, et al., 2012). Pregnancy, lactation and infancy are specific
times in life when essential nutrients are indispensable and where most requirements are
different to any other life stages in relation to supporting rapid growth and development
(Bryhn, 2006). Feeding surveys show that an increasing number of mothers feed their infants
with industrially processed commercial infant foods and in recent years the baby food market
and the range of products has grown significantly (Pandelova, et al., 2012).
There is currently no clear and complete analytical nutritional data available for ready to feed
complementary infant foods in the UK. The nutritional database in the UK, McCance and
Widdowson contains limited data on the composition of complementary infant foods, in
addition the analytical techniques and nutrient data contained within the databases may now
be outdated. Furthermore the European Food Safety Authority has highlighted that nutrient
intake data after 6 months of age is insufficient in European countries (Caroli, et al., 2012).
Therefore as commercial weaning foods are increasingly being incorporated into an infant
diet and nutritional databases lack nutrient content for these particular products, their
nutritional adequacy for the rapidly developing infant needs to be assessed. Furthermore the
effect of processing on nutrients in these foods also requires attention.
The aims were to evaluate the nutritional suitability of infant food products currently
available on the UK market, according to the most up to date recommendations and recent
relevant legislation and to explore the microencapsulation of essential fatty acids to optimise
the nutrient content of ‘ready-to-feed’ infant food products.
204
New protocols were developed for the quantitative analysis of certain key nutrients including
essential fatty acids, fat soluble vitamins (A, D and E) and essential elements (Ca, Cu, Fe, K,
Mg, Na, P and Zn) in commercially prepared infant foods in the UK and estimated daily
intakes based on consumption of these products were compared against current dietary
recommendations for infants. The Ca:P ratio was also determined in a range of commercially
prepared infant foods currently sold in the UK and compared to recommendations in relation
to bone health. In addition the effects of commonly practiced re-heating treatments used by
parents on essential fatty acids in manufactured infant formula milks were examined. Finally
microencapsulation of essential fatty acids was explored in order to improve the nutritional
quality of infant food products. The key highlights of each of the analysis (Chapters 3, 4, 5
and 6) are summarised below.
7.1 Highlights of the essential fatty acid analysis (Chapter 3)
The results of the analysis of essential fatty acids indicate that an infant’s diet based on the
standardized menu, composed of daily consumption of commercial ‘ready-to-feed’ infant
foods and formula milk products does not meet recommendations for LCPUFA (DHA and
AA). This provides opportunities and scope for product optimization to improve the nutritive
value of commercial infant food products in relation to LCPUFA. DHA may be of more
importance due to the differences in conversion as further steps are required for the biological
synthesis of DHA, in addition the higher concentrations of LA (precursor of AA) were
observed in the infants diet, therefore this may lead to higher concentrations of AA being
formed in the body.
With respect to the precursor essential fatty acids (LA and ALA), the estimated total daily
intake of LA was found to be higher than the recommendations, whereas the ALA total daily
intake was found to be lower than recommendations set by the US; which increases the
LA:ALA ratio. This increase may have some effect on allergy development; however, due to
insufficient conversion of the essential fatty acid precursors (LA and ALA) to LCPUFA in
infants it may not have a significant effect.
Furthermore the major contributor of essential fatty acids in the infant’s diet has been
identified as infant formula milk. This highlights an important issue in relation to situations
where consumption of formula milk is comprised. In addition, the study highlights that the
impact of commonly practiced re-heating treatments used by parents for the preparation of
infant formula milks introduces significant changes in certain fatty acids (LA and ALA), and
205
therefore future assessment of the oxidation products following these methods of preparation
is suggested.
Finally, in relation to the transparency of the nutritional information declared on the labels by
the manufacturers, infant formula milks were all within the limits of EU regulations although
there was a degree of significant variation between the quantitative values analyzed in this
study and the declared values on the labels. It is also important to be aware that only certain
brands of UK infant formulas add LCPUFA. This is important as conversion from essential
fatty acid precursors (ALA and LA) to LCPUFA in infants are thought to be insufficient so
they are required in their pre-formed sources to meet the requirements of the infant.
Therefore parents need to be aware that if the formula that their infant receives does not
fortify with LCPUFA the infant will need to receive adequate amounts of pre-formed sources
from the foods that they consume, which have been observed to be low from commercial
complementary infant foods tested in this study. This may lead to complementary infant
foods needing to be fortified with LCPUFA, especially DHA to meet infant’s
recommendations for optimal development.
7.2 Highlights of the vitamin A and E analysis (Chapter 4)
The concentration of vitamin A (retinyl acetate, retinyl palmitate and β-carotene) and E (α
and γ-tocopherol) in commercial ‘ready to feed; infant foods was quantitatively determined
by HPLC. The estimated total daily intake of vitamin A converted into RE from the
consumption of a combination of commercial ‘ready to feed’ infant foods and infant formula,
based on the standardised menu approach, was found to be in excess of the upper intake
levels set for infants of 900 μg RE/day. It is worth mentioning here that contribution of
vitamin A from infant formula alone was found to be 396 μg RE which exceeds the RNI of
350 μg RE for infant’s aged 7-12 months by 13%. The remaining vitamin A content of the
diet was mainly from carotenoids (β-carotene and total carotenoids) which are considered to
be less harmful. However further studies into the bioavailability of the different forms of
vitamin A in infants and the effect of excess intake is necessary. Pre-formed vitamin A food
sources contributed 58.3% of the RNI, therefore if the contribution from milk intake is
reduced, deficiency may become an issue and parents should be aware of the impact that the
reduction in fortified infant formula use may have on the nutritional composition of an
infant’s diet.
206
The total daily intake of vitamin E based upon a diet consisting of complementary ready to
feed infant foods and infant formula provided a vitamin E intake of 10.4 mg/day of α-TE,
which is higher than the recommended adequate intakes of 5 mg/day α-tocopherol set by the
US. However 81% of vitamin E was provided from infant formula with a minor contribution
from infant food products, which may become a concern when milk intake is compromised or
reduced as it is after the first year of life.
7.3 Highlights of the essential elemental and vitamin D analysis (Chapter 5)
This primary study investigated the ratio of Ca:P in conjunction with vitamin D and other
essential elements (Cu, Fe, K, Mg, Na, Zn) in a range of commercial infant food products in
the UK. In addition, as this study is the first to include consumption of infant snack products,
the level of total calorie intake is also calculated in order to assess total daily energy intake in
relation to obesity.
The Ca:P ratio of the infant’s diet based on the standard feeding regime used in this study
equates to 1.49:1, which is within the recommended range of 1.1 – 2:1 recommended by
ESPGHAN. However the actual daily intakes of calcium and phosphorus were 176% and
155% above the RNI respectively. The implication of excess intake of micronutrients
warrants further investigation for long term health effects.
This investigation is the first to our knowledge to include infant snack products. However
when the snack products were removed from the total daily intake the majority of essential
elemental intakes met recommendations, indicating that parents need to select snack options
which do not exceed requirements.
The total dietary intake of vitamin D3 was determined to be 9.61 μg/day, which is 137%
above the RNI. However 120% is contributed from fortified infant formula. As weaning
foods are typically low in vitamin D unless they are fortified and breast milk concentrations
are typically low, vitamin D deficiency may arise when infant formula consumption is
reduced, which is the case after the first year of life.
Finally the estimated total energy intake, from consumption of the products tested herein, is
estimated to contribute to a high calorie intake with a possible impact on obesity.
207
7.4 Highlights of the microencapsulation of fish oil (Chapter 6)
A directly spray dried fish oil technique has proven beneficial as a production method over a
spray dried nano-emulsion of encapsulated fish oil. The encapsulated powders produced by
the desired method offer a source of DHA that has the potential to be incorporated into infant
foods to increase their dietary DHA consumption, which at this time is not meeting dietary
recommendations as indicated in Chapter 3. Further work into the storage stability and the
effects of the incorporation of the encapsulated powder into the food product are required.
The use of the encapsulated powder produced would offer protection against degradation as
well as masking the odour and taste to offer palatability of the product.
7.5 Implications of the research
Over recent decades the modern lifestyle dynamic has led to an increased parental reliance on
commercially marketed complementary infant foods in the UK, which has been highlighted
by the Diet and Nutrition Survey of Infants and Young Children. The current nutritional
labelling formats for ready to eat complementary foods are a duplicate of the legislative
requirements for manufacturing ready meals intended for the general population, the
implication of this is that a number of important nutrients maybe limiting or excessive, which
will affect their nutritional quality and suitability as an infant food. Furthermore nutritional
databases, such as McCance and Widdowson provide limited data on the composition of
these types of food products. The European Food Safety Authority has highlighted that
nutrient intake data after six months of life is currently inadequate and insufficient and
urgently needs to be addressed.
The nutritional evaluation of commercial infant foods undertaken herein has highlighted that
these food products are not nutrient dense and that the main dietary contributor is the fortified
infant formula. In situations where infant formula is reduced or compromised, these types of
food products are unlikely to meet an infant’s dietary requirements. This provides
opportunities and scope for product optimisation to improve the nutritive value of infant food
products. Furthermore it would be beneficial if commercially marketed infant foods provided
nutritional information of micronutrients on the labelling of products to enable parents to be
able to make informed choices about the foods they feed their infants. Food manufacturers
may believe that this would be detrimental to profits. However providing food products that
are nutrient dense may actually act as a selling point and be beneficial for sales. Due to
infants having a small gastric capacity, it is essential that they are receiving nutrient dense
208
foods during the weaning stage to satisfy dietary requirements for optimal growth and
development and prevent poor health in later life.
7.5 References
Bryhn, Morten (2006). Polyunsaturated fatty acids in infant nutrition. Pronova Biocare,
EPAX AS.
Caroli, M., Mele, R. M., Tomaselli, M. A., Cammisa, M., Longo, F., & Attolini, E., (2012).
Complementary feeding patterns in Europe with a special focus on Italy. Nutrition,
Metabolism and Cardiovascular Disease, 22(10), 813-8.
Committee on Toxicity (2003). COT statement on metals in infant food. COT statement
2003/02. Available at: http://cot.food.gov.uk.
Pandelova, M., Lopez, W. L., Michalke, B., & Schramm, K. W. (2012). Ca, Cd, Cu, Fe, Hg,
Mn, Ni, Pb, Se, and Zn contents in baby foods from the EU market: Comparison of assessed
infant intakes with the present safety limits for minerals and trace elements. Journal of Food
Composition and Analysis, 27(2), 120-127.
Scientific Advisory Committee on Nutrition (2011). SACN Early Life Nutrition Report.
SACN: reports and positions statements, Public Health England.
209
Chapter 8
Overall conclusions and future work
The diet and nutrition survey of infants and young children highlights that at least 75% of
boys over 7 months and 78% of girls are above the 50th
percentile for weight compared
against the UK WHO growth standards, which may in part be due to the overconsumption of
macronutrients such as calories, fats and carbohydrates (Department of Health, 2013).
However overconsumption of food does not necessarily mean that the diet is providing
excess micronutrients (vitamins and minerals). Infant foods need to be micronutrient rich and
nutrient dense (amount of nutrient/100 kcal of food) in order for the food to be of a high
nutritional quality. Therefore infant foods must provide substantial amounts of micronutrients
with relatively fewer calories; in comparison to empty calorie foods where micronutrient
levels are low and could potentially lead to deficiencies of certain micronutrients. High
nutritional quality products are necessary to provide the infant with the appropriate levels of
macro and micronutrients for optimal development.
The study conducted so far indicates that total daily intakes of vitamin A and E exceed
recommendations. It is, however, important to note that fortified infant formulas were found
to be the major contributor. The aforementioned highlights the importance of nutrient dense
foods in situations where consumption of infant formula/breast milk is reduced or
compromised. On the other hand, over consumption of certain nutrients, including vitamin A
and E, during the first year of life should also be an issue for concern, as currently there is not
enough attention paid to the impact of over intake of these particular nutrients following
consumption of fortified formula.
The investigation into the essential elemental content of dairy based commercial infant food
products also highlighted that total daily intakes exceed recommendations. This investigation
is the first to our knowledge to include infant snack products. However, when the snack
products were removed from the total daily intake the majority of intakes met
recommendations. In addition the calorie contribution from these products also exceeded
recommendations, indicating that parents need to select snack options which do not exceed
requirements, as this may have implications for obesity. Similarly vitamin D intakes
exceeded recommendations and infant formula was identified as the main contributor, which
may lead to deficiency issues when infant formula is reduced or compromised. According to
210
the results from the most recent National Diet and Nutrition Survey there is evidence for an
increased risk of vitamin D deficiency in all age and sex groups. In addition to 27% of
preschool children aged between 1.5-3 years mean dietary intakes of vitamin D being below
the RNI (Public Health England, 2014).
The essential fatty acid content of the infant’s diet highlighted that pre-formed LCPUFA
DHA and AA are below recommendations set by the US. DHA and AA are important for
visual and brain development with numerous other potential health advantages being
suggested. DHA may be of more significance as the metabolism of fatty acids requires
further steps in the endogenous conversion to DHA in comparison to AA. In addition the high
intake of LA in the diet means that AA may be produced endogenously within the body from
its precursor (LA). Therefore the microencapsulation of fish oil was explored as a potential
source of DHA that could be added to complementary infant foods to improve their
nutritional quality.
There is scope for further investigations into the following areas:
8.1 Future work in relation to the current infant food market
a) Assessment of oxidation products and isomers of fatty acids after i) home processing
methods used by parents to re-heat infant formula and ‘ready to feed’ infant foods, ii)
industrial processing methods for the production of infant formula and ‘ready to feed’ infant
foods. This information would be useful for future product development to implement the
least detrimental conditions during production.
b) Investigate the effects of heating on other heat sensitive nutrients such as vitamin C,
thiamine (B1), pantothenic acid (B5), pyridoxine (B6) and folate (B9) in infant foods.
c) Nutritional assessment of commercial ‘ready to feed’ infant food products and infant
formula milk over the shelf life duration.
d) Complete assessment of non-mandatory labelled nutrients in a wide range of infant food
products, including infant breakfast, snack and meal products.
e) Future studies are warranted with focus on the bioavailability of excess nutrient intakes in
infants.
211
8.2 Future work in relation to new product development
a) Dissolution profiles of the pH dependent release of DHA from the microencapsulated fish
oil.
b) Assessment of the stability of DHA in the microencapsulated fish oil over typical shelf life
duration and conditions.
b) Analysis of the microencapsulated fish oil incorporated into an infant food product, i)
influence on other nutrients within the food matrix, ii) effects of food processing on the DHA
content and iii) stability of DHA within the food product during shelf life.
d) Analysis of the oxidation products produced during degradation of DHA from the
microencapsulated fish oil.
e) Investigation into the types of packaging, optimal processing and storage conditions of a
food product fortified with the microencapsulated fish oil.
f) Assessment of the nutritional profile of the microencapsulated fish oil.
g) Examine the issue of palatability and the organoleptic properties of the fortified infant food
product.
g) Assess the bioavailability of DHA after ingestion of a food product fortified with the
microencapsulated fish oil.
h) Future work into the production of new infant food products, including selection of
ingredients, processing conditions and packaging. To offer an infant food that is nutritionally
superior.
8.3 References
Department of Health (2013). Diet and nutrition survey of infants and young children, 2011.
FSA & Public Health England: England.
Public Health England (2014). National Diet and Nutrition Survey. Results from Years 1, 2, 3
and 4 (combined) of the Rolling Programme (2008/2009 – 2011/2012). Food Standards
Agency. Available at: https://www.gov.uk.
212
Addendum
Conferences/ Seminars
1. Nutrition and Nurture in Infancy and Childhood Conference, 10-13 June 2013. The
impact of early infant feeding on the development of atopic disease (Grange over Sands, UK)
2. Faculty Research Symposium, 13 June 2013. The impact of early infant feeding on the
development of atopic disease (UoG, Medway Campus).
3. 3rd
International Conference and Exhibition on Food Processing and Technology, 21-
23 July 2014. Determination of essential polyunsaturated fatty acids in complementary infant
foods in the UK by RP-HPLC-CAD (Las Vegas, USA).
4. 3rd
International Conference and Exhibition on Food Processing and Technology, 21-
23 July 2014. Impact of heating on fatty acid content of UK infant formula milk products by
HPLC-CAD (Las Vegas, USA).
5. Research Seminars, 18 March 2015. Fatty acid content of complementary infant foods in
the UK and the impact of re-heating on the fatty acid content of infant formula using HPLC-
CAD – A novel approach (UoG, Medway Campus).
6. 5th
Euro-Global Summit and Expo on Food and Beverages, 16-18 June 2015.
Improving DHA content of infant foods in the UK (Alicante, Spain).
7. Faculty Research Symposium, 16 June 2015. Microencapsulation of docosahexaenoic
acid (DHA) for the potential use in ready to feed infant foods (UoG, Medway Campus).
Research Publications/Manuscripts
1. Loughrill, E., & Zand, N. (2016). An investigation into the fatty acid content of selected
fish-based commercial infant foods in the UK and the impact of commonly practiced re-
heating treatments used by parents for the preparation of infant formula milks. Food
Chemistry, 197, 783-789.
213
2. Emma Loughrill, Pesila Govinden and Nazanin Zand (2016). Vitamin A and E content of
commercial infant foods in the UK: a cause for concern? Food Chemistry (In Press; accepted
for publication, FOODCHEM-D-15-01457).
3. Emma Loughrill and Nazanin Zand (2016). Calcium to Phosphorus ratio and vitamin D
content of infant foods in the UK: possible implications for bone health. British Journal of
Nutrition (Under review, BJN-RA-15-0822).
4. Emma Loughrill, Sharon Thompson, Dennis Douromis, Samuel Owusu-Ware, Martin J.
Snowden and Nazanin Zand (2016). Microencapsulation of docosahexaenoic acid (DHA) for
the potential use in ready to feed infant foods. Food Research International (Submitted,
FOODRES-D-15-02694).
Book Chapters/Review Articles
1. Miguel de la Guardia and Salvador Garrigues (2015). Handbook of Mineral Elements in
Food. John Wiley and Sons.
2. Emma Loughrill, Laurence Harbige, Babur Z. Chowdhry and Nazanin Zand (2016).
Dietary and Nutritional Factors in the Development of Allergy in Infants and Children.
Comprehensive Reviews in Food Science and Food Safety (to be submitted).