Embed Size (px)
Citation preview
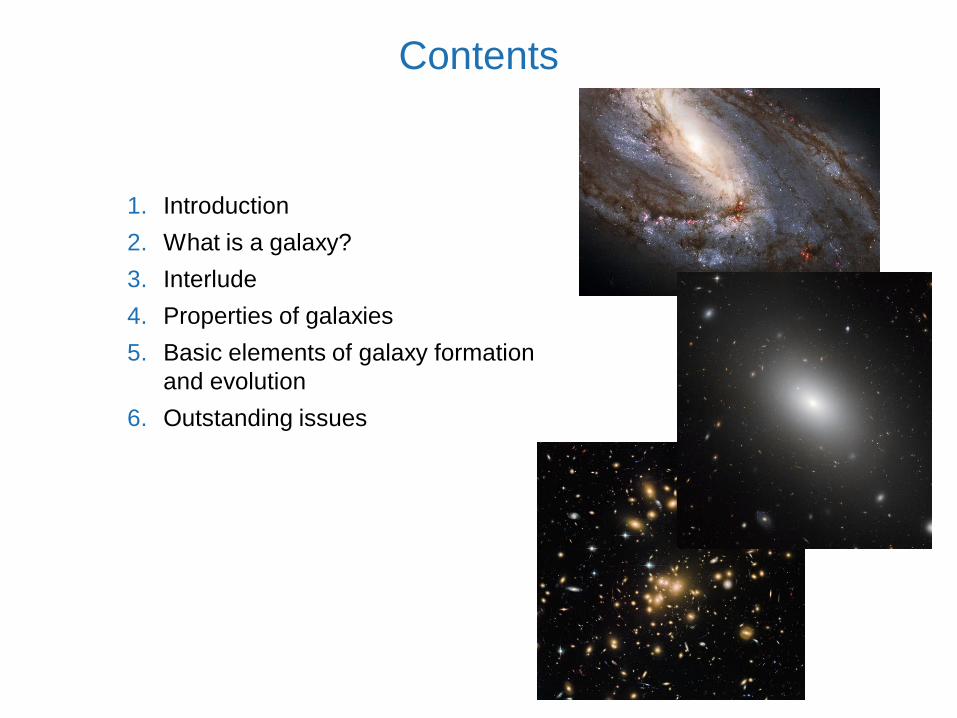
1. Introduction
2. What is a galaxy?
3. Interlude
4. Properties of galaxies
5. Basic elements of galaxy formation
and evolution
6. Outstanding issues
Contents

A galaxy is a gravitationally bound system of millions to billions of
stars of ~kpc size ( Not a precise definition!)
A galaxy’s size is a few 100 times smaller than the mean separation
between galaxies
The density of stars inside a galaxy is ~107 larger than the global
average density
In this sense, galaxies are well-defined entities
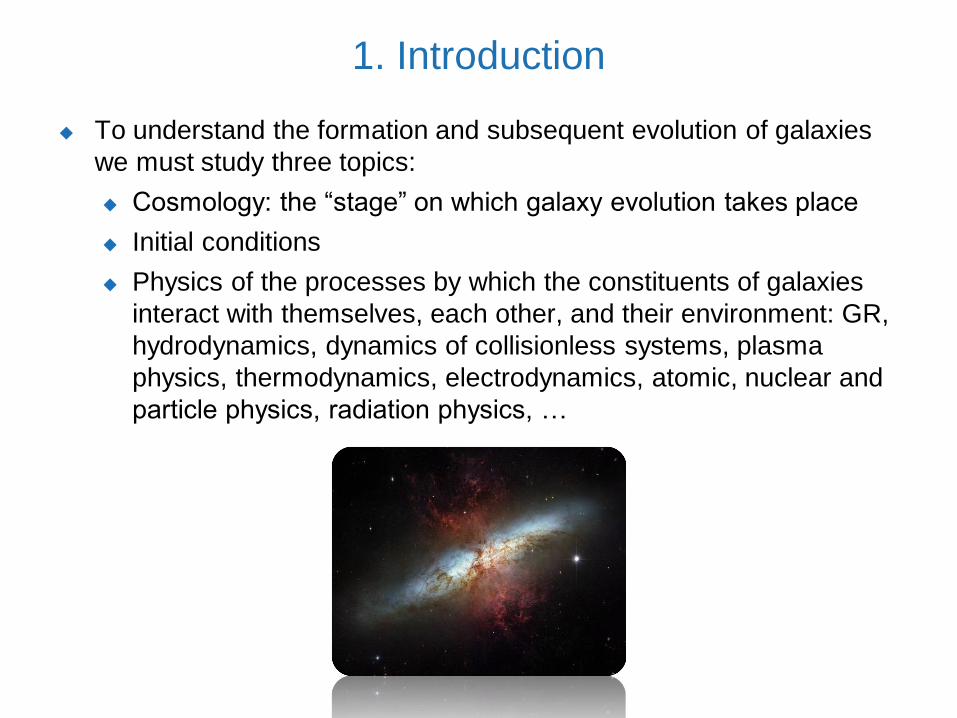
1. Introduction

To understand the formation and subsequent evolution of galaxies
we must study three topics:
Cosmology: the “stage” on which galaxy evolution takes place
1. Introduction

To understand the formation and subsequent evolution of galaxies
we must study three topics:
Cosmology: the “stage” on which galaxy evolution takes place
Initial conditions
1. Introduction
To understand the formation and subsequent evolution of galaxies
we must study three topics:
Cosmology: the “stage” on which galaxy evolution takes place
Initial conditions
Physics of the processes by which the constituents of galaxies
interact with themselves, each other, and their environment: GR,
hydrodynamics, dynamics of collisionless systems, plasma
physics, thermodynamics, electrodynamics, atomic, nuclear and
particle physics, radiation physics, …
1. Introduction

Galaxy constituents
Dark matter
Stars and star clusters
Gas
Dust
Central supermassive BH
Circumgalactic matter
1. Introduction
Physical processes
Gravitational collapse
Gas hydrodynamics
Star formation
Stellar evolution
Feedback
Interaction with the environment
…
Complexity both in terms of description and modeling!

In addition, galaxy formation and evolution is not well localised in the
parameter space of physical quantities
The physical processes involved cover many orders of magnitude in
size, time, mass, etc.
Huge complexity and very rich phenomenology
“Applied” science, requiring the synthesis of many branches of
astrophysics, no fundamental theory
Requires a multi-layered approach and a multitude of methods
1. Introduction

1. Introduction
Statistical investigations
of large samples
(surveys)
ObservationsImaging and spectroscopy at all wavelengths
Detailed studies of
small samples
TheoryAnalytical, semi-analytical, numerical
Statistical power, completeness
Level of detail

Timescales involved are too long to be able to directly observe
galaxy evolution
Forced to rely on the “lookback effect”: we can infer evolution only in
a statistical sense by comparing samples of galaxies at different
epochs (i.e. distances)
Adds yet another layer of complexity (selection effects)
1. Introduction

Technologically challenging on all fronts!
We require:
Large telescopes, both earth-bound
and space-based, employing
very different technologies at
different wavelengths
Different types of telescopes
Diverse, complex instrumentation
Massive computing power
1. Introduction

Finally, in the face of all of this complexity, we have to make do with
“observations” (as opposed to “experiments”)
The problem of how galaxies form and evolve is by no means
“solved”
We do not even have a complete picture of the phenomenology yet!
Things are still being discovered!
Galaxy formation and evolution is a rapidly evolving research field
Huge literature
1. Introduction


Galaxy evolution

Finally, in the face of all of this complexity, we have to make do with
“observations” (as opposed to “experiments”)
The problem of how galaxies form and evolve is by no means
“solved”
We do not even have a complete picture of the phenomenology yet!
Things are still being discovered!
Galaxy formation and evolution is a rapidly evolving research field
Huge literature
Here: only a very broad-brush overview
1. Introduction

Stars
Dominate the optical
appearance of galaxies
Dominant baryonic mass
component for large galaxies
Different types of stars based
on their luminosity, effective
temperature and evolutionary
stage
Usually cannot resolve
individual stars
Only observe combined light of
total stellar population
Usually dominated by the
youngest, most massive stars
(L M3.5 – 4 )
2.1 Galaxy constituents

Gas
Between 0 and ~50% of the
baryonic mass, depending on
galaxy type
Composition:
• ~90% H (~70% by mass)
• ~10% He (~30% by mass)
• < 1% metals
Usually in different phases (n, p, T)
• Atomic (neutral & ionised)
• Molecular
2.1 Galaxy constituents

Dust
Abundance strong function of galaxy type
Always irrelevant in terms of mass
But: absorbs, scatters and reddens stellar light
Strong impact on optical appearance of galaxy
2.1 Galaxy constituents
Reddening by dust usually
degenerate with stellar
population properties (age
and metallicity)
Re-radiates absorbed energy
in IR

2.1 Galaxy constituents
Central supermassive black hole (SMBH)
Present in most bright galaxies
Completely irrelevant in terms of mass
Relevance of central SMBH
for galaxy evolution
established by observational
correlations of SMBH mass
with host galaxy properties
Unclear how central SMBH
influences its host galaxy

Dark matter
Dominates (~90%) the total mass of a galaxy
Interacts at most weakly with itself and baryonic matter
Presence inferred from rotation curves and stellar
velocity dispersions
Collisionless
Mostly “cold” CDM
2.1 Galaxy constituents
No direct or indirect
detection
Physical nature unclear

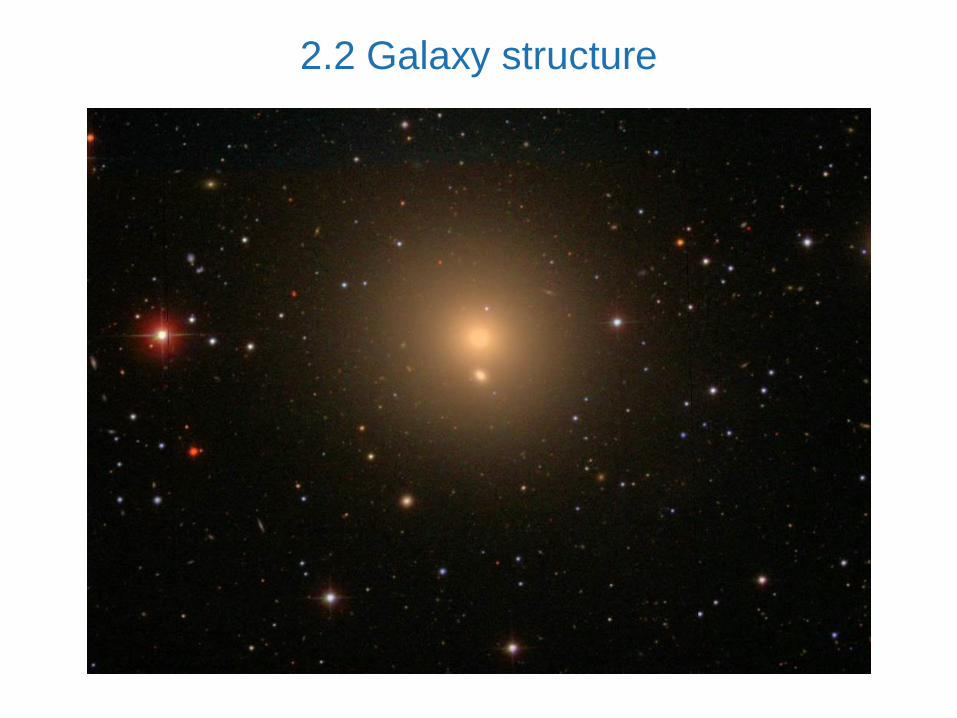
2.2 Galaxy structure
Major structural components (of bright galaxies)
Disk
• Rotationally supported
• Bar
• Spiral arms
Bulge (spheroid)
• Supported by random
motions
Stellar halo
DM halo
No bulge pure disk galaxy
No disk elliptical or
spheroidal galaxy

2.2 Galaxy structure

2.2 Galaxy structure

2.2 Galaxy structure

2.2 Galaxy structure
2.2 Galaxy structure

2.2 Galaxy structure

2.2 Galaxy structure

The diversity of galaxies means that a number of parameters are
required to describe a given galaxy adequately (unlike, e.g., main
sequence stars). The most important are:
Morphology, structure
Luminosity, stellar mass
Most basic, integral property of stellar population
Colour, additional characteristics of stellar population
“Age” or better: star formation history, metallicity, initial mass
function
Size, surface brightness
Cold gas mass, distribution
Dust mass, extinction curve, distribution
Nuclear activity
Environment
Distance, epoch
2.3 Main parameters
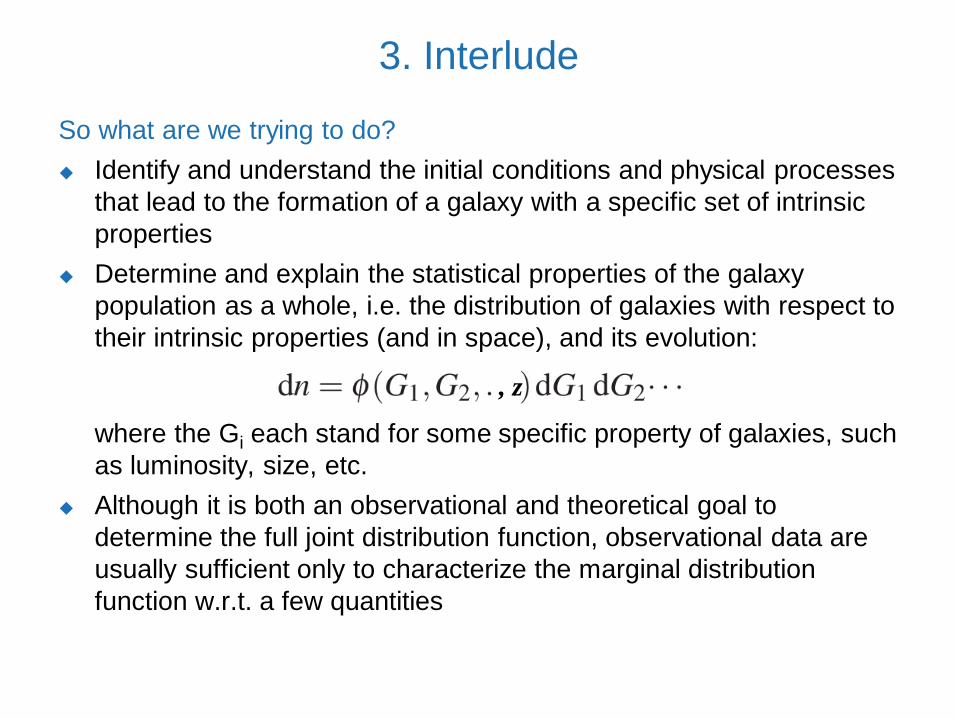
So what are we trying to do?
Identify and understand the initial conditions and physical processes
that lead to the formation of a galaxy with a specific set of intrinsic
properties
Determine and explain the statistical properties of the galaxy
population as a whole, i.e. the distribution of galaxies with respect to
their intrinsic properties (and in space), and its evolution:
where the Gi each stand for some specific property of galaxies, such
as luminosity, size, etc.
Although it is both an observational and theoretical goal to
determine the full joint distribution function, observational data are
usually sufficient only to characterize the marginal distribution
function w.r.t. a few quantities
3. Interlude
, z

The rise of redshift surveys

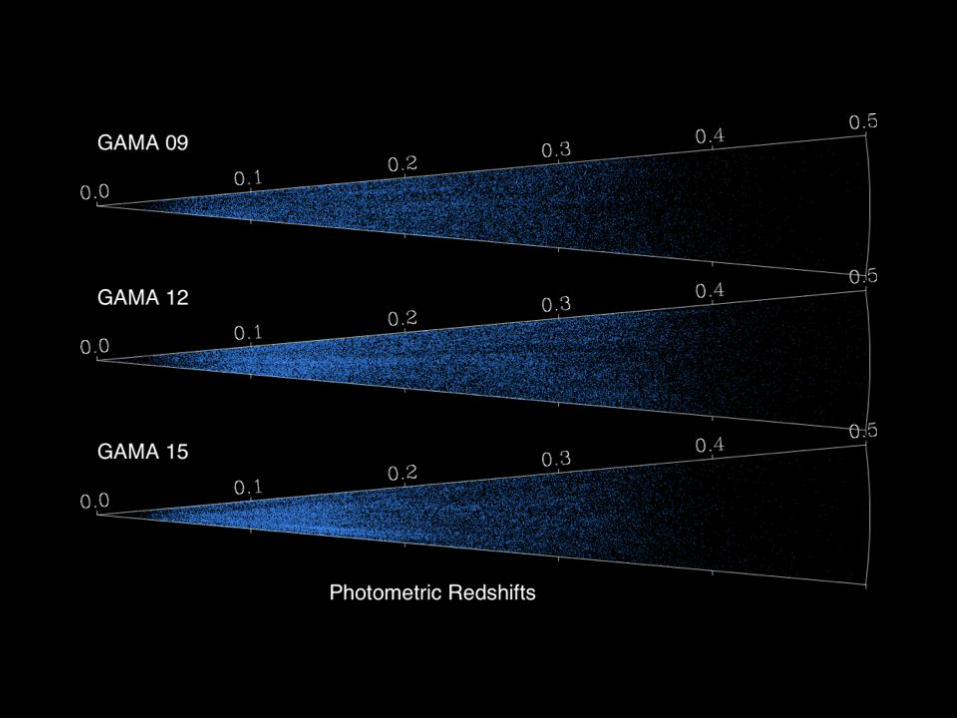

The rise of redshift surveys


Cosmology vs Galaxy Evolution surveys
• Galaxies as tracers of the mass distribution
• Volume!• Stand-alone
• High fidelity• Smaller regions• Completeness!• Multi- overlap
1. Introduction
2. What is a galaxy?
3. Interlude
4. Properties of galaxies
5. Basic elements of galaxy formation
and evolution
6. Outstanding issues
Contents

Average number of galaxies
per unit flux and unit area on
the sky
Galaxies are readily
observable in huge numbers
Depends on wavelength
Despite its simplicity, this
plot provides two important
insights:
The Universe is not
Euclidean
The galaxy population
evolves
4.1 Properties of galaxies: number counts

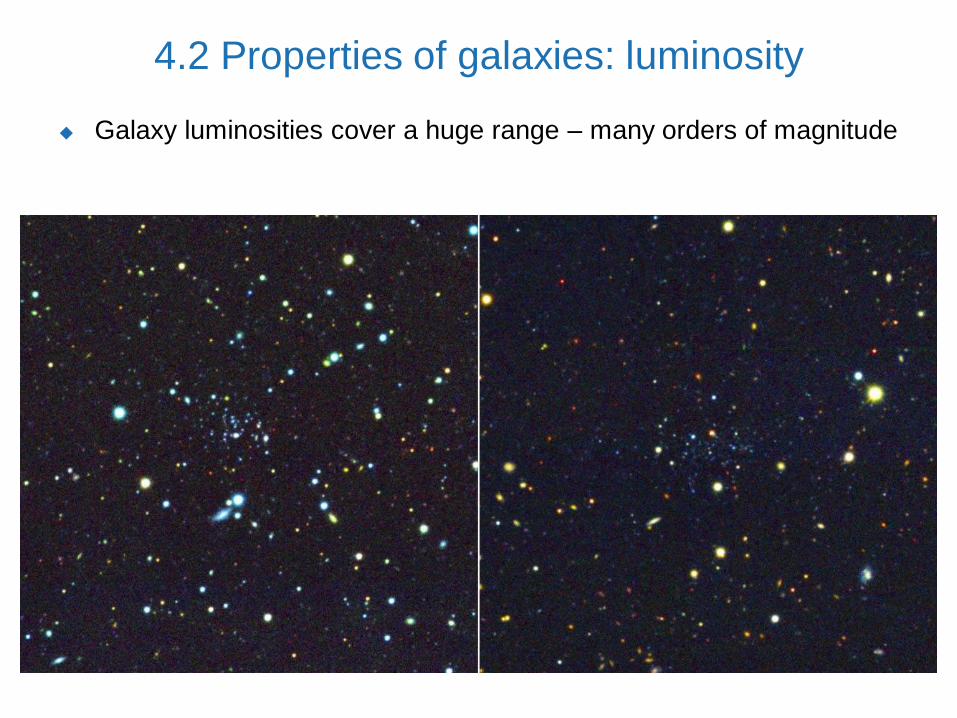
Galaxy luminosities cover a huge range – many orders of magnitude
4.2 Properties of galaxies: luminosity

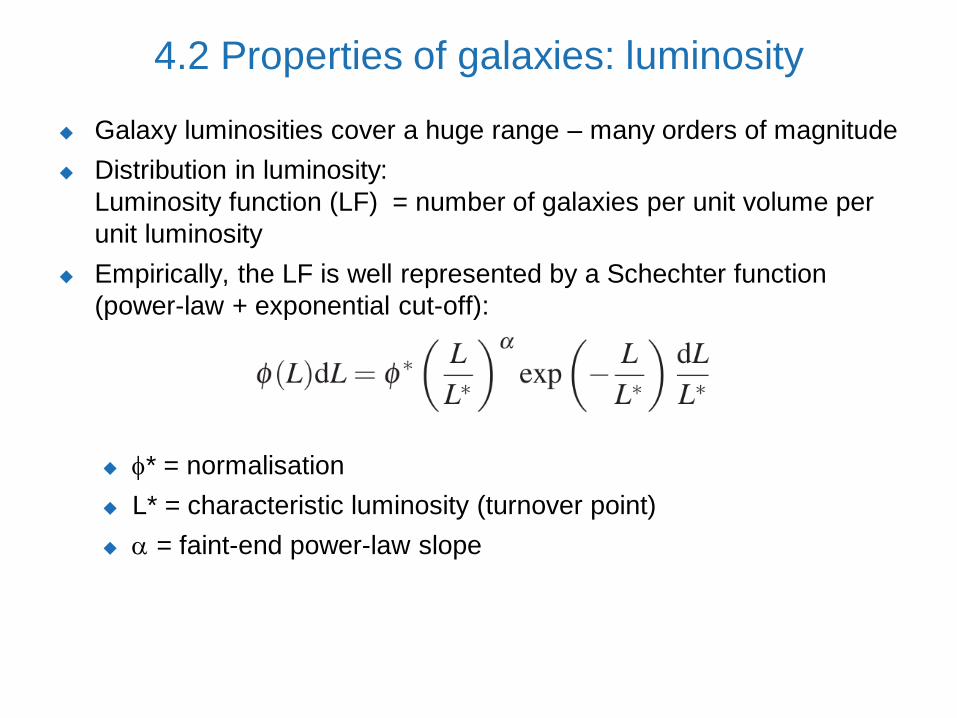
Galaxy luminosities cover a huge range – many orders of magnitude
4.2 Properties of galaxies: luminosity
Galaxy luminosities cover a huge range – many orders of magnitude
4.2 Properties of galaxies: luminosity
Galaxy luminosities cover a huge range – many orders of magnitude
Distribution in luminosity:
Luminosity function (LF) = number of galaxies per unit volume per
unit luminosity
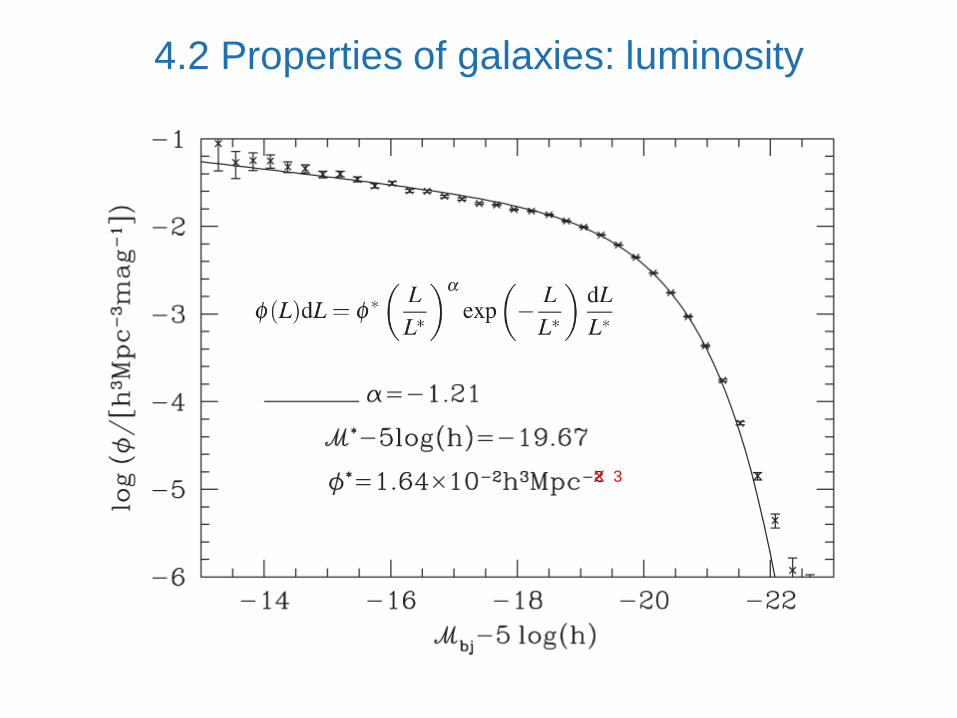
Empirically, the LF is well represented by a Schechter function
(power-law + exponential cut-off):
* = normalisation
L* = characteristic luminosity (turnover point)
= faint-end power-law slope
4.2 Properties of galaxies: luminosity
X 3
4.2 Properties of galaxies: luminosity

Volume effects for a flux-limited sample (flux limits are usually
imposed by available spectroscopic capability):
Few galaxies have L >> L* because they are rare
Few galaxies have L << L* because the volume over which they can
be seen is small
Most galaxies have L L*
Selection effects are ubiquitous in extragalactic astronomy!
4.2 Properties of galaxies: luminosity

The luminosity function varies as a function of:
Wavelength
Environment (cluster vs. field)
Redshift (evolution of the galaxy population)
Colour
Galaxy type
…
4.2 Properties of galaxies: luminosity
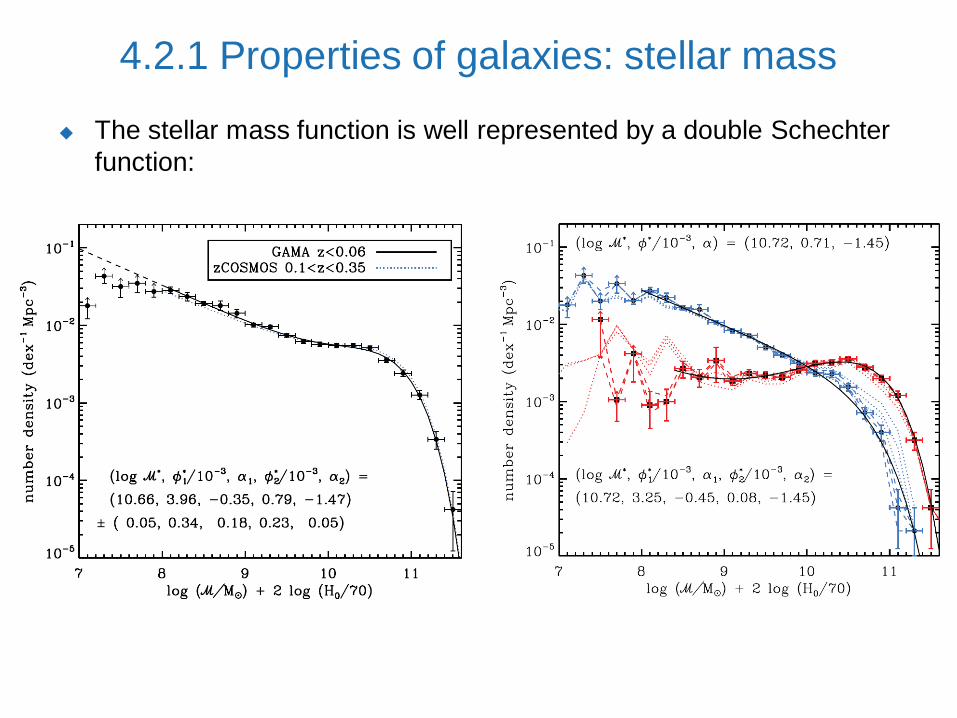
The stellar mass function is well represented by a double Schechter
function:
4.2.1 Properties of galaxies: stellar mass

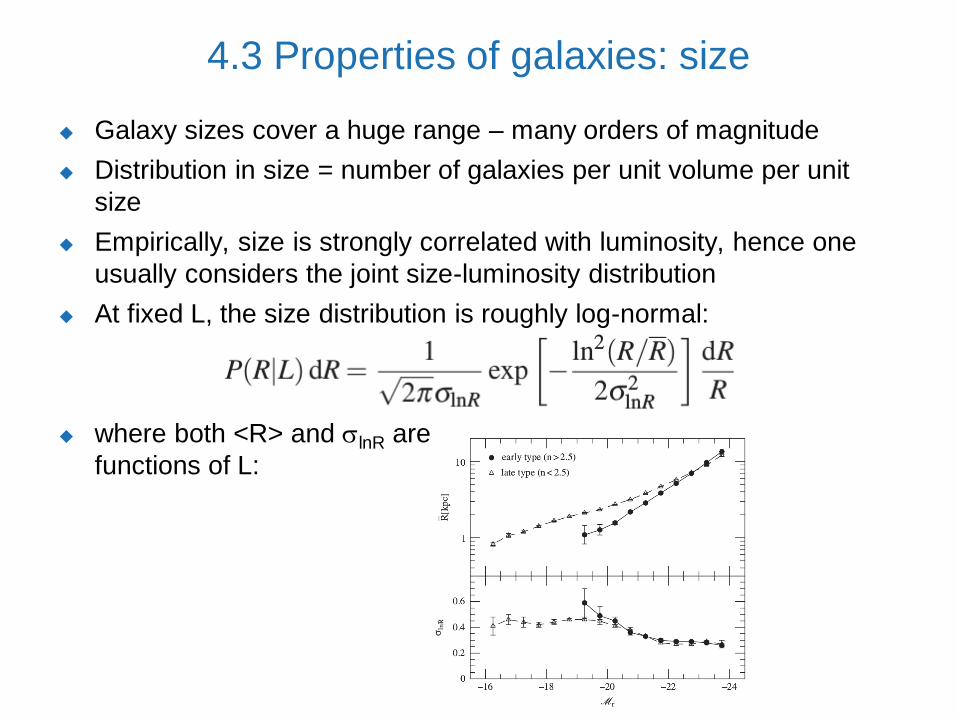
Galaxy sizes cover a huge range – many orders of magnitude
4.3 Properties of galaxies: size

Galaxy sizes cover a huge range – many orders of magnitude
4.3 Properties of galaxies: size
Galaxy sizes cover a huge range – many orders of magnitude
Distribution in size = number of galaxies per unit volume per unit
size
Empirically, size is strongly correlated with luminosity, hence one
usually considers the joint size-luminosity distribution
At fixed L, the size distribution is roughly log-normal:
where both <R> and lnR are
functions of L:
4.3 Properties of galaxies: size
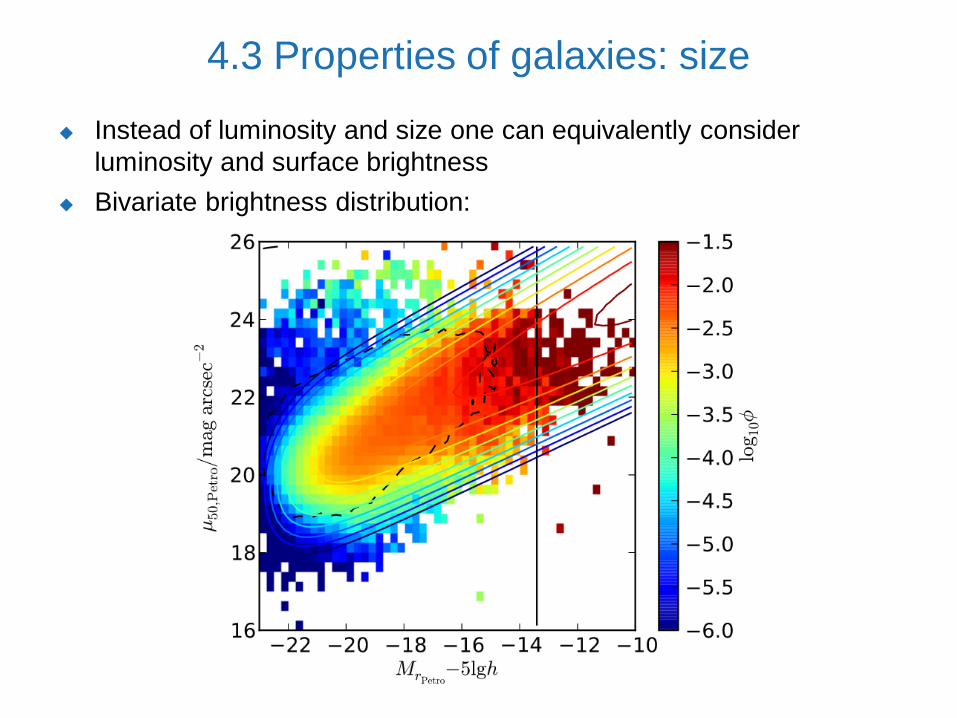
Instead of luminosity and size one can equivalently consider
luminosity and surface brightness
Bivariate brightness distribution:
4.3 Properties of galaxies: size

Size and surface brightness are also subject to selection effects:
4.3 Properties of galaxies: size

The term “morphology” refers to the visual appearance of galaxies in
astronomical images
Many galaxies display such striking morphologies that it seems self-
evident that morphology encodes important information about the
formation and evolution of galaxies
4.4 Properties of galaxies: morphology

The term “morphology” refers to the visual appearance of galaxies in
astronomical images
Many galaxies display such striking morphologies that it seems self-
evident that morphology encodes important information about the
formation and evolution of galaxies
Question: what aspects of morphology, exactly, contain relevant
information and how is this best extracted?
Different approaches:
Morphological classification
Surface brightness profiles
Non-parametric classification
4.4 Properties of galaxies: morphology

In the present-day Universe most bright galaxies display only a
restricted set of morphologies
In other words, these galaxies can be assigned to a finite set of
(more or less) well-defined morphological classes
Several such morphological classification systems have been
devised, most prominently:
Hubble system (Hubble’s tuning fork)
de Vaucouleurs system
4.4 Properties of galaxies: morphology


Hubble’s classification system
E and S0 often referred to as “early types”, S(B) as “late types”
Also: early and late-type spirals: S(B)a, S(B)c
Not meant to indicate an evolutionary sequence
Irr I
Irr II
4.4 Properties of galaxies: morphology

de Vaucouleur’s
classification system
(revised Hubble system)

de Vaucouleur’s classification system
Revision and extension of Hubble’s system
Refinement of Hubble’s stage (E-S0-S), and extension to Sd, Sm, Im
Change in nomenclature: S, SB SA, SB
Introduction of a third axis (in addition to stage and “barredness”):
normal or ring-like: (s) or (r)
Recognition that the boundaries between the “classes” along each of
the three axes are fuzzy explicit allowance for intermediate types
Examples:
SAB(r)c
SA(rs)ab
IBm
Caution: many workers in this field adopted the refinements and
extensions to the Hubble stage but ignored the rest
4.4 Properties of galaxies: morphology

Example
SB(s)bc

4.4 Properties of galaxies: morphology

4.4 Properties of galaxies: morphology

Apart from their physical characteristics, the visual appearance of
galaxies depends on a number of additional, observational
parameters:
Size relative to the size of a spatial resolution element of the
image
Brightness relative to the background
Noise level of the image
Projection effects
Wavelength
Furthermore, visual perception is subjective, i.e. it depends on the
observer, although experienced classifiers usually agree with each
other to within < ~1 Hubble type
Development of more quantitative measures of morphology
Also: breakdown of Hubble sequence at z 1 – 2
4.4 Properties of galaxies: morphology

The 2D surface brightness distributions of both spheroids and disks
are highly symmetric (although spiral arms and dust tend to reduce
the symmetry)
The 2D distribution can be reduced to a 1D surface brightness
“profile” by averaging the 2D distribution along elliptical isophotes
4.5 Properties of galaxies: SB profile

The 2D surface brightness distributions of both spheroids and disks
are highly symmetric (although spiral arms and dust tend to reduce
the symmetry)
The 2D distribution can be reduced to a 1D surface brightness
“profile” by averaging the 2D distribution along elliptical isophotes
The SB profiles of most spheroids and disks are well fit by the
Sérsic function:
I = surface brightness, [I] = flux / arcsec2
R = distance from galaxy centre along major axis, [R] = arcsec
Re = radius that enclose half of the total flux, size
I0 = central SB, Ie = I(Re)
n = Sérsic index, sets the concentration of the profile
n = 1: exponential profile
n = 4: de Vaucouleurs profile
n = bn = parameter that only depends on n
n = 0.5: Gaussian
4.5 Properties of galaxies: SB profile

4.5 Properties of galaxies: SB profile

Example of a two-component galaxy. The model is fit to the
2D SB distribution. Note that the model SB profile needs to
be convolved with the local PSF.
4.5 Properties of galaxies: SB profile

Stellar mass in spheroids stellar mass in disks
Photometric decomposition
component properties

Spheroids dominate at the very high-mass end, disks at the low-mass end
Photometric decomposition
component properties

SB profile fiiting assumes highly symmetric and smooth profiles
However, many features of galaxies do not fit this description:
Spiral arms
Dust lanes
(Dwarf) irregulars
Tidal features
Merging galaxies
Other features may invalidate the assumed (double) Sérsic model:
Nuclear components
Bars
Disk truncation or flaring
Isophotal twisting
When fitting a model with many degrees of freedom to data that are
not in fact represented by the model “unphysical” results
(e.g. bulge larger than disk)
4.5 Properties of galaxies: SB profile

These are methods of quantifying morphological characteristics in a
model-independent way directly from the pixel data
Examples:
Concentration, Asymmetry, clumpinesS (CAS)
Gini coefficient and M20
Multi-mode, Intensity, Distance (MID)
Decomposition using a set of eigenfunctions (e.g. shaplets)
Machine Learning Algorithms (e.g. Artificial Neural Networks,
Random Forests, Naïve Bayes, Support Vector Machines, …)
Possibly combined with Principal Component Analysis (PCA)
Sounds simple in some cases, but details matter
Particularly suited to high redshift galaxies which are largely
irregular
4.6 Properties of galaxies:
non-parametric methods

Always difficult to compare different morphological datasets
Difficult to quantify evolution of morphology
Nearby galaxies Same galaxies artificially redshifted
4.4 – 6 Properties of galaxies: morphology

More massive stars emit a larger fraction of their light at shorter
wavelengths than lower mass stars (Teff M3/8)
More massive stars live shorter than lower mass stars (t M-2)
The colour of a galaxy (i.e. of the integrated light of its stellar
population) carries information about its star-formation history
Colour = relative luminosity in two bands = crudest but easiest-to-
obtain additional information about stellar population beyond its total
luminosity in one band
But: colour also depends on metallicity and dust
4.7 Properties of galaxies: colour

The colour distribution of galaxies is bimodal
At lowest order, this reflects the distinction between spheroidals
and disks
But this distinction is not “clean”: disks can be red (dust) and
spheroids can be blue
The colour-magnitude distribution shows overlapping red and blue
sequences
Within each sequence, brighter
galaxies are redder
Age, metallicity or dust effects
with luminosity (mass)?
4.7 Properties of galaxies: colour

At typical temperatures in the interstellar medium (ISM), HI is mostly
in ground state (unless it‘s excited)
No emission in the optical
However, HI can be observed in the radio regime:
21 cm line = transition between hyperfine structure levels of HI
ground state
ΔE 6×10⁻⁶ eV ν = 1420 MHz, λ = 21.106 cm
4.8 Properties of galaxies: cold gas (HI) mass

“Blind” 21 cm surveys can be used to measure HI masses for large
numbers of galaxies HI mass function:
4.8 Properties of galaxies: cold gas (HI) mass

Irrelevant in terms of mass
Strong influence on optical appearance of galaxies through
Extinction
Reddening
4.9 Properties of galaxies: dust

Irrelevant in terms of mass
Strong influence on optical appearance of galaxies through
Extinction
Reddening
No simple spectral lines
But: each dust particle is a small solid body black body radiation
Continuum emission in IR
4.9 Properties of galaxies: dust
Size of dust particles
a 0.05 − 0.35 μm
Size distribution: dn/da ∝ a−3.5
Chemical composition
Graphite
Silicates
Carbon
CO
PAH
…
Formation?
Requires high densities and temperatures not in typical ISM
Stellar atmospheres
Stellar winds
Red giants
4.9 Properties of galaxies: dust

Extinction depends on wavelength due to scattering
Described by Mie scattering
Assumption: dust = spherical particle with radius a:
Geometric cross-section: σg = π a2
Scattering cross-section depends on wavelength:
λ a ∝ λ-1
λ >> a → 0
λ << a → const
Reddening
4.9 Properties of galaxies: dust

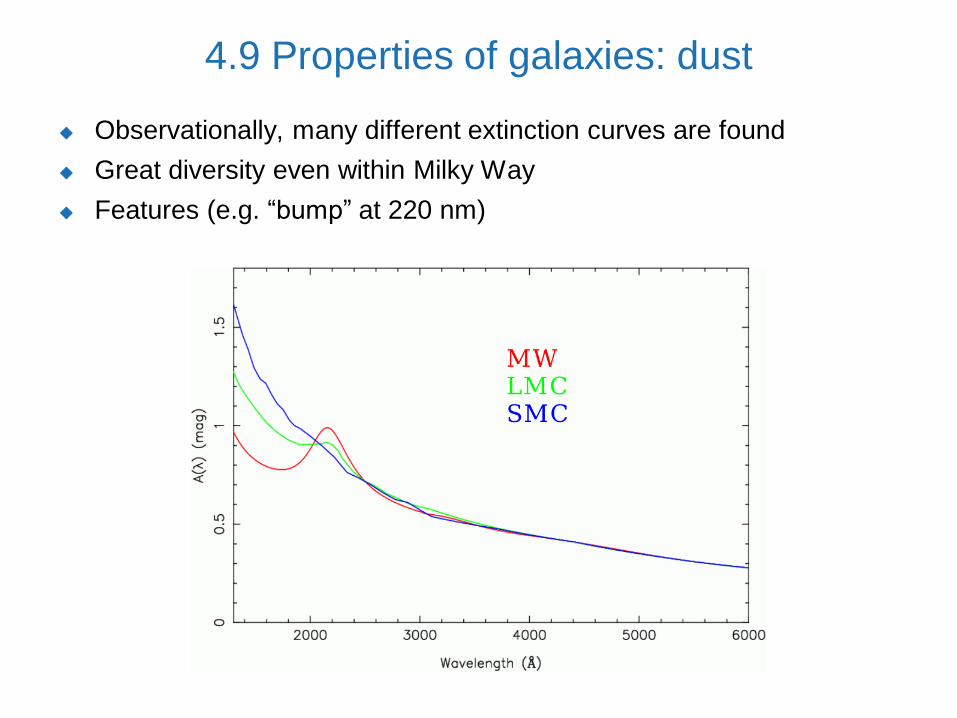
Observationally, many different extinction curves are found
Great diversity even within Milky Way
Features (e.g. “bump” at 220 nm)
Average Galactic
extinction curve
4.9 Properties of galaxies: dust
Observationally, many different extinction curves are found
Great diversity even within Milky Way
Features (e.g. “bump” at 220 nm)
4.9 Properties of galaxies: dust
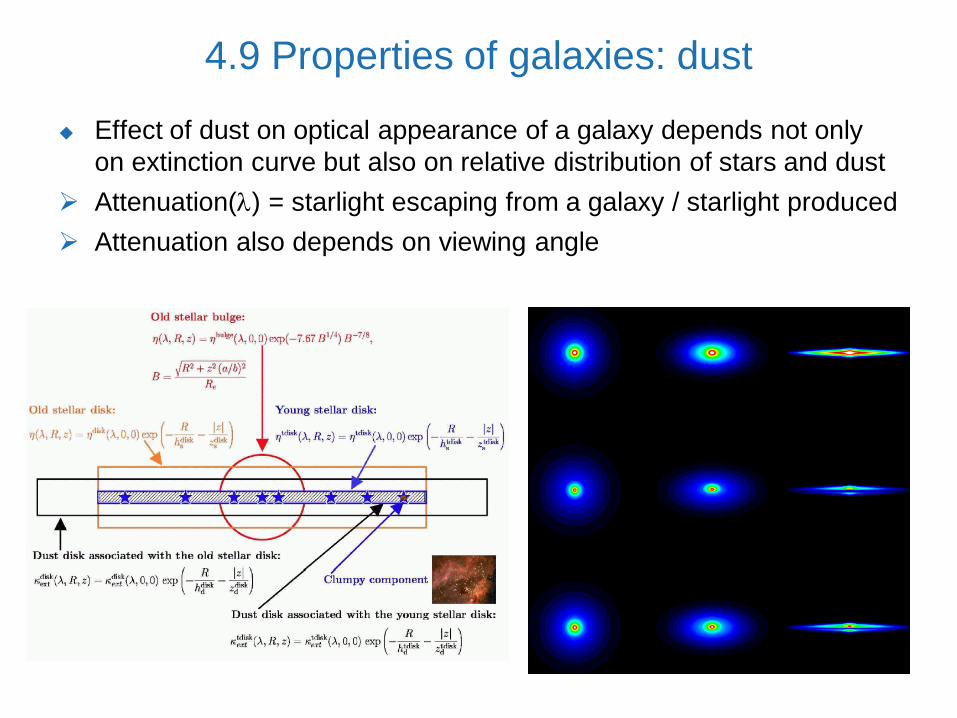
Effect of dust on optical appearance of a galaxy depends not only
on extinction curve but also on relative distribution of stars and dust
Attenuation() = starlight escaping from a galaxy / starlight produced
Attenuation also depends on viewing angle
4.9 Properties of galaxies: dust

Effect of dust on optical appearance of a galaxy depends not only
on extinction curve but also on relative distribution of stars and dust
Attenuation() = starlight escaping from a galaxy / starlight produced
Attenuation also depends on viewing angle
Viewing angle influences how much of both the disk and the bulge
we see
4.9 Properties of galaxies: dust

Survey at 250 m (Herschel) dust mass function of galaxies:
4.9 Properties of galaxies: dust

Why does environment matter to galaxies?
What is “environment”? How can one quantify “environment”?
4.10 Properties of galaxies: environment

4.10 Properties of galaxies: environment

4.10 Properties of galaxies: environment

4.10 Properties of galaxies: environment

Why does environment matter?
Frequency of interactions / mergers (rate of encounters with other
galaxies density in 6D phase space)
Gravitational environment tidal effects
Gaseous environment
Availability of cold gas for star formation
Ram-pressure stripping
Radiative environment
Densest regions collapsed first
4.10 Properties of galaxies: environment

What is “environment”? How can one quantify “environment”?
In 2D? Projection effects!
Or 3D? But redshift is not exactly the same thing as distance
because of peculiar velocities
4.10 Properties of galaxies: environment

What is “environment”? How can one quantify “environment”?
In 2D? Projection effects!
Or 3D? But redshift is not exactly the same thing as distance
because of peculiar velocities
Over which scales? Which are relevant?
4.10 Properties of galaxies: environment

What is “environment”? How can one quantify “environment”?
In 2D? Projection effects!
Or 3D? But redshift is not exactly the same thing as distance
because of peculiar velocities
Over which scales? Which are relevant?
Number of galaxies within some aperture or volume density
Distance to nth nearest neighbour
Halo mass
By dimensionality of surrounding large-scale structure
Void, sheet, filament, cluster/group
Density field
4.10 Properties of galaxies: environment

Grouping of galaxies by friends-of-friends method:
Assembly of large samples
of groups and clusters
Derivation of halo mass by
Galaxy kinematics
Weak lensing
4.10 Properties of galaxies: environment

Application of a minimal spanning tree (MST) to both groups and
galaxies:
Environmental classification by group, filament, tendril, void
4.10 Properties of galaxies: environment

The spectral energy distribution (SED) of galaxies can be
understood as the combined emission from multiple star, dust and
gas components:
4.11 Spectral properties of galaxies

Multiple dust components:
Warm dust in HII regions (heated by young stars)
Cold dust in diffuse ISM
Molecular emission
4.11 Spectral properties of galaxies

4.11 Spectral properties of galaxies

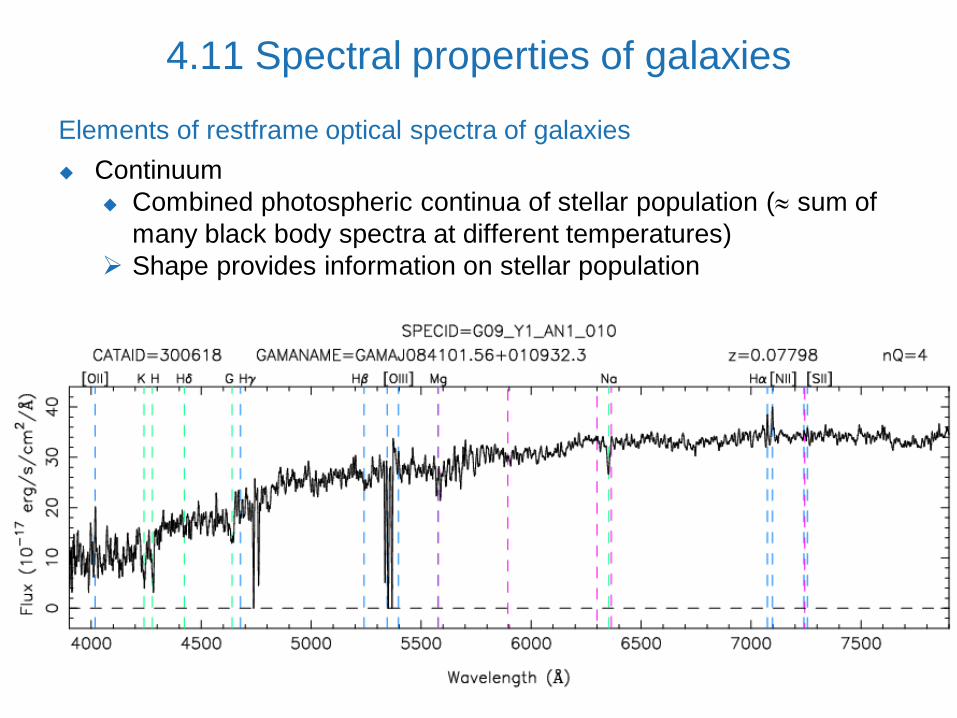
Elements of restframe optical spectra of galaxies
Continuum
Absorption lines
Emission lines
4.11 Spectral properties of galaxies

Elements of restframe optical spectra of galaxies
Continuum
Combined photospheric continua of stellar population ( sum of
many black body spectra at different temperatures)
Shape provides information on stellar population
4.11 Spectral properties of galaxies
Elements of restframe optical spectra of galaxies
Continuum
Combined photospheric continua of stellar population ( sum of
many black body spectra at different temperatures)
Shape provides information on stellar population
4.11 Spectral properties of galaxies

Stellar spectra:
Massive, hot, young
Low-mass, cool, old
4.11 Spectral properties of galaxies

Elements of restframe optical spectra of galaxies
Absorption lines
Mostly from H and metals in stellar photospheres
Stellar age and metallicity indicators
Stellar kinematics
4.11 Spectral properties of galaxies
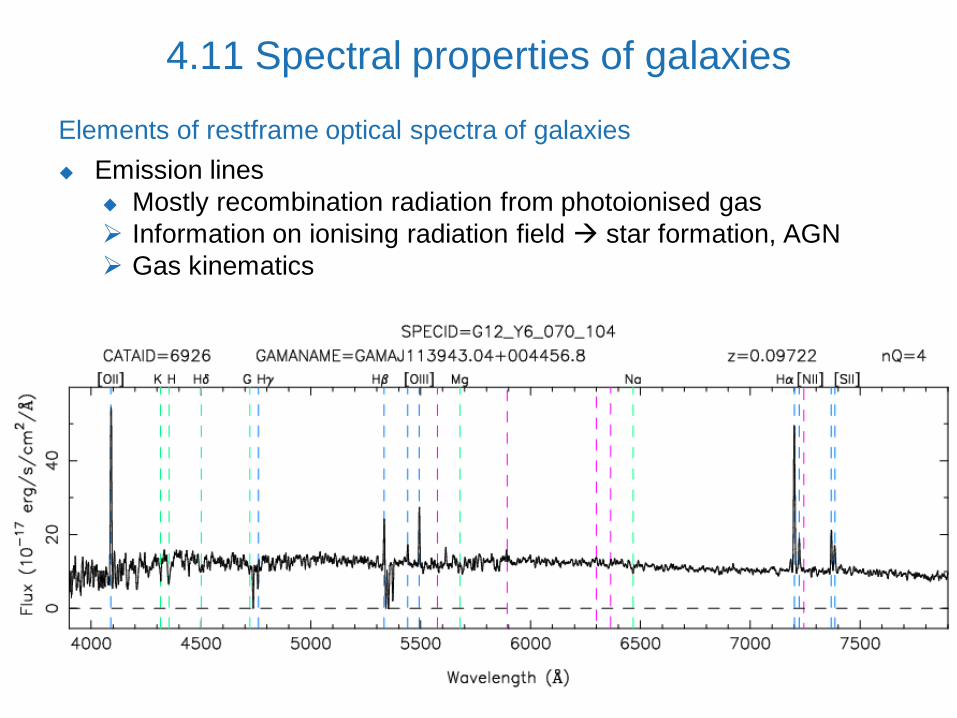
Elements of restframe optical spectra of galaxies
Emission lines
Mostly recombination radiation from photoionised gas
Information on ionising radiation field star formation, AGN
Gas kinematics
4.11 Spectral properties of galaxies

Elements of restframe optical spectra of galaxies
Emission lines
Mostly recombination radiation from photoionised gas
Information on ionising radiation field star formation, AGN
Gas kinematics
4.11 Spectral properties of galaxies

The presence of strong aborption lines requires significant amounts of
metals in stellar photospheres and hence implies an older stellar population
The presence of emission lines requires hot and therefore massive and
therefore young stars
Correspondence between spectral and morphological types
4.11 Spectral properties of galaxies

So far we have only considered integrated-light spectroscopy, i.e.
spectroscopy without any spatial information (e.g. fibre
spectroscopy)
We can obtain spatially resolved spectroscopy by using
Slits (1D spatial information)
Integral field spectroscopy (2D spatial information)
4.11 Spectral properties of galaxies

4.11 Spectral properties of galaxies

4.11 Spectral properties of galaxies

4.11 Spectral properties of galaxies

So far, we have considered a number of galaxy properties
(luminosity, size, morphology, etc)…
… and their distributions (at least for some properties: luminosity
function, size function)
Any viable galaxy formation and evolution model must be able to
explain and reproduce these distributions
However, additional information about the processes of galaxy
formation and evolution is encoded in the relations between these
properties
Relations between galaxy properties provide extremely strong
constraints for models
4.12 Relations among properties

Note: most of the time the relation between two (or more)
parameters consists of a correlation with some scatter
Thus the relation between properties x and y usually consist of
<y> = f(<x>)
• Usually: <y> = A <x> , i.e. log(<y>) = log(<x>) + const
Scatter: y(x)
Need to understand all of this: intercept, slope and scatter
4.12 Relations among properties

We have already encountered some relations. In particular, the
correlation between morphology and kinematics / characteristics of
the stellar population / cold gas content:
E S0 Sa Sb Sc
4.12 Relations among properties
Pressure supported
Red colours / old stars / no
ongoing SF
Low gas fraction
Rotational support
Blue colours / young stars /
active SF
High gas fraction
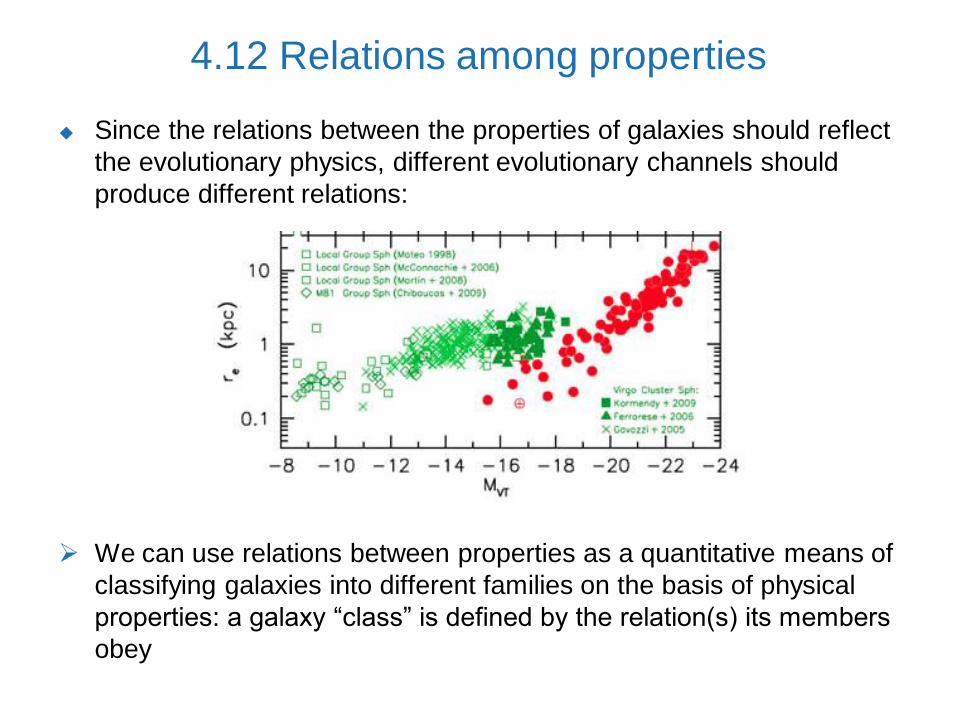
Since the relations between the properties of galaxies should reflect
the evolutionary physics, different evolutionary channels should
produce different relations:
We can use relations between properties as a quantitative means of
classifying galaxies into different families on the basis of physical
properties: a galaxy “class” is defined by the relation(s) its members
obey
4.12 Relations among properties
There are many, many relations between properties
Multi-dimensional relations
Can be difficult to identify “fundamental” properties
May need to control for z when investigating x vs. y
Correlation causation
“True” relations between properties x and y may be obscured by
transformation to observable proxies of x and y
What is noise, what is intrinsic scatter?
Unaccounted-for selection effects may create, destroy or alter
relations
Disentanglement of all of these effects require large samples
4.12 Relations among properties

Colour-magnitude relation
4.12 Relations among properties

Size-luminosity relation
At fixed L, size distribution
is log-normal
Disks: size distribution
linked to distribution of
angular momentum
Spheroids: size
distribution linked to
merger history
4.12 Relations among properties

Ellipticals: fundamental plane
log(Re / kpc) = 1.5 log( / (km/s)) - 0.75 log(<I>e) + const
Relates size, mass and luminosity
4.12 Relations among properties

Disks: Tully-Fisher relation
L = 2.9 x 10¹⁰ (v / (200 km/s))3.4 L⊙
4.12 Relations among properties

4.12 Relations among properties
Kennicutt-Schmidt law
SFR = 2.4 x 10⁻⁴ (gas / (M⊙/pc2))1.4 M⊙ yr-1 kpc-2
What regulates SF?

4.12 Relations among properties
SFR-M* relation

Mass-metallicity relation
Here: gas-phase metallicity as measured by O abundance
Important constraint for models of chemical evolution
4.12 Relations among properties
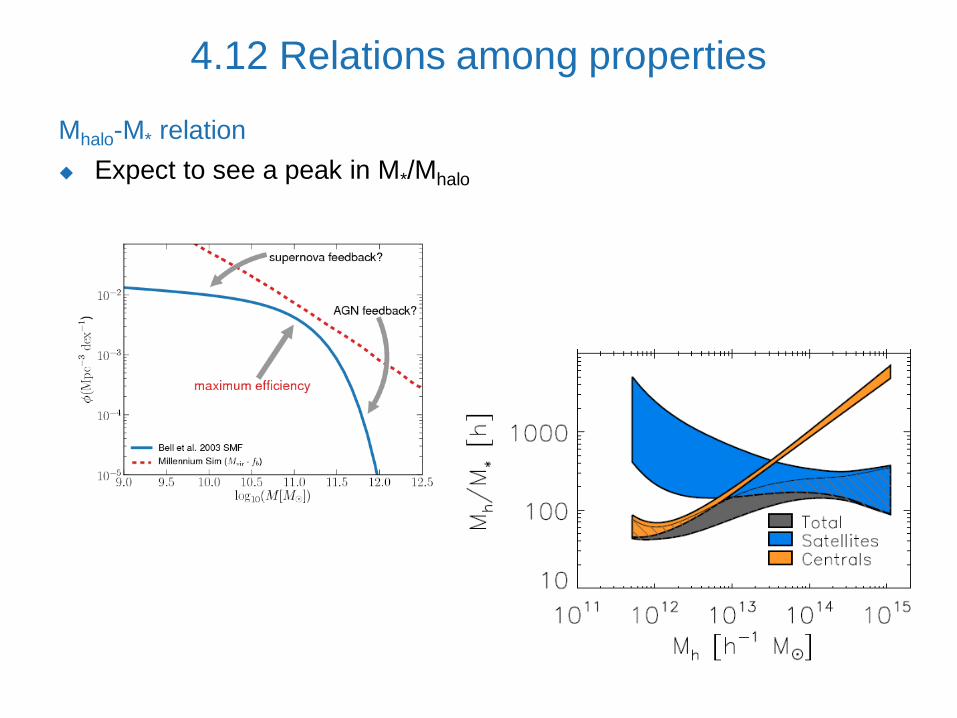
Mhalo-M* relation
Expect to see a peak in M*/Mhalo
4.12 Relations among properties

Morphology-density relation
Dependence of
morphological mix on
local galaxy density
Just one of many
correlations with
environment
4.12 Relations among properties

Morphology-density relation
Dependence of
morphological mix on
local galaxy density
Just one of many
correlations with
environment
Morphological mix also
depends on stellar mass
4.12 Relations among properties

MBH- relation
MBH = 1.3 x 10⁸ ( / (200 km/s))3.7– 5 M⊙
4.12 Relations among properties
Connects BH mass with
properties of host galaxy
Evidence of co-evolution?
How is the tightness of the
relation maintained during
mergers?
Alternatively: do mergers
produce a tight correlation from
an arbitrary MBH/Mbulge
distribution?

All of the above properties, their distributions and relations, evolve
with redshift
Need to repeat everything at all
redshifts while making sure that
apples are compared to apples
4.13 Evolution of properties

1. Introduction
2. What is a galaxy?
3. Interlude
4. Properties of galaxies
5. Basic elements of galaxy formation
and evolution
6. Outstanding issues
Contents

5. Basic elements of galaxy formation

General relativity
Cosmological principle (homogeneity and isotropy)
FLRW metric
Uniquely determined by geometry (k) and expansion history (R(t))
These are in turn determined by the mass-energy budget of the
Universe:
5.1 Cosmology

The “basic” cosmological model does not explain the emergence of
structure in the Universe.
Source of initial density perturbations from which galactic structures
could develop is still not entirely clear.
Best bet: a period of inflationary expansion in the very early
Universe (at end of GUT era) that inflates quantum fluctuations to a
macroscopic scale
5.2 Initial conditions
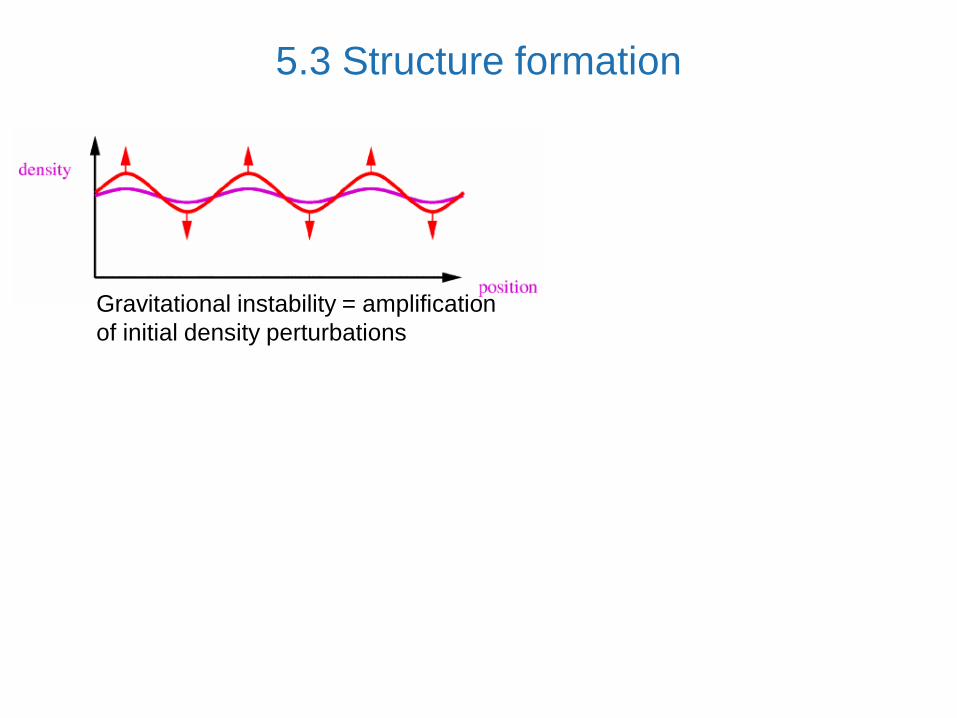
5.3 Structure formation
Gravitational instability = amplification
of initial density perturbations

Governed by 3 equations:
Continuity
Euler
Poisson
5.3 Structure formation
Gravitational instability = amplification
of initial density perturbations

5.4 Halo formation
t
/ 1 Collapse = decoupling from Hubble expansion
Increased density region
Average density region
Gravitational instability = amplification
of initial density perturbations
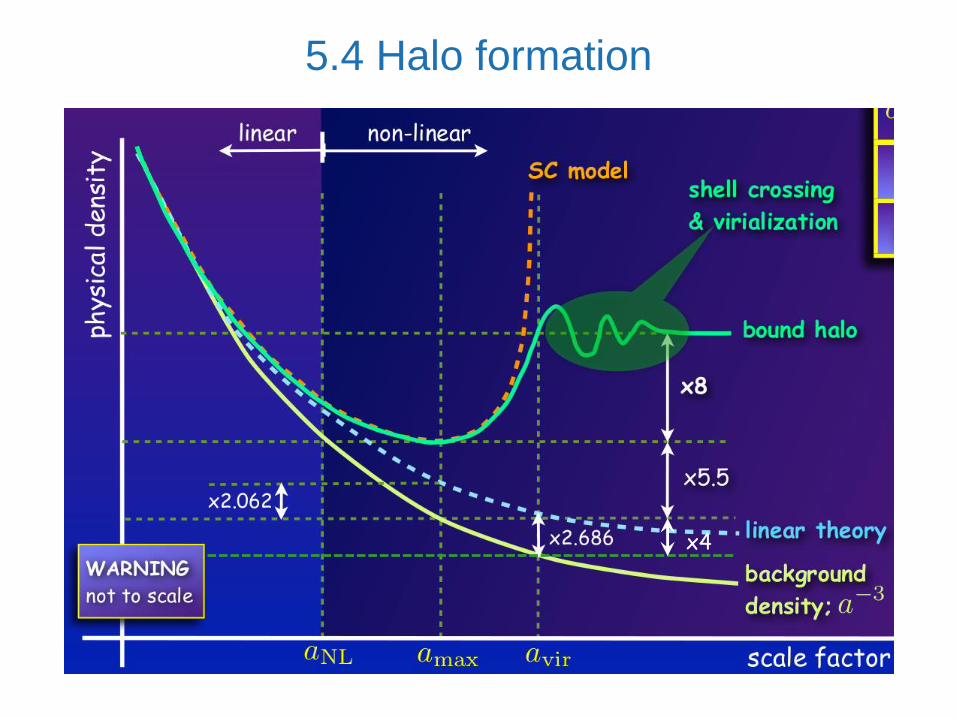
5.4 Halo formation
x4

Relaxation mechanisms available to collisionless systems:
Phase mixing
Diffusion of initially close-by points in phase-space due to the
difference in frequencies between neighboring orbits
Chaotic mixing
Diffusion of initially close-by points in phase-space due to the
chaotic nature of their orbits
Violent relaxation
Change in energy of individual particles due to changes in the
overall potential
Landau damping
Damping and decay of perturbations due to decoherence
between particles and waves
5.4 Halo formation

End state is a system in equilibrium, governed by collisionless
dynamics (collisionless Boltzmann equation)
Obeys the virial theorem: 2K + W = 0 E = K + W = -K = W/2
No success in describing end state with statistical mechanics
Need numerical simulations
End state depends on details of collapse…
… and on initial conditions
In particular: initial value of virial ratio = |2T/W|
CDM halos all expected to have formed from very low |2T/W|
Linked to universal density profile of CDM halos?
5.4 Halo formation

5.4 Halo formation
Gravitational instability = amplification
of initial density perturbations
t
/ 1 Collapse = decoupling from Hubble expansion
Increased density region
Average density region
DM relaxes halo Shocked gas
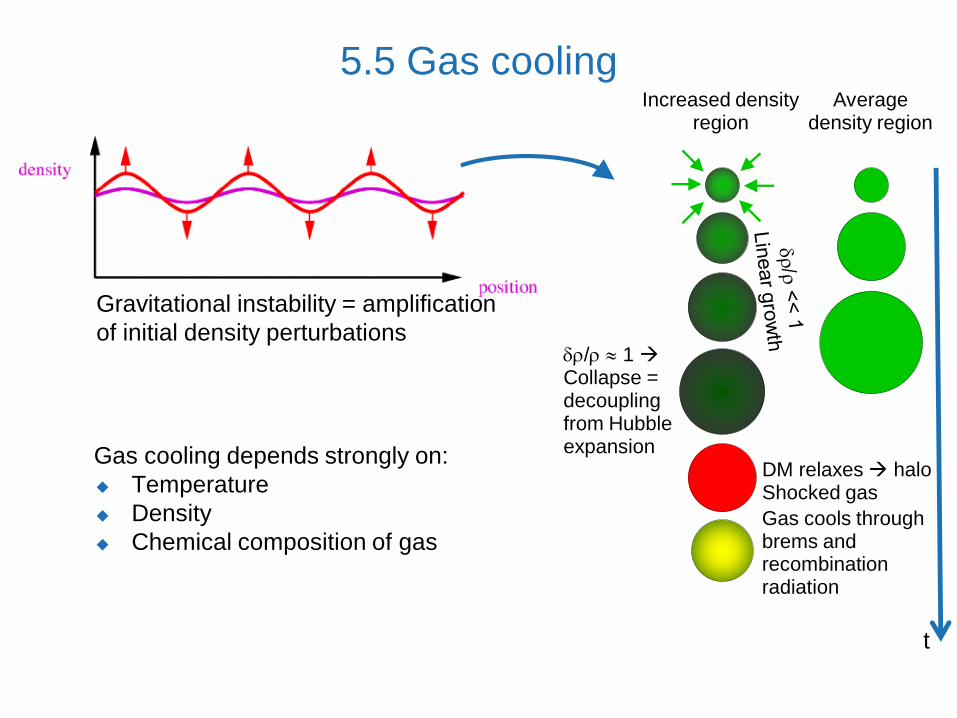
5.5 Gas cooling
Gravitational instability = amplification
of initial density perturbations
t
/ 1 Collapse = decoupling from Hubble expansion
Increased density region
Average density region
DM relaxes halo Shocked gas
Gas cools through brems and recombination radiation
Gas cooling depends strongly on:
Temperature
Density
Chemical composition of gas

Cooling processes
Compton cooling
e- lose energy to CMB, important at high z
Radiative processes
Bremsstrahlung (free-free)
Recombination (free-bound)
Collisional ionisation (bound-free)
Collisional excitation (bound-bound)
All depend on T
Define cooling function: (independent of nH)
5.5 Gas cooling

HHeII
O, C, N
Ne, Fe, Mg, Si
5.5 Gas cooling

Cooling timescale: (faster near centre)
tcool > tH: cooling unimportant hydrostatic equilibrium
tff < tcool < tH: quasi-hydrostatic equilibrium, evolves on cooling
timescale, system has time to react as gas cools
tcool < tff: catastrophic cooling gas is never heated to Tvir
(no shock, cold flow)
5.5 Gas cooling

5.5 Gas cooling
Gravitational instability = amplification
of initial density perturbations
t
/ 1 Collapse = decoupling from Hubble expansion
Increased density region
Average density region
DM relaxes halo Shocked gas
Gas cools through brems and recombination radiation
Gas cooling depends strongly on:
Temperature
Density
Chemical composition of gas
Cooling segregation of gas from DM,
collects as cold gas in centre of DM halo
proto-galaxy (disk)

5.6 Star formation
Gravitational instability = amplification
of initial density perturbations
Eventually: self-gravity of gas
dominates runaway collapse,
fragmentation star formation (SF)
Details still poorly understood
Initial mass function (IMF)?
Two SF modes:
Quiescent
Bursting
t
/ 1 Collapse = decoupling from Hubble expansion
Increased density region
Average density region
DM relaxes halo Shocked gas
Gas cools through brems and recombination radiation
Star formation

5.7 Feedback
Gravitational instability = amplification
of initial density perturbations
To prevent all of the gas from forming
stars, the gas needs to be stopped
from cooling, reheated or expelled.
Feedback from:
AGN (high-mass)
Supernovae (low-mass)
t
/ 1 Collapse = decoupling from Hubble expansion
Increased density region
Average density region
DM relaxes halo Shocked gas
Gas cools through brems and recombination radiation
Star formation
Feedback

5.7 Feedback
Gravitational instability = amplification
of initial density perturbations
t
/ 1 Collapse = decoupling from Hubble expansion
Increased density region
Average density region
DM relaxes halo Shocked gas
Gas cools through brems and recombination radiation
Star formation
Feedback

5.7 Feedback
Gravitational instability = amplification
of initial density perturbations
To prevent all of the gas from forming
stars, the gas needs to be stopped
from cooling, reheated or expelled.
Feedback from:
AGN (high-mass)
Supernovae (low-mass)
Details poorly understood t
/ 1 Collapse = decoupling from Hubble expansion
Increased density region
Average density region
DM relaxes halo Shocked gas
Gas cools through brems and recombination radiation
Star formation
Feedback

5.7 Feedback
Gravitational instability = amplification
of initial density perturbations
t
/ 1 Collapse = decoupling from Hubble expansion
Increased density region
Average density region
DM relaxes halo Shocked gas
Gas cools through brems and recombination radiation
Star formation
Feedback

5.8 Mergers
Gravitational instability = amplification
of initial density perturbations
t
/ 1 Collapse = decoupling from Hubble expansion
Increased density region
Average density region
DM relaxes halo Shocked gas
Gas cools through brems and recombination radiation
Star formation
FeedbackHierarchical growth
t

5.8 Mergers

5.7 Mergers

5.8 Mergers

Tidal stripping
Tidal interactions with other galaxies can remove stars, gas and DM,
and perturb the structure:
5.9 Dynamical evolution

Tidal stripping
Ram-pressure stripping
Movement of a satellite galaxy through the hot halo gas of another
galaxy causes a drag to be exerted on the ISM of the satellite
ablation of gas and dust:
5.9 Dynamical evolution
Tidal stripping
Ram-pressure stripping
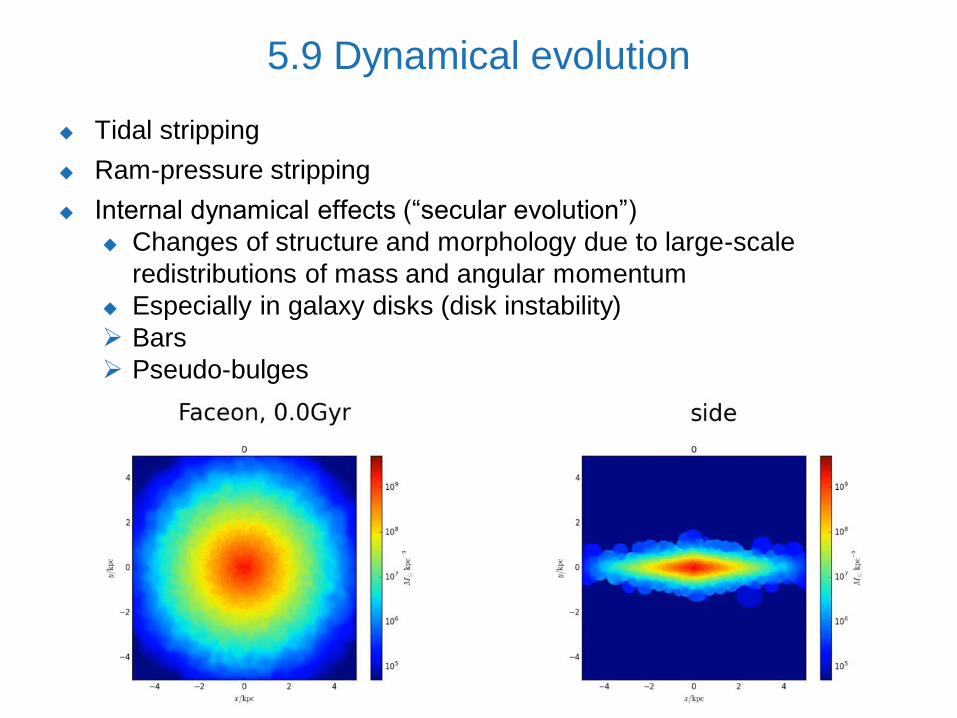
Internal dynamical effects (“secular evolution”)
Changes of structure and morphology due to large-scale
redistributions of mass and angular momentum
Especially in galaxy disks (disk instability)
Bars
Pseudo-bulges
5.9 Dynamical evolution

Stars produce heavy elements through nuclear fusion
These are returned to the ISM by stellar winds or supernovae
The metallicity of the ISM and of newly formed stars changes over
time
Changes the luminosities and colours of newly formed stars
Changes the cooling efficiency of the gas
Changes the abundance of dust
Evolution is made more complicated by:
Infall of “fresh” gas
Blow-out of gas by feedback processes
Mergers
5.10 Chemical evolution

5. Basic elements of galaxy formation

Simultaneous simulation of DM and gas hydrodynamics + “recipes”
for “sub-grid physics”: cooling, photo-ionisation, star formation and
evolution, feedback
Putting it all together: numerical models

Constrain sub-grid physics with selected set of observations
“Predict” everything else
Compare to observations
Identify discrepancies
Find and understand the reasons for the discrepancies
Fix the model without breaking existing successes
Putting it all together: numerical models

This topic merits entire conferences and books…
My personal list:
Star formation efficiency and the nature of feedback as a function of
halo mass
Fuelling and cessation of star formation
Roles of galaxy interactions and mergers versus in-situ processes
Relative prevalence of disks and spheroids
Mass-size relations of disks and spheroids
Downsizing
Co-evolution of central SMBH and their host galaxies
...
6. Outstanding issues