Embed Size (px)
Citation preview
Riccio et al. Clin Transl Allergy (2017) 7:6 DOI 10.1186/s13601-017-0143-1
RESEARCH
Galectin-3: an early predictive biomarker of modulation of airway remodeling in patients with severe asthma treated with omalizumab for 36 monthsAnna Maria Riccio1†, Pierluigi Mauri2†, Laura De Ferrari1, Rossana Rossi2, Dario Di Silvestre2, Louise Benazzi2, Alessandra Chiappori1, Roberto Walter Dal Negro3, Claudio Micheletto4 and Giorgio Walter Canonica1,5*
Abstract
Background: Bronchial asthma is a heterogeneous disease characterized by three cardinal features: chronic inflam-mation, variable airflow obstruction, and airway hyperresponsiveness. Asthma has traditionally been defined using nonspecific clinical and physiologic variables that encompass multiple phenotypes and are treated with nonspecific anti-inflammatory therapies. Based on the modulation of airway remodeling after 12 months of anti-immunoglobulin E (IgE) treatment, we identified two phenotypes (omalizumab responder, OR; and non-omalizumab responder, NOR) and performed morphometric analysis of bronchial biopsy specimens. We also found that these two phenotypes were correlated with the presence/absence of galectin-3 (Gal-3) at baseline (i.e., before treatment). The aims of the present study were to investigate the histological and molecular effects of long-term treatment (36 months) with anti-IgE and to analyze the behavior of OR and NOR patients.
Methods: All patients were treated with the monoclonal antibody anti-IgE omalizumab for 36 months. The bronchial biopsy specimens were evaluated using morphometric, eosinophilic, and proteomic analysis (MudPIT). New data were compared with previous data, and unsupervised cluster analysis of protein profiles was performed.
Results: After 36 months of treatment with omalizumab, reduction of reticular basement membrane (RBM) thickness was confirmed in OR patients (Gal-3-positive at baseline); similarly, the protein profiles (over 500 proteins identified) revealed that, in the OR group, levels of proteins specifically related to fibrosis and inflammation (e.g., smooth muscle and extracellular matrix proteins (including periostin), Gal-3, and keratins decreased by between 5- and 50-fold. Eosin-ophil levels were consistent with molecular data and decreased by about tenfold less in ORs and increased by twofold to tenfold more in NORs. This tendency was confirmed (p < 0.05) based on both fold change and DAVE algorithms, thus indicating a clear response to anti-IgE treatment in Gal-3-positive patients.
Conclusions: Our results showed that omalizumab can be considered a disease-modifying treatment in OR. The pro-teomic signatures confirmed the presence of Gal-3 at baseline to be a biomarker of long-term reduction in bronchial RBM thickness, eosinophilic inflammation, and muscular and fibrotic components in omalizumab-treated patients with severe asthma. Our findings suggest a possible relationship between Gal-3 positivity and improved pulmonary function.
© The Author(s) 2017. This article is distributed under the terms of the Creative Commons Attribution 4.0 International License (http://creativecommons.org/licenses/by/4.0/), which permits unrestricted use, distribution, and reproduction in any medium, provided you give appropriate credit to the original author(s) and the source, provide a link to the Creative Commons license, and indicate if changes were made. The Creative Commons Public Domain Dedication waiver (http://creativecommons.org/publicdomain/zero/1.0/) applies to the data made available in this article, unless otherwise stated.
Open Access
Clinical andTranslational Allergy
*Correspondence: [email protected] †Anna Maria Riccio, Pierluigi Mauri contributed equally to this manuscript. 5 Department of Biomedical Sciences, Personalized Medicine Clinic Asthma and Allergy, Humanitas University, Rozzano, Milan, ItalyFull list of author information is available at the end of the article
Page 2 of 10Riccio et al. Clin Transl Allergy (2017) 7:6
BackgroundBronchial asthma is a heterogeneous disease character-ized by three cardinal features: chronic inflammation, variable airflow obstruction, and airway hyperrespon-siveness [1]. The heterogeneity of asthma extends beyond clinical symptoms, response to therapy, age at onset, duration of disease process, extent of bronchial narrow-ing, sensitivity to triggering agents, airway inflammatory pattern, and the immune response. Accordingly, clas-sifying asthma into several smaller, more homogeneous subgroups, the so-called phenotypes, makes it easier to define the underlying mechanisms of the disease, admin-ister more effective mechanism-based therapy, and improve prediction of disease course.
Technological advances during the last decade have facilitated clinical and molecular research, thus making it possible to combine phenotyping approaches to optimize asthma management and personalized medicine [2].
The US Severe Asthma Research Program (SARP) recently analyzed an extensive dataset of patients with severe and nonsevere asthma in order to identify and describe robust subgroups of asthma patients with spe-cific features [3] that could guide personalized therapy, although this approach has not yet been verified. Using a variety of statistical analyses, the authors interrogated the dataset to identify the characteristics that most accu-rately distinguish between subgroups within the study population. This approach is known as clustering [1].
Asthma has traditionally been defined using nonspe-cific clinical and physiological variables that encompass multiple phenotypes and has been treated using nonspe-cific anti-inflammatory therapies. Recent molecular and genetic studies have identified clinical and inflammatory phenotypes associated with specific biomarkers.
Biomarkers for inflammation driven by type-2 helper T lymphocytes (Th2), including elevated fractional exhaled nitric oxide (FeNO) levels, blood/sputum eosinophil counts, and serum periostin levels, have helped to iden-tify a Th2-high molecular phenotype of asthma. Treat-ment of Th2-high asthmatic patients with biologic agents targeting immunoglobulin E (IgE) and the canonical Th2-related cytokines interleukin (IL) 4, IL-5, and IL-13 is proving to be efficacious [4]. However, we do not yet know the biomarkers able to identify a Th2-low asthma phenotype and potentially guide therapy. Although tar-geted biologic agents are generally efficacious in treat-ing various phenotypes of asthma and allergic disease, some patients respond better to one biologic agent than
another or not at all. The reasons for these differential responses are still unknown [5].
We performed morphometric analysis on bronchial biopsy specimens before and after anti-IgE treatment to investigate modulation (or not) of airway remodeling after 12 months of treatment with omalizumab. We iden-tified two phenotypes of severe asthma: the omalizumab responder phenotype (OR) and the non-omalizumab responder phenotype (NOR) [6]. Proteomic analysis of the specimens showed that these patient subgroups were characterized by different levels of galectin-3 (Gal-3) in bronchial tissue at baseline and after 12 months of treatment with omalizumab [7]. In the present study, we extended our morphometric, eosinophilic, and pro-teomic analyses by investigating bronchial biopsy speci-mens collected from the same patients after 36 months of treatment with omalizumab and compared molecular data with data on bronchial reticular basement mem-brane (RBM) thickness and bronchial eosinophilic and neutrophilic infiltration.
The aims of the present study were to evaluate prot-eomic signatures and modifications in RBM thickness with respect to long-term anti-IgE treatment and to investigate the behaviour of OR and NOR.
MethodsPatientsEight patients were treated with the monoclonal anti-body anti-IgE omalizumab for 36 months. The patients’ clinical features (Table 1) were described in a previous paper, where we showed that the original RBM thickness and eosinophil infiltration were reduced in a substantial proportion of severe asthmatics after 1 year of treatment with omalizumab, thus emphasizing the possible role of this agent in airway remodelling in severe persistent allergic asthma [6].
Keywords: Anti-IgE, Omalizumab, Severe asthma, Galectin-3, Biomarker, Airway remodeling, Bronchial biopsy, Proteomics, Eosinophils
Table 1 Patient characteristics
Data are expressed as mean ± SEM
Patients (n) 8
Age (years) 47.0 ± 9.7
Sex ratio (M/F) 5/3
Smokers/nonsmokers 1/7
Body mass index 23.8 ± 3.1
Total plasma IgE (kU/L) 309.4 ± 218.2
Forced expiratory volume in the first second 52% pred ± 14%
Asthma control test score 11.3 ± 2.8
Page 3 of 10Riccio et al. Clin Transl Allergy (2017) 7:6
The study was approved by the Ethics Committee of Orlandi General Hospital of Bussolengo, Verona, Italy.
Bronchial biopsy: collection and processingAs previously reported before treatment and at 12 months [6], each patient underwent bronchoscopy 36 months after starting anti-IgE treatment. Bronchial biopsy specimens were obtained using a flexible bron-choscope (Pentax FB19-TX, Langley, UK). Specimens were collected from the right middle lobe, fixed in forma-lin for 10 h at 4 °C, and embedded in paraffin. The blocks were cut into 3-µm sections using a rotary microtome.
Morphometric analysisThe bronchial sections were mounted onto glass slides, dewaxed, rehydrated, and stained with hematoxylin-eosin (Hematoxylin and Eosin Stain, Carl Roth GmbH + Co. KG, Germany).
The area of the RBM was measured using computer-aided digital morphometry with a DFC 320 Leica color digital camera attached to a Leica Microsystems DMLA light microscope. Digital images of the biopsies were captured at high power using a 100× lens and analyzed using QWin software (Leica Microsystems). Bronchial RBM thickness was measured according to the recom-mendations of the American Thoracic Society/Euro-pean Respiratory Society using the orthogonal intercept method. A 100 × 100-μm grid was randomly overlaid on hematoxylin-eosin-stained sections. Orthogonal inter-cepts were measured from the intersections of the grid with the RBM-epithelium junction to the RBM-subepi-thelial area junction. At least 40 measures were obtained every 20 μm. Morphometric analysis was performed by two blinded operators. The arithmetic means of the intercept measures were calculated using the formula τ = π/4 × arithmetic mean of orthogonal intercepts [8].
Evaluation of the eosinophilic infiltrateBronchial biopsies collected 36 months after start-ing treatment with omalizumab were considered suit-able for examination if at least 1.0 mm of RBM length and 0.1 mm2 of subepithelial area were morphometri-cally preserved. Eosinophils were quantified in the area extending 50 μm under the RBM and expressed as number of eosinophils/mm2 of subepithelium (mean of two samples per patient). The eosinophil count was per-formed by two blinded operators [9].
Evaluation of the neutrophilic infiltrateIn order to obtain complete data on the bronchial inflam-matory pattern, we evaluated neutrophilic infiltration before treatment and after 36 months. This variable was not investigated in our previous paper [6]. Biopsies were
considered suitable for examination when there was at least 1.0 mm of RBM length and 0.1 mm2 of subepithe-lial area. Neutrophils were quantified in the area extend-ing 50 μm under the RBM and expressed as number of neutrophils/mm2 of subepithelium. The neutrophil count was performed by two blinded operators [9].
Proteomic analysisThe dewaxed tissues (3-µm section from each sample) were dried in a vacuum centrifuge and resuspended in 0.1 M ammonium bicarbonate, pH 7.9. Proteins were extracted from tissue as previously described [7]. Briefly, tissue was homogenized in solution buffer (0.1 M ammo-nium bicarbonate, pH 7.9) treated with RapiGest SF reagent (Waters Corporation, Milford, MA, USA) and incubated with stirring, first at 100 °C for 20 min and then at 80 °C for 2 h. Subsequently, the protein con-centration was assayed using the SPNTM Protein Assay kit (G-Biosciences, Maryland Heights, MO, USA), and 5 ± 0.5 µg of protein from each sample was digested with trypsin (Sequencing Grade Modified Trypsin, Promega, Madison, WI, USA) using a 1:50 (w/w) enzyme/substrate ratio at 37 °C overnight. The next morning, an additional aliquot of enzyme was added at an enzyme/substrate ratio of 1:100 (w/w), and digestion was continued for 4 h. Enzyme digestion was stopped by addition of trifluoro-acetic acid to reach a pH of 2, and the digested samples were desalted and enriched using PepClean columns (Pierce Biotechnology, Rockford, IL, USA).
The resulting peptide mixtures were analyzed using multidimensional protein identification technology (MudPIT) [10] based on two-dimensional chromatog-raphy coupled to tandem mass spectrometry (2DC-MS/MS). Peptides were identified to correlate the experi-mental tandem mass spectra with the theoretical peptide sequences obtained by the in silico digestion of a human protein database (approximately 230,000 entries) down-loaded from the NCBI website (www.ncbi.nlm.nih.gov).
Statistical and clustering analysesMass spectra data were processed using Bioworks ver-sion 3.3.1 based on the SEQUEST algorithm (Univer-sity of Washington, licensed to Thermo Finnigan Corp., San José, CA, USA) and the following parameters: Xcorr scores greater than 1.5 for singly charged peptide ions and 2.0 and 2.5 for doubly and triply charged ions, respectively; peptide probability ≤0.001; and protein consensus score value ≥10. These filters guaranteed that the resulting proteins had a p value of ≤0.001. The false-positive peptide ratio, which was calculated through the reverse database, was less than 3%.
The statistical analysis was performed using R soft-ware. Biological and technical replicates were evaluated
Page 4 of 10Riccio et al. Clin Transl Allergy (2017) 7:6
by hierarchical clustering [11] using an in-house R script based on the XlsReadWrite, clue, and clValid libraries (http://cran.r-project.org). The Euclidean distance met-ric was applied and an agglomerative coefficient was calculated.
We measured five parameters (eosinophils, smooth muscle proteins, periostin, keratins, and RBM) in eight patients (OR, n = 4; NOR, n = 4) and separated them according to time (T0, and T36) to evaluate significant differences between OR and NOR. For each group, sig-nificant differences were also evaluated between baseline (T0) and T36.
As for eosinophils (cells/mm2), the t test (p ≤ 0.05) was used to evaluate the difference between the patient groups (OR and NOR) and treatment time (T0 and T36). The same comparisons were performed for periostin, Gal-3, smooth muscle proteins, and keratins. In this case, the average SEQUEST score values were evaluated using the Wilcoxon test because proteomic data are not nor-mally distributed (Shapiro–Wilk test).
Variation in the proteins analyzed was also evaluated by calculating the fold change, as previously reported [12]; this was defined as the natural logarithm of the ratio T36/T0. In addition, the protein lists were analyzed and aligned using multidimensional algorithm protein map software (MAProMa), which provides quantitative indexes based on the SEQUEST score, such as DAVE and DCI [13]. DAVE is an index of the ratio between the two conditions compared and, therefore, indicates different amounts of each protein under the two different condi-tions. When the protein is not present in the reference (baseline), DAVE is +2.0, whereas if the protein is not present in the sample (in our case after treatment, T36), DAVE is −2.0. Consequently, intermediate DAVE val-ues indicate different amounts of protein under the two conditions compared. DAVE values >|0.4| indicate sig-nificant variations. Finally, the t test was used to evalu-ate significant differences in the average DAVE and fold change values.
ResultsWe evaluated the effect of long-term anti-IgE treatment (36 months) on RBM thickness, eosinophilic and neu-trophilic infiltrates, and proteomic profiles by analyzing bronchial biopsy specimens from patients with severe asthma (Table 1).
Histological analysisAll bronchial biopsies were evaluated using morphomet-ric analysis of RBM thickness.
Differences were observed in the behavior of the two groups (OR and NOR) between baseline and 36 months of anti-IgE treatment.
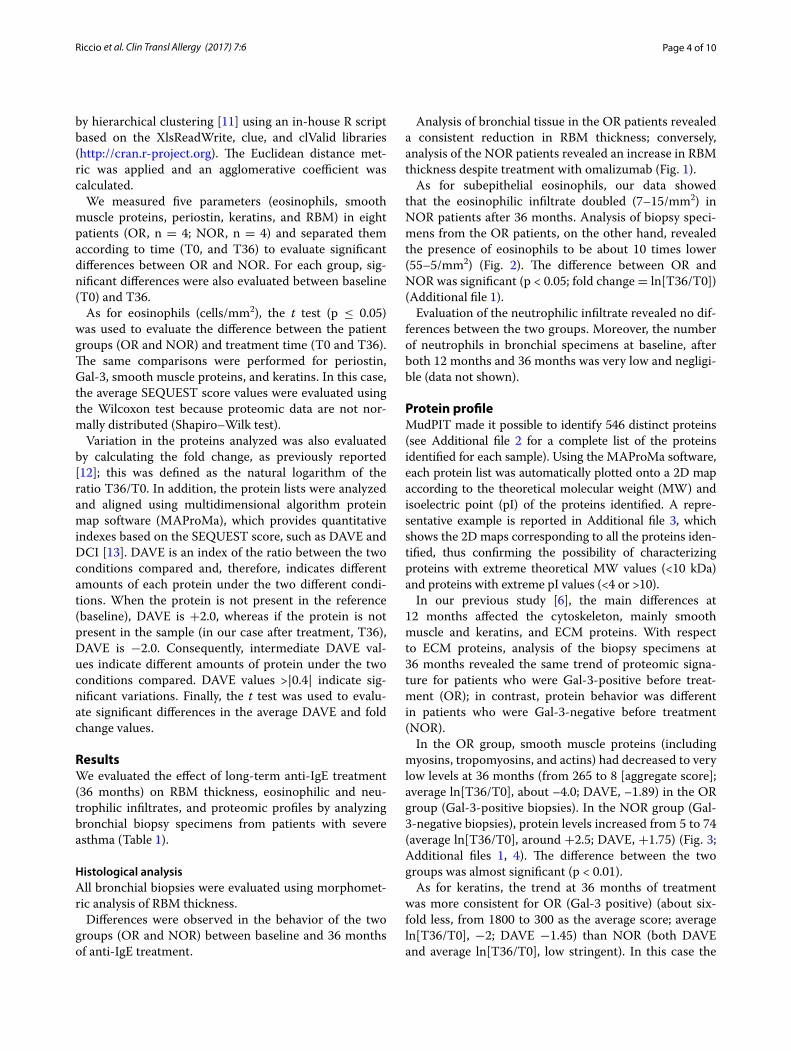
Analysis of bronchial tissue in the OR patients revealed a consistent reduction in RBM thickness; conversely, analysis of the NOR patients revealed an increase in RBM thickness despite treatment with omalizumab (Fig. 1).
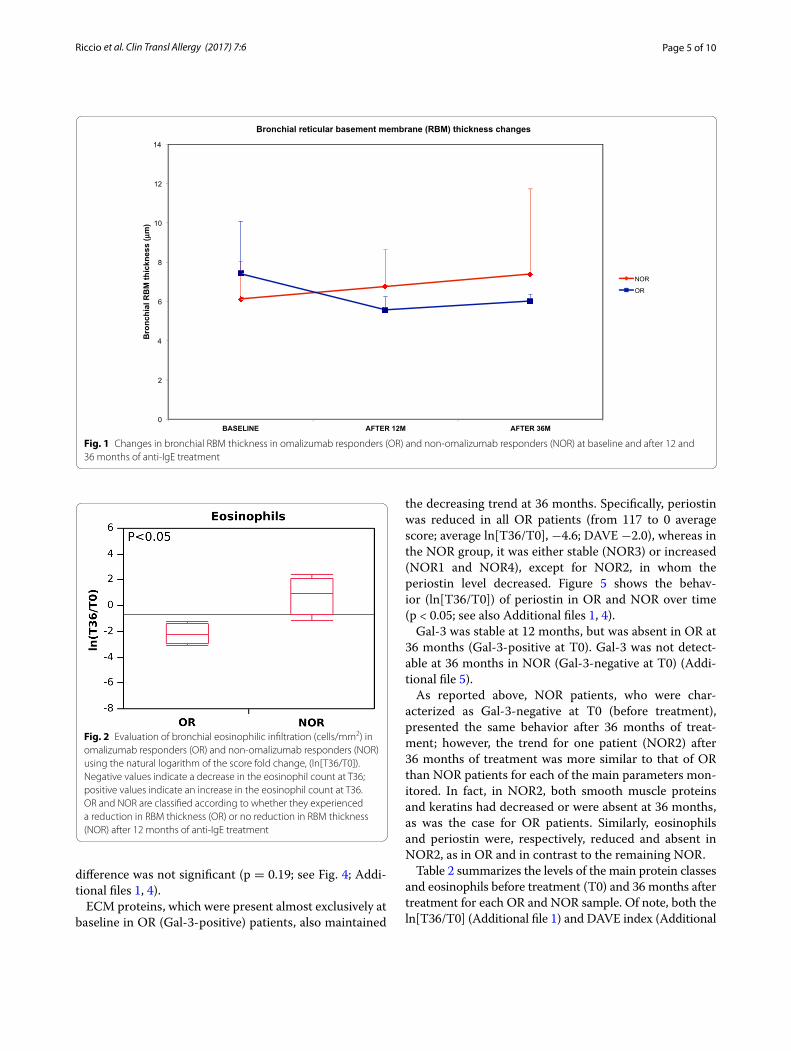
As for subepithelial eosinophils, our data showed that the eosinophilic infiltrate doubled (7–15/mm2) in NOR patients after 36 months. Analysis of biopsy speci-mens from the OR patients, on the other hand, revealed the presence of eosinophils to be about 10 times lower (55–5/mm2) (Fig. 2). The difference between OR and NOR was significant (p < 0.05; fold change = ln[T36/T0]) (Additional file 1).
Evaluation of the neutrophilic infiltrate revealed no dif-ferences between the two groups. Moreover, the number of neutrophils in bronchial specimens at baseline, after both 12 months and 36 months was very low and negligi-ble (data not shown).
Protein profileMudPIT made it possible to identify 546 distinct proteins (see Additional file 2 for a complete list of the proteins identified for each sample). Using the MAProMa software, each protein list was automatically plotted onto a 2D map according to the theoretical molecular weight (MW) and isoelectric point (pI) of the proteins identified. A repre-sentative example is reported in Additional file 3, which shows the 2D maps corresponding to all the proteins iden-tified, thus confirming the possibility of characterizing proteins with extreme theoretical MW values (<10 kDa) and proteins with extreme pI values (<4 or >10).
In our previous study [6], the main differences at 12 months affected the cytoskeleton, mainly smooth muscle and keratins, and ECM proteins. With respect to ECM proteins, analysis of the biopsy specimens at 36 months revealed the same trend of proteomic signa-ture for patients who were Gal-3-positive before treat-ment (OR); in contrast, protein behavior was different in patients who were Gal-3-negative before treatment (NOR).
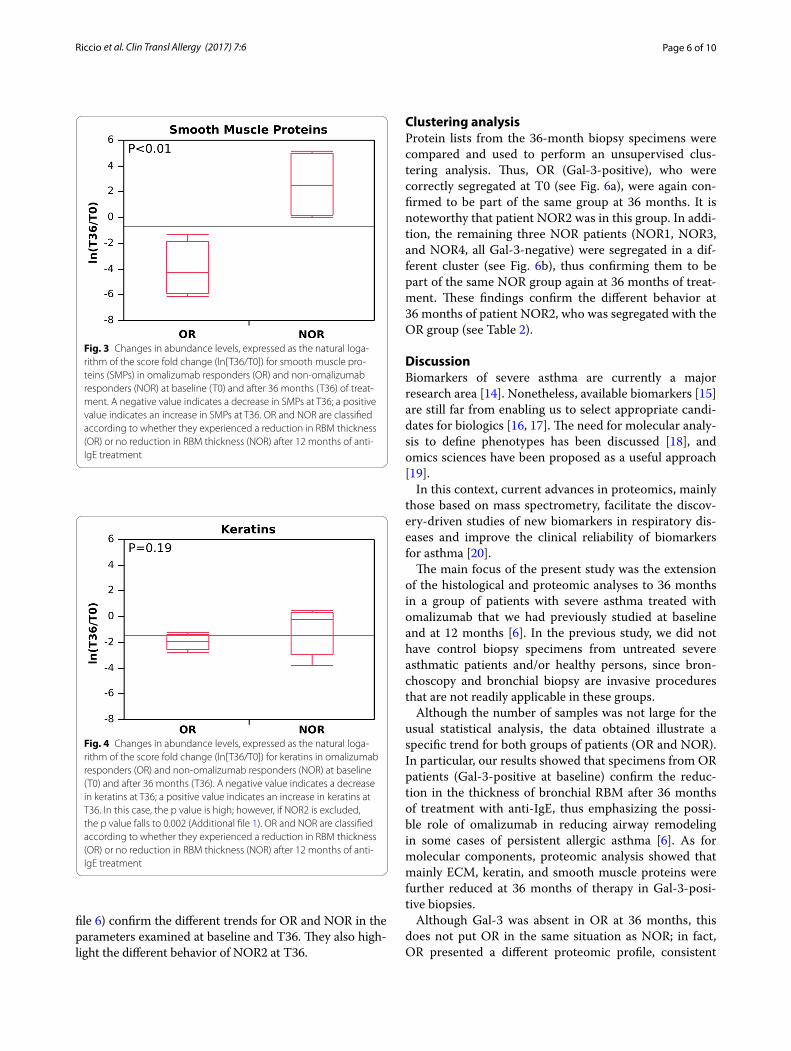
In the OR group, smooth muscle proteins (including myosins, tropomyosins, and actins) had decreased to very low levels at 36 months (from 265 to 8 [aggregate score]; average ln[T36/T0], about –4.0; DAVE, –1.89) in the OR group (Gal-3-positive biopsies). In the NOR group (Gal-3-negative biopsies), protein levels increased from 5 to 74 (average ln[T36/T0], around +2.5; DAVE, +1.75) (Fig. 3; Additional files 1, 4). The difference between the two groups was almost significant (p < 0.01).
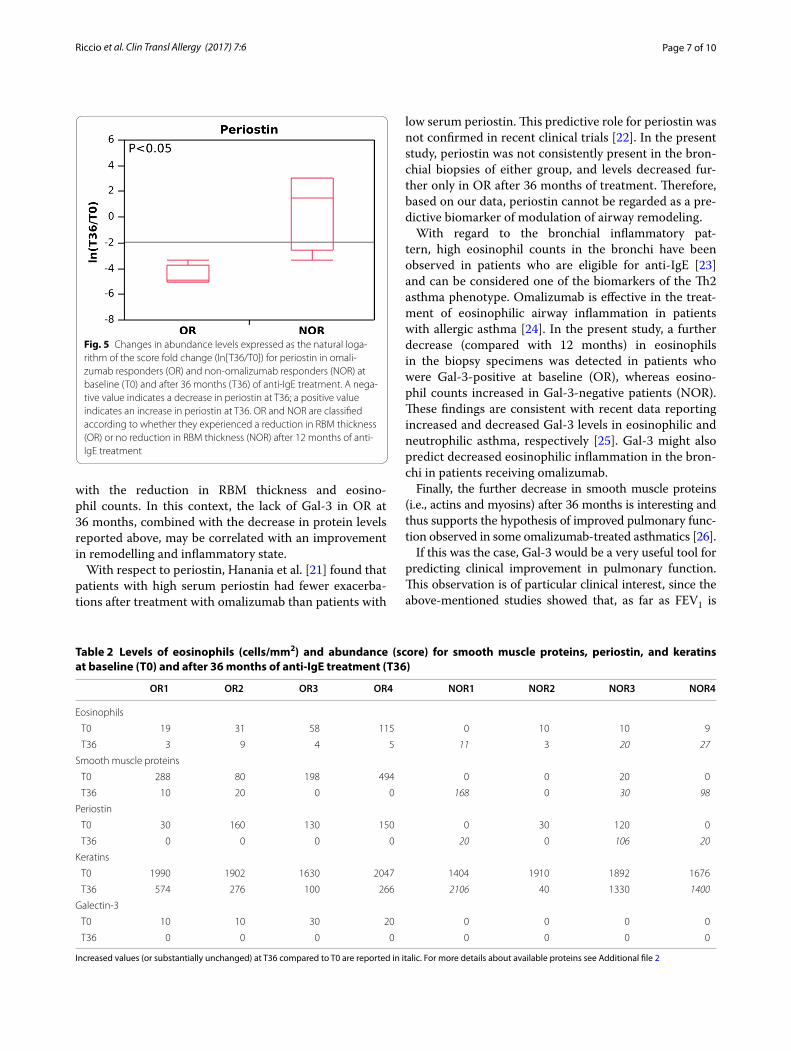
As for keratins, the trend at 36 months of treatment was more consistent for OR (Gal-3 positive) (about six-fold less, from 1800 to 300 as the average score; average ln[T36/T0], −2; DAVE −1.45) than NOR (both DAVE and average ln[T36/T0], low stringent). In this case the
Page 5 of 10Riccio et al. Clin Transl Allergy (2017) 7:6
difference was not significant (p = 0.19; see Fig. 4; Addi-tional files 1, 4).
ECM proteins, which were present almost exclusively at baseline in OR (Gal-3-positive) patients, also maintained
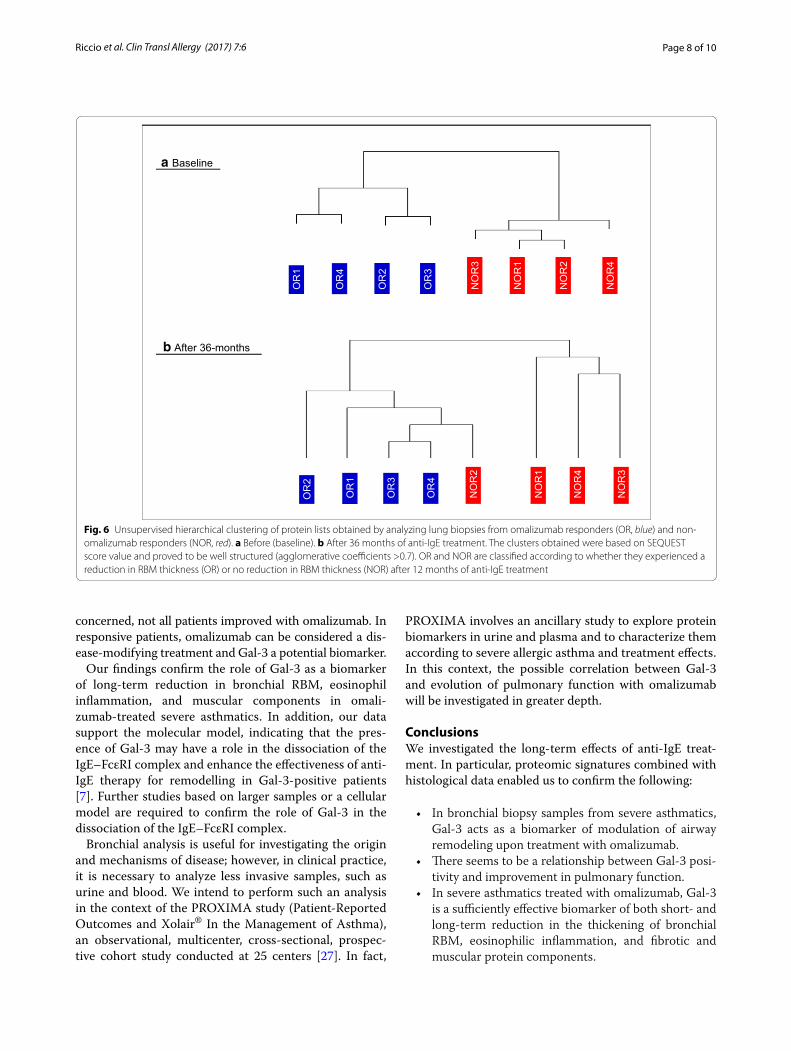
the decreasing trend at 36 months. Specifically, periostin was reduced in all OR patients (from 117 to 0 average score; average ln[T36/T0], −4.6; DAVE −2.0), whereas in the NOR group, it was either stable (NOR3) or increased (NOR1 and NOR4), except for NOR2, in whom the periostin level decreased. Figure 5 shows the behav-ior (ln[T36/T0]) of periostin in OR and NOR over time (p < 0.05; see also Additional files 1, 4).
Gal-3 was stable at 12 months, but was absent in OR at 36 months (Gal-3-positive at T0). Gal-3 was not detect-able at 36 months in NOR (Gal-3-negative at T0) (Addi-tional file 5).
As reported above, NOR patients, who were char-acterized as Gal-3-negative at T0 (before treatment), presented the same behavior after 36 months of treat-ment; however, the trend for one patient (NOR2) after 36 months of treatment was more similar to that of OR than NOR patients for each of the main parameters mon-itored. In fact, in NOR2, both smooth muscle proteins and keratins had decreased or were absent at 36 months, as was the case for OR patients. Similarly, eosinophils and periostin were, respectively, reduced and absent in NOR2, as in OR and in contrast to the remaining NOR.
Table 2 summarizes the levels of the main protein classes and eosinophils before treatment (T0) and 36 months after treatment for each OR and NOR sample. Of note, both the ln[T36/T0] (Additional file 1) and DAVE index (Additional
0
2
4
6
8
10
12
14
BASELINE AFTER 12M AFTER 36M
Bro
nchi
al R
BM
thic
knes
s (µ
m)
Bronchial reticular basement membrane (RBM) thickness changes
NOR
OR
Fig. 1 Changes in bronchial RBM thickness in omalizumab responders (OR) and non-omalizumab responders (NOR) at baseline and after 12 and 36 months of anti-IgE treatment
Fig. 2 Evaluation of bronchial eosinophilic infiltration (cells/mm2) in omalizumab responders (OR) and non-omalizumab responders (NOR) using the natural logarithm of the score fold change, (ln[T36/T0]). Negative values indicate a decrease in the eosinophil count at T36; positive values indicate an increase in the eosinophil count at T36. OR and NOR are classified according to whether they experienced a reduction in RBM thickness (OR) or no reduction in RBM thickness (NOR) after 12 months of anti-IgE treatment
Page 6 of 10Riccio et al. Clin Transl Allergy (2017) 7:6
file 6) confirm the different trends for OR and NOR in the parameters examined at baseline and T36. They also high-light the different behavior of NOR2 at T36.
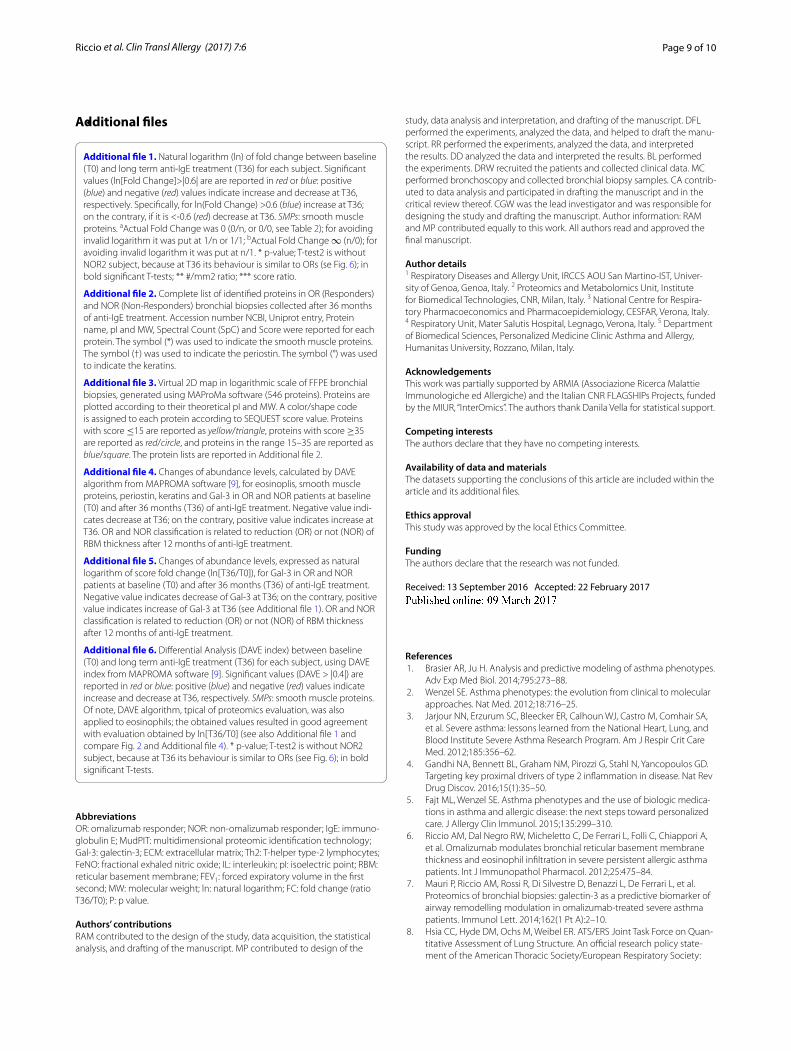
Clustering analysisProtein lists from the 36-month biopsy specimens were compared and used to perform an unsupervised clus-tering analysis. Thus, OR (Gal-3-positive), who were correctly segregated at T0 (see Fig. 6a), were again con-firmed to be part of the same group at 36 months. It is noteworthy that patient NOR2 was in this group. In addi-tion, the remaining three NOR patients (NOR1, NOR3, and NOR4, all Gal-3-negative) were segregated in a dif-ferent cluster (see Fig. 6b), thus confirming them to be part of the same NOR group again at 36 months of treat-ment. These findings confirm the different behavior at 36 months of patient NOR2, who was segregated with the OR group (see Table 2).
DiscussionBiomarkers of severe asthma are currently a major research area [14]. Nonetheless, available biomarkers [15] are still far from enabling us to select appropriate candi-dates for biologics [16, 17]. The need for molecular analy-sis to define phenotypes has been discussed [18], and omics sciences have been proposed as a useful approach [19].
In this context, current advances in proteomics, mainly those based on mass spectrometry, facilitate the discov-ery-driven studies of new biomarkers in respiratory dis-eases and improve the clinical reliability of biomarkers for asthma [20].
The main focus of the present study was the extension of the histological and proteomic analyses to 36 months in a group of patients with severe asthma treated with omalizumab that we had previously studied at baseline and at 12 months [6]. In the previous study, we did not have control biopsy specimens from untreated severe asthmatic patients and/or healthy persons, since bron-choscopy and bronchial biopsy are invasive procedures that are not readily applicable in these groups.
Although the number of samples was not large for the usual statistical analysis, the data obtained illustrate a specific trend for both groups of patients (OR and NOR). In particular, our results showed that specimens from OR patients (Gal-3-positive at baseline) confirm the reduc-tion in the thickness of bronchial RBM after 36 months of treatment with anti-IgE, thus emphasizing the possi-ble role of omalizumab in reducing airway remodeling in some cases of persistent allergic asthma [6]. As for molecular components, proteomic analysis showed that mainly ECM, keratin, and smooth muscle proteins were further reduced at 36 months of therapy in Gal-3-posi-tive biopsies.
Although Gal-3 was absent in OR at 36 months, this does not put OR in the same situation as NOR; in fact, OR presented a different proteomic profile, consistent
Fig. 3 Changes in abundance levels, expressed as the natural loga-rithm of the score fold change (ln[T36/T0]) for smooth muscle pro-teins (SMPs) in omalizumab responders (OR) and non-omalizumab responders (NOR) at baseline (T0) and after 36 months (T36) of treat-ment. A negative value indicates a decrease in SMPs at T36; a positive value indicates an increase in SMPs at T36. OR and NOR are classified according to whether they experienced a reduction in RBM thickness (OR) or no reduction in RBM thickness (NOR) after 12 months of anti-IgE treatment
Fig. 4 Changes in abundance levels, expressed as the natural loga-rithm of the score fold change (ln[T36/T0]) for keratins in omalizumab responders (OR) and non-omalizumab responders (NOR) at baseline (T0) and after 36 months (T36). A negative value indicates a decrease in keratins at T36; a positive value indicates an increase in keratins at T36. In this case, the p value is high; however, if NOR2 is excluded, the p value falls to 0.002 (Additional file 1). OR and NOR are classified according to whether they experienced a reduction in RBM thickness (OR) or no reduction in RBM thickness (NOR) after 12 months of anti-IgE treatment
Page 7 of 10Riccio et al. Clin Transl Allergy (2017) 7:6
with the reduction in RBM thickness and eosino-phil counts. In this context, the lack of Gal-3 in OR at 36 months, combined with the decrease in protein levels reported above, may be correlated with an improvement in remodelling and inflammatory state.
With respect to periostin, Hanania et al. [21] found that patients with high serum periostin had fewer exacerba-tions after treatment with omalizumab than patients with
low serum periostin. This predictive role for periostin was not confirmed in recent clinical trials [22]. In the present study, periostin was not consistently present in the bron-chial biopsies of either group, and levels decreased fur-ther only in OR after 36 months of treatment. Therefore, based on our data, periostin cannot be regarded as a pre-dictive biomarker of modulation of airway remodeling.
With regard to the bronchial inflammatory pat-tern, high eosinophil counts in the bronchi have been observed in patients who are eligible for anti-IgE [23] and can be considered one of the biomarkers of the Th2 asthma phenotype. Omalizumab is effective in the treat-ment of eosinophilic airway inflammation in patients with allergic asthma [24]. In the present study, a further decrease (compared with 12 months) in eosinophils in the biopsy specimens was detected in patients who were Gal-3-positive at baseline (OR), whereas eosino-phil counts increased in Gal-3-negative patients (NOR). These findings are consistent with recent data reporting increased and decreased Gal-3 levels in eosinophilic and neutrophilic asthma, respectively [25]. Gal-3 might also predict decreased eosinophilic inflammation in the bron-chi in patients receiving omalizumab.
Finally, the further decrease in smooth muscle proteins (i.e., actins and myosins) after 36 months is interesting and thus supports the hypothesis of improved pulmonary func-tion observed in some omalizumab-treated asthmatics [26].
If this was the case, Gal-3 would be a very useful tool for predicting clinical improvement in pulmonary function. This observation is of particular clinical interest, since the above-mentioned studies showed that, as far as FEV1 is
Fig. 5 Changes in abundance levels expressed as the natural loga-rithm of the score fold change (ln[T36/T0]) for periostin in omali-zumab responders (OR) and non-omalizumab responders (NOR) at baseline (T0) and after 36 months (T36) of anti-IgE treatment. A nega-tive value indicates a decrease in periostin at T36; a positive value indicates an increase in periostin at T36. OR and NOR are classified according to whether they experienced a reduction in RBM thickness (OR) or no reduction in RBM thickness (NOR) after 12 months of anti-IgE treatment
Table 2 Levels of eosinophils (cells/mm2) and abundance (score) for smooth muscle proteins, periostin, and keratins at baseline (T0) and after 36 months of anti-IgE treatment (T36)
Increased values (or substantially unchanged) at T36 compared to T0 are reported in italic. For more details about available proteins see Additional file 2
OR1 OR2 OR3 OR4 NOR1 NOR2 NOR3 NOR4
Eosinophils
T0 19 31 58 115 0 10 10 9
T36 3 9 4 5 11 3 20 27
Smooth muscle proteins
T0 288 80 198 494 0 0 20 0
T36 10 20 0 0 168 0 30 98
Periostin
T0 30 160 130 150 0 30 120 0
T36 0 0 0 0 20 0 106 20
Keratins
T0 1990 1902 1630 2047 1404 1910 1892 1676
T36 574 276 100 266 2106 40 1330 1400
Galectin-3
T0 10 10 30 20 0 0 0 0
T36 0 0 0 0 0 0 0 0
Page 8 of 10Riccio et al. Clin Transl Allergy (2017) 7:6
concerned, not all patients improved with omalizumab. In responsive patients, omalizumab can be considered a dis-ease-modifying treatment and Gal-3 a potential biomarker.
Our findings confirm the role of Gal-3 as a biomarker of long-term reduction in bronchial RBM, eosinophil inflammation, and muscular components in omali-zumab-treated severe asthmatics. In addition, our data support the molecular model, indicating that the pres-ence of Gal-3 may have a role in the dissociation of the IgE–FcεRI complex and enhance the effectiveness of anti-IgE therapy for remodelling in Gal-3-positive patients [7]. Further studies based on larger samples or a cellular model are required to confirm the role of Gal-3 in the dissociation of the IgE–FcεRI complex.
Bronchial analysis is useful for investigating the origin and mechanisms of disease; however, in clinical practice, it is necessary to analyze less invasive samples, such as urine and blood. We intend to perform such an analysis in the context of the PROXIMA study (Patient-Reported Outcomes and Xolair® In the Management of Asthma), an observational, multicenter, cross-sectional, prospec-tive cohort study conducted at 25 centers [27]. In fact,
PROXIMA involves an ancillary study to explore protein biomarkers in urine and plasma and to characterize them according to severe allergic asthma and treatment effects. In this context, the possible correlation between Gal-3 and evolution of pulmonary function with omalizumab will be investigated in greater depth.
ConclusionsWe investigated the long-term effects of anti-IgE treat-ment. In particular, proteomic signatures combined with histological data enabled us to confirm the following:
• In bronchial biopsy samples from severe asthmatics, Gal-3 acts as a biomarker of modulation of airway remodeling upon treatment with omalizumab.
• There seems to be a relationship between Gal-3 posi-tivity and improvement in pulmonary function.
• In severe asthmatics treated with omalizumab, Gal-3 is a sufficiently effective biomarker of both short- and long-term reduction in the thickening of bronchial RBM, eosinophilic inflammation, and fibrotic and muscular protein components.
OR
1
OR
2
OR
4
OR
3
NO
R1
NO
R4
NO
R2
NO
R3
OR
1
OR
2
OR
4
OR
3
NO
R1
NO
R4
NO
R2
NO
R3
OR
1
OR
2
OR
4
OR
3N
OR
1N
OR
1
NO
R2
NO
R3
a Baseline
b After 36-months
OR
1
OR
2
OR
4
NO
R1
NO
R3
NO
R4
OR
2
OR
3
OR
1
OR
4
NO
R2
Fig. 6 Unsupervised hierarchical clustering of protein lists obtained by analyzing lung biopsies from omalizumab responders (OR, blue) and non-omalizumab responders (NOR, red). a Before (baseline). b After 36 months of anti-IgE treatment. The clusters obtained were based on SEQUEST score value and proved to be well structured (agglomerative coefficients >0.7). OR and NOR are classified according to whether they experienced a reduction in RBM thickness (OR) or no reduction in RBM thickness (NOR) after 12 months of anti-IgE treatment
Page 9 of 10Riccio et al. Clin Transl Allergy (2017) 7:6
•
AbbreviationsOR: omalizumab responder; NOR: non-omalizumab responder; IgE: immuno-globulin E; MudPIT: multidimensional proteomic identification technology; Gal-3: galectin-3; ECM: extracellular matrix; Th2: T-helper type-2 lymphocytes; FeNO: fractional exhaled nitric oxide; IL: interleukin; pI: isoelectric point; RBM: reticular basement membrane; FEV1: forced expiratory volume in the first second; MW: molecular weight; ln: natural logarithm; FC: fold change (ratio T36/T0); P: p value.
Authors’ contributionsRAM contributed to the design of the study, data acquisition, the statistical analysis, and drafting of the manuscript. MP contributed to design of the
Additional files
Additional file 1. Natural logarithm (ln) of fold change between baseline (T0) and long term anti-IgE treatment (T36) for each subject. Significant values (ln[Fold Change]>|0.6| are are reported in red or blue: positive (blue) and negative (red) values indicate increase and decrease at T36, respectively. Specifically, for ln(Fold Change) >0.6 (blue) increase at T36; on the contrary, if it is <-0.6 (red) decrease at T36. SMPs: smooth muscle proteins. aActual Fold Change was 0 (0/n, or 0/0, see Table 2); for avoiding invalid logarithm it was put at 1/n or 1/1; bActual Fold Change ∞ (n/0); for avoiding invalid logarithm it was put at n/1. * p-value; T-test2 is without NOR2 subject, because at T36 its behaviour is similar to ORs (se Fig. 6); in bold significant T-tests; ** #/mm2 ratio; *** score ratio.
Additional file 2. Complete list of identified proteins in OR (Responders) and NOR (Non-Responders) bronchial biopsies collected after 36 months of anti-IgE treatment. Accession number NCBI, Uniprot entry, Protein name, pI and MW, Spectral Count (SpC) and Score were reported for each protein. The symbol (*) was used to indicate the smooth muscle proteins. The symbol (†) was used to indicate the periostin. The symbol (°) was used to indicate the keratins.
Additional file 3. Virtual 2D map in logarithmic scale of FFPE bronchial biopsies, generated using MAProMa software (546 proteins). Proteins are plotted according to their theoretical pI and MW. A color/shape code is assigned to each protein according to SEQUEST score value. Proteins with score ≤15 are reported as yellow/triangle, proteins with score ≥35 are reported as red/circle, and proteins in the range 15–35 are reported as blue/square. The protein lists are reported in Additional file 2.
Additional file 4. Changes of abundance levels, calculated by DAVE algorithm from MAPROMA software [9], for eosinoplis, smooth muscle proteins, periostin, keratins and Gal-3 in OR and NOR patients at baseline (T0) and after 36 months (T36) of anti-IgE treatment. Negative value indi-cates decrease at T36; on the contrary, positive value indicates increase at T36. OR and NOR classification is related to reduction (OR) or not (NOR) of RBM thickness after 12 months of anti-IgE treatment.
Additional file 5. Changes of abundance levels, expressed as natural logarithm of score fold change (ln[T36/T0]), for Gal-3 in OR and NOR patients at baseline (T0) and after 36 months (T36) of anti-IgE treatment. Negative value indicates decrease of Gal-3 at T36; on the contrary, positive value indicates increase of Gal-3 at T36 (see Additional file 1). OR and NOR classification is related to reduction (OR) or not (NOR) of RBM thickness after 12 months of anti-IgE treatment.
Additional file 6. Differential Analysis (DAVE index) between baseline (T0) and long term anti-IgE treatment (T36) for each subject, using DAVE index from MAPROMA software [9]. Significant values (DAVE > |0.4|) are reported in red or blue: positive (blue) and negative (red) values indicate increase and decrease at T36, respectively. SMPs: smooth muscle proteins. Of note, DAVE algorithm, tpical of proteomics evaluation, was also applied to eosinophils; the obtained values resulted in good agreement with evaluation obtained by ln[T36/T0] (see also Additional file 1 and compare Fig. 2 and Additional file 4). * p-value; T-test2 is without NOR2 subject, because at T36 its behaviour is similar to ORs (see Fig. 6); in bold significant T-tests.
study, data analysis and interpretation, and drafting of the manuscript. DFL performed the experiments, analyzed the data, and helped to draft the manu-script. RR performed the experiments, analyzed the data, and interpreted the results. DD analyzed the data and interpreted the results. BL performed the experiments. DRW recruited the patients and collected clinical data. MC performed bronchoscopy and collected bronchial biopsy samples. CA contrib-uted to data analysis and participated in drafting the manuscript and in the critical review thereof. CGW was the lead investigator and was responsible for designing the study and drafting the manuscript. Author information: RAM and MP contributed equally to this work. All authors read and approved the final manuscript.
Author details1 Respiratory Diseases and Allergy Unit, IRCCS AOU San Martino-IST, Univer-sity of Genoa, Genoa, Italy. 2 Proteomics and Metabolomics Unit, Institute for Biomedical Technologies, CNR, Milan, Italy. 3 National Centre for Respira-tory Pharmacoeconomics and Pharmacoepidemiology, CESFAR, Verona, Italy. 4 Respiratory Unit, Mater Salutis Hospital, Legnago, Verona, Italy. 5 Department of Biomedical Sciences, Personalized Medicine Clinic Asthma and Allergy, Humanitas University, Rozzano, Milan, Italy.
AcknowledgementsThis work was partially supported by ARMIA (Associazione Ricerca Malattie Immunologiche ed Allergiche) and the Italian CNR FLAGSHIPs Projects, funded by the MIUR, “InterOmics”. The authors thank Danila Vella for statistical support.
Competing interestsThe authors declare that they have no competing interests.
Availability of data and materialsThe datasets supporting the conclusions of this article are included within the article and its additional files.
Ethics approvalThis study was approved by the local Ethics Committee.
FundingThe authors declare that the research was not funded.
Received: 13 September 2016 Accepted: 22 February 2017
References 1. Brasier AR, Ju H. Analysis and predictive modeling of asthma phenotypes.
Adv Exp Med Biol. 2014;795:273–88. 2. Wenzel SE. Asthma phenotypes: the evolution from clinical to molecular
approaches. Nat Med. 2012;18:716–25. 3. Jarjour NN, Erzurum SC, Bleecker ER, Calhoun WJ, Castro M, Comhair SA,
et al. Severe asthma: lessons learned from the National Heart, Lung, and Blood Institute Severe Asthma Research Program. Am J Respir Crit Care Med. 2012;185:356–62.
4. Gandhi NA, Bennett BL, Graham NM, Pirozzi G, Stahl N, Yancopoulos GD. Targeting key proximal drivers of type 2 inflammation in disease. Nat Rev Drug Discov. 2016;15(1):35–50.
5. Fajt ML, Wenzel SE. Asthma phenotypes and the use of biologic medica-tions in asthma and allergic disease: the next steps toward personalized care. J Allergy Clin Immunol. 2015;135:299–310.
6. Riccio AM, Dal Negro RW, Micheletto C, De Ferrari L, Folli C, Chiappori A, et al. Omalizumab modulates bronchial reticular basement membrane thickness and eosinophil infiltration in severe persistent allergic asthma patients. Int J Immunopathol Pharmacol. 2012;25:475–84.
7. Mauri P, Riccio AM, Rossi R, Di Silvestre D, Benazzi L, De Ferrari L, et al. Proteomics of bronchial biopsies: galectin-3 as a predictive biomarker of airway remodelling modulation in omalizumab-treated severe asthma patients. Immunol Lett. 2014;162(1 Pt A):2–10.
8. Hsia CC, Hyde DM, Ochs M, Weibel ER. ATS/ERS Joint Task Force on Quan-titative Assessment of Lung Structure. An official research policy state-ment of the American Thoracic Society/European Respiratory Society:
Page 10 of 10Riccio et al. Clin Transl Allergy (2017) 7:6
• We accept pre-submission inquiries
• Our selector tool helps you to find the most relevant journal
• We provide round the clock customer support
• Convenient online submission
• Thorough peer review
• Inclusion in PubMed and all major indexing services
• Maximum visibility for your research
Submit your manuscript atwww.biomedcentral.com/submit
Submit your next manuscript to BioMed Central and we will help you at every step:
standards for quantitative assessment of lung structure. Am J Respir Crit Care Med. 2010;181:394–418.
9. Chetta A, Zanini A, Foresi A, Del Donno M, Castagnaro A, D’Ippolito R, et al. Vascular component of airway remodeling in asthma is reduced by high dose of fluticasone. Am J Respir Crit Care Med. 2003;167:751–7.
10. Mauri P, Scigelova M. Multidimensional protein identification technology for clinical proteomic analysis. Clin Chem Lab Med. 2009;47:636–46.
11. Zhao Y, Karypis G. Data clustering in life sciences. Mol Biotechnol. 2005;31:55–80.
12. Vigani G, Di Silvestre D, Agresta AM, Donnini S, Mauri P, Gehl C et al. Molybdenum and iron mutually impact their homeostasis in cucumber (Cucumis sativus) plants. New Phytol. 2017;213(3):1222–41.
13. Mauri P, Dehò G. A proteomic approach to the analysis of RNA degrado-some composition in Escherichia coli. Methods Enzymol. 2008;447:99–117.
14. Arron JR, Choy DF, Scheerens H, Matthews JG. Noninvasive biomarkers that predict treatment benefit from biologic therapies in asthma. Ann Am Thorac Soc. 2013;10(Suppl):S206–13.
15. Leung TF, Ko FW, Wong GW. Recent advances in asthma biomarker research. Ther Adv Respir Dis. 2013;7:297–308.
16. Chung KF. New treatments for severe treatment-resistant asthma: target-ing the right patient. Lancet Respir Med. 2013;1:639–52.
17. De Ferrari L, Chiappori A, Bagnasco D, Riccio AM, Passalacqua G, Canonica GW. Molecular phenotyping and biomarker development: Are we on our way towards targeted therapy for severe asthma? Expert Rev Respir Med. 2016;10:29–38.
18. Wenzel SE. Complex phenotypes in asthma: current definitions. Pulm Pharmacol Ther. 2013;26:710–5.
19. Holgate ST. Trials and tribulations in identifying new biologic treatments for asthma. Trends Immunol. 2012;33:238–46.
20. Rossi R, De Palma A, Benazzi L, Riccio AM, Canonica GW, Mauri P. Biomarker discovery in asthma and COPD by proteomic approaches. Proteomics Clin Appl. 2014;8:901–15.
21. Hanania NA, Wenzel S, Rosen K, Hsieh HJ, Mosesova S, Choy DF, et al. Exploring the effects of omalizumab in allergic asthma: an analysis of bio-markers in the EXTRA study. Am J Respir Crit Care Med. 2013;187:804–11.
22. Hanania NA, Korenblat P, Chapman KR, Bateman ED, Kopecky P, Paggiaro P, et al. Efficacy and safety of lebrikizumab in patients with uncontrolled asthma (LAVOLTA I and LAVOLTA II): replicate, phase 3, randomised, dou-ble-blind, placebo-controlled trials. Lancet Respir Med. 2016;4:781–96.
23. Busse W, Spector S, Rosén K, Wang Y, Alpan O. High eosinophil count: a potential biomarker for assessing successful omalizumab treatment effects. J Allergy Clin Immunol. 2013;132:485–6.
24. Djukanović R, Wilson SJ, Kraft M, Jarjour NN, Steel M, Chung KF. Effects of treatment with anti-immunoglobulin E antibody omalizumab on airway inflammation in allergic asthma. Am J Respir Crit Care Med. 2004;170:583–93.
25. Gao P, Gibson PG, Baines KJ, Yang IA, Upham JW, Reynolds PN, Hodge S, James AL, Jenkins C, Peters MJ, Zhang J, Simpson JL. Anti-inflammatory deficiencies in neutrophilic asthma: reduced galectin-3 and IL-1RA/IL-1β. Respir Res. 2015;24(16):5.
26. Baena-Cagnani CE, Teijeiro A, Canonica GW. Four-year follow-up in children with moderate/severe uncontrolled asthma after withdrawal of a 1-year omalizumab treatment. Curr Opin Allergy Clin Immunol. 2015;15:267–71.
27. Chiappori A, De Ferrari L, Folli C, Mauri P, Riccio AM, Canonica GW. Biomarkers and severe asthma: a critical appraisal. Clin Mol Allergy. 2015;13:20.