Embed Size (px)
Citation preview
Preliminary Statistics of the Census of Buildings and
Persons Affected by the Tsunami – 2004
(In this report, statistics are given only for the affected
Grama Niladhari divisions)
GALLE DISTRICT
Department of Census and Statistics - 2005
P R E F A C E The December 26th earthquake and tsunami that hit many parts of Asia and East Africa
was the most devastating natural disaster to occur in years. Sri Lanka is one of the badly
affected countries in Asia.
In order to provide information on the impact of Tsunami on Sri Lanka, the Department
of Census and Statistics is conducting a census covering the census blocks affected by the
disaster. This census has been designed to provide much needed information for planning
of rebuilding Tsunami affected areas and it is being conducted in two stages. During the
stage 1, all the buildings in the affected census blocks are listed. Data on a few key
indicators on the affected buildings and persons are also collected at this stage. Detail
information is collected during the second stage. Statistics compiled for the Galle district,
based on the data collected during the listing stage are given in this publication.
Comprehensive report giving detail information on the impact will be released shortly.
I am thankful to the staff of my department at all levels, who got involved in this census,
for their contributions to conduct the census successfully. Willingly, they worked so hard
making it possible to releases the statistics within very short period of time. To provide
quick access, these statistics are also published in the department’s website
(www.statistics.gov.lk).
I hope the information presented in this publication, would be useful for planners and
decision makers for rebuilding the country devastated by the Tsunami – 2004.
A. G. W. Nanayakkara
Director General
Department of Census and Statistics
10th February 2004
No. Page
i 2
ii4
1 Introduction6
2 13Preliminary Statistics of the Census of Buildings and Persons Affected by the Tsunami -2004
C O N T E N T S
Table
Preface
List of tables

No. Page
1 13
14
15
16
17
18
19
2 21
22
23
24
25
28
27
3 29
30
31
32
33
34
35
3.1e: Habaraduwa DS division 3.1f: Hikkaduwa DS division
3.1a: Bentota DS division 3.1b: Balapitiya DS division 3.1c: Galle Four Gravets DS division3.1d: Ambalangoda DS division
2.1a: Bentota DS division 2.1b: Balapitiya DS division
Population in the affected census blocks before and after Tsunami 2004 by DS division
Population in the affected census blocks before and after Tsunami 2004 by GN division
2.1c: Galle Four Gravets DS division2.1d: Ambalangoda DS division 2.1e: Habaraduwa DS division 2.1f: Hikkaduwa DS division
1.1a: Bentota DS division 1.1b: Balapitiya DS division
Number of buildings other than housing units of affected census blocks, before and after Tsunami by DS division
Number of buildings other than housing units of affected census blocks, before and after Tsunami by GN division
1.1c: Galle Four Gravets DS division1.1d: Ambalangoda DS division 1.1e: Habaraduwa DS division 1.1f: Hikkaduwa DS division
List of tables
Table
Number of housing units of affected census blocks, before and after Tsunami 2004 by DS division
Number of housing units before and after Tsunami 2004 by affected GN division

Census of Buildings and Persons Affected by the Tsunami – 2004
1. Introduction 26th of December 2004, was an unforgettable day for all Sri Lankans as well as for the whole world. On that fateful day, tidal waves struck the Eastern and Southern coasts of Sri Lanka as well as parts of Northern and Western coasts sweeping people away, causing flooding and destruction of infrastructure. The tidal waves were caused by a series of earthquakes, measuring 8.9 on the Richter scale that occurred in the sea near Sumatra, Indonesia. The other neighboring countries affected by this Tsunami were Indonesia, India, Maldives, Somalia and Thailand. Since many Sri Lankans did not have any pervious experience of this nature, the damage caused to their lives were unbelievable. Thousands of people were displaced and disappeared or killed within a very short time. Many institutions have adopted various methods to measure the damage caused by this calamity soon after the disaster. As there was no uniformity in the methodologies adopted the figures were found to be different from each other. As such, the Department of Census and Statistics (DCS), as the main government institution responsible in collecting, compiling, analysing and disseminating unbiased and reliable information in Sri Lanka, decided to conduct this special Census to collect information on people, housing units and other buildings, affected. For proper planning to rebuild the areas devastated by Tsunami and to assist the people affected, it is essential to have reliable information down to the lowest possible administrative units and even at individual level. The information collected in the census will be extremely useful to the policy makers, planners, international agencies and other donor agencies as well as other authorised agencies, which are genuinely interested in helping to rebuild the affected areas and in assisting the people affected to restart their normal lives. While the infrastructure development should benefit everyone, in the affected areas, it is essential to ensure that any assistance to families or individuals, goes to the right people, who are really affected and deserving. As such, DCS is taking every effort to collect the information as accurate as possible to ensure that no genuine person or family will be missed from the enumeration. As the objective of this census is to assist the people affected and to develop the areas devastated, it may be necessary to use the information collected at individual level. As such this Census is not conducted under the ‘Census Ordinance’, like in the case of any normal census. If the information is collected under the ‘Census Ordinance’, it will not be possible to use any individual information and therefore will not be useful in assisting the people affected.
Following Districts in the five Provinces have been affected.
Southern Province : Galle,Matara,Hambantota Western Province : Kalutara, Gampaha, Colombo Eastern Province : Ampara, Batticaloa, Trincomalee Northern Province : Jaffna, Mullativu, Killinochchi North Western Province : Puttalam
Altogether 13 Districts out of the 14 Districts in the coastal belt of Sri Lanka have reported to be affected by the waves. The DCS is conducting this Census only in the areas directly affected by Tsunami. However, there are affected people from different areas who were living outside the areas directly affected. (i) The people who were unfortunately travelling in the coastal belt in the Western, Southern, Eastern or Northern regions, (ii) The People who were staying in Hotels or with friends/ relatives in the affected areas, at the time of the disaster, (iii) The people from areas closer to the affected areas, who happened to be in the affected areas at the time of disaster, are also innocent victims of this natural disaster, which has affected lives of many people. Administrative setup of the country For administrative convenience, Sri Lanka has been divided to 9 Provinces. These Provinces are again sub divided in to 25 Districts. Each District is divided in to Divisional Secretariat (DS) Division depending on the population size of the area. Each DS Division consists of several Grama Niladhari (GN) Divisions, which is the lowest level of administrative area. Currently there are 324 DS Divisions and 14,008 GN Divisions. 2. Method of Data Collection: Data collection of a natural disaster of this scale is a new challenge and experience even to the Department of Census and Statistics (DCS). Due to the complexity of the Tsunami disaster, several steps had to be planned and adopted to collect accurate and reliable data. The procedure adopted to conduct the Census in the affected areas is described below.
♦ DCS has identified all the Grama Niladara Divisions (GND) in each District, affected by Tsunami (Already all such (GND) have been marked on maps electronically).
♦ The lists (F1 - From) of Housing Units and Other Buildings (which were prepared
for the Census 2001) pertaining to the affected Census Blocks of the affected GN Divisions, have been extracted and photocopied from the available records.
Census Block and F1 form In order to conduct the Census of Population and Housing in 2001, the GN Divisions were again sub divided in to several Census Blocks (CB). CB is an area within the GN Division which consists of about 80 housing units in Urban areas and about 65 units in Rural or Estate areas. The criteria for developing a CB is that one enumerator could visit all the units in one CB within 6 hours to take counts in those units in the census night. Lists of units for each CB with sketch map were prepared and stored in the DCS for conducting surveys in the future. The sketch map helps to identify the Housing Units and other Buildings, because the Serial Number of the Units are indicated in the map and the units are numbered in a sequence according to the lie of land. This list is called ‘F1’ form. The total number of such F1 forms prepared for entire Sri Lanka in this manner is around 125,000 and these are referred as CB frame. If one needs to do a survey, the selected lists should be extracted and updated before conducting the survey. The F1- Form has the following basic information .
a. Census Units No: b. Postal Address: c. Name of the Chief Occupant/Person in-charge of the Business/Owner d. Description of the Unit (Whether a ‘Housing Unit’; ‘Collective Living Quarters’;
Institute or Non – Housing Unit.) e. Number of Persons usually spending the night in the unit. f. Whether any one residing in the unit operates Agricultural Land or Livestock g. Whether any one residing in the unit is engaged in Fishing as an Occupation. h. Whether any one residing in the unit engaged in Non – Agricultural Economic
Activities. (If so details) Updating F1 form F1 form prepared as at 2001 contains names (name of head of household or owner of the business unit) and addresses of all the buildings in the CB. This has to be updated to contain all the units as at 26th of December 2004, just before Tsunami disaster. Updating has to be done by visiting the GN Division where CB is located. First, the boundaries of the CB is identified according to the map given in F1 form. One has to start from the first building unit in the block identifying the buildings according to the serial number given in the form. It has to be updated by including new buildings which were built after 2001 and deleting the buildings which were demolished between 2001 and just before Tsunami. While this operation is being done, buildings are identified as one of the categories out of four, Housing Units, Collective Living Quarters, Institutions or Non-Housing Units.

3. New listing form A New List of Units for Areas Affected by TSUNAMI was completed by the staff of the DCS. The copies of F1 – Forms were used as guides to identify the units. The New List of Units were prepared very carefully, by visiting the affected areas, with the copies of the F1 – Forms.
The contents of the New List of Units (RF1 - Form) for Areas Affected by TSUNAMI is given below.
a. Postal Address before the disaster b. Name of the head before the disaster c. Description of the Unit before the disaster (i.e. Housing Unit (HU); Living Quarter
other than Housing Unit (LQ); Institute (INS); Non – Housing Unit (NHU)) d. Whether the Unit is still Existing e. Present Status of the Unit (Completely Damaged; Partially Damaged (Can not be
used); Partially Damaged (can be used); not Damaged) f. No. of Persons lived (Before Tsunami) g. No. of Persons presently living h. Where do the usual residents of the Unit now living (In the unit; With
friends/relatives; Camp; other) i. Economic Activity (EA) of the unit j. Whether the EA still being carried –out k. Address if living elsewhere
Once the preparation of the above list is completed for each District, following more detailed information is collected. 4. Detail information collected from Housing Units
A. Information on Persons Currently living in the Unit a. Name of each person currently living in the HU b. Relationship to Head of Household (HH) c. Sex. d. Age (years) e. Whether the person got injured/disabled or ill due to Tsunami f. If so, the nature of disability, injury or illness g. Occupation before the disaster h. Whether the person is able to engage in the Occupation after the disaster i. Whether Studying in school or other Educational Institute (for persons aged 3-34
years j. Whether the parents of child (for children below 18 years): (1- Both parents living; 2-
father has died; 3 – mother has died; 4- both have died)
B.Information on persons who have died or still considered missing due to Tsunami
a. Name of the person b. Whether dead or missing c. Relationship to Head (before disaster) d. Sex/ e. Age (years) f. Whether missing or dead person had been physically disabled g. Occupation or Economic Activity before the disaster h. Whether attended school or educational institute before the disaster
C. Housing Information
a. Present status of the Unit (1-Completely Damaged; 2- Partially damaged (can not be used); 3- Partially damaged (can be used); 4- Not damaged)
b. Distance from the beach to the Housing Unit c. The height which the Housing Unit was submerged d. Condition of the Housing Unit e. Number of rooms in the Housing Unit f. Total floor area of the Housing Unit g. Time since the Housing Unit was constructed h. Whether sanitary facilities available i. Whether drinking water is currently available in the Housing Unit j. Size of the land in which the Housing Unit is located k. Ownership of the land l. Whether the head of household has an alternative land to build a house m. Properties destroyed due to Tsunami (belonging to the members of the former
Housing Unit) n. Total cost of the damaged property
5. Detail information collected from Non-Housing Units Information of the building
a. Address of the location of the building b. Information on the unit according to RF1 column 4 c. Activities carried out in the unit d. Ownership of the unit e. Current condition of the building f. Distance between the building unit and the beach g. The height which the building unit was submerged h. Condition of the building

i. Number of storeys in the building j. Number of rooms in the building k. Total floor area of the building l. Size of the land in which the building is located m. Ownership of the land n. Is there any alternative land to build a new building o. The damage caused to the building and the economic activity carried out in the
building
6. Definitions of ‘Housing Unit’ and ‘Non Housing Unit’ (Same definitions used in Census of Population and Housing - 2001) Housing unit The following 3 conditions should be satisfied in order to consider a building unit as a housing unit.
a. It should be a place of dwelling of human beings. b. It should be separated from other places of dwelling. c. It should have separate entrance.
Under this definition any building or a part of a building or any structure whether permanent or temporary such as huts, shanties, sheds etc., which are in fact used as place of residence were regarded as housing units. Collective Living Quarters A place where two or more unrelated persons share common living arrangement is considered as a collective living quarter. Institution This is a special case of collective living quarters, designed to house groups of persons who are bound by either a common public objective or a common personal interest under the supervision of a central authority sharing common living arrangements. Non-Housing Unit Every building or part of a building which is not used as a place of dwelling is a non housing unit. eg : office, petrol filling station, shop etc.
7. What is captured by this Census The main objective of this Census is to collect detail information on housing units and other buildings (hospitals, schools, hotels and restaurants, shops etc.) which were damaged Tsunami devastation. This information will be useful for policy makers and planners to decide how many new houses have to be constructed, in which area and for whom etc. Similarly using the information collected from other buildings (specially buildings in which economic activities were carried out), the extent of damage caused by Tsunami to these economic activities and loss of employment can be evaluated in order to use in the rebuilding process of this area. Following are captured by this Census
a. Buildings (Housing Units and other buildings) damaged by Tsunami b. Persons who died and who were residing in damaged houses c. Persons whose houses are damaged and lost employment d. Household assets of those whose houses are damaged e. Assets of their economic activity (eg. boats, fishing nets etc. of fisherman) of those
whose houses are damaged f. Children who were residing in damaged houses at the time of Tsunami and lost their
parents (mother, father or both) g. Attempts will also be made to fill the gaps using administrative records available in
other institutions.
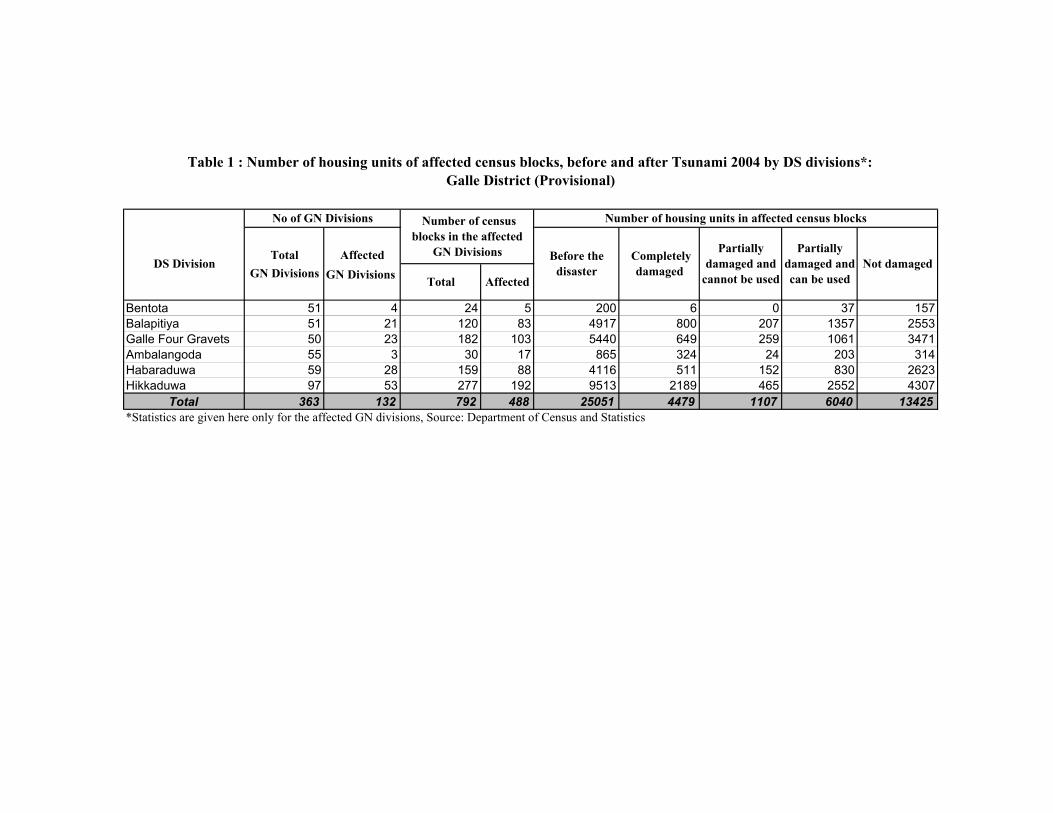
Total AffectedGN Divisions GN Divisions
Bentota 51 4 24 5 200 6 0 37 157Balapitiya 51 21 120 83 4917 800 207 1357 2553Galle Four Gravets 50 23 182 103 5440 649 259 1061 3471Ambalangoda 55 3 30 17 865 324 24 203 314Habaraduwa 59 28 159 88 4116 511 152 830 2623Hikkaduwa 97 53 277 192 9513 2189 465 2552 4307
Total 363 132 792 488 25051 4479 1107 6040 13425*Statistics are given here only for the affected GN divisions, Source: Department of Census and Statistics
Table 1 : Number of housing units of affected census blocks, before and after Tsunami 2004 by DS divisions*: Galle District (Provisional)
Number of census blocks in the affected
GN Divisions
Number of housing units in affected census blocks
DS DivisionPartially
damaged and can be used
Not damagedTotal Affected
Completely damaged
Partially damaged and
cannot be used
Before the disaster
No of GN Divisions
Number of Census Blocks
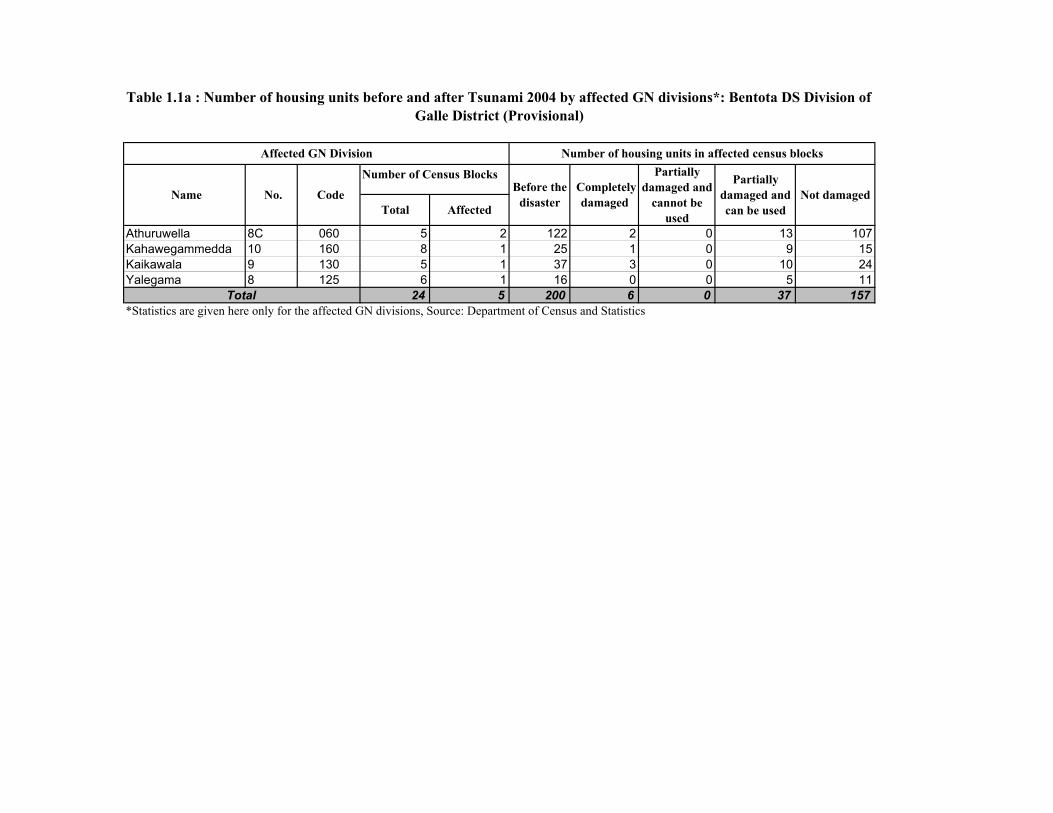
Athuruwella 8C 060 5 2 122 2 0 13 107Kahawegammedda 10 160 8 1 25 1 0 9 15Kaikawala 9 130 5 1 37 3 0 10 24Yalegama 8 125 6 1 16 0 0 5 11
24 5 200 6 0 37 157*Statistics are given here only for the affected GN divisions, Source: Department of Census and Statistics
Code Name No.
Total
Table 1.1a : Number of housing units before and after Tsunami 2004 by affected GN divisions*: Bentota DS Division of Galle District (Provisional)
Number of housing units in affected census blocks
Partially damaged and can be used
Not damagedTotal Affected
Partially damaged and
cannot be used
Affected GN Division
Before the disaster
Completely damaged
Number of Census Blocks
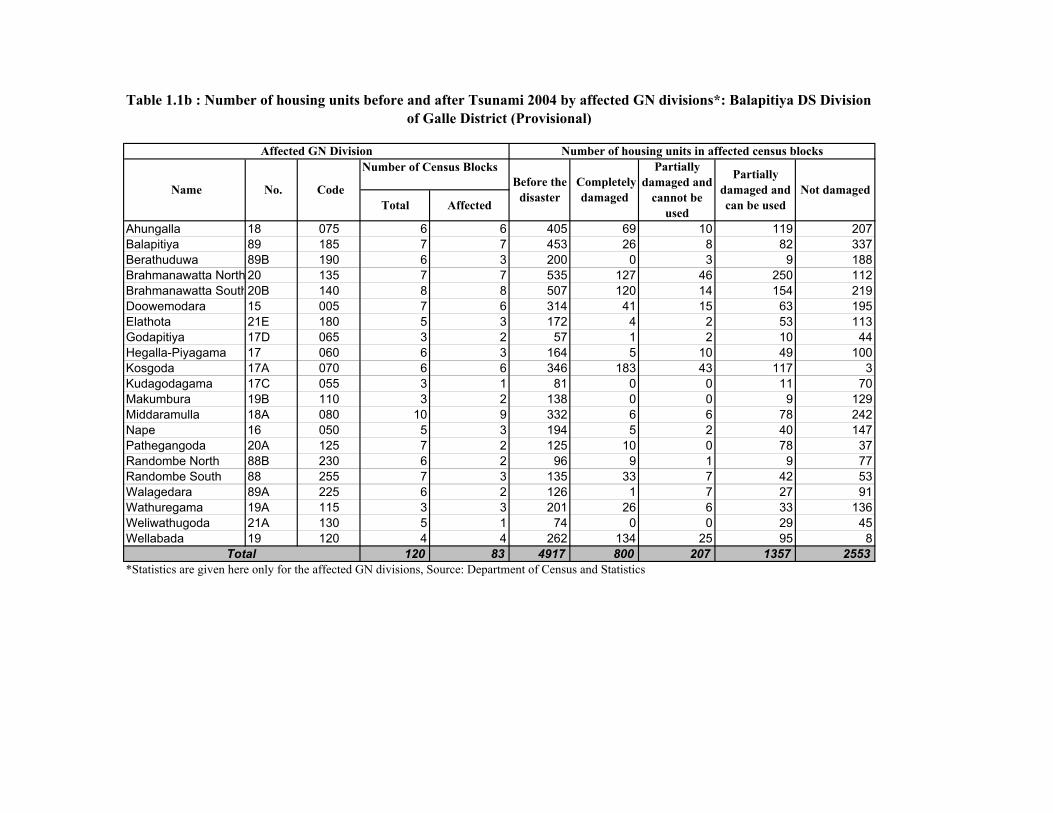
Ahungalla 18 075 6 6 405 69 10 119 207Balapitiya 89 185 7 7 453 26 8 82 337Berathuduwa 89B 190 6 3 200 0 3 9 188Brahmanawatta North 20 135 7 7 535 127 46 250 112Brahmanawatta South20B 140 8 8 507 120 14 154 219Doowemodara 15 005 7 6 314 41 15 63 195Elathota 21E 180 5 3 172 4 2 53 113Godapitiya 17D 065 3 2 57 1 2 10 44Hegalla-Piyagama 17 060 6 3 164 5 10 49 100Kosgoda 17A 070 6 6 346 183 43 117 3Kudagodagama 17C 055 3 1 81 0 0 11 70Makumbura 19B 110 3 2 138 0 0 9 129Middaramulla 18A 080 10 9 332 6 6 78 242Nape 16 050 5 3 194 5 2 40 147Pathegangoda 20A 125 7 2 125 10 0 78 37Randombe North 88B 230 6 2 96 9 1 9 77Randombe South 88 255 7 3 135 33 7 42 53Walagedara 89A 225 6 2 126 1 7 27 91Wathuregama 19A 115 3 3 201 26 6 33 136Weliwathugoda 21A 130 5 1 74 0 0 29 45Wellabada 19 120 4 4 262 134 25 95 8
120 83 4917 800 207 1357 2553*Statistics are given here only for the affected GN divisions, Source: Department of Census and Statistics
Table 1.1b : Number of housing units before and after Tsunami 2004 by affected GN divisions*: Balapitiya DS Division of Galle District (Provisional)
Code Name No.
Total
Affected GN Division
Total
Number of housing units in affected census blocks
Affected
Before the disaster
Completely damaged
Partially damaged and
cannot be used
Not damagedPartially
damaged and can be used
Number of Census Blocks
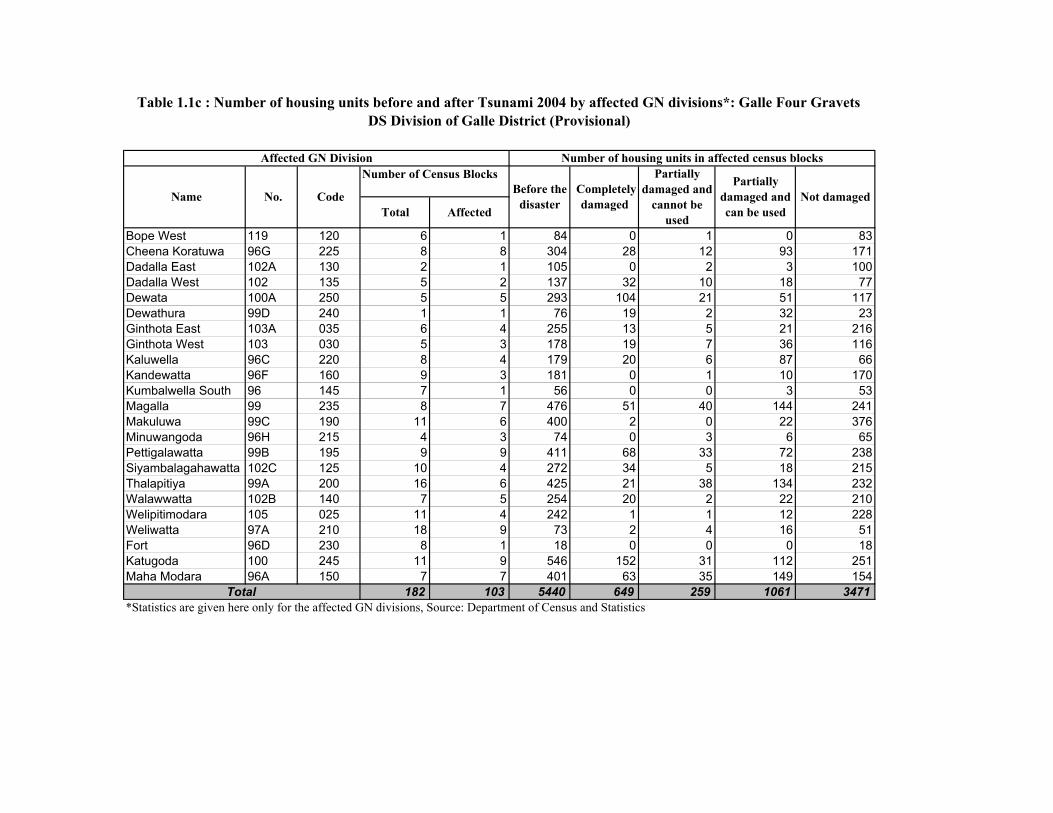
Bope West 119 120 6 1 84 0 1 0 83Cheena Koratuwa 96G 225 8 8 304 28 12 93 171Dadalla East 102A 130 2 1 105 0 2 3 100Dadalla West 102 135 5 2 137 32 10 18 77Dewata 100A 250 5 5 293 104 21 51 117Dewathura 99D 240 1 1 76 19 2 32 23Ginthota East 103A 035 6 4 255 13 5 21 216Ginthota West 103 030 5 3 178 19 7 36 116Kaluwella 96C 220 8 4 179 20 6 87 66Kandewatta 96F 160 9 3 181 0 1 10 170Kumbalwella South 96 145 7 1 56 0 0 3 53Magalla 99 235 8 7 476 51 40 144 241Makuluwa 99C 190 11 6 400 2 0 22 376Minuwangoda 96H 215 4 3 74 0 3 6 65Pettigalawatta 99B 195 9 9 411 68 33 72 238Siyambalagahawatta 102C 125 10 4 272 34 5 18 215Thalapitiya 99A 200 16 6 425 21 38 134 232Walawwatta 102B 140 7 5 254 20 2 22 210Welipitimodara 105 025 11 4 242 1 1 12 228Weliwatta 97A 210 18 9 73 2 4 16 51Fort 96D 230 8 1 18 0 0 0 18Katugoda 100 245 11 9 546 152 31 112 251Maha Modara 96A 150 7 7 401 63 35 149 154
182 103 5440 649 259 1061 3471*Statistics are given here only for the affected GN divisions, Source: Department of Census and Statistics
Affected Name No. Code
Affected GN Division
Total
Partially damaged and can be used
Table 1.1c : Number of housing units before and after Tsunami 2004 by affected GN divisions*: Galle Four Gravets DS Division of Galle District (Provisional)
Total
Completely damaged
Partially damaged and
cannot be used
Number of housing units in affected census blocks
Before the disaster Not damaged
Number of Census Blocks
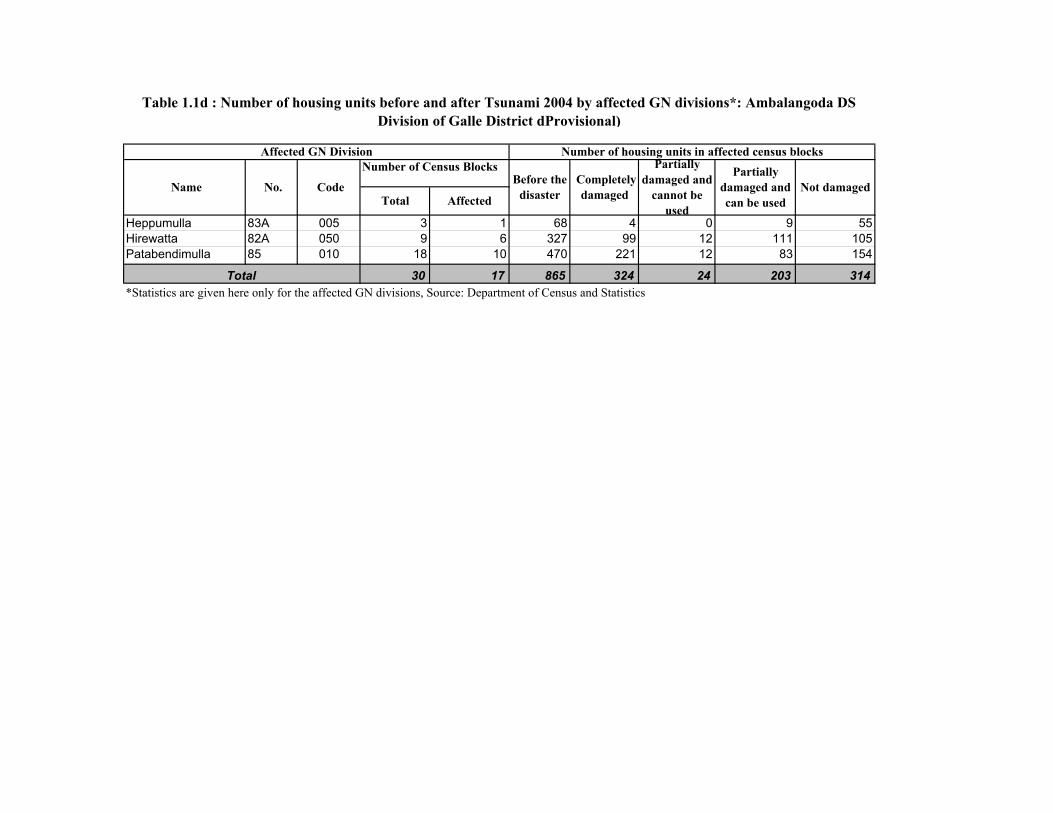
Heppumulla 83A 005 3 1 68 4 0 9 55Hirewatta 82A 050 9 6 327 99 12 111 105Patabendimulla 85 010 18 10 470 221 12 83 154
30 17 865 324 24 203 314*Statistics are given here only for the affected GN divisions, Source: Department of Census and Statistics
Code
Table 1.1d : Number of housing units before and after Tsunami 2004 by affected GN divisions*: Ambalangoda DS Division of Galle District dProvisional)
Number of housing units in affected census blocks
Before the disaster Not damaged
Total Affected
Total
Name No.
Affected GN Division
Completely damaged
Partially damaged and
cannot be used
Partially damaged and can be used
Number of Census Blocks
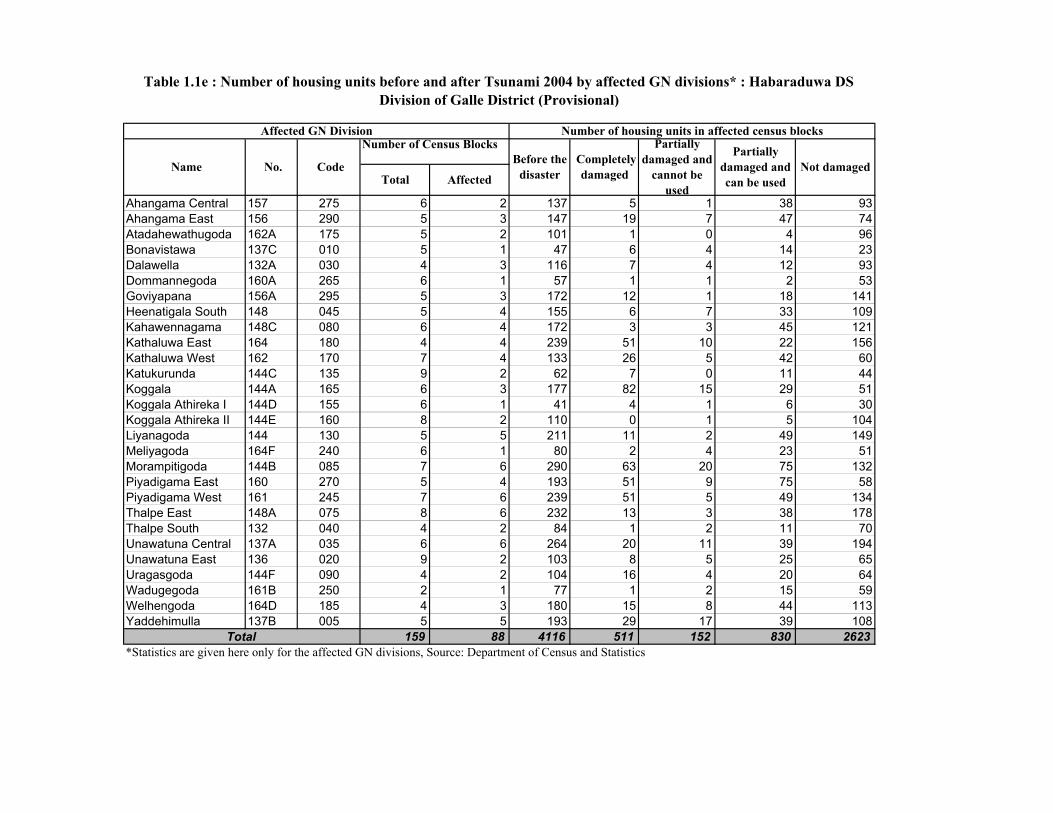
Ahangama Central 157 275 6 2 137 5 1 38 93Ahangama East 156 290 5 3 147 19 7 47 74Atadahewathugoda 162A 175 5 2 101 1 0 4 96Bonavistawa 137C 010 5 1 47 6 4 14 23Dalawella 132A 030 4 3 116 7 4 12 93Dommannegoda 160A 265 6 1 57 1 1 2 53Goviyapana 156A 295 5 3 172 12 1 18 141Heenatigala South 148 045 5 4 155 6 7 33 109Kahawennagama 148C 080 6 4 172 3 3 45 121Kathaluwa East 164 180 4 4 239 51 10 22 156Kathaluwa West 162 170 7 4 133 26 5 42 60Katukurunda 144C 135 9 2 62 7 0 11 44Koggala 144A 165 6 3 177 82 15 29 51Koggala Athireka I 144D 155 6 1 41 4 1 6 30Koggala Athireka II 144E 160 8 2 110 0 1 5 104Liyanagoda 144 130 5 5 211 11 2 49 149Meliyagoda 164F 240 6 1 80 2 4 23 51Morampitigoda 144B 085 7 6 290 63 20 75 132Piyadigama East 160 270 5 4 193 51 9 75 58Piyadigama West 161 245 7 6 239 51 5 49 134Thalpe East 148A 075 8 6 232 13 3 38 178Thalpe South 132 040 4 2 84 1 2 11 70Unawatuna Central 137A 035 6 6 264 20 11 39 194Unawatuna East 136 020 9 2 103 8 5 25 65Uragasgoda 144F 090 4 2 104 16 4 20 64Wadugegoda 161B 250 2 1 77 1 2 15 59Welhengoda 164D 185 4 3 180 15 8 44 113Yaddehimulla 137B 005 5 5 193 29 17 39 108
159 88 4116 511 152 830 2623*Statistics are given here only for the affected GN divisions, Source: Department of Census and Statistics
Affected GN Division
Table 1.1e : Number of housing units before and after Tsunami 2004 by affected GN divisions* : Habaraduwa DS Division of Galle District (Provisional)
Not damaged Code
Total
Name No. Before the disaster
Completely damaged
Partially damaged and
cannot be used
Partially damaged and can be used AffectedTotal
Number of housing units in affected census blocks
Number of Census Blocks
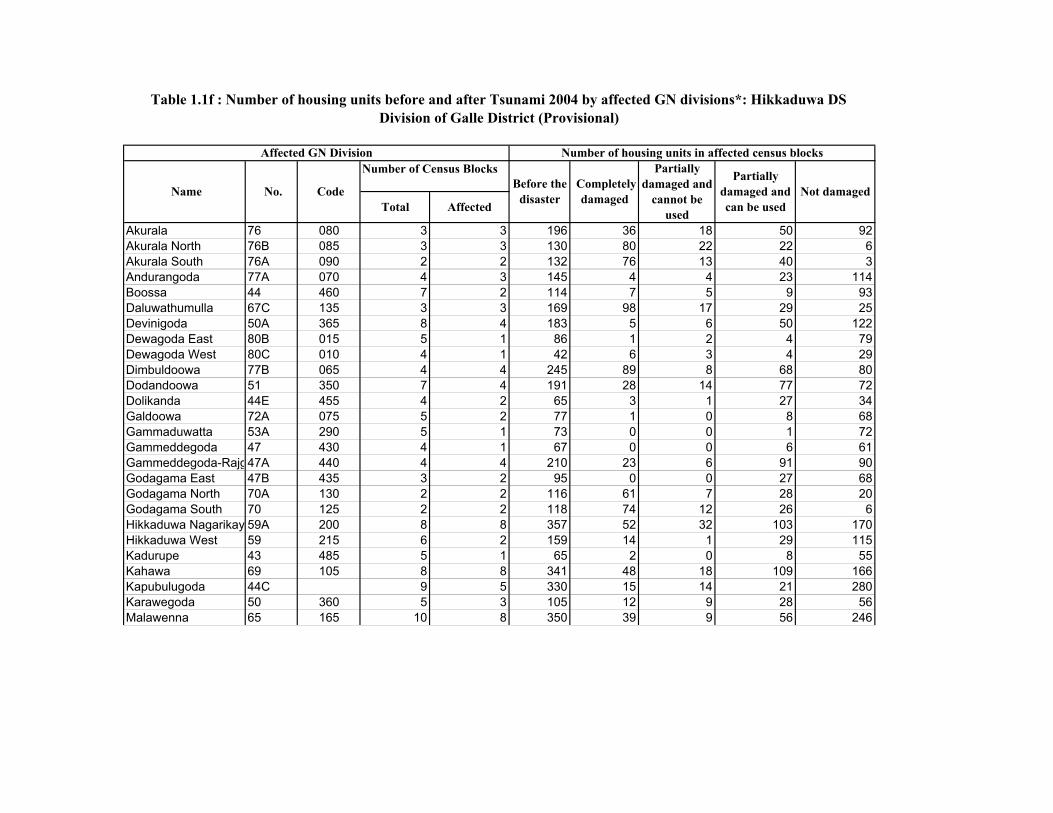
Akurala 76 080 3 3 196 36 18 50 92Akurala North 76B 085 3 3 130 80 22 22 6Akurala South 76A 090 2 2 132 76 13 40 3Andurangoda 77A 070 4 3 145 4 4 23 114Boossa 44 460 7 2 114 7 5 9 93Daluwathumulla 67C 135 3 3 169 98 17 29 25Devinigoda 50A 365 8 4 183 5 6 50 122Dewagoda East 80B 015 5 1 86 1 2 4 79Dewagoda West 80C 010 4 1 42 6 3 4 29Dimbuldoowa 77B 065 4 4 245 89 8 68 80Dodandoowa 51 350 7 4 191 28 14 77 72Dolikanda 44E 455 4 2 65 3 1 27 34Galdoowa 72A 075 5 2 77 1 0 8 68Gammaduwatta 53A 290 5 1 73 0 0 1 72Gammeddegoda 47 430 4 1 67 0 0 6 61Gammeddegoda-Rajg47A 440 4 4 210 23 6 91 90Godagama East 47B 435 3 2 95 0 0 27 68Godagama North 70A 130 2 2 116 61 7 28 20Godagama South 70 125 2 2 118 74 12 26 6Hikkaduwa Nagarikay 59A 200 8 8 357 52 32 103 170Hikkaduwa West 59 215 6 2 159 14 1 29 115Kadurupe 43 485 5 1 65 2 0 8 55Kahawa 69 105 8 8 341 48 18 109 166Kapubulugoda 44C 9 5 330 15 14 21 280Karawegoda 50 360 5 3 105 12 9 28 56Malawenna 65 165 10 8 350 39 9 56 246
Partially damaged and can be used Affected
Code
Affected GN DivisionPartially
damaged and cannot be
used
Not damagedCompletely damagedTotal
Before the disaster
Number of housing units in affected census blocks
Table 1.1f : Number of housing units before and after Tsunami 2004 by affected GN divisions*: Hikkaduwa DS Division of Galle District (Provisional)
Name No.
Number of Census Blocks
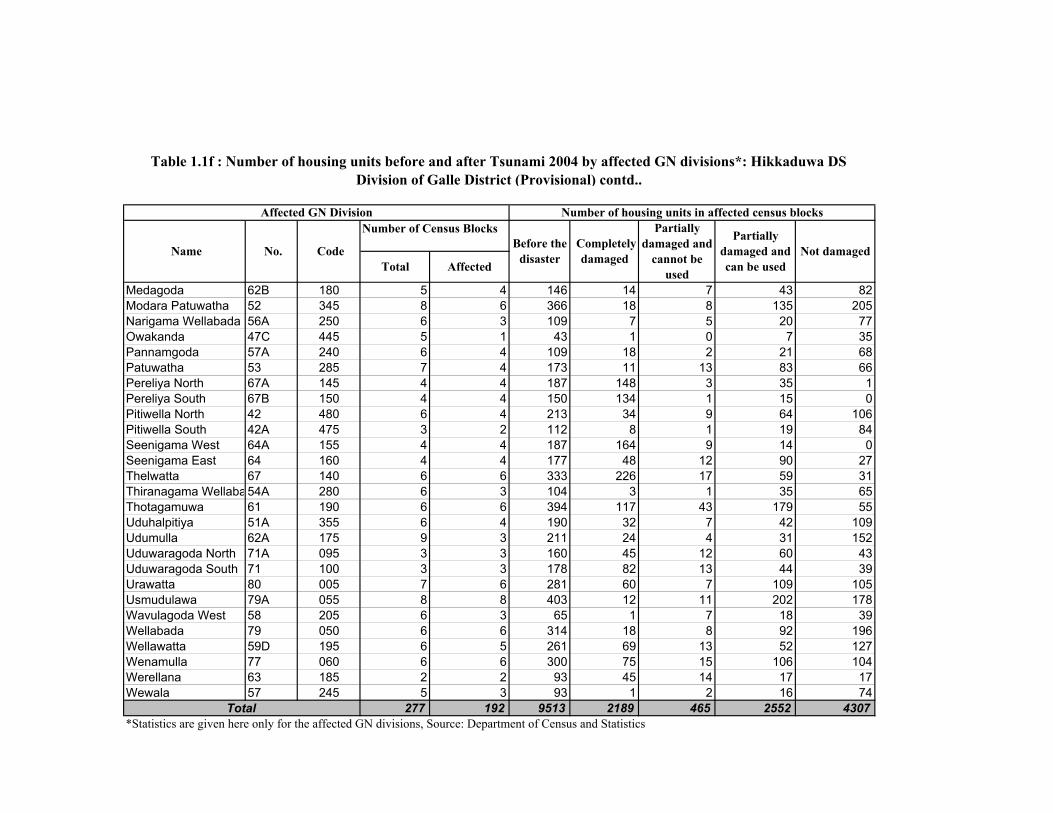
Medagoda 62B 180 5 4 146 14 7 43 82Modara Patuwatha 52 345 8 6 366 18 8 135 205Narigama Wellabada 56A 250 6 3 109 7 5 20 77Owakanda 47C 445 5 1 43 1 0 7 35Pannamgoda 57A 240 6 4 109 18 2 21 68Patuwatha 53 285 7 4 173 11 13 83 66Pereliya North 67A 145 4 4 187 148 3 35 1Pereliya South 67B 150 4 4 150 134 1 15 0Pitiwella North 42 480 6 4 213 34 9 64 106Pitiwella South 42A 475 3 2 112 8 1 19 84Seenigama West 64A 155 4 4 187 164 9 14 0Seenigama East 64 160 4 4 177 48 12 90 27Thelwatta 67 140 6 6 333 226 17 59 31Thiranagama Wellaba54A 280 6 3 104 3 1 35 65Thotagamuwa 61 190 6 6 394 117 43 179 55Uduhalpitiya 51A 355 6 4 190 32 7 42 109Udumulla 62A 175 9 3 211 24 4 31 152Uduwaragoda North 71A 095 3 3 160 45 12 60 43Uduwaragoda South 71 100 3 3 178 82 13 44 39Urawatta 80 005 7 6 281 60 7 109 105Usmudulawa 79A 055 8 8 403 12 11 202 178Wavulagoda West 58 205 6 3 65 1 7 18 39Wellabada 79 050 6 6 314 18 8 92 196Wellawatta 59D 195 6 5 261 69 13 52 127Wenamulla 77 060 6 6 300 75 15 106 104Werellana 63 185 2 2 93 45 14 17 17Wewala 57 245 5 3 93 1 2 16 74
277 192 9513 2189 465 2552 4307*Statistics are given here only for the affected GN divisions, Source: Department of Census and Statistics
Total
Not damaged
Table 1.1f : Number of housing units before and after Tsunami 2004 by affected GN divisions*: Hikkaduwa DS Division of Galle District (Provisional) contd..
Affected GN Division Number of housing units in affected census blocks
Name No. Code Before the disasterTotal Affected
Completely damaged
Partially damaged and
cannot be used
Partially damaged and can be used
Total AffectedGN Divisions GN Divisions
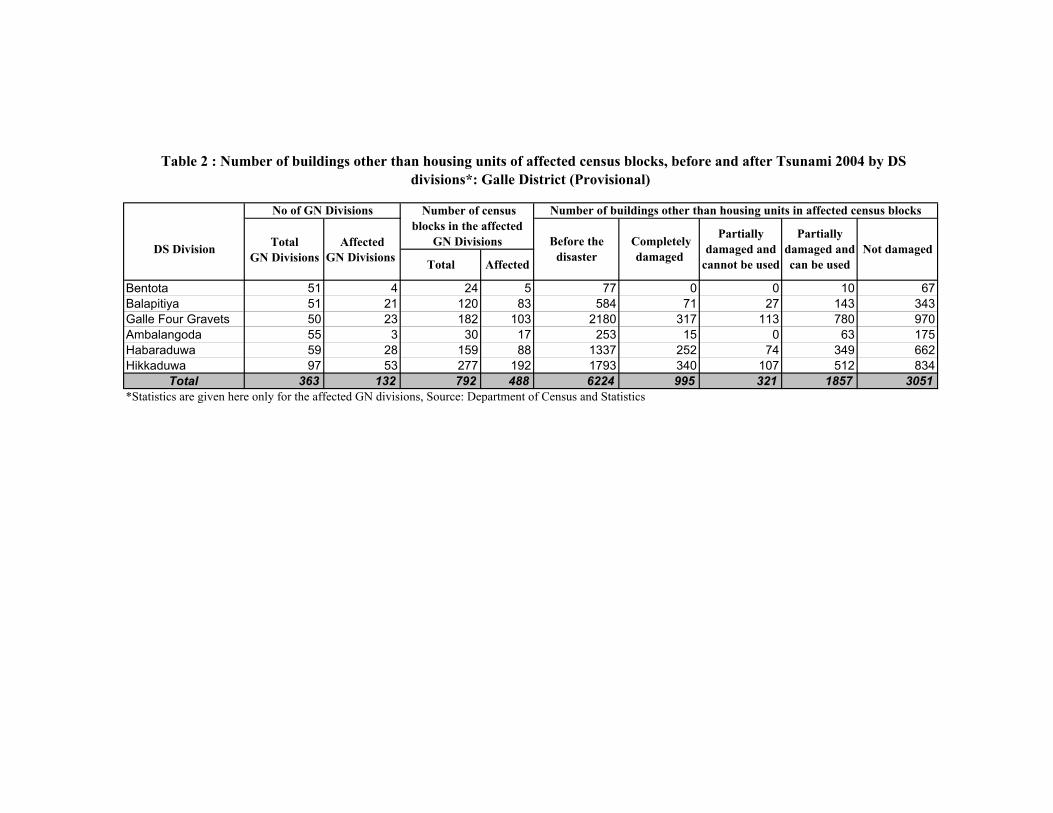
Bentota 51 4 24 5 77 0 0 10 67Balapitiya 51 21 120 83 584 71 27 143 343Galle Four Gravets 50 23 182 103 2180 317 113 780 970Ambalangoda 55 3 30 17 253 15 0 63 175Habaraduwa 59 28 159 88 1337 252 74 349 662Hikkaduwa 97 53 277 192 1793 340 107 512 834
Total 363 132 792 488 6224 995 321 1857 3051*Statistics are given here only for the affected GN divisions, Source: Department of Census and Statistics
Table 2 : Number of buildings other than housing units of affected census blocks, before and after Tsunami 2004 by DS divisions*: Galle District (Provisional)
Partially damaged and
cannot be used
Number of census blocks in the affected
GN Divisions
Number of buildings other than housing units in affected census blocks
DS Division
No of GN Divisions
Before the disaster
Completely damaged
Partially damaged and can be used
Not damagedTotal Affected
Number of Census Blocks
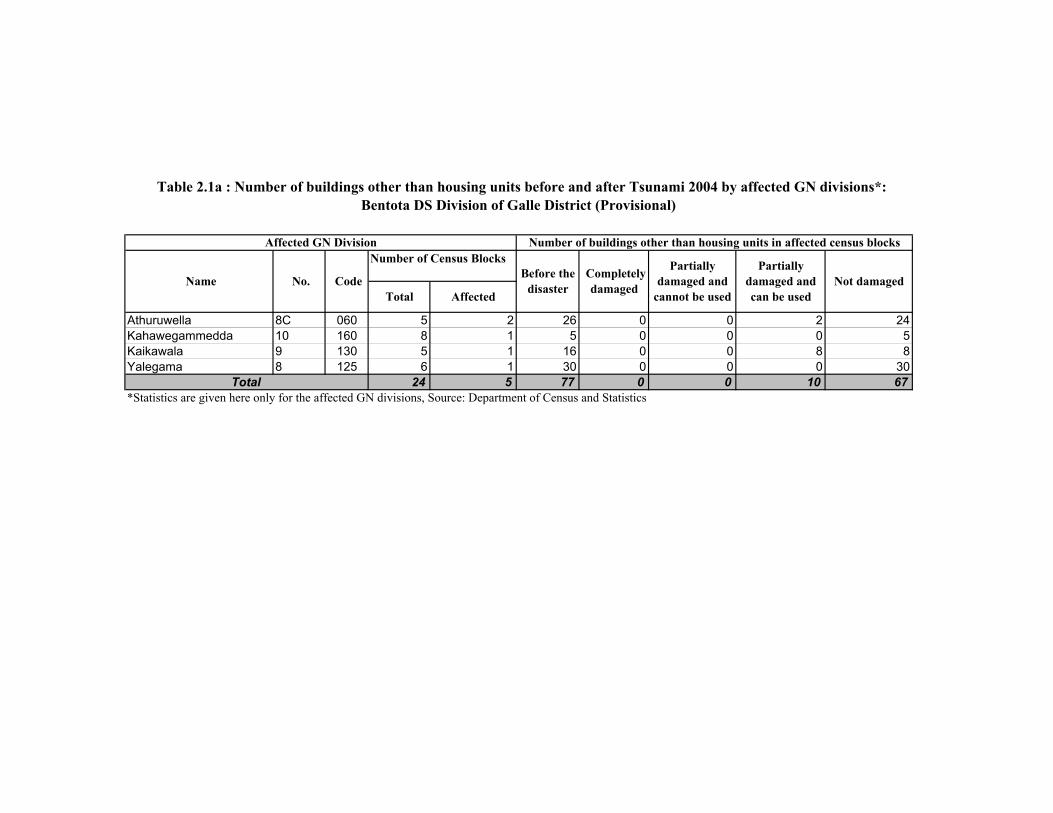
Athuruwella 8C 060 5 2 26 0 0 2 24Kahawegammedda 10 160 8 1 5 0 0 0 5Kaikawala 9 130 5 1 16 0 0 8 8Yalegama 8 125 6 1 30 0 0 0 30
24 5 77 0 0 10 67*Statistics are given here only for the affected GN divisions, Source: Department of Census and Statistics
Total
Number of buildings other than housing units in affected census blocksAffected GN Division
Name No. CodeTotal Affected
Not damagedPartially
damaged and cannot be used
Partially damaged and can be used
Table 2.1a : Number of buildings other than housing units before and after Tsunami 2004 by affected GN divisions*: Bentota DS Division of Galle District (Provisional)
Before the disaster
Completely damaged

Number of Census Blocks
Ahungalla 18 075 6 6 70 5 3 2 60Balapitiya 89 185 7 7 34 0 1 4 29Berathuduwa 89B 190 6 3 9 0 1 1 7Brahmanawatta North 20 135 7 7 39 5 6 10 18Brahmanawatta South 20B 140 8 8 67 2 0 5 60Doowemodara 15 005 7 6 32 10 1 7 14Elathota 21E 180 5 3 5 0 0 0 5Godapitiya 17D 065 3 2 5 0 0 2 3Hegalla-Piyagama 17 060 6 3 17 2 1 3 11Kosgoda 17A 070 6 6 51 16 1 34 0Kudagodagama 17C 055 3 1 16 1 0 8 7Makumbura 19B 110 3 2 4 0 0 0 4Middaramulla 18A 080 10 9 66 3 2 10 51Nape 16 050 5 3 45 8 2 20 15Pathegangoda 20A 125 7 2 23 2 0 12 9Randombe North 88B 230 6 2 10 0 1 2 7Randombe South 88 255 7 3 23 11 4 3 5Walagedara 89A 225 6 2 7 2 0 0 5Wathuregama 19A 115 3 3 31 3 3 8 17Weliwathugoda 21A 130 5 1 17 0 0 4 13Wellabada 19 120 4 4 13 1 1 8 3
120 83 584 71 27 143 343*Statistics are given here only for the affected GN divisions, Source: Department of Census and Statistics
Number of buildings other than housing units in affected census blocks
No. Code Before the disaster
Completely damaged
Partially damaged and
cannot be used
Partially damaged and can be used
Name
Total
Table 2.1b : Number of buildings other than housing units before and after Tsunami 2004 by affected GN divisions*: Balapitiya DS Division of Galle District (Provisional)
Affected GN Division
Not damagedTotal Affected
Number of Census Blocks
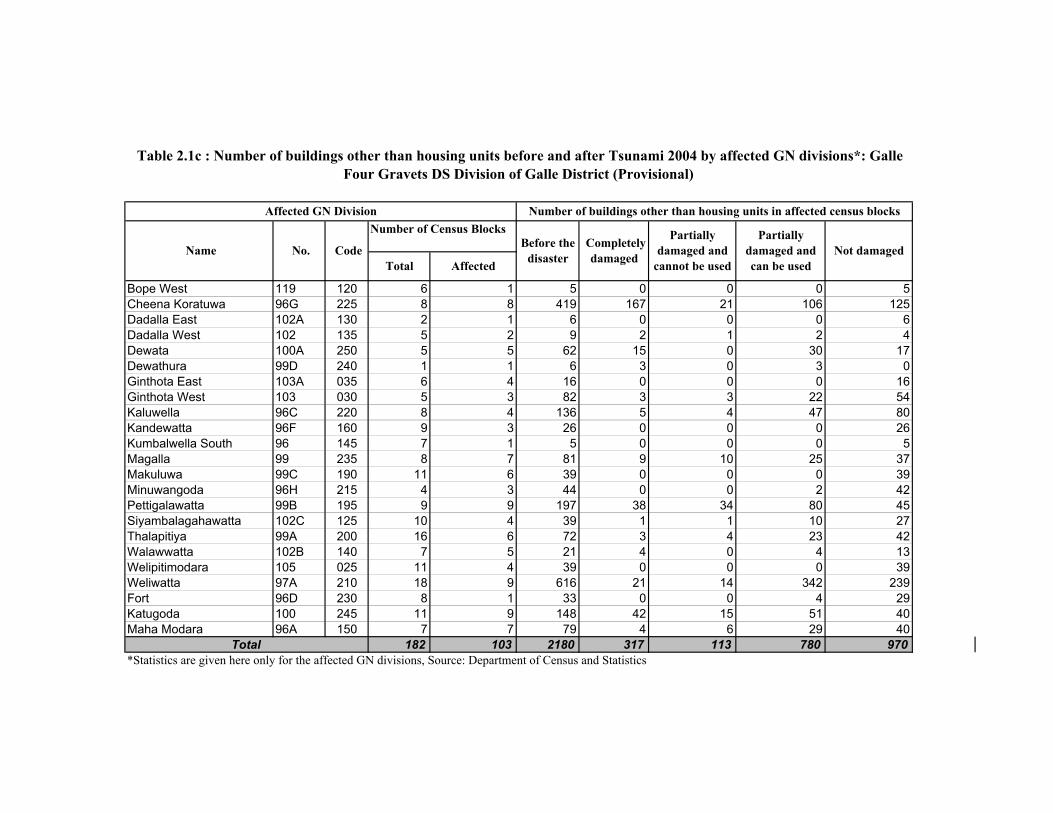
Bope West 119 120 6 1 5 0 0 0 5Cheena Koratuwa 96G 225 8 8 419 167 21 106 125Dadalla East 102A 130 2 1 6 0 0 0 6Dadalla West 102 135 5 2 9 2 1 2 4Dewata 100A 250 5 5 62 15 0 30 17Dewathura 99D 240 1 1 6 3 0 3 0Ginthota East 103A 035 6 4 16 0 0 0 16Ginthota West 103 030 5 3 82 3 3 22 54Kaluwella 96C 220 8 4 136 5 4 47 80Kandewatta 96F 160 9 3 26 0 0 0 26Kumbalwella South 96 145 7 1 5 0 0 0 5Magalla 99 235 8 7 81 9 10 25 37Makuluwa 99C 190 11 6 39 0 0 0 39Minuwangoda 96H 215 4 3 44 0 0 2 42Pettigalawatta 99B 195 9 9 197 38 34 80 45Siyambalagahawatta 102C 125 10 4 39 1 1 10 27Thalapitiya 99A 200 16 6 72 3 4 23 42Walawwatta 102B 140 7 5 21 4 0 4 13Welipitimodara 105 025 11 4 39 0 0 0 39Weliwatta 97A 210 18 9 616 21 14 342 239Fort 96D 230 8 1 33 0 0 4 29Katugoda 100 245 11 9 148 42 15 51 40Maha Modara 96A 150 7 7 79 4 6 29 40
182 103 2180 317 113 780 970*Statistics are given here only for the affected GN divisions, Source: Department of Census and Statistics
Affected
Partially damaged and
cannot be used
Partially damaged and can be used
Not damaged
Total
Name No. CodeTotal
Before the disaster
Completely damaged
Affected GN Division Number of buildings other than housing units in affected census blocks
Table 2.1c : Number of buildings other than housing units before and after Tsunami 2004 by affected GN divisions*: Galle Four Gravets DS Division of Galle District (Provisional)
Number of Census Blocks
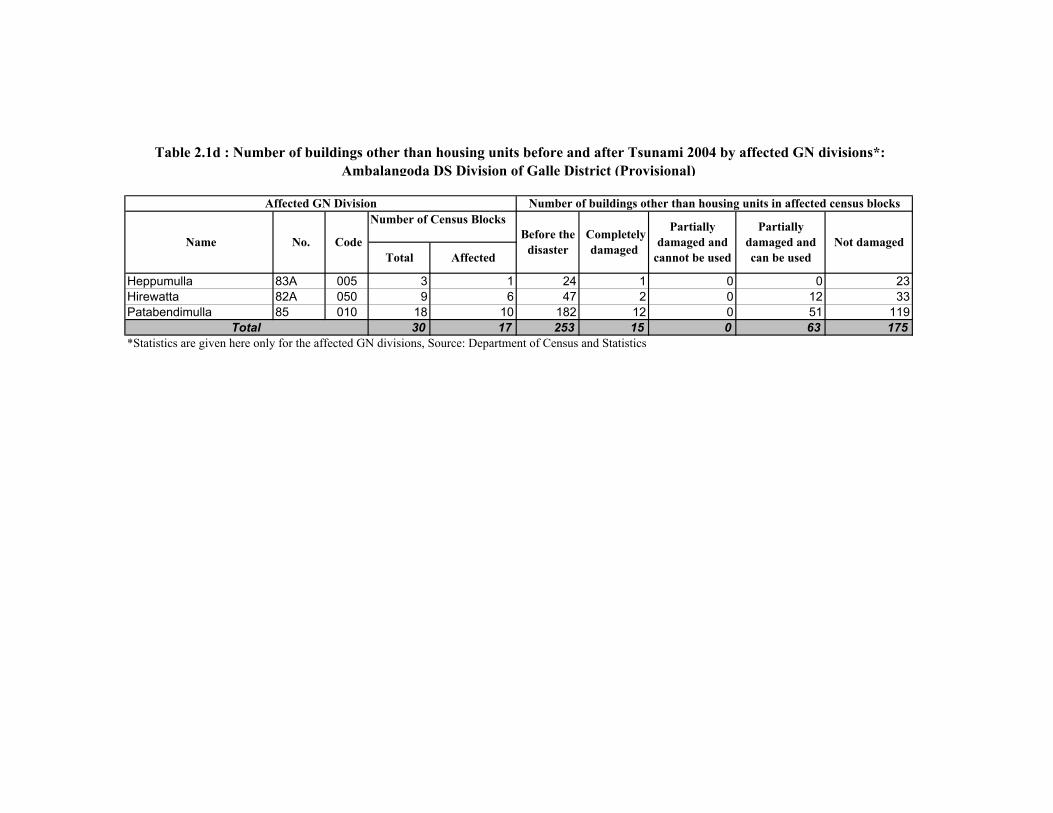
Heppumulla 83A 005 3 1 24 1 0 0 23Hirewatta 82A 050 9 6 47 2 0 12 33Patabendimulla 85 010 18 10 182 12 0 51 119
30 17 253 15 0 63 175*Statistics are given here only for the affected GN divisions, Source: Department of Census and Statistics
Table 2.1d : Number of buildings other than housing units before and after Tsunami 2004 by affected GN divisions*: Ambalangoda DS Division of Galle District (Provisional)
Total
Affected GN Division
Not damaged No.Total Affected
Partially damaged and
cannot be used
Before the disaster
Completely damaged Code
Partially damaged and can be used
Number of buildings other than housing units in affected census blocks
Name
Number of Census Blocks
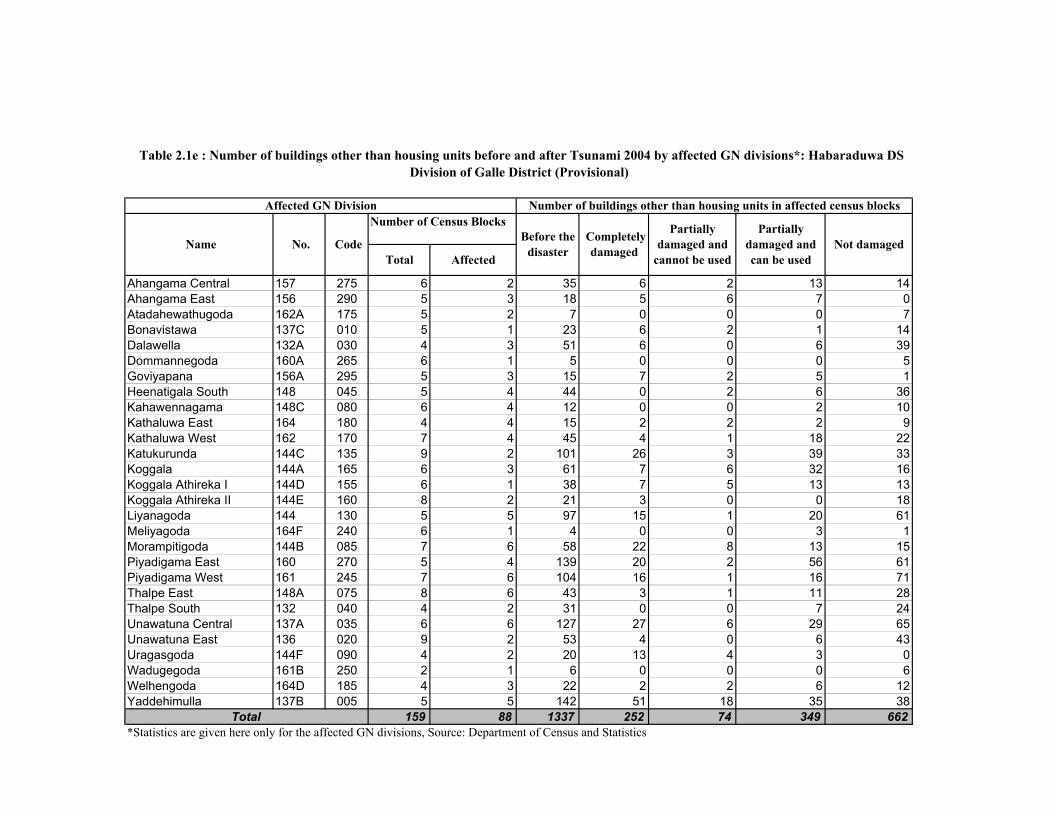
Ahangama Central 157 275 6 2 35 6 2 13 14Ahangama East 156 290 5 3 18 5 6 7 0Atadahewathugoda 162A 175 5 2 7 0 0 0 7Bonavistawa 137C 010 5 1 23 6 2 1 14Dalawella 132A 030 4 3 51 6 0 6 39Dommannegoda 160A 265 6 1 5 0 0 0 5Goviyapana 156A 295 5 3 15 7 2 5 1Heenatigala South 148 045 5 4 44 0 2 6 36Kahawennagama 148C 080 6 4 12 0 0 2 10Kathaluwa East 164 180 4 4 15 2 2 2 9Kathaluwa West 162 170 7 4 45 4 1 18 22Katukurunda 144C 135 9 2 101 26 3 39 33Koggala 144A 165 6 3 61 7 6 32 16Koggala Athireka I 144D 155 6 1 38 7 5 13 13Koggala Athireka II 144E 160 8 2 21 3 0 0 18Liyanagoda 144 130 5 5 97 15 1 20 61Meliyagoda 164F 240 6 1 4 0 0 3 1Morampitigoda 144B 085 7 6 58 22 8 13 15Piyadigama East 160 270 5 4 139 20 2 56 61Piyadigama West 161 245 7 6 104 16 1 16 71Thalpe East 148A 075 8 6 43 3 1 11 28Thalpe South 132 040 4 2 31 0 0 7 24Unawatuna Central 137A 035 6 6 127 27 6 29 65Unawatuna East 136 020 9 2 53 4 0 6 43Uragasgoda 144F 090 4 2 20 13 4 3 0Wadugegoda 161B 250 2 1 6 0 0 0 6Welhengoda 164D 185 4 3 22 2 2 6 12Yaddehimulla 137B 005 5 5 142 51 18 35 38
159 88 1337 252 74 349 662*Statistics are given here only for the affected GN divisions, Source: Department of Census and Statistics
Total
Affected GN Division
Affected
Before the disaster
Completely damaged
Number of buildings other than housing units in affected census blocks
Name No. Code Not damagedTotal
Partially damaged and
cannot be used
Partially damaged and can be used
Table 2.1e : Number of buildings other than housing units before and after Tsunami 2004 by affected GN divisions*: Habaraduwa DS Division of Galle District (Provisional)
Number of Census Blocks
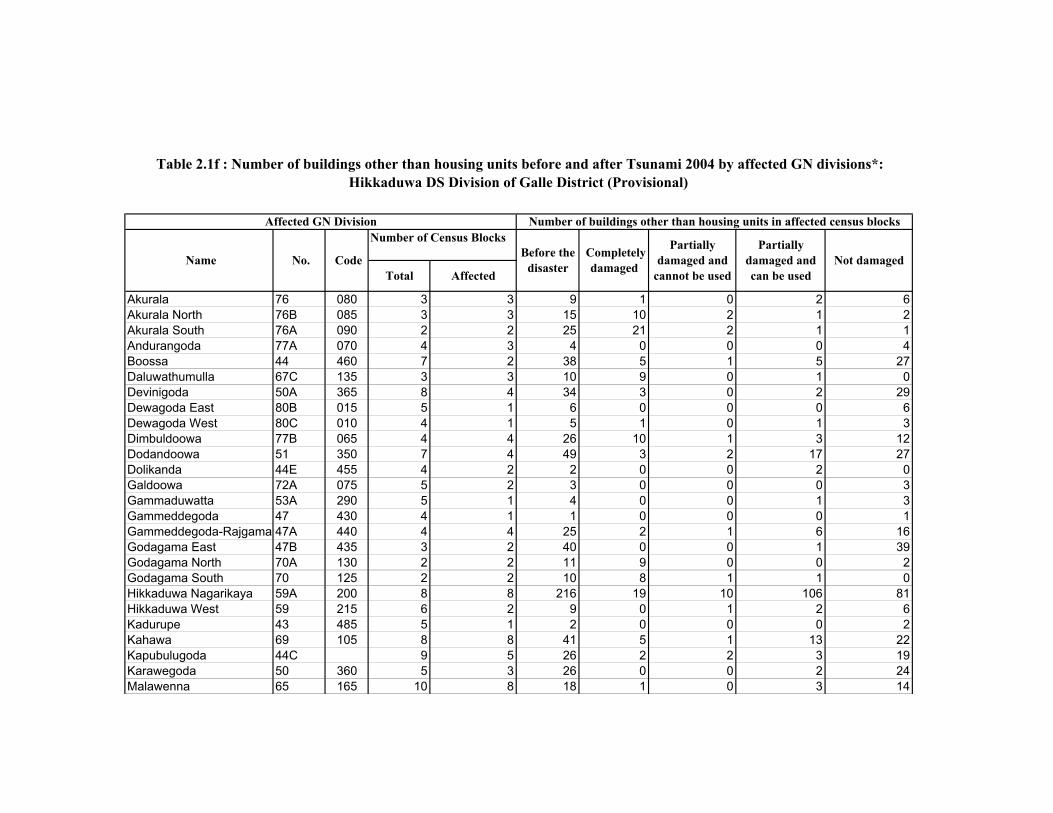
Akurala 76 080 3 3 9 1 0 2 6Akurala North 76B 085 3 3 15 10 2 1 2Akurala South 76A 090 2 2 25 21 2 1 1Andurangoda 77A 070 4 3 4 0 0 0 4Boossa 44 460 7 2 38 5 1 5 27Daluwathumulla 67C 135 3 3 10 9 0 1 0Devinigoda 50A 365 8 4 34 3 0 2 29Dewagoda East 80B 015 5 1 6 0 0 0 6Dewagoda West 80C 010 4 1 5 1 0 1 3Dimbuldoowa 77B 065 4 4 26 10 1 3 12Dodandoowa 51 350 7 4 49 3 2 17 27Dolikanda 44E 455 4 2 2 0 0 2 0Galdoowa 72A 075 5 2 3 0 0 0 3Gammaduwatta 53A 290 5 1 4 0 0 1 3Gammeddegoda 47 430 4 1 1 0 0 0 1Gammeddegoda-Rajgama 47A 440 4 4 25 2 1 6 16Godagama East 47B 435 3 2 40 0 0 1 39Godagama North 70A 130 2 2 11 9 0 0 2Godagama South 70 125 2 2 10 8 1 1 0Hikkaduwa Nagarikaya 59A 200 8 8 216 19 10 106 81Hikkaduwa West 59 215 6 2 9 0 1 2 6Kadurupe 43 485 5 1 2 0 0 0 2Kahawa 69 105 8 8 41 5 1 13 22Kapubulugoda 44C 9 5 26 2 2 3 19Karawegoda 50 360 5 3 26 0 0 2 24Malawenna 65 165 10 8 18 1 0 3 14
Table 2.1f : Number of buildings other than housing units before and after Tsunami 2004 by affected GN divisions*: Hikkaduwa DS Division of Galle District (Provisional)
Partially damaged and
cannot be used
Partially damaged and can be used
Number of buildings other than housing units in affected census blocks
Not damagedBefore the disaster
Completely damagedTotal Affected
Name No. Code
Affected GN Division
Number of Census Blocks
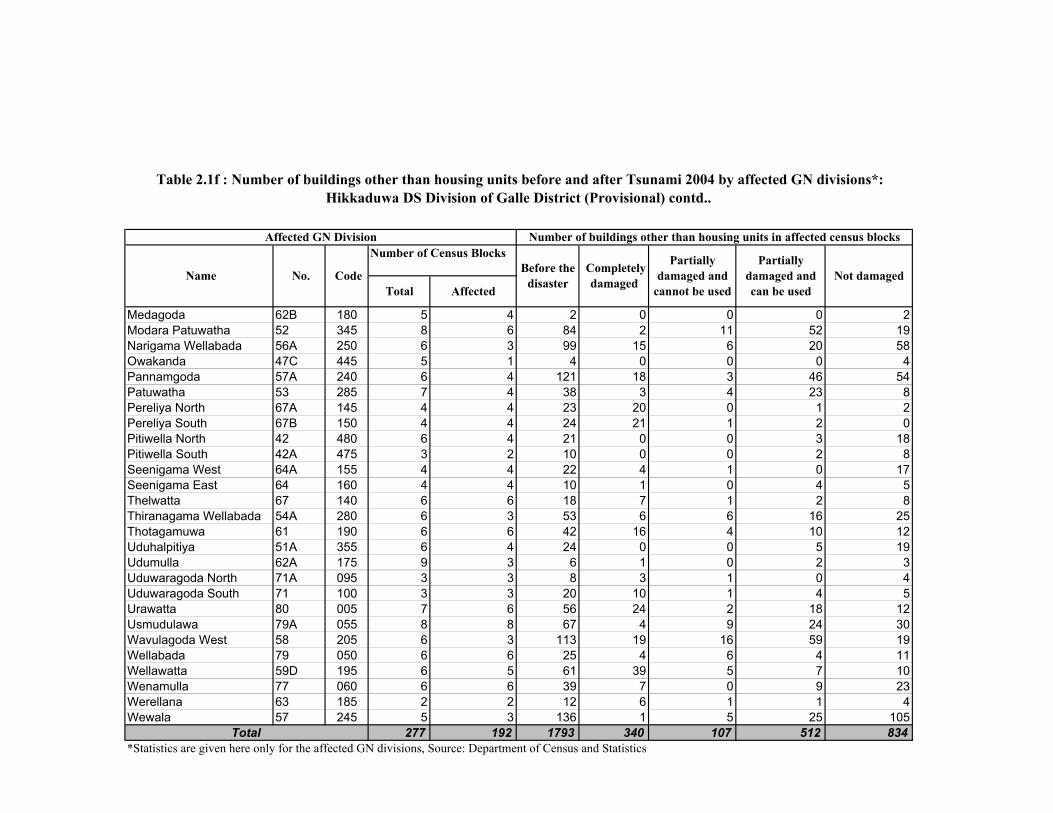
Medagoda 62B 180 5 4 2 0 0 0 2Modara Patuwatha 52 345 8 6 84 2 11 52 19Narigama Wellabada 56A 250 6 3 99 15 6 20 58Owakanda 47C 445 5 1 4 0 0 0 4Pannamgoda 57A 240 6 4 121 18 3 46 54Patuwatha 53 285 7 4 38 3 4 23 8Pereliya North 67A 145 4 4 23 20 0 1 2Pereliya South 67B 150 4 4 24 21 1 2 0Pitiwella North 42 480 6 4 21 0 0 3 18Pitiwella South 42A 475 3 2 10 0 0 2 8Seenigama West 64A 155 4 4 22 4 1 0 17Seenigama East 64 160 4 4 10 1 0 4 5Thelwatta 67 140 6 6 18 7 1 2 8Thiranagama Wellabada 54A 280 6 3 53 6 6 16 25Thotagamuwa 61 190 6 6 42 16 4 10 12Uduhalpitiya 51A 355 6 4 24 0 0 5 19Udumulla 62A 175 9 3 6 1 0 2 3Uduwaragoda North 71A 095 3 3 8 3 1 0 4Uduwaragoda South 71 100 3 3 20 10 1 4 5Urawatta 80 005 7 6 56 24 2 18 12Usmudulawa 79A 055 8 8 67 4 9 24 30Wavulagoda West 58 205 6 3 113 19 16 59 19Wellabada 79 050 6 6 25 4 6 4 11Wellawatta 59D 195 6 5 61 39 5 7 10Wenamulla 77 060 6 6 39 7 0 9 23Werellana 63 185 2 2 12 6 1 1 4Wewala 57 245 5 3 136 1 5 25 105
277 192 1793 340 107 512 834*Statistics are given here only for the affected GN divisions, Source: Department of Census and Statistics
Total
Partially damaged and can be used
Not damaged
Table 2.1f : Number of buildings other than housing units before and after Tsunami 2004 by affected GN divisions*: Hikkaduwa DS Division of Galle District (Provisional) contd..
Affected GN Division Number of buildings other than housing units in affected census blocks
Name No. Code Before the disasterTotal Affected
Completely damaged
Partially damaged and
cannot be used
Total AffectedGN Divisions GN Divisions
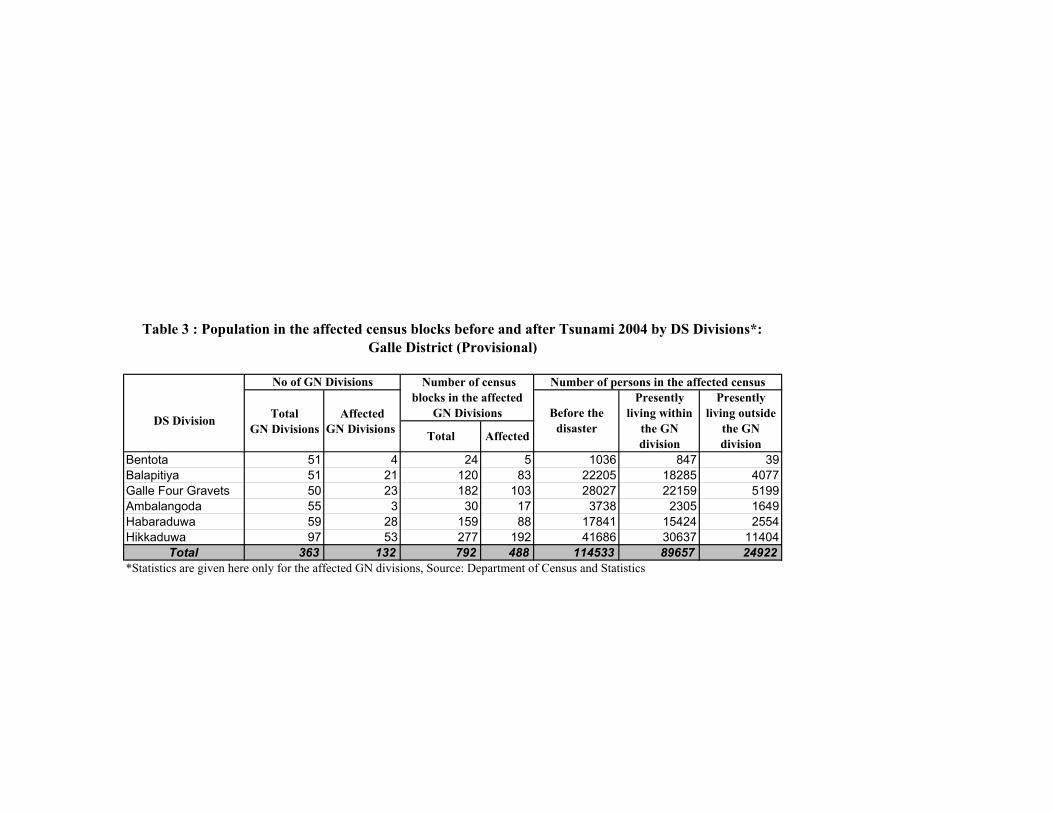
Bentota 51 4 24 5 1036 847 39Balapitiya 51 21 120 83 22205 18285 4077Galle Four Gravets 50 23 182 103 28027 22159 5199Ambalangoda 55 3 30 17 3738 2305 1649Habaraduwa 59 28 159 88 17841 15424 2554Hikkaduwa 97 53 277 192 41686 30637 11404
Total 363 132 792 488 114533 89657 24922*Statistics are given here only for the affected GN divisions, Source: Department of Census and Statistics
Table 3 : Population in the affected census blocks before and after Tsunami 2004 by DS Divisions*: Galle District (Provisional)
No of GN DivisionsPresently
living within the GN division
Presently living outside
the GN division
DS DivisionTotal Affected
Number of census blocks in the affected
GN Divisions
Number of persons in the affected census
Before the disaster
Number of Census Blocks
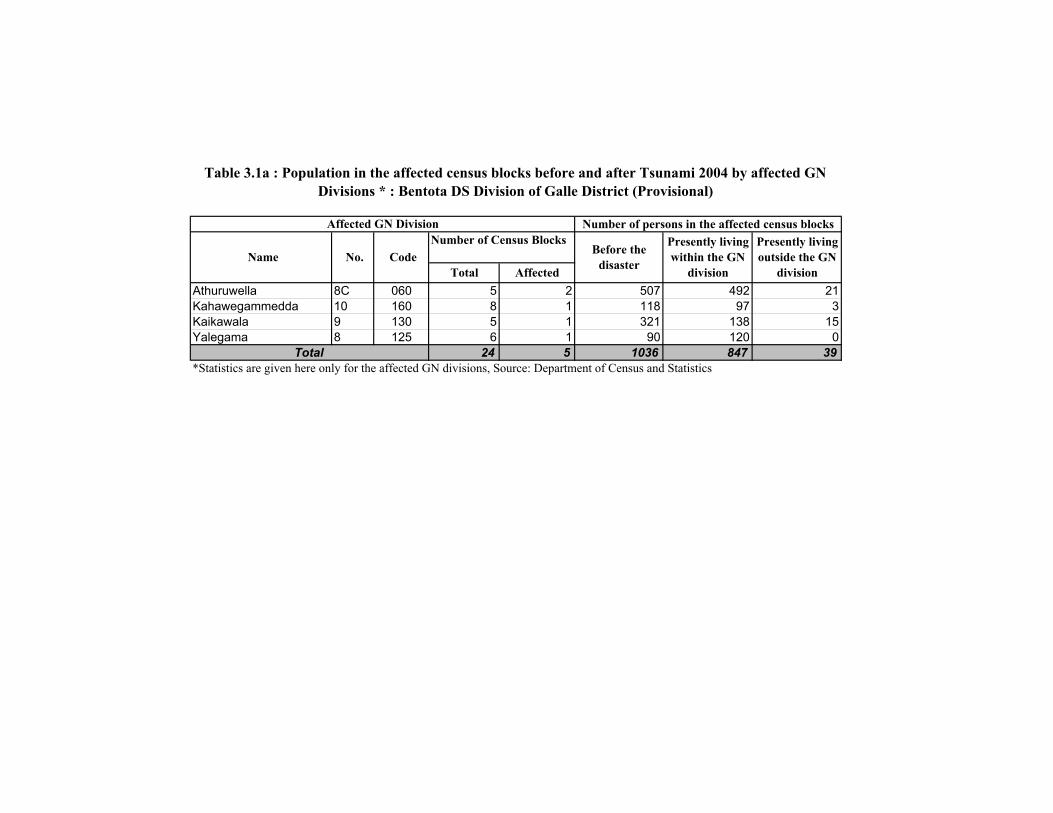
Athuruwella 8C 060 5 2 507 492 21Kahawegammedda 10 160 8 1 118 97 3Kaikawala 9 130 5 1 321 138 15Yalegama 8 125 6 1 90 120 0
24 5 1036 847 39*Statistics are given here only for the affected GN divisions, Source: Department of Census and Statistics
Table 3.1a : Population in the affected census blocks before and after Tsunami 2004 by affected GN Divisions * : Bentota DS Division of Galle District (Provisional)
Before the disaster Name No. Code
Total
Presently living within the GN
division
Presently living outside the GN
division
Number of persons in the affected census blocksAffected GN Division
Total Affected
Number of Census Blocks
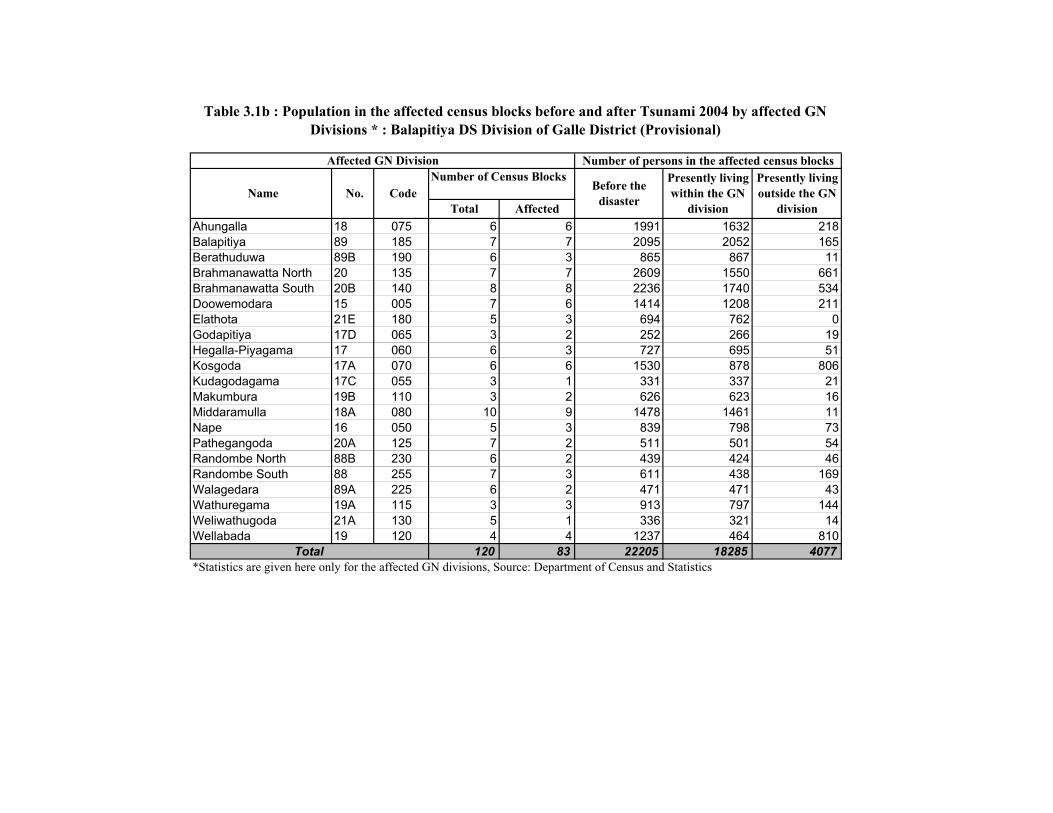
Ahungalla 18 075 6 6 1991 1632 218Balapitiya 89 185 7 7 2095 2052 165Berathuduwa 89B 190 6 3 865 867 11Brahmanawatta North 20 135 7 7 2609 1550 661Brahmanawatta South 20B 140 8 8 2236 1740 534Doowemodara 15 005 7 6 1414 1208 211Elathota 21E 180 5 3 694 762 0Godapitiya 17D 065 3 2 252 266 19Hegalla-Piyagama 17 060 6 3 727 695 51Kosgoda 17A 070 6 6 1530 878 806Kudagodagama 17C 055 3 1 331 337 21Makumbura 19B 110 3 2 626 623 16Middaramulla 18A 080 10 9 1478 1461 11Nape 16 050 5 3 839 798 73Pathegangoda 20A 125 7 2 511 501 54Randombe North 88B 230 6 2 439 424 46Randombe South 88 255 7 3 611 438 169Walagedara 89A 225 6 2 471 471 43Wathuregama 19A 115 3 3 913 797 144Weliwathugoda 21A 130 5 1 336 321 14Wellabada 19 120 4 4 1237 464 810
120 83 22205 18285 4077*Statistics are given here only for the affected GN divisions, Source: Department of Census and Statistics
Affected GN Division
AffectedTotal
Total
Number of persons in the affected census blocks
NamePresently living outside the GN
division No.
Table 3.1b : Population in the affected census blocks before and after Tsunami 2004 by affected GN Divisions * : Balapitiya DS Division of Galle District (Provisional)
Code Before the disaster
Presently living within the GN
division
Number of Census Blocks
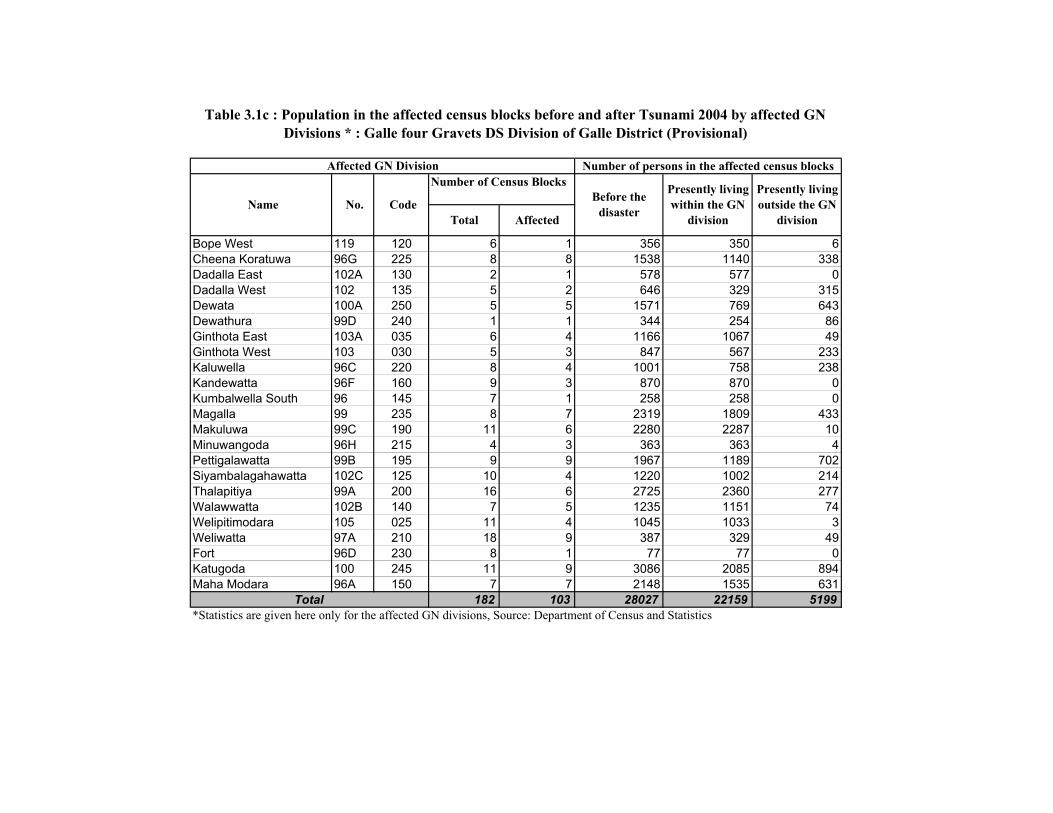
Bope West 119 120 6 1 356 350 6Cheena Koratuwa 96G 225 8 8 1538 1140 338Dadalla East 102A 130 2 1 578 577 0Dadalla West 102 135 5 2 646 329 315Dewata 100A 250 5 5 1571 769 643Dewathura 99D 240 1 1 344 254 86Ginthota East 103A 035 6 4 1166 1067 49Ginthota West 103 030 5 3 847 567 233Kaluwella 96C 220 8 4 1001 758 238Kandewatta 96F 160 9 3 870 870 0Kumbalwella South 96 145 7 1 258 258 0Magalla 99 235 8 7 2319 1809 433Makuluwa 99C 190 11 6 2280 2287 10Minuwangoda 96H 215 4 3 363 363 4Pettigalawatta 99B 195 9 9 1967 1189 702Siyambalagahawatta 102C 125 10 4 1220 1002 214Thalapitiya 99A 200 16 6 2725 2360 277Walawwatta 102B 140 7 5 1235 1151 74Welipitimodara 105 025 11 4 1045 1033 3Weliwatta 97A 210 18 9 387 329 49Fort 96D 230 8 1 77 77 0Katugoda 100 245 11 9 3086 2085 894Maha Modara 96A 150 7 7 2148 1535 631
182 103 28027 22159 5199*Statistics are given here only for the affected GN divisions, Source: Department of Census and Statistics
Affected GN Division
Table 3.1c : Population in the affected census blocks before and after Tsunami 2004 by affected GN Divisions * : Galle four Gravets DS Division of Galle District (Provisional)
Number of persons in the affected census blocks
Code Before the disaster
Presently living within the GN
division
Presently living outside the GN
divisionTotal Affected
Total
Name No.
Number of Census Blocks
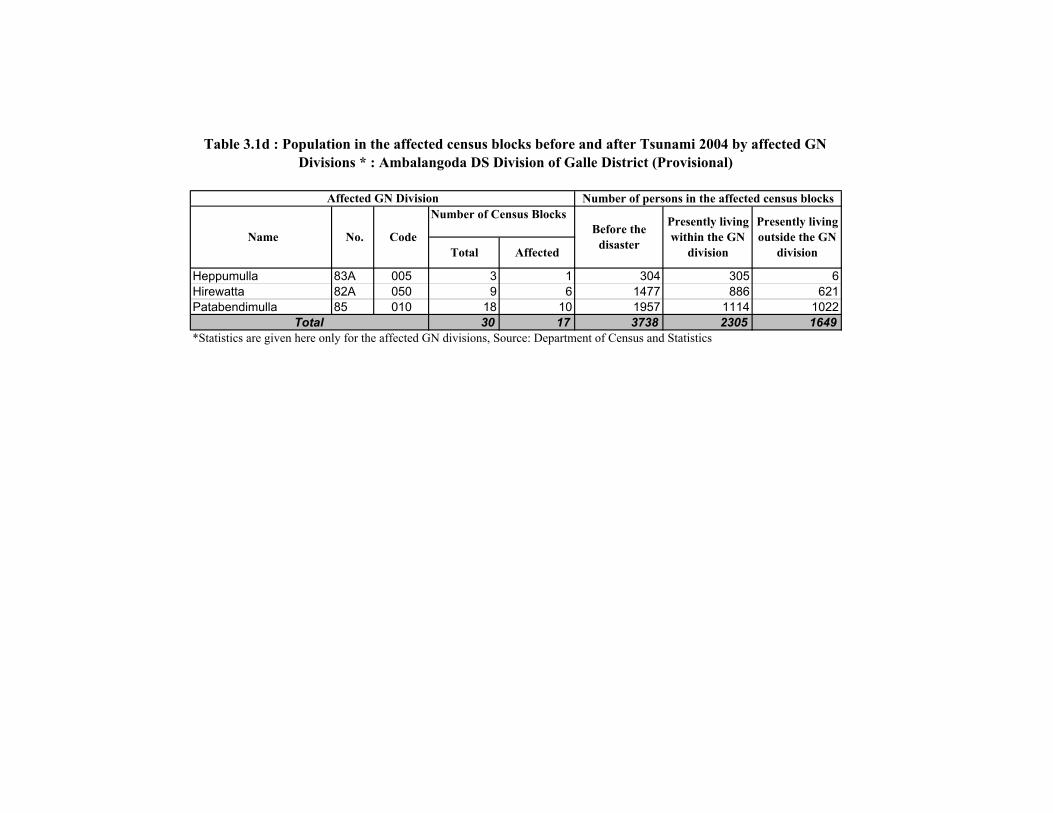
Heppumulla 83A 005 3 1 304 305 6Hirewatta 82A 050 9 6 1477 886 621Patabendimulla 85 010 18 10 1957 1114 1022
30 17 3738 2305 1649*Statistics are given here only for the affected GN divisions, Source: Department of Census and Statistics
Affected GN Division
Name No.
Number of persons in the affected census blocks
Presently living outside the GN
divisionTotal Affected
Total
Code Before the disaster
Presently living within the GN
division
Table 3.1d : Population in the affected census blocks before and after Tsunami 2004 by affected GN Divisions * : Ambalangoda DS Division of Galle District (Provisional)
Number of Census Blocks
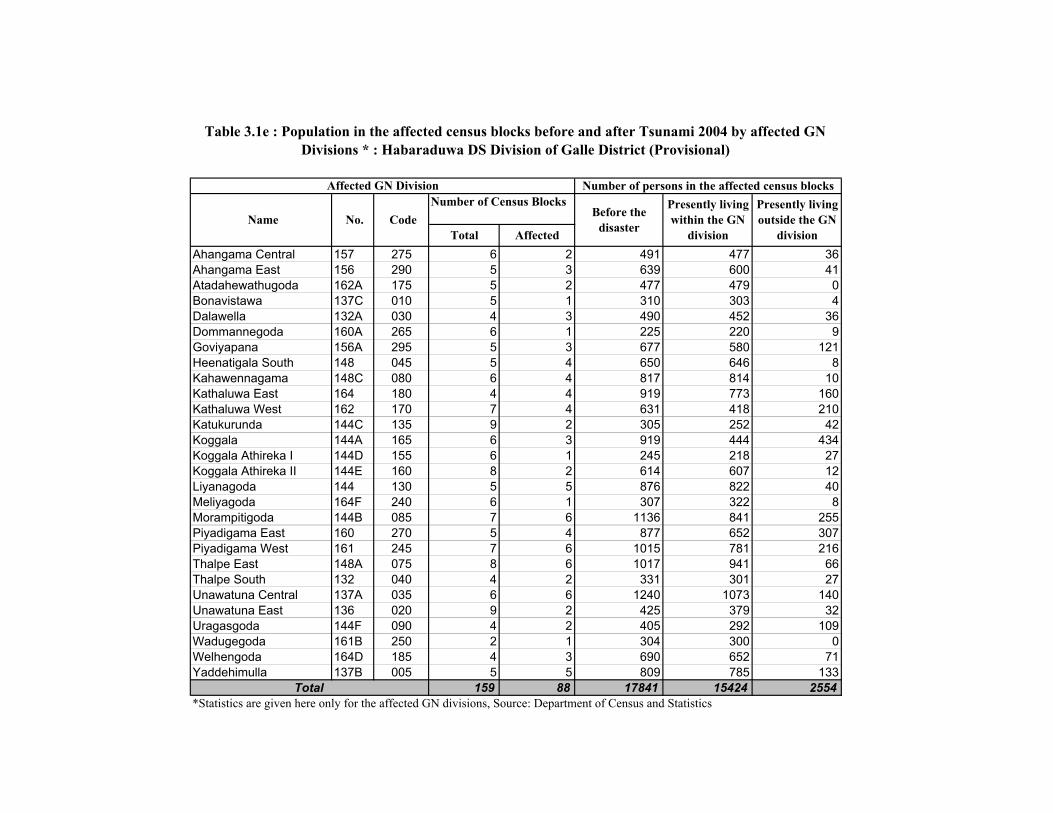
Ahangama Central 157 275 6 2 491 477 36Ahangama East 156 290 5 3 639 600 41Atadahewathugoda 162A 175 5 2 477 479 0Bonavistawa 137C 010 5 1 310 303 4Dalawella 132A 030 4 3 490 452 36Dommannegoda 160A 265 6 1 225 220 9Goviyapana 156A 295 5 3 677 580 121Heenatigala South 148 045 5 4 650 646 8Kahawennagama 148C 080 6 4 817 814 10Kathaluwa East 164 180 4 4 919 773 160Kathaluwa West 162 170 7 4 631 418 210Katukurunda 144C 135 9 2 305 252 42Koggala 144A 165 6 3 919 444 434Koggala Athireka I 144D 155 6 1 245 218 27Koggala Athireka II 144E 160 8 2 614 607 12Liyanagoda 144 130 5 5 876 822 40Meliyagoda 164F 240 6 1 307 322 8Morampitigoda 144B 085 7 6 1136 841 255Piyadigama East 160 270 5 4 877 652 307Piyadigama West 161 245 7 6 1015 781 216Thalpe East 148A 075 8 6 1017 941 66Thalpe South 132 040 4 2 331 301 27Unawatuna Central 137A 035 6 6 1240 1073 140Unawatuna East 136 020 9 2 425 379 32Uragasgoda 144F 090 4 2 405 292 109Wadugegoda 161B 250 2 1 304 300 0Welhengoda 164D 185 4 3 690 652 71Yaddehimulla 137B 005 5 5 809 785 133
159 88 17841 15424 2554*Statistics are given here only for the affected GN divisions, Source: Department of Census and Statistics
Affected GN Division
Total Affected
Table 3.1e : Population in the affected census blocks before and after Tsunami 2004 by affected GN Divisions * : Habaraduwa DS Division of Galle District (Provisional)
Total
Number of persons in the affected census blocks
Code Before the disaster
Presently living within the GN
division Name No.
Presently living outside the GN
division
Number of Census Blocks
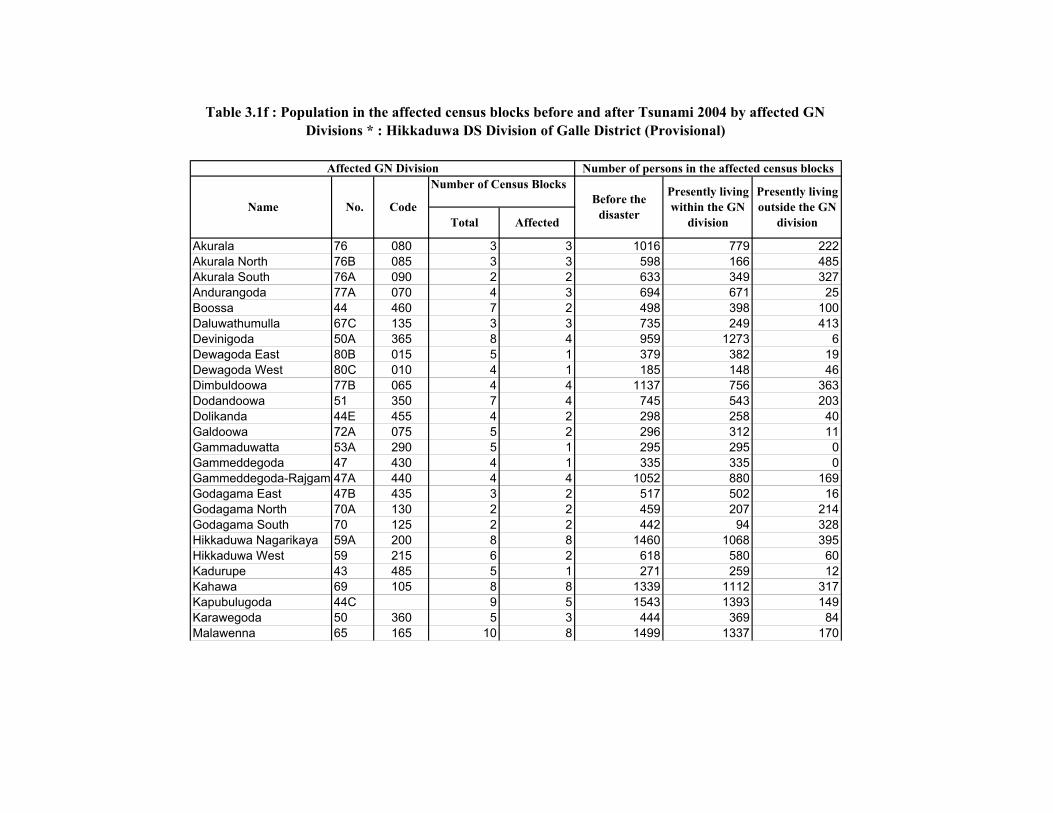
Akurala 76 080 3 3 1016 779 222Akurala North 76B 085 3 3 598 166 485Akurala South 76A 090 2 2 633 349 327Andurangoda 77A 070 4 3 694 671 25Boossa 44 460 7 2 498 398 100Daluwathumulla 67C 135 3 3 735 249 413Devinigoda 50A 365 8 4 959 1273 6Dewagoda East 80B 015 5 1 379 382 19Dewagoda West 80C 010 4 1 185 148 46Dimbuldoowa 77B 065 4 4 1137 756 363Dodandoowa 51 350 7 4 745 543 203Dolikanda 44E 455 4 2 298 258 40Galdoowa 72A 075 5 2 296 312 11Gammaduwatta 53A 290 5 1 295 295 0Gammeddegoda 47 430 4 1 335 335 0Gammeddegoda-Rajgam 47A 440 4 4 1052 880 169Godagama East 47B 435 3 2 517 502 16Godagama North 70A 130 2 2 459 207 214Godagama South 70 125 2 2 442 94 328Hikkaduwa Nagarikaya 59A 200 8 8 1460 1068 395Hikkaduwa West 59 215 6 2 618 580 60Kadurupe 43 485 5 1 271 259 12Kahawa 69 105 8 8 1339 1112 317Kapubulugoda 44C 9 5 1543 1393 149Karawegoda 50 360 5 3 444 369 84Malawenna 65 165 10 8 1499 1337 170
Affected GN Division
Table 3.1f : Population in the affected census blocks before and after Tsunami 2004 by affected GN Divisions * : Hikkaduwa DS Division of Galle District (Provisional)
Presently living within the GN
division
Presently living outside the GN
divisionTotal Code
Affected
Number of persons in the affected census blocks
Name No. Before the disaster

Number of Census Blocks
Medagoda 62B 180 5 4 606 510 51Modara Patuwatha 52 345 8 6 1601 1423 151Narigama Wellabada 56A 250 6 3 453 410 24Owakanda 47C 445 5 1 213 213 0Pannamgoda 57A 240 6 4 499 424 83Patuwatha 53 285 7 4 777 679 110Pereliya North 67A 145 4 4 839 87 695Pereliya South 67B 150 4 4 626 83 435Pitiwella North 42 480 6 4 847 583 244Pitiwella South 42A 475 3 2 494 431 62Seenigama West 64A 155 4 4 840 113 641Seenigama East 64 160 4 4 689 312 317Thelwatta 67 140 6 6 1507 336 1092Thiranagama Wellabada 54A 280 6 3 392 365 28Thotagamuwa 61 190 6 6 1640 1081 692Uduhalpitiya 51A 355 6 4 834 664 167Udumulla 62A 175 9 3 872 848 20Uduwaragoda North 71A 095 3 3 717 446 261Uduwaragoda South 71 100 3 3 786 390 394Urawatta 80 005 7 6 1167 909 382Usmudulawa 79A 055 8 8 1846 1787 140Wavulagoda West 58 205 6 3 249 198 54Wellabada 79 050 6 6 1413 1348 166Wellawatta 59D 195 6 5 1150 816 328Wenamulla 77 060 6 6 1391 997 399Werellana 63 185 2 2 441 114 289Wewala 57 245 5 3 350 355 5
277 192 41686 30637 11404*Statistics are given here only for the affected GN divisions, Source: Department of Census and Statistics
Total
Total Affected
Table 3.1f : Population in the affected census blocks before and after Tsunami 2004 by affected GN Divisions * : Hikkaduwa DS Division of Galle District (Provisional) contd..
Affected GN Division Number of persons in the affected census blocks
Name No. Code Before the disaster
Presently living within the GN
division
Presently living outside the GN
division