Embed Size (px)
Citation preview
M I N D - B O D Y T R A I N I N G T O O L Sw w w . s t r e s s r e s i l i e n t m i n d . c o . u k © G l y n B l a c k e t t
Galvanic Skin ResponseSoftware Application User Guide
Contents 1 Introduction.......................................................................................................2
2 Launching the Application.................................................................................3
2.1 Hardware Set-up...................................................................................3
3 About GSR Biofeedback...................................................................................4
3.1 The Physiological Basis of GSR Biofeedback.......................................4
3.2 Rate of Change of Skin Conductance...................................................4
4 User Interface...................................................................................................5
4.1 Standard Controls (Start / Stop, etc.)....................................................5
4.2 Short-term Skin Conductance Display..................................................6
4.3 Rate of Change Display........................................................................7
4.4 Numeric Displays..................................................................................8
4.5 Long-term Display.................................................................................8
4.6 Threshold Display and Controls............................................................9
4.7 Audio Feedback....................................................................................9
5 Session Reports..............................................................................................11
5.1 Report Options....................................................................................11
5.2 Adding Notes to a Report....................................................................11
5.3 Sample Session Report......................................................................12
6 Application Report...........................................................................................13
6.1 Report Options....................................................................................13
GSR Application User Guide, copyright Glyn Blackett page 1
1 IntroductionThis guide introduces the Galvanic Skin Response (GSR) biofeedback application, part of the Mind-Body Training Tools suite. This set of applications is designed to develop skills in mind-body awareness and self-regulation, particularly in a context of mindfulness and meditation practice.
The guide has two purposes: firstly to explain what GSR actually is, and secondly to teach you how to use the software – though it is more of a reference than a tutorial. Other training material is available on the StressResilientMind.co.uk website.
Specifically, the physiological parameter being measured in the GSR application is Skin Conductance (SC). SC changes are mediated by the Autonomic Nervous System (ANS). The Sympathetic Nervous System (which is one of the two branches of the ANS) causes quite rapid increases in SC. The Sympathetic NS is the mediator of the well-known “fight or flight” response, so working with GSR biofeedback offers a way of learning about this important aspect of the physiological expression of emotion.
In keeping with others in the suite, the GSR application was designed to support your aims, not to supplant them. Achieving low skin conductance is not necessarily the most important thing. In other words, biofeedback should enhance or expand your subjective awareness rather than detract from it.
The guide assumes that you have read the Software Installation and Set-up Guide, and therefore know how to start the application.
The application works with several devices. For an up to date list of supported hardware, please see the StressResilientMind.co.uk website.
GSR Application User Guide, copyright Glyn Blackett page 2
2 Launching the Application
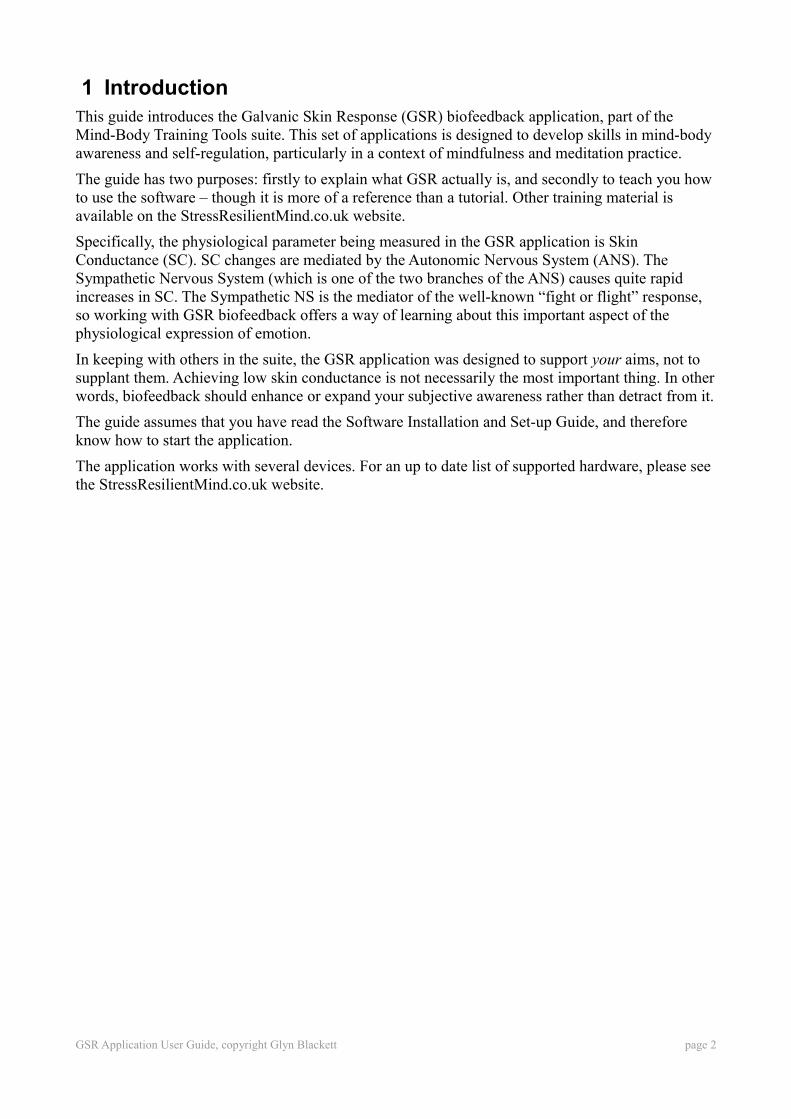
Figure 1 above shows the GSR & Skin Temperature tab of the Platform application. Press the button labelled 1 to launch the application. Make sure you have your BioEra licence key (dongle) inserted into a USB socket. After a few seconds a new window will appear on your screen.
2.1 Hardware Set-up
The physical aspects of hardware set-up (how to connect and use your sensors, etc.) are dependent upon the type of amplifier you are using, and are covered in a separate document (Hardware Set-up Guide).
Before you start the application you configure the device set-up options, accessible by clicking a button in the Set-up tab of the Platform. In the dialog, select the type of amplifier (biofeedback device) you are using, in the GSR source control. Note, all the source settings are remembered the next time you start the Platform.
One of the device options is 'Simulator'. In simulator mode, you can learn how to use the software without the encumbrance of sensors, leads etc. (The application simply uses recorded data as a source.) Seethe Installation and Set-up Guide for further details of Device set-up.
Once you have started the application, you should see your device selection reflected in the device status display in the top right corner of the main window (see figure 2). The lamp (shown as a red square in figure 2) should change to green when you press the play button. If you do not see this happen, it means that the application has not been able to establish a connection with your device. Check it is plugged in and that the batteries are not flat.
For some devices, you'll see a button rather than just text. Pressing this button opens up a dialog that allows you to adjust settings related to the device, such as COM port. The specifics depend on the device – see the Hardware Set-up Guide for more details.
GSR Application User Guide, copyright Glyn Blackett page 3
3 About GSR BiofeedbackGalvanic Skin Response is an electrical property of the skin. As mentioned, the specific parameter being measured is skin conductance (SC). SC is the inverse of skin resistance (SR). Mathematically, SC = 1/SR.
To measure SC, you apply a small voltage to the skin, and measure how much current flows. (The voltage is very small and not perceptible.) The more current flows, the higher the conductance (and the lower the resistance).
SC is a useful thing to measure in biofeedback because it changes in response to emotional stimuli. While the skin is itself not a good electrical conductor, emotional stimuli cause sweat glands to produce sweat, which is a conductor. The amounts of sweat may be tiny but enough to create a measurable change.
GSR is typically measured in the hands, because in the hands especially sweating is responsive to emotions.
In my professional practice I don't typically use GSR biofeedback as a training vehicle, because changes are to a large extent involuntary. Rather, I use it to illustrate the mind-body connection, and the nature of the emotional and attentional influences on the ANS.
3.1 The Physiological Basis of GSR Biofeedback
Sweat gland activity is controlled by the Autonomic Nervous System (ANS). The ANS is a part of the nervous system that governs many of our automatic and visceral responses. It has two branches, known as the sympathetic and parasympathetic nervous systems. These have opposite effects on the body, rather like the accelerator and brake in a car. The sympathetic increases the body's arousal level (it's the accelerator) while the parasympathetic lowers arousal (it's the brake). It's the sympathetic which triggers the sweat response we're measuring in GSR biofeedback.
Other examples of effects of sympathetic arousal include increased heart rate and blood pressure, increased blood sugar levels, and a directing of the blood more towards the muscles. It's preparing the body for action – it's associated with the so-called “fight or flight” or stress response. Conversely the parasympathetic NS has effects such as lowering heart rate, blood pressure and blood sugar, and diverting blood more towards the digestive organs (it's known as the “rest and digest” response).
So increases in SC are triggered by sympathetic responses. SC decreases as the sweat evaporates. The parasympathetic NS doesn't directly affect the sweat response, but it does so indirectly because it inhibits the sympathetic NS.
What causes the sympathetic response? Of course what we're interested in is emotional stimuli. The sympathetic NS mediates the “fight or flight” response happens when we feel stressed – anxious, frustrated or angry. But increases in SC don't just mean stress – arousing emotions like excitement also trigger the same response. It's best to think of SC increases as reflecting arousal, which can be “positive” or “negative”.
3.2 Rate of Change of Skin Conductance
The absolute value of the SC reading itself is of little value – rather, it is changes in SC that count. For this reason it is useful to calculate the rate of change of SC. Much of the feedback in the application is actually based on this calculation – for example see section 4.3 below. Increasing SC (triggered by the sympathetic NS) gives a positive rate of change. In the absence of sympathetic activation, sweat evaporates and SC drops, giving a negative rate of change.
GSR Application User Guide, copyright Glyn Blackett page 4
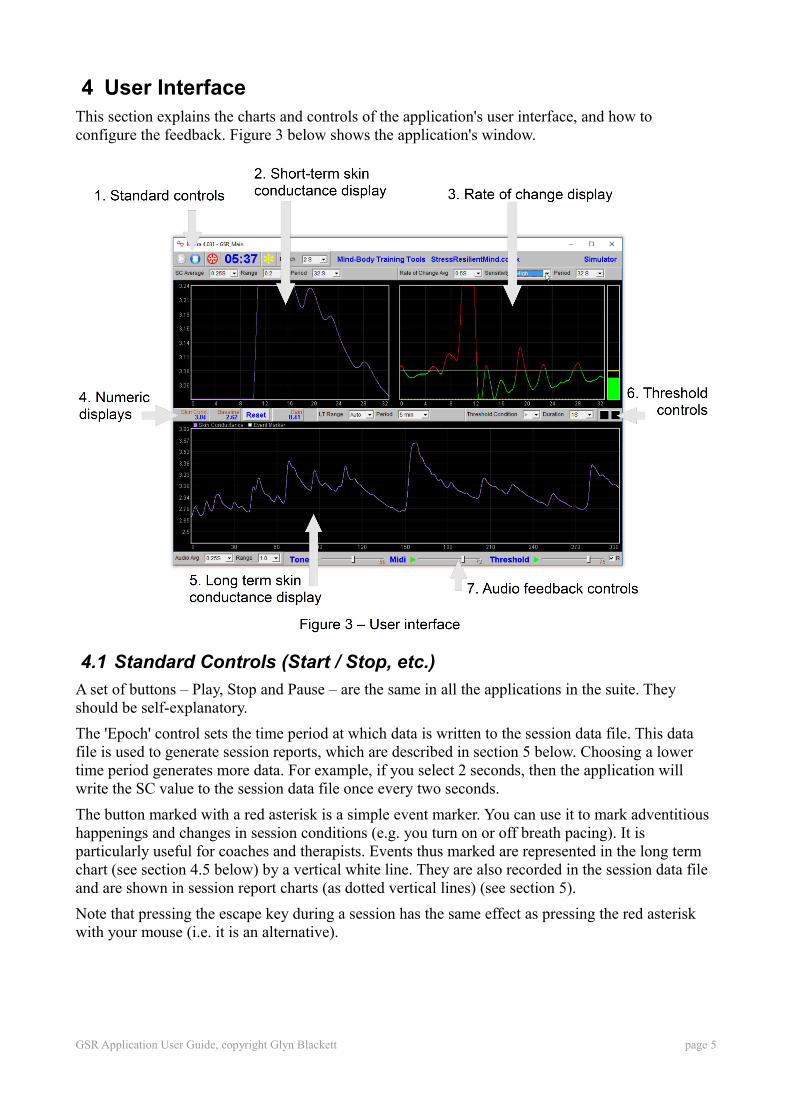
4 User InterfaceThis section explains the charts and controls of the application's user interface, and how to configure the feedback. Figure 3 below shows the application's window.
4.1 Standard Controls (Start / Stop, etc.)
A set of buttons – Play, Stop and Pause – are the same in all the applications in the suite. They should be self-explanatory.
The 'Epoch' control sets the time period at which data is written to the session data file. This data file is used to generate session reports, which are described in section 5 below. Choosing a lower time period generates more data. For example, if you select 2 seconds, then the application will write the SC value to the session data file once every two seconds.
The button marked with a red asterisk is a simple event marker. You can use it to mark adventitious happenings and changes in session conditions (e.g. you turn on or off breath pacing). It is particularly useful for coaches and therapists. Events thus marked are represented in the long term chart (see section 4.5 below) by a vertical white line. They are also recorded in the session data file and are shown in session report charts (as dotted vertical lines) (see section 5).
Note that pressing the escape key during a session has the same effect as pressing the red asterisk with your mouse (i.e. it is an alternative).
GSR Application User Guide, copyright Glyn Blackett page 5

4.2 Short-term Skin Conductance Display
The chart in figure 4 above shows the progression of skin conductance over the short term.
The three drop-down list controls, positioned above the chart and described in the following table, can be used to configure this chart.
SC Average Controls the level of smoothing of the SC signal. With a shorter average you will see all the fine-grained changes. With a longer average these are smoothed out, but the signal will be slower in responding to change.
I suggest a setting of 0.25 seconds will be adequate for most users.
Range Controls the vertical scale of the display, or the difference between the upper and lower limits of the vertical axis.
Note this chart operates in auto-centre mode. The trace will be continually adjusted so that it's (most recent) right hand section displays in the middle of the vertical range. This means that although the scale is fixed, the actual upper and lower limits are constantly changing.
Selecting 'Auto' produces a different behaviour: the system will automatically calculate the best range to best fit the chart based on the variation over the period of the chart. In this case the range will not stay fixed but will vary over the session.
Period This controls the length of time it takes for the traces to traverse the whole chart from right to left – or in other words the horizontal range.
Note that increasing the period after processing has started can have unpredictable consequences, so I recommend you make your selection before pressing play.
GSR Application User Guide, copyright Glyn Blackett page 6
4.3 Rate of Change Display
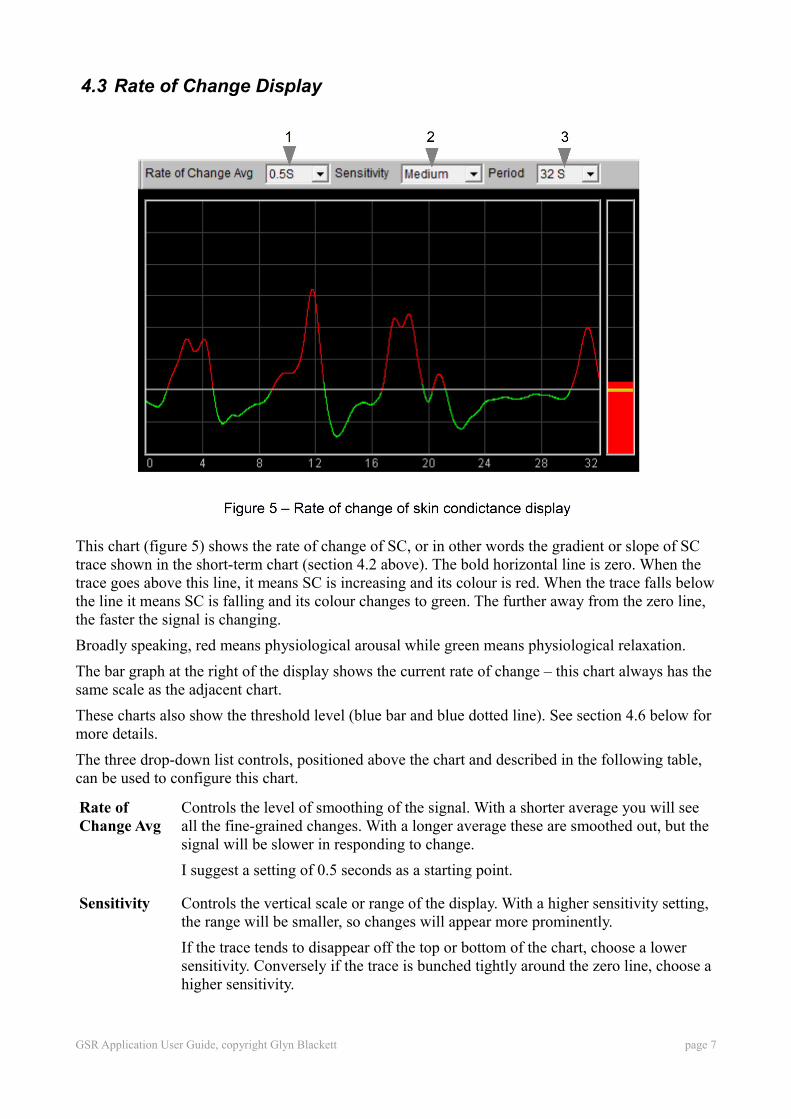
This chart (figure 5) shows the rate of change of SC, or in other words the gradient or slope of SC trace shown in the short-term chart (section 4.2 above). The bold horizontal line is zero. When the trace goes above this line, it means SC is increasing and its colour is red. When the trace falls below the line it means SC is falling and its colour changes to green. The further away from the zero line, the faster the signal is changing.
Broadly speaking, red means physiological arousal while green means physiological relaxation.
The bar graph at the right of the display shows the current rate of change – this chart always has the same scale as the adjacent chart.
These charts also show the threshold level (blue bar and blue dotted line). See section 4.6 below for more details.
The three drop-down list controls, positioned above the chart and described in the following table, can be used to configure this chart.
Rate of Change Avg
Controls the level of smoothing of the signal. With a shorter average you will see all the fine-grained changes. With a longer average these are smoothed out, but the signal will be slower in responding to change.
I suggest a setting of 0.5 seconds as a starting point.
Sensitivity Controls the vertical scale or range of the display. With a higher sensitivity setting, the range will be smaller, so changes will appear more prominently.
If the trace tends to disappear off the top or bottom of the chart, choose a lower sensitivity. Conversely if the trace is bunched tightly around the zero line, choose a higher sensitivity.
GSR Application User Guide, copyright Glyn Blackett page 7
Period This controls the length of time it takes for the traces to traverse the whole chart from right to left – or in other words the horizontal range.
Note that increasing the period after processing has started can have unpredictable consequences, so I recommend you make your selection before pressing play.
4.4 Numeric Displays
The numeric displays show the following data:
Skin Cond. Displays the current skin conductance in micro-Siemens.
Baseline The SC reading at the beginning of the session, or more accurately 30 seconds into the session (to allow a settling period).
You may reset the baseline to the current reading at any time, by pressing the 'Reset' button.
Gain Current SC minus the baseline. This allows you to assess the overall change achieved in your session.
4.5 Long-term Display
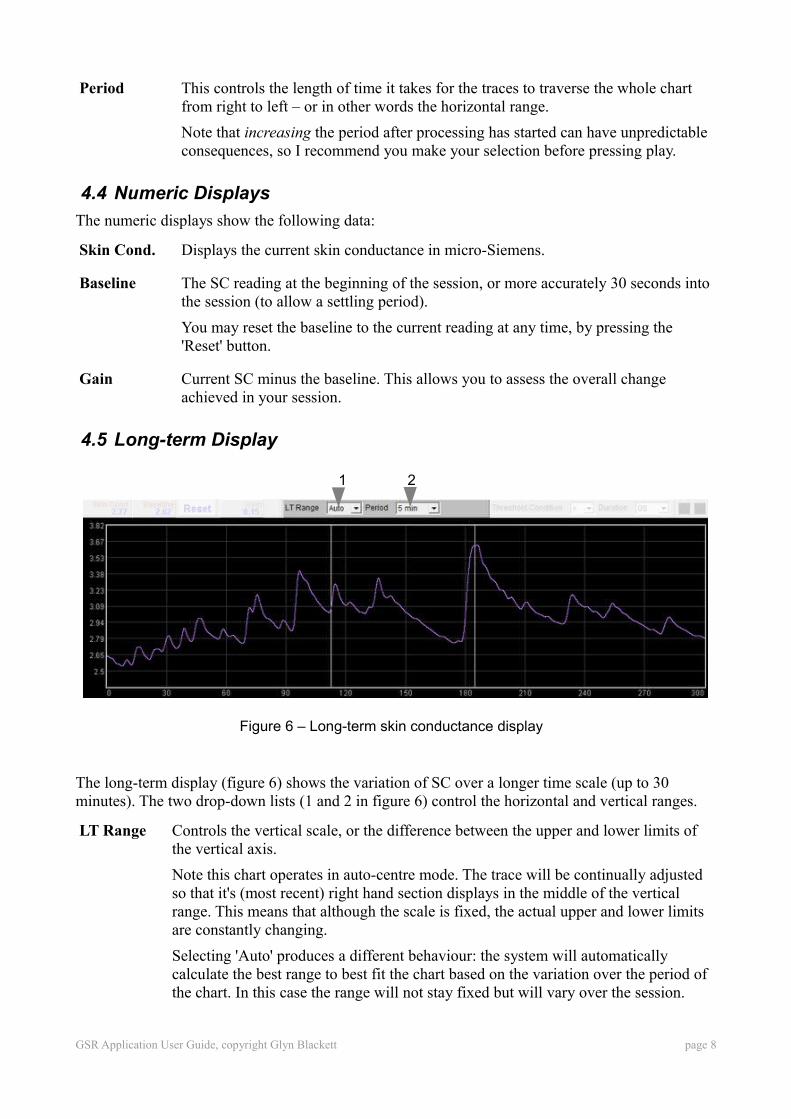
The long-term display (figure 6) shows the variation of SC over a longer time scale (up to 30 minutes). The two drop-down lists (1 and 2 in figure 6) control the horizontal and vertical ranges.
LT Range Controls the vertical scale, or the difference between the upper and lower limits of the vertical axis.
Note this chart operates in auto-centre mode. The trace will be continually adjusted so that it's (most recent) right hand section displays in the middle of the vertical range. This means that although the scale is fixed, the actual upper and lower limits are constantly changing.
Selecting 'Auto' produces a different behaviour: the system will automatically calculate the best range to best fit the chart based on the variation over the period of the chart. In this case the range will not stay fixed but will vary over the session.
GSR Application User Guide, copyright Glyn Blackett page 8
Figure 6 – Long-term skin conductance display
1 2
Period Controls the horizontal (time) range – in other words how long it takes the trace to traverse from right to left.
Note that increasing the period after processing has started can have unpredictable consequences, so I recommend you make your selection before pressing play.
4.6 Threshold Display and Controls
Threshold-based feedback is designed to follow a consistent pattern throughout all the applications, and therefore it made sense to describe threshold functionality in a single place, viz. The Guide to Audio and Threshold-based Feedback (a separate document). I recommend you read that before trying to make sense of this section.
(Controls for threshold-based audio feedback are covered in section 4.7 below.)
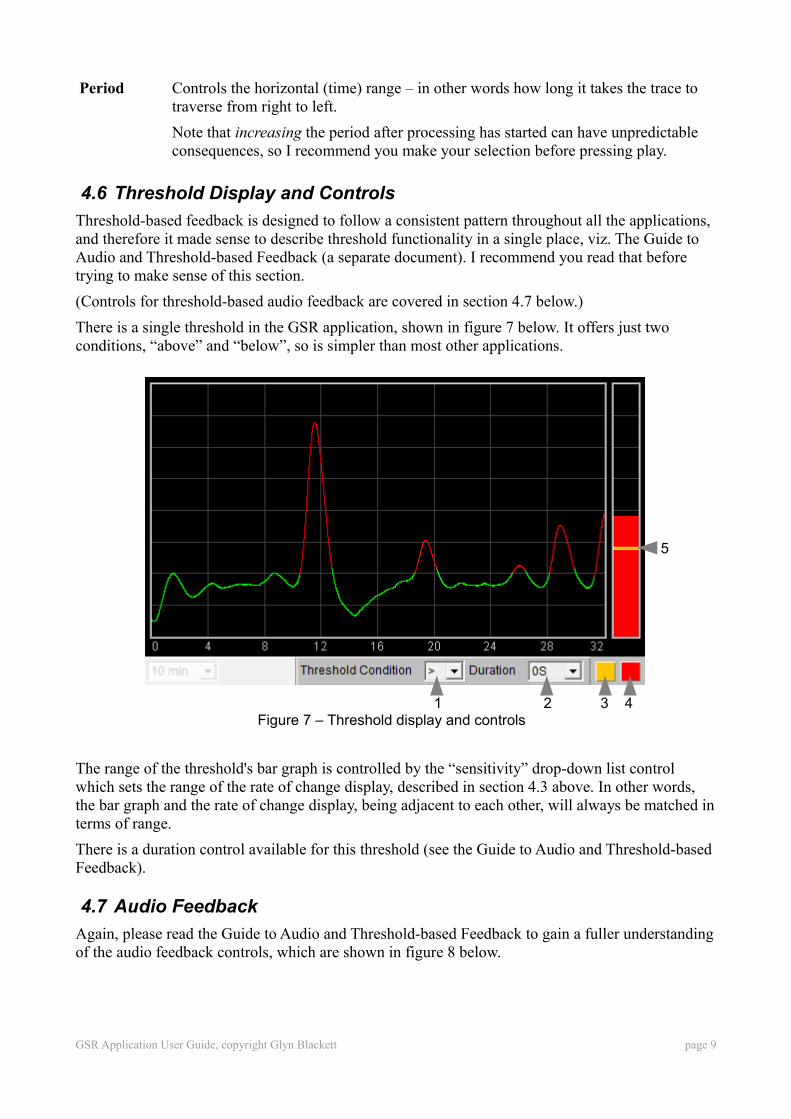
There is a single threshold in the GSR application, shown in figure 7 below. It offers just two conditions, “above” and “below”, so is simpler than most other applications.
The range of the threshold's bar graph is controlled by the “sensitivity” drop-down list control which sets the range of the rate of change display, described in section 4.3 above. In other words, the bar graph and the rate of change display, being adjacent to each other, will always be matched in terms of range.
There is a duration control available for this threshold (see the Guide to Audio and Threshold-based Feedback).
4.7 Audio Feedback
Again, please read the Guide to Audio and Threshold-based Feedback to gain a fuller understanding of the audio feedback controls, which are shown in figure 8 below.
GSR Application User Guide, copyright Glyn Blackett page 9
1 2 3 4
5
Figure 7 – Threshold display and controls

In the GSR application three forms of audio feedback are available: simple tone, midi, and threshold. For the most part audio feedback works as it does in other applications, but there are some features particular to this application:
• Audio feedback has it's own averaging control, distinct from the application's main average (but working in the same way), and labelled 1 in figure 8.
• Tone and midi feedback have their own range control (shown as 2 in figure 8) distinct from the range controls for the short-term and long-term displays.
• Both tone and midi feedback have an “auto-centre” feature, meaning that when the SC change is sufficiently large to take the pitch outside of its range, the pitch is reset to the middle of the range, in effect recalibrating the feedback.
• The threshold has a “duration” control, already mentioned in section 4.5 above, and in consequence there are two lamps, the left lights up (amber) on the initial threshold-cross, while the right lights up (red) only after the “duration” period.
GSR Application User Guide, copyright Glyn Blackett page 10
5 Session ReportsThe application records data so that you can generate a report for your sessions. The report contains summary data and graphs showing the progression of skin conductance over the whole session.
Note that the SC data in the session data file is averaged according to the setting of the short-term SC display (control 2 in figure 4).
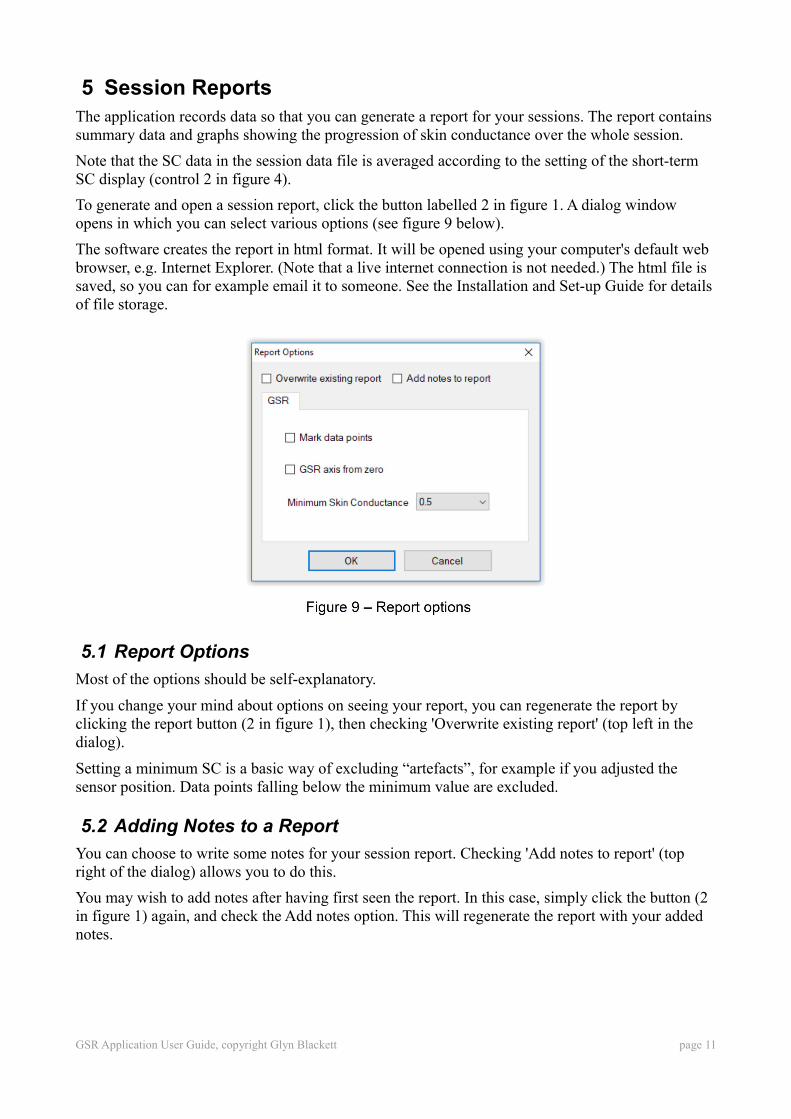
To generate and open a session report, click the button labelled 2 in figure 1. A dialog window opens in which you can select various options (see figure 9 below).
The software creates the report in html format. It will be opened using your computer's default web browser, e.g. Internet Explorer. (Note that a live internet connection is not needed.) The html file is saved, so you can for example email it to someone. See the Installation and Set-up Guide for details of file storage.
5.1 Report Options
Most of the options should be self-explanatory.
If you change your mind about options on seeing your report, you can regenerate the report by clicking the report button (2 in figure 1), then checking 'Overwrite existing report' (top left in the dialog).
Setting a minimum SC is a basic way of excluding “artefacts”, for example if you adjusted the sensor position. Data points falling below the minimum value are excluded.
5.2 Adding Notes to a Report
You can choose to write some notes for your session report. Checking 'Add notes to report' (top right of the dialog) allows you to do this.
You may wish to add notes after having first seen the report. In this case, simply click the button (2 in figure 1) again, and check the Add notes option. This will regenerate the report with your added notes.
GSR Application User Guide, copyright Glyn Blackett page 11
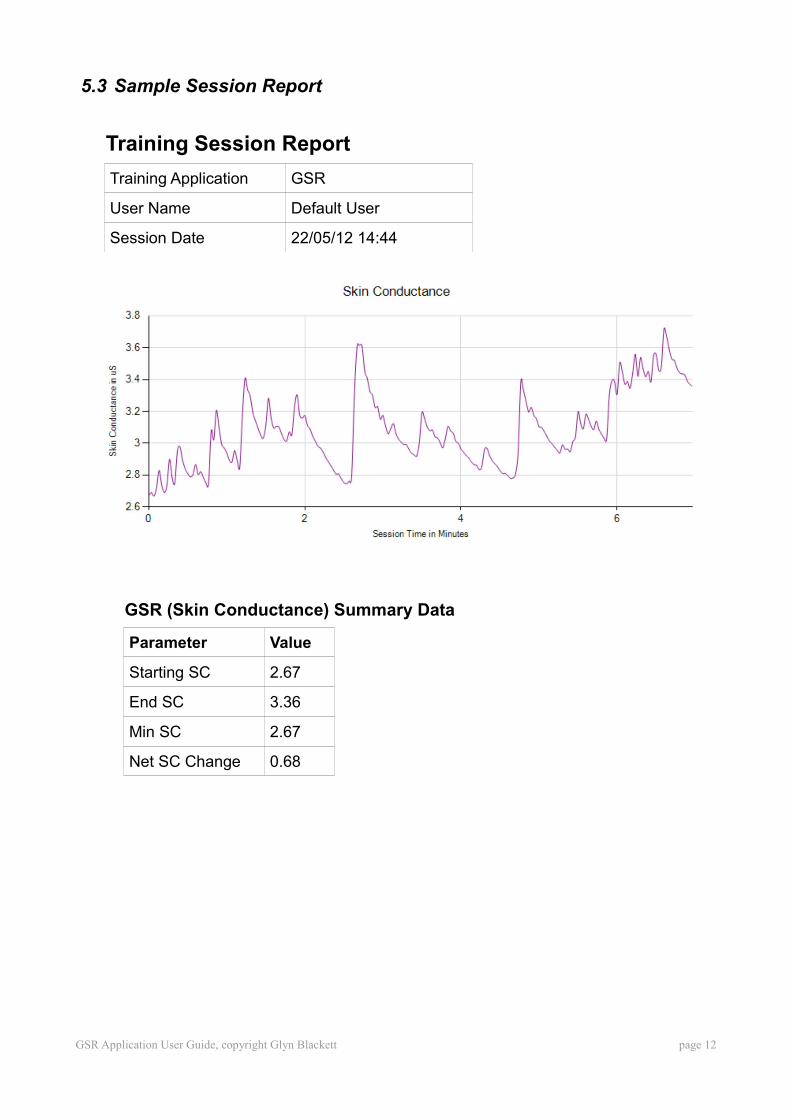
5.3 Sample Session Report
Training Session Report
Training Application GSR
User Name Default User
Session Date 22/05/12 14:44
GSR (Skin Conductance) Summary Data
Parameter Value
Starting SC 2.67
End SC 3.36
Min SC 2.67
Net SC Change 0.68
GSR Application User Guide, copyright Glyn Blackett page 12
6 Application ReportAn application report summarises all the sessions for the currently selected user, in charts and a table.
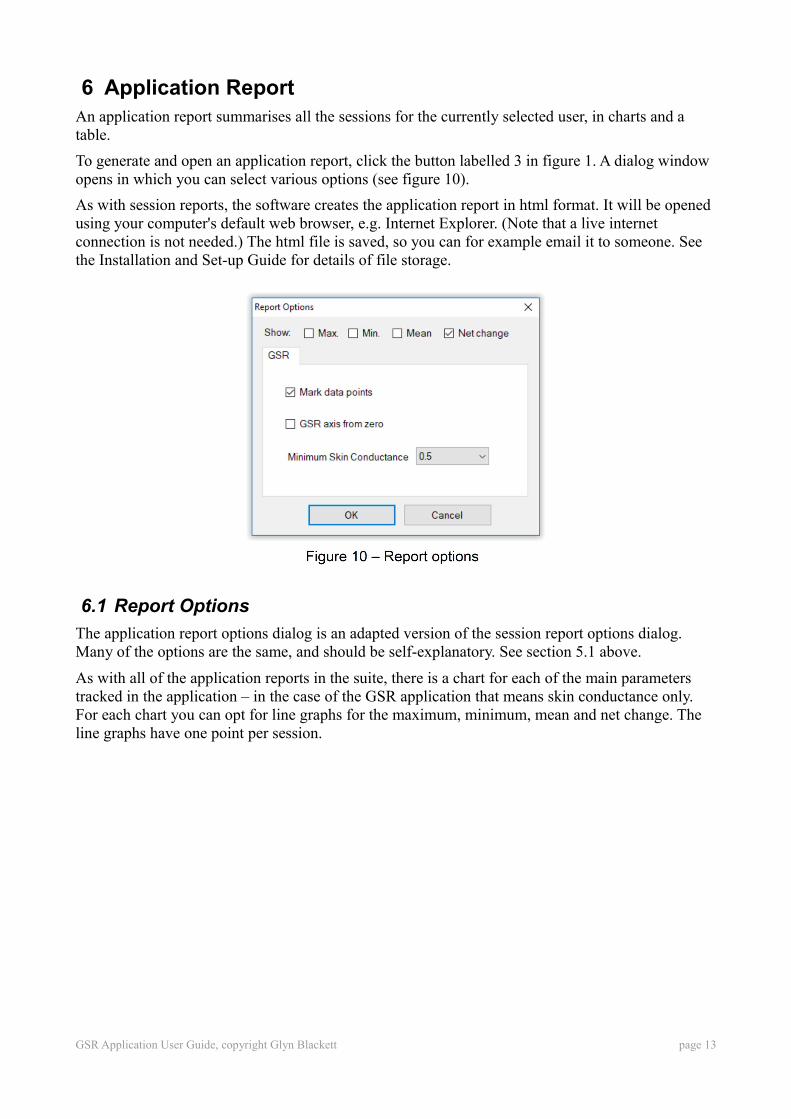
To generate and open an application report, click the button labelled 3 in figure 1. A dialog window opens in which you can select various options (see figure 10).
As with session reports, the software creates the application report in html format. It will be opened using your computer's default web browser, e.g. Internet Explorer. (Note that a live internet connection is not needed.) The html file is saved, so you can for example email it to someone. See the Installation and Set-up Guide for details of file storage.
6.1 Report Options
The application report options dialog is an adapted version of the session report options dialog. Many of the options are the same, and should be self-explanatory. See section 5.1 above.
As with all of the application reports in the suite, there is a chart for each of the main parameters tracked in the application – in the case of the GSR application that means skin conductance only. For each chart you can opt for line graphs for the maximum, minimum, mean and net change. The line graphs have one point per session.
GSR Application User Guide, copyright Glyn Blackett page 13
![Sensor Galvanic Skin Response (GSR) Berbasis Arduino Uno …portal.fmipa.itb.ac.id/skf2015/files/skf_2015_hardiyanto... · 2016-06-18 · penelitian tentang konduktansi kulit [4,5]](https://img.pdfslide.net/doc/110x75/5e2639a7042eb5682935e471/sensor-galvanic-skin-response-gsr-berbasis-arduino-uno-2016-06-18-penelitian.jpg)