Embed Size (px)
Citation preview
This is an electronic reprint of the original article.This reprint may differ from the original in pagination and typographic detail.
Powered by TCPDF (www.tcpdf.org)
This material is protected by copyright and other intellectual property rights, and duplication or sale of all or part of any of the repository collections is not permitted, except that material may be duplicated by you for your research use or educational purposes in electronic or print form. You must obtain permission for any other use. Electronic or print copies may not be offered, whether for sale or otherwise to anyone who is not an authorised user.
Galvis, Leonardo; Bertinetto, Carlo; Holopainen, Ulla; Tamminen, Tarja; Vuorinen, Tapani
Structural and chemical analysis of native and malted barley kernels by polarizedRaman spectroscopy (PRS)
Published in:JOURNAL OF CEREAL SCIENCE
DOI:10.1016/j.jcs.2014.12.008
Published: 01/01/2015
Document VersionPeer reviewed version
Please cite the original version:Galvis, L., Bertinetto, C. G., Holopainen, U., Tamminen, T., & Vuorinen, T. (2015). Structural and chemicalanalysis of native and malted barley kernels by polarized Raman spectroscopy (PRS). JOURNAL OF CEREALSCIENCE, 62(March 2015), 73-80. DOI: 10.1016/j.jcs.2014.12.008
1
Structural and chemical analysis of native and malted barley 1
kernels by polarized Raman spectroscopy (PRS) 2
3
Leonardo Galvisa*, Carlo Bertinettoa, Ulla Holopainenb , Tarja Tamminenb 4
and Tapani Vuorinena5
aAalto University, School of Chemical Technology, P.O Box 16300, 00076 Espoo, Finland. 6
bVTT, Technical Research Centre of Finland, P.O Box 1000, 02044 Espoo, Finland 7
8
* Corresponding author. Tel: +358 50 5124514 9
E-mail addresses: [email protected] (L. Galvis) 10
[email protected] (T. Vuorinen) 11
12
Abstract 13
In this work, barley kernel sections embedded in resin were mapped using polarized 14
Raman spectroscopy (PRS) for evaluation of both chemical and structural changes in 15
endosperm upon malting. A multivariate analysis that includes Band-Target Entropy 16
Minimization (BTEM) was used to resolve the individual spectrum of components 17
present on sections and to reconstruct images based on their relative signal. BTEM-18
resolved spectra matched with several individual model compound spectra that allowed 19
the identification of protein, starch, non-starch carbohydrates, esterified ferulic acid and 20
embedding media. Raman images also revealed chemical changes in the cell walls within 21
starchy endosperm and inside cells due to enzymatic reactions in malting. The anisotropic 22
response of the C-O-C Raman band associated with the orientation of ordered structures 23
*Revised Manuscript with No Changes Marked
2
inside starch granules remains despite a notorious shape distortion of large starch 24
granules. 25
Keywords: Chemical imaging, Malting, Multivariate analysis, Polarized Raman 26
spectroscopy 27
Abbreviations28
(AFM) Atomic Force Microscopy, (BTEM) Band-Target Entropy Minimization, (CV) 29
Coefficient of Variation, (LLS) Linear Least-Squares fit, (PRS) Polarized Raman 30
Spectroscopy, (SD) Standard Deviation 31
1. Introduction 32
The chemical composition and microstructure of cereal kernels determines the outcome 33
of several food processing techniques such as milling, gelatinization and malting 34
(Holopainen et al., 2005). For example, cereal kernels experience a series of chemical and 35
structural changes during malting that lead to both release of fermentable carbohydrates 36
and production of precursors related to desired organoleptic properties for beer 37
production. In this regard, the endosperm microstructure of cereal kernels is also known 38
to play an important role in malting that greatly depends on properties of the protein 39
matrix and packing density of starch in endosperm cells (Chandra et al., 1999). Optical 40
microscopy constitutes the standard technique to obtain information regarding chemical 41
distribution of different compounds inside cereal kernels but requires the implementation 42
of several staining protocols of histological sections. Moreover, the evaluation of 43
microstructure in cereal kernels often requires the use of other complementary 44
microscopic techniques. For instance, confocal scanning laser microscopy (CSLM) and 45
scanning electron microscopy (SEM) have been used to study starch granules of different 46
3
botanical sources (Glaring et al., 2006,van de Velde et al., 2002,Nair et al., 2011). Atomic 47
force microscopy (AFM) has also been employed in the study of isolated starch granules, 48
thus enabling the visualization of ultra-structures on native and mutant pea starch (Ridout 49
et al., 2002). In this context, in situ scanning techniques that provide both chemical and 50
structural information at micron scale in cereal grains open up the opportunity of 51
increasing the knowledge regarding cereal endosperm transformations during malting. 52
Briefly, the malting process begins by the imbibition of barley grains in steeping vessels 53
for 1-2 days in a stage called “steeping”, which induces seed germination. Subsequently, 54
germinating grains are incubated for 3 to 4 days in boxes for sprouting. The aim of this 55
phase is the production of cell wall and protein-degrading enzymes. Finally, the seedlings 56
are dried at 50 to 90oC to stop all metabolic processes inside the seeds by water 57
deprivation and heat effects during a stage called “kilning” (Kleinwächter et al., 2014). 58
Polarized Raman micro-spectroscopy (PRS) constitutes a suitable technique to study 59
cereal kernels during malting since both chemical composition and molecular orientation 60
of materials can be obtained at high spatial resolution (0.6-1μm) without undergoing 61
staining of prepared sections (Jääskeläinen et al., 2013). PRS is based on the analysis of 62
the inelastic scattering of light interacting with molecules, in which the frequency shift 63
between the incident and scattered light is associated with a particular vibration mode of 64
a chemical bond. Several cereal kernels have already been studied by PRS. For instance, 65
wheat kernels were used to investigate the relationship between interstitial protein 66
structure and hardness (Piot et al., 2002) and to characterize arabinoxylans present in the 67
cell wall during the endosperm development (Philippe et al., 2006). Additionally, PRS 68
4
revealed starch granule structure in the endosperm of wild and mutant maize kernels 69
(Wellner et al., 2011), and also the compound distribution of aleurone layer in wheat and 70
barley kernels using basis spectral analysis (Jääskeläinen et al., 2013). 71
In this work, we have studied the chemical and structural properties of both native and 72
malted barley grains endosperm by PRS. The computational analysis carried out enabled 73
us to reconstruct individual components using Band-Target Entropy Minimization 74
(BTEM) and to elaborate images on selected regions corresponding to the aleurone layer-75
starchy endosperm boundary and the centre of the starchy endosperm. To our knowledge, 76
this is the first application of this type of chemometric techniques to the study of cereal 77
kernels. Additionally, we have focused on the analysis of the anisotropic response of the 78
starch Raman band that is related to the orientation of ordered structures inside native and 79
malted barley. 80
2. Materials and Methods 81
2.1. Barley sections 82
Kernels of malting barley (Hordeum vulgare L.) cultivar Fairytale from crop 2010 were 83
studied as native and malted. The malting process was carried out in an industrial 84
production system as follows: barley kernels were steeped twice in conical steeping 85
vessels at 15°C during 13 and 3 hours respectively with a 16-hour air-rest between the 86
steeps. After steeping, the barley kernels were transferred to germination boxes for 6 days 87
at 16°C. The germination process was terminated during kilning using air at 50°C for 17h 88
and finally at 84°C for 4 hours. 89
5
Malted and native barley kernels were then fixed with a solution of 3% paraformaldehyde 90
and 1% glutaraldehyde in 0.10 mol/L sodium potassium phosphate buffer pH 7. 91
Subsequently, kernels were dehydrated in a series of ethanol solutions, embedded in 92
Historesin© (Leica microsystem; Mensheim, Germany) and cut into semi-thin sections (4 93
μm thick) with a rotary microtome (Microm Labogeräte GmbH, Walldorf, Germany) 94
using a tungsten carbon knife. Longitudinal and cross-sections of native and malted 95
barley kernels were then mounted onto glass slides and dried on a heating plate at 40oC. 96
2.2. Model compounds 97
In order to validate the resolved spectra from BTEM, Raman spectra of different model 98
compounds, namely gliadin (Sigma-Aldrich), arabinoxylan from rye (Secale cereal L.; 99
Leuven Bioproducts), barley starch (Berner), (1 3,1 4)- -D glucan (Megazyme) and 100
ferulic acid (Sigma Aldrich), were recorded. 101
2.3. Atomic force microscopy (AFM) 102
A single large starch granule embedded in the endosperm of native barley seeds was 103
mapped by atomic force microscopy using an AFM instrument that is coupled to a WITec 104
alpha 300 Raman microscope (alpha 300, WITec, Ulm, Germany). The image was 105
obtained in air using silicon NCR cantilevers (Nanoworld Germany) with a tip radius 106
below 10 nm and a nominal force constant of 42 N.m-1, operating in tapping mode 107
(resonance frequency 285 kHz). Topographic and amplitude mode images were recorded. 108
The image size was 25x25 m2 and the scan frequency 1Hz. No further image processing 109
was performed. 110
6
2.4. Raman spectroscopy 111
For Raman experiments, a continuous excitation laser beam was focused down to a 112
micrometre sized spot on the barley sections through a confocal Raman microscope 113
equipped with a piezo-scanner. A frequency doubled Nd:YAG, 532 nm linear polarized 114
excitation laser (~20 mW) was used in combination with a 100X (Nikon, NA = 0.90) 115
microscope objective. The polarization angle of the laser was rotated using a half-wave 116
plate in the optical pathway. The spectra were acquired using a CCD camera (Andor 117
Newton DU970-BV, Andor Technology plc, Belfast, UK) behind a grating (600 g mm−1) 118
spectrograph with a spectral resolution of 2-3 cm−1. For mapping, the surface of the 119
barley sections were scanned with steps of 1 m, integrating the signal for 0.3 s and using 120
0o polarization of the exciting laser. Several histological sections of native and different 121
malting time points were available to study under PRS. Optical microscope images were 122
employed to select the more representative of malted kernels. For PRS mapping, ten 123
histological sections (five longitudinal and five cross-sections) of each native and malted 124
kernels were used. For polarization experiments, the starch spectra were collected on 125
different spots of a single large starch granule in native barley, integrating the signal for 1 126
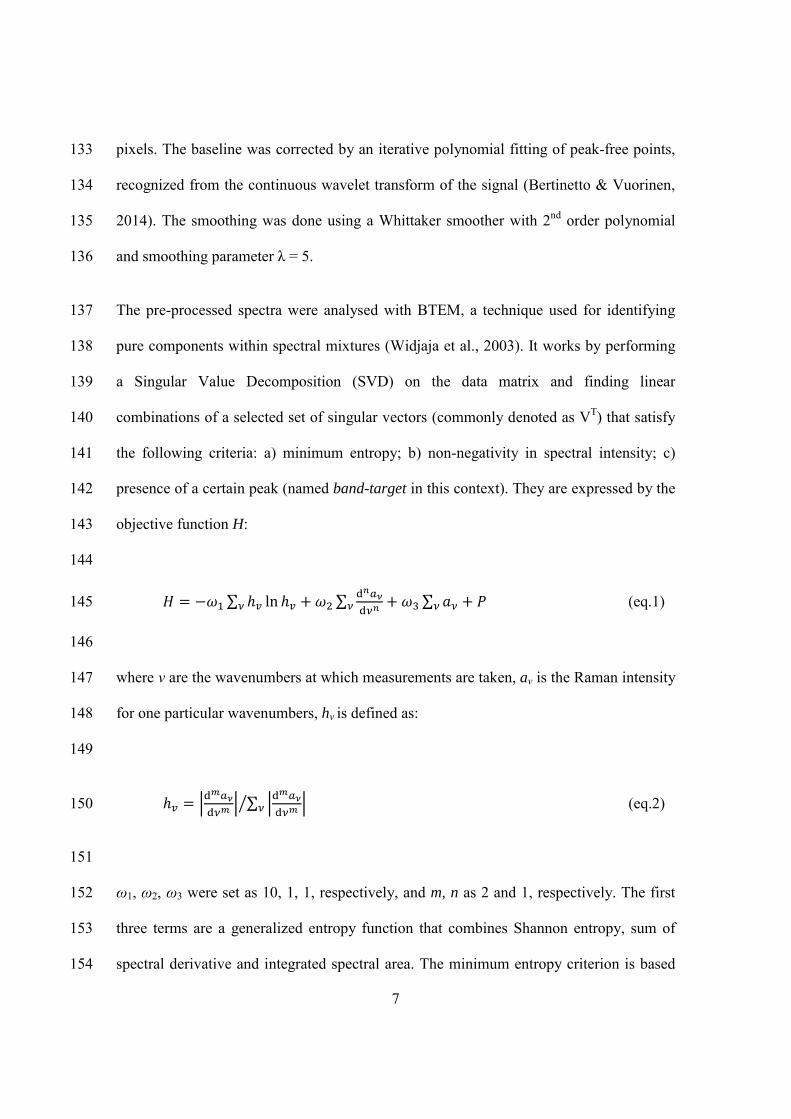
s at different polarization direction ranging from -90 o to 90o with steps of 15o.127
2.5. Analysis of Raman images 128
All spectra were first pre-processed by removing cosmic ray peaks, correcting the 129
baseline drift, restricting the wavenumber range to 320-1800 cm-1, smoothing and 130
normalizing by the Euclidean norm. Cosmic peaks were removed using an in-house 131
written algorithm based on the comparison of differential spectra among neighbouring 132
7
pixels. The baseline was corrected by an iterative polynomial fitting of peak-free points, 133
recognized from the continuous wavelet transform of the signal (Bertinetto & Vuorinen, 134
2014). The smoothing was done using a Whittaker smoother with 2nd order polynomial 135
and smoothing parameter = 5. 136
The pre-processed spectra were analysed with BTEM, a technique used for identifying 137
pure components within spectral mixtures (Widjaja et al., 2003). It works by performing 138
a Singular Value Decomposition (SVD) on the data matrix and finding linear 139
combinations of a selected set of singular vectors (commonly denoted as VT) that satisfy 140
the following criteria: a) minimum entropy; b) non-negativity in spectral intensity; c) 141
presence of a certain peak (named band-target in this context). They are expressed by the 142
objective function H: 143
144
(eq.1) 145
146
where are the wavenumbers at which measurements are taken, a is the Raman intensity 147
for one particular wavenumbers, h is defined as:148
149
(eq.2) 150
151
1, 2, 3 were set as 10, 1, 1, respectively, and m, n as 2 and 1, respectively. The first 152
three terms are a generalized entropy function that combines Shannon entropy, sum of 153
spectral derivative and integrated spectral area. The minimum entropy criterion is based 154
8
on the principle that a pure component always has lower entropy than a mixture 155
containing it. The fourth term P in eq. 1 is a penalty function that takes very large values 156
in the occurrence of negative spectral intensities. The presence of the band-target in the 157
final reconstructed spectrum is guaranteed by a peak-normalization step before every 158
evaluation of H. The BTEM algorithm is run several times yielding a different solution, 159
and thus a possible pure component, for each band-target. In our implementation, the 160
band-targets were searched automatically (Tan et al., 2009) and the optimum for H was 161
found by means of a Particle Swarm Optimizer (http://psotoolbox.sourceforge.net/, 162
2014). 163
In parallel with the application of BTEM directly to the whole matrix of pre-processed 164
spectra, BTEM was also applied to two sets of cluster-averaged spectra. Clustering was 165
performed on the pre-processed data compressed by PCA, retaining the principal 166
components explaining 85-90% of the total variance. The first set was obtained with 167
hierarchical clustering, using city-block distance, complete linkage and selecting a 168
partition with a number of clusters approximately equal to 1/100 of the total number of 169
pixels in the image. The second set was obtained with the k-means method, using city-170
block distance, setting a number of clusters ~1/10 of the total number of pixels, running 171
the algorithm 1000 times with different random initializations and retaining the partition 172
with the lowest sum of squared errors. Prior to the clustering step, the noisiest spectra 173
were filtered out to avoid the risk of averaging them with good ones and thus severely 174
distorting the signal. The cluster-averaging suppressed some noise that was not 175
eliminated during pre-processing and brought about a more compact SVD, with fewer VT176
9
needed to describe the data. The number of VT used for running the BTEM algorithm was 177
chosen by visual inspection; in a few cases, different numbers of VT were tried. 178
All the BTEM runs mentioned above (i.e. on whole image, on two sets of cluster-179
averaged spectra and on occasional alternate VT sets) yielded a superset of solutions, on 180
which a post-screening was carried out to identify the pure components in the sample. 181
The best solutions were selected by removing near-identical ones and by comparing with 182
the spectra of model compounds. Images of the relative concentration of each identified 183
compound were generated by a linear least-squares (LLS) fit of the selected BTEM 184
solution (basis set) on the Raman spectra. In a few cases, different basis sets were tried 185
and the one with the best fit and no negative concentrations (with some tolerance for 186
noisy points) were retained.187
188
2.6 Analysis of anisotropic response in starch spectra 189
Analysis of the signal variation at different polarization directions of the laser was 190
initially carried out to evaluate the anisotropic behaviour of spectral peaks within a starch 191
granule. Firstly, the spectra were pre-processed by removing cosmic ray peaks, correcting 192
the baseline (using the same algorithms as above), restricting the wavenumber range to 193
280-1650 cm-1, smoothing and dividing every spectrum by the sum of the Euclidean 194
norms of the spectra belonging to the same pixel. This last operation homogenized the 195
total intensity at each pixel, which was affected by non-uniform sample depth, without 196
suppressing the variability related to the polarization angle. Secondly, a spectrum of the 197
Standard Deviation (SD) of the Raman intensities among thirteen polarization angles was 198
calculated for every pixel of the image. These SD spectra were then processed by 199
10
hierarchical clustering (using Euclidean distance and Ward linkage) to identify the region 200
in the image showing the most pronounced Raman anisotropic behaviour. For this region, 201
a spectrum of the Coefficient of Variation (CV) was computed by dividing the SD 202
spectrum by the average (pixel-normalized) Raman spectrum. The anisotropy of each 203
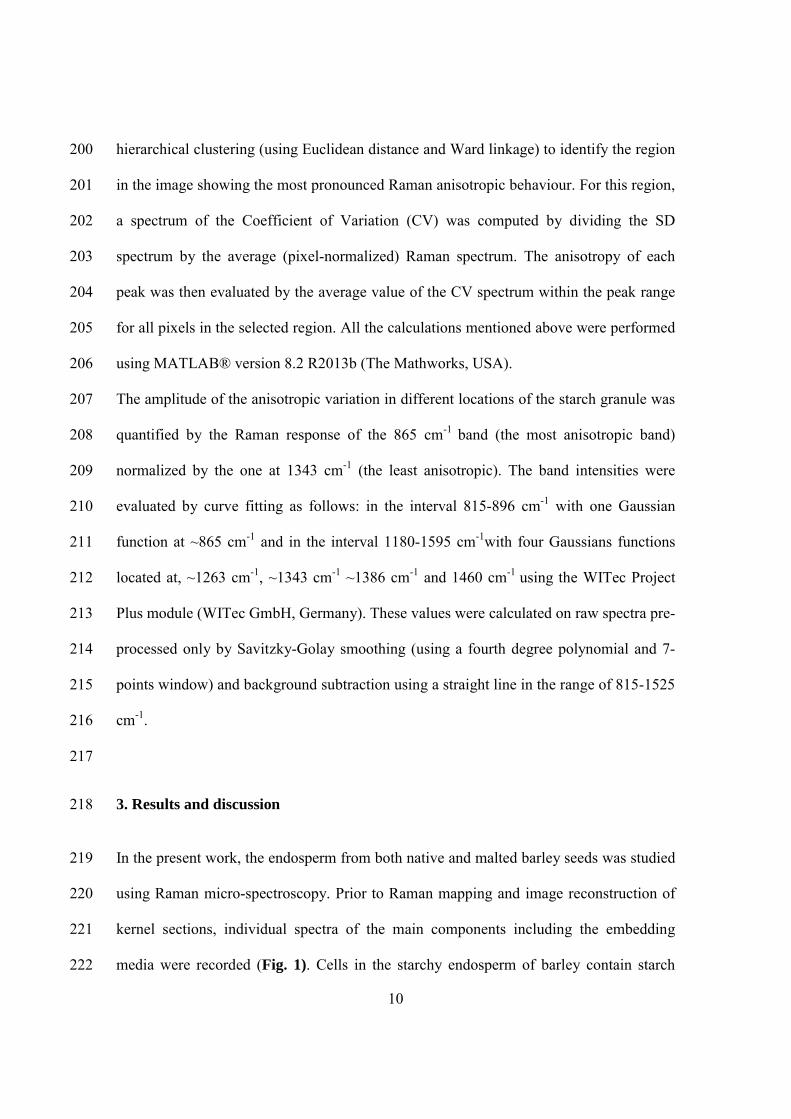
peak was then evaluated by the average value of the CV spectrum within the peak range 204
for all pixels in the selected region. All the calculations mentioned above were performed 205
using MATLAB® version 8.2 R2013b (The Mathworks, USA). 206
The amplitude of the anisotropic variation in different locations of the starch granule was 207
quantified by the Raman response of the 865 cm-1 band (the most anisotropic band) 208
normalized by the one at 1343 cm-1 (the least anisotropic). The band intensities were 209
evaluated by curve fitting as follows: in the interval 815-896 cm-1 with one Gaussian 210
function at ~865 cm-1 and in the interval 1180-1595 cm-1with four Gaussians functions 211
located at, ~1263 cm-1, ~1343 cm-1 ~1386 cm-1 and 1460 cm-1 using the WITec Project 212
Plus module (WITec GmbH, Germany). These values were calculated on raw spectra pre-213
processed only by Savitzky-Golay smoothing (using a fourth degree polynomial and 7-214
points window) and background subtraction using a straight line in the range of 815-1525 215
cm-1.216
217
3. Results and discussion 218
In the present work, the endosperm from both native and malted barley seeds was studied 219
using Raman micro-spectroscopy. Prior to Raman mapping and image reconstruction of 220
kernel sections, individual spectra of the main components including the embedding 221
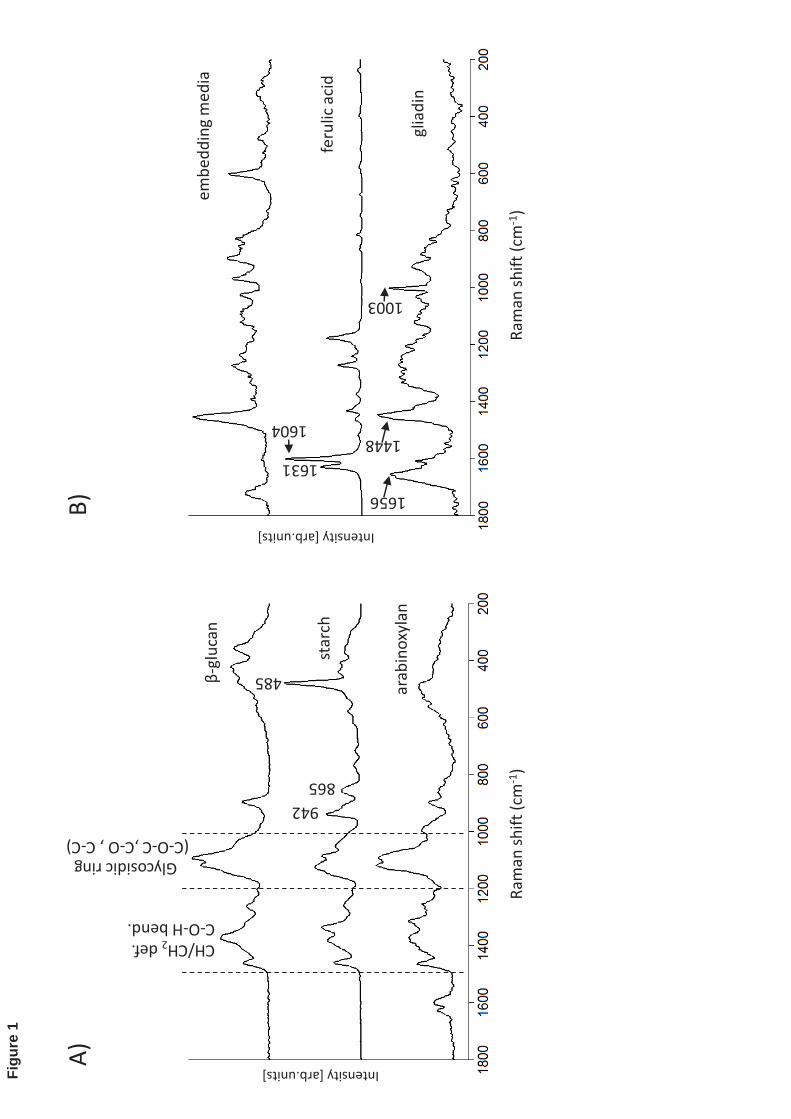
media were recorded (Fig. 1). Cells in the starchy endosperm of barley contain starch 222
11
granules embedded in a protein matrix and cell walls composed of arabinoxylan and 223
(1 3, 1 4)- -D glucans. Other minor components of the cell walls are cellulose, 224
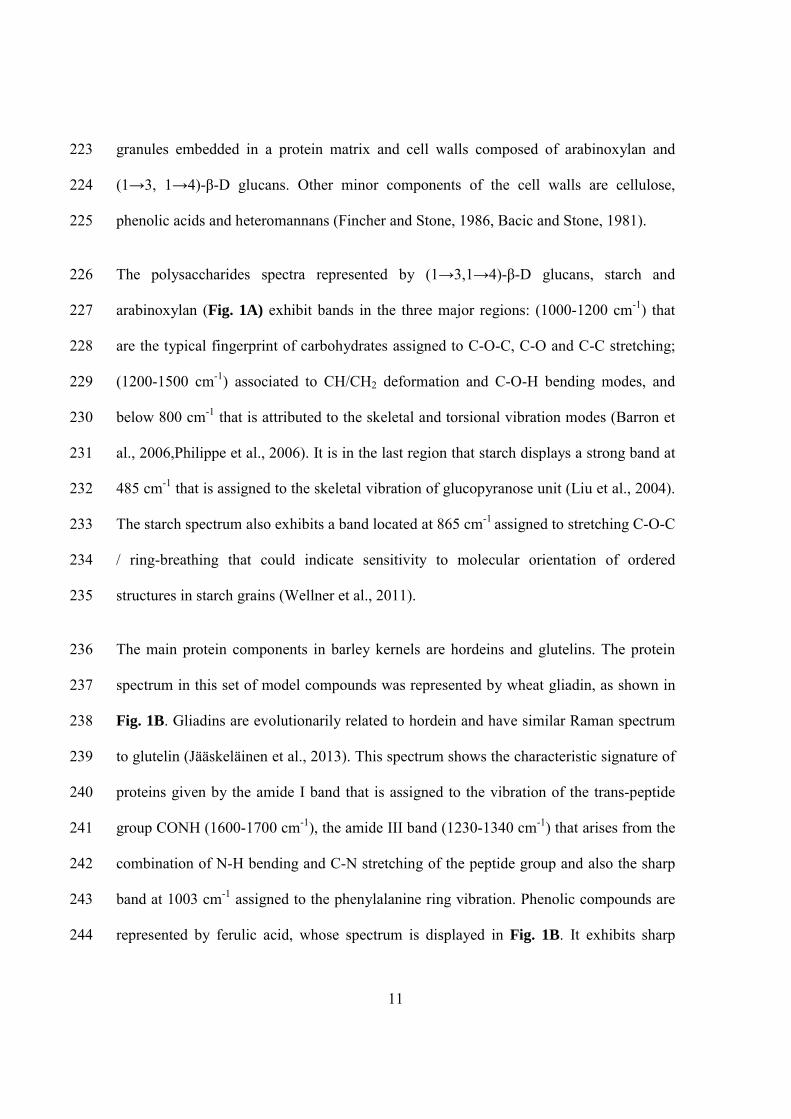
phenolic acids and heteromannans (Fincher and Stone, 1986, Bacic and Stone, 1981). 225
The polysaccharides spectra represented by (1 3,1 4)- -D glucans, starch and 226
arabinoxylan (Fig. 1A) exhibit bands in the three major regions: (1000-1200 cm-1) that 227
are the typical fingerprint of carbohydrates assigned to C-O-C, C-O and C-C stretching; 228
(1200-1500 cm-1) associated to CH/CH2 deformation and C-O-H bending modes, and 229
below 800 cm-1 that is attributed to the skeletal and torsional vibration modes (Barron et 230
al., 2006,Philippe et al., 2006). It is in the last region that starch displays a strong band at 231
485 cm-1 that is assigned to the skeletal vibration of glucopyranose unit (Liu et al., 2004). 232
The starch spectrum also exhibits a band located at 865 cm-1 assigned to stretching C-O-C 233
/ ring-breathing that could indicate sensitivity to molecular orientation of ordered 234
structures in starch grains (Wellner et al., 2011). 235
The main protein components in barley kernels are hordeins and glutelins. The protein 236
spectrum in this set of model compounds was represented by wheat gliadin, as shown in 237
Fig. 1B. Gliadins are evolutionarily related to hordein and have similar Raman spectrum 238
to glutelin (Jääskeläinen et al., 2013). This spectrum shows the characteristic signature of 239
proteins given by the amide I band that is assigned to the vibration of the trans-peptide 240
group CONH (1600-1700 cm-1), the amide III band (1230-1340 cm-1) that arises from the 241
combination of N-H bending and C-N stretching of the peptide group and also the sharp 242
band at 1003 cm-1 assigned to the phenylalanine ring vibration. Phenolic compounds are 243
represented by ferulic acid, whose spectrum is displayed in Fig. 1B. It exhibits sharp 244
12
bands at 1604 and 1631 cm-1 that are assigned to the aromatic ring vibration and to C=C 245
side-chain stretching, respectively. The same doublets on the region 1590-1630 cm-1 are 246
observed in the arabinoxylan spectrum due to the presence of covalently bonded ferulic 247
acid to its structure (Ka uráková et al., 1999). Due to band overlapping among the Raman 248
spectra of the carbohydrates, protein and the embedding media, a multivariate analysis 249
that includes BTEM was performed in order to reconstruct the Raman spectrum of the 250
main components present in barley sections. The selected areas mapped by PRS for 251
native and malted barley grains correspond to the boundary starchy endosperm-aleurone 252
layer and the centre of the starchy endosperm. An example of the BTEM-reconstructed 253
spectra of the components present in boundary starchy endosperm-aleurone layer is 254
shown in Fig. 2. Reconstructed spectra match well with the authentic spectra 255
corresponding to protein, starch, non-starch carbohydrates and the embedding media. The 256
spectrum D in Fig. 2 shows the typical doublet band of ferulic acid but with a slight 257
frequency shift of the band located at 1604 cm-1 in pure ferulic acid to 1599 cm-1 in the 258
reconstructed spectra. This shifting has been attributed to the influence of the 259
environment on the esterified form of ferulic acid present in the aleurone cell wall (Piot et 260
al., 2000). Another interesting aspect of this reconstructed spectrum is the presence of a 261
small band at ~1660-1725 cm-1 that is associated with the carbonyl group present in 262
esters (Movasaghi et al., 2007, Calheiros et al., 2008). Moreover, peaks in the range 263
~1100-1500 cm-1 are less sharp than in the model compound, which is probably due to 264
the pure crystalline state of the latter as opposed to the complex mixture of substances 265
present in the barley kernel. 266
13
The reconstructed spectrum E related to proteins clearly shows the characteristic amide I 267
(1600-1700 cm-1), amide III (1230-1340 cm-1) and phenylalanine ring (~1003 cm-1) 268
vibrations. The spectrum F did not match any of the model compounds but appears as a 269
result of the contribution of anisotropic starch bands during BTEM analysis, especially 270
the one at 865 cm-1 that is sensitive to the orientation of molecules within starch granules 271
(see discussion below). It is worth noting such detailed information is often lost during 272
the pre-processing phase, therefore the presence of this spectrum among the BTEM 273
solutions denotes a very effective chemometric analysis. On the other hand, it was not 274
possible to obtain clearly distinct reconstructions for the spectra of arabinoxylan and (1-275
3) (1-4) -D-glucans, probably because of their highly similar spectral features or 276
insufficient signal-to-noise ratio in the relevant areas of the image. In this sense, it is 277
better to account for this spectrum as ‘non-starch cell wall carbohydrate’ (spectrum A) 278
that according to its location in barley seeds might represent arabinoxylan (71%) in the 279
endosperm aleurone layer or (1-3) (1-4) -D-glucans (75%) in the starchy endosperm 280
(Bacic and Stone, 1981). 281
Using computationally reconstructed spectra as opposed to spectra of model compounds 282
to resolve Raman images has two main advantages. The first one, which was already 283
previously mentioned, is that reconstructed spectra are probably more similar to the 284
actual spectrum of the component inside the sample. The second is that this 285
computational approach provides an objective and reliable way to identify which 286
components should form the basis set. The choice of the basis set has indeed a great 287
influence on the subsequent fit; however, when using only a priori chemical knowledge, 288
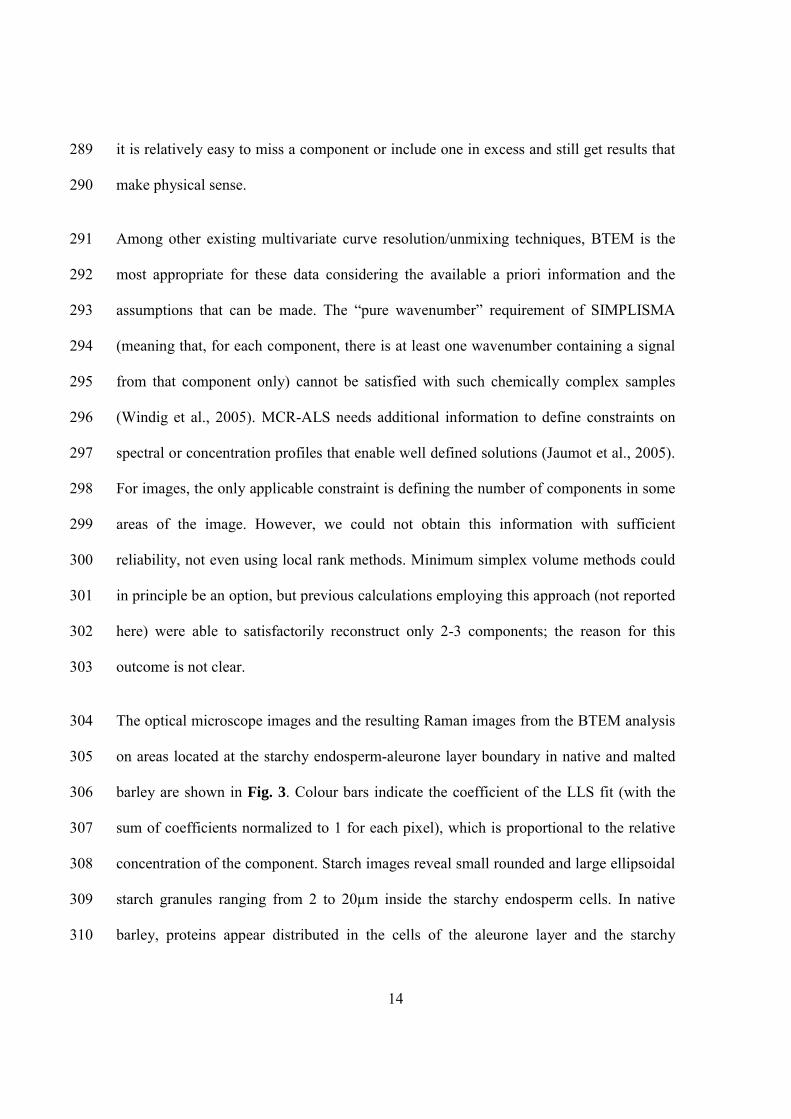
14
it is relatively easy to miss a component or include one in excess and still get results that 289
make physical sense. 290
Among other existing multivariate curve resolution/unmixing techniques, BTEM is the 291
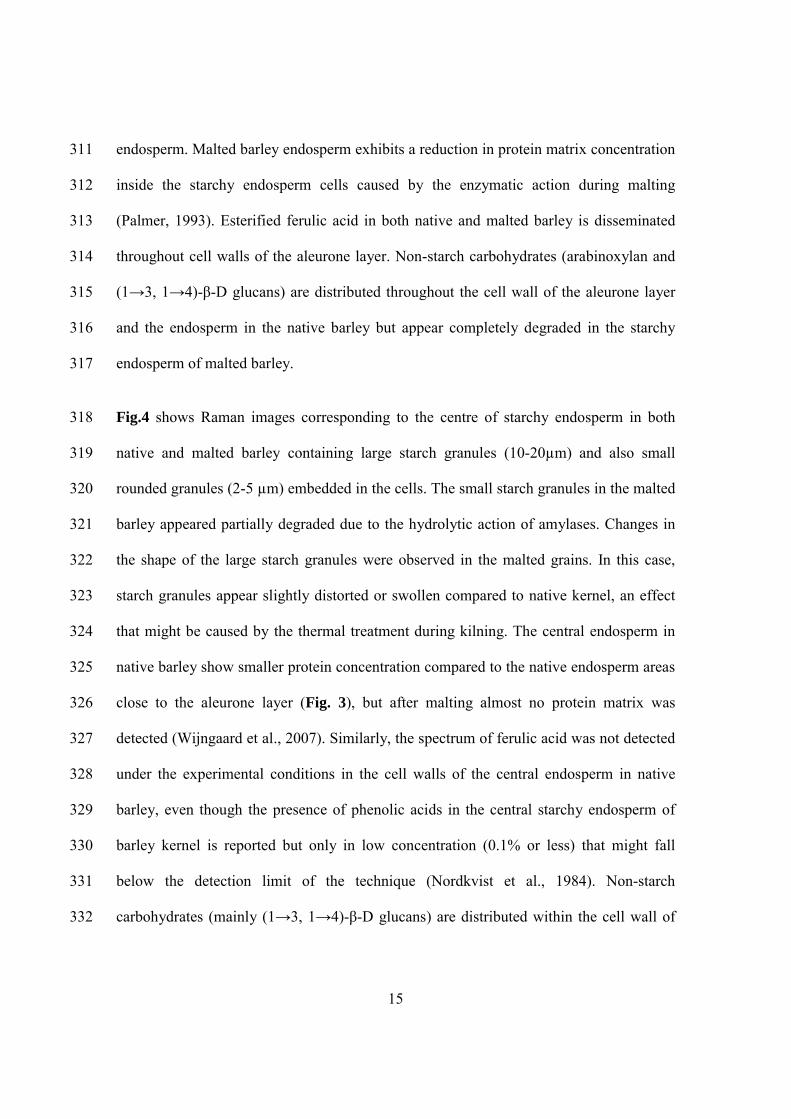
most appropriate for these data considering the available a priori information and the 292
assumptions that can be made. The “pure wavenumber” requirement of SIMPLISMA 293
(meaning that, for each component, there is at least one wavenumber containing a signal 294
from that component only) cannot be satisfied with such chemically complex samples 295
(Windig et al., 2005). MCR-ALS needs additional information to define constraints on 296
spectral or concentration profiles that enable well defined solutions (Jaumot et al., 2005). 297
For images, the only applicable constraint is defining the number of components in some 298
areas of the image. However, we could not obtain this information with sufficient 299
reliability, not even using local rank methods. Minimum simplex volume methods could 300
in principle be an option, but previous calculations employing this approach (not reported 301
here) were able to satisfactorily reconstruct only 2-3 components; the reason for this 302
outcome is not clear. 303
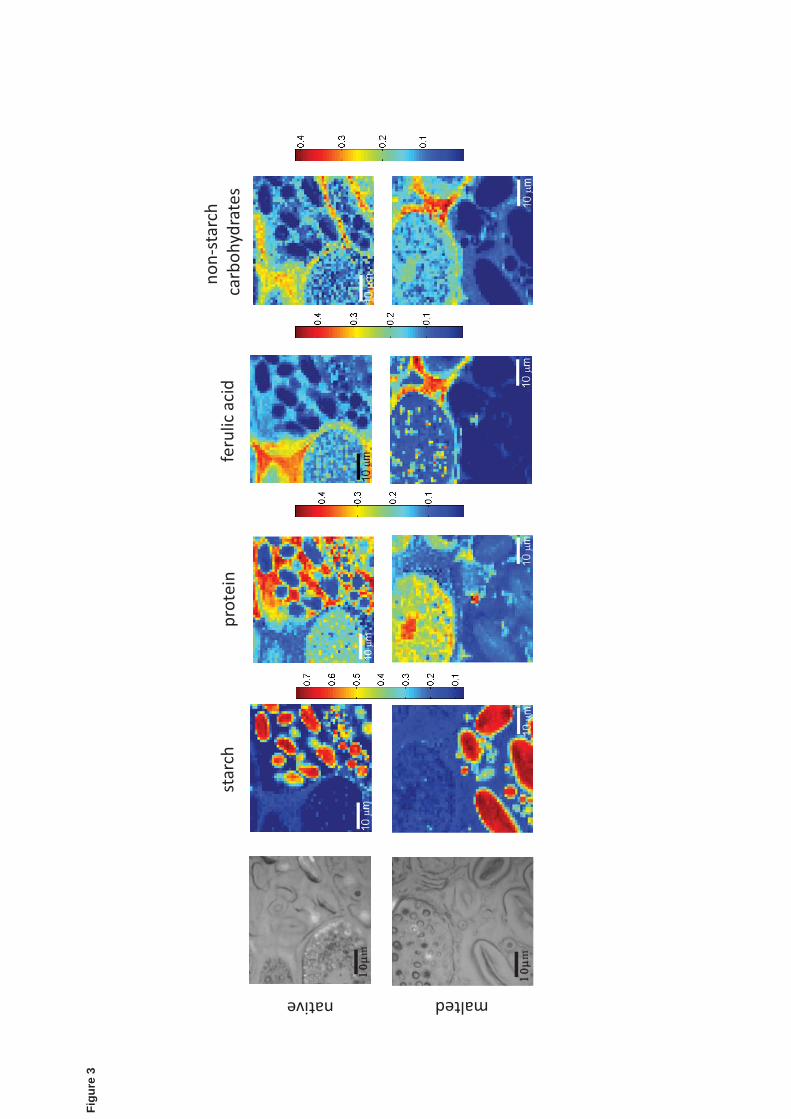
The optical microscope images and the resulting Raman images from the BTEM analysis 304
on areas located at the starchy endosperm-aleurone layer boundary in native and malted 305
barley are shown in Fig. 3. Colour bars indicate the coefficient of the LLS fit (with the 306
sum of coefficients normalized to 1 for each pixel), which is proportional to the relative 307
concentration of the component. Starch images reveal small rounded and large ellipsoidal 308
starch granules ranging from 2 to 20μm inside the starchy endosperm cells. In native 309
barley, proteins appear distributed in the cells of the aleurone layer and the starchy 310
15
endosperm. Malted barley endosperm exhibits a reduction in protein matrix concentration 311
inside the starchy endosperm cells caused by the enzymatic action during malting 312
(Palmer, 1993). Esterified ferulic acid in both native and malted barley is disseminated 313
throughout cell walls of the aleurone layer. Non-starch carbohydrates (arabinoxylan and 314
(1 3, 1 4)- -D glucans) are distributed throughout the cell wall of the aleurone layer 315
and the endosperm in the native barley but appear completely degraded in the starchy 316
endosperm of malted barley. 317
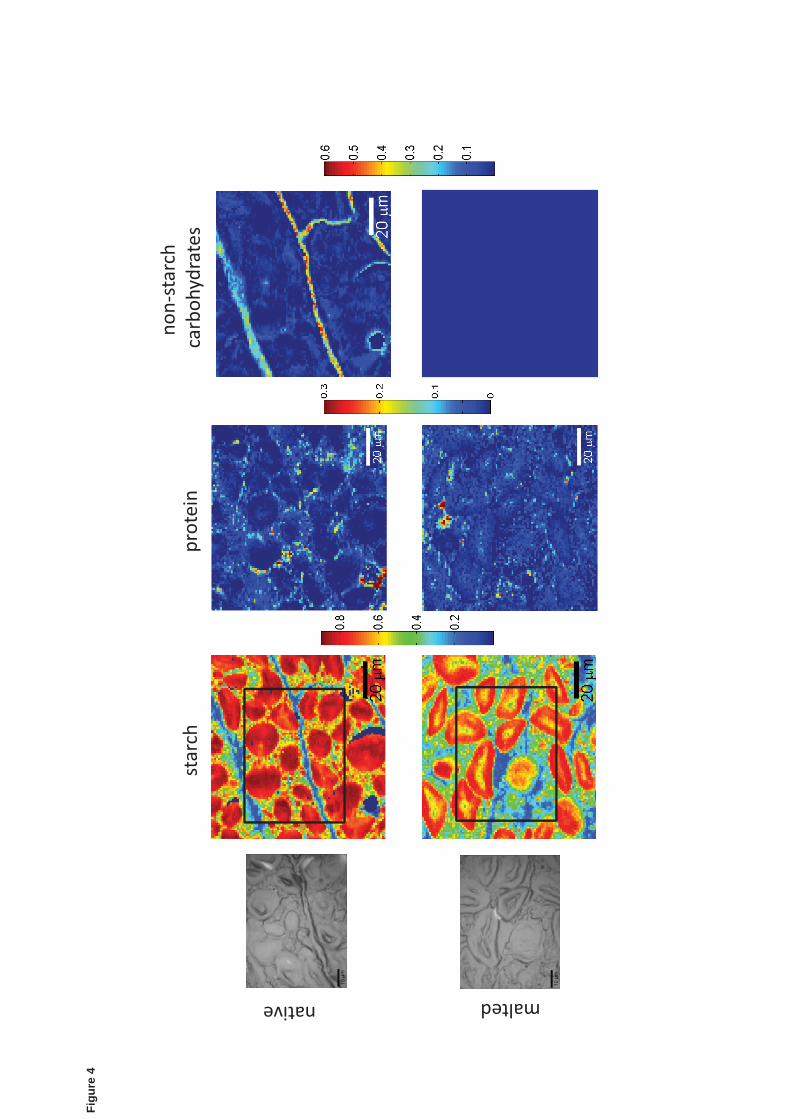
Fig.4 shows Raman images corresponding to the centre of starchy endosperm in both 318
native and malted barley containing large starch granules (10-20μm) and also small 319
rounded granules (2-5 μm) embedded in the cells. The small starch granules in the malted 320
barley appeared partially degraded due to the hydrolytic action of amylases. Changes in 321
the shape of the large starch granules were observed in the malted grains. In this case, 322
starch granules appear slightly distorted or swollen compared to native kernel, an effect 323
that might be caused by the thermal treatment during kilning. The central endosperm in 324
native barley show smaller protein concentration compared to the native endosperm areas 325
close to the aleurone layer (Fig. 3), but after malting almost no protein matrix was 326
detected (Wijngaard et al., 2007). Similarly, the spectrum of ferulic acid was not detected 327
under the experimental conditions in the cell walls of the central endosperm in native 328
barley, even though the presence of phenolic acids in the central starchy endosperm of 329
barley kernel is reported but only in low concentration (0.1% or less) that might fall 330
below the detection limit of the technique (Nordkvist et al., 1984). Non-starch 331
carbohydrates (mainly (1 3, 1 4)- -D glucans) are distributed within the cell wall of 332
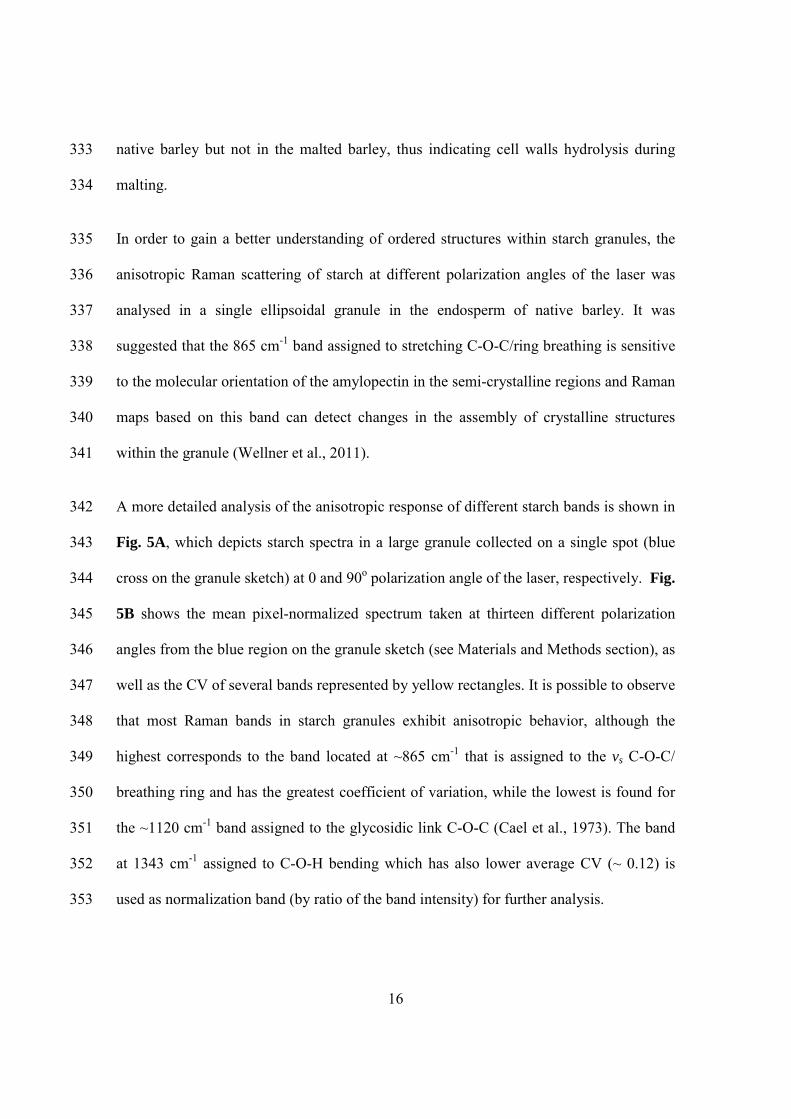
16
native barley but not in the malted barley, thus indicating cell walls hydrolysis during 333
malting. 334
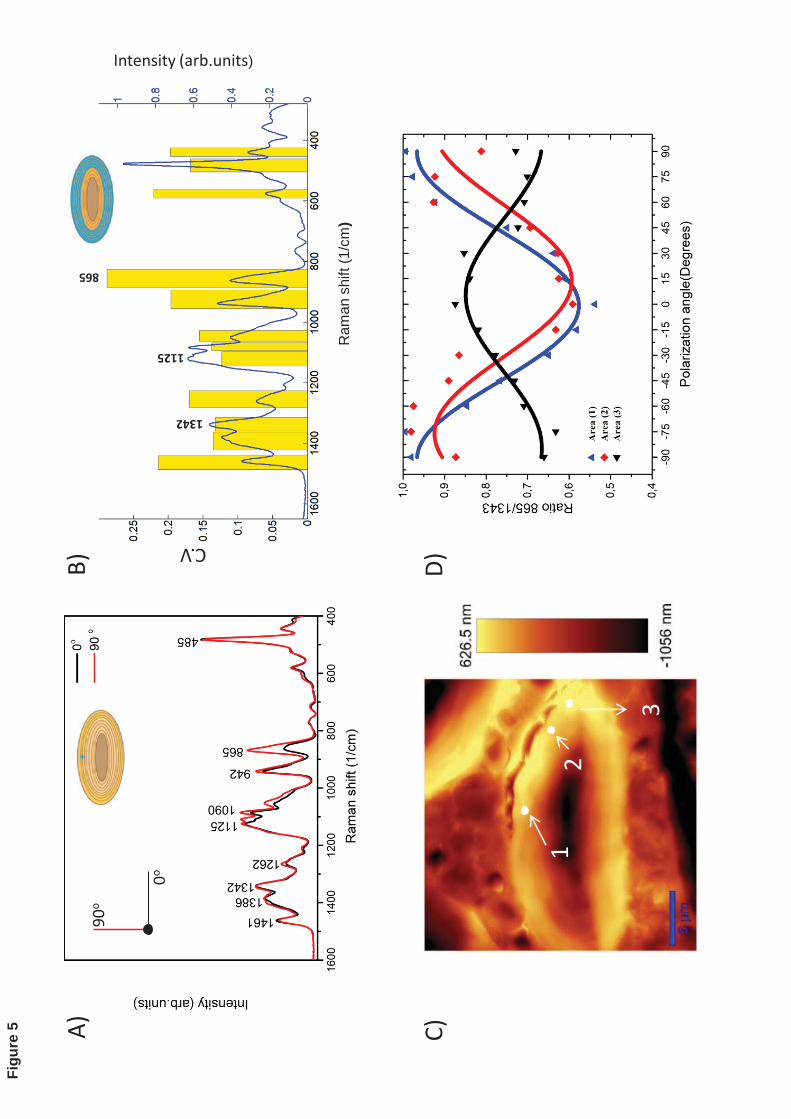
In order to gain a better understanding of ordered structures within starch granules, the 335
anisotropic Raman scattering of starch at different polarization angles of the laser was 336
analysed in a single ellipsoidal granule in the endosperm of native barley. It was 337
suggested that the 865 cm-1 band assigned to stretching C-O-C/ring breathing is sensitive 338
to the molecular orientation of the amylopectin in the semi-crystalline regions and Raman 339
maps based on this band can detect changes in the assembly of crystalline structures 340
within the granule (Wellner et al., 2011). 341
A more detailed analysis of the anisotropic response of different starch bands is shown in 342
Fig. 5A, which depicts starch spectra in a large granule collected on a single spot (blue 343
cross on the granule sketch) at 0 and 90o polarization angle of the laser, respectively. Fig. 344
5B shows the mean pixel-normalized spectrum taken at thirteen different polarization 345
angles from the blue region on the granule sketch (see Materials and Methods section), as 346
well as the CV of several bands represented by yellow rectangles. It is possible to observe 347
that most Raman bands in starch granules exhibit anisotropic behavior, although the 348
highest corresponds to the band located at ~865 cm-1 that is assigned to the vs C-O-C/ 349
breathing ring and has the greatest coefficient of variation, while the lowest is found for 350
the ~1120 cm-1 band assigned to the glycosidic link C-O-C (Cael et al., 1973). The band 351
at 1343 cm-1 assigned to C-O-H bending which has also lower average CV (~ 0.12) is 352
used as normalization band (by ratio of the band intensity) for further analysis. 353
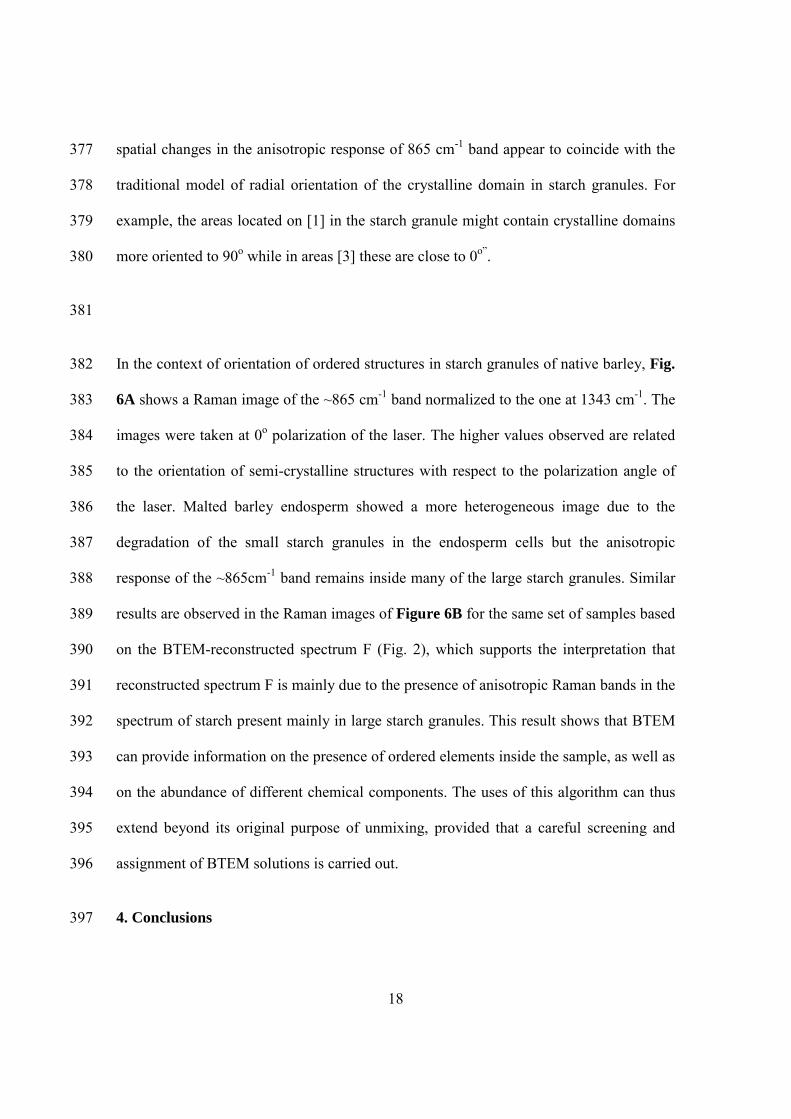
17
The ultrastructure of starch granules consists of concentric shells of alternating semi-354
crystalline and amorphous layers or growth rings. These layers are composed by “parcels 355
of crystals” or blocklets with amylopectin as the main component. Within the amorphous 356
layers, the inner structure of the blocklets in particular is defected by non-branching and 357
lower branching molecules (such as amylose) (Pérez and Bertoft, 2010). As an example 358
of the anisotropic variation in different locations of a single starch granule, the Raman 359
response of the 865 cm-1 band normalized by the one at 1343 cm-1 on confocal spots 360
located on areas marked [1], [2] and [3] is shown on Fig. 5C and 5D. The response of 361
these spots was fitted to the sinusoidal equation ))(2(1( cxCosbaI −+= by using a non-362
linear regression, where I corresponds to the intensity ratio (865cm-1/1343cm-1), a is the 363
mean value of the intensity ratio, b the amplitude of the fitting curve, x the polarization 364
angle of the laser and c the phase shift. This strong spatial variation of the band at 865 365
cm-1 has been attributed to orientation of the crystalline amylopectin elements within the 366
plane of observation (Wellner et al., 2011). It is also important to notice that due to the 367
resolution of the technique (0.6-1μm), the anisotropic response observed on a single 368
confocal spot is the result of the interaction of the laser beam with several amorphous and 369
semi-crystalline layers. On the other hand, double-helix structures like A-type crystals 370
prepared from short amylose chains show the C-O-C groups roughly aligned along the 371
double helix (Popov et al., 2009). In this case, it is possible that the global Raman tensor 372
of this band in helical structures inside the large starch granules have the largest 373
polarisability along the double-helix axis and as consequence the maximal Raman 374
response of the C-O-C band at ~865 cm-1 for molecules located “in plane” is obtained 375
when the polarization of the exciting laser is parallel to double helix axis. The observed 376
18
spatial changes in the anisotropic response of 865 cm-1 band appear to coincide with the 377
traditional model of radial orientation of the crystalline domain in starch granules. For 378
example, the areas located on [1] in the starch granule might contain crystalline domains 379
more oriented to 90o while in areas [3] these are close to 0o”.380
381
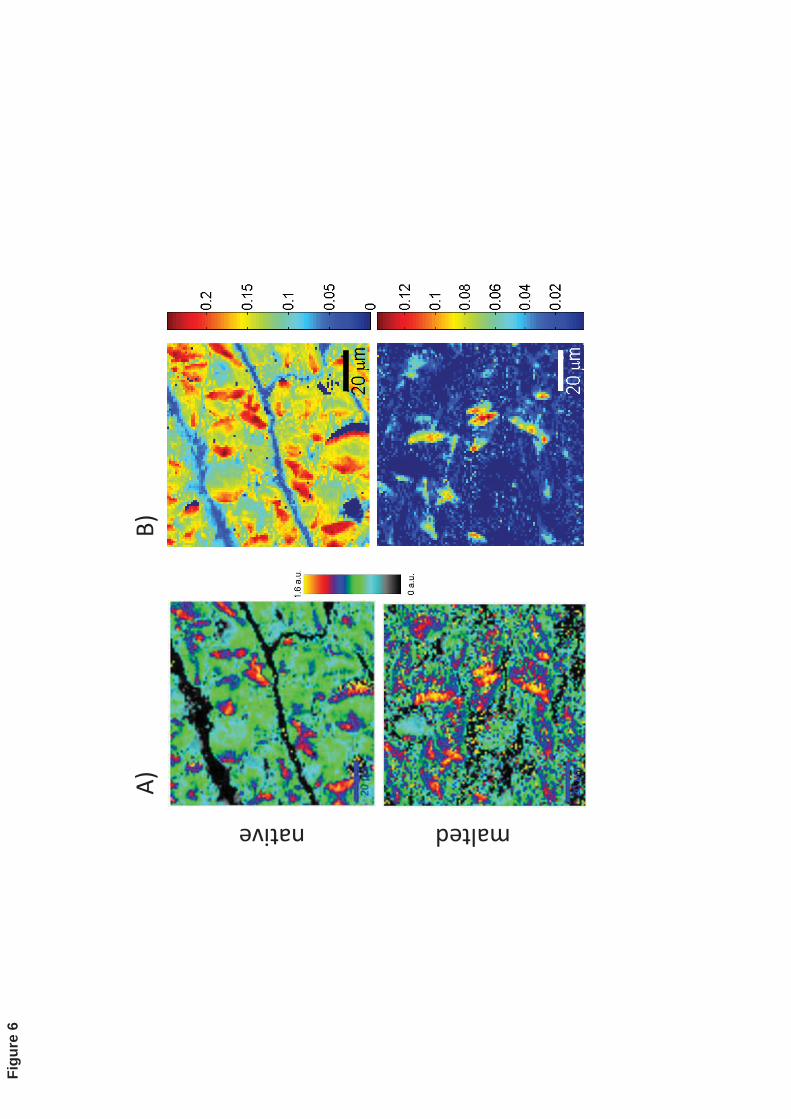
In the context of orientation of ordered structures in starch granules of native barley, Fig. 382
6A shows a Raman image of the ~865 cm-1 band normalized to the one at 1343 cm-1. The 383
images were taken at 0o polarization of the laser. The higher values observed are related 384
to the orientation of semi-crystalline structures with respect to the polarization angle of 385
the laser. Malted barley endosperm showed a more heterogeneous image due to the 386
degradation of the small starch granules in the endosperm cells but the anisotropic 387
response of the ~865cm-1 band remains inside many of the large starch granules. Similar 388
results are observed in the Raman images of Figure 6B for the same set of samples based 389
on the BTEM-reconstructed spectrum F (Fig. 2), which supports the interpretation that 390
reconstructed spectrum F is mainly due to the presence of anisotropic Raman bands in the 391
spectrum of starch present mainly in large starch granules. This result shows that BTEM 392
can provide information on the presence of ordered elements inside the sample, as well as 393
on the abundance of different chemical components. The uses of this algorithm can thus 394
extend beyond its original purpose of unmixing, provided that a careful screening and 395
assignment of BTEM solutions is carried out. 396
4. Conclusions 397
19
In this work, PRS was used to study the chemical and structural changes of barley 398
endosperm upon malting. Multivariate analysis of the endosperm spectra using BTEM 399
appeared suitable to reconstruct individual spectra of the main components and elaborate 400
distribution maps over the barley sections. The BTEM-reconstructed spectra may not 401
only correspond to different compounds present in the sample, but also to the Raman 402
anisotropic response of certain substances, as it was observed for starch. 403
PRS was able to detect chemical changes in malting, whose major impact is observed not 404
only through the degradation of small starch granules inside the endosperm cells, but also 405
in the shape distortion of large granules and the hydrolysis of cell walls in starchy 406
endosperm. It was also shown that the Raman anisotropic response of the C-O-C band at 407
~865 cm-1 was preserved in many of the big starch granules after malting. Finally, it is 408
possible that a clear spatial description of the anisotropic response of the~865 cm-1 band 409
in starch helical structures will enable the elaboration of in-situ orientation maps of 410
amylopectin in starch granules that can be used for the study of different cereals kernels. 411
Acknowledgments 412
The authors acknowledge the Academy of Finland for financial support, the PBL 413
Brewing Laboratory for providing the barley and malt material and Dr Juan Jose Valle 414
for his help during AFM measurements. 415
References 416
Bacic, A., Stone, B., 1981. Chemistry and Organization of Aleurone Cell-Wall 417Components from Wheat and Barley. Australian Journal of Plant Physiology 8, 475-495. 418
20
Barron, C., Robert, P., Guillon, F., Saulnier, L., Rouau, X., 2006. Structural heterogeneity 419of wheat arabinoxylans revealed by Raman spectroscopy. Carbohydrate research 341, 4201186-1191. 421
Bertinetto, C.G., Vuorinen, T., 2014. Automatic Baseline Recognition for the Correction 422of Large Sets of Spectra Using Continuous Wavelet Transform and Iterative Fitting. 423Applied Spectroscopy 68, 155-164. 424
Cael, S., Koenig, J., Blackwell, J., 1973. Infrared and Raman spectroscopy of 425carbohydrates: part III: Raman spectra of the polymorphic forms of amylose. 426Carbohydrate research 29, 123-134. 427
Calheiros, R., Machado, N., Fiuza, S., Gaspar, A., Garrido, J., Milhazes, N., Borges, F., 428Marques, M., 2008. Antioxidant phenolic esters with potential anticancer activity: A 429Raman spectroscopy study. Journal of Raman Spectroscopy 39, 95-107. 430
Chandra, G.S., Proudlove, M.O., Baxter, E.D., 1999. The structure of barley endosperm-431An important determinant of malt modification. Journal of the science of food and 432agriculture 79, 37-46. 433
Fincher, G.B., Stone, B.A., 1986. Cell walls and their components, In: American 434Association of Cereal Chemists (Ed.), Advances in Cereal Science and Technology, 435Minnesota, pp. 207-296. 436
Glaring, M.A., Koch, C.B., Blennow, A., 2006. Genotype-specific spatial distribution of 437starch molecules in the starch granule: a combined CLSM and SEM approach. 438Biomacromolecules 7, 2310-2320. 439
Holopainen, U.R., Wilhelmson, A., Salmenkallio-Marttila, M., Peltonen-Sainio, P., 440Rajala, A., Reinikainen, P., Kotaviita, E., Simolin, H., Home, S., 2005. Endosperm 441structure affects the malting quality of barley (Hordeum vulgare L.). Journal of 442Agricultural and Food Chemistry 53, 7279-7287. 443
Jääskeläinen, A., Holopainen-Mantila, U., Tamminen, T., Vuorinen, T., 2013. Endosperm 444and aleurone cell structure in barley and wheat as studied by optical and Raman 445microscopy. Journal of cereal science 57, 543-550. 446
Jaumot, J., Gargallo, R., de Juan, A., Tauler, R., 2005. A graphical user-friendly interface 447for MCR-ALS: a new tool for multivariate curve resolution in MATLAB. Chemometrics 448and Intelligent Laboratory Systems 76, 101-110. 449
Ka uráková, M., Wellner, N., Ebringerova, A., Hromadkova, Z., Wilson, R., Belton, P., 4501999. Characterisation of xylan-type polysaccharides and associated cell wall 451components by FT-IR and FT-Raman spectroscopies. Food Hydrocolloids 13, 35-41. 452
21
Kleinwächter, M., Müller, C., Methner, F., Selmar, D., 2014. Biochemical heterogeneity 453of malt is caused by both biological variation and differences in processing: I. Individual 454grain analyses of biochemical parameters in differently steeped barley (< i> Hordeum 455vulgare L.) malts. Food Chemistry 147, 25-33. 456
Liu, Y., Himmelsbach, D.S., Barton, F.E., 2004. Two-dimensional Fourier transform 457Raman correlation spectroscopy determination of the glycosidic linkages in amylose and 458amylopectin. Applied Spectroscopy 58, 745-749. 459
Movasaghi, Z., Rehman, S., Rehman, I.U., 2007. Raman spectroscopy of biological 460tissues. Applied Spectroscopy Reviews 42, 493-541. 461
Nair, S., Knoblauch, M., Ullrich, S., Baik, B., 2011. Microstructure of hard and soft 462kernels of barley. Journal of cereal science 54, 354-362. 463
Nordkvist, E., Salomonsson, A., Åman, P., 1984. Distribution of insoluble bound 464phenolic acids in barley grain. Journal of the science of food and agriculture 35, 657-661. 465
Palmer, G., 1993. Ultrastructure of endosperm and quality. Ferment 6, 105-110. 466
Pérez, S., Bertoft, E., 2010. The molecular structures of starch components and their 467contribution to the architecture of starch granules: A comprehensive review. 468Starch�Stärke 62, 389-420. 469
Philippe, S., Barron, C., Robert, P., Devaux, M., Saulnier, L., Guillon, F., 2006. 470Characterization using Raman microspectroscopy of arabinoxylans in the walls of 471different cell types during the development of wheat endosperm. Journal of Agricultural 472and Food Chemistry 54, 5113-5119. 473
Piot, O., Autran, J., Manfait, M., 2000. Spatial distribution of protein and phenolic 474constituents in wheat grain as probed by confocal Raman microspectroscopy. Journal of 475cereal science 32, 57-71. 476
Piot, O., Autran, J., Manfait, M., 2002. Assessment of cereal quality by micro-Raman 477analysis of the grain molecular composition. Applied Spectroscopy 56, 1132-1138. 478
Popov, D., Buleon, A., Burghammer, M., Chanzy, H., Montesanti, N., Putaux, J.-., 479Potocki-Veronese, G., Riekel, C., 2009. Crystal Structure of A-amylose: A Revisit from 480Synchrotron Microdiffraction Analysis of Single Crystals. Macromolecules 42, 1167-4811174.482
Ridout, M., Gunning, A., Parker, M., Wilson, R., Morris, V., 2002. Using AFM to image 483the internal structure of starch granules. Carbohydrate Polymers 50, 123-132. 484
22
Tan, S., Zhu, H., Chew, W., 2009. Self-modeling curve resolution of multi-component 485vibrational spectroscopic data using automatic band-target entropy minimization 486(AutoBTEM). Analytica Chimica Acta 639, 29-41. 487
van de Velde, F., van Riel, J., Tromp, R.H., 2002. Visualisation of starch granule 488morphologies using confocal scanning laser microscopy (CSLM). Journal of the science 489of food and agriculture 82, 1528-1536. 490
Wellner, N., Georget, D.M.R., Parker, M.L., Morris, V.J., 2011. In situ Raman 491microscopy of starch granule structures in wild type and ae mutant maize kernels. Starch-492Starke 63, 128-138. 493
Widjaja, E., Li, C.Z., Chew, W., Garland, M., 2003. Band-target entropy minimization. A 494robust algorithm for pure component spectral recovery. Application to complex 495randomized mixtures of six components. Analytical Chemistry 75, 4499-4507. 496
Wijngaard, H.H., Renzetti, S., Arendt, E.K., 2007. Microstructure of buckwheat and 497barley during malting observed by confocal scanning laser microscopy and scanning 498electron microscopy. Journal of the Institute of Brewing 113, 34-41. 499
Windig, W., Gallagher, N.B., Shaver, J.M., Wise, B.M., 2005. A new approach for 500interactive self-modeling mixture analysis. Chemometrics and Intelligent Laboratory 501Systems 77, 85-96. 502
503504505
Figure captions 506
Figure 1: A) Raman spectra of authentic carbohydrates, (1 3, 1 4)- -D-glucan, starch 507
and arabinoxylan present in barley kernels. B) Raman spectra of other model compounds 508
used in this study: embedding media, ferulic acid and gliadin. 509
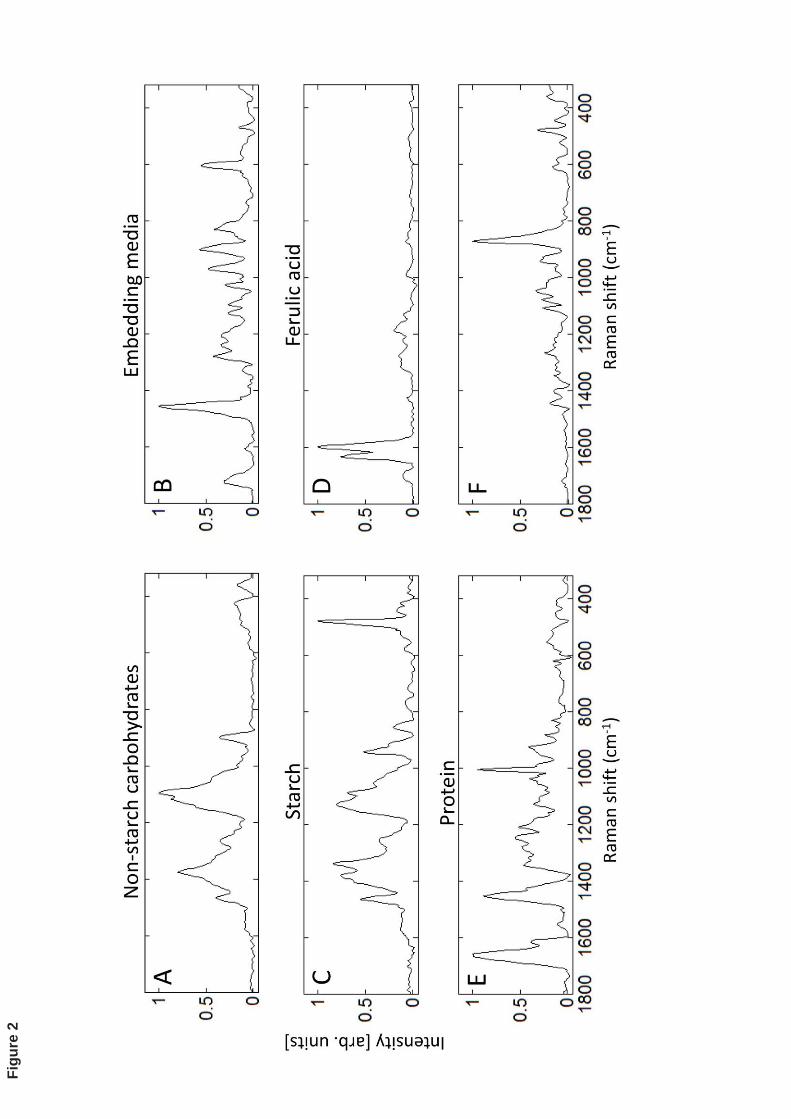
Figure 2: Reconstructed spectra (A-F) from BTEM analysis performed on native barley 510
kernel at the boundary of the aleurone layer-starchy endosperm. The reconstructed 511
spectrum F appears as a result of anisotropic Raman bands in starch spectrum. 512
513
23
Figure 3: Raman images based on the BTEM-reconstructed spectra of compounds 514
present in the boundary aleurone layer-starchy endosperm in native and malted barley. 515
They correspond to: starch, protein, ferulic acid and non-starch carbohydrates. Color bars 516
indicate the fraction of the LLS fit coefficient, which is proportional to the relative 517
concentration of the component. 518
519
Figure 4: Raman images based on the BTEM-reconstructed spectra of starch, protein and 520
non-starch carbohydrates present in the centre of starchy endosperm of native and malted 521
barley. Reconstructed spectra of non-starch carbohydrates were not resolved for malted 522
barley. Color bars indicate the fraction of the LLS fit coefficient as in Fig. 3. 523
524
Figure 5: A) Raman spectra of a native starch granule on a single spot (blue cross on the 525
starch granule sketch). Spectra were recorded at 0o and 90o polarization of the laser. The 526
higher anisotropic response is observed in the Raman band located at 865 cm-1 assigned 527
to vs C-O-C/ring breathing. B) Mean Raman spectrum (blue line) obtained at thirteen 528
different polarization angles of the laser from the blue region in the granule sketch (with 529
high anisotropic behavior). Yellow rectangles: the height represents the average 530
coefficient of variation (CV) of the Raman intensity (standard deviation/mean intensity) 531
in the selected band ranges, indicated by the width. C) AFM image in topography mode 532
of a sectioned starch granule with ellipsoidal shape found in native barley endosperm. D)533
Experimental and fitted anisotropic response of the band ratio 865cm-1
/1343cm-1
on the 534
areas marked as [1], [2] and [3] in C.535
536
24
Figure 6: A) Raman images of the band ratio 865cm-1
/1343cm-1
taken at 0o
polarization 537
angle of the laser on a region located on the center of the endosperm for native (top) and 538
malted (bottom) of barley kernel. Higher ratio values on the images ratio are due to the 539
anisotropic response of the band at 865 cm-1
, which is sensitive to the molecular 540
orientation of order structures inside the starch granule. B) Raman Images for the same 541
samples based on the BTEM-reconstructed spectrum F (Fig. 2). 542
543
544
545
β-gl
ucan
star
ch
arab
inox
ylan
485
embe
ddin
g m
edia
feru
lic a
cid
glia
din
865
CH/CH2 def. C-O-H bend.
942
1604
1631
1656
1003
1448
Glycosidic ring (C-O-C ,C-O , C-C)
A)
B)
Ram
an sh
ift (c
m-1
) Ra
man
shift
(cm
-1)
Intensity [arb.units]
Intensity [arb.units]
Figu
re 1
Figu
re 2
feru
lic a
cid
non-
star
ch
carb
ohyd
rate
s
native malted
star
ch
prot
ein
m m
Figu
re 3
star
ch
native malted
prot
ein
non-
star
ch
carb
ohyd
rate
s
Figu
re 4
Ram
an s
hift
(1/c
m)
Intensity (arb.units) B)
C.V
A)
C)
1 2
3
1125
D)
0o
90o
1342
865
Figu
re 5
native malted
A)
B)
Figu
re 6