Embed Size (px)
Citation preview
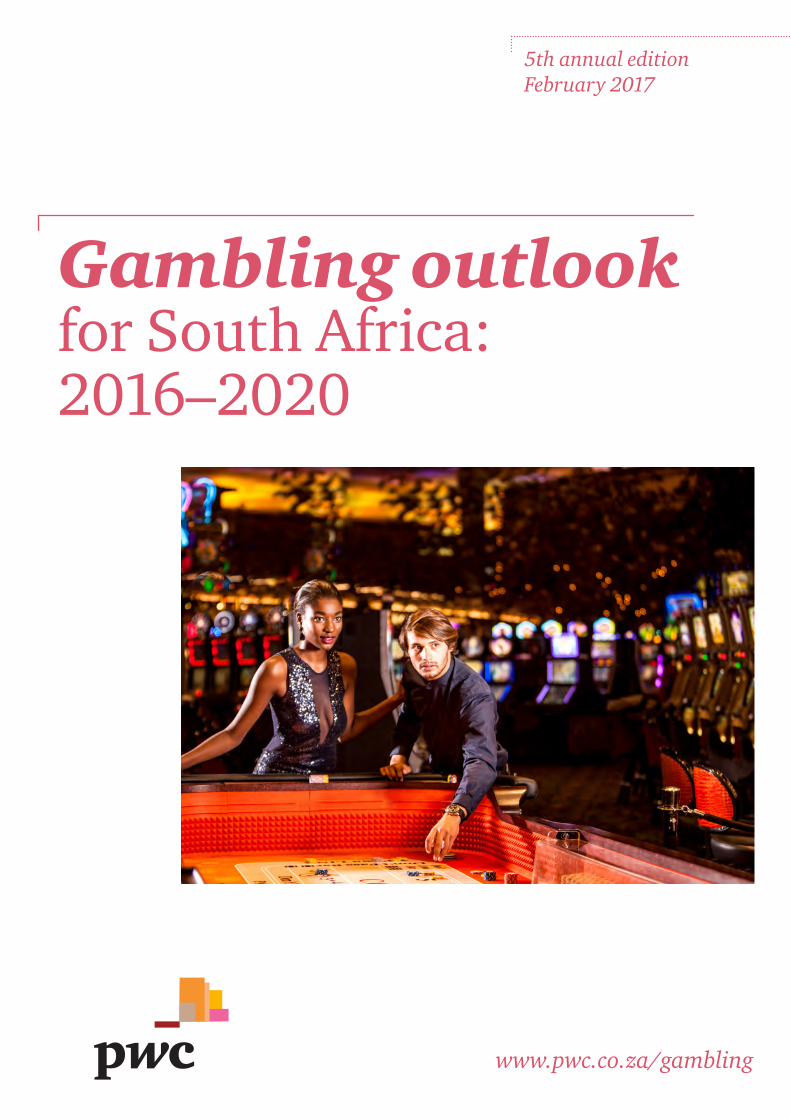
5th annual edition February 2017
www.pwc.co.za/gambling
Gambling outlook for South Africa: 2016–2020

© 2017. PricewaterhouseCoopers (PwC), the South African firm. All rights reserved. In this document, ‘PwC’ refers to PricewaterhouseCoopers in South Africa, which is a member firm of PricewaterhouseCoopers International Limited (PwCIL), each member firm of which is a separate legal entity and does not act as an agent of PwCIL.
‘PwC’ is the brand under which member firms of PricewaterhouseCoopers International Limited (PwCIL) operate and provide services. Together, these firms form the PwC network. Each firm in the network is a separate legal entity and does not act as an agent of PwCIL or any other member firm. PwCIL does not provide any services to clients. PwCIL is not responsible or liable for the acts or omissions of any of its member firms nor can it control the exercise of their professional judgment or bind them in any way.
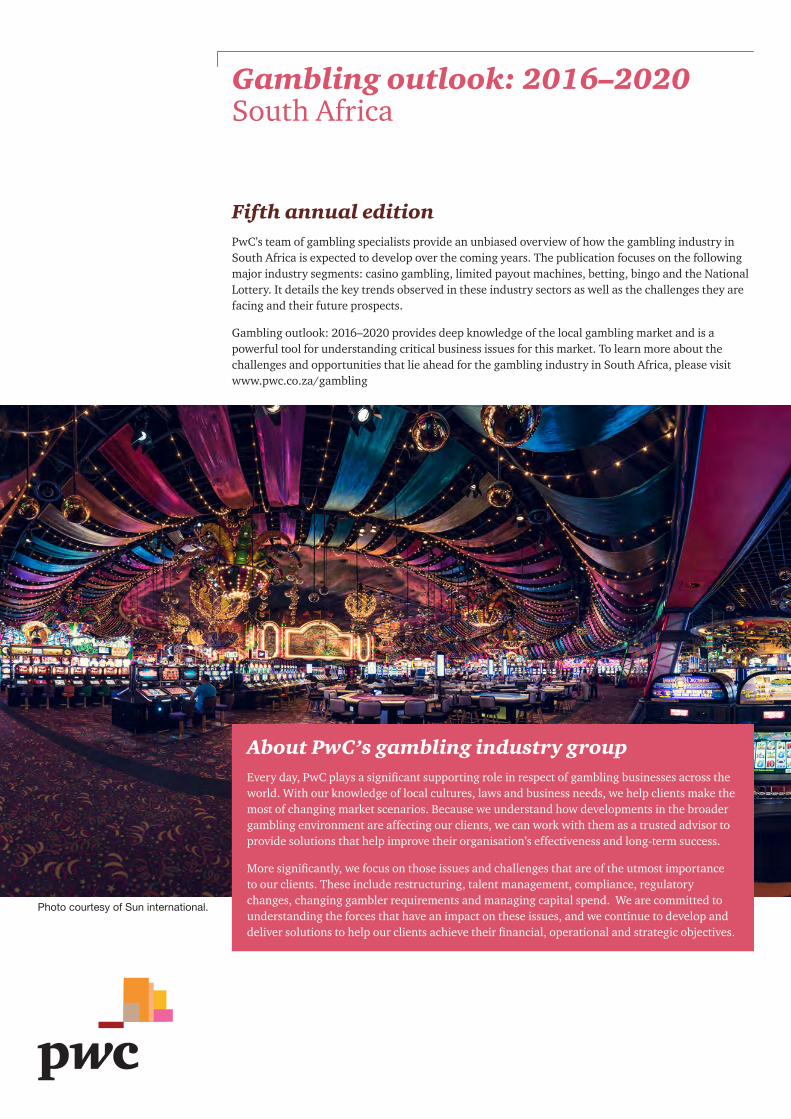
Gambling outlook: 2016–2020South Africa
Fifth annual editionPwC’s team of gambling specialists provide an unbiased overview of how the gambling industry in South Africa is expected to develop over the coming years. The publication focuses on the following major industry segments: casino gambling, limited payout machines, betting, bingo and the National Lottery. It details the key trends observed in these industry sectors as well as the challenges they are facing and their future prospects.
Gambling outlook: 2016–2020 provides deep knowledge of the local gambling market and is a powerful tool for understanding critical business issues for this market. To learn more about the challenges and opportunities that lie ahead for the gambling industry in South Africa, please visit www.pwc.co.za/gambling
About PwC’s gambling industry groupEvery day, PwC plays a significant supporting role in respect of gambling businesses across the world. With our knowledge of local cultures, laws and business needs, we help clients make the most of changing market scenarios. Because we understand how developments in the broader gambling environment are affecting our clients, we can work with them as a trusted advisor to provide solutions that help improve their organisation’s effectiveness and long-term success.
More significantly, we focus on those issues and challenges that are of the utmost importance to our clients. These include restructuring, talent management, compliance, regulatory changes, changing gambler requirements and managing capital spend. We are committed to understanding the forces that have an impact on these issues, and we continue to develop and deliver solutions to help our clients achieve their financial, operational and strategic objectives.
Photo courtesy of Sun international.
4 Gambling outlook: 2016 – 2020 • South Africa
At PwC, our purpose is to build trust in society and solve important problems. We’re a network of firms in 157 countries with more than 223,000 people who are committed to delivering quality in assurance, advisory and tax services. Find out more and tell us what matters to you by visiting us at www.pwc.com.
PricewaterhouseCoopers Inc. 2 Eglin Road Sunninghill, 2157 +27 11 797 4000 www.pwc.co.za
Quantitative research and analysis was provided by Wilkofsky Gruen Associates Inc., a provider of global research and analysis of the hospitality industry. See www.wilkofskygruen.com for more information.
Editorial team
• Pietro Calicchio, PwC South Africa Gambling Industry Leader
• Yolan Naidoo, Senior Manager
Editing and design
• Catherine Ensor
• Design Studio
• Cover photo courtesy of Tsogo Sun
Many other professionals within PwC reviewed the text and contributed local expertise to this publication, and we thank them for their assistance.
Gambling outlook: 2016–2020South Africa
Photo courtesy of Tsogo Sun.
5PwC
The Use of Outlook dataThe information in this publication is given for general information purposes only and is not meant to be taken as legal or professional advice in any way. You should consult a professional advisor before making any decisions or taking any action. Neither the author nor the copyright owner or publisher can accept any responsibility for loss to any person acting or not acting as a result of any material in this publication. The information in this document is given ‘as is’ with no assurance or guarantee of the completeness, accuracy or timeliness thereof, and without warranty of any kind. In no event will PwC be liable for any losses arising from any decision made or action taken in reliance on the information.
Designations used by companies to distinguish their products are often claimed as trademarks. In all instances where PwC knows about such a claim, the product names appear in initial capital letters or all capital letters. However, readers should contact those companies for more complete information regarding trademarks and registration.
Permission to citeNo part of this publication may be excerpted, reproduced, stored in a retrieval system, or distributed or transmitted in any form or by any means, including electronic, mechanical, photocopying, recording or scanning, without the prior written permission of PwC.
Requests should be submitted in writing to Pietro Calicchio at [email protected] outlining the excerpts you wish to use along with a draft copy of the full report that excerpts will appear in. Provision of this information is necessary for every citation request to enable PwC to assess the context in which the excerpts are being presented.
© 2017. PricewaterhouseCoopers (PwC), the South African firm. All rights reserved. In this document, ‘PwC’ refers to PricewaterhouseCoopers in South Africa, which is a member firm of PricewaterhouseCoopers International Limited (PwCIL), each member firm of which is a separate legal entity and does not act as an agent of PwCIL.
‘PwC’ is the brand under which member firms of PricewaterhouseCoopers International Limited (PwCIL) operate and provide services. Together, these firms form the PwC network. Each firm in the network is a separate legal entity and does not act as an agent of PwCIL or any other member firm. PwCIL does not provide any services to clients. PwCIL is not responsible or liable for the acts or omissions of any of its member firms nor can it control the exercise of their professional judgment or bind them in any way.
6 Gambling outlook: 2016 – 2020 • South Africa
PricewaterhouseCoopers Inc., 2 Eglin Road, Sunninghill 2157, Private Bag X36, Sunninghill 2157, South AfricaT: +27 (0) 11 797 4000, F: +27 (0) 11 797 5800, www.pwc.co.za
Chief Executive Officer: T D ShangoManagement Committee: S N Madikane, J S Masondo, P J Mothibe, C Richardson, F Tonelli, C VolschenkThe Company’s principal place of business is at 2 Eglin Road, Sunninghill where a list of directors’ names is available for inspection.Reg. no. 1998/012055/21, VAT reg.no. 4950174682
Pietro Calicchio Gambling Industry Leader
Johannesburg
9 February 2017
To our clients and friends in the gambling industry,
Welcome to the fifth edition of Gambling outlook 2016-2020. This publication focuses on segments within the South African gambling industry, with detailed forecasts and analysis. For each segment, we give details about the key trends we have noted as well as key challenges and future prospects we have identified.
The gambling industry continues to grow from a revenue perspective, continues to expand and invest large amounts in capital expenditure. As a business, however, the margins are low, a large portion of the costs is fixed, regulatory compliance is stringent and profitability depends on volume.
Gross gambling revenues for casinos, limited payout machines, bingo and betting totalled R26 billion in 2015, an 11.2% increase on the prior year, with casinos retaining their majority share of the market with gross gambling revenues of R18.2 billion. We continue to see the increase in popularity of sports betting which resulted in the betting industry’s gross gambling revenues increasing by 28.5% over the prior year.
We at PwC continue to stay on top of trends and developments that may impact gambling companies, now and in the future, and we look forward to sharing our thoughts with you once again. We appreciate your feedback and ask that you continue to tell us what we can do to make our publications more relevant and useful to you
If you would like clarification on any matters covered in this publication or you believe we can be of service to your business in any way, please contact one of our industry specialists listed on page 42 of this report.
Finally, we thank you for your support and wish you an exciting and rewarding year ahead.
Sincerely,
Pietro Calicchio Partner Gambling Industry Leader PwC South Africa
7PwC
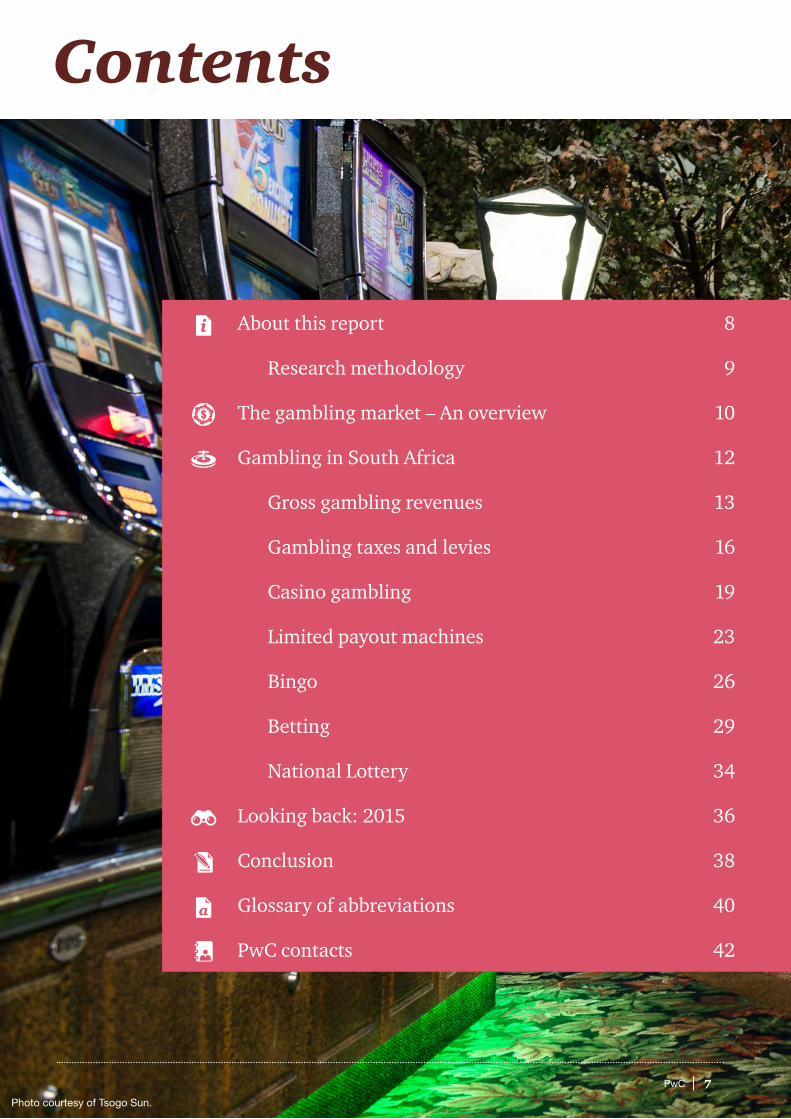
About this report 8
Research methodology 9
The gambling market – An overview 10
Gambling in South Africa 12
Gross gambling revenues 13
Gambling taxes and levies 16
Casino gambling 19
Limited payout machines 23
Bingo 26
Betting 29
National Lottery 34
Looking back: 2015 36
Conclusion 38
Glossary of abbreviations 40
PwC contacts 42
Contents
Photo courtesy of Tsogo Sun.
8 Gambling outlook: 2016 – 2020 • South Africa
About this report
Photo courtesy of Tsogo Sun.
9PwC
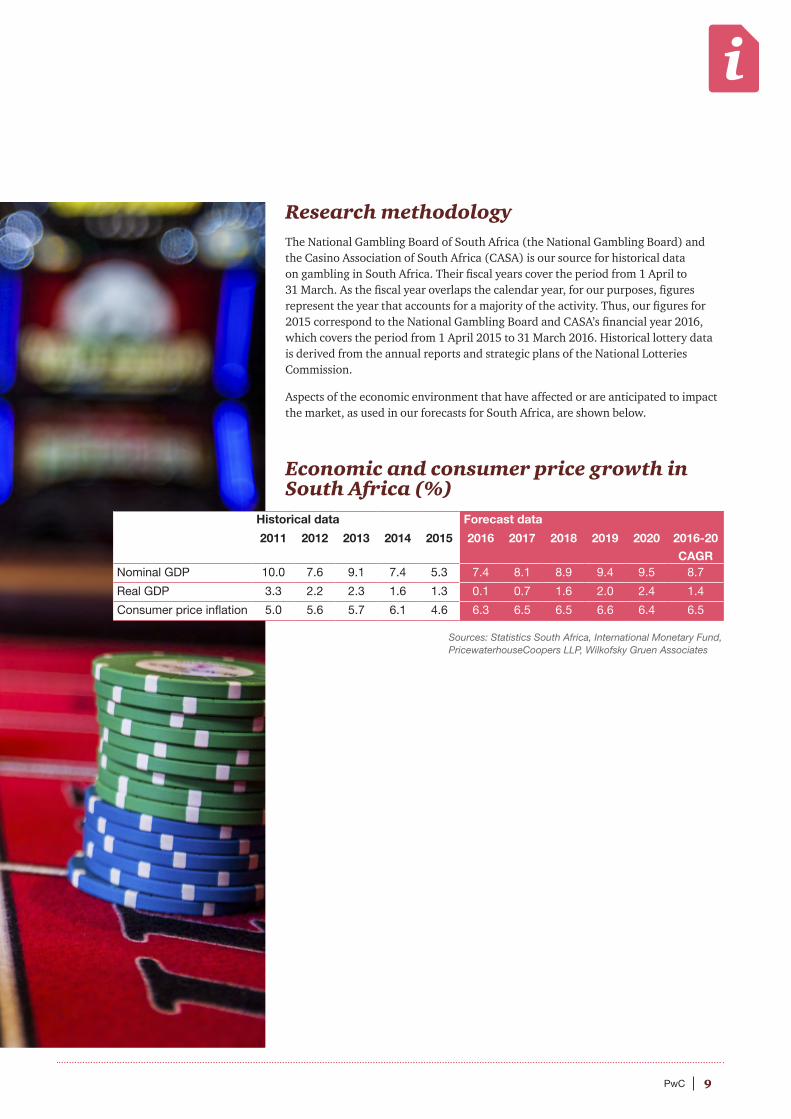
Research methodologyThe National Gambling Board of South Africa (the National Gambling Board) and the Casino Association of South Africa (CASA) is our source for historical data on gambling in South Africa. Their fiscal years cover the period from 1 April to 31 March. As the fiscal year overlaps the calendar year, for our purposes, figures represent the year that accounts for a majority of the activity. Thus, our figures for 2015 correspond to the National Gambling Board and CASA’s financial year 2016, which covers the period from 1 April 2015 to 31 March 2016. Historical lottery data is derived from the annual reports and strategic plans of the National Lotteries Commission.
Aspects of the economic environment that have affected or are anticipated to impact the market, as used in our forecasts for South Africa, are shown below.
Economic and consumer price growth in South Africa (%)
Historical data Forecast data
2011 2012 2013 2014 2015 2016 2017 2018 2019 2020 2016-20
CAGRNominal GDP 10.0 7.6 9.1 7.4 5.3 7.4 8.1 8.9 9.4 9.5 8.7
Real GDP 3.3 2.2 2.3 1.6 1.3 0.1 0.7 1.6 2.0 2.4 1.4
Consumer price inflation 5.0 5.6 5.7 6.1 4.6 6.3 6.5 6.5 6.6 6.4 6.5
Sources: Statistics South Africa, International Monetary Fund, PricewaterhouseCoopers LLP, Wilkofsky Gruen Associates
10 Gambling outlook: 2016 – 2020 • South Africa
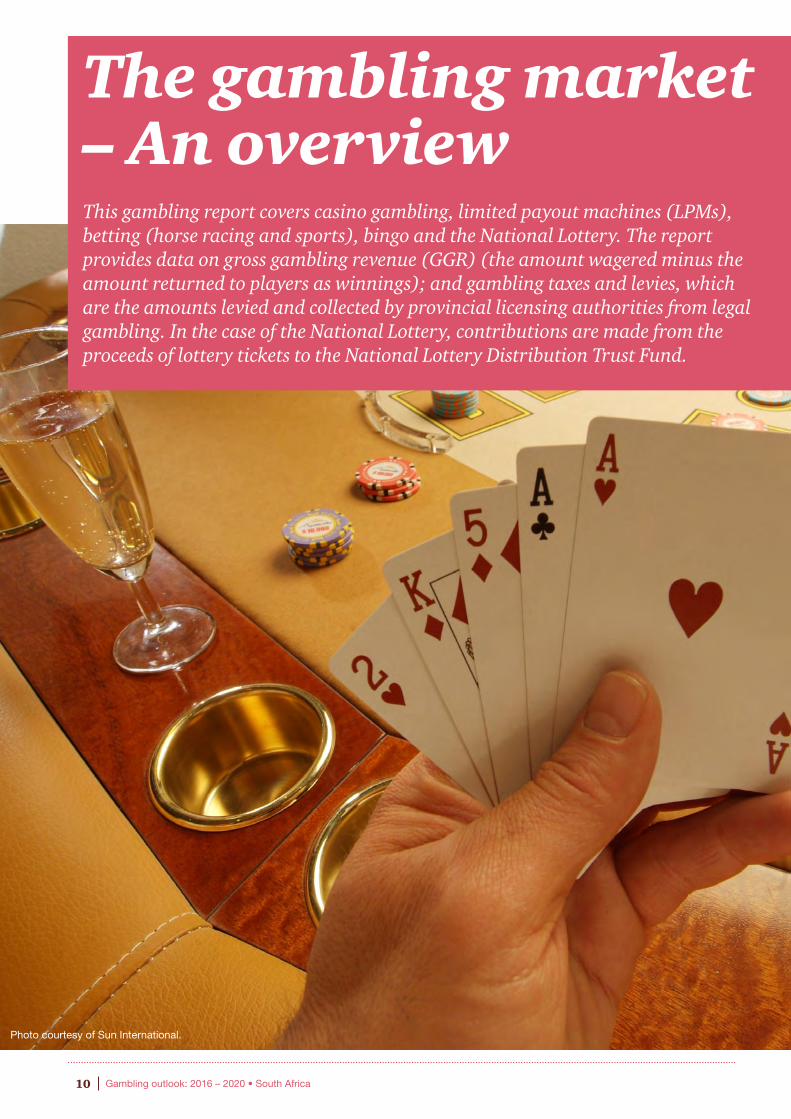
The gambling market – An overviewThis gambling report covers casino gambling, limited payout machines (LPMs), betting (horse racing and sports), bingo and the National Lottery. The report provides data on gross gambling revenue (GGR) (the amount wagered minus the amount returned to players as winnings); and gambling taxes and levies, which are the amounts levied and collected by provincial licensing authorities from legal gambling. In the case of the National Lottery, contributions are made from the proceeds of lottery tickets to the National Lottery Distribution Trust Fund.
Photo courtesy of Sun International.
11PwC
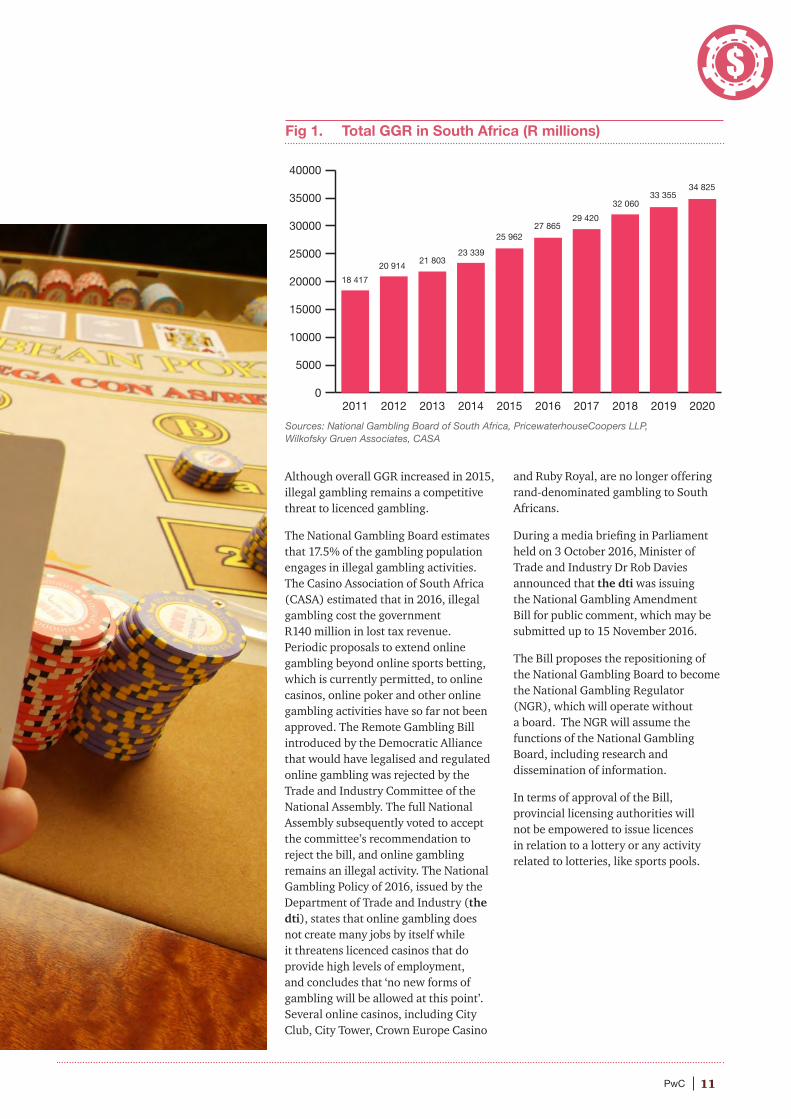
Fig 1. Total GGR in South Africa (R millions)
Although overall GGR increased in 2015, illegal gambling remains a competitive threat to licenced gambling.
The National Gambling Board estimates that 17.5% of the gambling population engages in illegal gambling activities. The Casino Association of South Africa (CASA) estimated that in 2016, illegal gambling cost the government R140 million in lost tax revenue. Periodic proposals to extend online gambling beyond online sports betting, which is currently permitted, to online casinos, online poker and other online gambling activities have so far not been approved. The Remote Gambling Bill introduced by the Democratic Alliance that would have legalised and regulated online gambling was rejected by the Trade and Industry Committee of the National Assembly. The full National Assembly subsequently voted to accept the committee’s recommendation to reject the bill, and online gambling remains an illegal activity. The National Gambling Policy of 2016, issued by the Department of Trade and Industry (the dti), states that online gambling does not create many jobs by itself while it threatens licenced casinos that do provide high levels of employment, and concludes that ‘no new forms of gambling will be allowed at this point’. Several online casinos, including City Club, City Tower, Crown Europe Casino
and Ruby Royal, are no longer offering rand-denominated gambling to South Africans.
During a media briefing in Parliament held on 3 October 2016, Minister of Trade and Industry Dr Rob Davies announced that the dti was issuing the National Gambling Amendment Bill for public comment, which may be submitted up to 15 November 2016.
The Bill proposes the repositioning of the National Gambling Board to become the National Gambling Regulator (NGR), which will operate without a board. The NGR will assume the functions of the National Gambling Board, including research and dissemination of information.
In terms of approval of the Bill, provincial licensing authorities will not be empowered to issue licences in relation to a lottery or any activity related to lotteries, like sports pools.
0
5000
10000
15000
20000
25000
30000
35000
40000
2020201920182017201620152014201320122011
18 417
34 82533 355
32 060
29 42027 865
25 962
23 33921 803
20 914
Sources: National Gambling Board of South Africa, PricewaterhouseCoopers LLP, Wilkofsky Gruen Associates, CASA
12 Gambling outlook: 2016 – 2020 • South Africa
Gambling in South Africa
Photo courtesy of Tsogo Sun.
13PwC
Fig 2. GGR in South Africa (R millions), 2016–2020
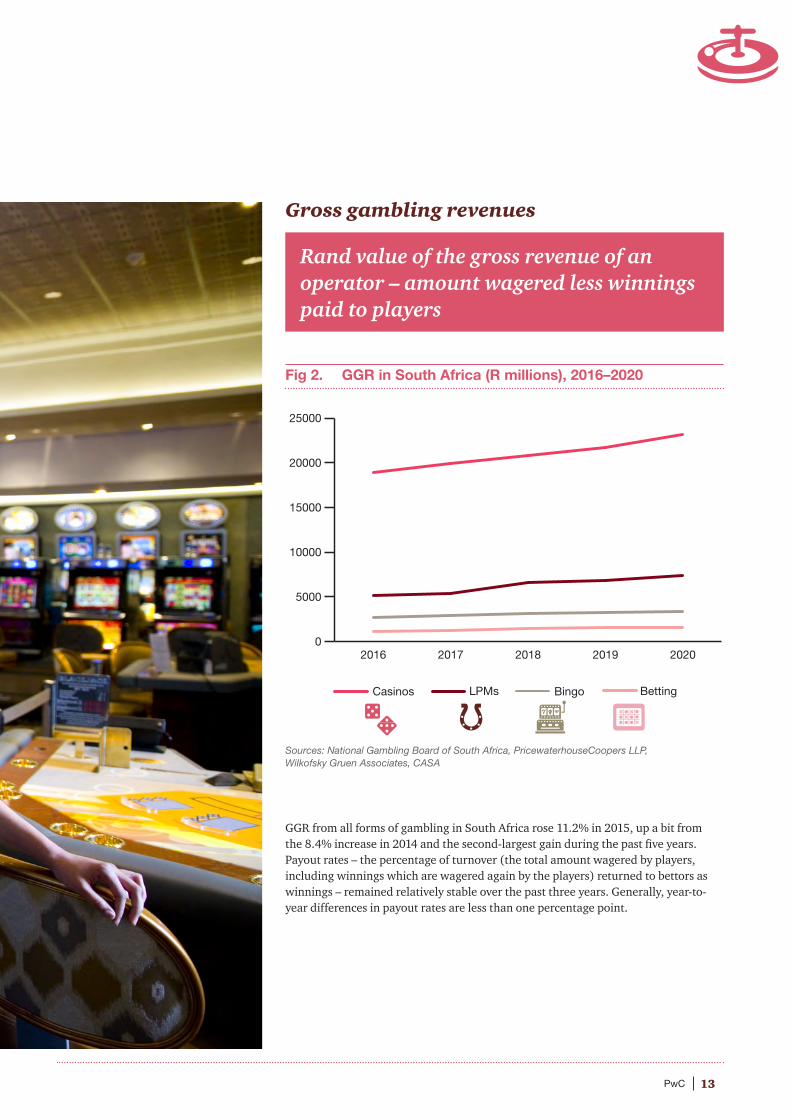
GGR from all forms of gambling in South Africa rose 11.2% in 2015, up a bit from the 8.4% increase in 2014 and the second-largest gain during the past five years. Payout rates – the percentage of turnover (the total amount wagered by players, including winnings which are wagered again by the players) returned to bettors as winnings – remained relatively stable over the past three years. Generally, year-to-year differences in payout rates are less than one percentage point.
Gross gambling revenues
0
5000
10000
15000
20000
25000
BettingBingoLPMsCasinos
20202019201820172016
Rand value of the gross revenue of an operator – amount wagered less winnings paid to players
Sources: National Gambling Board of South Africa, PricewaterhouseCoopers LLP, Wilkofsky Gruen Associates, CASA
14 Gambling outlook: 2016 – 2020 • South Africa
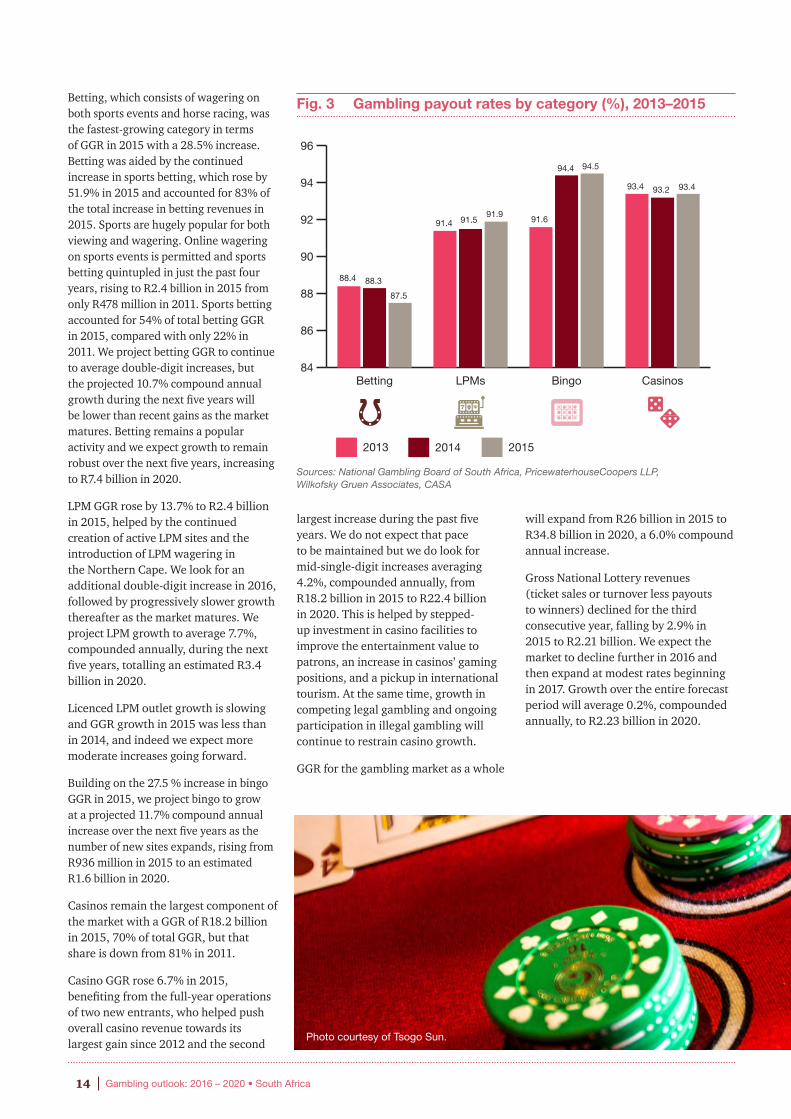
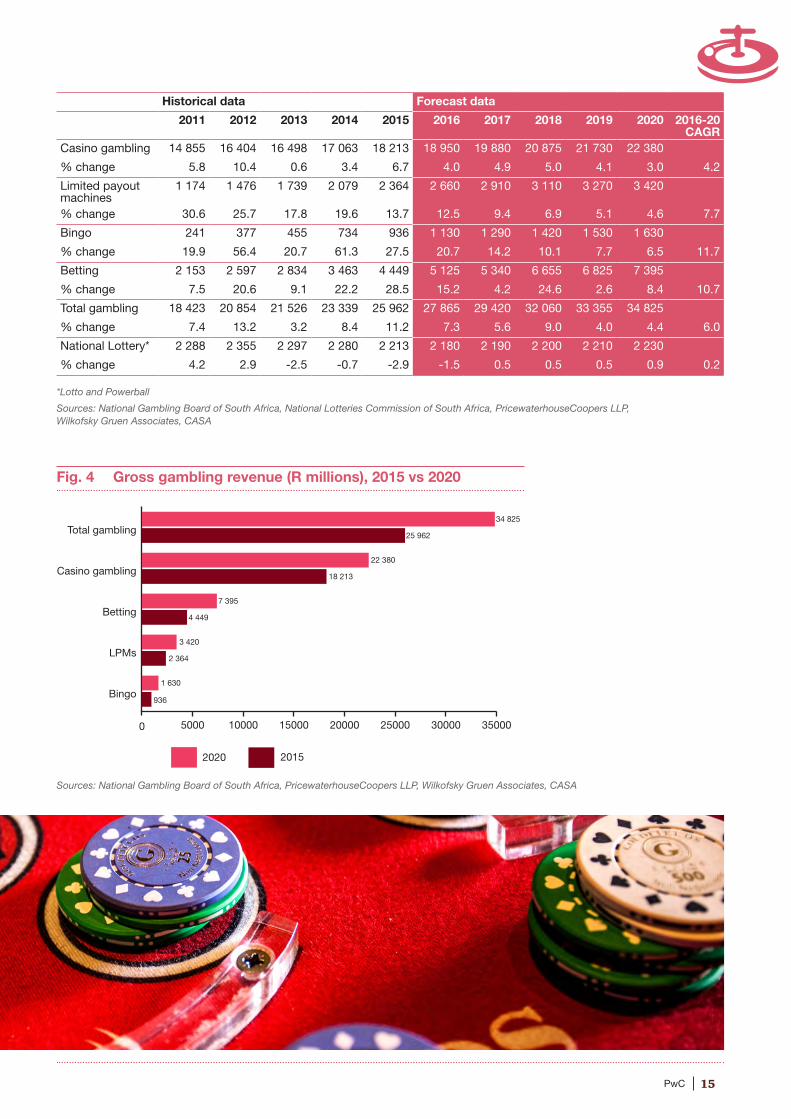
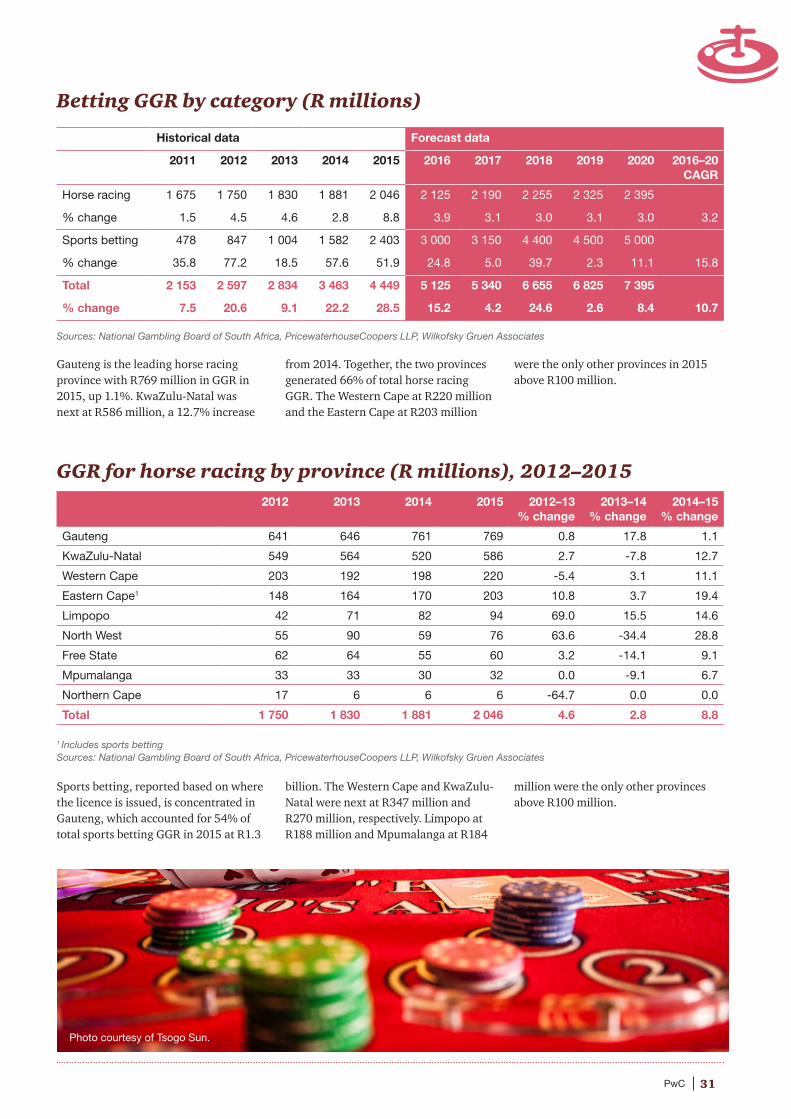
Betting, which consists of wagering on both sports events and horse racing, was the fastest-growing category in terms of GGR in 2015 with a 28.5% increase. Betting was aided by the continued increase in sports betting, which rose by 51.9% in 2015 and accounted for 83% of the total increase in betting revenues in 2015. Sports are hugely popular for both viewing and wagering. Online wagering on sports events is permitted and sports betting quintupled in just the past four years, rising to R2.4 billion in 2015 from only R478 million in 2011. Sports betting accounted for 54% of total betting GGR in 2015, compared with only 22% in 2011. We project betting GGR to continue to average double-digit increases, but the projected 10.7% compound annual growth during the next five years will be lower than recent gains as the market matures. Betting remains a popular activity and we expect growth to remain robust over the next five years, increasing to R7.4 billion in 2020.
LPM GGR rose by 13.7% to R2.4 billion in 2015, helped by the continued creation of active LPM sites and the introduction of LPM wagering in the Northern Cape. We look for an additional double-digit increase in 2016, followed by progressively slower growth thereafter as the market matures. We project LPM growth to average 7.7%, compounded annually, during the next five years, totalling an estimated R3.4 billion in 2020.
Licenced LPM outlet growth is slowing and GGR growth in 2015 was less than in 2014, and indeed we expect more moderate increases going forward.
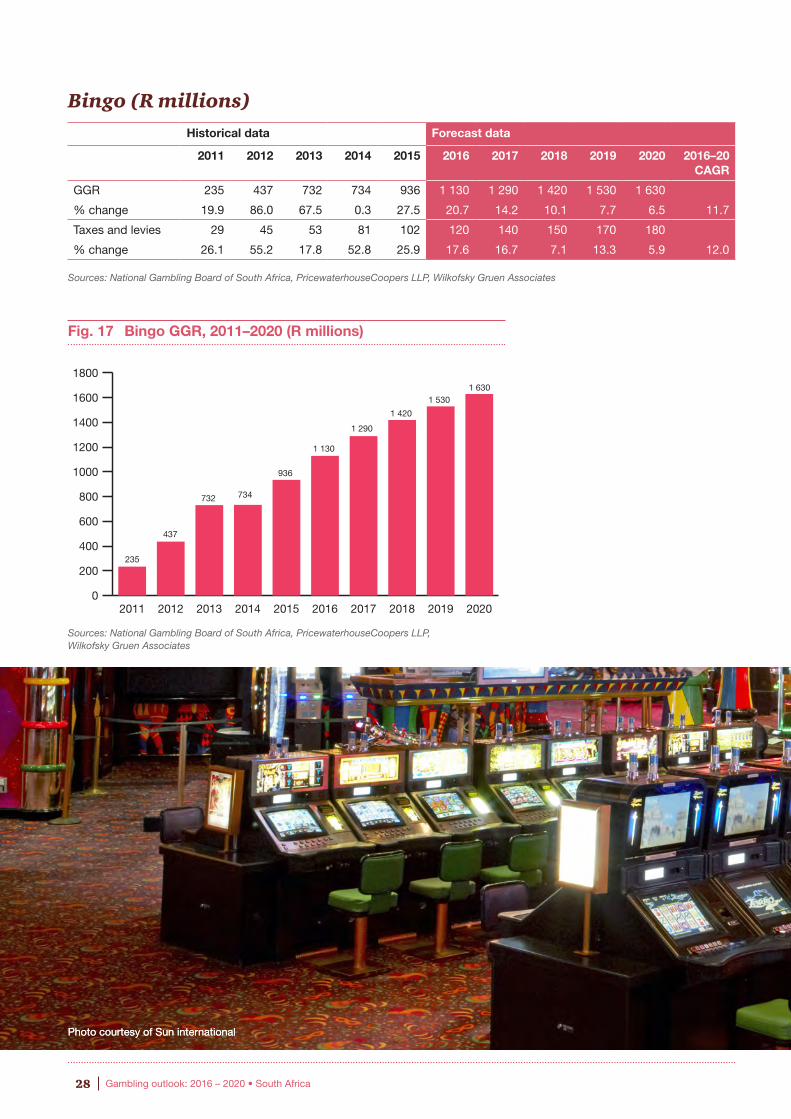
Building on the 27.5 % increase in bingo GGR in 2015, we project bingo to grow at a projected 11.7% compound annual increase over the next five years as the number of new sites expands, rising from R936 million in 2015 to an estimated R1.6 billion in 2020.
Casinos remain the largest component of the market with a GGR of R18.2 billion in 2015, 70% of total GGR, but that share is down from 81% in 2011.
Casino GGR rose 6.7% in 2015, benefiting from the full-year operations of two new entrants, who helped push overall casino revenue towards its largest gain since 2012 and the second
largest increase during the past five years. We do not expect that pace to be maintained but we do look for mid-single-digit increases averaging 4.2%, compounded annually, from R18.2 billion in 2015 to R22.4 billion in 2020. This is helped by stepped-up investment in casino facilities to improve the entertainment value to patrons, an increase in casinos’ gaming positions, and a pickup in international tourism. At the same time, growth in competing legal gambling and ongoing participation in illegal gambling will continue to restrain casino growth.
GGR for the gambling market as a whole
will expand from R26 billion in 2015 to R34.8 billion in 2020, a 6.0% compound annual increase.
Gross National Lottery revenues (ticket sales or turnover less payouts to winners) declined for the third consecutive year, falling by 2.9% in 2015 to R2.21 billion. We expect the market to decline further in 2016 and then expand at modest rates beginning in 2017. Growth over the entire forecast period will average 0.2%, compounded annually, to R2.23 billion in 2020.
Fig. 3 Gambling payout rates by category (%), 2013–2015
Sources: National Gambling Board of South Africa, PricewaterhouseCoopers LLP, Wilkofsky Gruen Associates, CASA
84
86
88
90
92
94
96
201520142013
CasinosBingoLPMsBetting
88.4
93.493.293.4
94.594.4
91.691.9
91.591.4
87.5
88.3
84
86
88
90
92
94
96
201520142013
CasinosBingoLPMsBetting
88.4
93.393.293.4
94.5
91.591.691.9
91.591.4
87.5
88.3
Photo courtesy of Tsogo Sun.
15PwC
Fig. 4 Gross gambling revenue (R millions), 2015 vs 2020
Sources: National Gambling Board of South Africa, PricewaterhouseCoopers LLP, Wilkofsky Gruen Associates, CASA
*Lotto and Powerball
Sources: National Gambling Board of South Africa, National Lotteries Commission of South Africa, PricewaterhouseCoopers LLP, Wilkofsky Gruen Associates, CASA
Historical data Forecast data
2011 2012 2013 2014 2015 2016 2017 2018 2019 2020 2016-20 CAGR
Casino gambling 14 855 16 404 16 498 17 063 18 213 18 950 19 880 20 875 21 730 22 380
% change 5.8 10.4 0.6 3.4 6.7 4.0 4.9 5.0 4.1 3.0 4.2
Limited payout machines
1 174 1 476 1 739 2 079 2 364 2 660 2 910 3 110 3 270 3 420
% change 30.6 25.7 17.8 19.6 13.7 12.5 9.4 6.9 5.1 4.6 7.7
Bingo 241 377 455 734 936 1 130 1 290 1 420 1 530 1 630
% change 19.9 56.4 20.7 61.3 27.5 20.7 14.2 10.1 7.7 6.5 11.7
Betting 2 153 2 597 2 834 3 463 4 449 5 125 5 340 6 655 6 825 7 395
% change 7.5 20.6 9.1 22.2 28.5 15.2 4.2 24.6 2.6 8.4 10.7
Total gambling 18 423 20 854 21 526 23 339 25 962 27 865 29 420 32 060 33 355 34 825
% change 7.4 13.2 3.2 8.4 11.2 7.3 5.6 9.0 4.0 4.4 6.0
National Lottery* 2 288 2 355 2 297 2 280 2 213 2 180 2 190 2 200 2 210 2 230
% change 4.2 2.9 -2.5 -0.7 -2.9 -1.5 0.5 0.5 0.5 0.9 0.2
0 5000 10000 15000 20000 25000 30000 35000
20152020
Bingo
LPMs
Betting
Casino gambling
Total gambling34 825
2 364
3 420
4 449
7 395
18 213
22 380
25 962
936
1 630
16 Gambling outlook: 2016 – 2020 • South Africa
Gambling taxes and levies
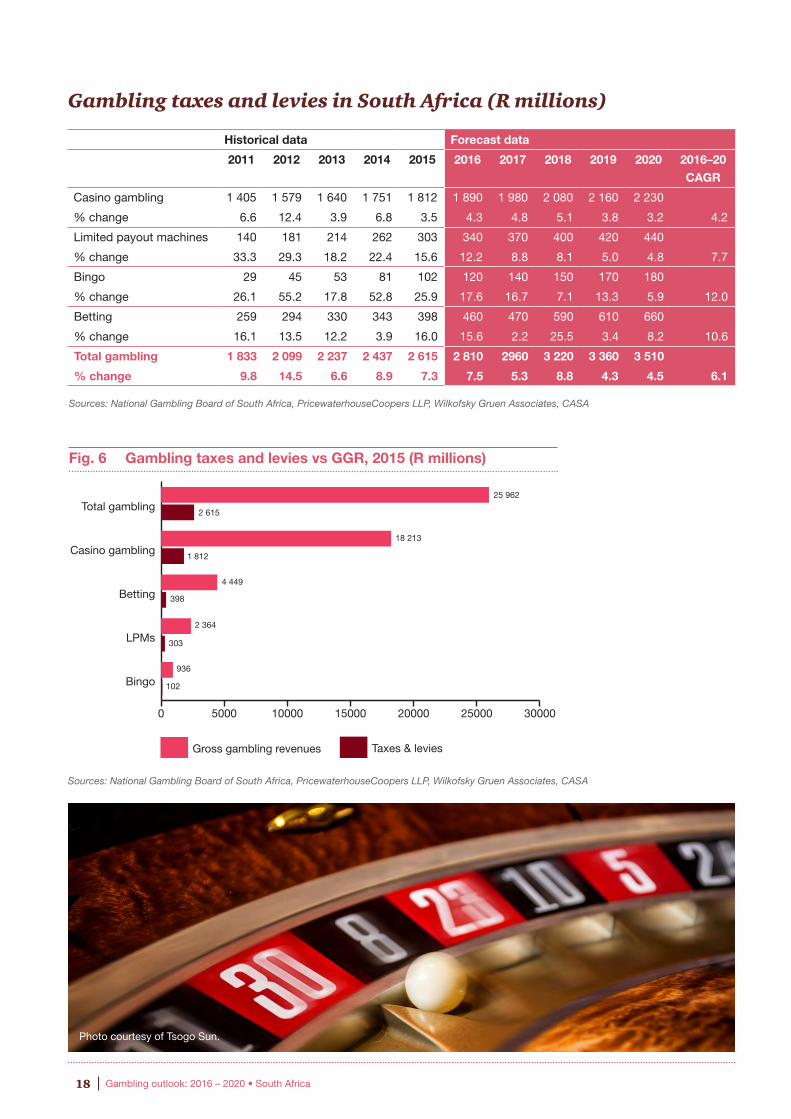
Gambling taxes and levies totalled R2.6 billion in 2015, up 7.3% from 2014. As a percentage of gross gambling revenues, LPMs continued to have the highest tax rate at 12.8% in 2015, up from 12.6% in 2014. Bingo was next at 10.9%; followed by casinos at 9.9%, a
bit lower than the 10.3% rate in 2014. Betting had the lowest share at 8.9% in 2015, down from 9.9% in 2014 and 11.6% in 2013. The drop in the betting share reflects the growing role of sports betting in overall betting totals. For the market as a whole, taxes and levies
averaged 10.1% of GGR in 2015, a modest decrease from their 10.4% share in 2014. These taxes and levies are paid to the provincial gambling boards.
Casinos also pay deemed output VAT to the National Treasury on the GGR that they have earned. The estimated deemed output VAT collected on gambling revenues from casinos in 2015 amounted to R2 billion, or 11% of GGR.
Gambling taxes and levies represented 9.9% of casino GGR. When VAT is included, casinos’ share of all taxes rises to nearly more than 21% of GGR.
Gauteng reached R913 million in gambling taxes and levies in 2015,
accounting for 35% of the total. KwaZulu-Natal and the Western Cape were next at R612 million and R574 million, respectively. North West posted the largest increase, 33.3%, fuelled principally by large gains in sports betting and casino gambling.
Fig. 5 Gambling taxes and levies as a share of GGR, 2013–2015 (%)
Sources: National Gambling Board of South Africa, PricewaterhouseCoopers LLP, Wilkofsky Gruen Associates, CASA
The amount levied and collected by provincial licensing authorities from legal gambling. Corporate tax and VAT on gambling revenues are excluded from our analysis.
0
2
4
6
8
10
12
14
201520142013
BingoBettingCasinosLPMs
12.3
10.911.0
7.2
8.9
9.9
11.6
9.910.3
9.9
12.812.6
0
2
4
6
8
10
12
14
201520142013
BingoBettingCasinosLPMs
12.3
10.9
7.37.2
8.9
9.9
11.6
10.610.49.9
12.812.6
17PwC
Gambling taxes and levies by province, 2012-2015 (R millions)
The Western Cape and KwaZulu-Natal had the highest shares of taxes and levies as a percentage of GGR, each exceeding
10% in 2015, stemming from their dominance in the LPM market, which has the highest gambling tax rates.
Taxes/levies as a % of GGR, 2012-2015
In general, we look for slower growth in taxes and levies over the next five years in line with the maturation of the LPM market, which has the highest share of taxes as a percentage of GGR.
The Gauteng province had announced plans to raise casino taxes but no further announcements on when this will be implemented have been made. For the forecast period as a whole,
we project taxes and levies to expand by 6.1%, compounded annually, to R3.5 billion in 2020, comparable to the 6.0% compound annual increase in overall GGR.
Sources: National Gambling Board of South Africa, PricewaterhouseCoopers LLP, Wilkofsky Gruen Associates, CASA
Sources: National Gambling Board of South Africa, PricewaterhouseCoopers LLP, Wilkofsky Gruen Associates, CASA
2012
2013
2014
2015
2012-13 %
change
2013-14 %
change
2014-15 %
changeGauteng 836 848 901 913 1.4 6.3 1.3
KwaZulu-Natal 494 535 560 612 8.3 4.7 9.3
Western Cape 402 459 539 574 14.2 17.4 6.5
Eastern Cape 112 122 139 158 8.9 13.9 13.7
North West 86 96 102 136 11.6 6.3 33.3
Mpumalanga 67 74 83 87 10.4 12.2 4.8
Limpopo 46 48 56 70 4.3 16.7 25.0
Free State 40 40 39 44 0.0 -2.5 12.8
Northern Cape 16 15 18 21 -6.3 20.0 16.7
Total 2 099 2 237 2 437 2 615 6.6 8.9 7.3
2012 2013 2014 2015
Gauteng 9.2 9.2 9.3 8.6
KwaZulu-Natal 12.5 12.9 12.8 12.6
Western Cape 12.6 13.4 14.5 14.2
North West 7.8 8.1 8.1 8.4
Eastern Cape 7.9 8.0 8.1 8.3
Mpumalanga 7.6 7.7 7.8 7.6
Limpopo 7.9 7.6 7.9 7.7
Free State 7.8 7.6 6.7 6.9
Northern Cape 7.6 7.5 7.9 8.0
Photo courtesy of Tsogo Sun.
18 Gambling outlook: 2016 – 2020 • South Africa
Historical data Forecast data
2011 2012 2013 2014 2015 2016 2017 2018 2019 2020 2016–20
CAGR
Casino gambling 1 405 1 579 1 640 1 751 1 812 1 890 1 980 2 080 2 160 2 230
% change 6.6 12.4 3.9 6.8 3.5 4.3 4.8 5.1 3.8 3.2 4.2
Limited payout machines 140 181 214 262 303 340 370 400 420 440
% change 33.3 29.3 18.2 22.4 15.6 12.2 8.8 8.1 5.0 4.8 7.7
Bingo 29 45 53 81 102 120 140 150 170 180
% change 26.1 55.2 17.8 52.8 25.9 17.6 16.7 7.1 13.3 5.9 12.0
Betting 259 294 330 343 398 460 470 590 610 660
% change 16.1 13.5 12.2 3.9 16.0 15.6 2.2 25.5 3.4 8.2 10.6
Total gambling 1 833 2 099 2 237 2 437 2 615 2 810 2960 3 220 3 360 3 510
% change 9.8 14.5 6.6 8.9 7.3 7.5 5.3 8.8 4.3 4.5 6.1
Gambling taxes and levies in South Africa (R millions)
Fig. 6 Gambling taxes and levies vs GGR, 2015 (R millions)
Sources: National Gambling Board of South Africa, PricewaterhouseCoopers LLP, Wilkofsky Gruen Associates, CASA
Sources: National Gambling Board of South Africa, PricewaterhouseCoopers LLP, Wilkofsky Gruen Associates, CASA
0 5000 10000 15000 20000 25000 30000
Taxes & leviesGross gambling revenues
Bingo
LPMs
Betting
Casino gambling
Total gambling25 962
102
936
303
2 364
398
4 449
1 812
18 213
2 615
Photo courtesy of Tsogo Sun.
19PwC
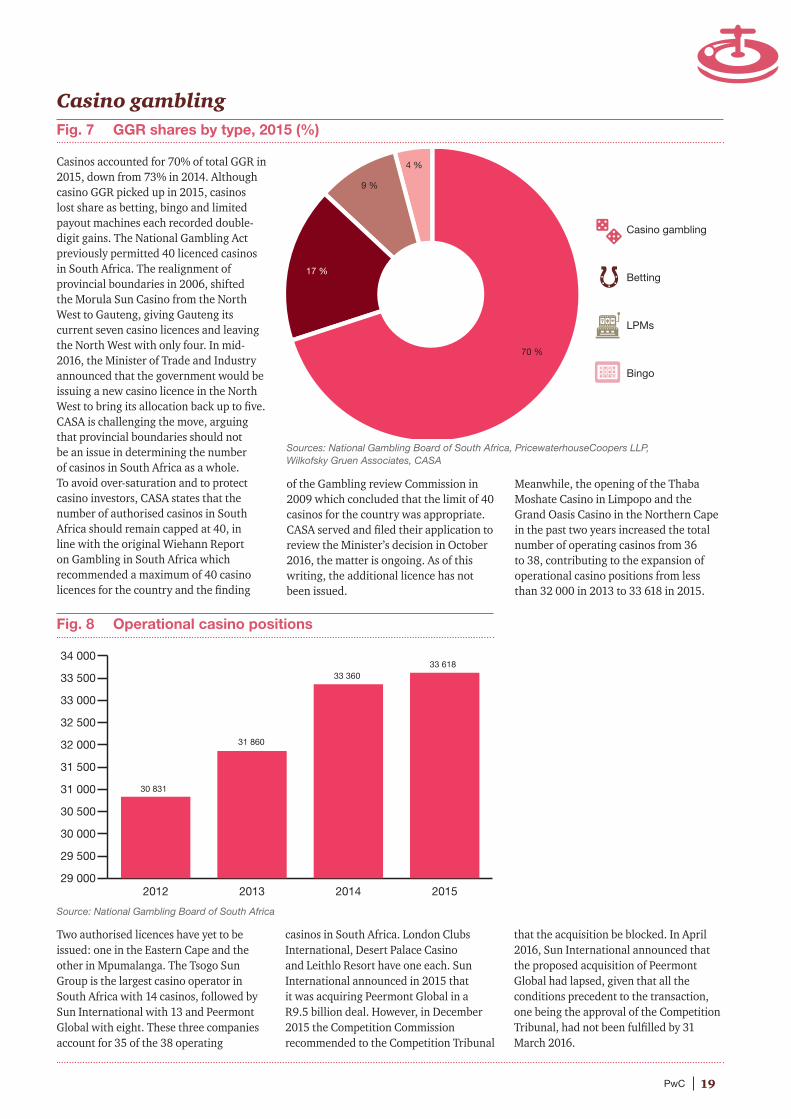
Casino gambling Fig. 7 GGR shares by type, 2015 (%)
Casinos accounted for 70% of total GGR in 2015, down from 73% in 2014. Although casino GGR picked up in 2015, casinos lost share as betting, bingo and limited payout machines each recorded double-digit gains. The National Gambling Act previously permitted 40 licenced casinos in South Africa. The realignment of provincial boundaries in 2006, shifted the Morula Sun Casino from the North West to Gauteng, giving Gauteng its current seven casino licences and leaving the North West with only four. In mid-2016, the Minister of Trade and Industry announced that the government would be issuing a new casino licence in the North West to bring its allocation back up to five. CASA is challenging the move, arguing that provincial boundaries should not be an issue in determining the number of casinos in South Africa as a whole. To avoid over-saturation and to protect casino investors, CASA states that the number of authorised casinos in South Africa should remain capped at 40, in line with the original Wiehann Report on Gambling in South Africa which recommended a maximum of 40 casino licences for the country and the finding
of the Gambling review Commission in 2009 which concluded that the limit of 40 casinos for the country was appropriate. CASA served and filed their application to review the Minister’s decision in October 2016, the matter is ongoing. As of this writing, the additional licence has not been issued.
Meanwhile, the opening of the Thaba Moshate Casino in Limpopo and the Grand Oasis Casino in the Northern Cape in the past two years increased the total number of operating casinos from 36 to 38, contributing to the expansion of operational casino positions from less than 32 000 in 2013 to 33 618 in 2015.
Sources: National Gambling Board of South Africa, PricewaterhouseCoopers LLP, Wilkofsky Gruen Associates, CASA
Source: National Gambling Board of South Africa
29 000
29 500
30 000
30 500
31 000
31 500
32 000
32 500
33 000
33 500
34 000
2015201420132012
30 831
33 61833 360
31 860
Fig. 8 Operational casino positions
Two authorised licences have yet to be issued: one in the Eastern Cape and the other in Mpumalanga. The Tsogo Sun Group is the largest casino operator in South Africa with 14 casinos, followed by Sun International with 13 and Peermont Global with eight. These three companies account for 35 of the 38 operating
casinos in South Africa. London Clubs International, Desert Palace Casino and Leithlo Resort have one each. Sun International announced in 2015 that it was acquiring Peermont Global in a R9.5 billion deal. However, in December 2015 the Competition Commission recommended to the Competition Tribunal
that the acquisition be blocked. In April 2016, Sun International announced that the proposed acquisition of Peermont Global had lapsed, given that all the conditions precedent to the transaction, one being the approval of the Competition Tribunal, had not been fulfilled by 31 March 2016.
Bingo
LPMs
Betting
Casino gambling
4 %
9 %
17 %
70 %
Casino gambling
Betting
LPMs
Bingo
20 Gambling outlook: 2016 – 2020 • South Africa
Casino licences and operating casinos by province, 2015
Gauteng was the leading province in casino GGR at R7.5 billion in 2015, up 5.5% from 2014. KwaZulu-Natal was next at R3.4 billion, a 7.7% increase
from 2014, followed by Western Cape, which rose by 2.7% to R2.8 billion. North West and the Eastern Cape were the only other provinces to
generate more than R1 billion in GGR. Mpumalanga was the only province where casino GGR declined in 2015.
GGR earned by casinos by province, 2012–2015 (R millions)
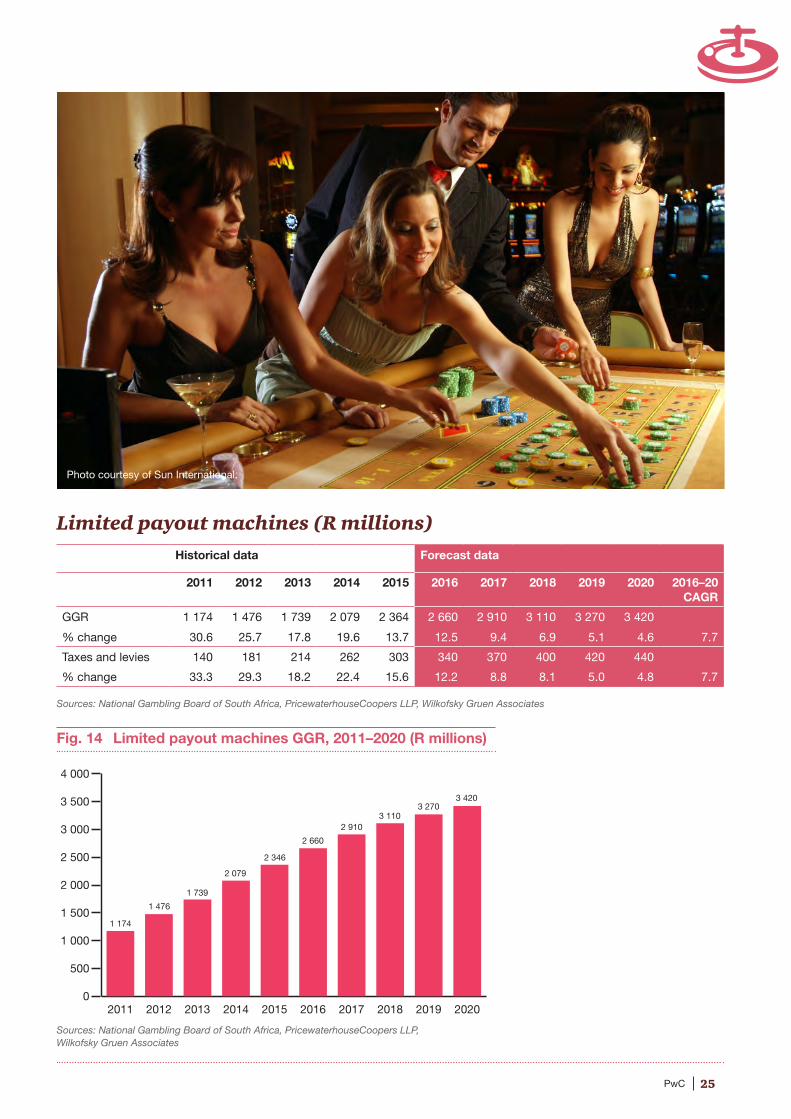
Casinos are investing heavily in their operations, spending more than R2.3 billion in 2015 in capital expenditures to maintain and improve their entertainment appeal to customers.
Tsogo Sun has begun upgrading its Suncoast casino. It plans to spend R2.1 billion over the next two years to expand casino floor space, adding 900 gaming machines and 16 gaming tables as part of a major development that will include a 20 000 square metre retail mall, restaurants and a multilevel parking garage. The project is expected to be completed by mid-2018 and should give the market a boost.
In 2015, the Gauteng Gambling Board approved Sun International’s relocation of the Morula Sun to Menlyn Maine. Sun International is spending R4 billion on the new Time Square facility in Menlyn Maine, which will include a larger casino with more slot machines and gaming tables, as well as an expanded hotel. The Time Square casino is scheduled to open in 2017 and should likewise stimulate the market. Sun International have also spent R800 million on the refurbishment of its Sun City resort including, two new and very exclusive, by invitation only, high-end casinos, the Palace Villa and the Palace Salon, located in The Palace.
In June 2016, Emfuleni Resorts, a subsidiary of Sun International, cancelled plans to build a mixed-use development on empty land adjoining the Boardwalk Precinct in Port Elizabeth as part of a complex that would have included a shopping mall and events venue. The Boardwalk Precinct, where the casino is currently located, has nine years remaining on its 15-year licence. The new project was contingent on a 20-year extension of the licence but the Eastern Cape Gambling and Betting Board chose not to extend that licence at this time.
Authorised licences Issued licences Operating casinos
Gauteng 7 7 7
KwaZulu-Natal 5 5 5
Western Cape 5 5 5
Eastern Cape 5 4 4
Free State 4 4 4
Mpumalanga 4 3 3
North West 5 4 4
Limpopo 3 3 3
Northern Cape 3 3 3
Total 41 38 38
Sources: PricewaterhouseCoopers LLP, Wilkofsky Gruen Associates
Sources: National Gambling Board of South Africa, PricewaterhouseCoopers LLP, Wilkofsky Gruen Associates, CASA
2012 2013 2014 2015 2012–13 % change
2013–14 % change
2014–15 % change
Gauteng 7 229 6 988 7 096 7 483 -3.3 1.5 5.5
KwaZulu-Natal 2 967 3 073 3 198 3 443 3.6 4.1 7.7
Western Cape 2 393 2 536 2 701 2 773 6.0 6.5 2.7
North West 1 015 1 042 1 085 1 358 2.7 4.1 25.2
Eastern Cape 1 108 1 171 1 197 1 213 5.7 2.2 1.3
Mpumalanga 709 729 758 743 2.8 4.0 -2.0
Free State 419 420 467 506 0.2 11.2 8.4
Limpopo 373 352 354 456 -5.6 0.6 28.8
Northern Cape 191 187 210 238 -2.1 12.3 13.3
Total 16 404 16 498 17 063 18 213 0.6 3.4 6.7
21PwC
Overnight tourist visitors (thousands), 2015 vs 2016
South Africa is also experiencing growth in the number of foreign visitors in 2016, helped by the depreciating rand, and easing of certain visa restrictions, which is making South Africa more affordable and more attractive for international travellers. Over the first seven months of 2016, the number of foreign overnight tourist visitors to South Africa was up 14.9%. Growth in foreign tourism should have a positive impact on casino revenues.
The economy is also showing signs of improvement. After declining by 1.2% in the first quarter of 2016, real GDP growth rebounded in the second quarter with a 3.3% increase, its best performance since the fourth quarter of 2014. For 2016 as a whole, the economy in real terms is expected to be relatively flat, but the International Monetary
Fund projects progressively faster increases over the 2017–2020 period.
We project casino GGR growth to drop to 4.0% in 2016 but to then improve in 2017 and 2018 as the Tsogo Sun and Sun International projects are completed. We then look for slower growth in 2019 and 2020 as the impact of these projects runs its course. For the forecast period as a whole, casino GGR will increase at an estimated 4.2% compound annual rate, rising to R22.4 billion in 2020 from R18.2 billion in 2015.
In early 2016, The Gauteng Provincial Legislature announced it was revamping the tax structure for casinos, eliminating the flat 9% rate that applies to all casinos in the province and replacing it with a progressive structure dependent on the casinos revenues. The larger
casinos are concerned about the new tax structure, as a higher tax rate will affect their profitability and may impact future investment plans. However no further announcements have been made as to whether this revamped tax structure will be implemented.
We expect casino taxes and levies to rise at a 4.2% compound annual rate to an estimated R2.2 billion in 2020, from R1.8 billion in 2015. That figure does not include the deemed output VAT.
Source: Statistics South Africa
2015 2016 % change
January 878 1 013 13.3
February 681 804 15.3
March 733 905 19.0
April 720 796 9.5
May 685 761 10.0
June 610 691 11.7
July 733 822 10.8
August 731 834 12.4
September 717 794 9.7
October 749 851 12.0
November 774 809 4.3
Total 8 011 9 080 11.8
Photo courtesy of Tsogo Sun.
22 Gambling outlook: 2016 – 2020 • South Africa
Casino gambling in South Africa (R millions)
Fig. 9 Casino GGR, 2011–2020 (R millions)
Fig. 10 Casino share of non-betting gambling revenues (%)
Historical data Forecast data
2011 2012 2013 2014 2015 2016 2017 2018 2019 2020 2016–20 CAGR
GGR 14 855 16 404 16 498 17 063 18 213 18 950 19 880 20 875 21 730 22 380
% change 5.8 10.4 0.6 3.4 6.7 4.0 4.9 5.0 4.1 3.0 4.2
Taxes and levies 1 405 1 579 1 640 1 751 1 812 1 890 1 980 2 080 2 160 2 230
% change 6.6 12.4 3.9 6.8 3.5 4.3 4.8 5.1 3.8 3.2 4.2
Sources: National Gambling Board of South Africa, PricewaterhouseCoopers LLP, Wilkofsky Gruen Associates, CASA
Sources: National Gambling Board of South Africa, PricewaterhouseCoopers LLP, Wilkofsky Gruen Associates, CASA
Sources: National Gambling Board of South Africa, PricewaterhouseCoopers LLP, Wilkofsky Gruen Associates, CASA
0
5000
10000
15000
20000
25000
2020201920182017201620152014201320122011
14 855
21 73020 875
19 88018 950
18 21317 06316 49816 404
22 380
70
80
90
100
2020201920182017201620152014201320122011
91.3
81,681,982,282,683,384,7
85,8
87.0
89.6
23PwC
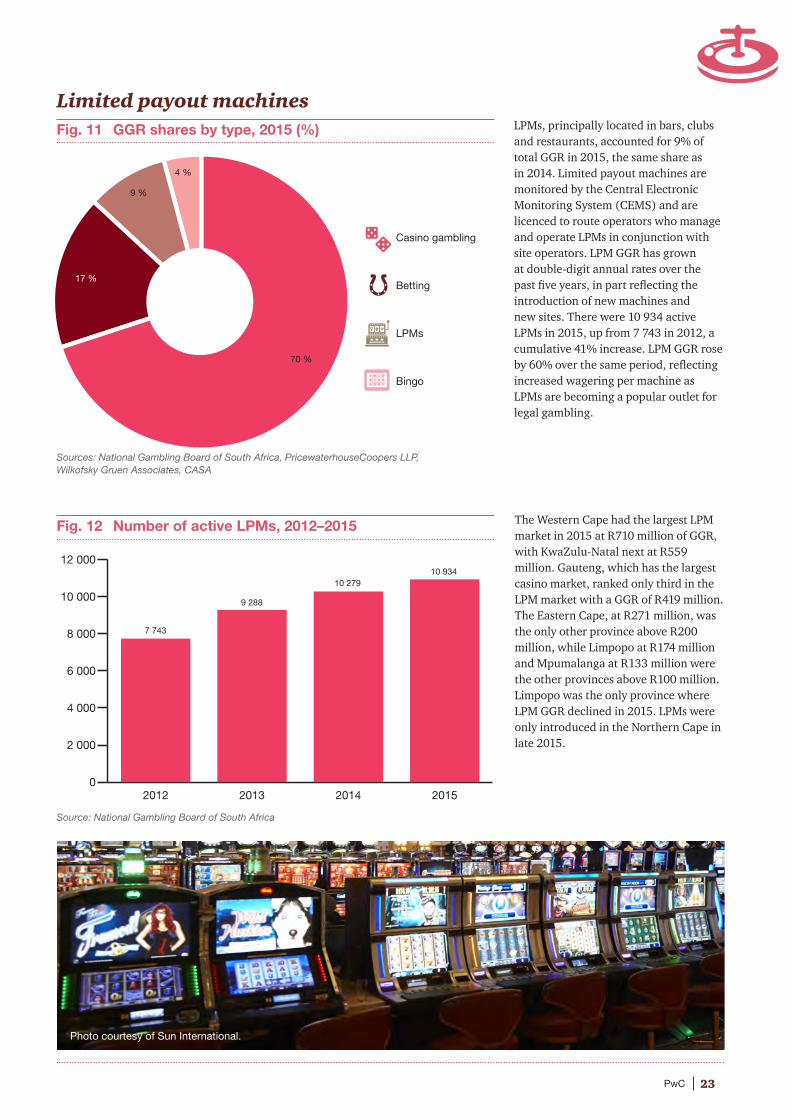
Limited payout machinesFig. 11 GGR shares by type, 2015 (%) LPMs, principally located in bars, clubs
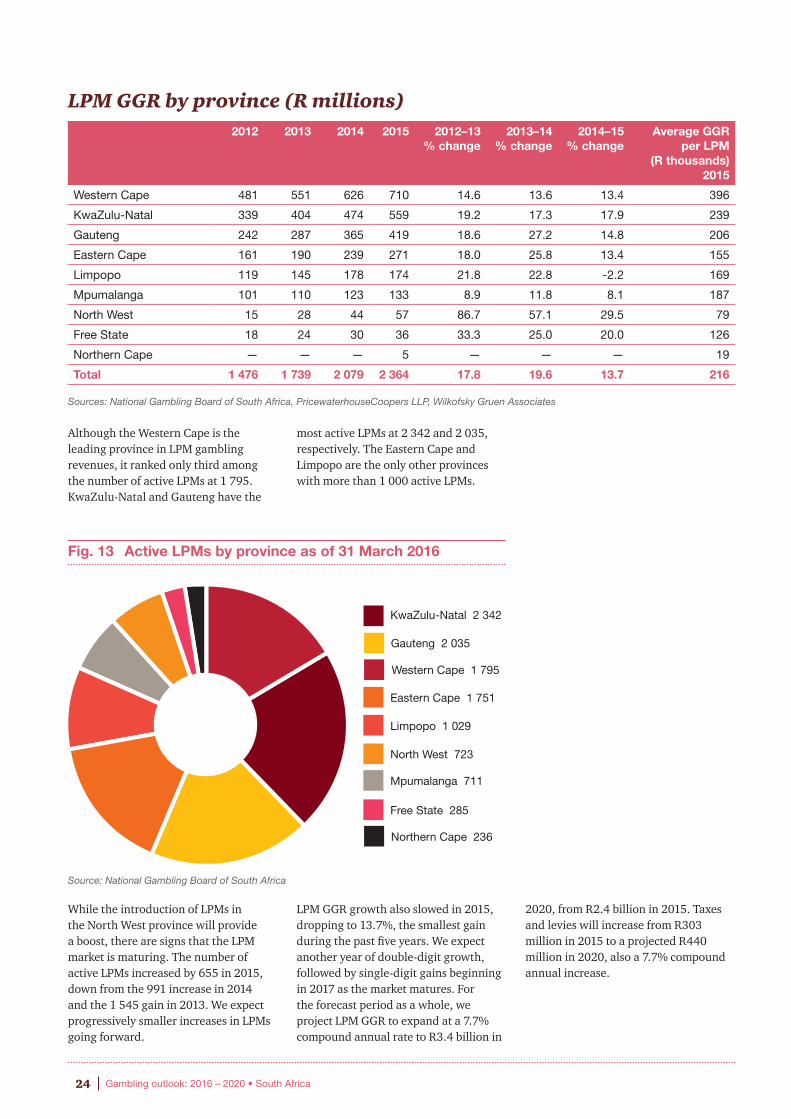
and restaurants, accounted for 9% of total GGR in 2015, the same share as in 2014. Limited payout machines are monitored by the Central Electronic Monitoring System (CEMS) and are licenced to route operators who manage and operate LPMs in conjunction with site operators. LPM GGR has grown at double-digit annual rates over the past five years, in part reflecting the introduction of new machines and new sites. There were 10 934 active LPMs in 2015, up from 7 743 in 2012, a cumulative 41% increase. LPM GGR rose by 60% over the same period, reflecting increased wagering per machine as LPMs are becoming a popular outlet for legal gambling.
Fig. 12 Number of active LPMs, 2012–2015 The Western Cape had the largest LPM market in 2015 at R710 million of GGR, with KwaZulu-Natal next at R559 million. Gauteng, which has the largest casino market, ranked only third in the LPM market with a GGR of R419 million. The Eastern Cape, at R271 million, was the only other province above R200 million, while Limpopo at R174 million and Mpumalanga at R133 million were the other provinces above R100 million. Limpopo was the only province where LPM GGR declined in 2015. LPMs were only introduced in the Northern Cape in late 2015.
Sources: National Gambling Board of South Africa, PricewaterhouseCoopers LLP, Wilkofsky Gruen Associates, CASA
Source: National Gambling Board of South Africa
0
2 000
4 000
6 000
8 000
10 000
12 000
2015201420132012
10 934
7 743
9 288
10 279
Bingo
LPMs
Betting
Casino gambling
4 %
9 %
17 %
70 %
Photo courtesy of Sun International.
Casino gambling
Betting
LPMs
Bingo
24 Gambling outlook: 2016 – 2020 • South Africa
LPM GGR by province (R millions)
Although the Western Cape is the leading province in LPM gambling revenues, it ranked only third among the number of active LPMs at 1 795. KwaZulu-Natal and Gauteng have the
most active LPMs at 2 342 and 2 035, respectively. The Eastern Cape and Limpopo are the only other provinces with more than 1 000 active LPMs.
Fig. 13 Active LPMs by province as of 31 March 2016
While the introduction of LPMs in the North West province will provide a boost, there are signs that the LPM market is maturing. The number of active LPMs increased by 655 in 2015, down from the 991 increase in 2014 and the 1 545 gain in 2013. We expect progressively smaller increases in LPMs going forward.
LPM GGR growth also slowed in 2015, dropping to 13.7%, the smallest gain during the past five years. We expect another year of double-digit growth, followed by single-digit gains beginning in 2017 as the market matures. For the forecast period as a whole, we project LPM GGR to expand at a 7.7% compound annual rate to R3.4 billion in
2020, from R2.4 billion in 2015. Taxes and levies will increase from R303 million in 2015 to a projected R440 million in 2020, also a 7.7% compound annual increase.
2012 2013 2014 2015 2012–13 % change
2013–14 % change
2014–15 % change
Average GGR per LPM
(R thousands) 2015
Western Cape 481 551 626 710 14.6 13.6 13.4 396
KwaZulu-Natal 339 404 474 559 19.2 17.3 17.9 239
Gauteng 242 287 365 419 18.6 27.2 14.8 206
Eastern Cape 161 190 239 271 18.0 25.8 13.4 155
Limpopo 119 145 178 174 21.8 22.8 -2.2 169
Mpumalanga 101 110 123 133 8.9 11.8 8.1 187
North West 15 28 44 57 86.7 57.1 29.5 79
Free State 18 24 30 36 33.3 25.0 20.0 126
Northern Cape — — — 5 — — — 19
Total 1 476 1 739 2 079 2 364 17.8 19.6 13.7 216
Sources: National Gambling Board of South Africa, PricewaterhouseCoopers LLP, Wilkofsky Gruen Associates
Source: National Gambling Board of South Africa
Northern Cape 236
Free State 285
North West 723
Mpumalanga 711
Limpopo 1 029
Eastern Cape 1 751
Gauteng 2 035
KwaZulu-Natal 2 342
Western Cape 1 795
25PwC
Limited payout machines (R millions)
Fig. 14 Limited payout machines GGR, 2011–2020 (R millions)
Sources: National Gambling Board of South Africa, PricewaterhouseCoopers LLP, Wilkofsky Gruen Associates
Sources: National Gambling Board of South Africa, PricewaterhouseCoopers LLP, Wilkofsky Gruen Associates
Historical data Forecast data
2011 2012 2013 2014 2015 2016 2017 2018 2019 2020 2016–20 CAGR
GGR 1 174 1 476 1 739 2 079 2 364 2 660 2 910 3 110 3 270 3 420
% change 30.6 25.7 17.8 19.6 13.7 12.5 9.4 6.9 5.1 4.6 7.7
Taxes and levies 140 181 214 262 303 340 370 400 420 440
% change 33.3 29.3 18.2 22.4 15.6 12.2 8.8 8.1 5.0 4.8 7.7
0
500
1 000
1 500
2 000
2 500
3 000
3 500
4 000
2020201920182017201620152014201320122011
1 174
3 4203 270
3 1102 910
2 660
2 346
2 079
1 739
1 476
Photo courtesy of Sun International.
26 Gambling outlook: 2016 – 2020 • South Africa
BingoFig. 15 GGR shares by type, 2015 (%)
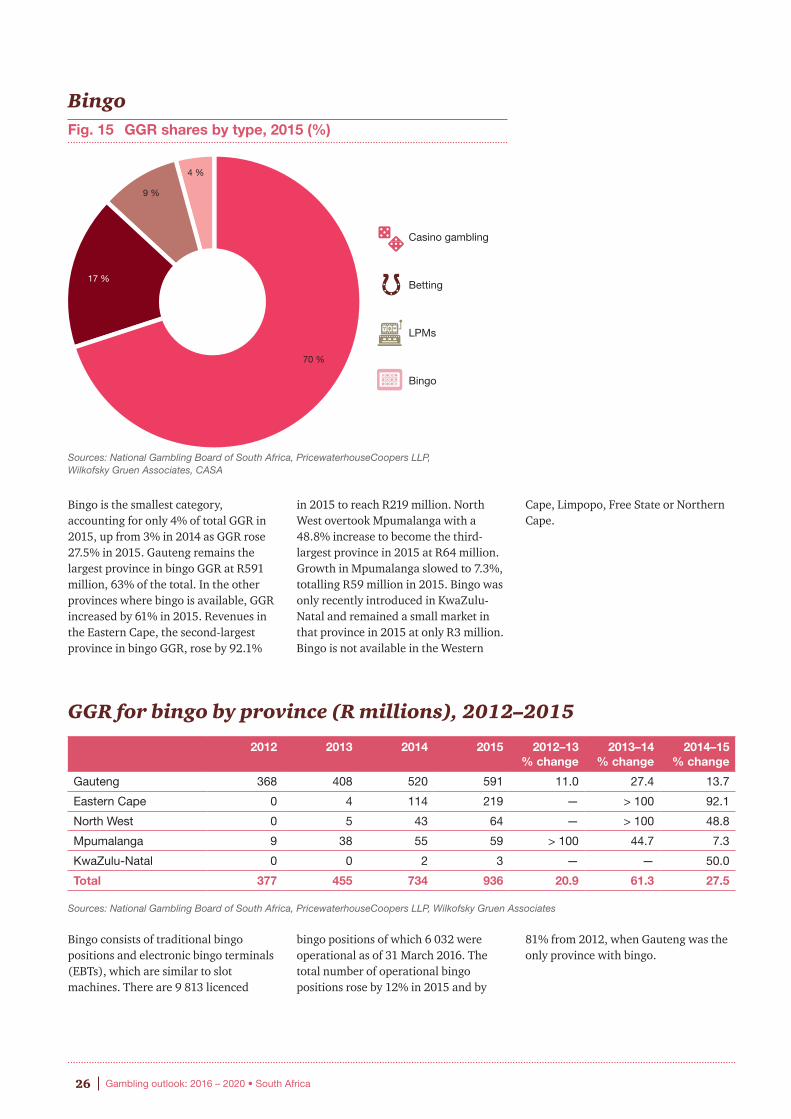
Bingo is the smallest category, accounting for only 4% of total GGR in 2015, up from 3% in 2014 as GGR rose 27.5% in 2015. Gauteng remains the largest province in bingo GGR at R591 million, 63% of the total. In the other provinces where bingo is available, GGR increased by 61% in 2015. Revenues in the Eastern Cape, the second-largest province in bingo GGR, rose by 92.1%
in 2015 to reach R219 million. North West overtook Mpumalanga with a 48.8% increase to become the third-largest province in 2015 at R64 million. Growth in Mpumalanga slowed to 7.3%, totalling R59 million in 2015. Bingo was only recently introduced in KwaZulu-Natal and remained a small market in that province in 2015 at only R3 million. Bingo is not available in the Western
Cape, Limpopo, Free State or Northern Cape.
GGR for bingo by province (R millions), 2012–2015
Bingo consists of traditional bingo positions and electronic bingo terminals (EBTs), which are similar to slot machines. There are 9 813 licenced
bingo positions of which 6 032 were operational as of 31 March 2016. The total number of operational bingo positions rose by 12% in 2015 and by
81% from 2012, when Gauteng was the only province with bingo.
2012 2013 2014 2015 2012–13 % change
2013–14 % change
2014–15 % change
Gauteng 368 408 520 591 11.0 27.4 13.7
Eastern Cape 0 4 114 219 — > 100 92.1
North West 0 5 43 64 — > 100 48.8
Mpumalanga 9 38 55 59 > 100 44.7 7.3
KwaZulu-Natal 0 0 2 3 — — 50.0
Total 377 455 734 936 20.9 61.3 27.5
Sources: National Gambling Board of South Africa, PricewaterhouseCoopers LLP, Wilkofsky Gruen Associates, CASA
Sources: National Gambling Board of South Africa, PricewaterhouseCoopers LLP, Wilkofsky Gruen Associates
Bingo
LPMs
Betting
Casino gambling
4 %
9 %
17 %
70 %
Casino gambling
Betting
LPMs
Bingo
27PwC
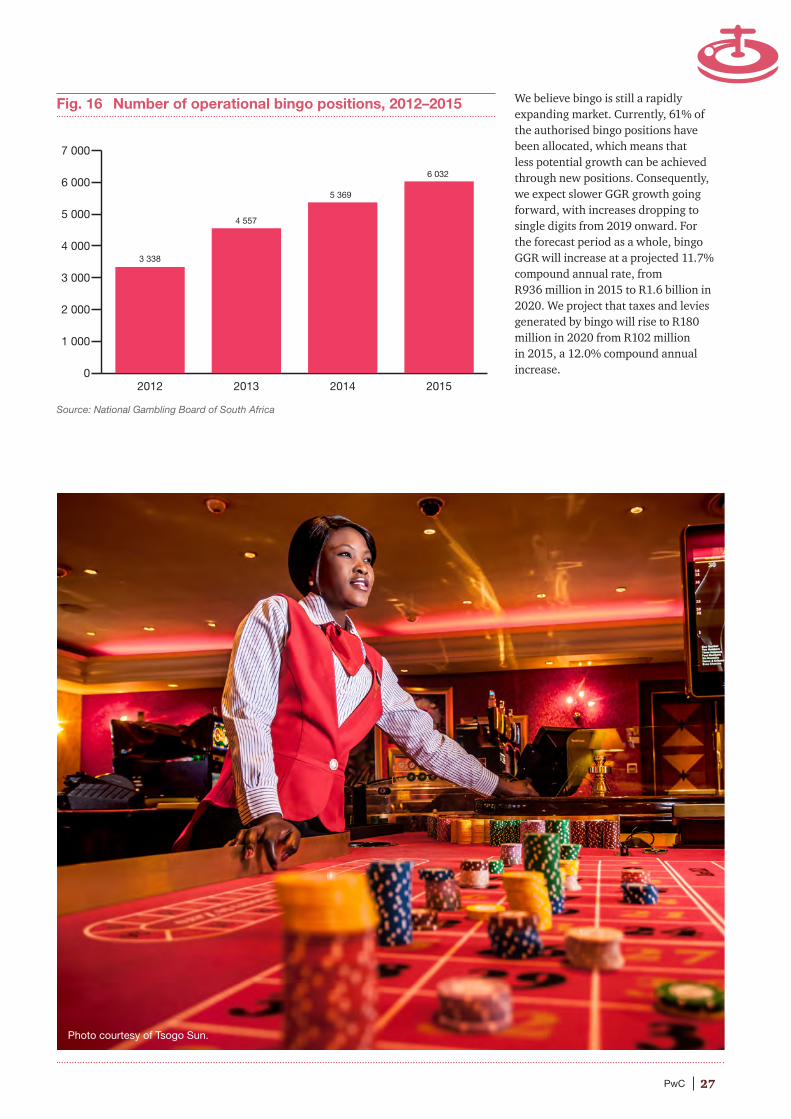
Fig. 16 Number of operational bingo positions, 2012–2015 We believe bingo is still a rapidly expanding market. Currently, 61% of the authorised bingo positions have been allocated, which means that less potential growth can be achieved through new positions. Consequently, we expect slower GGR growth going forward, with increases dropping to single digits from 2019 onward. For the forecast period as a whole, bingo GGR will increase at a projected 11.7% compound annual rate, from R936 million in 2015 to R1.6 billion in 2020. We project that taxes and levies generated by bingo will rise to R180 million in 2020 from R102 million in 2015, a 12.0% compound annual increase.
Source: National Gambling Board of South Africa
0
1 000
2 000
3 000
4 000
5 000
6 000
7 000
2015201420132012
3 338
6 032
5 369
4 557
Photo courtesy of Tsogo Sun.
28 Gambling outlook: 2016 – 2020 • South Africa
Bingo (R millions)
Fig. 17 Bingo GGR, 2011–2020 (R millions)
Sources: National Gambling Board of South Africa, PricewaterhouseCoopers LLP, Wilkofsky Gruen Associates
Historical data Forecast data
2011 2012 2013 2014 2015 2016 2017 2018 2019 2020 2016–20 CAGR
GGR 235 437 732 734 936 1 130 1 290 1 420 1 530 1 630
% change 19.9 86.0 67.5 0.3 27.5 20.7 14.2 10.1 7.7 6.5 11.7
Taxes and levies 29 45 53 81 102 120 140 150 170 180
% change 26.1 55.2 17.8 52.8 25.9 17.6 16.7 7.1 13.3 5.9 12.0
0
200
400
600
800
1000
1200
1400
1600
1800
2020201920182017201620152014201320122011
1 6301 530
1 420
1 290
1 130
936
734732
437
235
Sources: National Gambling Board of South Africa, PricewaterhouseCoopers LLP, Wilkofsky Gruen Associates
Photo courtesy of Tsogo Sun.Photo courtesy of Sun internationalPhoto courtesy of Sun international
29PwC
Betting
Fig. 18 GGR shares by type, 2015 (%)
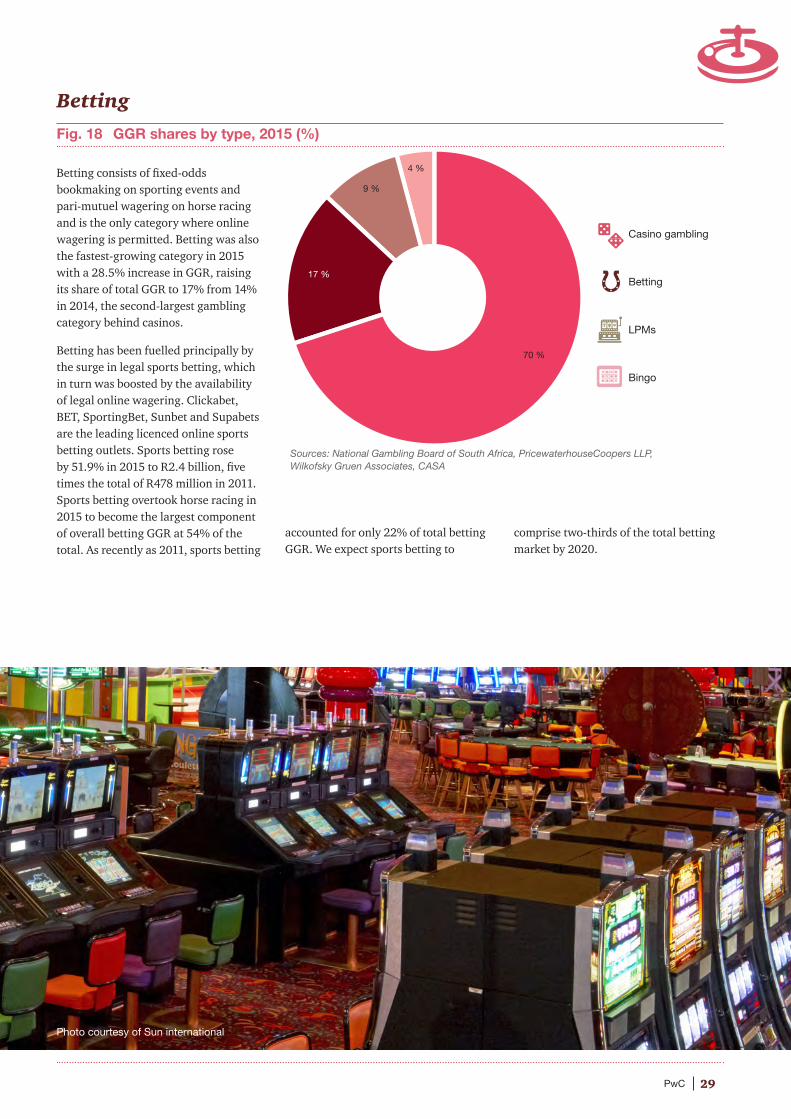
Betting consists of fixed-odds bookmaking on sporting events and pari-mutuel wagering on horse racing and is the only category where online wagering is permitted. Betting was also the fastest-growing category in 2015 with a 28.5% increase in GGR, raising its share of total GGR to 17% from 14% in 2014, the second-largest gambling category behind casinos.
Betting has been fuelled principally by the surge in legal sports betting, which in turn was boosted by the availability of legal online wagering. Clickabet, BET, SportingBet, Sunbet and Supabets are the leading licenced online sports betting outlets. Sports betting rose by 51.9% in 2015 to R2.4 billion, five times the total of R478 million in 2011. Sports betting overtook horse racing in 2015 to become the largest component of overall betting GGR at 54% of the total. As recently as 2011, sports betting
accounted for only 22% of total betting GGR. We expect sports betting to
comprise two-thirds of the total betting market by 2020.
Sources: National Gambling Board of South Africa, PricewaterhouseCoopers LLP, Wilkofsky Gruen Associates, CASA
Bingo
LPMs
Betting
Casino gambling
4 %
9 %
17 %
70 %
Casino gambling
Betting
LPMs
Bingo
Photo courtesy of Sun international
30 Gambling outlook: 2016 – 2020 • South Africa
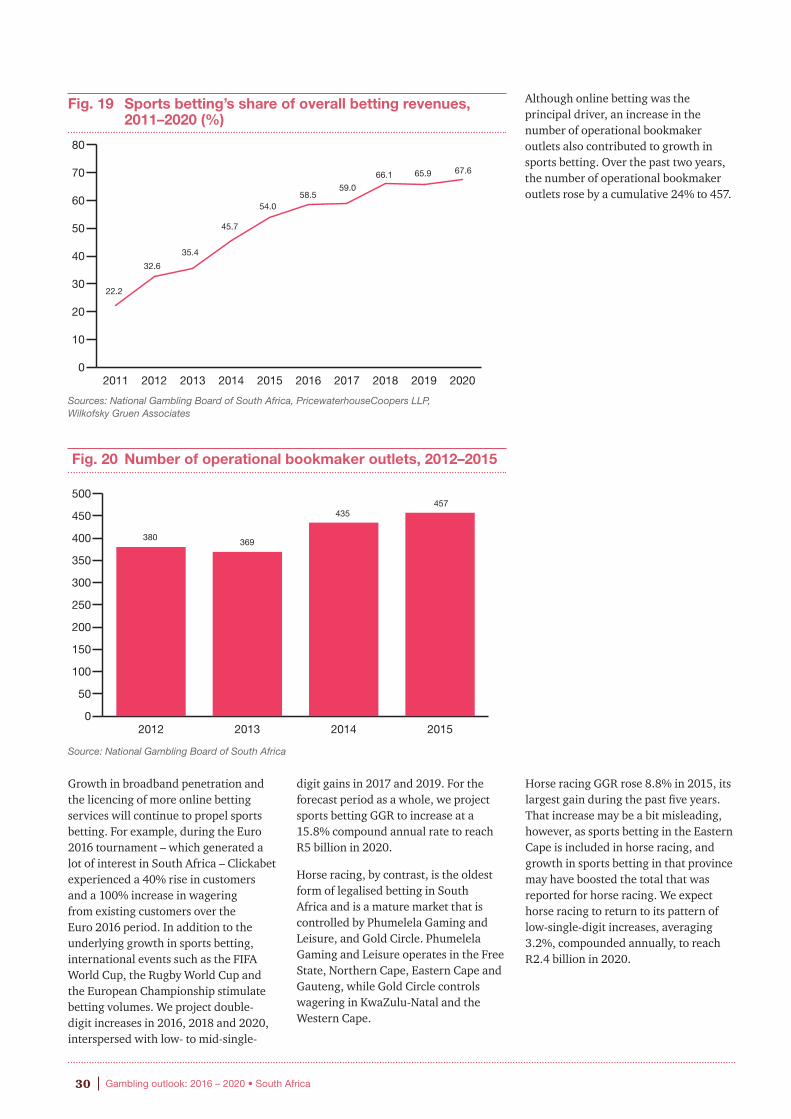
Fig. 19 Sports betting’s share of overall betting revenues, 2011–2020 (%)
Although online betting was the principal driver, an increase in the number of operational bookmaker outlets also contributed to growth in sports betting. Over the past two years, the number of operational bookmaker outlets rose by a cumulative 24% to 457.
Fig. 20 Number of operational bookmaker outlets, 2012–2015
Growth in broadband penetration and the licencing of more online betting services will continue to propel sports betting. For example, during the Euro 2016 tournament – which generated a lot of interest in South Africa – Clickabet experienced a 40% rise in customers and a 100% increase in wagering from existing customers over the Euro 2016 period. In addition to the underlying growth in sports betting, international events such as the FIFA World Cup, the Rugby World Cup and the European Championship stimulate betting volumes. We project double-digit increases in 2016, 2018 and 2020, interspersed with low- to mid-single-
digit gains in 2017 and 2019. For the forecast period as a whole, we project sports betting GGR to increase at a 15.8% compound annual rate to reach R5 billion in 2020.
Horse racing, by contrast, is the oldest form of legalised betting in South Africa and is a mature market that is controlled by Phumelela Gaming and Leisure, and Gold Circle. Phumelela Gaming and Leisure operates in the Free State, Northern Cape, Eastern Cape and Gauteng, while Gold Circle controls wagering in KwaZulu-Natal and the Western Cape.
Horse racing GGR rose 8.8% in 2015, its largest gain during the past five years. That increase may be a bit misleading, however, as sports betting in the Eastern Cape is included in horse racing, and growth in sports betting in that province may have boosted the total that was reported for horse racing. We expect horse racing to return to its pattern of low-single-digit increases, averaging 3.2%, compounded annually, to reach R2.4 billion in 2020.
Sources: National Gambling Board of South Africa, PricewaterhouseCoopers LLP, Wilkofsky Gruen Associates
Source: National Gambling Board of South Africa
0
10
20
30
40
50
60
70
80
2020201920182017201620152014201320122011
22.2
67.665.966.1
59.058.5
54.0
45.7
35.4
32.6
0
50
100
150
200
250
300
350
400
450
500
2015201420132012
380
457435
369
31PwC
Betting GGR by category (R millions)
Gauteng is the leading horse racing province with R769 million in GGR in 2015, up 1.1%. KwaZulu-Natal was next at R586 million, a 12.7% increase
from 2014. Together, the two provinces generated 66% of total horse racing GGR. The Western Cape at R220 million and the Eastern Cape at R203 million
were the only other provinces in 2015 above R100 million.
GGR for horse racing by province (R millions), 2012–2015
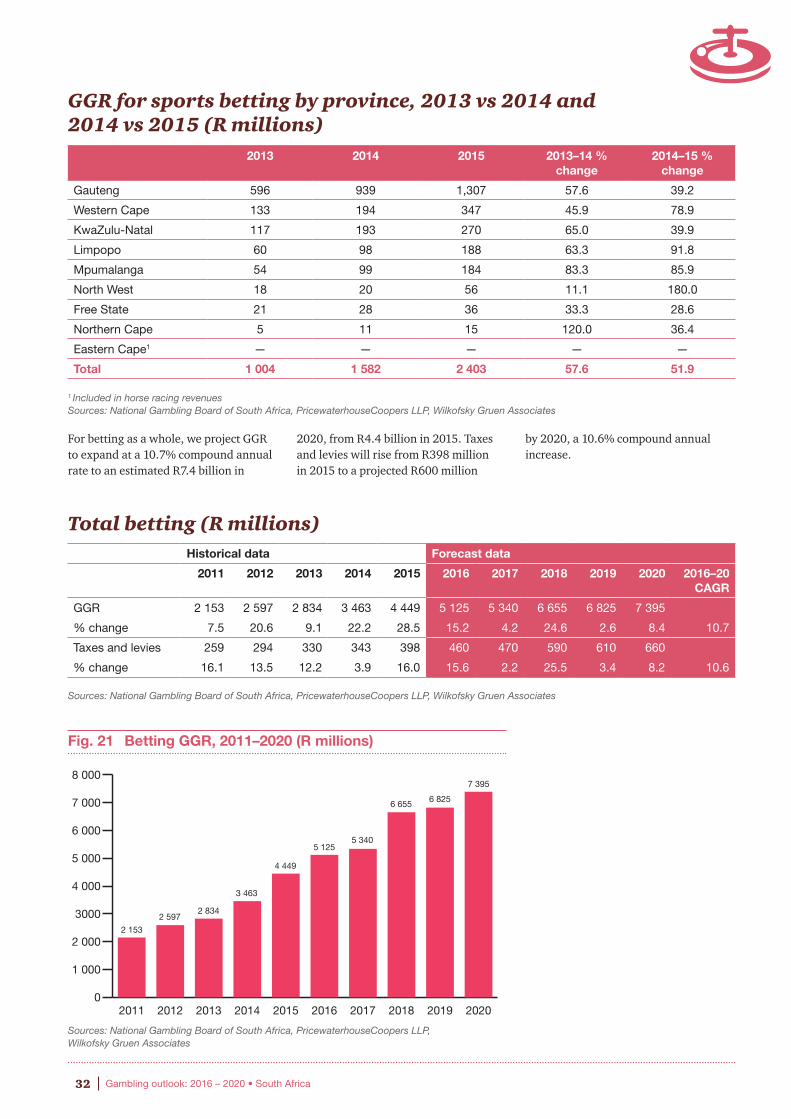
Sports betting, reported based on where the licence is issued, is concentrated in Gauteng, which accounted for 54% of total sports betting GGR in 2015 at R1.3
billion. The Western Cape and KwaZulu-Natal were next at R347 million and R270 million, respectively. Limpopo at R188 million and Mpumalanga at R184
million were the only other provinces above R100 million.
Sources: National Gambling Board of South Africa, PricewaterhouseCoopers LLP, Wilkofsky Gruen Associates
1 Includes sports betting Sources: National Gambling Board of South Africa, PricewaterhouseCoopers LLP, Wilkofsky Gruen Associates
Historical data Forecast data
2011 2012 2013 2014 2015 2016 2017 2018 2019 2020 2016–20 CAGR
Horse racing 1 675 1 750 1 830 1 881 2 046 2 125 2 190 2 255 2 325 2 395
% change 1.5 4.5 4.6 2.8 8.8 3.9 3.1 3.0 3.1 3.0 3.2
Sports betting 478 847 1 004 1 582 2 403 3 000 3 150 4 400 4 500 5 000
% change 35.8 77.2 18.5 57.6 51.9 24.8 5.0 39.7 2.3 11.1 15.8
Total 2 153 2 597 2 834 3 463 4 449 5 125 5 340 6 655 6 825 7 395
% change 7.5 20.6 9.1 22.2 28.5 15.2 4.2 24.6 2.6 8.4 10.7
2012 2013 2014 2015 2012–13 % change
2013–14 % change
2014–15 % change
Gauteng 641 646 761 769 0.8 17.8 1.1
KwaZulu-Natal 549 564 520 586 2.7 -7.8 12.7
Western Cape 203 192 198 220 -5.4 3.1 11.1
Eastern Cape1 148 164 170 203 10.8 3.7 19.4
Limpopo 42 71 82 94 69.0 15.5 14.6
North West 55 90 59 76 63.6 -34.4 28.8
Free State 62 64 55 60 3.2 -14.1 9.1
Mpumalanga 33 33 30 32 0.0 -9.1 6.7
Northern Cape 17 6 6 6 -64.7 0.0 0.0
Total 1 750 1 830 1 881 2 046 4.6 2.8 8.8
Photo courtesy of Tsogo Sun.
32 Gambling outlook: 2016 – 2020 • South Africa
GGR for sports betting by province, 2013 vs 2014 and 2014 vs 2015 (R millions)
For betting as a whole, we project GGR to expand at a 10.7% compound annual rate to an estimated R7.4 billion in
2020, from R4.4 billion in 2015. Taxes and levies will rise from R398 million in 2015 to a projected R600 million
by 2020, a 10.6% compound annual increase.
Total betting (R millions)
Fig. 21 Betting GGR, 2011–2020 (R millions)
2013 2014 2015 2013–14 % change
2014–15 % change
Gauteng 596 939 1,307 57.6 39.2
Western Cape 133 194 347 45.9 78.9
KwaZulu-Natal 117 193 270 65.0 39.9
Limpopo 60 98 188 63.3 91.8
Mpumalanga 54 99 184 83.3 85.9
North West 18 20 56 11.1 180.0
Free State 21 28 36 33.3 28.6
Northern Cape 5 11 15 120.0 36.4
Eastern Cape1 — — — — —
Total 1 004 1 582 2 403 57.6 51.9
1 Included in horse racing revenues Sources: National Gambling Board of South Africa, PricewaterhouseCoopers LLP, Wilkofsky Gruen Associates
Sources: National Gambling Board of South Africa, PricewaterhouseCoopers LLP, Wilkofsky Gruen Associates
Sources: National Gambling Board of South Africa, PricewaterhouseCoopers LLP, Wilkofsky Gruen Associates
Historical data Forecast data
2011 2012 2013 2014 2015 2016 2017 2018 2019 2020 2016–20 CAGR
GGR 2 153 2 597 2 834 3 463 4 449 5 125 5 340 6 655 6 825 7 395
% change 7.5 20.6 9.1 22.2 28.5 15.2 4.2 24.6 2.6 8.4 10.7
Taxes and levies 259 294 330 343 398 460 470 590 610 660
% change 16.1 13.5 12.2 3.9 16.0 15.6 2.2 25.5 3.4 8.2 10.6
0
1 000
2 000
3000
4 000
5 000
6 000
7 000
8 000
2020201920182017201620152014201320122011
2 153
7 395
6 8256 655
5 3405 125
4 449
3 463
2 8342 597
33PwC
Photo courtesy of Tsogo Sun.
34 Gambling outlook: 2016 – 2020 • South Africa
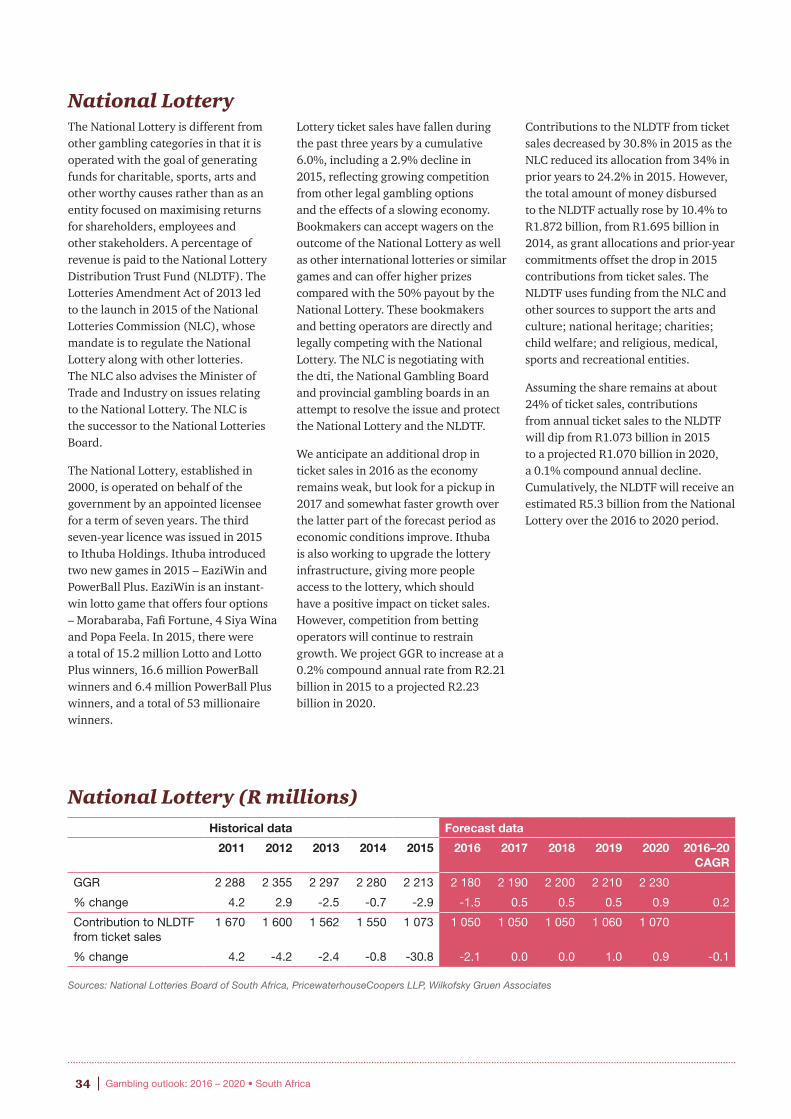
National Lottery The National Lottery is different from other gambling categories in that it is operated with the goal of generating funds for charitable, sports, arts and other worthy causes rather than as an entity focused on maximising returns for shareholders, employees and other stakeholders. A percentage of revenue is paid to the National Lottery Distribution Trust Fund (NLDTF). The Lotteries Amendment Act of 2013 led to the launch in 2015 of the National Lotteries Commission (NLC), whose mandate is to regulate the National Lottery along with other lotteries. The NLC also advises the Minister of Trade and Industry on issues relating to the National Lottery. The NLC is the successor to the National Lotteries Board.
The National Lottery, established in 2000, is operated on behalf of the government by an appointed licensee for a term of seven years. The third seven-year licence was issued in 2015 to Ithuba Holdings. Ithuba introduced two new games in 2015 – EaziWin and PowerBall Plus. EaziWin is an instant-win lotto game that offers four options – Morabaraba, Fafi Fortune, 4 Siya Wina and Popa Feela. In 2015, there were a total of 15.2 million Lotto and Lotto Plus winners, 16.6 million PowerBall winners and 6.4 million PowerBall Plus winners, and a total of 53 millionaire winners.
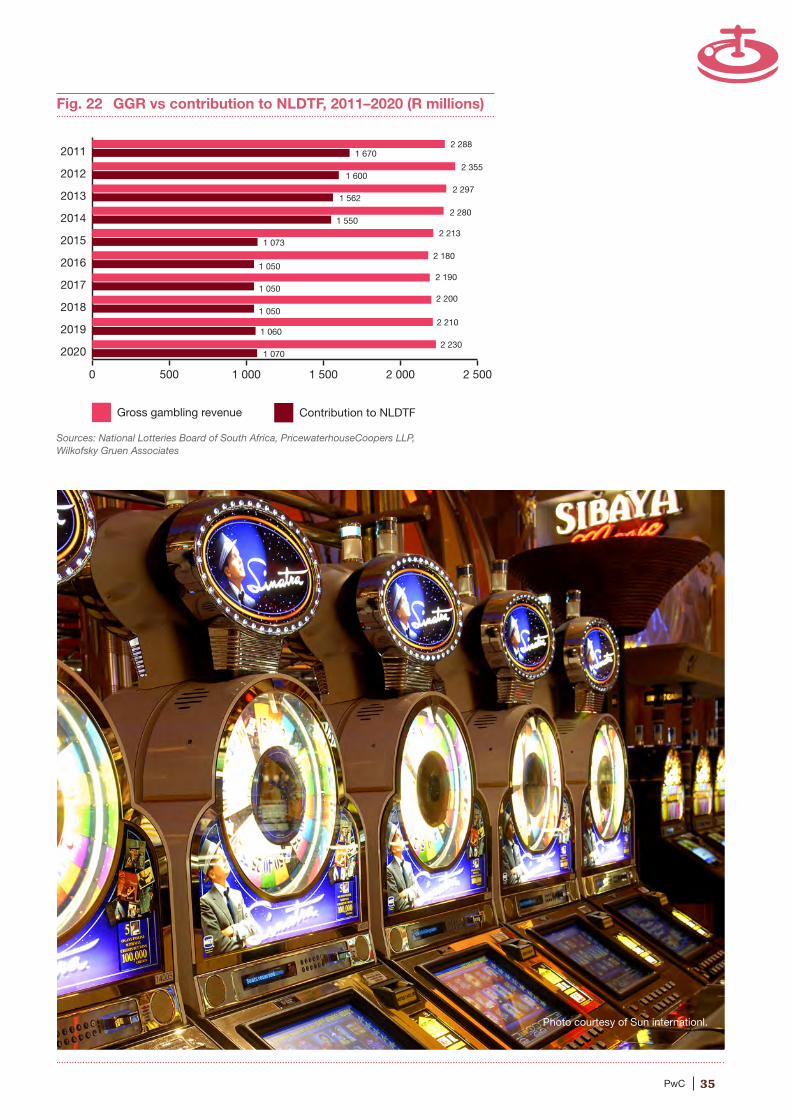
Lottery ticket sales have fallen during the past three years by a cumulative 6.0%, including a 2.9% decline in 2015, reflecting growing competition from other legal gambling options and the effects of a slowing economy. Bookmakers can accept wagers on the outcome of the National Lottery as well as other international lotteries or similar games and can offer higher prizes compared with the 50% payout by the National Lottery. These bookmakers and betting operators are directly and legally competing with the National Lottery. The NLC is negotiating with the dti, the National Gambling Board and provincial gambling boards in an attempt to resolve the issue and protect the National Lottery and the NLDTF.
We anticipate an additional drop in ticket sales in 2016 as the economy remains weak, but look for a pickup in 2017 and somewhat faster growth over the latter part of the forecast period as economic conditions improve. Ithuba is also working to upgrade the lottery infrastructure, giving more people access to the lottery, which should have a positive impact on ticket sales. However, competition from betting operators will continue to restrain growth. We project GGR to increase at a 0.2% compound annual rate from R2.21 billion in 2015 to a projected R2.23 billion in 2020.
Contributions to the NLDTF from ticket sales decreased by 30.8% in 2015 as the NLC reduced its allocation from 34% in prior years to 24.2% in 2015. However, the total amount of money disbursed to the NLDTF actually rose by 10.4% to R1.872 billion, from R1.695 billion in 2014, as grant allocations and prior-year commitments offset the drop in 2015 contributions from ticket sales. The NLDTF uses funding from the NLC and other sources to support the arts and culture; national heritage; charities; child welfare; and religious, medical, sports and recreational entities.
Assuming the share remains at about 24% of ticket sales, contributions from annual ticket sales to the NLDTF will dip from R1.073 billion in 2015 to a projected R1.070 billion in 2020, a 0.1% compound annual decline. Cumulatively, the NLDTF will receive an estimated R5.3 billion from the National Lottery over the 2016 to 2020 period.
National Lottery (R millions)Historical data Forecast data
2011 2012 2013 2014 2015 2016 2017 2018 2019 2020 2016–20 CAGR
GGR 2 288 2 355 2 297 2 280 2 213 2 180 2 190 2 200 2 210 2 230
% change 4.2 2.9 -2.5 -0.7 -2.9 -1.5 0.5 0.5 0.5 0.9 0.2
Contribution to NLDTF from ticket sales
1 670 1 600 1 562 1 550 1 073 1 050 1 050 1 050 1 060 1 070
% change 4.2 -4.2 -2.4 -0.8 -30.8 -2.1 0.0 0.0 1.0 0.9 -0.1
Sources: National Lotteries Board of South Africa, PricewaterhouseCoopers LLP, Wilkofsky Gruen Associates
35PwC
Fig. 22 GGR vs contribution to NLDTF, 2011–2020 (R millions)
Sources: National Lotteries Board of South Africa, PricewaterhouseCoopers LLP, Wilkofsky Gruen Associates
0 500 1 000 1 500 2 000 2 500
Contribution to NLDTFGross gambling revenue
2020
2019
2018
2017
2016
2015
2014
2013
2012
20112 288
2 230
2 210
2 200
2 190
2 180
2 213
1 070
1 060
1 050
1 073
1 5502 280
1 5622 297
1 6002 355
1 670
1 050
1 050
Photo courtesy of Sun internationl.

36 Gambling outlook: 2016 – 2020 • South Africa
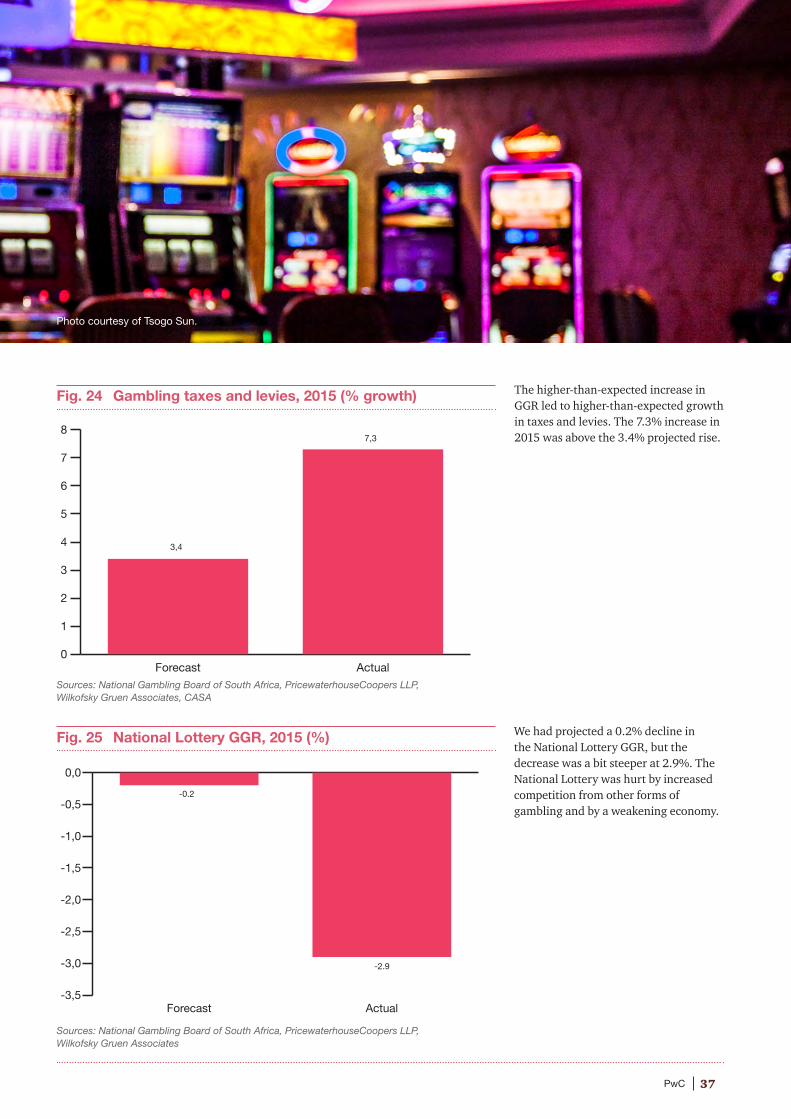
Fig. 23 GGR by type, 2015 (% growth)
0
10
20
30
40
ActualForecast
TotalBingo BettingLPMsCasino gambling
34.3
11.2
3.4
27.528.5
0.5
13.7
16.9
6.7
0.4
Sources: National Gambling Board of South Africa, PricewaterhouseCoopers LLP, Wilkofsky Gruen Associates, CASA
Looking back:2015In our previous Taking the odds report, released in December 2015, we forecast that overall GGR for South Africa would grow by 3.4% in 2015. This turned out to be a significant underestimation of the market, which actually grew by 11.2%. Casino gambling and betting grew much faster than we expected, and those gains offset shortfalls in limited payout machines and bingo growth.
Casino GGR increased by 6.7% compared with our 0.4% projected gain, and betting soared by 28.5% on the strength of large gains in online sports betting. We had predicted only a 0.5% increase in a post-FIFA World Cup year. In the case of casinos, the market rebounded in 2015 despite a weakening economy as two new casinos contributed to an increase in wagering.
Our projected 16.9% increase for LPMs was a bit higher than the 13.7% rise in GGR, as the LPM payout rate edged up in 2015.
37PwC
The higher-than-expected increase in GGR led to higher-than-expected growth in taxes and levies. The 7.3% increase in 2015 was above the 3.4% projected rise.
Fig. 24 Gambling taxes and levies, 2015 (% growth)
We had projected a 0.2% decline in the National Lottery GGR, but the decrease was a bit steeper at 2.9%. The National Lottery was hurt by increased competition from other forms of gambling and by a weakening economy.
Sources: National Gambling Board of South Africa, PricewaterhouseCoopers LLP, Wilkofsky Gruen Associates, CASA
11,9
3,4
0
1
2
3
4
5
6
7
8
ActualForecast
3,4
7,3
Fig. 25 National Lottery GGR, 2015 (%)
Sources: National Gambling Board of South Africa, PricewaterhouseCoopers LLP, Wilkofsky Gruen Associates
-3,5
-3,0
-2,5
-2,0
-1,5
-1,0
-0,5
0,0
ActualForecast
-0.2
-2.9
Photo courtesy of Tsogo Sun.
38 Gambling outlook: 2016 – 2020 • South Africa
Conclusion
Photo courtesy of Sun International.
39PwC
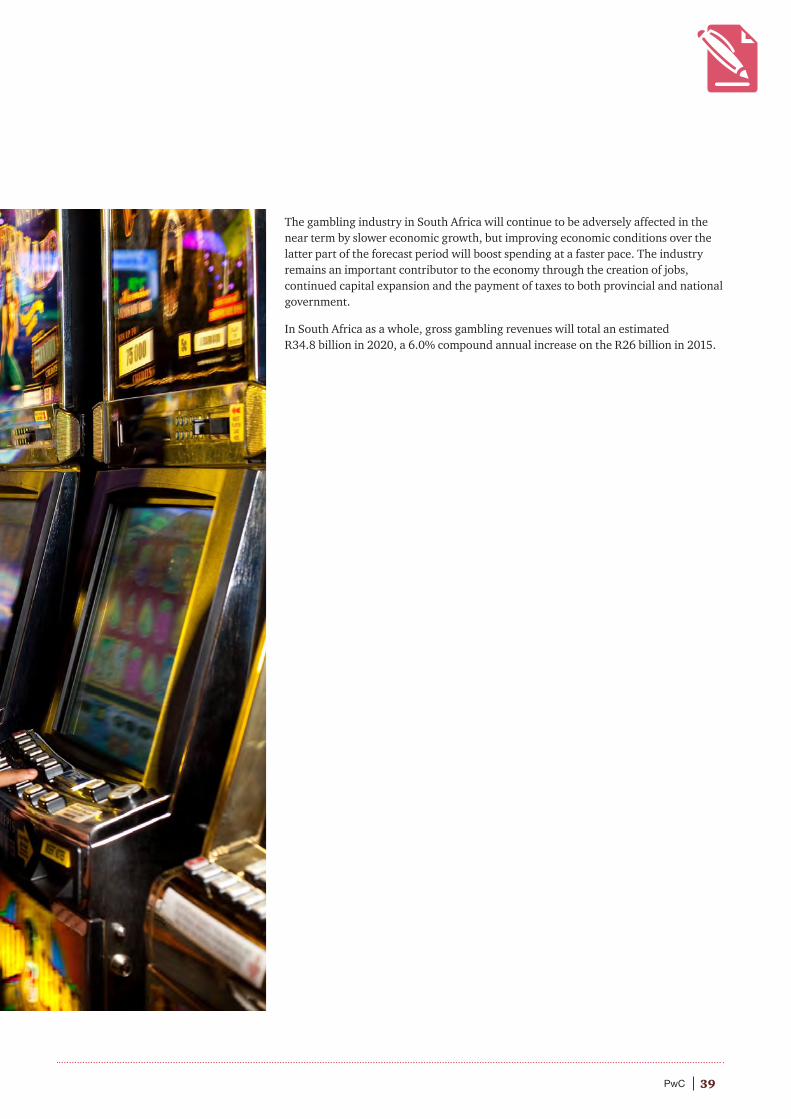
The gambling industry in South Africa will continue to be adversely affected in the near term by slower economic growth, but improving economic conditions over the latter part of the forecast period will boost spending at a faster pace. The industry remains an important contributor to the economy through the creation of jobs, continued capital expansion and the payment of taxes to both provincial and national government.
In South Africa as a whole, gross gambling revenues will total an estimated R34.8 billion in 2020, a 6.0% compound annual increase on the R26 billion in 2015.
40 Gambling outlook: 2016 – 2020 • South Africa
Glossary of abbreviations
Photo courtesy of Tsogo Sun.
41PwC
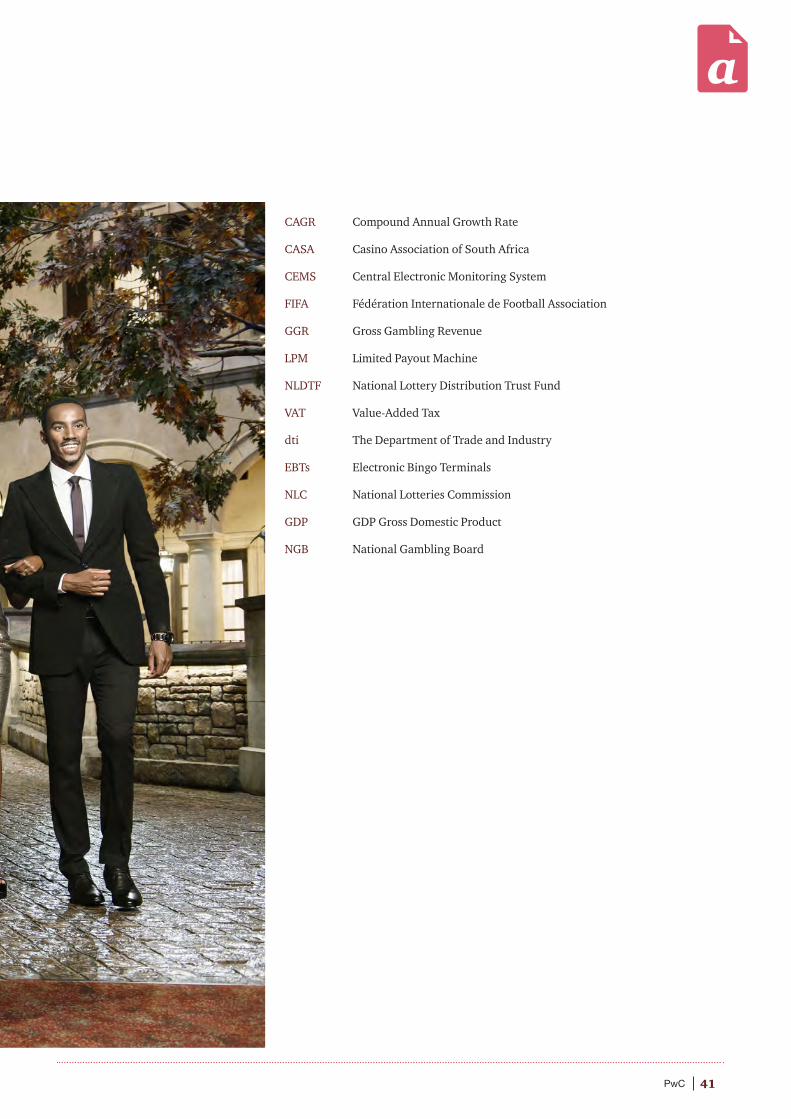
CAGR Compound Annual Growth Rate
CASA Casino Association of South Africa
CEMS Central Electronic Monitoring System
FIFA Fédération Internationale de Football Association
GGR Gross Gambling Revenue
LPM Limited Payout Machine
NLDTF National Lottery Distribution Trust Fund
VAT Value-Added Tax
dti The Department of Trade and Industry
EBTs Electronic Bingo Terminals
NLC National Lotteries Commission
GDP GDP Gross Domestic Product
NGB National Gambling Board
42 Gambling outlook: 2016 – 2020 • South Africa
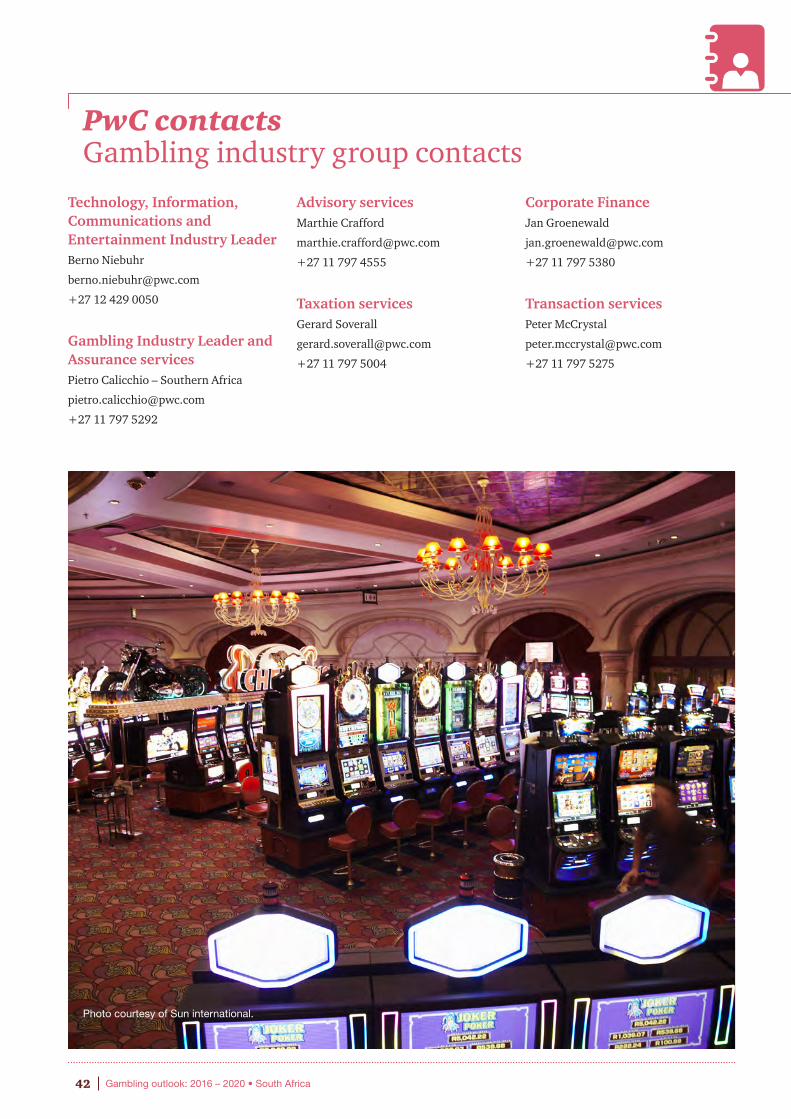
PwC contactsGambling industry group contacts
Technology, Information, Communications and Entertainment Industry LeaderBerno Niebuhr
+27 12 429 0050
Gambling Industry Leader and Assurance servicesPietro Calicchio – Southern Africa
+27 11 797 5292
Advisory servicesMarthie Crafford
+27 11 797 4555
Taxation servicesGerard Soverall
+27 11 797 5004
Corporate FinanceJan Groenewald
+27 11 797 5380
Transaction servicesPeter McCrystal
+27 11 797 5275
Photo courtesy of Sun international.

43PwC
www.pwc.co.za/gambling
OHSAS 18001Only wood form sustainable forests is usedISO 14001, 9001 certificationFSC, CoC, PEFC approvedEMAS MemberPaper Profile MemberManufactured from TCF pulp ( total chlorine free )Acid FreeRecyclable
This publication is printed on Magno Satin Matt
© 2017. PricewaterhouseCoopers (“PwC”), a South African firm, PwC is part of the PricewaterhouseCoopers International Limited (“PwCIL”) network that consists of separate and independent legal entities that do not act as agents of PwCIL or any other member firm, nor is PwCIL or the separate firms responsible or liable for the acts or omissions of each other in any way. No portion of this document may be reproduced by any process without the written permission of PwC. (16-19579)