Embed Size (px)
Citation preview

GamblinG Sector Performance rePortFinancial Year 2012/2013
neXt
CLICK ON LINKS TO NAVIGATE

bacK to toP
CLICK ON LINKS TO NAVIGATE
IndexAcknowledgements
Exclusion of claims
Foreword
Abbreviations
Explanatory notes
List of tables and graphs
Executive summary: Overview of the South African gambling sector
1 cHaPter 1: introDUction
2 cHaPter 2: caSino Sector
3 cHaPter 3: racinG anD bettinG Sector
4 cHaPter 4: limiteD PaYoUt macHine Sector
5 cHaPter 5: binGo Sector
6 cHaPter 6: conclUSion
ii© National Gambling Board, 2014
acknowledgementsThe following people and institutions are acknowledged for their inputs in the compilation of this report:
• All Provincial Licensing Authorities for submitting (audited) information related to market conduct, market share and provinvicial gambling statistics per mode, operator and province.
exclusion of claimsThe National Gambling Board (NGB), nor the Department of Trade and Industry (the dti), do not guarantee or provide any commercial warranties and/or guarantee the robustness for the purpose of use, nor are any such warranties to be implied with respect to the information and data published herein.
In no event shall the NGB and (the dti), nor its employees, officers or representatives become liable to users of the data and information provided herein, or to any other party, for any loss or damage, consequential or otherwise, including but not limited to time, money or goodwill, arising from the use, operation or modification of the data or information, or for the failure to transmit a copy of any particular document. In using the information or data, users assume the risk for relying on such data or information, and further agree to indemnity, defend, and hold harmless the NGB or the dti, and its employees, officers and representatives for any and all liability of any nature arising out of or resulting from the lack of accuracy or correctness of the information or data, or the use of the information or data. Further, in using this information or data, the user acknowledges that the user is responsible for personally assessing the accuracy and reliability of the data or information provided, and that the images provided or copies thereof, are subject to error and omission, and are not guaranteed or warranted to be true, complete or correct.
The data published herein is not for commercial purposes. No person, entity or user shall sell, give or receive for the purpose of selling or offering for sale, any portion of the information or data provided herein, nor may they use the information in a manner that is in violation of any law or regulation.

bacK to toP
CLICK ON LINKS TO NAVIGATE
IndexAcknowledgements
Exclusion of claims
Foreword
Abbreviations
Explanatory notes
List of tables and graphs
Executive summary: Overview of the South African gambling sector
1 cHaPter 1: introDUction
2 cHaPter 2: caSino Sector
3 cHaPter 3: racinG anD bettinG Sector
4 cHaPter 4: limiteD PaYoUt macHine Sector
5 cHaPter 5: binGo Sector
6 cHaPter 6: conclUSion
© National Gambling Board, 2014 iii
foreword
One of the key mandates of the National Gambling Board (referred to as ’the board’) is to monitor market share and market conduct in the South African gambling industry. In doing so, the board has gathered national gambling statistics and limited information in terms of market conduct on the different legal gambling modes in South Africa over many years. National gambling statistics are published annually on the website (www.ngb.org.za). However, the board resolved that a comprehensive report on the performance of all licensed gambling modes be published.
The need arose to extensively map the gambling industry in terms of size, growth and nature and inform stakeholders and the public accordingly. The sharing of information in this report is based on those gambling modes regulated by the board i.e. casinos, limited payout machines, bingo and wagering and betting in terms of horse racing and sport.
This report is the first of its kind to map the gambling industry and provide the reader with a national overview about the size and scope of different regulated gambling modes in South Africa. This initiative further serves as a benchmark for future reports by informing the reader about gambling trends by gambling operators, number of outlets and gambling positions, as well as national gambling statistics per gambling mode.
The board would also like to extend its gratitude to Provincial Licensing Authorities for submitting information and statistics as required.
Prof linda de Vries
Chairperson: National Gambling Board
Chairperson of the National Gambling Board (NGB)Prof linda de Vries

indexcontentS
Acknowledgements iiExclusion of claims iiForeword iiiAbbreviations vExplanatory notes viList of tables and graphs viiiExecutive summary: Overview of the South African gambling sector ix
1 CHAPTER 1: INTRODUCTION 2
2 CHAPTER 2: CASINO SECTOR 42.1 Number of casinos in South Africa as on 31 March 2013 42.2 Number of licensed and operational machines/slots, tables and positions in casinos as on 31 March
20135
2.3 Amount of turnover (money wagered), GGR generated and taxes/levies collected per province in casinos in FY13
9
2.3.1 Turnover in the casino sector per province in FY13 92.3.2 Gross gambling revenue generated by the casino sector per province in FY13 102.3.3 Taxes/levies collected by PLAs from the casino sector per province in FY13 11
3 CHAPTER 3: RACING AND BETTING SECTOR 133.1 Number of licensed totalisators and bookmakers as on 31 March 2013 133.2 Amount of turnover (money wagered), GGR generated and taxes/levies collected per province in the
racing and betting sector in FY1315
3.2.1 Turnover (Rand value of money wagered) in the racing and betting sector per province in FY13 153.2.2 Gross gambling revenue generated in the racing and betting sector per province in FY13 163.2.3 Taxes/levies collected by PLAs from the racing and betting sector per province in FY13 17
4 CHAPTER 4: LIMITED PAYOUT MACHINE SECTOR 194.1 Number of licensed and operational route and site operators per province as on 31 March 2013 194.2 Amount of turnover (money wagered), GGR generated and taxes/levies collected per province in the
limited payout machine sector in FY13 22
4.2.1 Turnover (Rand value of money wagered) in the limited payout machine sector per province in FY13 224.2.2 Gross gambling revenue generated in the limited payout machine sector per province in FY13 234.2.3 Taxes/levies collected by PLAs from the limited payout machine sector per province in FY13 24
5 CHAPTER 5: BINGO SECTOR 265.1 Number of bingo operators and licensed operational bingo outlets as on 31 March 2013 265.2 Number of licensed and operational bingo positions as on 31 March 2013 275.3 Amount of TO (money wagered), GGR generated and taxes/levies collected per province in the bingo
sector in FY13 28
5.3.1 Turnover (Rand value of money wagered) in the bingo sector per province in FY13 285.3.2 Gross gambling revenue generated in the bingo sector per province in FY13 295.3.3 Taxes/levies collected by PLAs from the bingo sector per province in FY13 30
6 CHAPTER 6: CONCLUSION 32Contributors & verification of data and provincial gambling statistics 33Reference 33
Acknowledgements
Exclusion of claims
Foreword
Abbreviations
Explanatory notes
List of tables and graphs
Executive summary: Overview of the South African gambling sector
1 cHaPter 1: introDUction
2 cHaPter 2: caSino Sector
3 cHaPter 3: racinG anD bettinG Sector
4 cHaPter 4: limiteD PaYoUt macHine Sector
5 cHaPter 5: binGo Sector
6 cHaPter 6: conclUSion
Gambling Sector
Performance report
Financial Year 2012/2013bacK to toP
CLICK ON LINKS TO NAVIGATE

bacK to toP
CLICK ON LINKS TO NAVIGATE
IndexAcknowledgements
Exclusion of claims
Foreword
Abbreviations
Explanatory notes
List of tables and graphs
Executive summary: Overview of the South African gambling sector
1 cHaPter 1: introDUction
2 cHaPter 2: caSino Sector
3 cHaPter 3: racinG anD bettinG Sector
4 cHaPter 4: limiteD PaYoUt macHine Sector
5 cHaPter 5: binGo Sector
6 cHaPter 6: conclUSion
© National Gambling Board, 2014 v
contentSAcknowledgements iiExclusion of claims iiForeword iiiAbbreviations vExplanatory notes viList of tables and graphs viiiExecutive summary: Overview of the South African gambling sector ix
1 CHAPTER 1: INTRODUCTION 2
2 CHAPTER 2: CASINO SECTOR 42.1 Number of casinos in South Africa as on 31 March 2013 42.2 Number of licensed and operational machines/slots, tables and positions in casinos as on 31 March
20135
2.3 Amount of turnover (money wagered), GGR generated and taxes/levies collected per province in casinos in FY13
9
2.3.1 Turnover in the casino sector per province in FY13 92.3.2 Gross gambling revenue generated by the casino sector per province in FY13 102.3.3 Taxes/levies collected by PLAs from the casino sector per province in FY13 11
3 CHAPTER 3: RACING AND BETTING SECTOR 133.1 Number of licensed totalisators and bookmakers as on 31 March 2013 133.2 Amount of turnover (money wagered), GGR generated and taxes/levies collected per province in the
racing and betting sector in FY1315
3.2.1 Turnover (Rand value of money wagered) in the racing and betting sector per province in FY13 153.2.2 Gross gambling revenue generated in the racing and betting sector per province in FY13 163.2.3 Taxes/levies collected by PLAs from the racing and betting sector per province in FY13 17
4 CHAPTER 4: LIMITED PAYOUT MACHINE SECTOR 194.1 Number of licensed and operational route and site operators per province as on 31 March 2013 194.2 Amount of turnover (money wagered), GGR generated and taxes/levies collected per province in the
limited payout machine sector in FY13 22
4.2.1 Turnover (Rand value of money wagered) in the limited payout machine sector per province in FY13 224.2.2 Gross gambling revenue generated in the limited payout machine sector per province in FY13 234.2.3 Taxes/levies collected by PLAs from the limited payout machine sector per province in FY13 24
5 CHAPTER 5: BINGO SECTOR 265.1 Number of bingo operators and licensed operational bingo outlets as on 31 March 2013 265.2 Number of licensed and operational bingo positions as on 31 March 2013 275.3 Amount of TO (money wagered), GGR generated and taxes/levies collected per province in the bingo
sector in FY13 28
5.3.1 Turnover (Rand value of money wagered) in the bingo sector per province in FY13 285.3.2 Gross gambling revenue generated in the bingo sector per province in FY13 295.3.3 Taxes/levies collected by PLAs from the bingo sector per province in FY13 30
6 CHAPTER 6: CONCLUSION 32Contributors & verification of data and provincial gambling statistics 33Reference 33
AbbreviationsCASA Casino Association of South Africa
BBBEE Broad Based Black Economic Empowerment
CEMS Central Electronic Monitoring System
EBT Electronic Bingo Terminal
FY Financial Year
GGR Gross Gambling Revenue
LPM Limited Payout Machine
NGA National Gambling Act
NGB National Gambling Board
PLA Provincial Licensing Authority
RO Route Operator
SO Site Operator
TO Turnover

bacK to toP
CLICK ON LINKS TO NAVIGATE
IndexAcknowledgements
Exclusion of claims
Foreword
Abbreviations
Explanatory notes
List of tables and graphs
Executive summary: Overview of the South African gambling sector
1 cHaPter 1: introDUction
2 cHaPter 2: caSino Sector
3 cHaPter 3: racinG anD bettinG Sector
4 cHaPter 4: limiteD PaYoUt macHine Sector
5 cHaPter 5: binGo Sector
6 cHaPter 6: conclUSion
vi© National Gambling Board, 2014
Explanatory Notesterm eXPlanation
bingo Bingo means a game played in whole or in part by electronic means that is played using cards or other devices; that are divided into spaces each of which bears a different number, picture or symbol; and which are arranged randomly such that each card or similar device contains a unique set of numbers, pictures or symbols; in which an operator calls or displays a series of numbers, pictures or symbols in random order and the players match each such number, picture or symbol on the card or device as it is called or displayed; and the player who is first to match all the spaces on the card or device, or who matches a specified set of numbers, pictures or symbols on the card or device, wins a prize.
bookmaker A bookmaker, bookie or turf accountant is a person or organisation that takes bets on various events or contingencies such as horse racing, football, rugby union or marriages, births, names, divorces and even in extreme cases deaths etc. at agreed upon odds (fixed odds). A bookmaker may be licensed to operate on or off-course, that is at a licensed premises, other than a racecourse.
casino A casino is a facility which is licensed to house and accommodate certain types of licensed casino style slots and table gambling games.
Gambling machine/slot machine used interchangeably
A slot machine, informally known as a fruit machine, is a casino gambling machine with three or more reels which spin when a button is pushed or a handle is pulled (older mechanical types). These slot machines are also known as one-armed bandits because of the one lever on the side of the machine (the arm) and because of their ability to leave the gamer penniless (bandit). The machine pays off based on patterns of symbols visible on the front of the machine when it stops. Slot machines are the most popular gambling method in casinos and constitute about 80 percent of the average casino’s income.
Gross gambling revenue (GGr)
Gross gambling revenue is defined as the Rand value of the gross revenue of an operator in terms of turnover less winnings paid to players.
Horse racing Horse racing is the sport in which horses and their riders take part in races, typically with substantial betting on the outcome.
licenced (all modes and outlets)
Licensed is when a person or company is in possession of a valid licence, registration card or certificate allowing him/them to offer approved gambling activities within a licensed premises to over 18 year old persons.
limited payout machine (lPm)
Limited payout machine means a gambling machine outside of a casino in respect of the playing of which the stakes and prizes are limited.
route operator (ro)
Route operator is a juristic person which is licensed to own and operate limited payout machines, maintain and effect the collection of money and paying of taxes and levies in respect of all machines under its licence.
Site operator (So)
Site operator is a natural or juristic person licensed to manage limited payout machines owned by a route operator on his licensed premises (also known as a site) and to make them available to be played by members of the public.

bacK to toP
CLICK ON LINKS TO NAVIGATE
IndexAcknowledgements
Exclusion of claims
Foreword
Abbreviations
Explanatory notes
List of tables and graphs
Executive summary: Overview of the South African gambling sector
1 cHaPter 1: introDUction
2 cHaPter 2: caSino Sector
3 cHaPter 3: racinG anD bettinG Sector
4 cHaPter 4: limiteD PaYoUt macHine Sector
5 cHaPter 5: binGo Sector
6 cHaPter 6: conclUSion
© National Gambling Board, 2014 vii
term eXPlanationtable game In casinos, the term table game is used to distinguish games such as blackjack, craps, roulette and baccarat that are
played on a table and operated by one or more live dealers like a croupier or poker dealer.taxes/levies Gambling tax levied by and collected by provincial licensing authorities.totalisator/Pari-mutuel betting used interchangeably
Totalisator is the name for the automated pool betting system which runs pari-mutuel betting, calculating payoff odds, displaying them, and producing tickets based on incoming bets.
Parimutuel betting (from the French: Pari Mutuel) is a betting system in which all bets of a particular type are placed together in a pool; taxes and the “house-take” are removed, and payoff odds are calculated by sharing the net pool among all winning bets.
turnover (to) Turnover is the rand value of money wagered. This includes “recycling” which refers to amounts that are staked on more than one occasion). “TO” in the Fixed Odds/Bookmaking environment is, however, different from other forms of gambling in that the amount of money crossing the table is NOT seen as turnover, because the amount of money staked/wagered/bet on an event is returned to the player should the player win the wager/bet, so a true description of turnover in Fixed Odds/Bookmaking parlance is money wagered minus the stakes wagered on winnings bets = Fixed Odds/Bookmaking turnover.

bacK to toP
CLICK ON LINKS TO NAVIGATE
IndexAcknowledgements
Exclusion of claims
Foreword
Abbreviations
Explanatory notes
List of tables and graphs
Executive summary: Overview of the South African gambling sector
1 cHaPter 1: introDUction
2 cHaPter 2: caSino Sector
3 cHaPter 3: racinG anD bettinG Sector
4 cHaPter 4: limiteD PaYoUt macHine Sector
5 cHaPter 5: binGo Sector
6 cHaPter 6: conclUSion
viii© National Gambling Board, 2014
list of tables and Graphs table
Page
Table 1: Number of licensed slots, tables and positions per province as on 31 March 2013 5
GraPHS Graph 1: Number of operational casinos per province as on 31 March 2013 4
Graph 2: Number of operational slots per province as on 31 March 2013 6
Graph 3: Number of operational tables per province as on 31 March 2013 7
Graph 4: Number of operational positions per province as on 31 March 2013 8
Graph 5: Turnover, casinos per province, FY13 9
Graph 6: Gross gambling revenue, casinos per province, FY13 10
Graph 7: Taxes/levies, casinos per province, FY13 11
Graph 8: Number of licenced totalisator outlets per province, FY13 13
Graph 9: Number of licenced bookmakers per province, FY13 14
Graph 10: Number of licenced bookmaker outlets per province, FY13 14
Graph 11: Turnover, racing and betting, FY13 15
Graph 12: Gross gambling revenue, racing and betting per province, FY13 16
Graph 13: Taxes/levies, racing and betting per province, FY13 17
Graph 14: Number of licensed operational route operators per province as on 31 March 2013 20
Graph 15: Number of licensed site operators per province as on 31 March 2013 21
Graph 16: Number of installed LPMs per province as on 31 March 2013 21
Graph 17: Turnover, limited payout machines, FY13 22
Graph 18: Gross gambling revenue, limited payout machines per province, FY13 23
Graph 19: Taxes/levies, limited payout machines per province, FY13 24
Graph 20: Number of operational bingo outlets as on 31 March 2013 26
Graph 21: Number of operational bingo positions as on 31 March 2013 27
Graph 22: Turnover, bingo, FY13 28
Graph 23: Gross gambling revenue, bingo, FY13 29
Graph 24: Taxes/levies, bingo, FY13 30

bacK to toP
CLICK ON LINKS TO NAVIGATE
IndexAcknowledgements
Exclusion of claims
Foreword
Abbreviations
Explanatory notes
List of tables and graphs
Executive summary: Overview of the South African gambling sector
1 cHaPter 1: introDUction
2 cHaPter 2: caSino Sector
3 cHaPter 3: racinG anD bettinG Sector
4 cHaPter 4: limiteD PaYoUt macHine Sector
5 cHaPter 5: binGo Sector
6 cHaPter 6: conclUSion
© National Gambling Board, 2014 ix
executive Summary: overview of the South african Gambling SectorintroDUctionOne of the strategic outcome-orientated goals of the board is to gather information to provide a holistic overview of the South African gambling sector. The purpose of this report is to provide an overview of the South African gambling sector in terms of market conduct and national gambling statistics applicable to those gambling modes regulated by the board for the financial year 2012/2013 (exclusive of the national lottery). The market conduct information represents the status of the sector as on 31 March 2013. Breakdowns per province and gambling mode are discussed in more detail in the report. Information is submitted by all Provincial Licensing Authorities (PLAs). This report is the baseline upon which future reports will be benchmarked. The report provides actual information of the gambling sector regulated by the National Gambling Board (NGB) in terms of the National Gambling Act (NGA).
caSinoSA total number of 36 casinos (out of a maximum allowable 40 available licenses) is operational in South Africa and owned by five controlling shareholders of which three have multiple licenses. The total number of licensed operational machines (slots) in South Africa is 22 919, as well as 832 gambling tables, representing 30 831 operational gambling positions in casinos.
limiteD PaYoUt macHineS (lPms)Route operators manage 1 821 site operators in the LPM sector. The total number of installed LPMs in South Africa is 7 743 across all provinces except in Northern Cape where no LPMs are rolled out.
racinG anD bettinGTwo totalisator licenses have been issued and for economic reasons they are operating as one in the racing and betting sector by virtue of a joint agreement between the two companies licensed. This has resulted in them having 397 licensed totalisator outlets, both branches and agencies (the latter is businesses owned by independent persons who offer tote bets for a percentage of turnover from that site they operate from). The total of 225 licensed bookmakers are in operation countrywide. This is both sole trader and corporate bookmakers. Between them they own 380 fixed odds/bookmaking licensed outlets.
binGoBingo operators are operational in South Africa in Gauteng and Mpumalanga. Eleven bingo halls were operational, representing a total number of 3 338 operational bingo positions.

bacK to toP
CLICK ON LINKS TO NAVIGATE
IndexAcknowledgements
Exclusion of claims
Foreword
Abbreviations
Explanatory notes
List of tables and graphs
Executive summary: Overview of the South African gambling sector
1 cHaPter 1: introDUction
2 cHaPter 2: caSino Sector
3 cHaPter 3: racinG anD bettinG Sector
4 cHaPter 4: limiteD PaYoUt macHine Sector
5 cHaPter 5: binGo Sector
6 cHaPter 6: conclUSion
x© National Gambling Board, 2014
national GamblinG StatiSticSThe FY2012/2013 statistics continue to show an increase in GGR, as well as taxes/levies across all modes of gambling in all provinces. The GGR increased by 11.9% from R18 417 million in FY12 to R20 914 million in FY13. Taxes/levies increased by 12.6% from R1 834 in FY12 to R2 098 million in FY13.
SnaP SHot of tHe GamblinG Sector, fY13 Number of licensed operational casinos 36
Number of licensed site operators (LPM) 1 821
Number of licensed totalisators 2
Number of licensed bookmakers 225
Number of licensed bingo operators 4
Number of licensed bingo positions 5 613
Number of licensed totalisator outlets 397
Number of licensed bookmaker outlets 380
Number of operational bingo halls/outlets 11
Number of licensed operational machines (slots) (casinos) 22 919
Number of licensed operational tables (casinos) 832
Number of licensed operational positions (casinos) 30 831
Number of licensed installed LPMs 7 743
Number of licensed operational bingo positions 3 338
Total gambling turnover, all modes R283 335 448 250
Total gross gambling revenue, all modes R20 914 143 321
Total taxes/levies collected, all modes R2 097 993 970

bacK to toP
CLICK ON LINKS TO NAVIGATE
index
Chapter 1:
Introduction
Acknowledgements
Exclusion of claims
Foreword
Abbreviations
Explanatory notes
List of tables and graphs
Executive summary: Overview of the South African gambling sector
1 cHaPter 1: introDUction
2 cHaPter 2: caSino Sector
3 cHaPter 3: racinG anD bettinG Sector
4 cHaPter 4: limiteD PaYoUt macHine Sector
5 cHaPter 5: binGo Sector
6 cHaPter 6: conclUSion
bacK to toP
CLICK ON LINKS TO NAVIGATE
IndexAcknowledgements
Exclusion of claims
Foreword
Abbreviations
Explanatory notes
List of tables and graphs
Executive summary: Overview of the South African gambling sector
1 cHaPter 1: introDUction
2 cHaPter 2: caSino Sector
3 cHaPter 3: racinG anD bettinG Sector
4 cHaPter 4: limiteD PaYoUt macHine Sector
5 cHaPter 5: binGo Sector
6 cHaPter 6: conclUSion
2© National Gambling Board, 2014
chapter 1: introduction
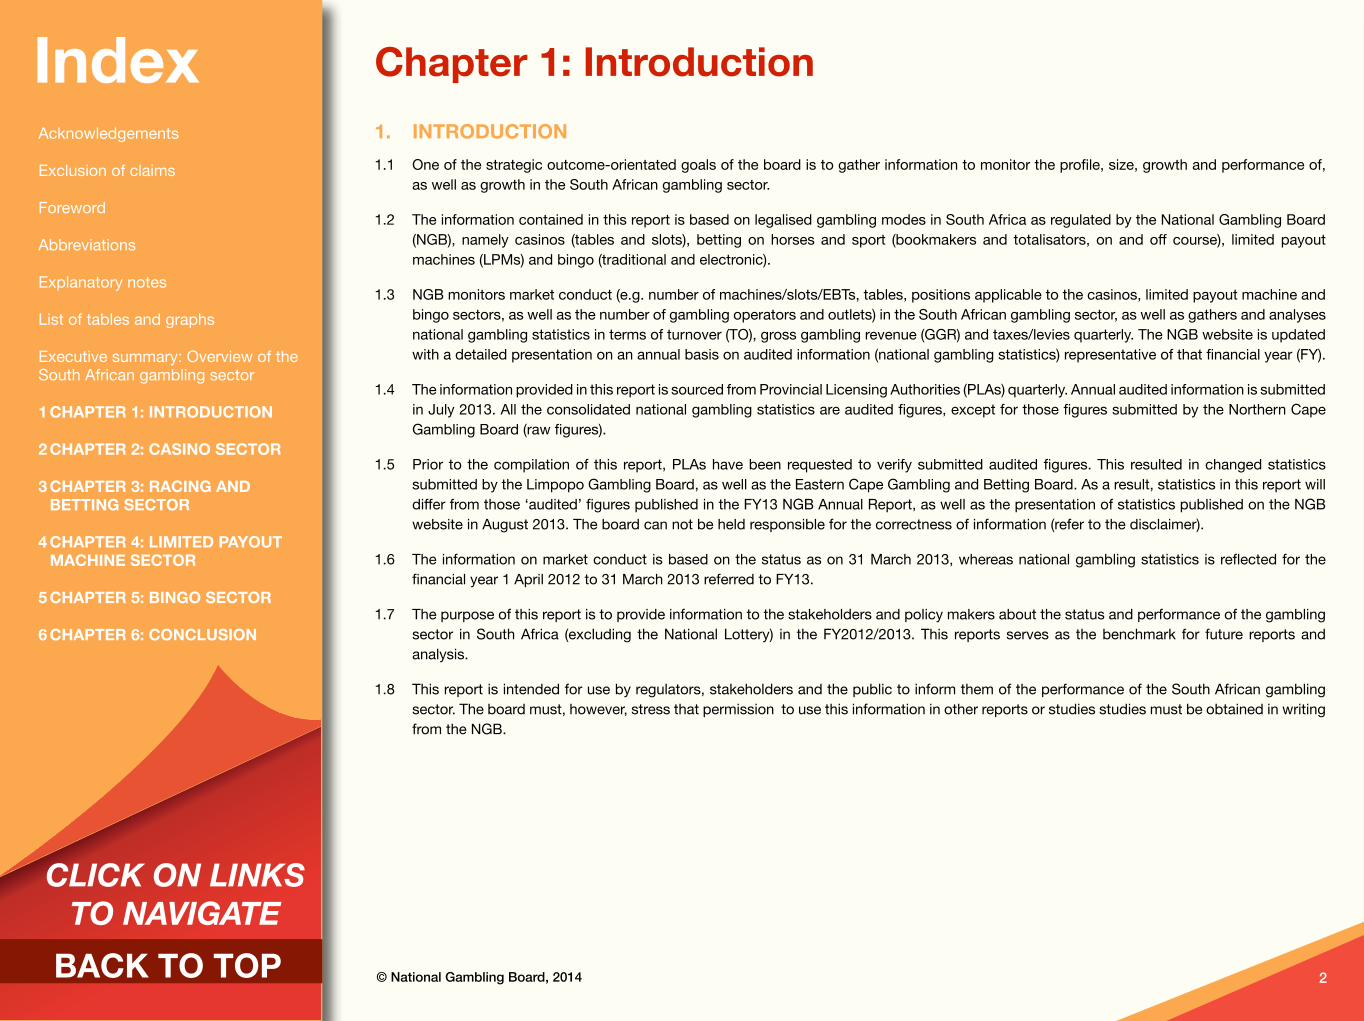
1. introDUction 1.1 One of the strategic outcome-orientated goals of the board is to gather information to monitor the profile, size, growth and performance of,
as well as growth in the South African gambling sector.
1.2 The information contained in this report is based on legalised gambling modes in South Africa as regulated by the National Gambling Board (NGB), namely casinos (tables and slots), betting on horses and sport (bookmakers and totalisators, on and off course), limited payout machines (LPMs) and bingo (traditional and electronic).
1.3 NGB monitors market conduct (e.g. number of machines/slots/EBTs, tables, positions applicable to the casinos, limited payout machine and bingo sectors, as well as the number of gambling operators and outlets) in the South African gambling sector, as well as gathers and analyses national gambling statistics in terms of turnover (TO), gross gambling revenue (GGR) and taxes/levies quarterly. The NGB website is updated with a detailed presentation on an annual basis on audited information (national gambling statistics) representative of that financial year (FY).
1.4 The information provided in this report is sourced from Provincial Licensing Authorities (PLAs) quarterly. Annual audited information is submitted in July 2013. All the consolidated national gambling statistics are audited figures, except for those figures submitted by the Northern Cape Gambling Board (raw figures).
1.5 Prior to the compilation of this report, PLAs have been requested to verify submitted audited figures. This resulted in changed statistics submitted by the Limpopo Gambling Board, as well as the Eastern Cape Gambling and Betting Board. As a result, statistics in this report will differ from those ‘audited’ figures published in the FY13 NGB Annual Report, as well as the presentation of statistics published on the NGB website in August 2013. The board can not be held responsible for the correctness of information (refer to the disclaimer).
1.6 The information on market conduct is based on the status as on 31 March 2013, whereas national gambling statistics is reflected for the financial year 1 April 2012 to 31 March 2013 referred to FY13.
1.7 The purpose of this report is to provide information to the stakeholders and policy makers about the status and performance of the gambling sector in South Africa (excluding the National Lottery) in the FY2012/2013. This reports serves as the benchmark for future reports and analysis.
1.8 This report is intended for use by regulators, stakeholders and the public to inform them of the performance of the South African gambling sector. The board must, however, stress that permission to use this information in other reports or studies studies must be obtained in writing from the NGB.

bacK to toP
CLICK ON LINKS TO NAVIGATE
Chapter 2:
Casino Sector
indexAcknowledgements
Exclusion of claims
Foreword
Abbreviations
Explanatory notes
List of tables and graphs
Executive summary: Overview of the South African gambling sector
1 cHaPter 1: introDUction
2 cHaPter 2: caSino Sector
3 cHaPter 3: racinG anD bettinG Sector
4 cHaPter 4: limiteD PaYoUt macHine Sector
5 cHaPter 5: binGo Sector
6 cHaPter 6: conclUSion

bacK to toP
CLICK ON LINKS TO NAVIGATE
IndexAcknowledgements
Exclusion of claims
Foreword
Abbreviations
Explanatory notes
List of tables and graphs
Executive summary: Overview of the South African gambling sector
1 cHaPter 1: introDUction
2 cHaPter 2: caSino Sector
3 cHaPter 3: racinG anD bettinG Sector
4 cHaPter 4: limiteD PaYoUt macHine Sector
5 cHaPter 5: binGo Sector
6 cHaPter 6: conclUSion
4© National Gambling Board, 2014
chapter 2: casino Sector 2.1 nUmber of caSinoS in SoUtH africa aS on 31 marcH 20132.1.1 A total number of 36 casinos (out of the maximum of 40 licenses provided for in the national legislation) are operational in South Africa as
on 31 March 2013. Controlling shareholders are Sun International (13 casinos), Tsogo Sun Holdings/Hosken Consolidated Investments (14 casinos), Peermont Resorts (7 casinos), London Clubs International (1 casino) and Northern Cape Casino Consultants (1 casino). All casinos are members of the Casinos Association of South Africa (CASA), except Emerald Resort and Casino and Desert Palace Casino and Resort.
2.1.2 Gauteng has the most casinos (7 = 19.4%) of the market), followed by both Western Cape and KwaZulu-Natal (each have 5 = each having 13.9%) respectively of the total casino market, as reflected below:
Graph 1: number of operational casinos per province as on 31 march 2013
number of operational casinos in South africa per province, fY13
Gauteng
Western Cape
Eastern Cape
Northern Cape
Limpopo
North West
KwaZulu-Natal
Free State
Mpumalanga
Total: 36
7
19.4%
5
13.9%
4
11.1%
2
5.6%
3
8.3%
4
11.1%
5
13.9%
4
11.1%
2
5.6%
2.1.3 These figures are stable and no operational casino was added during the reporting period.

bacK to toP
CLICK ON LINKS TO NAVIGATE
IndexAcknowledgements
Exclusion of claims
Foreword
Abbreviations
Explanatory notes
List of tables and graphs
Executive summary: Overview of the South African gambling sector
1 cHaPter 1: introDUction
2 cHaPter 2: caSino Sector
3 cHaPter 3: racinG anD bettinG Sector
4 cHaPter 4: limiteD PaYoUt macHine Sector
5 cHaPter 5: binGo Sector
6 cHaPter 6: conclUSion
© National Gambling Board, 2014 5
2.2 nUmber of licenSeD anD oPerational macHineS/SlotS, tableS anD PoSitionS in caSinoS aS on 31 marcH 2013
2.2.1 NGB monitors the number of licensed and operational gambling machines/slots, tables and gambling positions in casinos. Positions are calculated as the sum total of gambling machines and tables. Kindly note that one table game represents 14 gambling positions in Gauteng and Mpumalanga, and 6 gambling positions in the other remaining seven provinces.
2.2.2 The Gauteng province accounts for the highest number of licensed gambling machines/slots (8 679), tables (331) and gambling positions (13 313) compared to other provinces. This is followed by Western Cape for the second highest number of licensed slots (3 822) whereas KwaZulu-Natal accounts for the second highest number of licensed tables (159) and licensed positions (4 621). Refer to Table 1 below:
table 1: number of licensed slots, tables and positions per province as on 31 march 2013
nUmber of licenceD SlotS, tableS anD PoSitionS (caSinoS) aS on 31 marcH 2013
ProVincetotalfY13
QrtGambling
mode Gauteng1 Westerncape KwaZulu-natal mpumalanga limpopo north
Westnorthern
capeeastern
capefree State
4 licensed slots
8 67937.3%
3 82216.4%
3 66715.8%
1 1044.8%
5542.4%
1 7747.6%
4532.0%
2 1989.5%
1 0004.3%
23 251100%
licensed tables 331
37.1%118
13.2%159
17.8%44
5.2%24
2.7%71
8.0%17
1.9%83
9.3%44
4.9%891
100%
licensed positions 13 313
41.8%4 53014.2%
4 62114.5%
1 9896.2%
6952.2%
2 2006.9%
5551.7%
2 6968.5%
1 2644.0%
31 863100%
1 Gauteng figures for licensed slots are estimates, as no split between licensed slots and tables are available with regard to some of the casinos in Gauteng.

bacK to toP
CLICK ON LINKS TO NAVIGATE
IndexAcknowledgements
Exclusion of claims
Foreword
Abbreviations
Explanatory notes
List of tables and graphs
Executive summary: Overview of the South African gambling sector
1 cHaPter 1: introDUction
2 cHaPter 2: caSino Sector
3 cHaPter 3: racinG anD bettinG Sector
4 cHaPter 4: limiteD PaYoUt macHine Sector
5 cHaPter 5: binGo Sector
6 cHaPter 6: conclUSion
6© National Gambling Board, 2014
2.2.3 Gauteng accounts for the highest number of operational slots in casinos (37.9%), followed by Western Cape (16.4%) and KwaZulu-Natal (15.8%) as reflected in Graph 2 below:
Graph 2: number of operational slots per province as on 31 march 2013*
number of operational slots in casinos per province, fY13
Eastern Cape
Free State
Gauteng
KwaZulu-Natal
Limpopo
Mpumalanga
North West
Northern Cape
Western Cape
Total: 22 919
2 108
9.2% 883
3.9%
8 679
37.9%
3 751
16.4%
453
2.0%
1 774
7.7%1 104
4.8%550
2.4%
3 617
15.8%
*Gauteng figures for licensed slots are estimates, as no split between licensed slots and tables are available with regard to some of the casinos in Gauteng.

bacK to toP
CLICK ON LINKS TO NAVIGATE
IndexAcknowledgements
Exclusion of claims
Foreword
Abbreviations
Explanatory notes
List of tables and graphs
Executive summary: Overview of the South African gambling sector
1 cHaPter 1: introDUction
2 cHaPter 2: caSino Sector
3 cHaPter 3: racinG anD bettinG Sector
4 cHaPter 4: limiteD PaYoUt macHine Sector
5 cHaPter 5: binGo Sector
6 cHaPter 6: conclUSion
© National Gambling Board, 2014 7
2.2.4 Gauteng accounts for the highest number of operational tables (38.6%), followed by KwaZulu-Natal (17.3%) and Western Cape (13.7%) as on 31 March 2013, as reflected in Graph 3 below:
Graph 3: number of operational tables per province as on 31 march 2013*
number of operational slots in casinos per province, fY13
Eastern Cape
Free State
Gauteng
KwaZulu-Natal
Limpopo
Mpumalanga
North West
Northern Cape
Western Cape144
17.3%
23
2.8%
44
5.3%
71
8.5%
17
2.0%
114
13.7%
321
38.6%
36
4.3%
62
7.5%
Total: 832
*Gauteng figures for licensed slots are estimates, as no split between licensed slots and tables are available with regard to some of the casinos in Gauteng.
bacK to toP
CLICK ON LINKS TO NAVIGATE
IndexAcknowledgements
Exclusion of claims
Foreword
Abbreviations
Explanatory notes
List of tables and graphs
Executive summary: Overview of the South African gambling sector
1 cHaPter 1: introDUction
2 cHaPter 2: caSino Sector
3 cHaPter 3: racinG anD bettinG Sector
4 cHaPter 4: limiteD PaYoUt macHine Sector
5 cHaPter 5: binGo Sector
6 cHaPter 6: conclUSion
8© National Gambling Board, 2014
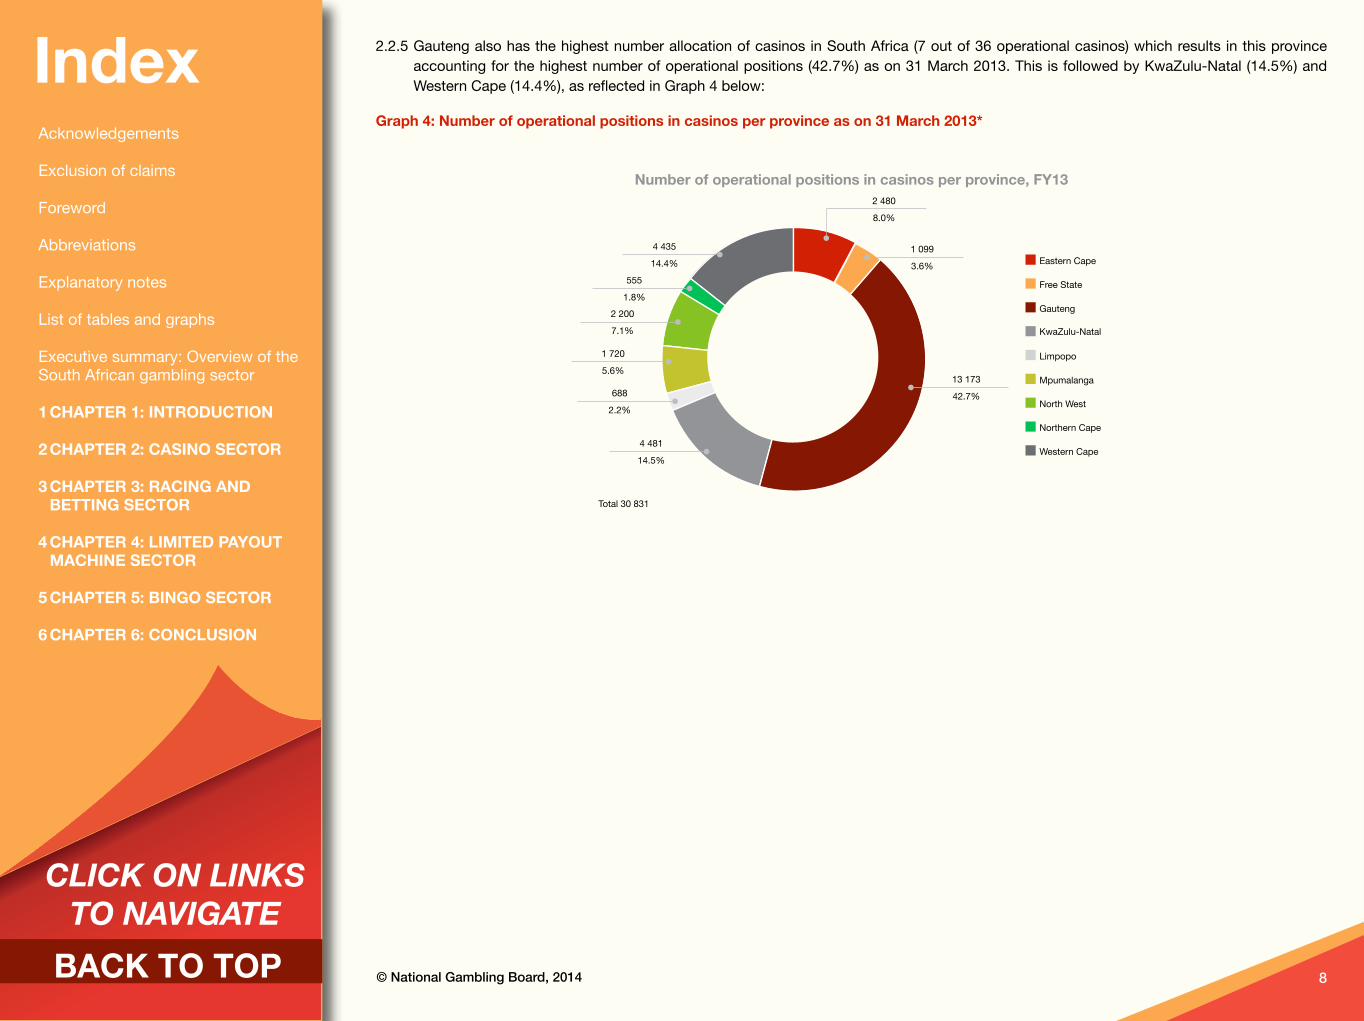
2.2.5 Gauteng also has the highest number allocation of casinos in South Africa (7 out of 36 operational casinos) which results in this province accounting for the highest number of operational positions (42.7%) as on 31 March 2013. This is followed by KwaZulu-Natal (14.5%) and Western Cape (14.4%), as reflected in Graph 4 below:
Graph 4: number of operational positions in casinos per province as on 31 march 2013*
number of operational positions in casinos per province, fY13
Eastern Cape
Free State
Gauteng
KwaZulu-Natal
Limpopo
Mpumalanga
North West
Northern Cape
Western Cape
13 173
42.7%
1 099
3.6%
2 480
8.0%
4 435
14.4%
555
1.8%2 200
7.1%
1 720
5.6%
688
2.2%
4 481
14.5%
Total 30 831

bacK to toP
CLICK ON LINKS TO NAVIGATE
IndexAcknowledgements
Exclusion of claims
Foreword
Abbreviations
Explanatory notes
List of tables and graphs
Executive summary: Overview of the South African gambling sector
1 cHaPter 1: introDUction
2 cHaPter 2: caSino Sector
3 cHaPter 3: racinG anD bettinG Sector
4 cHaPter 4: limiteD PaYoUt macHine Sector
5 cHaPter 5: binGo Sector
6 cHaPter 6: conclUSion
© National Gambling Board, 2014 9
2.3 amoUnt of tUrnoVer (moneY WaGereD), GGr GenerateD anD taXeS/leVieS collecteD Per ProVince in caSinoS in fY13
2.3.1 turnover in the casino sector per province
i The total Rand value of money wagered in casinos during FY13 is R241 575 712 843. This amount represents 85.3% out of all turnover (money wagered) representing all gambling modes and when compared to money wagered at licensed racing and betting, LPM and bingo outlets.
ii Gauteng has the highest number of casinos compared to other provinces resulting in the highest amount of money wagered at these gambling venues (42.4%). This is followed by money wagered in KwaZulu-Natal casinos (19.9%) and Western Cape (16.5%) as reflected in Graph 5 below:
Graph 5: turnover, casinos per province, fY13
turnover: casinos, per province, fY13
Eastern Cape
Free State
Gauteng
KwaZulu-Natal
Limpopo
Mpumalanga
North West
Northern Cape
Western Cape
Total: R241 575 712 843
R102 465 934 400
42.4%
R7 756 524 361
3.2%
R48 160 819 356
19.9%
R11 337 129 248
4.7%
R2 588 974 938
1.1%
R39 864 444 863
16.5%
R2 904 562 626
1.2%
R7 619 306 701
3.2%
R18 878 016 349
7.8%
bacK to toP
CLICK ON LINKS TO NAVIGATE
IndexAcknowledgements
Exclusion of claims
Foreword
Abbreviations
Explanatory notes
List of tables and graphs
Executive summary: Overview of the South African gambling sector
1 cHaPter 1: introDUction
2 cHaPter 2: caSino Sector
3 cHaPter 3: racinG anD bettinG Sector
4 cHaPter 4: limiteD PaYoUt macHine Sector
5 cHaPter 5: binGo Sector
6 cHaPter 6: conclUSion
10© National Gambling Board, 2014
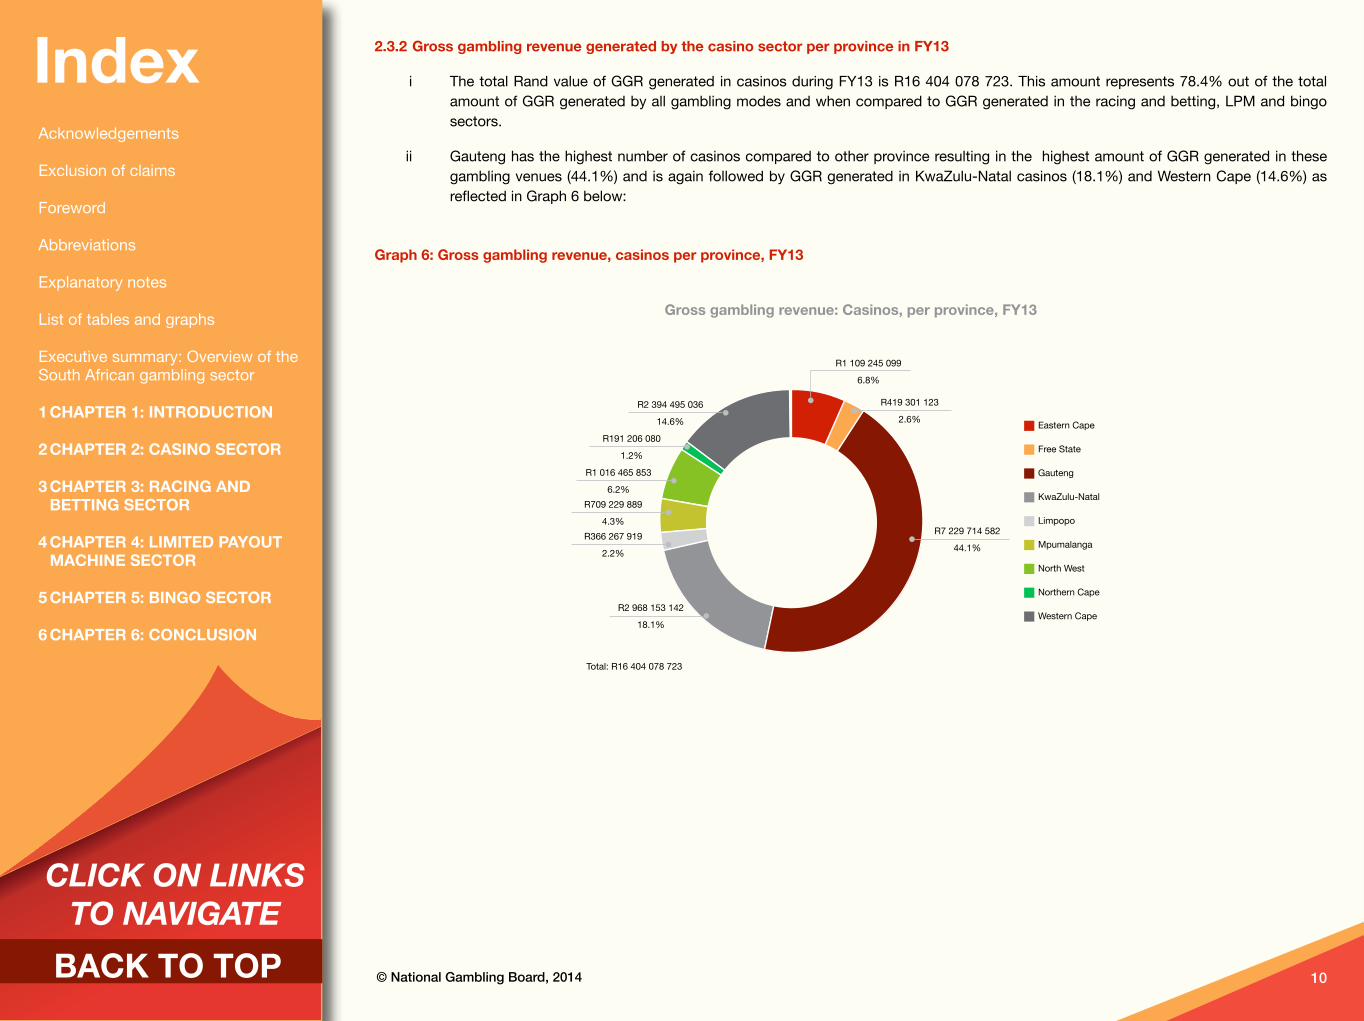
2.3.2 Gross gambling revenue generated by the casino sector per province in fY13
i The total Rand value of GGR generated in casinos during FY13 is R16 404 078 723. This amount represents 78.4% out of the total amount of GGR generated by all gambling modes and when compared to GGR generated in the racing and betting, LPM and bingo sectors.
ii Gauteng has the highest number of casinos compared to other province resulting in the highest amount of GGR generated in these gambling venues (44.1%) and is again followed by GGR generated in KwaZulu-Natal casinos (18.1%) and Western Cape (14.6%) as reflected in Graph 6 below:
Graph 6: Gross gambling revenue, casinos per province, fY13
Gross gambling revenue: casinos, per province, fY13
Eastern Cape
Free State
Gauteng
KwaZulu-Natal
Limpopo
Mpumalanga
North West
Northern Cape
Western Cape
Total: R16 404 078 723
R7 229 714 582
44.1%
R419 301 123
2.6%
R1 109 245 099
6.8%
R2 968 153 142
18.1%
R366 267 919
2.2%
R709 229 889
4.3%
R1 016 465 853
6.2%
R191 206 080
1.2%
R2 394 495 036
14.6%

bacK to toP
CLICK ON LINKS TO NAVIGATE
IndexAcknowledgements
Exclusion of claims
Foreword
Abbreviations
Explanatory notes
List of tables and graphs
Executive summary: Overview of the South African gambling sector
1 cHaPter 1: introDUction
2 cHaPter 2: caSino Sector
3 cHaPter 3: racinG anD bettinG Sector
4 cHaPter 4: limiteD PaYoUt macHine Sector
5 cHaPter 5: binGo Sector
6 cHaPter 6: conclUSion
© National Gambling Board, 2014 11
2.3.3 taxes/levies collected by Plas from the casino sector per province in fY13
i The total Rand value of taxes/levies collected by PLAs from the casino sector during FY13 is R1 578 594 016. This amount represents 75.2% out of the total amount of taxes/levies collected from all gambling modes (inclusive of racing and betting, LPMs and bingo).
ii Gauteng has the highest number of casinos compared to other provinces resulting in the highest amount of taxes/levies collected from these gambling venues (41.3%) and is followed by GGR generated by the casino sector in KwaZulu-Natal (21.5%) and Western Cape (18.7%) as reflected in Graph 7 below:
Graph 7: taxes/levies, casinos per province, fY13
taxes/levies: casinos, per province, fY13
Eastern Cape
Free State
Gauteng
KwaZulu-Natal
Limpopo
Mpumalanga
North West
Northern Cape
Western Cape
Total: R1 578 594 016
R651 377 066
41.3%
R29 514 335
1.9%
R89 043 782
5.6%R295 486 202
18.7%
R15 239 849
1.0%R80 324 569
5.1%
R29 301 434
1.9%
R49 683 426
3.1%
R338 623 353
21.5%

bacK to toP
CLICK ON LINKS TO NAVIGATE
Chapter 3: Racing and
Betting Sector
indexAcknowledgements
Exclusion of claims
Foreword
Abbreviations
Explanatory notes
List of tables and graphs
Executive summary: Overview of the South African gambling sector
1 cHaPter 1: introDUction
2 cHaPter 2: caSino Sector
3 cHaPter 3: racinG anD bettinG Sector
4 cHaPter 4: limiteD PaYoUt macHine Sector
5 cHaPter 5: binGo Sector
6 cHaPter 6: conclUSion

bacK to toP
CLICK ON LINKS TO NAVIGATE
IndexAcknowledgements
Exclusion of claims
Foreword
Abbreviations
Explanatory notes
List of tables and graphs
Executive summary: Overview of the South African gambling sector
1 cHaPter 1: introDUction
2 cHaPter 2: caSino Sector
3 cHaPter 3: racinG anD bettinG Sector
4 cHaPter 4: limiteD PaYoUt macHine Sector
5 cHaPter 5: binGo Sector
6 cHaPter 6: conclUSion
© National Gambling Board, 2014 13
chapter 3: racing and betting Sector 3.1 nUmber of licenSeD totaliSatorS anD booKmaKerS aS on 31 marcH 20133.1.1 The racing and betting sector comprises of two totalisator operators namely: Phumelela and Gold Circle. Phumelela is currently managing
the Western Cape operations on behalf of the Kenilworth Racing Trust. In essence, Phumelela has now expanded its operations to the Western Cape and has presence in 8 provinces with exception of KwaZulu-Natal. Telebet call centres are located in Gauteng and Eastern Cape. Licensed bookmakers are spread in all provinces throughout the Republic and there are currently 225 licensed to operate, with 380 venues. Bets can be placed on horse racing and sport (on and off course), as well as on any other legal contingency.
3.1.2 Two totalisators are licensed in South Africa namely Gold Circle (operating in Western Cape and KwaZulu-Natal), whereas Phumelela is operating in the rest of the provinces (Gauteng, Mpumalanga, Limpopo, North West, Northern Cape, Eastern Cape and Free State). The infrastructure in terms of the number of bookmakers and totalisators, as well as outlets for FY13, is reflected below.
3.1.3 Gauteng accounts for the highest number of licensed bookmakers (42.2%), followed by KwaZulu-Natal (29.3%) and Western Cape (13.8%). The highest number of licenced bookmaker outlets is established in Western Cape (30.3%), followed by Gauteng (25.0%) and KwaZulu-Natal (21.6%).
3.1.4 The number of licensed totalisator outlets, licensed bookmakers and outlets is reflected in Graphs 8 to 10 below:
Graph 8: number of licenced totalisator outlets per province, fY13
number of licensed totalisator outlets per province, fY13
Eastern Cape
Free State
Gauteng
KwaZulu-Natal
Limpopo
Mpumalanga
North West
Northern Cape
Western Cape
Total: 397
126
31.7%
14
3.5%
126
31.7%
18
4.5%
16
4.0%
15
3.8%
56
14.1%2
0.5%
24
6.1%

bacK to toP
CLICK ON LINKS TO NAVIGATE
IndexAcknowledgements
Exclusion of claims
Foreword
Abbreviations
Explanatory notes
List of tables and graphs
Executive summary: Overview of the South African gambling sector
1 cHaPter 1: introDUction
2 cHaPter 2: caSino Sector
3 cHaPter 3: racinG anD bettinG Sector
4 cHaPter 4: limiteD PaYoUt macHine Sector
5 cHaPter 5: binGo Sector
6 cHaPter 6: conclUSion
14© National Gambling Board, 2014
Graph 9: number of licenced bookmakers per province, fY13
number of licensed bookmakers per province, fY13
Eastern Cape
Free State
Gauteng
KwaZulu-Natal
Limpopo
Mpumalanga
North West
Northern Cape
Western Cape
Total: 225
8
3.6%7
3.1%
95
42.2%
66
29.3%
31
13.8%
4
1.8%
11
4.9%
2
0.9%
1
0.4%
Graph 10: number of licenced bookmaker outlets per province, fY13
number of licensed bookmaker outlets per province, fY13
Total: 380
Eastern Cape
Free State
Gauteng
KwaZulu-Natal
Limpopo
Mpumalanga
North West
Northern Cape
Western Cape
95
25.0%
82
21.6%
5
1.3%
25
6.6%
36
9.5%
3
0.8%
115
30.3%
18
4.7%
1
0.3%

bacK to toP
CLICK ON LINKS TO NAVIGATE
IndexAcknowledgements
Exclusion of claims
Foreword
Abbreviations
Explanatory notes
List of tables and graphs
Executive summary: Overview of the South African gambling sector
1 cHaPter 1: introDUction
2 cHaPter 2: caSino Sector
3 cHaPter 3: racinG anD bettinG Sector
4 cHaPter 4: limiteD PaYoUt macHine Sector
5 cHaPter 5: binGo Sector
6 cHaPter 6: conclUSion
© National Gambling Board, 2014 15
3.2 amoUnt of tUrnoVer (moneY WaGereD), GGr GenerateD anD taXeS/leVieS collecteD Per ProVince in tHe racinG anD bettinG Sector in fY13
3.2.1 turnover (rand value of money wagered minus money staked on winnings bets struck which are returned = to in the fixed odds/bookmaking environment) in the racing and betting sector per province in fY13
i The total Rand value of money wagered in the racing and betting sector during FY13 is R20 185 805 930. This amount represented 7.1% out of all turnover (money wagered) representing all gambling modes and when compared to money wagered at licensed casinos, LPM and bingo outlets.
ii Gauteng has the highest number of licensed bookmakers compared to other provinces resulting in the highest amount of money wagered at these gambling venues (58.1%). Gauteng and KwaZulu-Natal have the highest number of totalisator outlets (31.7% each), whereas Western Cape accounts for the highest number of bookmaker outlets (30.3%)
iii This is followed by money wagered in the KwaZulu-Natal racing and betting sector (18.7%) and Western Cape (15.5%) as reflected in Graph 11 below:
Graph 11: turnover, racing and betting, fY13
turnover: racing and betting, per province, fY13
Eastern Cape
Free State
Gauteng
KwaZulu-Natal
Limpopo
Mpumalanga
North West
Northern Cape
Western Cape
Total: R20 185 805 930
R11 721 808 894
58.1%
R409 682 056
2.0%
R3 781 977 056
18.7%
R340 358 590
1.7%
R233 893 828
1.2%
R247 723 741
1.2%
R34 746 310
0.2%
R3 123 768 202
15.5%
R291 847 253
1.4%
R34 746 310
0.2%

bacK to toP
CLICK ON LINKS TO NAVIGATE
IndexAcknowledgements
Exclusion of claims
Foreword
Abbreviations
Explanatory notes
List of tables and graphs
Executive summary: Overview of the South African gambling sector
1 cHaPter 1: introDUction
2 cHaPter 2: caSino Sector
3 cHaPter 3: racinG anD bettinG Sector
4 cHaPter 4: limiteD PaYoUt macHine Sector
5 cHaPter 5: binGo Sector
6 cHaPter 6: conclUSion
16© National Gambling Board, 2014
3.2.2 Gross gambling revenue generated in the racing and betting sector per province in fY13
i The total Rand value of GGR generated in the racing and betting sector during FY13 is R2 596 845 092. This amount represented 12.4% out of the total amount of GGR compared to the other legalised gambling sectors (casino, LPMs and bingo sectors).
ii Gauteng has the highest number of licensed bookmakers compared to other provinces resulting in the highest amount of GGR generated in these gambling venues (44.9%).
iii This is followed by GGR generated in the KwaZulu-Natal racing and betting sector (24.7%) and Western Cape (11.9%) as reflected in Graph 12 below:
Graph 12: Gross gambling revenue, racing and betting per province, fY13
Gross gambling revenue, racing and betting per province, fY13
Eastern Cape
Free State
Gauteng
KwaZulu-Natal
Limpopo
Mpumalanga
North West
Northern Cape
Western Cape
Total: R2 596 845 092
R71 161 429
2.7%
R20 255 075
0.8%
R309 184 773
11.9%
R60 521 191
2.3%
R98 220 124
3.8%
R642 035 780
24.7%
R1 166 628 941
44.9%
R78 086 977
3.0%
R150 750 801
5.8%

bacK to toP
CLICK ON LINKS TO NAVIGATE
IndexAcknowledgements
Exclusion of claims
Foreword
Abbreviations
Explanatory notes
List of tables and graphs
Executive summary: Overview of the South African gambling sector
1 cHaPter 1: introDUction
2 cHaPter 2: caSino Sector
3 cHaPter 3: racinG anD bettinG Sector
4 cHaPter 4: limiteD PaYoUt macHine Sector
5 cHaPter 5: binGo Sector
6 cHaPter 6: conclUSion
© National Gambling Board, 2014 17
3.2.3 taxes/levies collected by Plas from the racing and betting sector per province in fY13
i The total Rand value of taxes/levies collected by PLAs from the racing and betting sector during FY13 is R293 598 897. This amount represented 14.0% out of the total amount of taxes/levies collected from all gambling modes (inclusive of casinos, LPMs and bingo).
ii Despite the fact that Gauteng has the highest number of licensed bookmakers compared to other provinces, the highest amounts of taxes/levies are collected from Gauteng and KwaZulu-Natal (35.5% and 35.4% respectively). This is followed by a smaller amount of taxes/levies collected from the racing and betting sector in Western Cape (17.6%) as reflected in Graph 13 below:
Graph 13: taxes/levies, racing and betting per province, fY13
taxies/levies, racing and betting per province, fY13
Eastern Cape
Free State
Gauteng
KwaZulu-Natal
Limpopo
Mpumalanga
North West
Northern Cape
Western Cape
Total: R293 598 897
R104 182 807
35.5%
R8 235 035
2.8
R103 988 176
35.4%
R4 563 775
1.6%
R51 627 387
17.6%R881 438
0.3%
R6 384 308
2.2%
R6 684 547
2.3%
R7 051 423
2.4%
18bacK to toP
CLICK ON LINKS TO NAVIGATE
Chapter 4: Limited Payout
Machine Sector
indexAcknowledgements
Exclusion of claims
Foreword
Abbreviations
Explanatory notes
List of tables and graphs
Executive summary: Overview of the South African gambling sector
1 cHaPter 1: introDUction
2 cHaPter 2: caSino Sector
3 cHaPter 3: racinG anD bettinG Sector
4 cHaPter 4: limiteD PaYoUt macHine Sector
5 cHaPter 5: binGo Sector
6 cHaPter 6: conclUSion

bacK to toP
CLICK ON LINKS TO NAVIGATE
IndexAcknowledgements
Exclusion of claims
Foreword
Abbreviations
Explanatory notes
List of tables and graphs
Executive summary: Overview of the South African gambling sector
1 cHaPter 1: introDUction
2 cHaPter 2: caSino Sector
3 cHaPter 3: racinG anD bettinG Sector
4 cHaPter 4: limiteD PaYoUt macHine Sector
5 cHaPter 5: binGo Sector
6 cHaPter 6: conclUSion
© National Gambling Board, 2014 19
chapter 4: limited Payout machine Sector 4.1 nUmber of licenSeD anD oPerational roUte anD Site oPeratorS Per ProVince on
31 marcH 20134.1.1 There are three main categories of role players in the LPM sector namely route operators, site operators and the Central Electronic Monitoring
System (CEMS). Route operators are companies that are licensed to own, manage and operate LPMs and spread across the country (except Northern Cape). Site operators are privately-owned hotels, pubs or eating establishments, totalisator or bookmaker outlets spread across the country. CEMS is a centralised LPM monitoring and evaluation system operated on a long-term contract basis by Zonke Monitoring Systems, located in Johannesburg.
4.1.2 The following route operators are operational in provinces as listed below:
i Vukani Gaming: All provinces except Northern Cape
ii Pioneer: Eastern Cape
iii Grand Gaming: Gauteng and Western Cape
iv Gold Rush: Gauteng, Limpopo and North West
v Crazy Slots: Gauteng
vi Hot Slots: Gauteng
vii Kingdom Slots: KwaZulu-Natal
viii Luck@it: KwaZulu-Natal
ix Zimele: Mpumalanga
x Bathusi Investment: North West

bacK to toP
CLICK ON LINKS TO NAVIGATE
IndexAcknowledgements
Exclusion of claims
Foreword
Abbreviations
Explanatory notes
List of tables and graphs
Executive summary: Overview of the South African gambling sector
1 cHaPter 1: introDUction
2 cHaPter 2: caSino Sector
3 cHaPter 3: racinG anD bettinG Sector
4 cHaPter 4: limiteD PaYoUt macHine Sector
5 cHaPter 5: binGo Sector
6 cHaPter 6: conclUSion
20© National Gambling Board, 2014
4.1.3 The number of route operators reflected per province below includes route operators operating in more than one province. They are then counted in each province licensed. Gauteng has the biggest number of operational LPM route operators (23.8%), followed by KwaZulu-Natal (19.1%) and Mpumalanga (9.5%) as reflected in Graph 14 below:
Graph 14: number of licensed operational route operators per province as on 31 march 2013
number of operational route operators per province, fY13
Gauteng
Western Cape
KwaZulu-Natal
Mpumalanga
Limpopo
North West
Northern Cape
Eastern Cape
Free State
2
9.5%
4
19.1%
5
23.8%
2
9.5%
1
4.8%
0
3
14.3%
2
9.5%
2
9.5%

bacK to toP
CLICK ON LINKS TO NAVIGATE
IndexAcknowledgements
Exclusion of claims
Foreword
Abbreviations
Explanatory notes
List of tables and graphs
Executive summary: Overview of the South African gambling sector
1 cHaPter 1: introDUction
2 cHaPter 2: caSino Sector
3 cHaPter 3: racinG anD bettinG Sector
4 cHaPter 4: limiteD PaYoUt macHine Sector
5 cHaPter 5: binGo Sector
6 cHaPter 6: conclUSion
© National Gambling Board, 2014 21
4.1.4 The total number of 7 743 licensed LPMs is installed countrywide as on 31 March 2013. KwaZulu-Natal accounts for the highest number of licensed site operators (28.8%) and installed LPMs (28.1%), followed by Western Cape and Gauteng as reflected in Graphs 15 and 16 below:
Graph 15: number of licensed site operators per province as on 31 march 2013
number of licensed site operators per province, fY13
Eastern Cape
Free State
Gauteng
KwaZulu-Natal
Limpopo
Mpumalanga
North West
Northern Cape
Western Cape
Total: 1 821
161
8.8%58
3.2%
318
17.5%
524
28.8%157
8.6%
141
7.7%
100
5.5%
0
362
19.9%
Graph 16: number of installed lPms per province as on 31 march 2013
number of installed lPms per province, fY13
Eastern Cape
Free State
Gauteng
KwaZulu-Natal
Limpopo
Mpumalanga
North West
Northern Cape
Western Cape
Total: 7 743
1 296
16.7%
2 176
28.1%
204
2.6%
1 048
13.5%
0
1 630
21.1%
70
0.9%
590
7.6%
729
9.4%

bacK to toP
CLICK ON LINKS TO NAVIGATE
IndexAcknowledgements
Exclusion of claims
Foreword
Abbreviations
Explanatory notes
List of tables and graphs
Executive summary: Overview of the South African gambling sector
1 cHaPter 1: introDUction
2 cHaPter 2: caSino Sector
3 cHaPter 3: racinG anD bettinG Sector
4 cHaPter 4: limiteD PaYoUt macHine Sector
5 cHaPter 5: binGo Sector
6 cHaPter 6: conclUSion
22© National Gambling Board, 2014
4.2 amoUnt of tUrnoVer (moneY WaGereD), GGr GenerateD anD taXeS/leVieS collecteD Per ProVince in tHe limiteD PaYoUt macHine Sector in fY13
4.2.1 turnover (rand value of money wagered) in the limited payout machine sector per province in fY13
i The total Rand value of money wagered in the limited payout machine sector during FY13 is R16 070 420 969. This amount represents 5.7% out of all turnover (money wagered) representing all gambling modes and when compared to money wagered at licensed casinos, racing & betting and bingo outlets.
ii Although KwaZulu-Natal has the highest number of licensed site operators, licensed and installed limited payout machines (compared to other provinces), this province does not account for the highest amount of turnover or money wagered in the LPM sector.
iii Western Cape accounts for the highest amount of money wagered at limited payout machine outlets (34.4%). This is followed by money wagered at limited payout machine outlets in KwaZulu-Natal (23.4%) and Gauteng (16.2%) as reflected in Graph 17 below:
Graph 17: turnover, limited payout machines per province, fY13
turnover, limited payout machines per province, fY13
Eastern Cape
Free State
Gauteng
KwaZulu-Natal
Limpopo
Mpumalanga
North West
Northern Cape
Western Cape
Total: R16 070 420 969
R181 701 679
1.1%
R1 698 491 186
10.6%
R2 596 165 610
16.2%
R3 766 107 310
23.4%
R5 523 940 269
34.4%
R146 377 056
0.9%R973 348 177
6.1%
R1 184 289 683
7.4%
bacK to toP
CLICK ON LINKS TO NAVIGATE
IndexAcknowledgements
Exclusion of claims
Foreword
Abbreviations
Explanatory notes
List of tables and graphs
Executive summary: Overview of the South African gambling sector
1 cHaPter 1: introDUction
2 cHaPter 2: caSino Sector
3 cHaPter 3: racinG anD bettinG Sector
4 cHaPter 4: limiteD PaYoUt macHine Sector
5 cHaPter 5: binGo Sector
6 cHaPter 6: conclUSion
© National Gambling Board, 2014 23
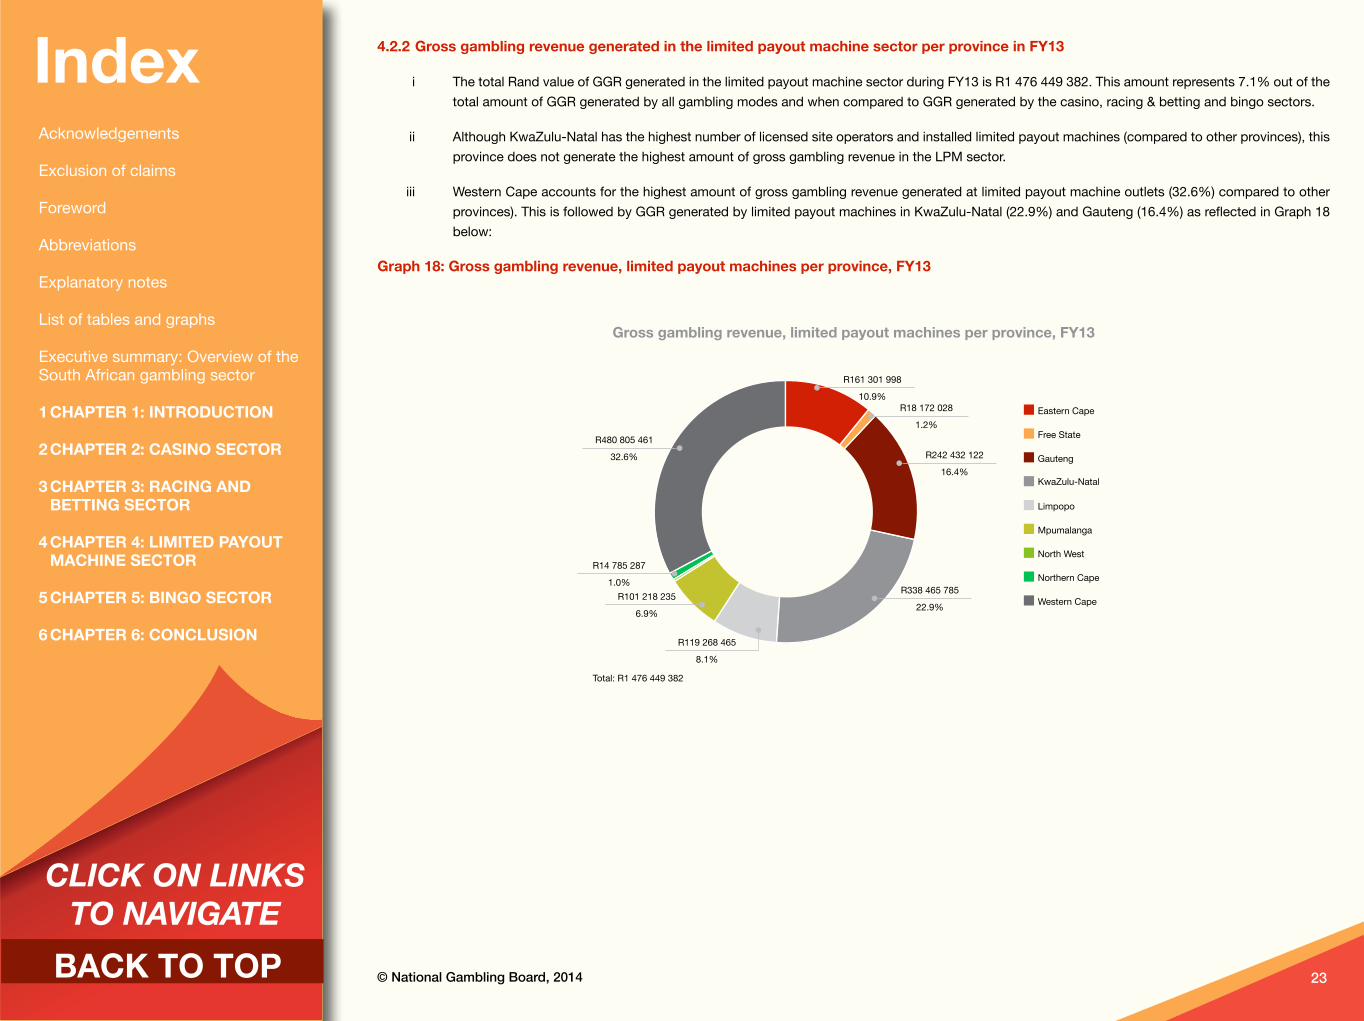
4.2.2 Gross gambling revenue generated in the limited payout machine sector per province in fY13
i The total Rand value of GGR generated in the limited payout machine sector during FY13 is R1 476 449 382. This amount represents 7.1% out of the total amount of GGR generated by all gambling modes and when compared to GGR generated by the casino, racing & betting and bingo sectors.
ii Although KwaZulu-Natal has the highest number of licensed site operators and installed limited payout machines (compared to other provinces), this province does not generate the highest amount of gross gambling revenue in the LPM sector.
iii Western Cape accounts for the highest amount of gross gambling revenue generated at limited payout machine outlets (32.6%) compared to other provinces). This is followed by GGR generated by limited payout machines in KwaZulu-Natal (22.9%) and Gauteng (16.4%) as reflected in Graph 18 below:
Graph 18: Gross gambling revenue, limited payout machines per province, fY13
Gross gambling revenue, limited payout machines per province, fY13
Total: R1 476 449 382
R18 172 028
1.2%
R242 432 122
16.4%
R338 465 785
22.9%
R161 301 998
10.9%
R480 805 461
32.6%
R14 785 287
1.0%R101 218 235
6.9%
R119 268 465
8.1%
Eastern Cape
Free State
Gauteng
KwaZulu-Natal
Limpopo
Mpumalanga
North West
Northern Cape
Western Cape

bacK to toP
CLICK ON LINKS TO NAVIGATE
IndexAcknowledgements
Exclusion of claims
Foreword
Abbreviations
Explanatory notes
List of tables and graphs
Executive summary: Overview of the South African gambling sector
1 cHaPter 1: introDUction
2 cHaPter 2: caSino Sector
3 cHaPter 3: racinG anD bettinG Sector
4 cHaPter 4: limiteD PaYoUt macHine Sector
5 cHaPter 5: binGo Sector
6 cHaPter 6: conclUSion
24© National Gambling Board, 2014
4.2.3 taxes/levies collected by Plas from the limited payout machine sector per province in fY13
i The total Rand value of taxes/levies collected by PLAs from the limited payout machine sector during FY13 is R180 968 947. This amount represents 8.6% out of the total amount of taxes/levies collected by PLAs from all gambling industries inclusive of the casino, racing & betting and bingo sectors.
ii Although KwaZulu-Natal has the highest number of licensed site operators and operational limited payout machines (compared to other provinces), the highest amount of taxes/levies is not collected from this province.
iii Western Cape accounts for the highest amount of taxes/levies collected by all PLAs from the limited payout machine sector (30.3%). This is followed by taxes/levies collected from the limited payout machine sector in KwaZulu-Natal (28.1%) and Gauteng (20.1%) as reflected in Graph 19 below:
Graph 19: taxes/levies, limited payout machines per province, fY13
taxes/levies, limited payout machines per province, fY13
Eastern Cape
Free State
Gauteng
KwaZulu-Natal
Limpopo
Mpumalanga
North West
Northern Cape
Western Cape
Total: R180 968 947
R2 180 643
1.2%
R16 130 200
8.9%
R36 439 667
20.1%
R50 769 868
28.1%
R54 898 153
30.3%
0
R887 115
0.5%
R101 121 824
5.6%R9 541 477
5.3%

bacK to toP
CLICK ON LINKS TO NAVIGATE
IndexAcknowledgements
Exclusion of claims
Foreword
Abbreviations
Explanatory notes
List of tables and graphs
Executive summary: Overview of the South African gambling sector
1 cHaPter 1: introDUction
2 cHaPter 2: caSino Sector
3 cHaPter 3: racinG anD bettinG Sector
4 cHaPter 4: limiteD PaYoUt macHine Sector
5 cHaPter 5: binGo Sector
6 cHaPter 6: conclUSion
© National Gambling Board, 2014bacK to toP
CLICK ON LINKS TO NAVIGATE
Chapter 5: Bingo Sector
indexAcknowledgements
Exclusion of claims
Foreword
Abbreviations
Explanatory notes
List of tables and graphs
Executive summary: Overview of the South African gambling sector
1 cHaPter 1: introDUction
2 cHaPter 2: caSino Sector
3 cHaPter 3: racinG anD bettinG Sector
4 cHaPter 4: limiteD PaYoUt macHine Sector
5 cHaPter 5: binGo Sector
6 cHaPter 6: conclUSion

bacK to toP
CLICK ON LINKS TO NAVIGATE
IndexAcknowledgements
Exclusion of claims
Foreword
Abbreviations
Explanatory notes
List of tables and graphs
Executive summary: Overview of the South African gambling sector
1 cHaPter 1: introDUction
2 cHaPter 2: caSino Sector
3 cHaPter 3: racinG anD bettinG Sector
4 cHaPter 4: limiteD PaYoUt macHine Sector
5 cHaPter 5: binGo Sector
6 cHaPter 6: conclUSion
26© National Gambling Board, 2014
chapter 5: bingo Sector 5.1 nUmber of binGo oPeratorS anD licenSeD oPerational binGo oUtletS aS on 31
marcH 2013 5.1.1 Of the nine provinces in South Africa, bingo is rolled out in Gauteng and Mpumalanga only as on 31 March 2013. KwaZulu-Natal and North
West provinces have accepted bingo license applications, but the outcome is yet to be announced. The Eastern Cape Gambling and Betting Board awarded six licences to operate bingo halls in various towns in the Eastern Cape, however, none of these venues was operational as on 31 March 2013.
5.1.2 Bingo operators operational in South Africa are Galaxy Bingo, Viva Bingo and Silk Gaming and Leisure in Gauteng, and Viva Bingo in Mpumalanga (since quarter 3). Overall eleven out of thirteen licensed bingo outlets are operational (10 out of eleven outlets in Gauteng and one out of two in Mpumalanga) as on 31 March 2013.
Graph 20: number of operational bingo outlets on 31 march 2013
number of operational bingo outlets per province, fY13
Gauteng
Mpumalanga
Total: 11
1
9.1%
10
90.9%

bacK to toP
CLICK ON LINKS TO NAVIGATE
IndexAcknowledgements
Exclusion of claims
Foreword
Abbreviations
Explanatory notes
List of tables and graphs
Executive summary: Overview of the South African gambling sector
1 cHaPter 1: introDUction
2 cHaPter 2: caSino Sector
3 cHaPter 3: racinG anD bettinG Sector
4 cHaPter 4: limiteD PaYoUt macHine Sector
5 cHaPter 5: binGo Sector
6 cHaPter 6: conclUSion
© National Gambling Board, 2014 27
5.2 nUmber of licenSeD anD oPerational binGo PoSitionS aS on 31 marcH 20135.2.1 The number of licensed bingo positions in South Africa is 5 613, of which 3 338 positions are operational.
5.2.2 Gauteng accounts for the highest number of licensed bingo positions (5 216), of which 3 141 positions are operational as reflected in Graph 21 below.
Graph 21: number of operational bingo positions as on 31 march 2013
number of operational bingo positions per province, fY13
Total: 3 338
197
5.9%
3 141
94.1%
Gauteng
Mpumalanga

bacK to toP
CLICK ON LINKS TO NAVIGATE
IndexAcknowledgements
Exclusion of claims
Foreword
Abbreviations
Explanatory notes
List of tables and graphs
Executive summary: Overview of the South African gambling sector
1 cHaPter 1: introDUction
2 cHaPter 2: caSino Sector
3 cHaPter 3: racinG anD bettinG Sector
4 cHaPter 4: limiteD PaYoUt macHine Sector
5 cHaPter 5: binGo Sector
6 cHaPter 6: conclUSion
28© National Gambling Board, 2014
5.3 amoUnt of tUrnoVer (moneY WaGereD), GGr GenerateD anD taXeS/leVieS collecteD Per ProVince in tHe binGo Sector in fY13
5.3.1 turnover (rand value of money wagered) in the bingo sector per province in fY13
i The total Rand value of money wagered in the bingo sector during FY13 is R5 503 508 508. This amount represents 2.0% out of all turnover (money wagered) representing all gambling modes and when compared to money wagered at licensed casinos, racing & betting and limited payout machine outlets.
ii Bingo is offered for play in two provinces only namely Gauteng and Mpumalanga. Gauteng accounts for the highest number of licensed and operational bingo outlets and positions, resulting in the highest amount of money wagered (97.0%), compared to Mpumalanga (3.0%) as reflected in Graph 22 below. Note that money is only wagered from the bingo outlet in Mpumalanga since quarter three.
Graph 22: turnover, bingo, fY13
turnover, bingo per province, fY13
Gauteng
Mpumalanga
Total: R5 503 508 508
R165 845 846
3.0%
R5 337 662 662
97.0%

bacK to toP
CLICK ON LINKS TO NAVIGATE
IndexAcknowledgements
Exclusion of claims
Foreword
Abbreviations
Explanatory notes
List of tables and graphs
Executive summary: Overview of the South African gambling sector
1 cHaPter 1: introDUction
2 cHaPter 2: caSino Sector
3 cHaPter 3: racinG anD bettinG Sector
4 cHaPter 4: limiteD PaYoUt macHine Sector
5 cHaPter 5: binGo Sector
6 cHaPter 6: conclUSion
© National Gambling Board, 2014 29
5.3.2 Gross gambling revenue generated in the bingo sector per province in fY13
i The total Rand value of gross gambling revenue generated by the bingo sector during FY13 is R436 770 125. This amount represents 2.1% out of the total amount of GGR generated by all licensed gambling modes.
ii Bingo is offered for play in two provinces only namely Gauteng and Mpumalanga. Gauteng accounts for the highest number of licensed and operational bingo outlets and positions, resulting in the highest amount of GGR generated (98.0%), compared to Mpumalanga (2.0%), and reflected in Graph 23 below. Note that GGR is only generated in the bingo sector in Mpumalanga since quarter three (October – December 2013).
Graph 23: Gross gambling revenue, bingo, fY13
Gross gambling revenue, bingo per province, fY13
Total: R436 770 125
R427 888 402
98.0%
R8 881 723
2.0%
Gauteng
Mpumalanga
bacK to toP
CLICK ON LINKS TO NAVIGATE
IndexAcknowledgements
Exclusion of claims
Foreword
Abbreviations
Explanatory notes
List of tables and graphs
Executive summary: Overview of the South African gambling sector
1 cHaPter 1: introDUction
2 cHaPter 2: caSino Sector
3 cHaPter 3: racinG anD bettinG Sector
4 cHaPter 4: limiteD PaYoUt macHine Sector
5 cHaPter 5: binGo Sector
6 cHaPter 6: conclUSion
30© National Gambling Board, 2014
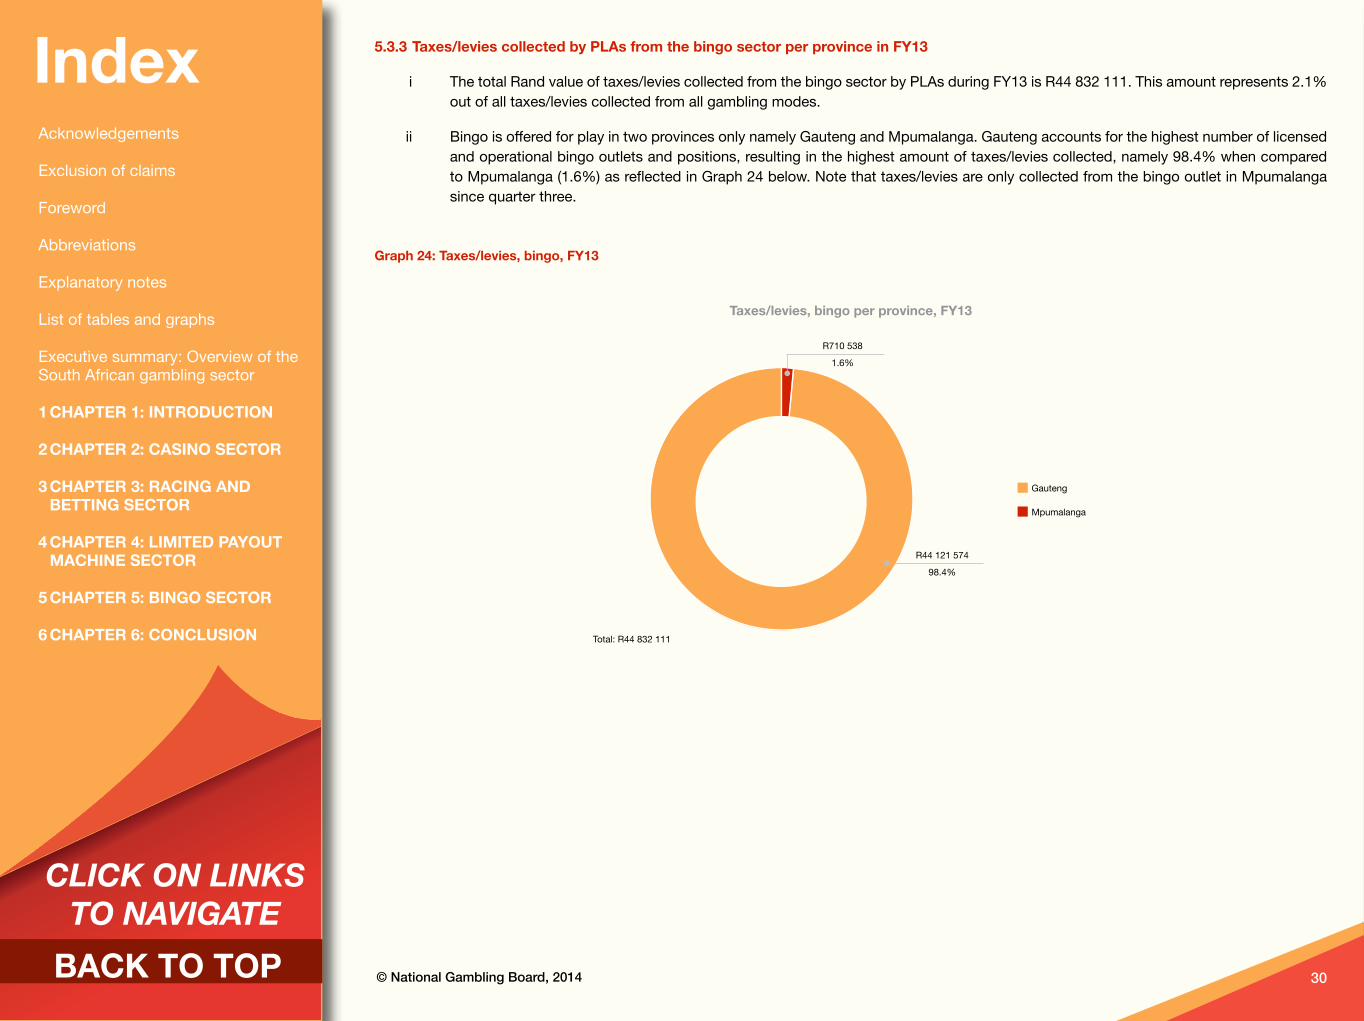
5.3.3 taxes/levies collected by Plas from the bingo sector per province in fY13
i The total Rand value of taxes/levies collected from the bingo sector by PLAs during FY13 is R44 832 111. This amount represents 2.1% out of all taxes/levies collected from all gambling modes.
ii Bingo is offered for play in two provinces only namely Gauteng and Mpumalanga. Gauteng accounts for the highest number of licensed and operational bingo outlets and positions, resulting in the highest amount of taxes/levies collected, namely 98.4% when compared to Mpumalanga (1.6%) as reflected in Graph 24 below. Note that taxes/levies are only collected from the bingo outlet in Mpumalanga since quarter three.
Graph 24: taxes/levies, bingo, fY13
taxes/levies, bingo per province, fY13
Total: R44 832 111
R44 121 574
98.4%
R710 538
1.6%
Gauteng
Mpumalanga
bacK to toP
CLICK ON LINKS TO NAVIGATE
IndexAcknowledgements
Exclusion of claims
Foreword
Abbreviations
Explanatory notes
List of tables and graphs
Executive summary: Overview of the South African gambling sector
1 cHaPter 1: introDUction
2 cHaPter 2: caSino Sector
3 cHaPter 3: racinG anD bettinG Sector
4 cHaPter 4: limiteD PaYoUt macHine Sector
5 cHaPter 5: binGo Sector
6 cHaPter 6: conclUSion
© National Gambling Board, 2014bacK to toP
CLICK ON LINKS TO NAVIGATE
Chapter 6: Conclusion
indexAcknowledgements
Exclusion of claims
Foreword
Abbreviations
Explanatory notes
List of tables and graphs
Executive summary: Overview of the South African gambling sector
1 cHaPter 1: introDUction
2 cHaPter 2: caSino Sector
3 cHaPter 3: racinG anD bettinG Sector
4 cHaPter 4: limiteD PaYoUt macHine Sector
5 cHaPter 5: binGo Sector
6 cHaPter 6: conclUSion

bacK to toP
CLICK ON LINKS TO NAVIGATE
IndexAcknowledgements
Exclusion of claims
Foreword
Abbreviations
Explanatory notes
List of tables and graphs
Executive summary: Overview of the South African gambling sector
1 cHaPter 1: introDUction
2 cHaPter 2: caSino Sector
3 cHaPter 3: racinG anD bettinG Sector
4 cHaPter 4: limiteD PaYoUt macHine Sector
5 cHaPter 5: binGo Sector
6 cHaPter 6: conclUSion
32© National Gambling Board, 2014
chapter 6: conclusionThe casino and limited pay-out machine sectors are fairly stable. The casino sector dominates other gambling modes or sectors in terms of the number of gambling positions, TO, GGR and taxes/levies collected. This is also the case with regards to Gauteng being the province accounting for the highest number of gambling positions, as well as the biggest amounts in terms of TO, GGR and taxes/levies collected.
Although the highest number of installed LPMs is found in KwaZulu-Natal (2 176), it is the Western Cape (1 630) that accounts for the highest amount of money wagered, GGR generated and taxes/levies collected.
The year on year statistics continue to show an increase in GGR, as well as taxes/levies across all modes of gambling in all provinces. The GGR increased by 11.9% from R18 417 million in FY12 to R20 914 million in FY13. Taxes/levies increased by 12.6% from R1 834 in FY12 to R2 098 million in FY13.
Growth is expected in the racing & betting, LPM and bingo sectors. This is especially applicable to expected increase in sport betting, the roll-out of bingo in other provinces such as Limpopo, Eastern Cape, North West and KwaZulu-Natal (and the expected growth in the number of electronic bingo terminals), as well as LPMs.
The Board will continue to monitor market conduct and national gambling statistics in the next financial year (FY14). The information in this report is the baseline on which analysis and comparisons will be built in future.

bacK to toP
CLICK ON LINKS TO NAVIGATE
IndexAcknowledgements
Exclusion of claims
Foreword
Abbreviations
Explanatory notes
List of tables and graphs
Executive summary: Overview of the South African gambling sector
1 cHaPter 1: introDUction
2 cHaPter 2: caSino Sector
3 cHaPter 3: racinG anD bettinG Sector
4 cHaPter 4: limiteD PaYoUt macHine Sector
5 cHaPter 5: binGo Sector
6 cHaPter 6: conclUSion
© National Gambling Board, 2014 33
Contributors & Verification of Data and Provincial Gambling StatisticsIn the compilation of this report, all PLAs were (once again) requested on 18 February 2014 and 4 March 2014 to verify the audited market conduct information and provincial gambling statistics submitted on/before 31 July 2013 for the financial year 2012/2013. Feedback was received as follows:
eastern cape Gambling and betting board:
Submitted changes to provincial gambling statistics and market conduct information on 7 March 2014
free State Gambling and liquor authority:
Confirmed correctness of market conduct information and provincial gambling statistics on 7 March 2014
Gauteng Gambling board:
Confirmed correctness of market conduct information and provincial gambling statistics on 4 and 10 March 2014
KwaZulu-natal Gaming and betting board:
Confirmed correctness of market conduct information and provincial gambling statistics on 21 February 2014 and 7 March 2014
limpopo Gambling board:
Submitted changes to provincial gambling statistics and market conduct information on 11 and 18 March 2014
mpumalanga Gambling board:
Submitted changes to market conduct information on 6 March 2014
northern cape Gambling board:
No verification or feedback received
north West Gambling board:
Confirmed correctness of market conduct information and provincial gambling statistics on 25 February 2014
Western cape Gambling and racing board:
Confirmed correctness of market conduct information and provincial gambling statistics on 26 February 2014
referenceNational Gambling Act, Act no7 of 2004.
bacK to toP
CLICK ON LINKS TO NAVIGATE
indexAcknowledgements
Exclusion of claims
Foreword
Abbreviations
Explanatory notes
List of tables and graphs
Executive summary: Overview of the South African gambling sector
1 cHaPter 1: introDUction
2 cHaPter 2: caSino Sector
3 cHaPter 3: racinG anD bettinG Sector
4 cHaPter 4: limiteD PaYoUt macHine Sector
5 cHaPter 5: binGo Sector
6 cHaPter 6: conclUSion

bacK to toP
contact DetailS:
national Gambling board
Direct switchboard: 086 722 7713 or 0100033475
fax to e-mail number: 0866185729
Website: www.ngb.org.za
e-mail: [email protected]
address: 420 Witch-Hazel avenue, eco-Glades 2, block c, eco-Park, centurion, 0144


![Philosophy of Nature [With Explanatory Notes - Volume II]](https://img.pdfslide.net/doc/110x75/545fb4f7b1af9f16598b4ddb/philosophy-of-nature-with-explanatory-notes-volume-ii.jpg)