Embed Size (px)
Citation preview
Game Consoles
Docket #12-AAER-2A
Prepared by: Forest Kaser, ENERGY SOLUTIONS Pierre Delforge, NATURAL RESOURCES DEFENSE COUNCIL
Prepared for:
PACIFIC GAS & ELECTRIC
COMPANY SOUTHERN CALIFORNIA
EDISON SAN DIEGO GAS AND
ELECTRIC SOUTHERN CALIFORNIA
GAS COMPANY
This report was prepared by the California Statewide Utility Codes and Standards Program and funded by the California utility customers under the auspices of the California Public Utilities Commission. Copyright 2013 Pacific Gas and Electric Company, Southern California Edison, Southern California Gas, San Diego Gas & Electric. All rights reserved, except that this document may be used, copied, and distributed without modification. Neither PG&E, SCE, SoCalGas, SDG&E, nor any of its employees makes any warranty, express of implied; or assumes any legal liability or responsibility for the accuracy, completeness or usefulness of any data, information, method, product, policy or process disclosed in this document; or represents that its use will not infringe any privately-owned rights including, but not limited to, patents, trademarks or copyrights.
Analysis of Standards Proposal for Game Consoles
Codes and Standards Enhancement (CASE) Initiative For PY 2013: Title 20 Standards Development
DOCKETEDCalifornia Energy Commission
JUL 29 2013
TN 7178012-AAER-2A
Table of Contents
1 EXECUTIVE SUMMARY ................................................................................................ 1
1.1 Recommendation .................................................................................................. 1
2 PRODUCT DESCRIPTION ............................................................................................. 2
3 MANUFACTURING AND MARKET CHANNEL OVERVIEW ........................................ 6
4 ENERGY USAGE............................................................................................................. 7
4.1 Test Methods ....................................................................................................... 7 4.1.1 Current Test Methods ....................................................................................................................................................................... 7 4.1.2 Proposed Test Methods...................................................................................................................................................................... 7
4.2 Game Console Duty Cycle and Modal Power ................................................................ 7 4.3 Per Unit Energy Consumption, Trends & Efficiency Measures ............................................ 8 4.4 Energy Use Per Unit for Qualifying Products .............................................................. 11
5 MARKET SATURATION & SALES ............................................................................... 15
5.1 Current Market Situation ...................................................................................... 15 5.1.1 Total Stock and Annual Sales .......................................................................................................................................................... 15
5.2 Future Market Adoption of High Efficiency Options ...................................................... 16
6 SAVINGS POTENTIAL.................................................................................................. 17
6.1 Statewide California Energy Savings .......................................................................... 17 6.1 State or Local Government Costs and Savings .............................................................. 19
7 ECONOMIC ANALYSIS................................................................................................ 19
7.1 Design Life ........................................................................................................ 19 7.2 Incremental Cost ................................................................................................ 20
7.2.1 Incremental Cost of Modal Power Limits ............................................................................................................................................ 20 7.2.2 Incremental Cost of Minimum Internal Power Supply Efficiency ............................................................................................................. 21 7.2.3 Total Incremental Cost ................................................................................................................................................................... 21
7.3 Lifecycle Cost / Net Benefit ................................................................................... 21
8 ACCEPTANCE ISSUES .................................................................................................. 23
8.1 Existing Standards ............................................................................................... 23 8.2 Product Cycle .................................................................................................... 23 8.3 Stakeholder Positions ........................................................................................... 24
9 ENVIRONMENTAL IMPACTS ...................................................................................... 24
9.1 Hazardous Materials ............................................................................................. 24 9.2 Air Quality ....................................................................................................... 24 9.3 Greenhouse Gases ............................................................................................... 25
10 RECOMMENDATIONS ................................................................................................ 27
10.1 Recommended Standards Proposal ........................................................................... 27 10.1.1 Auto Power Down ......................................................................................................................................................................... 27 10.1.2 Modal Limits ................................................................................................................................................................................ 27 10.1.3 Internal Power Supply Efficiency....................................................................................................................................................... 28 10.1.4 Active Game Play Test and List ........................................................................................................................................................ 28
10.2 Proposed Changes to the Title 20 Code Language ......................................................... 28
10.1 Implementation Plan ............................................................................................ 33
REFERENCES ............................................................................................................................ 34
APPENDIX A: GAME CONSOLE OPERATIONAL MODE FUNCTIONS .................................. A-1
APPENDIX B: NRDC ACTIVE GAME PLAY TEST METHOD .................................................. B-1
APPENDIX C: NRDC CONNECTED AND READY TEST METHOD ......................................... C-1
APPENDIX D: COST ANALYSIS ASSUMPTIONS ................................................................... D-1
APPENDIX E: CRITERIA POLLUTANT EMISSIONS AND MONETIZATION ..........................E-1
E.1 Criteria Pollutant Emissions Calculation .................................................................... E-1 E.2 Criteria Pollutant Emissions Monetization ................................................................. E-1
APPENDIX F: GREENHOUSE GAS VALUATION DISCUSSION ............................................... F-1
F.1 Damage Cost Approach ........................................................................................ F-1 F.1.1 Interagency Working Group Estimates ............................................................................................................................................. F-1
F.2 Abatement Cost Approach .................................................................................... F-2 F.3 Regulated Carbon Market Approach ........................................................................ F-3
F.3.1 European Union Emissions Trading System ...................................................................................................................................... F-3 F.3.2 California Cap & Trade ................................................................................................................................................................ F-4
1 | IOU CASE Report: Game Consoles | July 29, 2013
1 Executive Summary The Pacific Gas and Electric Company (PG&E), Southern California Edison (SCE), Southern California Gas (SCG), and San Diego Gas & Electric (SDG&E) Codes and Standards Enhancement (CASE) Initiative Project seeks to address energy efficiency opportunities through development of new and updated Title 20 standards. Individual reports document information and data helpful to the California Energy Commission (CEC) and other stakeholders in the development of these new and updated standards. The objective of this project is to develop CASE Reports that provide comprehensive technical, economic, market, and infrastructure information on each of the potential appliance standards. This CASE Report covers standard options for game consoles.
Video game consoles have become a staple in the majority of California homes with an average of one console per household in the state. Sales are expected to increase over the next few years as the introduction of next generation consoles in 2013 triggers a refresh of existing stock. Some of the most common game consoles on the market today consume a similar amount of annual energy to a mainstream desktop computer. In aggregate, California game consoles consume roughly 1,400 GWh annually, equivalent to half the output of a medium-size 500 MW power plant, and as much electricity as is consumed annually by all the households in the city of Oakland.
Manufacturers' voluntary adoption of an “automatic power down” feature has been helping to reduce energy consumption by game consoles, but large savings opportunities remain available, including improvements in the way automated power management is implemented.
Tier 1 levels and other requirements are set to be achievable by all game consoles currently available on the market with minimal changes. Tier 2 levels are based on levels achieved by the most efficient consoles available today. They will require hardware changes but manufacturers will have four years to implement these changes before Tier 2 becomes effective. In the absence of data on the upcoming next generation consoles from Sony and Microsoft, we have proposed a framework which will be able to accommodate potentially different levels for these consoles when this data becomes available at the end of 2013. We will then propose level adjustments for high-performance consoles if appropriate.
The proposed standards also include auto-power down requirements to guarantee the savings potential from this capability, and a test and list requirement for game play to provide transparency on game play power use.
The standards are cost-effective for users, with net saving between $9 and $40 per unit over the lifetime of the products. They will yield energy cost savings over the lifetimes of the products that are 60% to 290% higher than their incremental upfront costs, making them cost-effective for consumers.
CEC’s adoption of the proposed standard would represent savings of 570 GWh/yr after entire stock turnover. NRDC estimates that this would save Californians $75 million annually, and reduce California’s CO2 emissions by over 200,000 metric tons annually, the equivalent of removing 50,000 passenger cars from the road continuously.
1.1 Recommendation
The estimated public benefits of the proposed standard outweigh the estimated costs. As a result, the Commission should adopt the proposed standard.
2 | IOU CASE Report: Game Consoles | July 29, 2013
2 Product Description A wide variety of electronic devices enable users to play games by interacting with video displays. This report focuses on the subset of such devices that are intended for stationary home use; consist of computer-like hardware components such as central processors, system memory, graphics processors, video memory, and storage drives; and rely primarily on televisions and specialized hand held controllers for signal output and input, respectively. Hereafter, such products are referred to as “game consoles” or “consoles.”
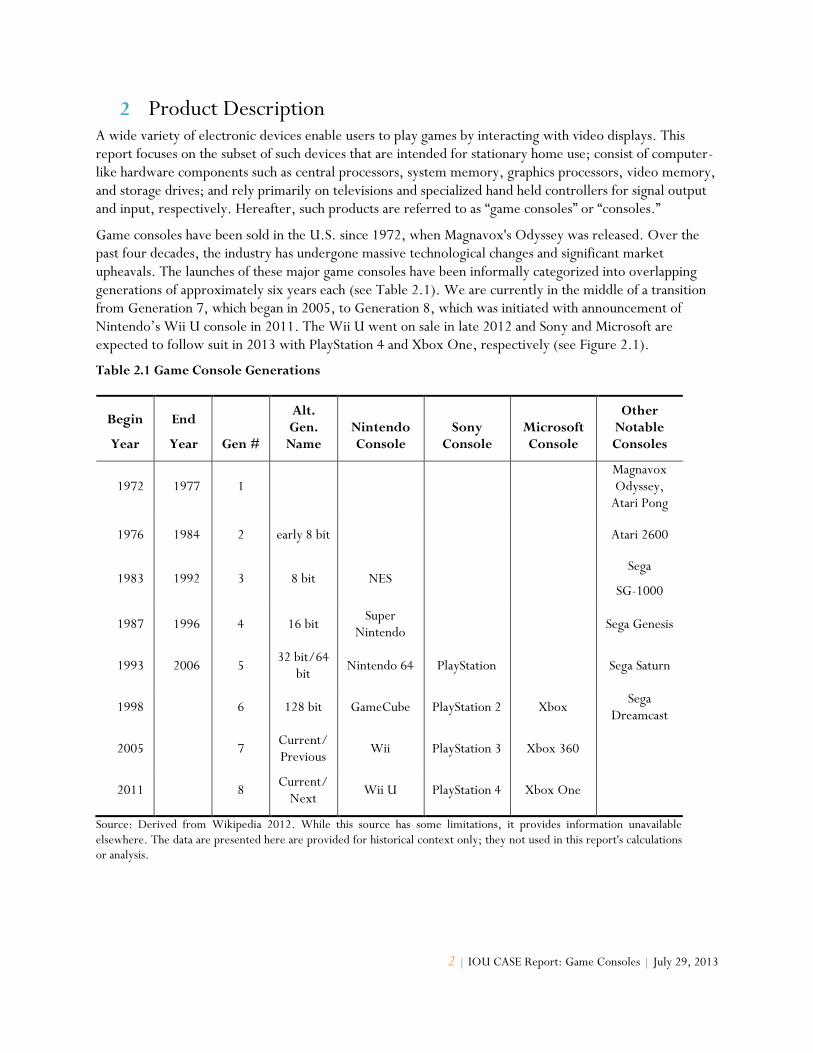
Game consoles have been sold in the U.S. since 1972, when Magnavox's Odyssey was released. Over the past four decades, the industry has undergone massive technological changes and significant market upheavals. The launches of these major game consoles have been informally categorized into overlapping generations of approximately six years each (see Table 2.1). We are currently in the middle of a transition from Generation 7, which began in 2005, to Generation 8, which was initiated with announcement of Nintendo’s Wii U console in 2011. The Wii U went on sale in late 2012 and Sony and Microsoft are expected to follow suit in 2013 with PlayStation 4 and Xbox One, respectively (see Figure 2.1).
Table 2.1 Game Console Generations
Begin
Year
End
Year Gen #
Alt. Gen. Name
Nintendo Console
Sony Console
Microsoft Console
Other Notable Consoles
1972 1977 1 Magnavox Odyssey,
Atari Pong
1976 1984 2 early 8 bit Atari 2600
1983 1992 3 8 bit NES Sega
SG-1000
1987 1996 4 16 bit Super
Nintendo Sega Genesis
1993 2006 5 32 bit/64
bit Nintendo 64 PlayStation Sega Saturn
1998 6 128 bit GameCube PlayStation 2 Xbox Sega
Dreamcast
2005 7 Current/Previous
Wii PlayStation 3 Xbox 360
2011 8 Current/
Next Wii U PlayStation 4 Xbox One
Source: Derived from Wikipedia 2012. While this source has some limitations, it provides information unavailable elsewhere. The data are presented here are provided for historical context only; they not used in this report's calculations or analysis.
3 | IOU CASE Report: Game Consoles | July 29, 2013
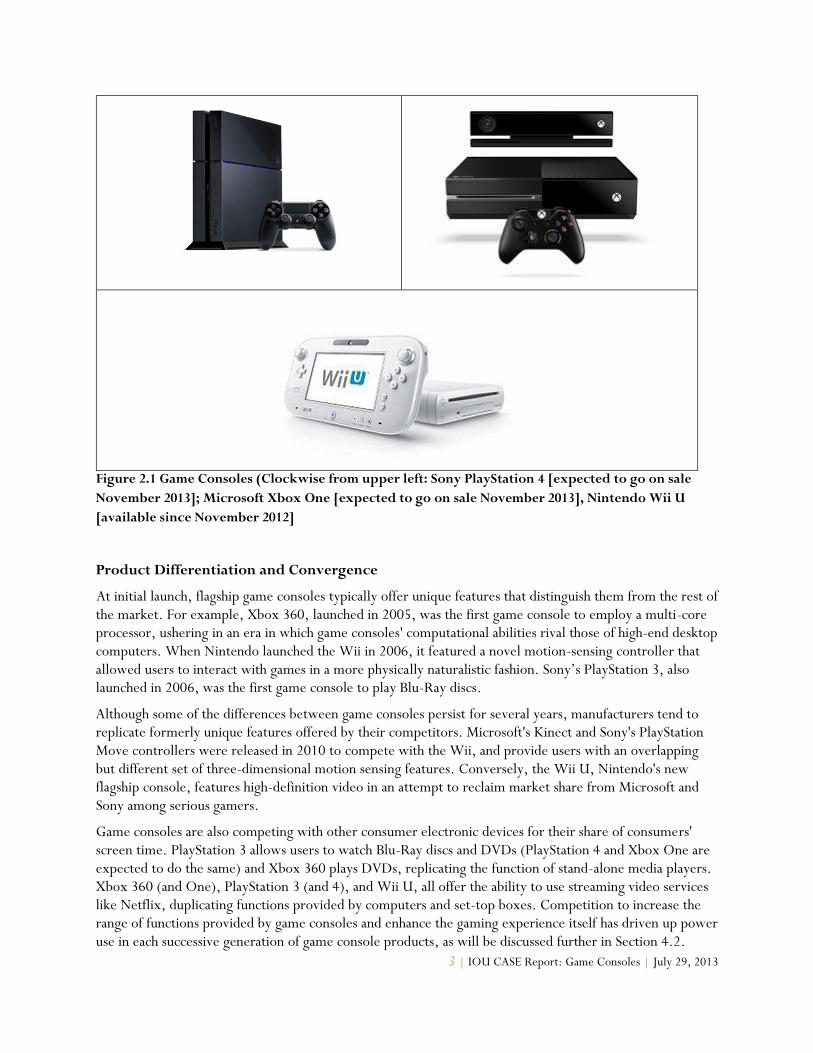
Figure 2.1 Game Consoles (Clockwise from upper left: Sony PlayStation 4 [expected to go on sale
November 2013]; Microsoft Xbox One [expected to go on sale November 2013], Nintendo Wii U
[available since November 2012]
Product Differentiation and Convergence
At initial launch, flagship game consoles typically offer unique features that distinguish them from the rest of the market. For example, Xbox 360, launched in 2005, was the first game console to employ a multi-core processor, ushering in an era in which game consoles' computational abilities rival those of high-end desktop computers. When Nintendo launched the Wii in 2006, it featured a novel motion-sensing controller that allowed users to interact with games in a more physically naturalistic fashion. Sony’s PlayStation 3, also launched in 2006, was the first game console to play Blu-Ray discs.
Although some of the differences between game consoles persist for several years, manufacturers tend to replicate formerly unique features offered by their competitors. Microsoft's Kinect and Sony's PlayStation Move controllers were released in 2010 to compete with the Wii, and provide users with an overlapping but different set of three-dimensional motion sensing features. Conversely, the Wii U, Nintendo's new flagship console, features high-definition video in an attempt to reclaim market share from Microsoft and Sony among serious gamers.
Game consoles are also competing with other consumer electronic devices for their share of consumers' screen time. PlayStation 3 allows users to watch Blu-Ray discs and DVDs (PlayStation 4 and Xbox One are expected to do the same) and Xbox 360 plays DVDs, replicating the function of stand-alone media players. Xbox 360 (and One), PlayStation 3 (and 4), and Wii U, all offer the ability to use streaming video services like Netflix, duplicating functions provided by computers and set-top boxes. Competition to increase the range of functions provided by game consoles and enhance the gaming experience itself has driven up power use in each successive generation of game console products, as will be discussed further in Section 4.2.
4 | IOU CASE Report: Game Consoles | July 29, 2013
Although the ability of game consoles to perform the functions of one or more stand-alone device has the potential to eliminate manufacturing, distribution, and disposal-phase energy consumption associated with the substituted devices, current consoles typically use much more power to provide the same functionality. For example, dedicated video streaming devices such as Apple TV can stream high definition video for less than 1 watts (W) compared to over 60 W for current game consoles (Shimpi 2013).
New High-Performance Consoles
The new game consoles from Sony and Microsoft are expected to deliver a number of a new features and an increase in computational performance relative to the current generation. Microsoft’s Xbox One will be shipped with the Kinect accessory and will reportedly be capable of being activated and controlled using voice commands. Continuing the trend towards providing functions that consumers previously accessed through other devices, Microsoft has advertised the ability of the Xbox One to allow users to switch between applications for browsing the Internet, streaming video, and conducting voice and video-enabled telephone calls. According to Sony, the PlayStation 4 will enable users to broadcast their games over the Internet and to record and save gameplay video for sharing with others.
The energy usage characteristics of the new consoles have not been published, and likely will not become available until the consoles go on sale. As a result, the standards proposed here do not include separate requirements for the new consoles. To anticipate the possibility that the new consoles may require different modal power limits, we propose using system memory bandwidth as a proxy for performance to separate consoles in two distinct performance categories to distinguish them from other consoles.
System memory bandwidth is the rate at which data can be transferred between the processor and the system memory and provides a useful index of system performance. In the simplest case, the system memory bandwidth can be calculated as the product of the system memory clock frequency (in gigahertz) and system memory bus width (in bytes). Preliminary reports suggest that the calculation may be more complex for Xbox One due to its hybrid memory architecture (Westwater 2013). However, even calculated in the most straightforward way, the Xbox One and PlayStation 4 are clearly distinguishable from other consoles (see Table 2.2 below). A threshold of 64 gigabytes per second (GB/s) system memory bandwidth could be used to set separate standards for high performance consoles, if new information suggests such binning would be appropriate.

5 | IOU CASE Report: Game Consoles | July 29, 2013
Table 2.2 Comparison of Game Console Hardware Characteristics
Metric
Game Console
Xbox 360 PS3 Wii Wii U PS4 Xbox One Ouya Piston
CPU PowerPC Tri-Core Xenon
Cell IBM
PowerPC "Broadway"
Tri-Core IBM
PowerPC "Espresso"
APU with eight x86-64 cores
APU with eight x86-64 cores
Nvidia Tegra 3 — Quad-core
processor
3.2GHz quad-core AMD
CPU
Cores 3 dual
threaded 7 single threaded
1 3 8 8 4 4
CPU Frequency (GHz) 3.2 3.2 0.7 1.6 1.6 1.6 3.2
System memory 512MB
1400MHz GDDR3
256MB + 256 MB
64MB DDR 8GB
5500MHz GDDR5
8GB 2133MHz
DDR3 1GB 1600Mhz
System memory bus 128-bits 256-bits 256-bits
System memory bandwidth (GB/s)
22.4 25.6 5.6 12.8 176 68.3-102 2
Sources: Wikipedia 2013a, Wikipedia 2013a, Wikipedia 2013a, Wikipedia 2013a, Wikipedia 2013a, Wikipedia 2013a, (while Wikipedia has some limitations, it provides information unavailable elsewhere; the data are presented here provide context for the proposed approach to binning high-performance consoles but are not used in this report's calculations or analysis); Tickled_Pink 2012, Shedeen 2013, InquiringMind 2013, Hruska 2013, Anthony 2013, Anand 2013.
6 | IOU CASE Report: Game Consoles | July 29, 2013
3 Manufacturing and Market Channel Overview Game consoles are unlike most other consumer electronics in that the market is divided among only three major manufacturers: Sony, Microsoft, and Nintendo. New manufacturers are entering the market, however, including Ouya, which released its eponymous game console in June 2013, and Xi3, which started taking orders in March 2013 for its Piston console.
Game consoles also differ from other consumer electronics in that product feature sets tend to change in a discontinuous rather than in a continuous fashion. That is, rather than adding features incrementally to existing products on an annual basis, manufacturers package major new features into new product lines that are released every five or six years and marketed as a new “generation.” In some cases, a manufacturer may continue to produce and sell an older-generation console even after launching a new flagship product. Sony continued to sell PlayStation 2, for example, from 2000 until 2013, even though PlayStation 3 was launched in 2006.
Game console hardware is released in discrete generations mainly to create a stable platform for software development, which represents the vast majority of game console manufacturers’ profits (Hittinger 2012). Maintaining a consistent set of features within a generation of consoles establishes a stable platform that enables developers to create a larger inventory of game titles for a particular console than would otherwise be possible. This benefits consumers who gain access to more game titles for each console purchase, as well as software developers and manufacturers who can amortize hardware and game title development costs associated with a unique hardware feature set over a longer period.
Variations in hardware configurations and accessory packages may distinguish different price points of the same basic product. For example, in the U.S the PlayStation 3 “super slim” model is available with either 500 GB or a 250 GB of storage capacity.
Game console manufacturers do make some changes to products within a generation, sometimes referred to as “models.” Typically, new models of the same console replace previous versions and include features such as form factor, increased internal storage capacity, or improved network capabilities. Manufacturers also leverage improvements in semiconductor fabrication processes to decrease system energy consumption and accompanying space and cooling requirements. Microsoft's release of the Xbox 360 S (or “slim”) in 2010 is an example featuring a slimmer form factor, more hard drive storage, built-in networking, and a new, more efficient processor architecture (Shimpi 2010). In some cases, the changes following initial product launch may significantly affect console energy use, as is discussed in Section 4.3 below.
7 | IOU CASE Report: Game Consoles | July 29, 2013
4 Energy Usage
4.1 Test Methods1
4.1.1 Current Test Methods
The U.S. Environmental Protection Agency (EPA) Game Console Recognition Program has developed a test method for evaluating compliance with auto power down requirements as well as modal power limits. This test method can be used for testing compliance with all requirements of the proposed standard except the requirement to report active game play power level and the internal power supply efficiency requirement.
The Natural Resources Defense Council (NRDC) has developed a draft test method for evaluating power levels during active game play (NRDC 2013; Appendix A). This draft test method addresses the challenges presented by variability in power use depending on player skill, game title, and game position. It provides results that are sufficiently repeatable and representative for a Test and List requirement, if not for a mandatory power limit. NRDC has also proposed a draft test method for testing power consumption when the console is in a lower power mode but ready to respond to network, voice or other external triggers (Appendix B).
The Electric Power Research (EPRI) and Ecova have developed a test method for evaluating the performance of internal power supply units: Generalized Test Protocol for Calculating the Energy Efficiency of Internal Ac-Dc and Dc-Dc Power Supplies (EPRI 2012). This test method can be used to evaluate game console internal power supply efficiency.
4.1.2 Proposed Test Methods
The EPA Game Console Recognition Program Test Method is proposed in this report for testing compliance with auto power down requirements and power consumption in all modes except for active game play (see Section 4.2 for description of game console modes). NRDC Active Gaming Test Method (Appendix A) should be the basis for reporting active game play power use. In addition, NRDC Connected and Ready Test Method (Appendix B) should be the basis for testing power use in networked standby and connected and ready modes.
The Ecova/EPRI Generalized Test Protocol for Calculating the Energy Efficiency of Internal Ac-Dc and Dc-Dc Power Supplies should be used to test internal power supply efficiency.
4.2 Game Console Duty Cycle and Modal Power
Game consoles consume energy in several distinct modes of operation. The fraction of time consoles typically spend in each mode over a specific period of time constitutes the “duty cycle” of the product. The major modes of operation in the current generation of consoles are defined in this report as Game Play, Media, Navigation, Standby, and Networked Standby. For details on how game console modes used in this report compare to the modes of other electronic devices, please see Appendix A:.
Game Play and Media modes are modes that rely on specific console applications to provide entertainment content to the user. Media mode includes the transmission of audio and or visual content from online streaming services such as Netflix as well as content derived from removable media, such as DVDs. Navigation provides access to features and/or settings associated with the console or other applications.
1 See proposed code language in Section 10.2 for test method references.
8 | IOU CASE Report: Game Consoles | July 29, 2013
Future consoles may include additional application types that provide functions other than game play, media playback, or navigation. This Report recognizes this possibility, with the standards proposal requiring that consoles automatically power down from such hypothetical applications. Because of the difficulty inherent in predicting the power requirements for future applications and/or modes, the standards proposal does not apply power limits to them.
The other two major modes are Standby and Networked Standby. Standby is a true off mode, meaning the only way for a user to exit the mode is through the use of a power command (Nordman 2012). Consoles in Standby may be capable of providing certain secondary functions, such as accessory charging, or maintenance activities but cannot be reactivated and switched into another mode by way of a remotely initiated trigger from a network connection. Networked standby allows the console to be reactivated and switched into another mode by way of a signal received through a network connection. The Wii console (but not the Wii U) includes a feature called “Connect24” that involves network communications but without the possibility of switching to a different mode without user input. The specific language of the proposed standard (see Section10.2) would treat Connect24 as a Standby mode and require that console power consumption be lower than the corresponding modal limit. Therefore, the Wii with Connect24, as currently implemented, would not qualify under the proposed standard.
In addition to those standard modes, Microsoft’s advertising for the voice activation feature of Xbox One suggests that an additional “connected and ready” mode may be relevant when that console enters the market. “Connected and Ready” is very similar to networked standby, except that reactivation is triggered from voice commands, gestures, or other environmental cues instead of through a signal received over a network. Since that mode does not currently exist, it was not included in energy usage or savings calculations in this report. The proposed standard does include a modal limit for “connected and ready” equal to that proposed for “networked standby” since these two modes are quite similar.
4.3 Per Unit Energy Consumption, Trends & Efficiency Measures
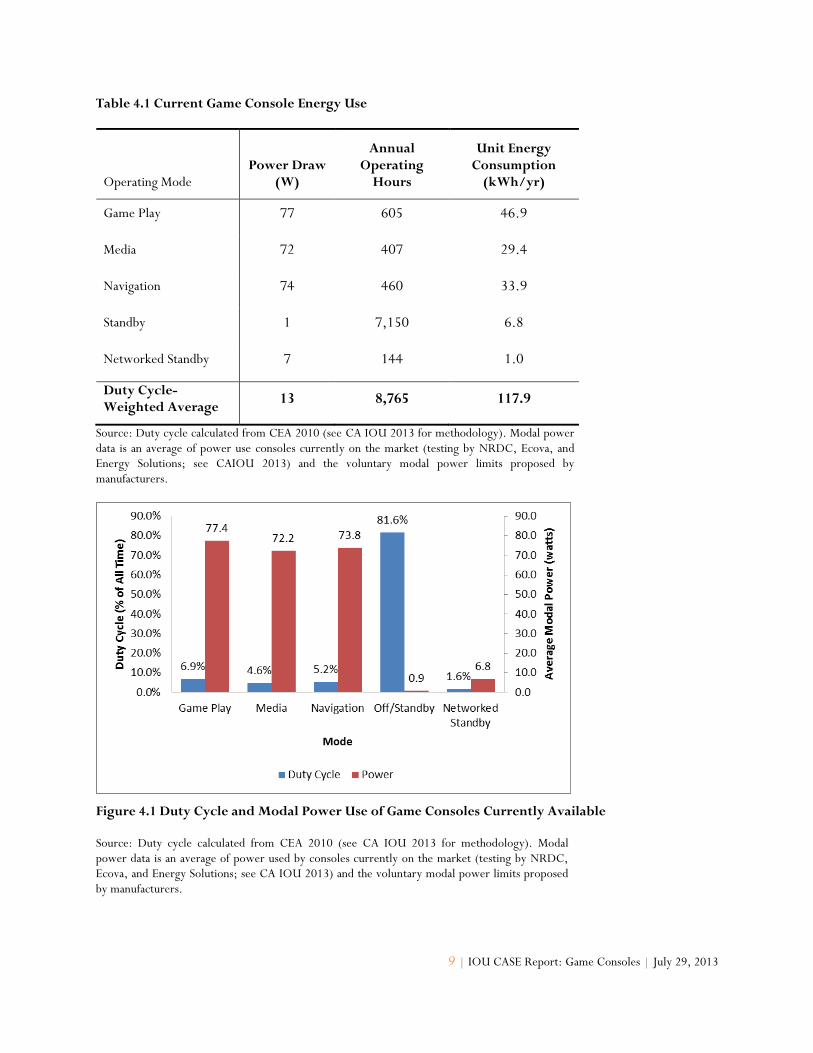
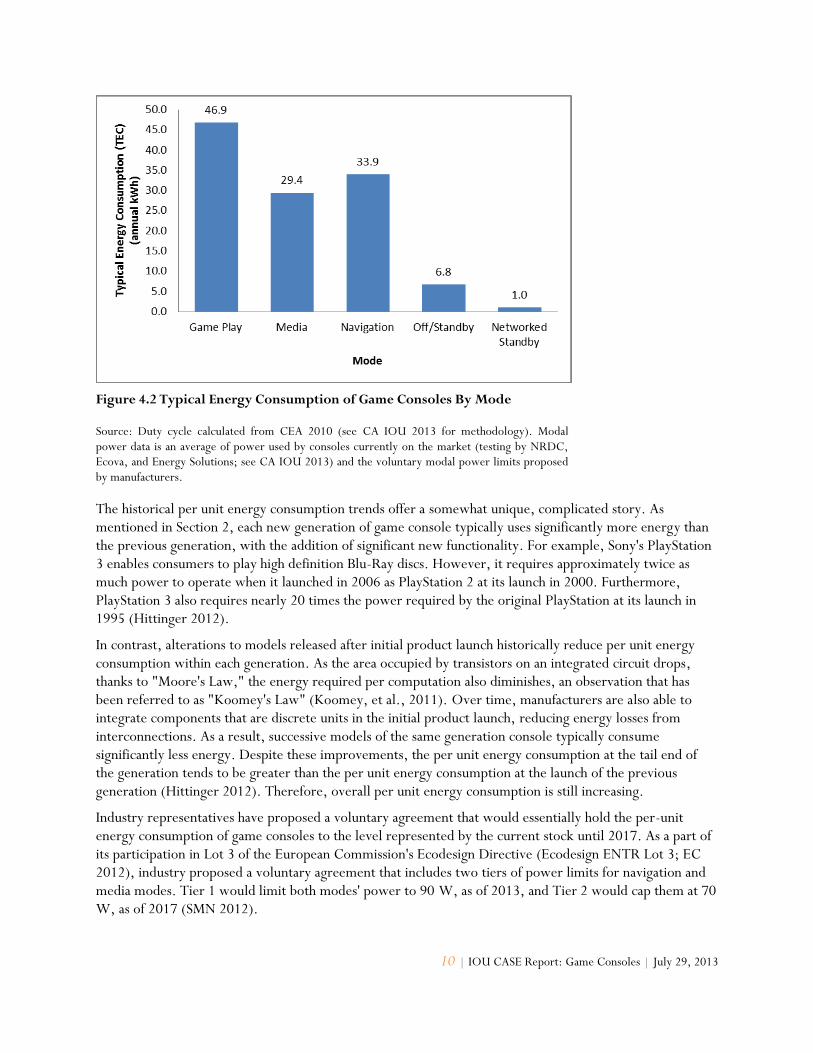
Because of the natural, market-based fluctuations in the power usage of game consoles over time (see Section 3 and discussion below), in this Report the power draw of consoles currently on the market is averaged with the modal power limits in manufacturers’ proposed voluntary standards. Manufacturers’ proposed modal power limits are used as a proxy for the power consumption of the new game consoles to be released in 2013 (Xbox One and PlayStation 4). Therefore, the average modal power values, shown in Table 4.1 below, provide an estimate of what game console power usage is likely to be in the near term (“non-standards case)” for the purpose of contrasting with what console power usage is likely to be in the case the standards proposed in this report are adopted (“standards case”). The relationship between the power required by different game console modes and the fraction of time consoles spend in each mode is shown in Figure 4.1. Figure 4.2shows the total energy consumption, by mode, for game consoles.
9 | IOU CASE Report: Game Consoles | July 29, 2013
Table 4.1 Current Game Console Energy Use
Operating Mode Power Draw
(W)
Annual Operating
Hours
Unit Energy Consumption
(kWh/yr)
Game Play 77 605 46.9
Media 72 407 29.4
Navigation 74 460 33.9
Standby 1 7,150 6.8
Networked Standby 7 144 1.0
Duty Cycle-Weighted Average
13 8,765 117.9
Source: Duty cycle calculated from CEA 2010 (see CA IOU 2013 for methodology). Modal power data is an average of power use consoles currently on the market (testing by NRDC, Ecova, and Energy Solutions; see CAIOU 2013) and the voluntary modal power limits proposed by manufacturers.
Figure 4.1 Duty Cycle and Modal Power Use of Game Consoles Currently Available
Source: Duty cycle calculated from CEA 2010 (see CA IOU 2013 for methodology). Modal power data is an average of power used by consoles currently on the market (testing by NRDC, Ecova, and Energy Solutions; see CA IOU 2013) and the voluntary modal power limits proposed by manufacturers.
10 | IOU CASE Report: Game Consoles | July 29, 2013
Figure 4.2 Typical Energy Consumption of Game Consoles By Mode
Source: Duty cycle calculated from CEA 2010 (see CA IOU 2013 for methodology). Modal power data is an average of power used by consoles currently on the market (testing by NRDC, Ecova, and Energy Solutions; see CA IOU 2013) and the voluntary modal power limits proposed by manufacturers.
The historical per unit energy consumption trends offer a somewhat unique, complicated story. As mentioned in Section 2, each new generation of game console typically uses significantly more energy than the previous generation, with the addition of significant new functionality. For example, Sony's PlayStation 3 enables consumers to play high definition Blu-Ray discs. However, it requires approximately twice as much power to operate when it launched in 2006 as PlayStation 2 at its launch in 2000. Furthermore, PlayStation 3 also requires nearly 20 times the power required by the original PlayStation at its launch in 1995 (Hittinger 2012).
In contrast, alterations to models released after initial product launch historically reduce per unit energy consumption within each generation. As the area occupied by transistors on an integrated circuit drops, thanks to "Moore's Law," the energy required per computation also diminishes, an observation that has been referred to as "Koomey's Law" (Koomey, et al., 2011). Over time, manufacturers are also able to integrate components that are discrete units in the initial product launch, reducing energy losses from interconnections. As a result, successive models of the same generation console typically consume significantly less energy. Despite these improvements, the per unit energy consumption at the tail end of the generation tends to be greater than the per unit energy consumption at the launch of the previous generation (Hittinger 2012). Therefore, overall per unit energy consumption is still increasing.
Industry representatives have proposed a voluntary agreement that would essentially hold the per-unit energy consumption of game consoles to the level represented by the current stock until 2017. As a part of its participation in Lot 3 of the European Commission's Ecodesign Directive (Ecodesign ENTR Lot 3; EC 2012), industry proposed a voluntary agreement that includes two tiers of power limits for navigation and media modes. Tier 1 would limit both modes' power to 90 W, as of 2013, and Tier 2 would cap them at 70 W, as of 2017 (SMN 2012).
11 | IOU CASE Report: Game Consoles | July 29, 2013
Industry representatives also presented their proposed voluntary limits in a public conference call held in August 2012 to discuss the Environmental Protection Agency's Game Console Recognition Program specification. A multi-stakeholder Consultation Forum was held in Brussels in November 2012 to consider the industry proposal. The European Commission is expected to decide whether to accept the voluntary agreement in lieu of implementing its own regulatory measure in 2013.
The Tier 2 modal limits in the industry proposal are close to what current generation consoles require in active modes. The industry proposal thus represents a commitment to keep console power draw constant, but not to improve it. To be consistent with industry’s voluntary plans, the CASE Team calculated the energy consumption associated with the non-standards case by averaging the modal power consumption of consoles currently available on the market with the modal limits proposed by manufacturers (CA IOU 2013).
While the manufacturers' proposal for modal power limits and their embrace of automatic power-down are positive steps, opportunities exist for additional cost-effective energy savings. Certain problems in how the automatic power-down feature is implemented diminish its impact on energy savings. For example, the Wii U includes strong cautionary language about the risk of data loss associated with automatic power down. Since most games automatically save data, such language is probably unnecessary and likely leads users to disable the auto power down feature. Also, voluntary standards are more prone inadvertent noncompliance since they are likely subjected to less stringent quality control procedures.
The EPA Game Console Recognition Program launched the first version of its voluntary standard in March 2013 (EPA 2013). The EPA’s performance requirements include modal limits of 40 W for navigation mode, 50 W for streaming media mode, and 0.5 W for standby. The EPA did not include a modal limit for networked standby in deference to pending European regulation through Ecodesign Lot 26 (EC 2013; discussed below). NRDC testing of Nintendo's Wii U shows that game consoles can display high-definition video in media and navigation modes using under 35 W, significantly less than what manufacturers propose (Leadbetter 2012; Shimpi 2012). The Tier 2 modal limits in the proposed standard of 30 W for navigation and 35 W for streaming media reflect what the market has already demonstrated to be technically feasible, as demonstrated by the Wii U, high-end gaming notebooks, and dedicated standalone media streaming devices. .
Another opportunity for energy savings in game consoles is suggested by reference in Lot 3 to the Ecodesign Lot 26 horizontal regulation on networked standby (EC 2013). The Lot 26 standard includes a 6 W limit effective in 2015 and a 3 W limit in 2017. These same limits are adopted in the proposed standard (although the Tier 2 effective year is 2018). Finally, parallel efforts on internal power supplies for computers suggest that 85 percent efficiency floor for active game play mode, for which we do not propose a modal power limit, is also feasible and cost-effective for game consoles (see Section 7.2.2 for more details on computer power supply testing and incremental cost analysis).
4.4 Energy Use Per Unit for Qualifying Products
For most consumer electronics, the existence of a large pool of manufacturers makes it feasible to set requirements that not every manufacturer can meet. In those cases, most manufacturers will be able to meet consumer demand and competition will likely drive improvements throughout the market. Because of the limited number of game console manufacturers, it would not be reasonable to impose standards that only one or two of the three major manufacturers are capable of meeting. Instead, the requirements of the proposed standard were designed to reflect what is technically feasible for all manufacturers to achieve, based on the capabilities of currently available game consoles and other consumer electronics that perform

12 | IOU CASE Report: Game Consoles | July 29, 2013
similar functions as discussed above in Section 4.3. Preliminary testing indicates that Wii U is likely to exceed all hardware and software requirements included in Tier 1 of the proposed standard, meeting the requirements of Tier 2 as well. Given the development time allowed by the proposed standard, all consoles should be capable of achieving similar performance levels.
The proposed standard establishes four types of energy efficiency requirements for game consoles:
1. Auto Power Down: requires that game consoles, by default, automatically power down from active modes to a standby mode when not in use. This requirement would be typically addressed through software changes.
2. Modal Limits: establishes maximum limits on the power that game consoles can draw in certain modes of operation. This requirement would be addressed through hardware changes.
3. Internal Power Supply Efficiency: requires that the internal power supplies of game consoles, when present, have an efficiency of at least 85 percent at 50 percent loading. This requirement would be addressed through hardware changes.
4. Active Game Play Test and List: requires that console power draw in active game play mode be tested and reported to the Energy Commission using a standardized testing procedure. This requirement is addressed by testing. A similar requirement already exists in Mexico but without guidelines on how to measure power draw in a consistent and meaningful manner.
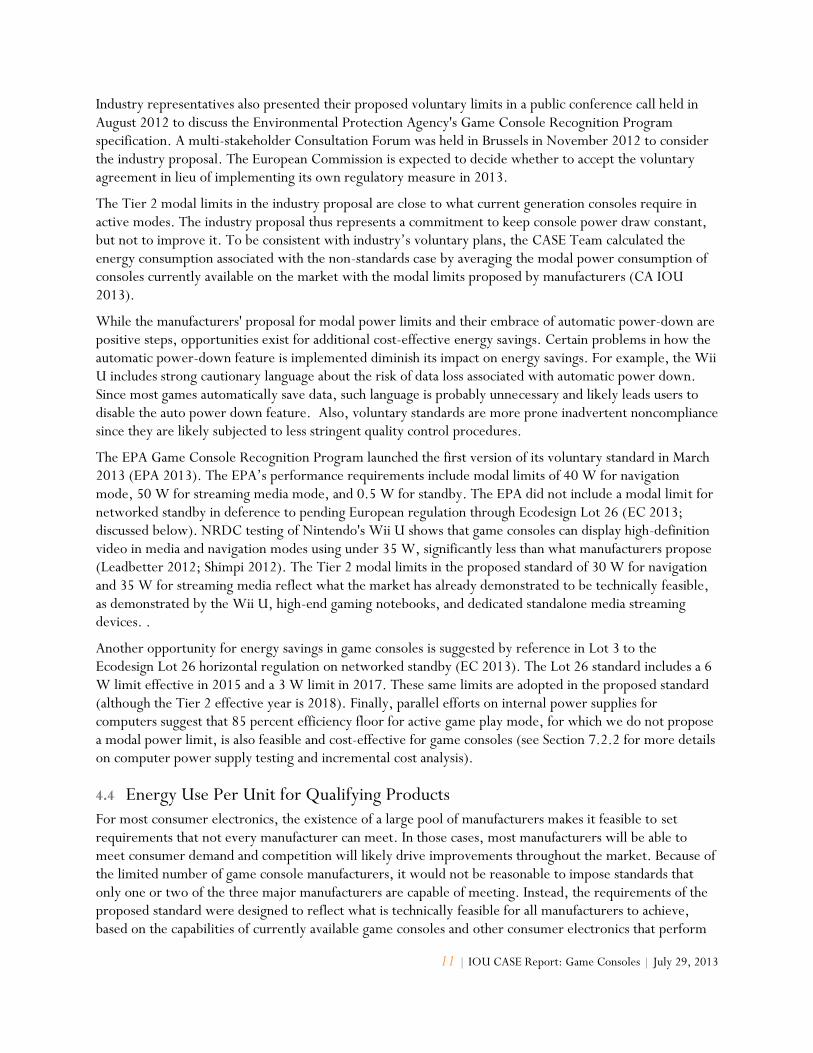
Each of the four requirements is described in more detail in Section 9.1. For specific code language, please see Section 10.2. Preliminary testing indicates that Nintendo’s Wii U game console is likely to exceed the proposed Tier 1 hardware and software requirements and may even meet Tier 2 requirements. It remains to be seen whether the next generation consoles from Microsoft and Sony will perform similarly. The CASE Team analysis estimated the typical energy consumption of qualifying products by 1) restricting the sales-weighted average modal power consumption of all consoles sold in or after the relevant effective date to that permitted by the proposed standard as a result of both modal power limits and a minimum power supply efficiency; and 2) altering the duty cycle to reflect a decrease of 50 percent in the amount of time spent in navigation mode and a decrease of 25 percent in the amount of time spent in game play and media modes to reflect compliance with the auto power down requirement. All time shifted away from navigation, game play, and media modes was distributed proportionately between networked standby and standby mode assuming the maximum power use permitted by the standard for each mode. It was also assumed that 80 percent of game consoles comply with the optimal APD practices. The power draw and unit energy consumption were calculated for each operating mode for three different types of qualifying products: 1) those that meet only the auto power down requirement (see Table 4.2; 2) those that meet all Tier 1 requirements (see Table 4.3); and 3) those that meet all Tier 2 requirements (see Table 4.6). A summary of product energy consumption for unqualified and all three classes of qualified products is presented in Table 4.7.
13 | IOU CASE Report: Game Consoles | July 29, 2013
Table 4.2 Average Energy Use for Auto Power Down - Qualifying Products
Operating Mode Power Draw
(W)
Annual Operating
Hours
Unit Energy Consumption
(kWh/yr)
Game Play 77 575 44.5
Media 72 387 27.9
Navigation 74 230 17.0
Standby 1 7,425 7.0
Networked Standby 7 149 1.0
Duty-Weighted Average
11 8,765 97.4
Source: Duty cycle calculated from CEA 2010 (see CA IOU 2013 for methodology). Modal power data is an average of power used by consoles currently on the market (testing by NRDC, Ecova, and Energy Solutions; see CAIOUs 2013) and the voluntary modal power limits proposed by manufacturers.
Table 4.3 Average Energy Use for Tier 1 - Qualifying Products
Operating Mode Power Draw
(W)
Annual Operating
Hours
Unit Energy Consumption
(kWh/yr)
Game Play 75 605 45.6
Media 58 407 23.6
Navigation 40 460 18.4
Standby 0.5 7,150 3.6
Networked Standby 6 144 0.9
Duty-Weighted Average
9 8,765 79.2
Source: Duty cycle calculated from CEA 2010 (see CA IOU 2013 for methodology). Modal power data is an average of power used by consoles currently on the market (testing by NRDC, Ecova, and Energy Solutions; see CAIOUs 2013) and the voluntary modal power limits proposed by manufacturers.
14 | IOU CASE Report: Game Consoles | July 29, 2013
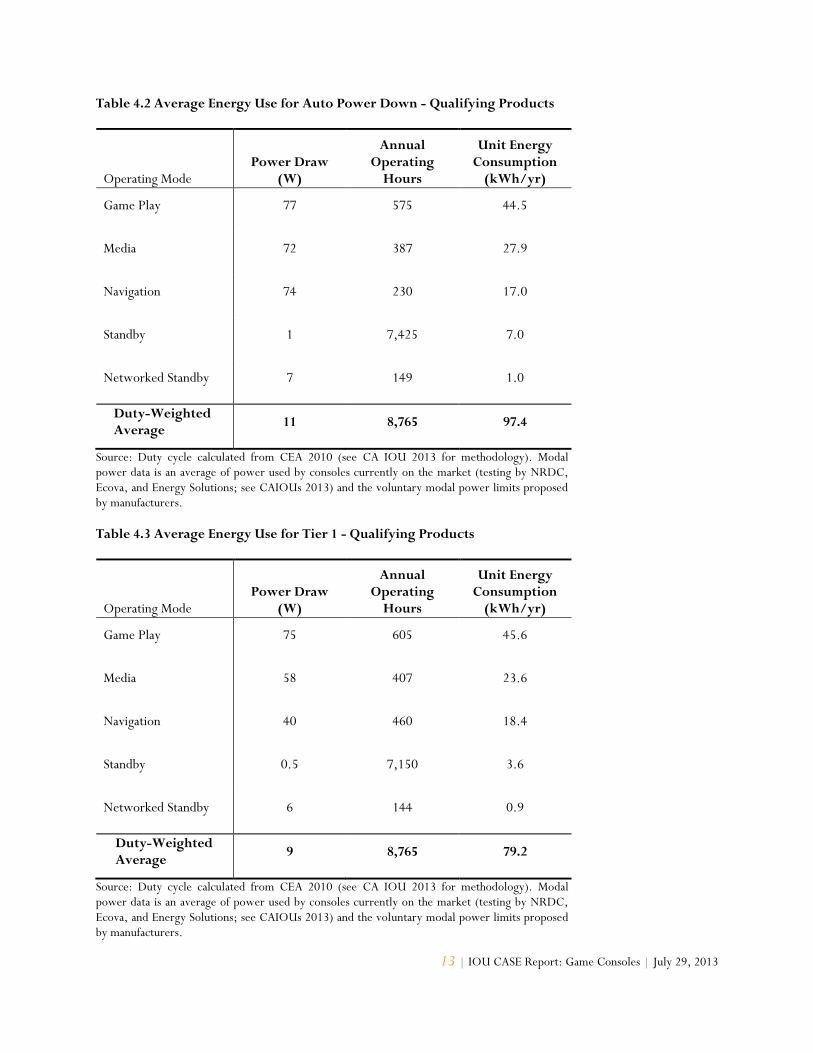
Table 4.4 Average Energy Use for Tier 2 - Qualifying Products
Operating Mode Power
Draw (W) Annual
Operating Hours
Unit Energy Consumption
(kWh/yr)
Game Play 46 605 27.5
Media 35 407 14.2
Navigation 30 460 13.8
Standby 0.5 7,150 3.6
Networked Standby 3 144 0.4
Duty-Weighted Average
5 8,765 47.8
Source: Duty cycle calculated from CEA 2010 (see CA IOU 2013 for methodology). Modal power data is an average of power used by consoles currently on the market (testing by NRDC, Ecova, and Energy Solutions; see CAIOU 2013) and the voluntary modal power limits proposed by manufacturers.
Table 4.5 Duty Cycle-Weighted Average Energy Use for All Qualified Products
Product Class Power Draw
(W) Annual
Operating Hours
Unit Energy Consumption
(kWh/yr)
Current Sales 13 8,765 117.9
APD 11 8,765 97.4
Tier 1 9 8,765 79.2
Tier 2 5 8,765 47.8
Source: Duty cycle calculated from CEA 2010 (see CA IOU 2013 for methodology). Modal power data is an average of power used by consoles currently on the market (testing by NRDC, Ecova, and Energy Solutions; see CAIOUs 2013) and the voluntary modal power limits proposed by manufacturers.

15 | IOU CASE Report: Game Consoles | July 29, 2013
5 Market Saturation & Sales
5.1 Current Market Situation
Game console sales in the U.S. increased dramatically between 2000 and 2009. However, sales have been uneven since then, which may be due in part to the current generation of consoles reaching the end of their product life. As depicted in Figure 5.1, game console sales are anticipated to recover somewhat from low sales in 2012 but reach a plateau over the next decade as the market reaches saturation.
Figure 5.1 Historical and Projected California Game Console Sales
Source: Prepared using sales data for the Americas for the years 2005-2011 from VGChartz.
5.1.1 Total Stock and Annual Sales
This report assumes that the sales that have been estimated to have taken place in California between 2005 and 2012 represent the total stock of consoles currently in use statewide, which is reasonable given a typical console lifetime of six years. This report further assumes that average annual game console sales will be essentially level for the foreseeable future. In addition, U.S. sales data published by VGChartz were scaled to represent statewide sales using California’s share of the U.S. population (12 percent). Table 5.1 shows the estimated total stock and annual sales used in this analysis.

16 | IOU CASE Report: Game Consoles | July 29, 2013
Table 5.1 Projected California Game Console Sales and Stock
Annual Sales Stock
Year
Units
(millions)
Units
(millions)
2012 1.94 12.37
2013 1.95 12.71
2014 1.95 12.46
2015 1.95 12.24
2016 1.95 11.87
2017 1.95 11.76
2018 1.95 11.77
2019 1.95 11.77
2020 1.95 11.77
2021 1.95 11.77
2022 1.95 11.77
2023 1.95 11.77
Source: Extrapolated using sales data for the Americas for the years 2005-2011 from VGChartz assuming that console sales recover from low levels seen in 2012 but reach a plateau over the next decade as the market reaches saturation
5.2 Future Market Adoption of High Efficiency Options
Game console manufacturers may adopt a voluntary agreement in addition to, or in conjunction with, the EPA Game Console Recognition Program and proceedings in the European Commission. Since auto power down is a relatively simple and inexpensive measure to implement, it is likely that console manufacturers will continue include this feature in future product launches but they are not obligated to do so. Manufacturers have already incorporated auto power down in current products via firmware upgrades, but the manner in which it is implemented could benefit from further improvements to prevent users from disabling it.
The modal power limits in the proposed standard are below the limits likely to appear in any industry voluntary agreement. It is also unlikely that manufacturers would voluntarily report power use during active game play mode.

17 | IOU CASE Report: Game Consoles | July 29, 2013
6 Savings Potential
6.1 Statewide California Energy Savings
This report develops an analysis of the savings potential of the proposed game console energy efficiency standard by comparing the energy use of game consoles in two future scenarios: 1) the case in which no standard is adopted; and 2) the case in which the proposed standard is adopted. The difference between the two cases represents the savings potential for the proposed standard.
As previously described in Section 5, this analysis assumes a positive, but decreasing rate of growth in both sales and stock throughout the period of analysis. Furthermore, because no products currently meet the proposed standards, and lacking standards, would not be expected to do so by the effective date, future game console energy use in the case that no standards are adopted will be the same as the current energy use. The statewide total peak demand and annual energy consumption for annual sales and the total values associated with complete stock turnover are shown in Table 6.1.
Table 6.1 California Statewide Non-Standards Case Energy Use & Peak DemandA
Year
Annual Sales Stock
Annual Energy Consumption
(GWh/yr)
Peak Demand
(MW)
Annual Energy Consumption
(GWh/yr)
Peak Demand
(MW)
2013 190 3.6 1,400 27
2014 190 3.6 1,300 26
2015 (Tier 1 Effective Date)
190 3.6 1,300 25
2016 190 3.6 1,200 24
2017 190 3.6 1,200 23
2018 (Tier 2 Effective Date)
190 3.6 1,100 22
2019 190 3.6 1,100 22
2020 190 3.6 1,100 22
2021 190 3.6 1,100 22
2022 190 3.6 1,100 22
2023 190 3.6 1,100 22
Source: Duty cycle calculated from CEA 2010 (see CA IOU 2013 for methodology). Modal power data is an average of power used by consoles currently on the market (testing by NRDC, Ecova, and Energy Solutions; see CA IOUs 2013) and the voluntary modal power limits proposed by manufacturers. A Statewide demand (and demand reduction) is quantified as coincident peak load (and coincident peak load reduction), the simultaneous peak load for all end users, as defined by Koomey and Brown (2002).
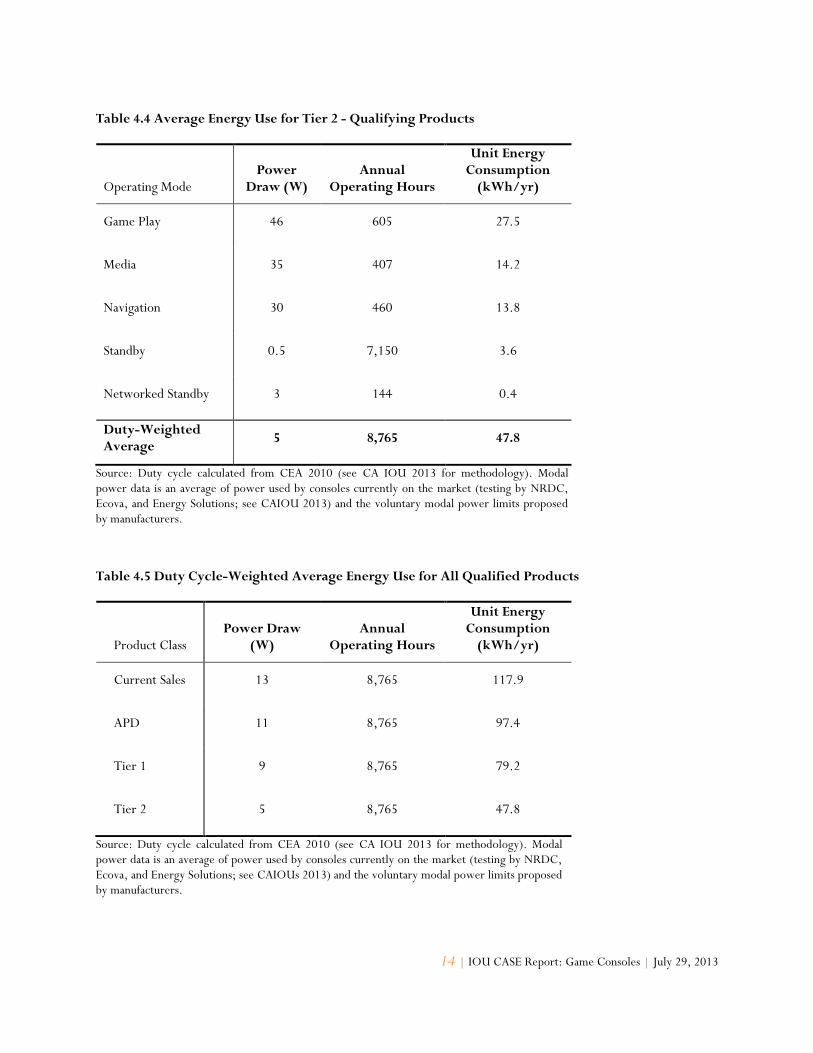
The peak demand and energy consumption associated with game consoles in the case in which standards are adopted is shown in Table 6.2.
18 | IOU CASE Report: Game Consoles | July 29, 2013
Table 6.2 California Statewide Standards Case Energy Use & Peak DemandA
Year
Annual Sales Stock
Annual Energy Consumption
(GWh/yr)
Peak Demand
(MW)
Annual Energy Consumption
(GWh/yr)
Peak Demand
(MW)
2013 190 3.6 1,400 27
2014 190 3.6 1,300 26
2015 (Tier 1 Effective Date)
150 2.8 1,300 24
2016 150 2.8 1,200 22
2017 150 2.8 1,100 20
2018 (Tier 2 Effective Date)
93 1.8 910 17
2019 93 1.8 820 16
2020 93 1.8 720 14
2021 93 1.8 670 13
2022 93 1.8 610 12
2023 93 1.8 560 11
Source: Duty cycle calculated from CEA 2010 (see CA IOU 2013 for methodology). Modal power data is an average of power used by consoles currently on the market (testing by NRDC, Ecova, and Energy Solutions; see CAIOUs 2013) and the voluntary modal power limits proposed by manufacturers. A Statewide demand (and demand reduction) is quantified as coincident peak load (and coincident peak load reduction), the simultaneous peak load for all end users, as defined by Koomey and Brown (2002).
The difference between peak demand and energy consumption in the standards case and the no-standards case is shown in Table 6.3.
19 | IOU CASE Report: Game Consoles | July 29, 2013
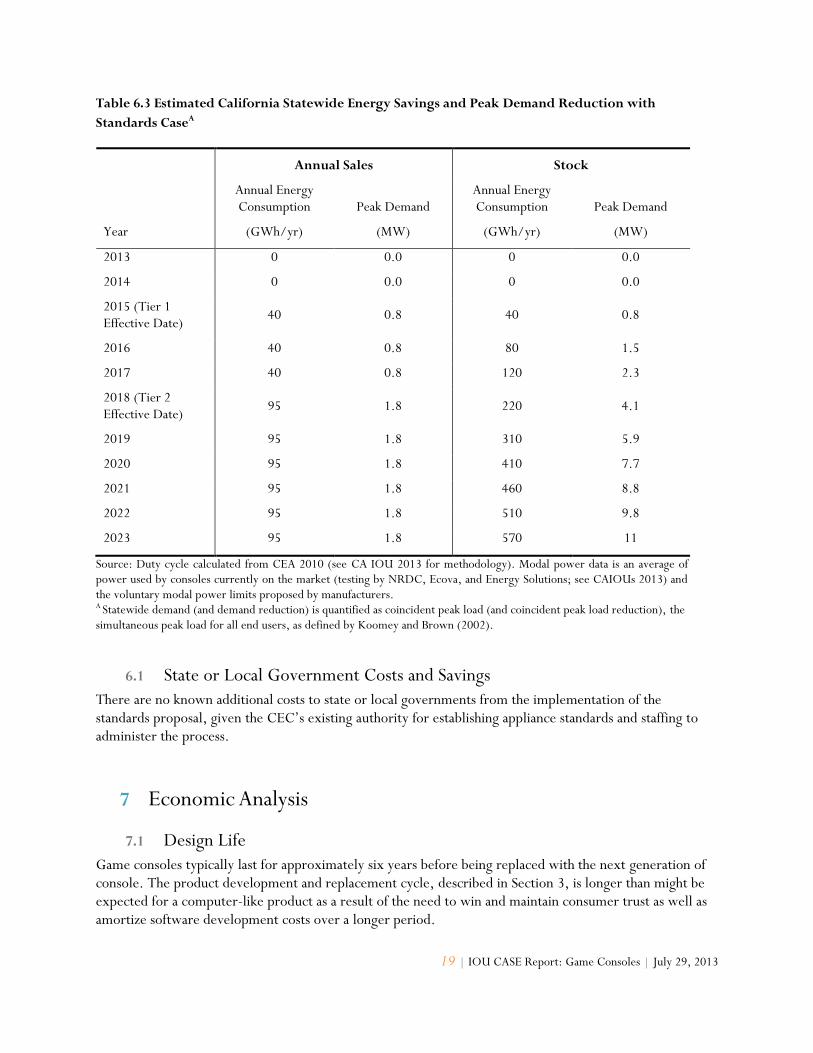
Table 6.3 Estimated California Statewide Energy Savings and Peak Demand Reduction with
Standards CaseA
Year
Annual Sales Stock
Annual Energy Consumption
(GWh/yr)
Peak Demand
(MW)
Annual Energy Consumption
(GWh/yr)
Peak Demand
(MW)
2013 0 0.0 0 0.0
2014 0 0.0 0 0.0
2015 (Tier 1 Effective Date)
40 0.8 40 0.8
2016 40 0.8 80 1.5
2017 40 0.8 120 2.3
2018 (Tier 2 Effective Date)
95 1.8 220 4.1
2019 95 1.8 310 5.9
2020 95 1.8 410 7.7
2021 95 1.8 460 8.8
2022 95 1.8 510 9.8
2023 95 1.8 570 11
Source: Duty cycle calculated from CEA 2010 (see CA IOU 2013 for methodology). Modal power data is an average of power used by consoles currently on the market (testing by NRDC, Ecova, and Energy Solutions; see CAIOUs 2013) and the voluntary modal power limits proposed by manufacturers. A Statewide demand (and demand reduction) is quantified as coincident peak load (and coincident peak load reduction), the simultaneous peak load for all end users, as defined by Koomey and Brown (2002).
6.1 State or Local Government Costs and Savings
There are no known additional costs to state or local governments from the implementation of the standards proposal, given the CEC’s existing authority for establishing appliance standards and staffing to administer the process.
7 Economic Analysis
7.1 Design Life
Game consoles typically last for approximately six years before being replaced with the next generation of console. The product development and replacement cycle, described in Section 3, is longer than might be expected for a computer-like product as a result of the need to win and maintain consumer trust as well as amortize software development costs over a longer period.
20 | IOU CASE Report: Game Consoles | July 29, 2013
7.2 Incremental Cost
Game console pricing is somewhat different from the pricing of other consumer electronics products. Profits from game title sales enable console manufacturers to tolerate low (or even negative) margins on hardware sales, at least for a short period following the launch of a new console generation (Hittinger 2012). Rapidly falling component costs allow margins to expand in subsequent years. In addition, new models of the same console generation may include new configuration and accessory options and new pricing structures. For example, the premium Xbox 360 at initial release in 2005 cost $399.99 in the U.S. (Surette 2005), but two years later a new model with six times the storage capacity was released at an even higher price point ($479.99; Microsoft 2007a), while the original model's price was dropped to $349.99 (Microsoft 2007b). As a result of the complexity of game console pricing strategies, the costs of efficiency improvements, such as the ones prescribed by the proposed standards, are not as clearly linked to the prices paid by consumers as they are for other types of consumer electronics.
The maximum incremental cost that would be in the public's interest to pay in the current year for the modifications that would allow game consoles to comply with Tier 1 and Tier 2 standards is equal to the financial value of the energy savings that such standards would capture. Since the savings would not be captured until the Tier 1 and Tier 2 effective years, the base cost, the cost of Tier 1 compliance, and the cost of Tier 2 compliance were each discounted in the years following the current year to account for the optimization of production costs. Empirical evidence indicates that nominal console prices typically decrease during the consoles lifetime by 25-50 percent. To develop a conservative estimate of the total cost that would be justified by the proposed standards, the CASE Team assumed a 15 percent reduction in nominal prices as the cumulative production of game consoles doubles, which is equivalent to the application of a 3 percent annual reduction. The energy cost savings that Tier 1 of the proposed standard would generate are sufficient to justify an incremental cost of up to $25.52 in the current year. Including the Tier 2 energy cost savings would justify a total incremental cost of up to $49.35 in the current year.
Since there are no products currently available on the market that have demonstrated the ability to meet all of the proposed standards through independent testing, the incremental cost of buying a qualifying product is not precisely known. Auto power down can typically be accomplished via firmware upgrades for close to no cost per unit. Similarly, the cost of testing and reporting active game play power for each model sold would be negligible (averaged over all units sold). The likely incremental costs of the other two proposed requirements (modal power limits and minimum internal power supply efficiency) are discussed in more detail below.
7.2.1 Incremental Cost of Modal Power Limits
Testing of Nintendo's newest flagship console (the Wii U) by NRDC and others (Leadbetter 2012, Shimpi 2012), suggests that the 2012 release model is likely to approach or exceed both the Tier 1 and Tier 2 modal limits requirement of the proposed standards. Although networked standby mode has not been tested, displaying high-definition video in navigation and media modes appears to draw only 29-32 W (similar to what is required in Tier 2), while standby mode draws 0.2-0.6 W (0.3 W lower - 0.1 W higher than what is required in Tier 2). At the time of this writing, the suggested retail price for the basic version of the Wii U with 8 GB of on-board storage and built-in motion sensing capabilities is $299.99. This is the same as the retail price of an Xbox 360 S console package featuring 4 GB of storage and the Kinect motion-sensing accessory. The price of a package that includes the low-end PlayStation 3, which comes with a minimum of 250 GB of storage, and Sony's Move motion sensing accessory, is $339.98. Since the additional cost associated with the PlayStation system could easily be attributed to the cost of the extra storage it provides, the incremental cost of complying with modal power limits appears to be very low.
21 | IOU CASE Report: Game Consoles | July 29, 2013
The Ouya, a new game console funded through Kickstarter that debuted in June 2013, has been reported to draw under 5 W during active game play, while retailing for just $99 (Stevens 2013). Similarly, Apple TV can stream high definition video using less than 1 W (Shimpi 2013), and also retails for $99. While the technical capabilities of the Ouya will likely be somewhat lower than the capabilities of current generation Xbox and PlayStation devices, and with Apple TV providing a more limited set of functions than game consoles, the large difference in pricing suggests there is ample room for the major console manufacturers to reduce power usage without passing on significant costs to consumers.
To generate a conservative estimate of the benefits of the proposed standards, this analysis assumes that Tier 1 and Tier 2 modal limits will increase costs by $10 per console.
7.2.2 Incremental Cost of Minimum Internal Power Supply Efficiency
The incremental cost to the consumer of meeting the internal power supply requirement (85% at 37% loading) above the assumed current market levels of about 80% was conservatively estimated to be $7.08 based on desktop internal power supply data —one teardown analysis for cost by efficiency at 50% loading (iSuppli 2011), which determined the relationship between power supply balance of materials cost and efficiency and an 80 PLUS market study (Schare, Hummer and Ekrem 2011)—and an assumed markup of two times the power supply manufacturer incremental cost, added by the manufacturer of the game consoles and retailer. While desktops and game consoles are not the same product in whole, the internal power supply components are much the same.
7.2.3 Total Incremental Cost
Using the assumptions described above, the total incremental cost of Tier 1 and Tier 2 requirements was estimated to be $17.08 and $27.08, respectively, in 2013. In the first year that the Tier 1 standards would go into effect (2015), including reductions in cost due to experience, the per-unit cost of compliance was calculated to be $15.29. In the first year the Tier 2 standards would go into effect (2018), including reductions in cost due to experience, the total per-unit cost of Tier 1 and Tier 2 compliance was calculated to be $20.92.
7.3 Lifecycle Cost / Net Benefit
The lifecycle costs and benefits represent the sum of the annual benefits and costs of the proposed standard over the entire design life of the product. The lifecycle costs and benefits of the proposed standard per unit are shown in Table 7.1. The overall lifecycle cost/benefit ratio and present value of all costs and benefits of the standard is shown in Table 7.2.

22 | IOU CASE Report: Game Consoles | July 29, 2013
Table 7.1 Lifecycle Costs and Benefits per Unit for Qualifying Products with Standards Case
Year
Design Life
(years)
Lifecycle Costs per Unit
(Present Value $)
Lifecycle Benefits per Unit
(Present Value $)
Incremental Costs per
Unit Additional
Costs Total Costsa
Energy Savings per
Unitc Additional
Benefits Total
Benefits
2015 (Tier 1 Effective Date)
6 $15b n/a $15b $25 n/a $25
2018 (Tier 2 Effective Date)
6 $21b n/a $25b $61 n/a $61
a Cost calculations include 3% annual discounting from 2013 to account for production experience. b Calculated as follows: $0 for auto power down; $10 each for Tier 1 and Tier 2 modal limits (empirical evidence suggests $0); $12 for improved power supply efficiency (iSuppli 2011; Schare, Hummer and Ekrem 2011); adjusted per note (a) c Calculated using the CEC’s average statewide present value statewide energy rates that assume a 3% discount rate (CEC 2012).
Table 7.2 Lifecycle Cost Benefit Ratio for Qualifying Products and Net Present Values with Standards
Case
Tier
Lifecycle Benefit /
Cost Ratioa
Net Present Value ($)b
Per Unit First Year Sales
($) Stock Turnover
($)c
Tier 1 1.6 $9 $18,000,000 $61,000,000
Tier 2 2.9 $40 $79,000,000 $530,000,000
Total $591,000,000
a Total present value benefits divided by total present value costs. b Positive value indicates a reduced total cost of ownership over the life of the game console. c Stock Turnover NPV is calculated by taking the sum of the NPVs for the products purchased each year following the standard’s effective date through the stock turnover year (see note a above), plus any additional non-replacement units due to market growth, if applicable. For example, for a standard effective in 2015 applying to a product with a 6 year design life, the NPV of the products purchased in the 6th year (2020) includes lifecycle cost and benefits through 2025, and therefore, so does the Stock Turnover NPV. d For price of electricity, average annual rates were used, starting in the effective year (see Appendix D: for more details). It should be noted that while the proposed standard is cost-effective, it may be more cost-effective if using alternative rate structures. For example, marginal utility rates may more accurately reflect what customers save on utility bills as result of the standard.
23 | IOU CASE Report: Game Consoles | July 29, 2013
8 Acceptance Issues
8.1 Existing Standards
No mandatory standards currently exist for game console energy efficiency. The EPA, with support from the Department of Energy (DOE), has developed a voluntary standard through the EPA Game Console Recognition Program. The EPA standards include modal limits for streaming media, navigation and standby that are identical to the Tier 1 requirements proposed here. The European Commission is also in the process of developing game console energy efficiency standards, and is very close to adopting a horizontal modal power limit for networked standby. The Ecodesign Lot 26 networked standby standard is meant to be applicable to a variety of consumer electronics, including game consoles. The modal limits for networked standby proposed here are identical to the limits in Ecodesign Lot 26, with the only difference being that Tier 2 of Ecodesign Lot 26 (3 W limit) becomes effective in 2017 instead of 2018.The specific language of the proposed modal power limit standard draws from both the EPA Game Console Recognition Program as well as Ecodesign Lot 26.
Game consoles use either internal (Sony PlayStation) or external power supplies (Microsoft Xbox and Nintendo Wii and Wii U) to convert alternating current to direct current for use by electronic components. Nintendo’s power supplies are Class A external power supplies (single-voltage with a rated output of less than or equal to 250 W), and are subject to federal efficiency standards established by the DOE. The federal Class A external power supply standards are listed in Section 301 of the Energy Independence and Security Act of 2007, effective July 1, 2008.
The Microsoft Xbox 360 power supply is multi-voltage. While not currently subject to energy efficiency standards, non-class A external power supplies, are anticipated to be covered in the upcoming DOE Battery Chargers and External Power Supplies (BCEPs) rule, initially proposed in March 2012. This proposed rule would preempt any standards that California might establish under Title 20 as of the anticipated effective date of 2015.
Single-voltage external power supplies for certain consumer electronics, including laptop computers, mobile phones, printers, print servers, scanners, personal digital assistants (PDAs), and digital cameras are regulated by California's Title 20 appliance standards. Effective July 1, 2008, Title 20 requires that regulated external power supplies with a nameplate output of more than 51 W in active mode achieve an efficiency of at least 85 percent.
No mandatory federal or California state standards exist for internal power supplies. A private-sector company (Ecova) administers a voluntary certification for internal power supplies called "80 PLUS." 80 PLUS requires multi-output power supplies in computers and servers to be 80 percent or greater energy efficient at 20 percent, 50 percent, and 100 percent of rated load with a true power factor of 0.9 or greater. The test method used for 80 PLUS certification is the same test method used for the ENERGY STAR® standards for computers and servers and is also the one proposed for use in the Title 20 game console standard.
8.2 Product Cycle
Preliminary testing indicates that the Wii U currently meets all Tier 1 software and hardware requirements of the proposed standard. Manufacturers have not found it challenging to implement changes that enable game consoles to power down automatically, although the way in which it is implemented can be improved. It may be technically difficult and/or costly for manufacturers to reduce modal power
24 | IOU CASE Report: Game Consoles | July 29, 2013
consumption for media playback. The NRDC Test Procedure for Game Play may require additional refinement to ensure that fair, stable, and representative power levels can be reported. Similarly, the NRDC Connected and Ready Test Procedure requires additional development.
Nintendo has already released its next generation console, which went on sale in the U.S. in November 2012. Sony and Microsoft are expected to launch the next generations of their consoles in November 2013. The Tier 1 modal power limits in the proposed standards are only slightly lower than what current consoles require, so it should be feasible for manufacturers to make incremental improvements to be in compliance by the corresponding effective date. The Tier 1 modal power limits would not become effective until approximately the time an entirely new generation of consoles is released. As a result, manufacturers have a full product development cycle to include Tier 2 modal limits in the design process.
8.3 Stakeholder Positions
Refer to Invitation to Participate responses (CEC 2013) for stakeholder comments.
9 Environmental Impacts
9.1 Hazardous Materials
There are no known incremental hazardous materials impacts from the efficiency improvements as a result of the proposed standards.
9.2 Air Quality
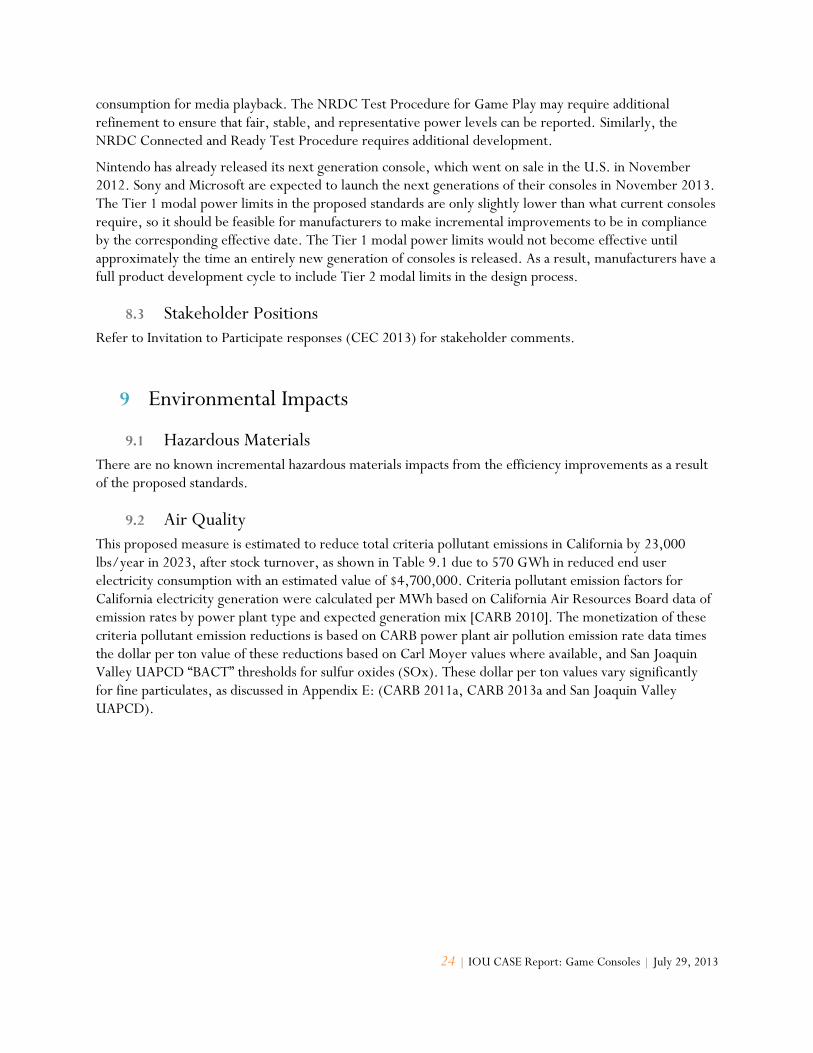
This proposed measure is estimated to reduce total criteria pollutant emissions in California by 23,000 lbs/year in 2023, after stock turnover, as shown in Table 9.1 due to 570 GWh in reduced end user electricity consumption with an estimated value of $4,700,000. Criteria pollutant emission factors for California electricity generation were calculated per MWh based on California Air Resources Board data of emission rates by power plant type and expected generation mix [CARB 2010]. The monetization of these criteria pollutant emission reductions is based on CARB power plant air pollution emission rate data times the dollar per ton value of these reductions based on Carl Moyer values where available, and San Joaquin Valley UAPCD “BACT” thresholds for sulfur oxides (SOx). These dollar per ton values vary significantly for fine particulates, as discussed in Appendix E: (CARB 2011a, CARB 2013a and San Joaquin Valley UAPCD).
25 | IOU CASE Report: Game Consoles | July 29, 2013
Table 9.1 Estimated California Criteria Pollutant Reduction Benefits (lbs/year) After Stock Turnover
lbs/year Carl Moyer
$/ton (2013) Monetization
ROG
16,000 $17,000 $140,000
NOx
54,000 $17,000 $470,000
SOx
5,600 $18,000 $52,000
PM2.5
23,000 $350,000 $4,000,000
Total
$4,700,000
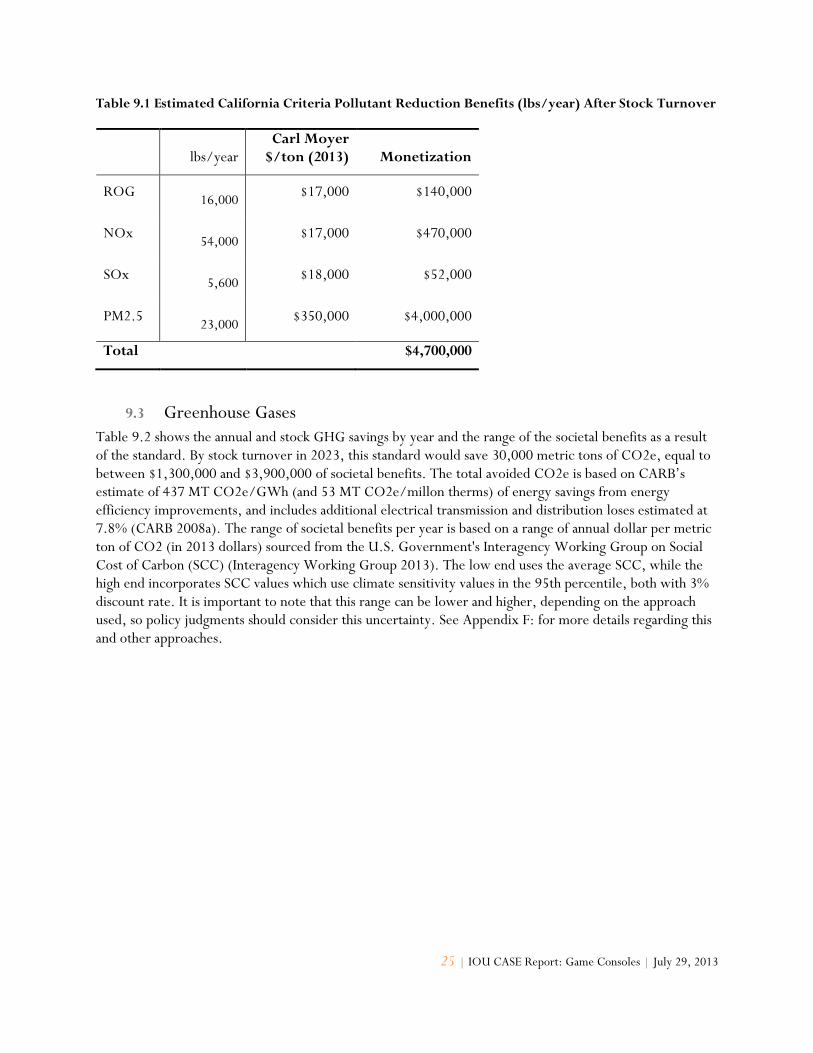
9.3 Greenhouse Gases
Table 9.2 shows the annual and stock GHG savings by year and the range of the societal benefits as a result of the standard. By stock turnover in 2023, this standard would save 30,000 metric tons of CO2e, equal to between $1,300,000 and $3,900,000 of societal benefits. The total avoided CO2e is based on CARB’s estimate of 437 MT CO2e/GWh (and 53 MT CO2e/millon therms) of energy savings from energy efficiency improvements, and includes additional electrical transmission and distribution loses estimated at 7.8% (CARB 2008a). The range of societal benefits per year is based on a range of annual dollar per metric ton of CO2 (in 2013 dollars) sourced from the U.S. Government's Interagency Working Group on Social Cost of Carbon (SCC) (Interagency Working Group 2013). The low end uses the average SCC, while the high end incorporates SCC values which use climate sensitivity values in the 95th percentile, both with 3% discount rate. It is important to note that this range can be lower and higher, depending on the approach used, so policy judgments should consider this uncertainty. See Appendix F: for more details regarding this and other approaches.

26 | IOU CASE Report: Game Consoles | July 29, 2013
Table 9.2 Estimated California Statewide Greenhouse Gas Savings and Cost Savings for Standards
Case
Year
Annual GHG Savings
(MT of CO2e/yr) Stock GHG Savings (MT of CO2e/yr)
Value of Stock GHG Savings -
low ($) Value of Stock GHG
Savings - high ($)
2013 0 0 $0 $0
2014 0 0 $0 $0
2015 2,100 2,100 $98,000 $280,000
2016 2,100 4,200 $200,000 $580,000
2017 2,100 6,400 $310,000 $920,000
2018 5,000 11,000 $550,000 $1,600,000
2019 5,000 16,000 $820,000 $2,500,000
2020 5,000 21,000 $1,100,000 $3,300,000
2021 5,000 24,000 $1,300,000 $3,900,000
2022 5,000 27,000 $1,500,000 $4,500,000
2023 5,000 30,000 $1,700,000 $5,100,000
27 | IOU CASE Report: Game Consoles | July 29, 2013
10 Recommendations
10.1 Recommended Standards Proposal
10.1.1 Auto Power Down
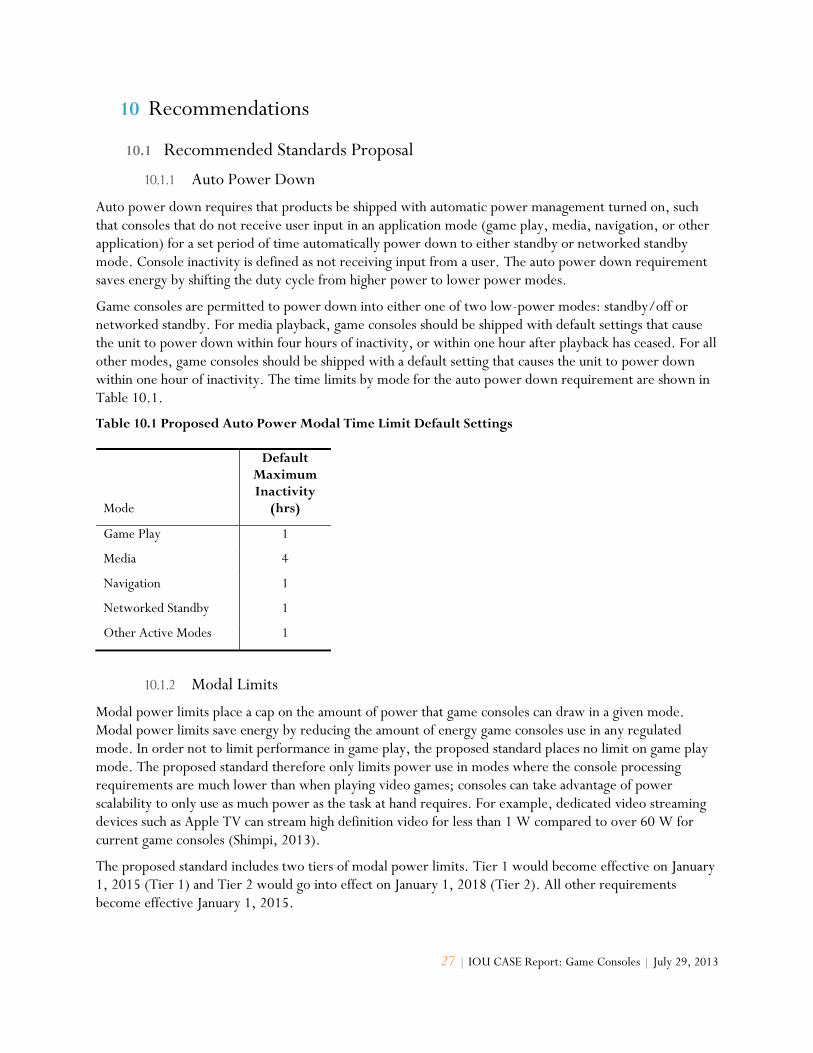
Auto power down requires that products be shipped with automatic power management turned on, such that consoles that do not receive user input in an application mode (game play, media, navigation, or other application) for a set period of time automatically power down to either standby or networked standby mode. Console inactivity is defined as not receiving input from a user. The auto power down requirement saves energy by shifting the duty cycle from higher power to lower power modes.
Game consoles are permitted to power down into either one of two low-power modes: standby/off or networked standby. For media playback, game consoles should be shipped with default settings that cause the unit to power down within four hours of inactivity, or within one hour after playback has ceased. For all other modes, game consoles should be shipped with a default setting that causes the unit to power down within one hour of inactivity. The time limits by mode for the auto power down requirement are shown in Table 10.1.
Table 10.1 Proposed Auto Power Modal Time Limit Default Settings
Mode
Default Maximum Inactivity
(hrs)
Game Play 1
Media 4
Navigation 1
Networked Standby 1
Other Active Modes 1
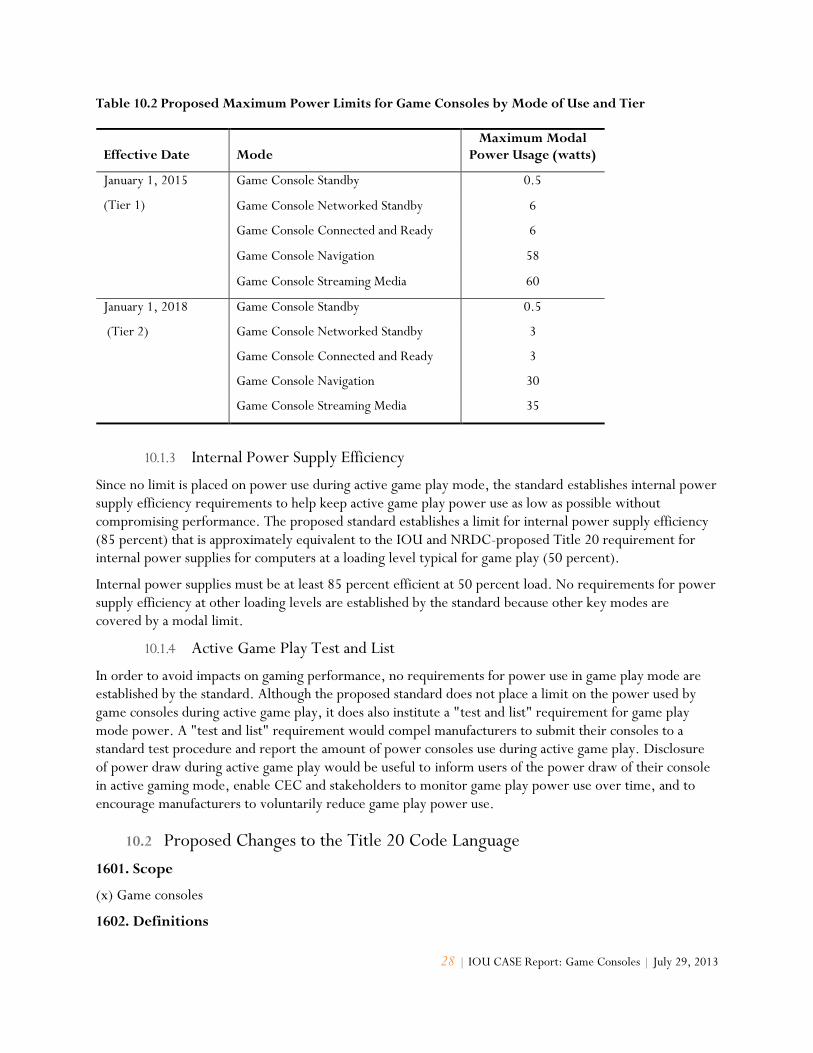
10.1.2 Modal Limits
Modal power limits place a cap on the amount of power that game consoles can draw in a given mode. Modal power limits save energy by reducing the amount of energy game consoles use in any regulated mode. In order not to limit performance in game play, the proposed standard places no limit on game play mode. The proposed standard therefore only limits power use in modes where the console processing requirements are much lower than when playing video games; consoles can take advantage of power scalability to only use as much power as the task at hand requires. For example, dedicated video streaming devices such as Apple TV can stream high definition video for less than 1 W compared to over 60 W for current game consoles (Shimpi, 2013).
The proposed standard includes two tiers of modal power limits. Tier 1 would become effective on January 1, 2015 (Tier 1) and Tier 2 would go into effect on January 1, 2018 (Tier 2). All other requirements become effective January 1, 2015.
28 | IOU CASE Report: Game Consoles | July 29, 2013
Table 10.2 Proposed Maximum Power Limits for Game Consoles by Mode of Use and Tier
Effective Date Mode Maximum Modal
Power Usage (watts)
January 1, 2015
(Tier 1)
Game Console Standby 0.5
Game Console Networked Standby
Game Console Connected and Ready
6
6
Game Console Navigation 58
Game Console Streaming Media 60
January 1, 2018
(Tier 2)
Game Console Standby 0.5
Game Console Networked Standby
Game Console Connected and Ready
3
3
Game Console Navigation 30
Game Console Streaming Media 35
10.1.3 Internal Power Supply Efficiency
Since no limit is placed on power use during active game play mode, the standard establishes internal power supply efficiency requirements to help keep active game play power use as low as possible without compromising performance. The proposed standard establishes a limit for internal power supply efficiency (85 percent) that is approximately equivalent to the IOU and NRDC-proposed Title 20 requirement for internal power supplies for computers at a loading level typical for game play (50 percent).
Internal power supplies must be at least 85 percent efficient at 50 percent load. No requirements for power supply efficiency at other loading levels are established by the standard because other key modes are covered by a modal limit.
10.1.4 Active Game Play Test and List
In order to avoid impacts on gaming performance, no requirements for power use in game play mode are established by the standard. Although the proposed standard does not place a limit on the power used by game consoles during active game play, it does also institute a "test and list" requirement for game play mode power. A "test and list" requirement would compel manufacturers to submit their consoles to a standard test procedure and report the amount of power consoles use during active game play. Disclosure of power draw during active game play would be useful to inform users of the power draw of their console in active gaming mode, enable CEC and stakeholders to monitor game play power use over time, and to encourage manufacturers to voluntarily reduce game play power use.
10.2 Proposed Changes to the Title 20 Code Language
1601. Scope
(x) Game consoles
1602. Definitions
29 | IOU CASE Report: Game Consoles | July 29, 2013
(a) General
"Game Console" means a standalone computer-like device whose primary use is to play video games. Game Consoles use a hardware architecture based in part on typical computer components (e.g., central processors, system memory, graphics processors, video memory, and storage drives). The primary input for Game Consoles are special hand held controllers rather than a mouse and keyboard. Game Consoles are also equipped with audiovisual outputs for use with televisions as the primary display, rather than (or in addition to) an external or integrated display. These devices do not typically use a conventional personal computer (PC) operating system, but often perform a variety of media functions such as: optical disc playback, digital video and picture viewing, and digital music playback. Handheld gaming devices, typically battery powered and intended for use with an integral display as the primary display, are not considered game consoles.
(x) Game Consoles
"Auto Power Down" means the ability of a game console to enter either game console sleep or game console standby/off mode after a defined period of time.
"Game Console Accessory Charging State" means the condition in which a game console is providing power to one or more accessories for the purpose of battery charging. This condition may exist simultaneously with any other mode.
“Game Console Active Mode” means a condition in which the equipment is plugged into a power source and at least one of the main function(s) providing the intended service of the equipment has been activated, such as game console navigation mode, game console media mode, game console game play mode, or game console application mode.
"Game Console Application Mode" means a game console active mode in which a user is actively using an application other than a game or media player for a purpose other than navigation to features and settings.
"Game Console Connected and Ready Mode” means a game console mode in which the console can be reactivated and switched into a game console active mode by way of a remotely initiated trigger from a voice command, movement, gesture, or other environmental cue.
"Game Console Internal Power Supply Unit (PSU)" means a component internal to the game console casing designed to convert ac voltage from the mains to dc voltage(s) for the purpose of powering the game console components.
"Game Console Media Mode" means a game console active mode in which the console is actively playing audio or video content, or has completed playback but has not been switched to another mode.
"Game Console Standby Mode" means a standby mode in which the game console has no active network link and no saved hardware state, and cannot be switched into an active mode by way of a trigger from a network connection but may be capable of being switched into game console accessory charging state by the establishment of a physical or wireless connection with an accessory or providing other secondary functions such as maintenance.
"Game Console Networked Standby Mode" means the condition in which the console but can be reactivated and switched into a game console active mode by way of a remotely initiated trigger from a network connection.
30 | IOU CASE Report: Game Consoles | July 29, 2013
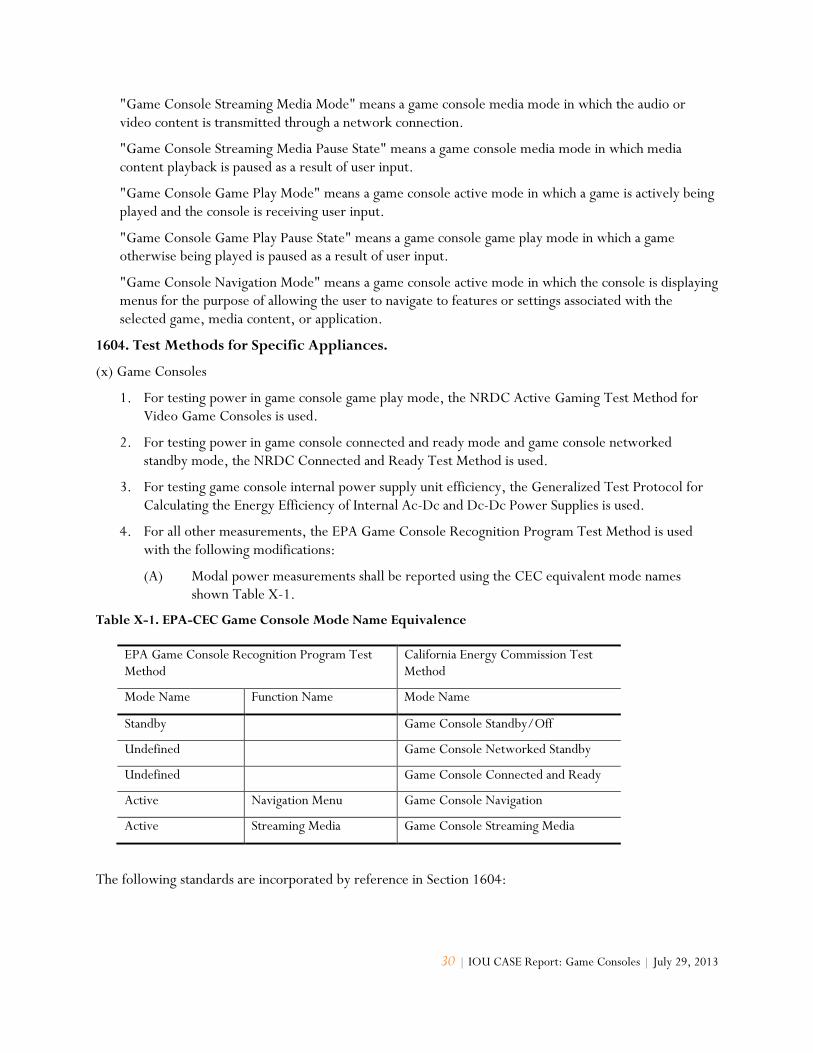
"Game Console Streaming Media Mode" means a game console media mode in which the audio or video content is transmitted through a network connection.
"Game Console Streaming Media Pause State" means a game console media mode in which media content playback is paused as a result of user input.
"Game Console Game Play Mode" means a game console active mode in which a game is actively being played and the console is receiving user input.
"Game Console Game Play Pause State" means a game console game play mode in which a game otherwise being played is paused as a result of user input.
"Game Console Navigation Mode" means a game console active mode in which the console is displaying menus for the purpose of allowing the user to navigate to features or settings associated with the selected game, media content, or application.
1604. Test Methods for Specific Appliances.
(x) Game Consoles
1. For testing power in game console game play mode, the NRDC Active Gaming Test Method for Video Game Consoles is used.
2. For testing power in game console connected and ready mode and game console networked standby mode, the NRDC Connected and Ready Test Method is used.
3. For testing game console internal power supply unit efficiency, the Generalized Test Protocol for Calculating the Energy Efficiency of Internal Ac-Dc and Dc-Dc Power Supplies is used.
4. For all other measurements, the EPA Game Console Recognition Program Test Method is used with the following modifications:
(A) Modal power measurements shall be reported using the CEC equivalent mode names shown Table X-1.
Table X-1. EPA-CEC Game Console Mode Name Equivalence
EPA Game Console Recognition Program Test Method
California Energy Commission Test Method
Mode Name Function Name Mode Name
Standby Game Console Standby/Off
Undefined Game Console Networked Standby
Undefined Game Console Connected and Ready
Active Navigation Menu Game Console Navigation
Active Streaming Media Game Console Streaming Media
The following standards are incorporated by reference in Section 1604:
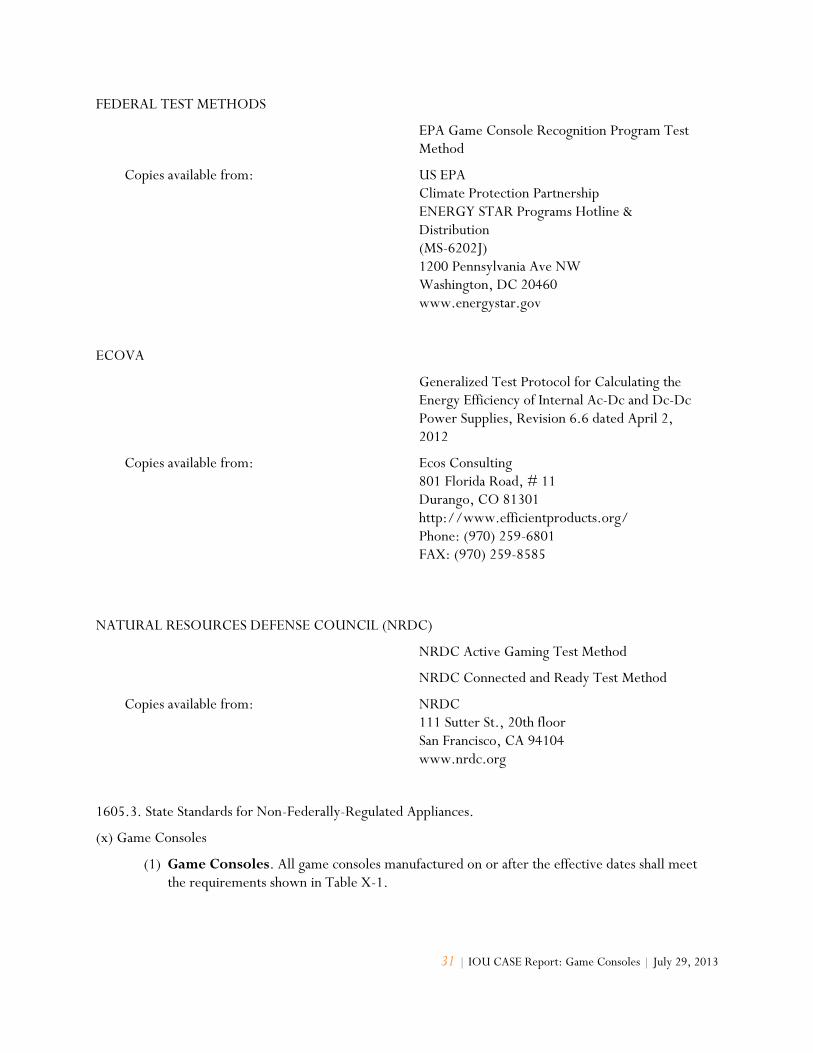
31 | IOU CASE Report: Game Consoles | July 29, 2013
FEDERAL TEST METHODS
EPA Game Console Recognition Program Test Method
Copies available from: US EPA Climate Protection Partnership ENERGY STAR Programs Hotline & Distribution (MS-6202J) 1200 Pennsylvania Ave NW Washington, DC 20460 www.energystar.gov
ECOVA
Generalized Test Protocol for Calculating the Energy Efficiency of Internal Ac-Dc and Dc-Dc Power Supplies, Revision 6.6 dated April 2, 2012
Copies available from: Ecos Consulting 801 Florida Road, # 11 Durango, CO 81301 http://www.efficientproducts.org/ Phone: (970) 259-6801 FAX: (970) 259-8585
NATURAL RESOURCES DEFENSE COUNCIL (NRDC)
NRDC Active Gaming Test Method
NRDC Connected and Ready Test Method
Copies available from: NRDC 111 Sutter St., 20th floor San Francisco, CA 94104 www.nrdc.org
1605.3. State Standards for Non-Federally-Regulated Appliances.
(x) Game Consoles
(1) Game Consoles. All game consoles manufactured on or after the effective dates shall meet the requirements shown in Table X-1.
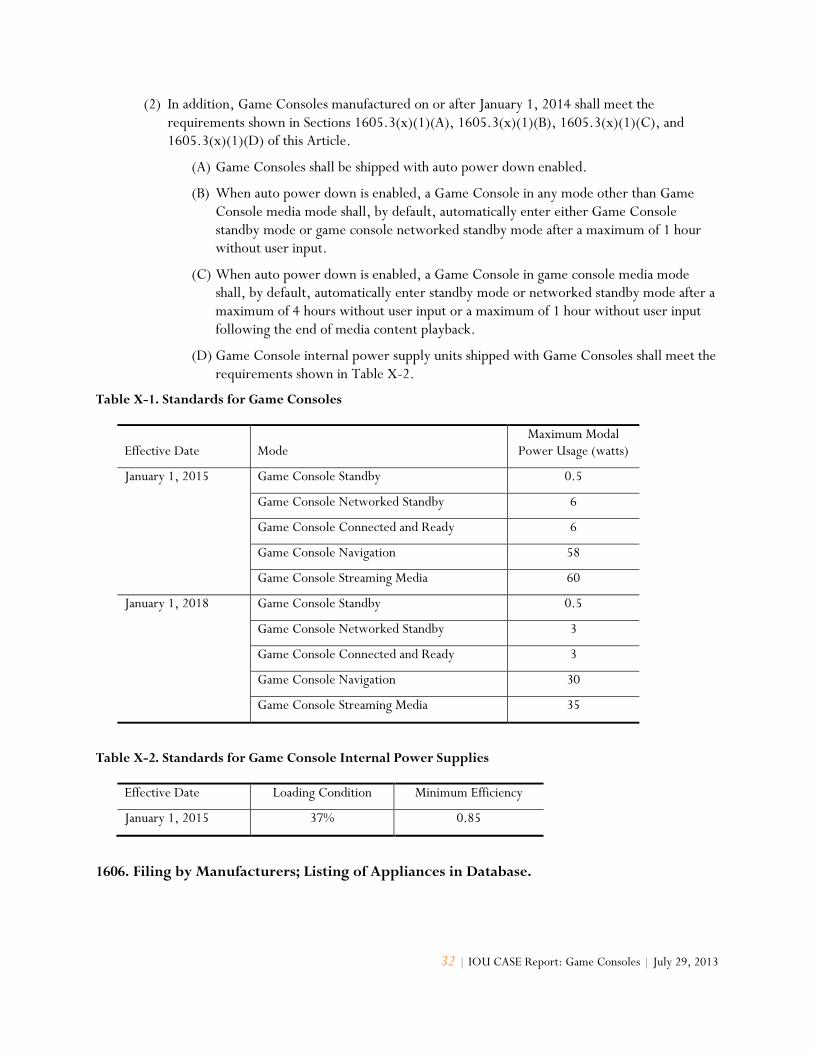
32 | IOU CASE Report: Game Consoles | July 29, 2013
(2) In addition, Game Consoles manufactured on or after January 1, 2014 shall meet the requirements shown in Sections 1605.3(x)(1)(A), 1605.3(x)(1)(B), 1605.3(x)(1)(C), and 1605.3(x)(1)(D) of this Article.
(A) Game Consoles shall be shipped with auto power down enabled.
(B) When auto power down is enabled, a Game Console in any mode other than Game Console media mode shall, by default, automatically enter either Game Console standby mode or game console networked standby mode after a maximum of 1 hour without user input.
(C) When auto power down is enabled, a Game Console in game console media mode shall, by default, automatically enter standby mode or networked standby mode after a maximum of 4 hours without user input or a maximum of 1 hour without user input following the end of media content playback.
(D) Game Console internal power supply units shipped with Game Consoles shall meet the requirements shown in Table X-2.
Table X-1. Standards for Game Consoles
Effective Date Mode Maximum Modal
Power Usage (watts)
January 1, 2015 Game Console Standby 0.5
Game Console Networked Standby 6
Game Console Connected and Ready 6
Game Console Navigation 58
Game Console Streaming Media 60
January 1, 2018 Game Console Standby 0.5
Game Console Networked Standby 3
Game Console Connected and Ready 3
Game Console Navigation 30
Game Console Streaming Media 35
Table X-2. Standards for Game Console Internal Power Supplies
Effective Date Loading Condition Minimum Efficiency
January 1, 2015 37% 0.85
1606. Filing by Manufacturers; Listing of Appliances in Database.

33 | IOU CASE Report: Game Consoles | July 29, 2013
Table X. Data Submittal Requirements for Inclusion in Table V of Title 20.
Appliance Required Information
Permissible Answers
X Game Consoles
Game Console Standby Mode Power (watts)
Game Console Networked Standby Mode Power (watts)
Game Console Connected and Ready Mode Power (watts)
Game Console Navigation Mode Power (watts)
Game Console Streaming Media Mode Power (watts)
Game Console Game Play Mode Power (watts)
Game Console Internal Power Supply Unit Efficiency at 37% Load
*"Identifier" information as described in Section 1602(a).
10.1 Implementation Plan
The expected implementation for this standards proposal is for the CEC to proceed with its appliance standards rulemaking authority, from pre-rulemaking and rulemaking through adoption, and for manufacturer compliance upon effective date.
34 | IOU CASE Report: Game Consoles | July 29, 2013
References Ackerman, Frank and Elizabeth A. Stanton. 2012. Stockholm Environment Institute. Climate Risks and
Carbon Prices: Revising the Social Cost of Carbon. http://www.economics-ejournal.org/economics/journalarticles/2012-10. Economics. April 4.
Anthony, S. 2013. “Xbox One vs. PS4: How the next-generation console specs compare.” Posted June 21,
2013. Accessed July 2013 at http://www.extremetech.com/gaming/156273-xbox-720-vs-ps4-
vs-pc-how-the-hardware-specs-compare.
Brown, Richard E. and Jonathan G. Koomey. 2002. "Electricity Use in California: Past Trends and Present
Usage Patterns." Energy Policy (also LBNL-47992). vol. 31, no. 9. July. pp. 849-864.
Calwell, C. & T. Reeder. 2002. Power Supplies: A Hidden Opportunity for Energy Savings. Natural Resources Defense Council. http://www.nrdc.org/air/energy/appliance/app2.pdf. Accessed January 29, 2013.
[CA IOU] California Investor Owned Utilities (Southern California Edison, Pacific Gas and Electric Company, San Diego Gas and Electric Company, Southern California Gas Company). 2013. “Game Consoles: Response to California Energy Commission 2013 Pre-Rulemaking Appliance Efficiency Invitation to Participate.” Docket Number 12-AAER-2A; Consumer Electronics.
[CARB] California Air Resources Board. 2008a. AB 32 Technical Stakeholder Working Group Meeting. Cost-Effectiveness. http://www.arb.ca.gov/cc/scopingplan/economics-sp/meetings/060308/ce_white_paper.pdf. June 3.
__. 2008b. Climate Change Scoping Plan Appendices Volume II: Analysis and Documentation. http://www.arb.ca.gov/cc/scopingplan/document/appendices_volume2.pdf. December
__. 2010. Proposed Regulation for a California Renewable Electricity Standard Staff Report: Initial Statement of Reasons Appendix D. http://www.arb.ca.gov/regact/2010/res2010/res10isor.pdf. Accessed July 24, 2013.
__. 2011a. California Air Resources Board. Appendix C: Cost Effectiveness Calculation Methodology. http://www.arb.ca.gov/msprog/moyer/guidelines/2011gl/appc_3_10_11.pdf. March 10.
__. 2011b. Emission Reduction Offsets Transaction Cost Summary Report for 2011. http://www.arb.ca.gov/nsr/erco/erco.htm.
__. 2012. Emission Reduction Offsets Transaction Cost Summary Report for 2012. http://www.arb.ca.gov/nsr/erco/erco.htm.
__. 2013a. Mail-Out #MSC 13-09. http://www.arb.ca.gov/msprog/mailouts/msc1309/msc1309.pdf. March 25.
__. 2013b. California Air Resources board Quarterly Auction 3, May 2013 – Summary Results Report. www.arb.ca.gov/cc/capandtrade/auction/may-2013/results.pdf.
35 | IOU CASE Report: Game Consoles | July 29, 2013
[CEA] Consumer Electronics Association. 2010. “Consumer Electronics Association Gaming and Energy Study.” Arlington, VA. September 2010.
[CEC] California Energy Commission. 2012. Adopted California Energy Commission Demand Forecast Report 2012-2022. Mid-Case Final Demand Forecast. Updated September 19, 2012.
__. 2013. Responses to the Invitation to Participate in the 2013 Appliance Efficiency Rulemaking. http://www.energy.ca.gov/appliances/2013rulemaking/documents/responses/.
[DOE] United States Department of Energy. 2012. Market Assessment and Markup Spreadsheet. Microsoft Excel. http://www.regulations.gov/#!documentDetail;D=EERE-2008-BT-STD-0005-0082.
__. 2013. Energy Conservation Program: Energy Conservation Standards for Standby Mode and Off Mode for Microwave Ovens. http://www.regulations.gov/#!docketDetail;rpp=10;po=0;D=EERE-2011-BT-STD-0048. June 17.
[DOL] United States Department of Labor. 2012. Bureau of Labor Statistics, CPI Inflation Calculator.
http://www.bls.gov/data/inflation_calculator.htm. Accessed June 13, 2013.
[EC] European Commission. 2008. Adopted Regulation for Standby and Off Mode, European Commission Ecodesign Directive Lot 6: Standby and Off-Mode. Effective January 7, 2009. Available online at: http://www.eceee.org/Eco_design/products/standby.
__. 2012. Consultation Forum ENTR Lot 3, European Commission Ecodesign Directive Lot ENTR 3: Sound and imaging equipment: DVD/video players and recorders, video projectors, video game consoles. November 9, 2012. http://www.eceee.org/Eco_design/products/ecomultimedia.
__. 2013. Draft Regulation for Networked Standby. European Commission Ecodesign Directive Lot 26: Networked Standby Losses of Energy Using Products. http://www.eceee.org/Eco_design/products/Lot26_networked_standby_losses.
Ecova. 2013. 80 PLUS® Performance Specification Program. http://www.plugloadsolutions.com/80PlusPowerSupplies.aspx.
[EPA] United States Environmental Protection Agency. 2013. “U.S. Environmental Protection Agency (EPA) Recognition Program for Game Consoles Performance Requirements v. 1.0”. http://energystar.gov/products/specs/node/146.
[EPRI] Electric Power Research Institute and Ecova. 2012. “Generalized Test Protocol for Calculating the Energy Efficiency of Internal Ac-Dc and Dc-Dc Power Supplies,” revision 6.6, April 2, 2012. http://efficientpowersupplies.epri.com/pages/Latest_Protocol/Generalized_Internal_Power_Supply_Efficiency_Test_Protocol_R6.6.pdf.
Hittinger, E., K. Mullins & I. Azevedo. 2012. “Electricity Consumption and Energy Savings Potential of Video Game Consoles in the United States.” Energy Efficiency 1-15. Digital Object Identifier: 10.1007/s12053-012-9152-z. Date of Publication: March 31, 2012.
36 | IOU CASE Report: Game Consoles | July 29, 2013
Horii, Brian and Dr. Jim Williams, Energy and Environmental Economics. 2013. CPUC Workshop on Societal Cost Test. http://www.cpuc.ca.gov/NR/rdonlyres/E7263960-03C4-4BB2-8FD2-2FBF7DAD3436/0/SCTWorkshop6102013.pdf. June.
Hruska, J. 2013. “Xbox One and PS4: Analyzing their support for 4K video and gaming.” Posted May 28,
2013. Access July 2013 at http://www.extremetech.com/gaming/156790-xbox-one-and-ps4-
analyzing-their-support-for-4k-video-and-gaming.
InquiringMind. 2013. “Wii U: Not Enough Bandwidth?” Posted January 17, 2013. Accessed July 2013 at
http://www.notenoughshaders.com/2013/01/17/wiiu-memory-story/.
[Interagency Working Group] Interagency Working Group on Social Cost of Carbon, United States
Government. 2013. Technical Support Document: Technical Update of the Social Cost of Carbon
for Regulatory Impact Analysis Under Executive Order 12866.
http://www.whitehouse.gov/sites/default/files/omb/inforeg/social_cost_of_carbon_for_ria_20
13_update.pdf.
iSuppli. 2011 “Cost of Efficiency,” prepared for Energy Solutions. Microsoft PowerPoint. Submitted by Marijana Vukicevic and Ahmed Abdallah.
Johnson, Laurie T. and Chris Hope. 2012. Journal of Environmental Studies and Sciences, Journal no. 13412. The social cost of carbon in U.S. regulatory impact analyses: an introduction and critique.
http://www.eenews.net/assets/2012/09/17/document_gw_05.pdf. September 12.
Koomey, J. S. Berard. M. Sanchez, & H. Wong. 2010. “Implications of Historical Trends in the Electrical Efficiency of Computing” Annals of the History of Computing 33 (3): 46 – 54. Digital Object Identifier: 10.1109/MAHC.2010.28. Date of Publication: March 29, 2010.
Leadbetter, R. 2012. “Wii U blitzes PS3 and 360 as the 'greenest' console.” Eurogamer. http://www.eurogamer.net/articles/digitalfoundry-wii-u-is-the-green-console. Accessed February 14, 2013.
Microsoft Corporation. 2007a. “Microsoft Unveils Xbox 360 Elite.” Archived at: http://web.archive.org/web/20070405185941/http://www.xbox.com/en-US/community/news/2007/0327-microsoftunveilsxbox360elite.htm. Accessed February 14, 2013.
__. 2007b. “Microsoft Lowers Xbox 360 Price.” Archived at: http://web.archive.org/web/20070820211136/http://www.xbox.com/en-US/community/news/2007/0806-consoleprice.htm. Accessed February 14, 2013.
Nordman, B. 2012. Research Scientist at Lawrence Berkeley National Laboratory. Personal communication. August 29, 2012.
[NRDC] Natural Resources Defense Council. 2013. Active Gaming Test Method for Video Game Consoles. Submitted to CEC by NRDC, Docket# 12-AAER-2A; Consumer Electronics.
37 | IOU CASE Report: Game Consoles | July 29, 2013
San Joaquin Valley UAPCD. 2008. Final Staff Report: Update to Rule 2201 Best Available Control Technology (BACT) Cost Effectiveness Thresholds. http://www.valleyair.org/busind/pto/bact/May%202008%20BACT%20cost%20effectiveness%20threshold%20update%20staff%20report.pdf. May 14.
Shedeen, Jesse. 2010. “Xbox 360 vs. PlayStation 3: The Hardware Throwdown.” Posted August 26, 2010.
Accessed July 2013 at http://www.ign.com/articles/2010/08/26/xbox-360-vs-playstation-3-
the-hardware-throwdown.
Shimpi, A. L. 2010. “Welcome to Valhalla: Inside the New 250GB Xbox 360 Slim.” AnandTech. http://www.anandtech.com/show/3774/welcome-to-valhalla-inside-the-new-250gb-xbox-360-slim. Accessed February 14, 2013.
__. 2012. “Nintendo Wii U Teardown.” AnandTech. http://www.anandtech.com/show/6465/nintendo-wii-u-teardown. Accessed February 14, 2013
__. 2013. “The Xbox One: Hardware Analysis and Comparison to PlayStation 4.” Posted May 22, 2013.
Accessed July 2013 at http://www.anandtech.com/show/6972/xbox-one-hardware-compared-
to-playstation-4/2.
[SMN] Sony Computer Entertainment Inc., Microsoft Corporation, & Nintendo Co., Ltd. “Energy Efficiency of Games Consoles: Draft Outline Proposal to Further Improve the Energy Consumption of Games Consoles.” http://ec.europa.eu/enterprise/policies/sustainable-business/ecodesign/product-groups/sound-imaging/files/console_maker_proposal_en.pdf. Accessed December 10, 2012.
Stevens, T. 2013. Ouya Review (founding backer edition). http://www.engadget.com/2013/04/03/ouya-review-founding-backer-edition/. Accessed April 29, 2013.
Surette, T. 2005. “Xbox 360 Pricing Revealed: $299 and $399 Models Due at Launch.” Gamespot. http://www.gamespot.com/news/xbox-360-pricing-revealed-299-and-399-models-due-at-launch-6131245. Accessed February 14, 2013.
Tickled_Pink. 2012. “Ouya console already getting support from major publishers.” Online Forum on
AtariAge.com. Posted July 31, 2012. Accessed July, 2013 at
http://atariage.com/forums/topic/200948-ouya-console-already-getting-support-from-major-
publishers/.
[VGChartz] VGChartz. 2012. “Global Hardware By Platform.” http://www.vgchartz.com/hw_annual_summary.php. Accessed July 25, 2012.
Westwater, William. Personal communication. July 15, 2013.
[Wikipedia] 2012. “History of Video Games.” http://en.wikipedia.org/wiki/History_of_video_games. Accessed October 15, 2012.
38 | IOU CASE Report: Game Consoles | July 29, 2013
__. 2013a. “Xbox 360.” http://en.wikipedia.org/wiki/Xbox 360. Accessed July 2013.
__. 2013b. “PlayStation 3.” http://en.wikipedia.org/wiki/PlayStation 3. Accessed July 2013.
__. 2013c. “Wii.” http://en.wikipedia.org/wiki/Wii. Accessed July 2013.
__. 2013d. “Wii U.” http://en.wikipedia.org/wiki/Wii U. Accessed July 2013.
__. 2013e. “PlayStation 4.” http://en.wikipedia.org/wiki/PlayStation 4. Accessed July 2013.
__. 2013f. “Xbox One.” http://en.wikipedia.org/wiki/Xbox One. Accessed July 2013.
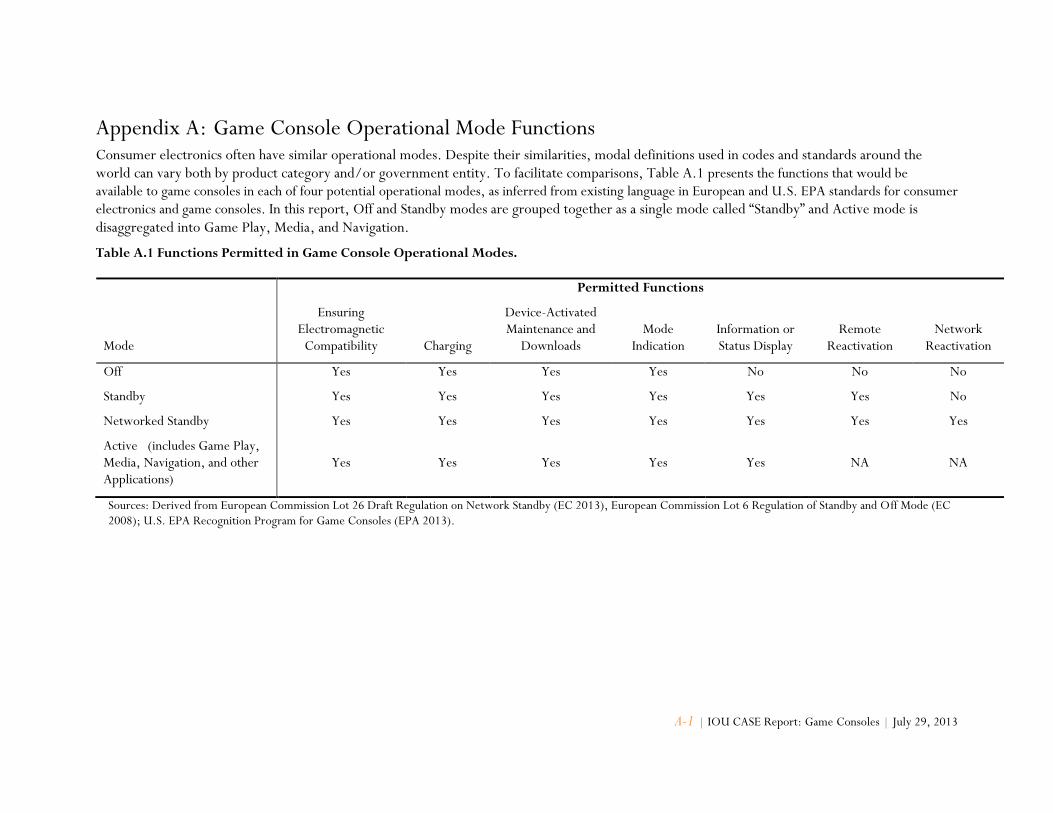
A-1 | IOU CASE Report: Game Consoles | July 29, 2013
Appendix A: Game Console Operational Mode Functions Consumer electronics often have similar operational modes. Despite their similarities, modal definitions used in codes and standards around the world can vary both by product category and/or government entity. To facilitate comparisons, Table A.1 presents the functions that would be
available to game consoles in each of four potential operational modes, as inferred from existing language in European and U.S. EPA standards for consumer
electronics and game consoles. In this report, Off and Standby modes are grouped together as a single mode called “Standby” and Active mode is disaggregated into Game Play, Media, and Navigation.
Table A.1 Functions Permitted in Game Console Operational Modes.
Mode
Permitted Functions
Ensuring Electromagnetic
Compatibility Charging
Device-Activated Maintenance and
Downloads Mode
Indication Information or Status Display
Remote Reactivation
Network Reactivation
Off Yes Yes Yes Yes No No No
Standby Yes Yes Yes Yes Yes Yes No
Networked Standby Yes Yes Yes Yes Yes Yes Yes
Active (includes Game Play, Media, Navigation, and other Applications)
Yes Yes Yes Yes Yes NA NA
Sources: Derived from European Commission Lot 26 Draft Regulation on Network Standby (EC 2013), European Commission Lot 6 Regulation of Standby and Off Mode (EC 2008); U.S. EPA Recognition Program for Game Consoles (EPA 2013).

B-1 | IOU CASE Report: Game Consoles | July 29, 2013
Appendix B: NRDC Active Game Play Test Method
Proposed Game Play Test Method for Video Game Consoles
Pierre Delforge, NRDC
July 29, 2013
1. Purpose
Active gaming continues to represent one of the highest energy uses in game consoles despite the
increased use of video playback and other non-gaming uses.
While NRDC does not advocate for limits on Game Play energy use in order not to interfere with console
performance in gaming mode, we believe it is important to be able to measure and report average power
use of video consoles in gaming mode.
The measurement and reporting of game play power use via a “Test and List” requirement will provide the
following benefits:
1. It will inform users of the power draw of their console in active gaming mode
2. It will bring transparency to console power consumption in Game Play mode, encouraging
manufacturers to reduce active gaming power use voluntarily
3. It will enable policymakers and stakeholders to monitor energy use in game play and to assess
the opportunity for future policy intervention.
2. Approach
NRDC’s proposed test method is designed to ensure that test results are representative and reproducible:
1. Representative: The test method provides a reasonable proxy for average game play energy
use in the real world.
2. Repeatable: The test method results can be reproduced consistently across multiple tests, within
a reasonable margin of error given that the objective of the test method is to support an
information requirement, not a mandatory power limit.
NATURAL RESOURCES DEFENSE COUNCIL
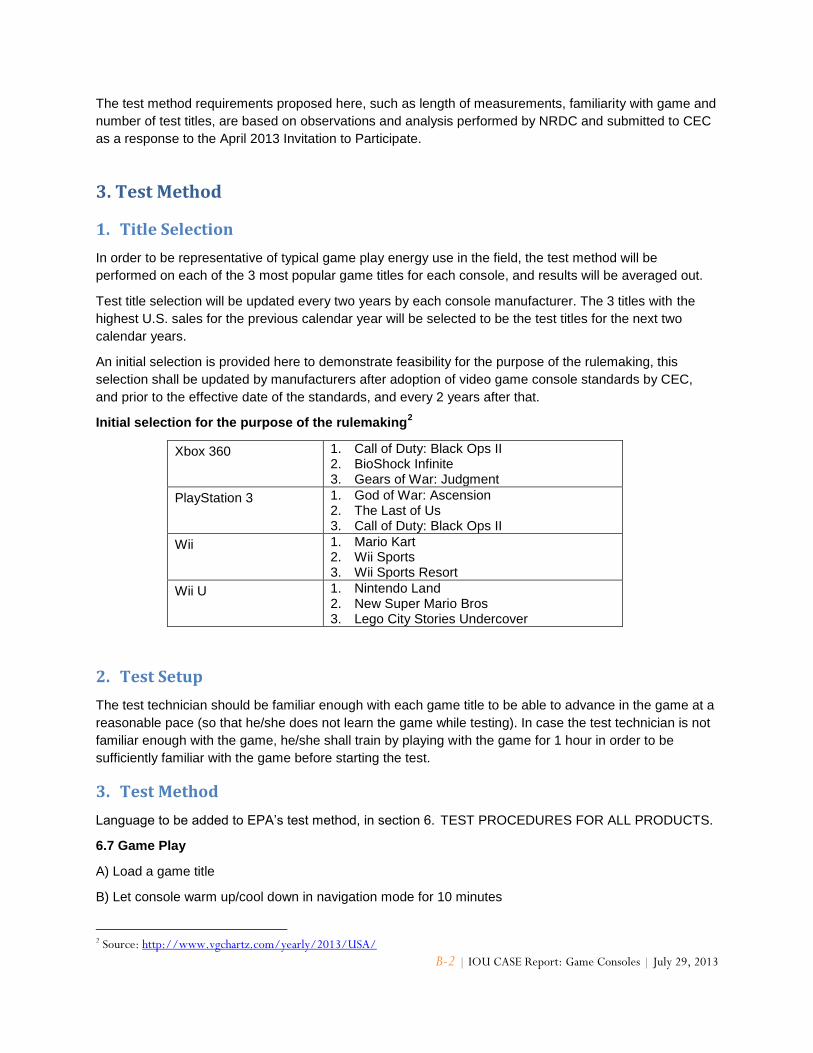
B-2 | IOU CASE Report: Game Consoles | July 29, 2013
The test method requirements proposed here, such as length of measurements, familiarity with game and
number of test titles, are based on observations and analysis performed by NRDC and submitted to CEC
as a response to the April 2013 Invitation to Participate.
3. Test Method
1. Title Selection
In order to be representative of typical game play energy use in the field, the test method will be
performed on each of the 3 most popular game titles for each console, and results will be averaged out.
Test title selection will be updated every two years by each console manufacturer. The 3 titles with the
highest U.S. sales for the previous calendar year will be selected to be the test titles for the next two
calendar years.
An initial selection is provided here to demonstrate feasibility for the purpose of the rulemaking, this
selection shall be updated by manufacturers after adoption of video game console standards by CEC,
and prior to the effective date of the standards, and every 2 years after that.
Initial selection for the purpose of the rulemaking2
Xbox 360 1. Call of Duty: Black Ops II 2. BioShock Infinite 3. Gears of War: Judgment
PlayStation 3 1. God of War: Ascension 2. The Last of Us 3. Call of Duty: Black Ops II
Wii 1. Mario Kart 2. Wii Sports 3. Wii Sports Resort
Wii U 1. Nintendo Land 2. New Super Mario Bros 3. Lego City Stories Undercover
2. Test Setup
The test technician should be familiar enough with each game title to be able to advance in the game at a
reasonable pace (so that he/she does not learn the game while testing). In case the test technician is not
familiar enough with the game, he/she shall train by playing with the game for 1 hour in order to be
sufficiently familiar with the game before starting the test.
3. Test Method
Language to be added to EPA’s test method, in section 6. TEST PROCEDURES FOR ALL PRODUCTS.
6.7 Game Play
A) Load a game title
B) Let console warm up/cool down in navigation mode for 10 minutes
2 Source: http://www.vgchartz.com/yearly/2013/USA/
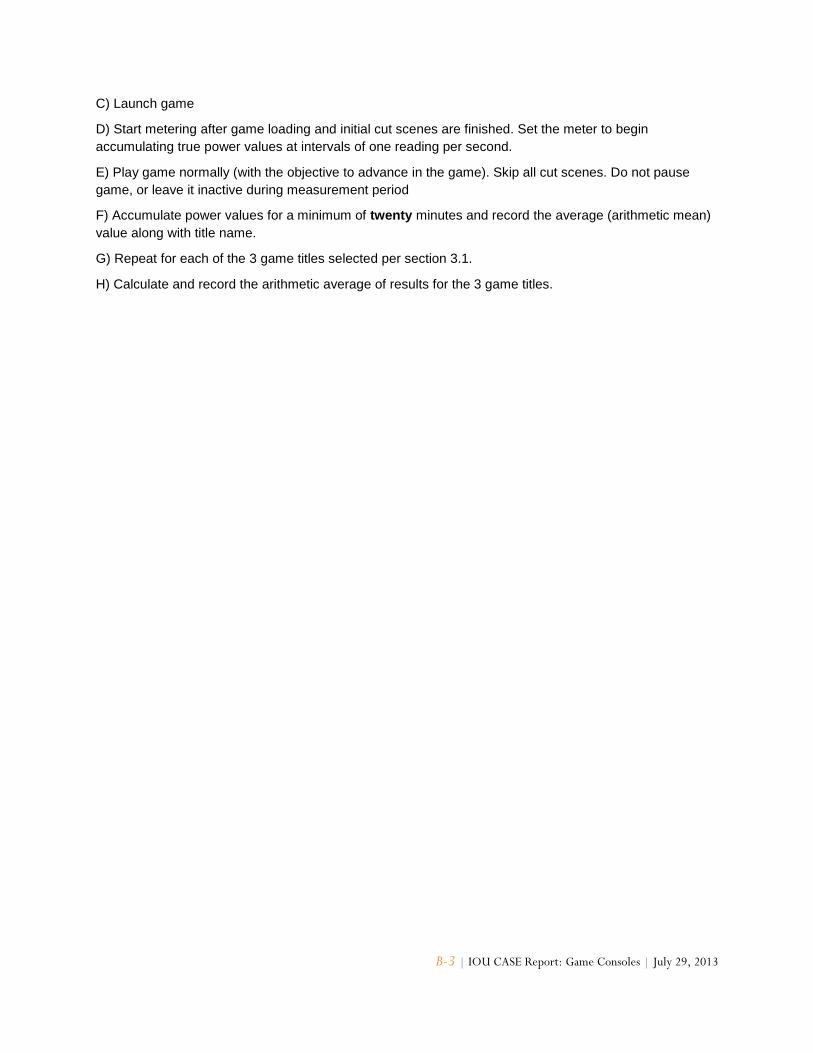
B-3 | IOU CASE Report: Game Consoles | July 29, 2013
C) Launch game
D) Start metering after game loading and initial cut scenes are finished. Set the meter to begin
accumulating true power values at intervals of one reading per second.
E) Play game normally (with the objective to advance in the game). Skip all cut scenes. Do not pause
game, or leave it inactive during measurement period
F) Accumulate power values for a minimum of twenty minutes and record the average (arithmetic mean)
value along with title name.
G) Repeat for each of the 3 game titles selected per section 3.1.
H) Calculate and record the arithmetic average of results for the 3 game titles.
C-1 | IOU CASE Report: Game Consoles | July 29, 2013
Appendix C: NRDC Connected and Ready Test Method
Proposed Connected and Ready Test Method for Video Game Consoles
1. Definition
(Adapted from http://www.aceee.org/files/proceedings/2012/data/papers/0193-000276.pdf)
Connected and Ready – The mode in which the console is not providing any primary or secondary
function, with the exception of an active network function and/or environmental condition monitoring
function (e.g. voice, motion…) to facilitate the activation of other modes. Connected and Ready allows the
reactivation of the product via a network signal, voice command, motion sensor or other similar means,
meaning the product need not be in active or idle mode to receive, process and act upon such signals
(trigger).
2. Test Method
Language to be added to EPA’s test method, in section 6. TEST PROCEDURES FOR ALL PRODUCTS.
6.8 Connected and Ready
For each Connected and Ready modes supported by the product and their combinations (networked,
voice, networked and voice, etc), perform the following:
A) Place the console in the desired Connected and Ready mode
B) Set the meter to begin accumulating true power values at intervals of one reading per second.
C) Accumulate power values for a minimum of five minutes and record the average (arithmetic mean)
value along with mode name and description.
D) Repeat for each of the connected and ready modes
E) Record the highest of all connected and ready mode values.
NATURAL RESOURCES DEFENSE COUNCIL
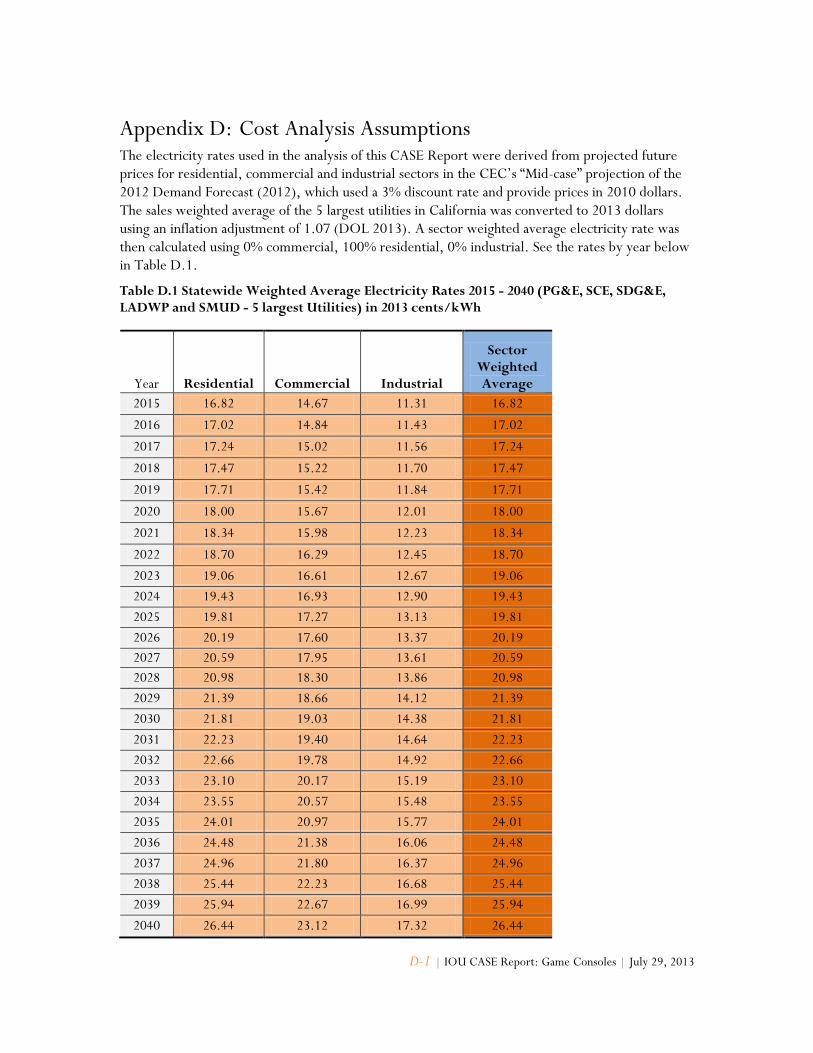
D-1 | IOU CASE Report: Game Consoles | July 29, 2013
Appendix D: Cost Analysis Assumptions The electricity rates used in the analysis of this CASE Report were derived from projected future prices for residential, commercial and industrial sectors in the CEC’s “Mid-case” projection of the 2012 Demand Forecast (2012), which used a 3% discount rate and provide prices in 2010 dollars. The sales weighted average of the 5 largest utilities in California was converted to 2013 dollars using an inflation adjustment of 1.07 (DOL 2013). A sector weighted average electricity rate was then calculated using 0% commercial, 100% residential, 0% industrial. See the rates by year below in Table D.1.
Table D.1 Statewide Weighted Average Electricity Rates 2015 - 2040 (PG&E, SCE, SDG&E, LADWP and SMUD - 5 largest Utilities) in 2013 cents/kWh
Year Residential Commercial Industrial
Sector Weighted Average
2015 16.82 14.67 11.31 16.82
2016 17.02 14.84 11.43 17.02
2017 17.24 15.02 11.56 17.24
2018 17.47 15.22 11.70 17.47
2019 17.71 15.42 11.84 17.71
2020 18.00 15.67 12.01 18.00
2021 18.34 15.98 12.23 18.34
2022 18.70 16.29 12.45 18.70
2023 19.06 16.61 12.67 19.06
2024 19.43 16.93 12.90 19.43
2025 19.81 17.27 13.13 19.81
2026 20.19 17.60 13.37 20.19
2027 20.59 17.95 13.61 20.59
2028 20.98 18.30 13.86 20.98
2029 21.39 18.66 14.12 21.39
2030 21.81 19.03 14.38 21.81
2031 22.23 19.40 14.64 22.23
2032 22.66 19.78 14.92 22.66
2033 23.10 20.17 15.19 23.10
2034 23.55 20.57 15.48 23.55
2035 24.01 20.97 15.77 24.01
2036 24.48 21.38 16.06 24.48
2037 24.96 21.80 16.37 24.96
2038 25.44 22.23 16.68 25.44
2039 25.94 22.67 16.99 25.94
2040 26.44 23.12 17.32 26.44
E-1 | IOU CASE Report: Game Consoles | July 29, 2013
Appendix E: Criteria Pollutant Emissions and Monetization
E.1 Criteria Pollutant Emissions Calculation
To calculate the statewide emissions rate for California, the incremental emissions between CARB’s high load and low load power generation forecasts for 2020 were divided by the incremental generation between CARB’s high load and low load power generation forecast for 2020. Incremental emissions were calculated based on the delta between California emissions in the high and low generation forecasts divided by the delta of total electricity generated in those two scenarios. This emission rate per MWh is intended to provide a benchmark of emission reductions attributable to energy efficiency measures that could help achieve the low load scenario instead of the high load scenario. While emission rates may change somewhat over time, 2020 was considered a representative year for this measure.
E.2 Criteria Pollutant Emissions Monetization
Avoided ambient ozone precursor and fine particulate air pollution benefits were monetized based on avoided control costs rather than damage costs due to the availability of emission control cost-effectiveness thresholds, as well as challenges in quantifying a specific value for damages per ton of pollutants.
Two sources of data for cost-effectiveness thresholds were evaluated. The first is Carl Moyer cost-effectiveness thresholds for ozone precursors and fine particulates (CARB 2011a, CARB 2013a and 2013b). The Carl Moyer program has provided incentives for voluntary reductions in criteria pollutant reductions from a variety of mobile combustion sources as well as stationary agricultural pumps that meet specified cost-effectiveness cut-offs.
The second is the San Joaquin Valley UAPCD Best-Available Control Technology (“BACT”) cost-effectiveness thresholds study. Pollution reduction technologies that are not yet demonstrated in practice (in which case they are required without a cost-effectiveness evaluation) can be required at new power plants and other sources if technologically feasible and within cost-effectiveness thresholds. San Joaquin Valley UAPCD conducted a state-wide study as the basis for updating their BACT thresholds in 2008.
This CASE report relies primarily on the Carl Moyer thresholds due to their state-wide nature and applicability to combustion sources3. In addition, the Carl Moyer fine particulate values for fine particulate apply to combustion sources with specific health impacts, while BACT thresholds include both combustion sources and dust. The Carl Moyer values are somewhat more conservative for ozone precursors than San Joaquin Valley UAPCD BACT thresholds, and significantly higher for fine particulate4.The Carl Moyer program does not address sulfur oxides, however, thus the San Joaquin BACT thresholds were used for this pollutant.
Price reports for California Emission Reduction Credit (ERCs, i.e. air pollution credits purchased to offset regulated emission increases) for 2011 and 2012 were also compared to the values selected
3 Further evaluation of the qualitative impacts of combustion fine particulate emissions from power generation and transportation sources may be beneficial. 4 We note that both the Carl Moyer and San Joaquin Valley UAPCD BACT cost-effectiveness thresholds for fine particulates fall within the wide range of fine particulate ERC trading prices in California in 2011 and 2012.
E-2 | IOU CASE Report: Game Consoles | July 29, 2013
in this CASE report. For each pollutant there is a wide range of ERC values per ton that are both higher and lower than the values per ton used in this CASE report [CARB 2011b and 2012]. Due to wide variability and low trading volumes, ERC values were evaluated for comparative purposes only.

F-1 | IOU CASE Report: Game Consoles | July 29, 2013
Appendix F: Greenhouse Gas Valuation Discussion The climate impacts of pollution from fossil fuel combustion and other human activities, including the greenhouse gas effect, present a major risk to global economies, public health and the environment. While there are uncertainties of the exact magnitude given the interconnectedness of ecological systems, at least three methods exist for estimating the societal costs of greenhouse gases: 1) the Damage Cost Approach 2) the Abatement Cost Approach and 3) the Regulated Carbon Market Approach. See below for more details regarding each approach.
F.1 Damage Cost Approach
In 2007, the U.S. Court of Appeals for the Ninth Circuit ruled that the National Highway Transportation Traffic Safety Administration (NHTSA) was required to assign a dollar value to benefits from abated carbon dioxide emissions. The court stated that while there are a wide range of estimates of monetary values, the price of carbon dioxide abatement is indisputably non-zero. In 2009, to meet the necessity of a consistent value for use by government agencies, the Obama Administration established the Interagency Working Group on the Social Cost of Carbon to establish official estimates (Johnson and Hope).
The Interagency Working Group primarily uses estimates of avoided damages from climate change which are valued at a price per ton of carbon dioxide, a method known as the damage cost approach.
F.1.1 Interagency Working Group Estimates
The Interagency Working Group SCC estimates, based on the damage cost approach, were calculated using three climate economic models called integrated assessment models which include the Dynamic Integrated Climate Economy (DICE), Policy Analysis of the Greenhouse Effect (PAGE), and Climate Framework for Uncertainty, Negotiation, and Distribution (FUND) models. These models incorporate projections of future emissions translated into atmospheric concentration levels which are then translated into temperature changes and human welfare and ecosystem impacts with inherent economic values. As part of the Federal rulemaking process, DOE publishes estimated monetary benefits using Interagency Working Group SCC values for each Trial Standard Level considered in their analyses, calculated as a net present value of benefits received by society from emission reductions and avoided damages over the lifetime of the product. The recent U.S. DOE Final Rulemaking for microwave ovens contains a Social Cost of Carbon section that presents the Interagency Working Group’s most recent SCC values over a range of discount rates (DOE 2013) as shown in Table F.1. The two dollar per metric ton values used in this CASE report were taken from the two highlighted columns, and converted to 2013 dollars.
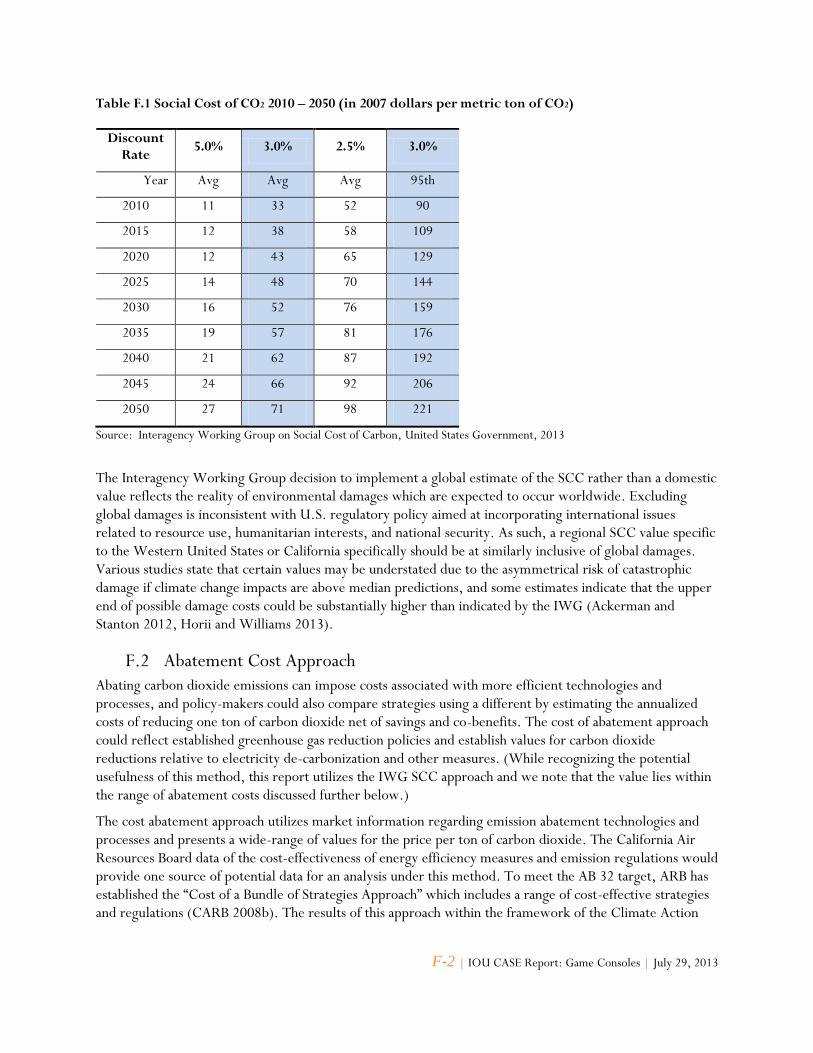
F-2 | IOU CASE Report: Game Consoles | July 29, 2013
Table F.1 Social Cost of CO2 2010 – 2050 (in 2007 dollars per metric ton of CO2)
Discount Rate
5.0% 3.0% 2.5% 3.0%
Year Avg Avg Avg 95th
2010 11 33 52 90
2015 12 38 58 109
2020 12 43 65 129
2025 14 48 70 144
2030 16 52 76 159
2035 19 57 81 176
2040 21 62 87 192
2045 24 66 92 206
2050 27 71 98 221
Source: Interagency Working Group on Social Cost of Carbon, United States Government, 2013
The Interagency Working Group decision to implement a global estimate of the SCC rather than a domestic value reflects the reality of environmental damages which are expected to occur worldwide. Excluding global damages is inconsistent with U.S. regulatory policy aimed at incorporating international issues related to resource use, humanitarian interests, and national security. As such, a regional SCC value specific to the Western United States or California specifically should be at similarly inclusive of global damages. Various studies state that certain values may be understated due to the asymmetrical risk of catastrophic damage if climate change impacts are above median predictions, and some estimates indicate that the upper end of possible damage costs could be substantially higher than indicated by the IWG (Ackerman and Stanton 2012, Horii and Williams 2013).
F.2 Abatement Cost Approach
Abating carbon dioxide emissions can impose costs associated with more efficient technologies and processes, and policy-makers could also compare strategies using a different by estimating the annualized costs of reducing one ton of carbon dioxide net of savings and co-benefits. The cost of abatement approach could reflect established greenhouse gas reduction policies and establish values for carbon dioxide reductions relative to electricity de-carbonization and other measures. (While recognizing the potential usefulness of this method, this report utilizes the IWG SCC approach and we note that the value lies within the range of abatement costs discussed further below.)
The cost abatement approach utilizes market information regarding emission abatement technologies and processes and presents a wide-range of values for the price per ton of carbon dioxide. The California Air Resources Board data of the cost-effectiveness of energy efficiency measures and emission regulations would provide one source of potential data for an analysis under this method. To meet the AB 32 target, ARB has established the “Cost of a Bundle of Strategies Approach” which includes a range of cost-effective strategies and regulations (CARB 2008b). The results of this approach within the framework of the Climate Action
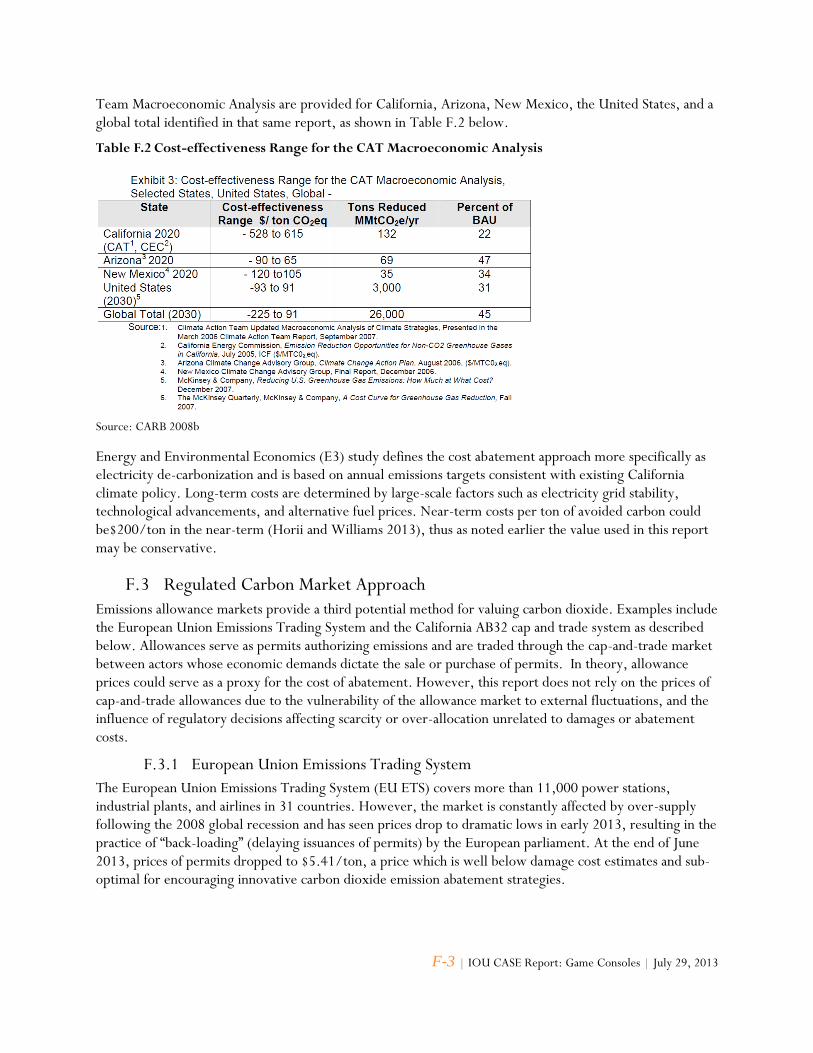
F-3 | IOU CASE Report: Game Consoles | July 29, 2013
Team Macroeconomic Analysis are provided for California, Arizona, New Mexico, the United States, and a global total identified in that same report, as shown in Table F.2 below.
Table F.2 Cost-effectiveness Range for the CAT Macroeconomic Analysis
Source: CARB 2008b
Energy and Environmental Economics (E3) study defines the cost abatement approach more specifically as electricity de-carbonization and is based on annual emissions targets consistent with existing California climate policy. Long-term costs are determined by large-scale factors such as electricity grid stability, technological advancements, and alternative fuel prices. Near-term costs per ton of avoided carbon could be$200/ton in the near-term (Horii and Williams 2013), thus as noted earlier the value used in this report may be conservative.
F.3 Regulated Carbon Market Approach
Emissions allowance markets provide a third potential method for valuing carbon dioxide. Examples include the European Union Emissions Trading System and the California AB32 cap and trade system as described below. Allowances serve as permits authorizing emissions and are traded through the cap-and-trade market between actors whose economic demands dictate the sale or purchase of permits. In theory, allowance prices could serve as a proxy for the cost of abatement. However, this report does not rely on the prices of cap-and-trade allowances due to the vulnerability of the allowance market to external fluctuations, and the influence of regulatory decisions affecting scarcity or over-allocation unrelated to damages or abatement costs.
F.3.1 European Union Emissions Trading System
The European Union Emissions Trading System (EU ETS) covers more than 11,000 power stations, industrial plants, and airlines in 31 countries. However, the market is constantly affected by over-supply following the 2008 global recession and has seen prices drop to dramatic lows in early 2013, resulting in the practice of “back-loading” (delaying issuances of permits) by the European parliament. At the end of June 2013, prices of permits dropped to $5.41/ton, a price which is well below damage cost estimates and sub-optimal for encouraging innovative carbon dioxide emission abatement strategies.
F-4 | IOU CASE Report: Game Consoles | July 29, 2013
F.3.2 California Cap & Trade
In comparison, California cap-and-trade allowance prices were reported to be at least $14/ton in May of 2013, with over 14.5 million total allowances sold for 2013 (CARB 2013b). However, cap-and-trade markets are likely to cover only subsets of emitting sectors of the industry covered by AB 32. In addition, the market prices of allowances are determined only partly by costs incurred by society or industry actors and largely by the stringency of the cap determined by regulatory agencies and uncontrollable market forces, as seen by the failure of the EU ETS to set a consistent and effective signal to curb carbon dioxide emissions.