Embed Size (px)
Citation preview

Gantt ChartsGantt Chartsfor project management
Jeff Barratt
Supply Chain and Operations Management
Dr. Tom Foster
Marriott School of Management
Brigham Young University
What is a Gantt Chart
Gantt Chart Applications
Gantt Chart Example
Gantt Chart Exercise
What is a Gantt Chart?• A visual representation of a project over
time– Used to schedule, coordinate, and allocate
the resources needed to complete a project– Shows start, end, and specific target dates
called “milestones”
Benefits of Gantt Charts• Efficiency Increase
– Project tracking– Set deadlines
• Communication Increase
• Coordination Increase
• Provides motivation through scheduling
• Encourages creativity
Features of Gantt Charts
• Easy to create– Freehand Gantt charts– Microsoft Excel– Microsoft Project– SmartDraw, Primavera, and other programs.
• Easy to modify and adjust
• Simple to understand
Disadvantages of Gantt Charts
• Activity descriptions often lack detail
• A lack of precedent and subsequent task relationships
• Does not allow for uncertain situations such as late or early finish times.
How Can This Tool Be Used in Your Organization?
• Upcoming projects?
• Communication barriers?
• Time restraints?
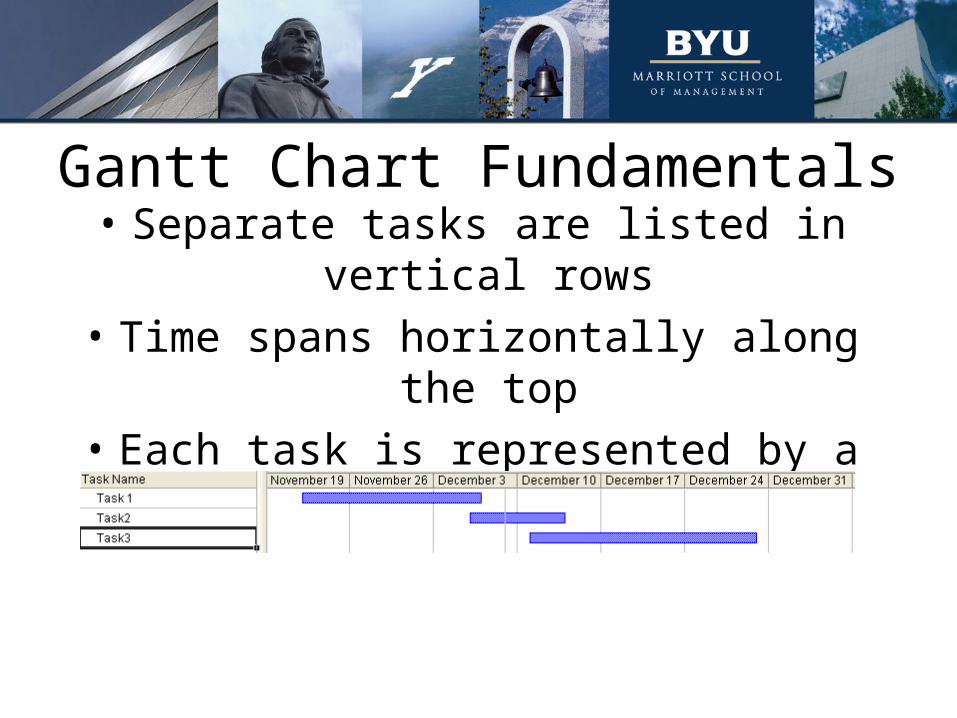
Gantt Chart Fundamentals• Separate tasks are listed in vertical rows
• Time spans horizontally along the top
• Each task is represented by a bar along the time horizon
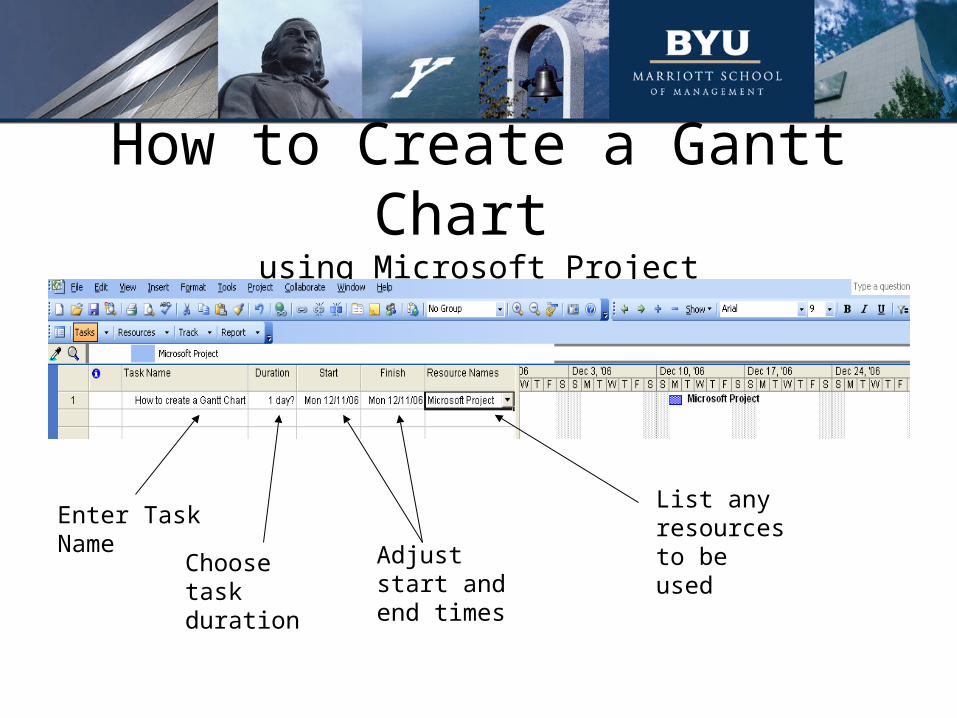
How to Create a Gantt Chart using Microsoft Project
Enter Task Name
Choose task duration
Adjust start and end times
List any resources to be used
ExerciseWater Tight Security Systems
just got a bid for installing the security system
on a new government building…
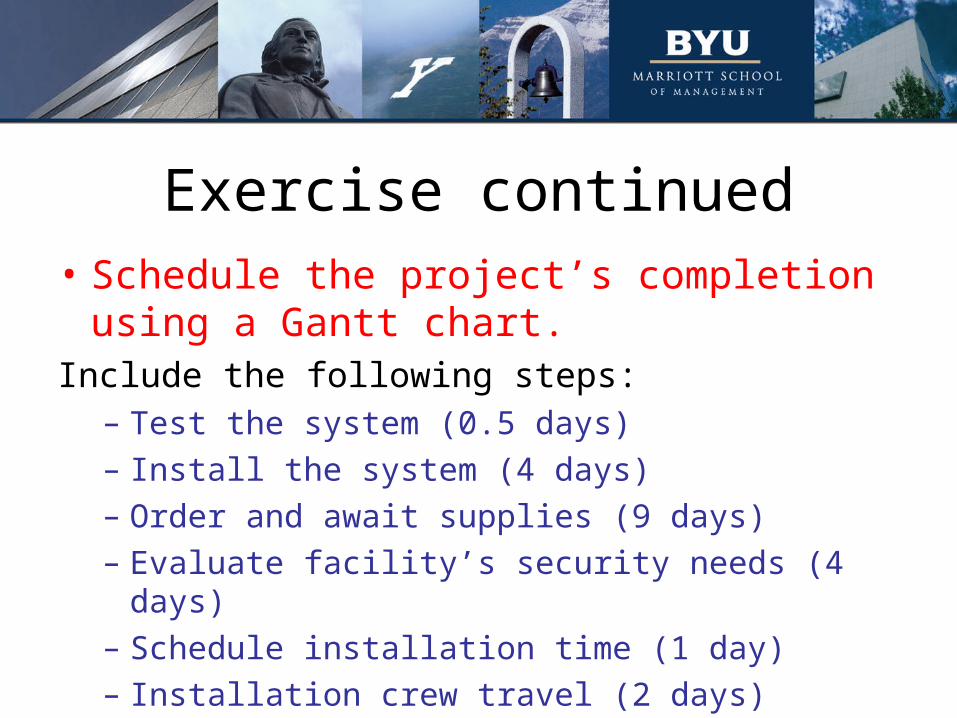
Exercise continued• Schedule the project’s completion using a
Gantt chart. Include the following steps:
– Test the system (0.5 days)
– Install the system (4 days)
– Order and await supplies (9 days)
– Evaluate facility’s security needs (4 days)
– Schedule installation time (1 day)
– Installation crew travel (2 days)
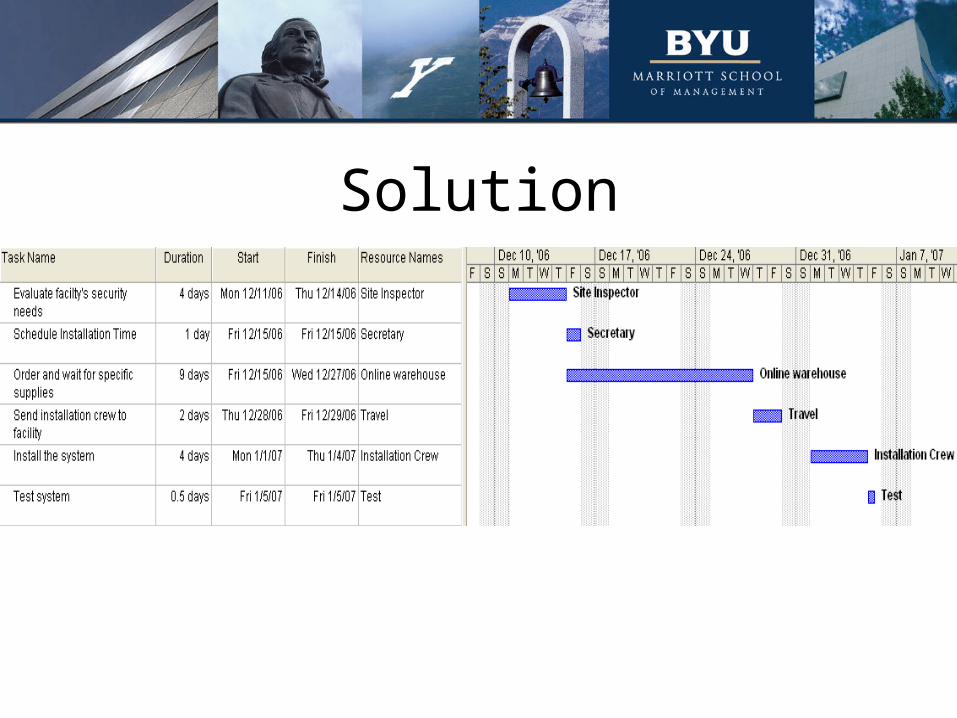
Solution
Real World Examples• Government Uses
– Hoover Dam construction, 1931– Interstate Highway Network, begun 1956
• Private Uses– Specific projects such as launching a new
product– Construction planning such as building a
home– Personal planning
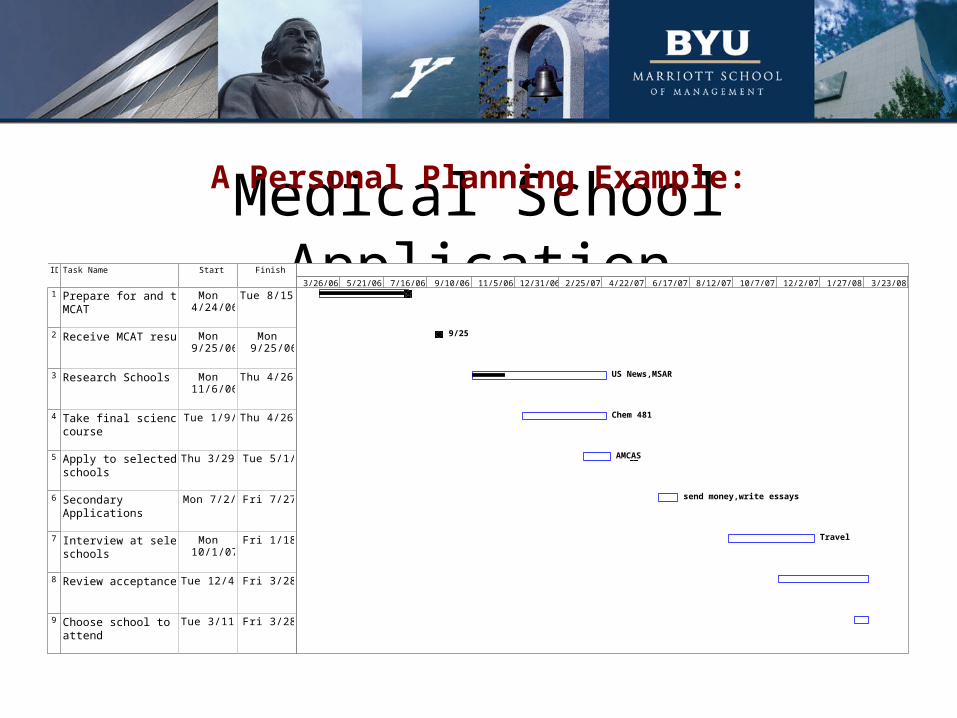
Medical School ApplicationID Task Name Start Finish
1 Prepare for and takeMCAT
Mon4/24/06
Tue 8/15/06
2 Receive MCAT results Mon9/25/06
Mon9/25/06
3 Research Schools Mon11/6/06
Thu 4/26/07
4 Take final sciencecourse
Tue 1/9/07 Thu 4/26/07
5 Apply to selectedschools
Thu 3/29/07 Tue 5/1/07
6 SecondaryApplications
Mon 7/2/07 Fri 7/27/07
7 Interview at selectschools
Mon10/1/07
Fri 1/18/08
8 Review acceptances Tue 12/4/07 Fri 3/28/08
9 Choose school toattend
Tue 3/11/08 Fri 3/28/08
9/25
US News,MSAR
Chem 481
AMCAS
send money,write essays
Travel
3/26/06 5/21/06 7/16/06 9/10/06 11/5/06 12/31/06 2/25/07 4/22/07 6/17/07 8/12/07 10/7/07 12/2/07 1/27/08 3/23/08 5/18/08
A Personal Planning Example:
Additional Information• Microsoft Office homepage • Academy of Management Journal. 2002,Vol. 45, No. 5,
956-970. “Charting Time: Timelines as Temporal Boundary Objects.” Elaine K. Yakura.
• Cost Engineering. Vol.47/No.7 July 2005, 14-21. “Effective Use of Gantt Chart for Managing Large Scale Projects.” Pankaja Pradeep Kumar, CCE.
Link
Additional Information Cont.• IEE Engineering Management. June/July 2003.
“Uncharted Territory?” Alan Orr. • Project Management Fifth Edition, 1995. Harold
Derzner, Ph.D. Pp 705-711.• See also:
– Program evaluation and review technique (PERT)– Critical path method (CPM)
SummarySummary
• Gantt charts are visual representations of a project over time. – Includes start, finish, and milestone dates.– Useful in project planning and tracking.– Helpful in resource communication and
allocation