Embed Size (px)
Citation preview
GAO-07-676R Oil and Gas Royalties
United States Government Accountability Office
Washington, DC 20548
May 1, 2007 The Honorable Jeff Bingaman Chairman Committee on Energy & Natural Resources United States Senate The Honorable Nick J. Rahall II Chairman Committee on Natural Resources House of Representatives The Honorable Stevan Pearce Ranking Member Subcommittee on Energy and Mineral Resources Committee on Natural Resources House of Representatives The Honorable Mary L. Landrieu United States Senate Subject: Oil and Gas Royalties: A Comparison of the Share of Revenue Received
from Oil and Gas Production by the Federal Government and Other Resource
Owners
Amid rising oil and gas prices and reports of record oil industry profits, a number of governments have taken steps to reevaluate and, in some cases, increase the share of oil and gas revenues they receive for the rights to develop oil and gas on their lands and waters. For example, the State of Alaska has recently passed new oil and gas legislation that will increase the state’s share of revenue received from oil and gas companies operating state leases. In January 2007, the Department of the Interior announced an increase in the royalty rate for future leases granted in the deepwater region of the Gulf of Mexico. Companies engaged in exploration and development of oil and gas resources do so under terms of concessions, leases, or contracts granted by governments or other resource owners. The terms and conditions of such arrangements are established by law or negotiated on a case-by-case basis. One important aspect of the arrangements is the applicable payments from the companies to the resource owners—in the United States, these include bonuses, rentals, royalties, corporate income taxes, and special fees or taxes. The precise mix and total amount of these payments, referred to as the “fiscal system” varies widely across different resource owners. The total revenue, as a percentage of the value of the oil and natural gas produced, received by government resource owners, such as
U.S. federal or state governments is commonly referred to as the “government take.” For example, a government take of 50 percent means that the government receives 50 percent of the cash flow produced from an oil or gas field. In fiscal year 2006, oil and gas companies received over $77 billion from the sale of oil and gas produced from federal lands and waters, and the Department of the Interior’s Minerals Management Service (MMS) reported that these companies paid the federal government about $10 billion in oil and gas royalties. Clearly, such large and financially significant resources must be carefully developed and managed so that our nation’s rising energy needs are met while at the same time the American people are ensured of receiving a fair rate of return on publicly owned resources, especially in light of the nation’s daunting current and long-range fiscal challenges. As requested, this report documents the information provided to your staffs in March 2007 on the U.S. government’s take and implications associated with increasing royalty rates. Specifically, this report discusses (1) the United States’ government take relative to that of other government resource owners and (2) the potential revenue implications of raising royalty rates on federal oil and gas leases going forward. To address the government take, our work included reviewing results of studies done by oil companies and industry consultants. We also collected and analyzed various studies generated by MMS, the agency responsible for collecting oil and gas royalties from federal lands and waters. In addition, we reviewed results of studies prepared over the last 13 years by various private and government sources on government take and interviewed Alaskan state and private consulting firm officials. In evaluating the study results we conducted interviews with study authors and an industry expert to discuss the study methodologies and the appropriate interpretation of the results. Based on these interviews and our review of study results, we believe the general approach that these study authors took was reasonable and that the study authors are credible. However, we did not fully evaluate each study’s methodology or the underlying data used to make the government take estimates. Overall, because all the studies came to similar conclusions with regard to the relative government-take ranking of the U.S. federal government and because such studies are used by oil and gas industry companies and governments alike for the purposes of evaluating the relative competitiveness of specific fiscal systems, we are confident that the broad conclusions of the studies are valid. To address the revenue implications of raising royalty rates, we gathered information from reports, studies, and government documents, and drew from past GAO reports related to oil and gas royalties. We also discussed the material in this report with MMS officials and they made helpful suggestions about the factors affecting the revenue implications of raising royalty rates. Our work was done from January 2007 through March 2007 in accordance with generally accepted government auditing standards. In Summary
Based on results of a number of studies, the U.S. federal government receives one of the lowest government takes in the world. Collectively, the results of five studies presented in 2006 by various private sector entities show that the United States receives a lower government take from the production of oil in the Gulf of Mexico than do states—such as Colorado, Wyoming, Texas, Oklahoma, California, and Louisiana—and many foreign governments. Other government-take studies issued in
GAO-07-676R Oil and Gas Royalties Page 2
2006 and prior years similarly show that the United States has consistently ranked low in government take compared to other governments. For example, a study completed in 2006 for MMS showed that the U.S. federal government take in the Gulf of Mexico deepwater and shallow water was lower than 29 and 26, respectively, of the 31 fiscal systems analyzed. In deciding where and when to invest oil and gas development dollars, companies consider the government take as well as other factors, including the size and availability of the oil and gas resources in the ground; the costs of finding and developing these resources, including labor costs and the costs of compliance with environmental regulations; and the stability of the fiscal system and the country in general. All else held equal, more investment dollars will flow to regions in which the government take is relatively low, where there are large oil and gas deposits that can be developed at relatively low cost, and where the fiscal system and government are deemed to be relatively more stable. Regarding the deepwater areas of the U.S. Gulf of Mexico, the current size of the government take, the relatively large estimated amounts of oil and gas in the ground, and the proximity to the large U.S. market for oil and gas make this region a favorable place to invest. However, the high costs of operating in deepwater may deter some investment. Increasing royalty rates on future federal oil and gas leases would likely increase the federal government take but by less than the percentage increase in the royalty rate because higher royalty rates would likely reduce some taxes and other fees and may also discourage some development and production. For example, the recently announced increase in royalty rates from 12.5 percent to 16.67 percent on future leases sold in the deepwater regions of the Gulf of Mexico will, according to MMS, increase overall federal revenues but will also cause reductions in some fees and in oil and gas production. Specifically, MMS estimates that the new royalty rate of 16.67 percent will increase revenue by $4.5 billion over 20 years. MMS also estimates that, by 2017, this increased revenue will be partially offset by revenue losses of $820 million over 20 years as a result of reduced rental fees as well as a decline in production of 5 percent. A lower royalty rate can encourage oil companies to pursue oil exploration and production and thereby provide an economic stimulus to oil producing regions. For example, according to a MMS study issued in 2006, as the industry expands output in the Gulf of Mexico, employment levels in all Gulf Coast states—including Alabama, Louisiana, Mississippi, and Texas—tend to rise to meet industry needs. As part of an energy strategy to meet the nation’s energy needs and balance the impacts of energy use on the environment and climate, a healthy domestic oil and natural gas industry is essential, and that means that the United States must continue to create a market that is competitive in attracting investment in oil and natural gas development. Such development, however, should not mean that the American people forgo a competitive and fair rate of return for the extraction and sale of these natural resources, especially in light of the current and long-range fiscal challenges facing our nation. The potential trade-offs between higher revenue collections and higher oil production highlight the broader challenge of striking a balance between meeting the nation’s increasing energy needs and ensuring a fair rate of return for the American people from oil production on federally leased lands and waters.
GAO-07-676R Oil and Gas Royalties Page 3
Background
The Department of the Interior, created by the Congress in 1849, oversees and manages the nation’s publicly owned natural resources, including parks, wildlife habitat, and crude oil and natural gas resources on over 500 million acres onshore and in the waters of the Outer Continental Shelf. In this capacity, the Department of the Interior is authorized to lease federal oil and gas resources and to collect the royalties associated with their production. The Department of the Interior’s Bureau of Land Management is responsible for leasing federal oil and natural gas resources on land, whereas, offshore, MMS has the leasing authority. To lease lands or waters for oil and gas exploration, companies generally must first pay the federal government a sum of money that is determined through a competitive auction. This money is called a bonus bid. After the lease is awarded and production begins, the companies must also pay royalties to MMS based on a percentage of the cash value of the oil and gas produced and sold.1 Royalty rates for onshore leases are generally 12 and a half percent whereas offshore, they range from 12 and a half percent for water depths of 400 meters or deeper (referred to as deepwater) to 16 and two-thirds percent for water depths less than 400 meters (referred to as shallow). However, the Secretary of the Interior recently announced plans to raise the royalty rate to 16 and two-thirds percent for most future leases issued in waters 400 meters or deeper. MMS also has the option of taking a percentage of the actual oil and natural gas produced, referred to as “taking royalties in kind,” and selling this energy itself or using it for other purposes, such as filling the nation’s Strategic Petroleum Reserve. In addition to bonus bids and royalties, companies pay taxes on corporate profits. The sum of all these and other payments comprises the government take. Because different governments set different levels of taxes, fees, and royalties, the relative size of any one component of government take generally varies across different fiscal systems. Study Results Indicate That the Federal Government Receives among the
Lowest Government Takes in the World
Results of five studies presented in reports or testimony to the Alaskan state legislature in 2006 indicate that the federal government receives one of the lowest government takes among the jurisdictions evaluated. The hearing was held to discuss a proposed new state tax on oil company profits. This proposal eventually was adopted and, in 2006, the State of Alaska enacted a new oil and gas production tax law which imposed a 22.5 percent tax on oil company profits. Two of the studies presented were from major oil companies, and three were from private consulting firms. The five studies had differing scopes and somewhat different estimates of government take. For example, one study focused primarily on comparing U.S. federal, state, and Canadian fiscal systems, while other studies focused on
1 Specifically, royalties are computed as a percentage of the monies received from the sale of oil and gas, with the total federal royalty revenue equal to the volume sold multiplied by the sales price multiplied by the royalty rate.
GAO-07-676R Oil and Gas Royalties Page 4
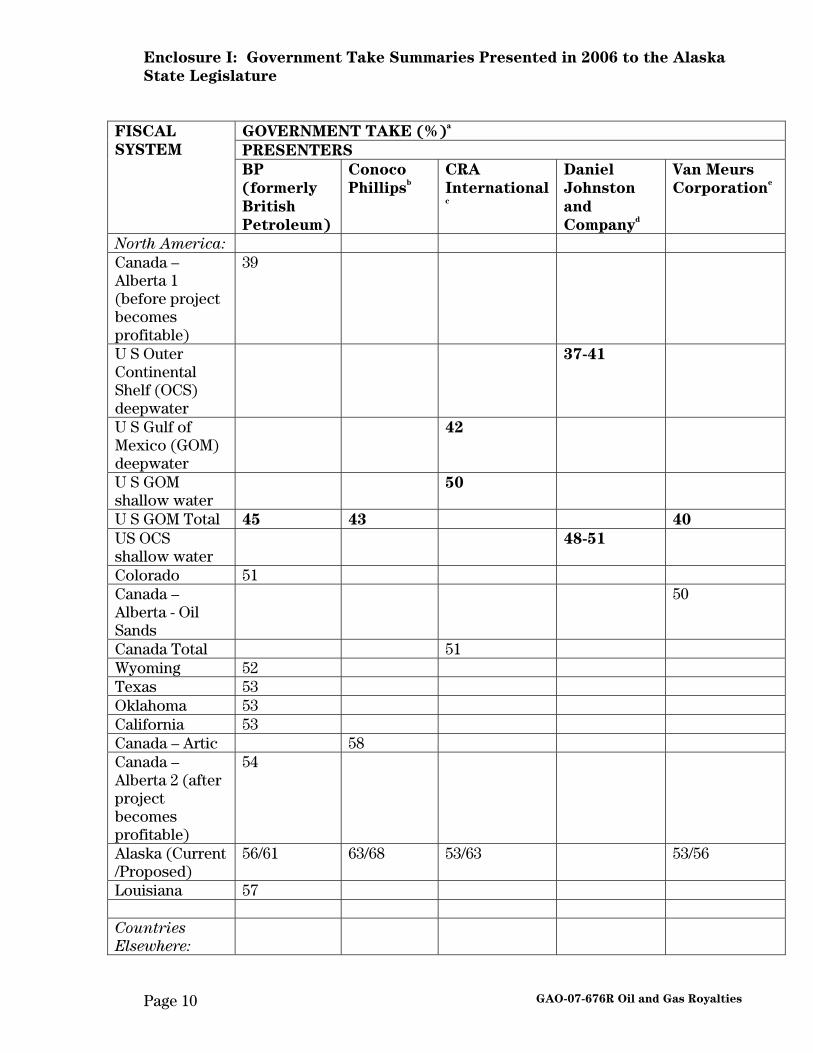
international comparisons. The results of the five studies are summarized below and in more detail in enclosure I.2
• BP (formerly British Petroleum), one of the world’s largest oil companies. testified that the federal government’s take for leases in the Gulf of Mexico (45 percent) was lower than 9 out of 10 other fiscal systems presented, including Colorado, Wyoming, Texas, Oklahoma, California, and Louisiana (between 51 percent and 57 percent).
• ConocoPhillips, Alaska’s number-one oil producer in 2005, testified that the
federal government’s take for leases in the Gulf of Mexico (43 percent) was lower than all 8 other fiscal systems presented, including the United Kingdom (52 percent) and Norway (76 percent).
• CRA International (formerly Charles River Associates), a global firm
specializing in business consultancy and economics, testified that the federal government’s take in the Gulf of Mexico—both deepwater (42 percent) and shallow water (50 percent)—was lower than the 6 other fiscal systems it evaluated, including Australia (61 percent).
• Daniel Johnston and Company, an independent petroleum advisory firm
providing services to the oil and gas industry, testified that the federal government’s take in the Gulf of Mexico for deepwater (between 37 and 41 percent) was 4th lowest and for shallow water (between 48 and 51 percent) was 8th lowest among 50 fiscal systems it evaluated.
• Van Meurs Corporation—a company which provides international consulting
services in several areas including petroleum legislation, contracts, and negotiations—reported that the federal government’s take in the Gulf of Mexico (40 percent) was the lowest among 10 fiscal systems it evaluated, including Alaska (53 percent) and Angola (64 percent).
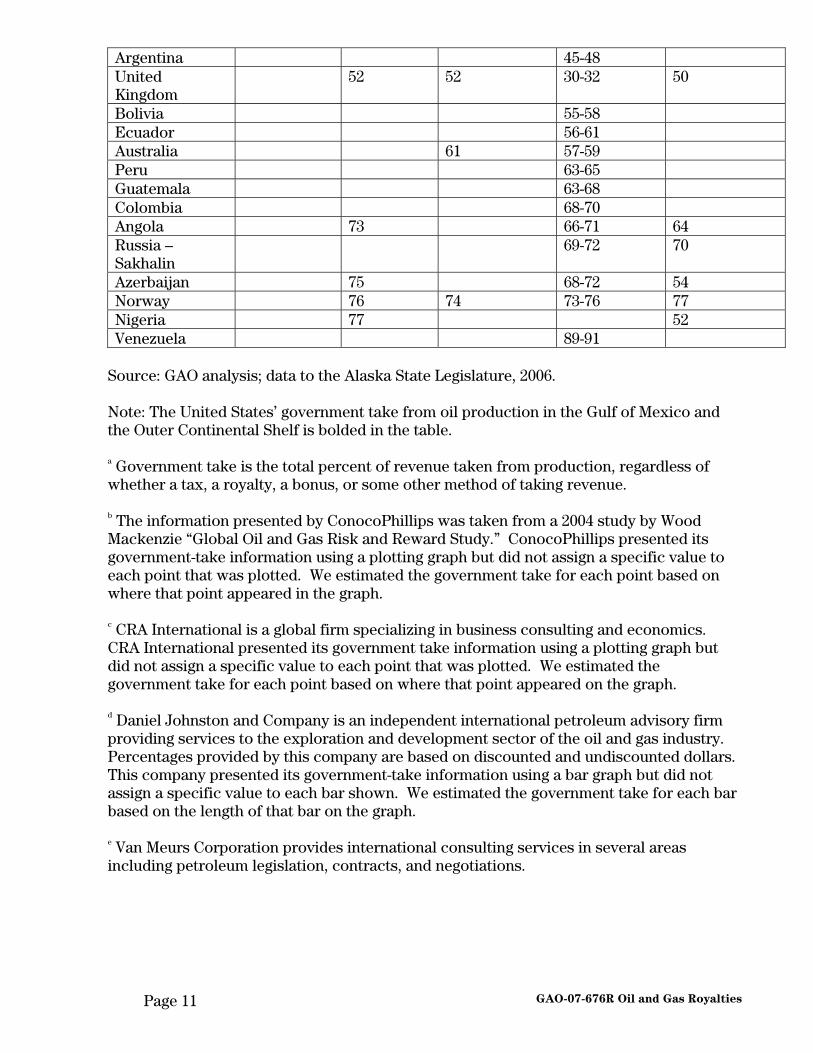
It should be recognized that the studies presented in this testimony were done before the recent increase in the royalty rate for future deepwater leases in the Gulf of Mexico. This action will, as new leases are added to the mix over time, cause the average government take in the Gulf of Mexico to rise somewhat. In addition, 4 of the 5 studies compared government take based on 11 fiscal systems or fewer. A comparison of a much larger number of fiscal systems provides more comprehensive information. In this regard, we found that other expanded government-take studies have been issued. These are summarized below and more details are presented in enclosure II. 2 The studies estimated slightly different government takes for the Gulf of Mexico. This is partially explained by the fact that some studies average the government take for the entire Gulf of Mexico, while others distinguish between the shallow and deepwater regions, which have different lease and royalty terms and therefore different government takes. Other variation may exist as a result of changes over time that are reflected in when the study data were collected as well as somewhat different methodologies used by the study authors to calculate government take.
GAO-07-676R Oil and Gas Royalties Page 5
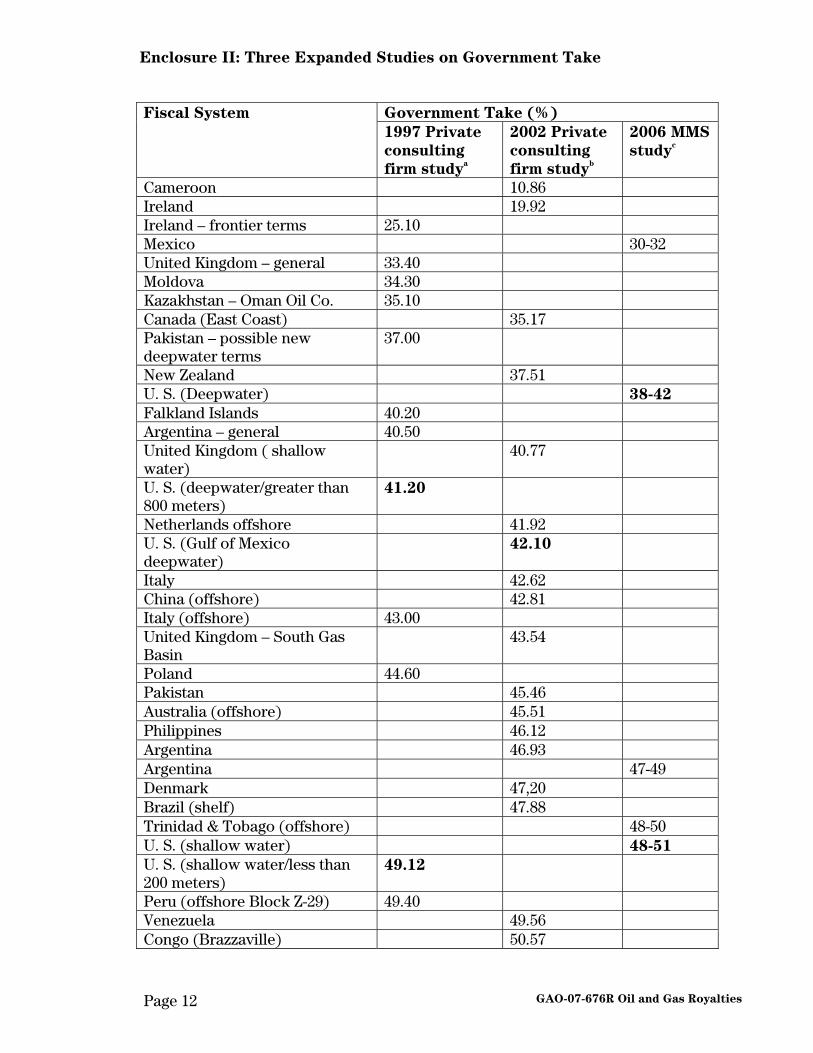
• A study issued in 2006 and done under contract with MMS by the Coastal Marine Institute of the Louisiana State University reported on 31 fiscal systems in 25 countries. The study showed, out of the 31 fiscal systems, Gulf of Mexico deepwater, at between 38 and 42 percent, was lower than 29 other systems and Gulf of Mexico shallow water, at between 48 percent and 51 percent, was lower than 26 systems. Three other offshore fiscal systems were also shown. This included Trinidad & Tobago offshore with a government take between 48 percent and 50 percent, Australia offshore with a government take of between 53 percent and 56 percent, and Egypt offshore with a government take of between 79 percent and 82 percent. Of the 31 fiscal systems presented, Mexico had the lowest government take at between 30 percent and 32 percent, and, at the other end of the spectrum, Venezuela had the highest government take at between 88 percent and 93 percent.
• A second study, issued in 2002 by Wood MacKenzie, a private consulting firm,
analyzed 61 fiscal systems within 50 countries. The study showed that, out of 61 fiscal systems, Gulf of Mexico deepwater ranked lower than 54 other systems with a federal government take of about 42 percent, while Alaska’s government take was about 64 percent. Of the 61 fiscal systems analyzed, Cameroon had the lowest government take at about 11 percent, and at the other end of the spectrum, Iran had the highest government take at about 93 percent.
• A third study, issued by Van Meurs Corporation in 1997, analyzed 324 fiscal
systems in 159 countries. The study showed that, out of 324 fiscal systems, Gulf of Mexico water greater than 800 meters ranked lower than 298 other systems with a federal government take of about 41 percent and Gulf of Mexico water between 200 and 400 meters ranked lower than 276 systems with a federal government take of about 47 percent. The study also indicated that governments tend to compete regionally and that the regional average government take for countries within North America was about 57 percent.
• Finally, one of the first expanded, or comprehensive, studies was completed
by Van Meurs Corporation in 1994 for the World Bank. That study showed that the government take from federal onshore lands, Gulf of Mexico deepwater, and Gulf of Mexico shallow, ranked lower than 194, 191, and 180 out of 226 fiscal systems in 144 countries, territories, and joint development zones analyzed.
The last few years of high oil and gas prices and record industry profits have been a factor in causing a number of resource owners to reevaluate their fiscal systems. For example, and as already discussed, the State of Alaska enacted in 2006, a new oil and gas production tax law which, among other things, imposed a 22.5 percent tax on oil company profits. In addition, at least five states—including New Jersey, New York, Pennsylvania, Washington, and Wisconsin—and Alberta Province in Canada are considering new oil and gas tax legislative proposals. The level of government take can influence investment in oil and gas development and production. Resource owners are competing to some extent for finite private
GAO-07-676R Oil and Gas Royalties Page 6
investment in oil and gas development, and in considering the ideal government take, the resource owners must consider that there may be a trade-off between the magnitude of government take and the level of investment. From the oil and gas industry’s perspective, government take represents one of the costs of doing business. As with any industry, if the costs in one geographic area increase, industry may pursue locations elsewhere. In addition to the overall government take, the mix of taxes, fees, and royalty rates that comprise the government take may also be important in determining the level of investment. For example, in commenting on Alaska’s then-proposed revisions to its oil and gas tax law, a BP official testified that a fiscal system should be equitable to investors and the government alike and should be profit-related, that is, with a tax levied on profits not revenues. Similarly a ConocoPhillips official testified that a balanced fiscal system is critical for future oil and gas investment in Alaska and that Alaska must maintain its fiscal system competitiveness on a global basis. Further, the size of oil and gas reserves, the costs of exploration and development, and the stability of the government and regulatory environment play a role in companies’ investment decisions. In many regards, the United States is a desirable place to invest in oil and gas development and production. For example, of non-OPEC countries, the United States held almost 10 percent of oil reserves as of 2006. In addition, including the existence of a nearby market for all that is produced, the United States is generally considered a stable place to invest, especially when compared to many countries, such as Venezuela and Nigeria, that have large oil and gas reserves. For example, in Venezuela, it was reported last year that the government had taken a series of steps to increase the government take as well as take greater control over oil operations in that country, and in Nigeria, it was recently reported that there have been repeated instances of oil company employees being kidnapped or attacked. However, much of the estimated oil reserves in the United States, such as those in the deepwater areas of the Gulf of Mexico, and the smaller pockets of oil remaining in mature oil fields will be more costly to develop than oil in some other regions, and these higher costs are a deterrent for investment. In addition, to the extent that environmental regulations in the United States are stricter than in some other oil producing countries, this could increase compliance costs and necessitate to some extent a lower government take in the United States. Further, to the extent that labor costs are a factor in determining the profitability of oil development projects, the United States may have higher labor costs than some other oil producing countries, and this would also necessitate, to some extent, a lower government take. Increasing Royalty Rates on Future Federal Oil and Gas Leases Would Likely
Increase the Federal Government Take
Increasing royalty rates on future federal oil and gas leases would likely increase the federal government take but by less than the percentage increase in the royalty rate itself because higher royalty rates will likely reduce some taxes and other fees and may also discourage some development and production compared to what it would be under lower government take conditions. For example, because the federal government assesses taxes on corporate profits, an increase in royalty rates would raise oil and gas company costs, thereby reducing their profits and, consequently, the
GAO-07-676R Oil and Gas Royalties Page 7
corporate income taxes they pay. In addition, an increase in royalty rates may reduce the amount, in fees or bonuses, oil and gas companies are willing to pay for the rights to develop individual leases. Because such fees or bonuses are determined competitively, this may lead to lower government revenue. Finally, higher royalty rates may deter some development or production of oil and gas if companies can find more profitable investment opportunities elsewhere and for which other factors, such as stability and the amount of oil and gas reserves are comparable. MMS’ analysis that accompanied a recently announced increase in the royalty rate for new federal deepwater offshore Gulf of Mexico leases illustrates how the increase in royalty rates can be offset somewhat by reduced fees and production. MMS estimates that the increased royalty rate of 16.67 percent—from 12.5 percent—will increase revenue from royalty payments by $4.5 billion over 20 years. However, MMS also recognized that this royalty rate increase will likely cause declines in bonus and rental revenues as well as reduce oil and gas production compared to what it would have been under the lower royalty rate. Specifically, MMS estimated a decline of bonus and rental revenues amounting to $820 million over 20 years and a decline in production of 5 percent, or 110 million barrels of oil equivalent, over 20 years compared to what production would have been at the lower rate. Nonetheless, MMS estimates that by 2017, the net increase in total revenue will still be substantial. In addition to revenue considerations, there are a number of other considerations that could be considered when establishing a royalty rate or the overall government take. These include environmental issues and socioeconomic effects. Royalties or other fees or taxes may reduce the amount of investment in oil and gas development and production and, therefore, to the extent that higher royalty rates reduce oil and gas development and production in the United States, could be used as a policy tool to reduce the domestic environmental impacts of oil and gas development. Regarding socioeconomic effects of oil and gas development and production, a 2006 study done under contract for MMS noted that as the oil and gas industry expands output in the Gulf of Mexico, employment levels in all Gulf Coast states—including Alabama, Louisiana, Mississippi, and Texas—tend to rise to meet industry needs.3 As agreed with your offices, unless you publicly announce the contents of this report earlier, we plan no further distribution until 30 days from the date of this report. At that time, we will send copies to appropriate congressional committees, the Secretary of the Interior, the Director of MMS, the Director of the Office of Management and Budget, and other interested parties. We will also make copies available to others upon request. In addition, the report will be available at no charge on GAO’s Web site at http://www.gao.gov.
3 Minerals Management Service, Economic Effects of Petroleum Prices and Production in the Gulf of
Mexico OCS on the U.S. Gulf Coast Economy, MMS 2006-063 (October 2006).
GAO-07-676R Oil and Gas Royalties Page 8
If you or your staff have any questions or comments about this report, please contact me at (202) 512-3841 or [email protected]. Contact points for our Offices of Congressional Relations and Public Affairs may be found on the last page of this report. GAO staff who made contributions to this report include Frank Rusco, Assistant Director; Robert Baney; Dan Novillo; Dawn Shorey; Barbara Timmerman; and Maria Vargas.
Mark E. Gaffigan Acting Director, Natural Resources and Environment Enclosures
GAO-07-676R Oil and Gas Royalties Page 9
Enclosure I: Government Take Summaries Presented in 2006 to the Alaska
State Legislature
GOVERNMENT TAKE (%)a
PRESENTERS
FISCAL
SYSTEM
BP
(formerly
British
Petroleum)
Conoco
Phillipsb
CRA
Internationalc
Daniel
Johnston
and
Companyd
Van Meurs
Corporatione
North America: Canada – Alberta 1 (before project becomes profitable)
39
U S Outer Continental Shelf (OCS) deepwater
37-41
U S Gulf of Mexico (GOM) deepwater
42
U S GOM shallow water
50
U S GOM Total 45 43 40
US OCS shallow water
48-51
Colorado 51 Canada – Alberta - Oil Sands
50
Canada Total 51 Wyoming 52 Texas 53 Oklahoma 53 California 53 Canada – Artic 58 Canada – Alberta 2 (after project becomes profitable)
54
Alaska (Current /Proposed)
56/61 63/68 53/63 53/56
Louisiana 57 Countries
Elsewhere:
GAO-07-676R Oil and Gas Royalties Page 10
Argentina 45-48 United Kingdom
52 52 30-32 50
Bolivia 55-58 Ecuador 56-61 Australia 61 57-59 Peru 63-65 Guatemala 63-68 Colombia 68-70 Angola 73 66-71 64 Russia – Sakhalin
69-72 70
Azerbaijan 75 68-72 54 Norway 76 74 73-76 77 Nigeria 77 52 Venezuela 89-91
Source: GAO analysis; data to the Alaska State Legislature, 2006. Note: The United States’ government take from oil production in the Gulf of Mexico and the Outer Continental Shelf is bolded in the table.
a Government take is the total percent of revenue taken from production, regardless of whether a tax, a royalty, a bonus, or some other method of taking revenue.
b The information presented by ConocoPhillips was taken from a 2004 study by Wood Mackenzie “Global Oil and Gas Risk and Reward Study.” ConocoPhillips presented its government-take information using a plotting graph but did not assign a specific value to each point that was plotted. We estimated the government take for each point based on where that point appeared in the graph.
c CRA International is a global firm specializing in business consulting and economics. CRA International presented its government take information using a plotting graph but did not assign a specific value to each point that was plotted. We estimated the government take for each point based on where that point appeared on the graph. d Daniel Johnston and Company is an independent international petroleum advisory firm providing services to the exploration and development sector of the oil and gas industry. Percentages provided by this company are based on discounted and undiscounted dollars. This company presented its government-take information using a bar graph but did not assign a specific value to each bar shown. We estimated the government take for each bar based on the length of that bar on the graph. e Van Meurs Corporation provides international consulting services in several areas including petroleum legislation, contracts, and negotiations.
GAO-07-676R Oil and Gas Royalties Page 11
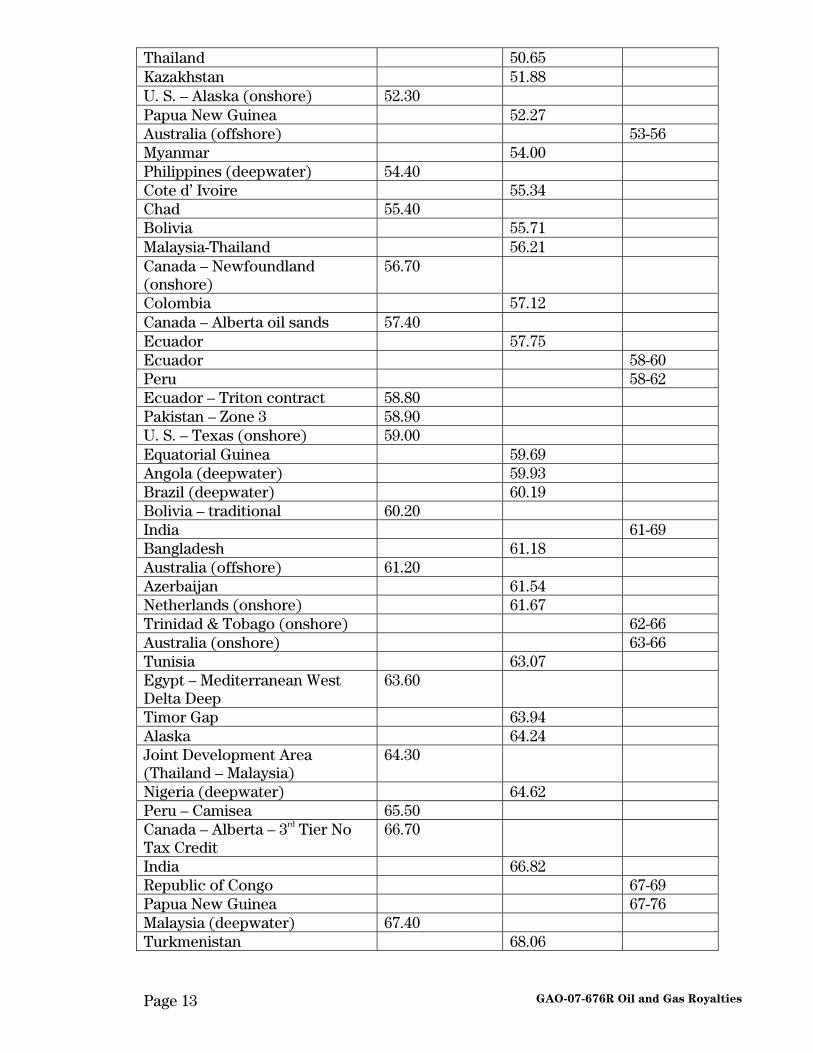
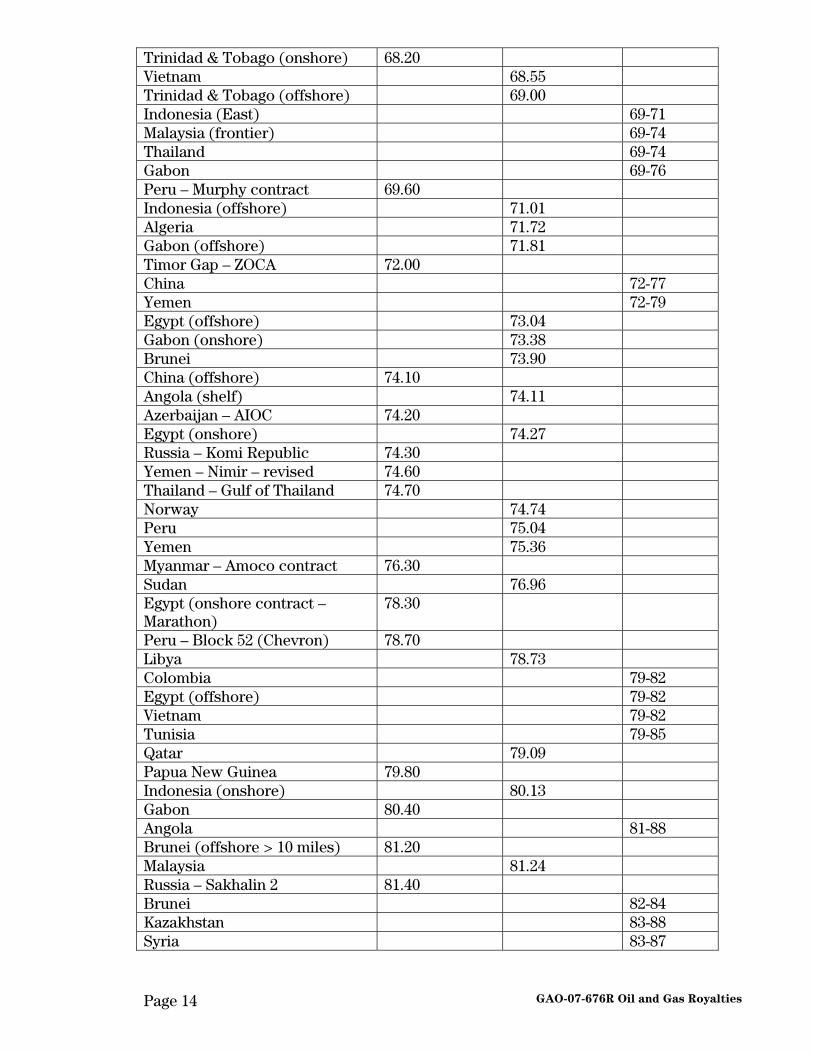
Enclosure II: Three Expanded Studies on Government Take
Government Take (%) Fiscal System
1997 Private
consulting
firm studya
2002 Private
consulting
firm studyb
2006 MMS
studyc
Cameroon 10.86 Ireland 19.92 Ireland – frontier terms 25.10 Mexico 30-32 United Kingdom – general 33.40 Moldova 34.30 Kazakhstan – Oman Oil Co. 35.10 Canada (East Coast) 35.17 Pakistan – possible new deepwater terms
37.00
New Zealand 37.51 U. S. (Deepwater) 38-42
Falkland Islands 40.20 Argentina – general 40.50 United Kingdom ( shallow water)
40.77
U. S. (deepwater/greater than 800 meters)
41.20
Netherlands offshore 41.92 U. S. (Gulf of Mexico deepwater)
42.10
Italy 42.62 China (offshore) 42.81 Italy (offshore) 43.00 United Kingdom – South Gas Basin
43.54
Poland 44.60 Pakistan 45.46
Australia (offshore) 45.51
Philippines 46.12
Argentina 46.93 Argentina 47-49 Denmark 47,20 Brazil (shelf) 47.88 Trinidad & Tobago (offshore) 48-50 U. S. (shallow water) 48-51
U. S. (shallow water/less than 200 meters)
49.12
Peru (offshore Block Z-29) 49.40 Venezuela 49.56
Congo (Brazzaville) 50.57
GAO-07-676R Oil and Gas Royalties Page 12
Thailand 50.65
Kazakhstan 51.88
U. S. – Alaska (onshore) 52.30
Papua New Guinea 52.27 Australia (offshore) 53-56 Myanmar 54.00 Philippines (deepwater) 54.40 Cote d’ Ivoire 55.34 Chad 55.40 Bolivia 55.71
Malaysia-Thailand 56.21
Canada – Newfoundland (onshore)
56.70
Colombia 57.12
Canada – Alberta oil sands 57.40
Ecuador 57.75 Ecuador 58-60 Peru 58-62 Ecuador – Triton contract 58.80 Pakistan – Zone 3 58.90 U. S. – Texas (onshore) 59.00
Equatorial Guinea 59.69 Angola (deepwater) 59.93 Brazil (deepwater) 60.19 Bolivia – traditional 60.20 India 61-69 Bangladesh 61.18 Australia (offshore) 61.20 Azerbaijan 61.54 Netherlands (onshore) 61.67 Trinidad & Tobago (onshore) 62-66 Australia (onshore) 63-66 Tunisia 63.07 Egypt – Mediterranean West Delta Deep
63.60
Timor Gap 63.94 Alaska 64.24 Joint Development Area (Thailand – Malaysia)
64.30
Nigeria (deepwater) 64.62 Peru – Camisea 65.50 Canada – Alberta – 3rd Tier No Tax Credit
66.70
India 66.82 Republic of Congo 67-69 Papua New Guinea 67-76 Malaysia (deepwater) 67.40 Turkmenistan 68.06
GAO-07-676R Oil and Gas Royalties Page 13
Trinidad & Tobago (onshore) 68.20 Vietnam 68.55 Trinidad & Tobago (offshore) 69.00 Indonesia (East) 69-71 Malaysia (frontier) 69-74 Thailand 69-74 Gabon 69-76 Peru – Murphy contract 69.60 Indonesia (offshore) 71.01 Algeria 71.72 Gabon (offshore) 71.81 Timor Gap – ZOCA 72.00 China 72-77 Yemen 72-79 Egypt (offshore) 73.04 Gabon (onshore) 73.38 Brunei 73.90 China (offshore) 74.10 Angola (shelf) 74.11 Azerbaijan – AIOC 74.20 Egypt (onshore) 74.27 Russia – Komi Republic 74.30 Yemen – Nimir – revised 74.60 Thailand – Gulf of Thailand 74.70 Norway 74.74 Peru 75.04 Yemen 75.36 Myanmar – Amoco contract 76.30 Sudan 76.96 Egypt (onshore contract – Marathon)
78.30
Peru – Block 52 (Chevron) 78.70 Libya 78.73 Colombia 79-82 Egypt (offshore) 79-82 Vietnam 79-82 Tunisia 79-85 Qatar 79.09 Papua New Guinea 79.80 Indonesia (onshore) 80.13 Gabon 80.40 Angola 81-88 Brunei (offshore > 10 miles) 81.20 Malaysia 81.24 Russia – Sakhalin 2 81.40 Brunei 82-84 Kazakhstan 83-88 Syria 83-87
GAO-07-676R Oil and Gas Royalties Page 14
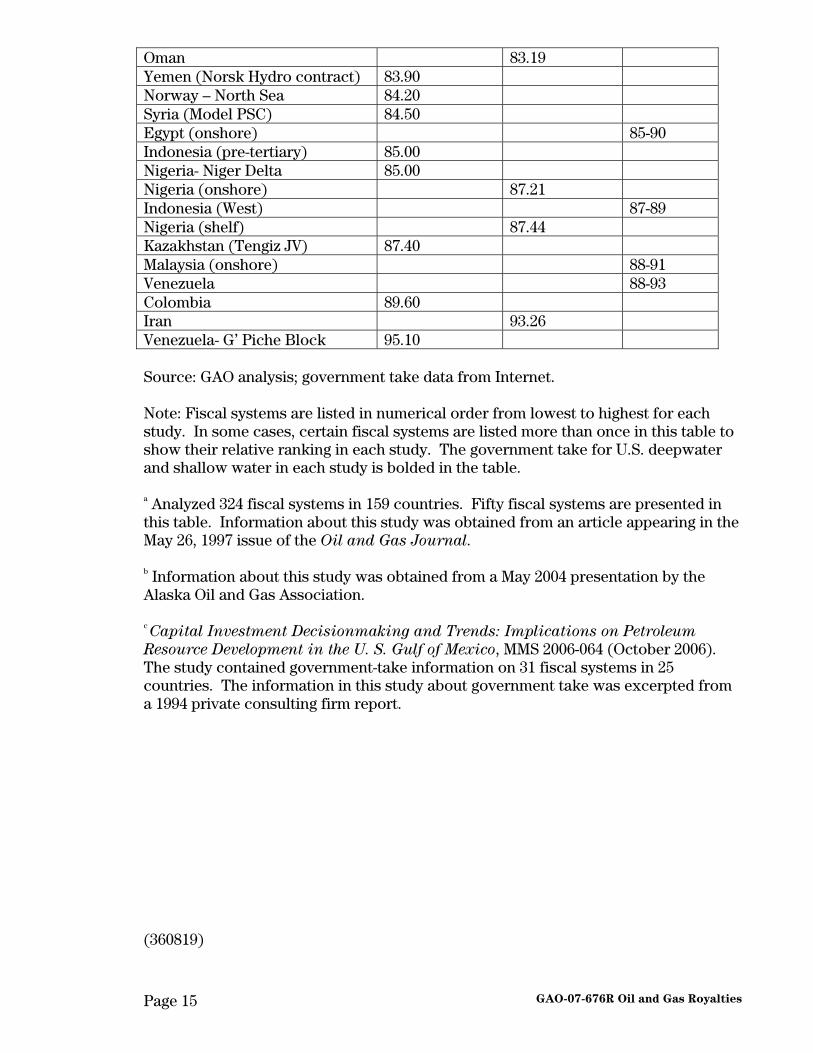
Oman 83.19 Yemen (Norsk Hydro contract) 83.90 Norway – North Sea 84.20 Syria (Model PSC) 84.50 Egypt (onshore) 85-90 Indonesia (pre-tertiary) 85.00 Nigeria- Niger Delta 85.00 Nigeria (onshore) 87.21 Indonesia (West) 87-89 Nigeria (shelf) 87.44 Kazakhstan (Tengiz JV) 87.40 Malaysia (onshore) 88-91 Venezuela 88-93 Colombia 89.60 Iran 93.26 Venezuela- G’ Piche Block 95.10 Source: GAO analysis; government take data from Internet. Note: Fiscal systems are listed in numerical order from lowest to highest for each study. In some cases, certain fiscal systems are listed more than once in this table to show their relative ranking in each study. The government take for U.S. deepwater and shallow water in each study is bolded in the table. a Analyzed 324 fiscal systems in 159 countries. Fifty fiscal systems are presented in this table. Information about this study was obtained from an article appearing in the May 26, 1997 issue of the Oil and Gas Journal. b Information about this study was obtained from a May 2004 presentation by the Alaska Oil and Gas Association. c Capital Investment Decisionmaking and Trends: Implications on Petroleum
Resource Development in the U. S. Gulf of Mexico, MMS 2006-064 (October 2006). The study contained government-take information on 31 fiscal systems in 25 countries. The information in this study about government take was excerpted from a 1994 private consulting firm report. (360819)
GAO-07-676R Oil and Gas Royalties Page 15