Embed Size (px)
Citation preview
BUS RAPID TRANSIT
Projects Improve Transit Service and Can Contribute to Economic Development
Report to the Committee on Banking, Housing, and Urban Affairs, U.S. Senate
July 2012
GAO-12-811
United States Government Accountability Office
GAO
United States Government Accountability Office
Highlights of GAO-12-811, a report to the Committee on Banking, Housing, and Urban Affairs, U.S. Senate
July 2012
BUS RAPID TRANSIT Projects Improve Transit Service and Can Contribute to Economic Development
Why GAO Did This Study
BRT is a form of transit that has generated interest around the world to help alleviate the adverse effects of traffic congestion and potentially contribute to economic growth. BRT features can include improvements to infrastructure, technology, and passenger amenities over standard bus service to improve service and attract new riders. The use of federal funding for BRT in the United States has increased since 2005, when the Safe Accountable Flexible Efficient Transportation Equity Act: A Legacy for Users expanded eligibility for major capital projects under FTA’s Capital Investment Grant Program to include corridor-based bus projects. BRT projects can be funded through New, Small, and Very Small Start grants under the Capital Investment Grant Program.
GAO was asked to examine (1) features included in BRT projects funded by the FTA; (2) BRT project performance in terms of ridership and service and how they compare to rail transit projects; (3) how BRT-projects’ costs differ from rail transit project costs; and (4) the extent to which BRT projects provide economic development and other benefits. To address these objectives, GAO sent questionnaires to officials of all 20 existing BRT and 20 existing rail-transit projects that the FTA recommended for funding from fiscal year 2005 through 2012 to collect information on project features, ridership, and service and interviewed select project sponsors. GAO also reviewed documents and interviewed government, academic, and industry group officials. The U.S. Department of Transportation did not comment on the draft report.
What GAO Found
U.S. bus rapid transit (BRT) projects we reviewed include features that distinguished BRT from standard bus service and improved riders’ experience. However, few of the projects (5 of 20) used dedicated or semi-dedicated lanes—a feature commonly associated with BRT and included in international systems to reduce travel time and attract riders. Project sponsors and planners explained that decisions on which features to incorporate into BRT projects were influenced by costs, community needs, and the ability to phase in additional features. For example, one project sponsor explained that well-lighted shelters with security cameras and real-time information displays were included to increase passengers’ sense of safety in the evening. Project sponsors told us they plan to incorporate additional features such as off-board fare collection over time.
The BRT projects we reviewed generally increased ridership and improved service over the previous transit service. Specifically, 13 of the 15 project sponsors that provided ridership data reported increases in ridership after 1 year of service and reduced average travel times of 10 to 35 percent over previous bus services. However, even with increases in ridership, U.S. BRT projects usually carry fewer total riders than rail transit projects and international BRT systems. Project sponsors and other stakeholders attribute this to higher population densities internationally and riders who prefer rail transit. However, some projects—such as the M15 BRT line in New York City—carry more than 55,000 riders per day.
Capital costs for BRT projects were generally lower than for rail transit projects and accounted for a small percent of the Federal Transit Administration’s (FTA) New, Small, and Very Small Starts’ funding although they accounted for over 50 percent of projects with grant agreements since fiscal year 2005. Project sponsors also told us that BRT projects can provide rail-like benefits at lower capital costs. However, differences in capital costs are due in part to elements needed for rail transit that are not required for BRT and can be considered in context of total riders, costs for operations, and other long-term costs such as vehicle replacement.
We found that although many factors contribute to economic development, most local officials we visited believe that BRT projects are contributing to localized economic development. For instance, officials in Cleveland told us that between $4 and $5 billion was invested near the Healthline BRT project—associated with major hospitals and universities in the corridor. Project sponsors in other cities told us that there is potential for development near BRT projects; however, development to date has been limited by broader economic conditions—most notably the recent recession. While most local officials believe that rail transit has a greater economic development potential than BRT, they agreed that certain factors can enhance BRT’s ability to contribute to economic development, including physical BRT features that relay a sense of permanence to developers; key employment and activity centers located along the corridor; and local policies and incentives that encourage transit-oriented development. Our analysis of land value changes near BRT lends support to these themes. In addition to economic development, BRT project sponsors highlighted other community benefits including quick construction and implementation and operational flexibility.
View GAO-12-811. For more information, contact David J. Wise at (202) 512-2834 or [email protected].
Page i GAO-12-811 Bus Rapid Transit
Letter 1
Background 4U.S. BRT Projects Incorporate Many Features, but Most Lack
Dedicated Running Ways 8Most BRT Projects Reported Increased Ridership and Improved
Service 20BRT Projects Generally Have Lower Capital Costs than Rail Transit 26Some BRT Projects Have Potential to Contribute to Economic
Development and Other Benefits 32Concluding Observations 40Agency Comments 41
Appendix I Project Information for Bus Rapid Transit Case Studies 43
Appendix II Objectives, Scope, and Methodology 44
Appendix III GAO Contact and Staff Acknowledgments 48
Tables
Table 1: Summary of GAO Questionnaire Results for BRT Projects’ Physical Features, by Number of Features 9
Table 2: Summary of Economic Development near BRT Case Studies 33
Table 3: Project Information for Bus Rapid Transit Case Studies 43
Figures
Figure 1: Characteristics of Bus Rapid Transit 6Figure 2: Number of BRT Projects That Reported Select Amenities
at Half or More Stations 12Figure 3: Example of a Standard Bus Stop versus Basic BRT
Station in Los Angeles 13Figure 4: Number of BRT Projects That Reported Select Features
in Half or More Vehicles 15Figure 5: Example of a BRT Vehicle Tracking System Display 17
Contents
Page ii GAO-12-811 Bus Rapid Transit
Figure 6: Percentage Change in Ridership for BRT Projects after 1 Year of Operation Compared to Previous Transit Service 21
Figure 7: BRT Projects’ Reported Travel Time Savings Compared to Previous Transit Service 22
Figure 8: Reported Average Weekday Ridership Data for First Year of Operation, by Mode 25
Figure 9: Range and Individual Capital Costs for BRT and Rail Transit Projects Receiving a Grant Agreement from Fiscal Year 2005 through February 2012 27
Figure 10: Total Number of Projects and Percentage of Total New Starts, Small Starts, and Very Small Starts Committed Funding from Fiscal Year 2005 through February 2012 28
Figure 11: Total Projects in New Starts, Small Starts, and Very Small Starts with Grant Agreements by Mode, Fiscal Year 2005 through February 2012 29
Figure 12: Land Value Changes along Cleveland’s Healthline BRT Corridor, 2006 through 2011 35
Figure 13: Land Value Changes near Eugene/Springfield, Oregon, EmX, 2005 through 2010 37
Page iii GAO-12-811 Bus Rapid Transit
Abbreviations ATA Area Transportation Authority (Kansas City) BHX Boulder Highway Express BRT bus rapid transit CR commuter rail DOT Department of Transportation EmX Emerald Express FTA Federal Transit Administration HR heavy rail ITS Intelligent Transportation Systems LTD Lane Transit District (Eugene, OR) LRT light rail transit MAX Metro Area Express (Kansas City) RTA Regional Transit Authority (Cleveland) RTC Regional Transportation Commission (Washoe County, Nevada) SAFETEA-LU Safe, Accountable, Flexible, Efficient Transportation Equity Act: A Legacy for Users TCRP Transit Cooperative Research Program TIGER Transportation Investment Generating Economic Recovery
This is a work of the U.S. government and is not subject to copyright protection in the United States. The published product may be reproduced and distributed in its entirety without further permission from GAO. However, because this work may contain copyrighted images or other material, permission from the copyright holder may be necessary if you wish to reproduce this material separately.
Page 1 GAO-12-811 Bus Rapid Transit
United States Government Accountability Office Washington, DC 20548
July 25, 2012
The Honorable Tim Johnson Chairman The Honorable Richard C. Shelby Ranking Member Committee on Banking, Housing, and Urban Affairs United States Senate
Bus rapid transit (BRT) has generated interest around the world for its potential to alleviate the adverse effects of traffic congestion and support economic growth, while generally having lower capital costs than rail transit. According to an international think tank, there are BRT corridors in more than 120 cities around the world, carrying over 27 million passengers a day.1 Many of these BRT systems incorporate dedicated lanes; large stations; higher passenger capacities; and quick service that can rival rail transit. In the U.S., BRT features vary, but generally include improvements to infrastructure, technology, and passenger amenities over standard bus service to attract new riders. BRT can provide several benefits to riders and the community, including improved mobility and reliability for riders, reduced travel times, reduced carbon emissions, and increased economic development.2
Since 2005, opportunities for federal capital funding for BRT projects in the U.S. have expanded due in part to changes made in the Safe, Accountable, Flexible, Efficient Transportation Equity Act: A Legacy for Users (SAFETEA-LU).
3 Specifically, SAFETEA-LU revised eligibility for major capital investment projects4
1 The World Resources Institute.
to include not only fixed-guideway systems but also corridor-based bus capital projects if specific criteria are
2 Public transit investments are one of many factors determining a locale’s economic development. 3 Pub. L. No. 109-59, 119 Stat. 1144 (Aug. 10, 2005). 4 49 U.S.C. § 5309(b)(1).
Page 2 GAO-12-811 Bus Rapid Transit
met.5
You asked us to examine the features of BRT projects recommended for funding by the Federal Transit Administration (FTA), as well as assess how these projects compare to rail transit. Accordingly, this report addresses the following four questions:
In a fiscal environment in which state and local governments are looking to build high-capacity transit systems with limited funding, BRT has emerged as a potentially cost-effective alternative to new or extended rail transit projects.
1. Which BRT features are included in BRT projects and why? 2. How have BRT projects performed in terms of ridership and service
and how do they compare to rail transit projects? 3. How do the costs of these projects differ from rail transit projects? 4. To what extent do BRT projects provide economic development and
other benefits to communities?
To determine which features are included in BRT projects and information on ridership and service, we sent questionnaires to the sponsors of all 20 completed BRT projects since fiscal year 2005 that FTA recommended for New Start, Small Start, Very Small Start, or Bus and Bus Facilities
5 Fixed-guideway systems use and occupy a separate right-of-way for the exclusive use of public transportation services, such as fixed rail and exclusive lanes for buses and other high-occupancy vehicles. According to FTA officials, the criteria FTA uses to determine if corridor based bus projects qualify as a fixed guideway system under 49 U.S.C. § 5309(b)(1) follows language in SAFETEA-LU that allows corridor-based bus capital projects if— ‘‘(A) a substantial portion of the project operates in a separate right-of-way dedicated for public transit use during peak hour operations; or ‘(B) the project represents a substantial investment in a defined corridor as demonstrated by features such as park-and-ride lots, transit stations, bus arrival and departure signage, intelligent transportation systems technology, traffic signal priority, off-board fare collection, advanced bus technology, and other features that support the long-term corridor investment.” See 49 U.S.C. § 5309(e)(10).
Page 3 GAO-12-811 Bus Rapid Transit
funding under the Capital Investment Grant program.6,7 We prepopulated the questionnaires with information on BRT features and service obtained from an existing interest group’s BRT database, project websites, and other project sponsor documentation submitted to FTA and asked project sponsors to verify or correct the prepopulated information and complete any missing information.8 In addition, we visited five BRT projects to obtain information about why certain BRT features were or were not included in the projects.9 (see app. 1.) Information from these visits cannot be generalized to all BRT projects. To assess how all 20 BRT projects have performed in terms of ridership and service and how they compare to all 20 rail transit projects, we used data from the completed BRT project questionnaires, and compared this data to the data from the questionnaires we sent to the sponsors of all completed rail transit projects that met the criteria outline above.10
6 The Capital Investment Grant Program also includes Fixed Guideway Modernization grants and Exempt projects that are not included in our scope. 49 U.S.C. § 5309. Within our scope, BusPlus, Franklin EmX, MetroRapid 741, M15, BHX, and RTC Rapid received grants through Bus and Bus Facilities. All others received grants through New Starts, Small Starts, or Very Small Starts.
We also reviewed existing literature on BRT and rail transit projects’ ridership and service levels. To assess how BRT projects compare to rail transit projects in terms of capital project costs and New Starts, Small Starts, or Very Small Starts share of funding, we collected and analyzed project grant data compiled by FTA. We included 55 (30 BRT and 25 rail transit) planned or completed projects that had construction grant agreements from fiscal year 2005 through February 2012. To verify and assess the reliability of
7 A New Starts projects is a project that has a total estimated capital project cost of $250 million or more or a New Starts contribution of $75 million or more. A Small Starts project has a total estimated project capital cost of under $250 million and a Small Starts contribution of under $75 million. Very Small Starts are very low cost projects within the Small Starts program that have an even further streamlined evaluation and rating process. Projects may also have other sources of federal funds, such as Federal Highway Administration’s Congestion Mitigation and Air Quality Improvement funds. 8 We received completed questionnaires for all 20 BRT projects in our scope for a response rate of 100 percent. 9 We interviewed project sponsors and visited the following BRT projects: the Healthline in Cleveland, OH; the RapidRide A Line in Seattle, WA; the Troost MAX in Kansas City, MO; the Metro Rapid System in Los Angeles, CA; and the Franklin EmX in Eugene, OR. Information obtained from our site visits is limited to the 5 BRT projects we visited. 10 For rail transit projects, we received completed questionnaires for 18 of the 20 rail transit projects in our scope for a response rate of 90 percent.
Page 4 GAO-12-811 Bus Rapid Transit
the data compiled by FTA, we compared and updated project capital cost data based on FTA’s Annual Reports on Funding Recommendations for fiscal years 2005 through 2012. To examine the extent to which BRT projects stimulate economic development and other benefits to communities, we reviewed existing literature on the impact of transit on economic development and land values. Also, during our five site visits—selected by consideration of several factors, including the number and extent of BRT features as well as ridership, length of route, peak headway, and geographic diversity—we interviewed project sponsors, transit experts, non-profit business organizations, and economic development professionals about development that has occurred (or is expected to occur) in and around the BRT corridors. To supplement testimonial evidence obtained during site-visit interviews, we collected land value assessment data for properties located within ¼ mile of the five BRT projects we visited and analyzed trends in the assessed inflation adjusted value of these properties for the 2 years prior to the project’s implementation to the 3 years after it began operating.11
We conducted this performance audit from July 2011 through July 2012 in accordance with generally accepted government auditing standards. Those standards require that we plan and perform the audit to obtain sufficient, appropriate evidence to provide a reasonable basis for our findings and conclusions based on our audit objectives. We believe that the evidence obtained provides a reasonable basis for our findings and conclusions based on our audit objectives. See appendix II for more information about our scope and methodology.
In addition to collecting data from FTA and sponsors of BRT and rail transit projects, we also reviewed relevant academic literature on BRT and rail transit and interviewed academic experts and BRT stakeholders.
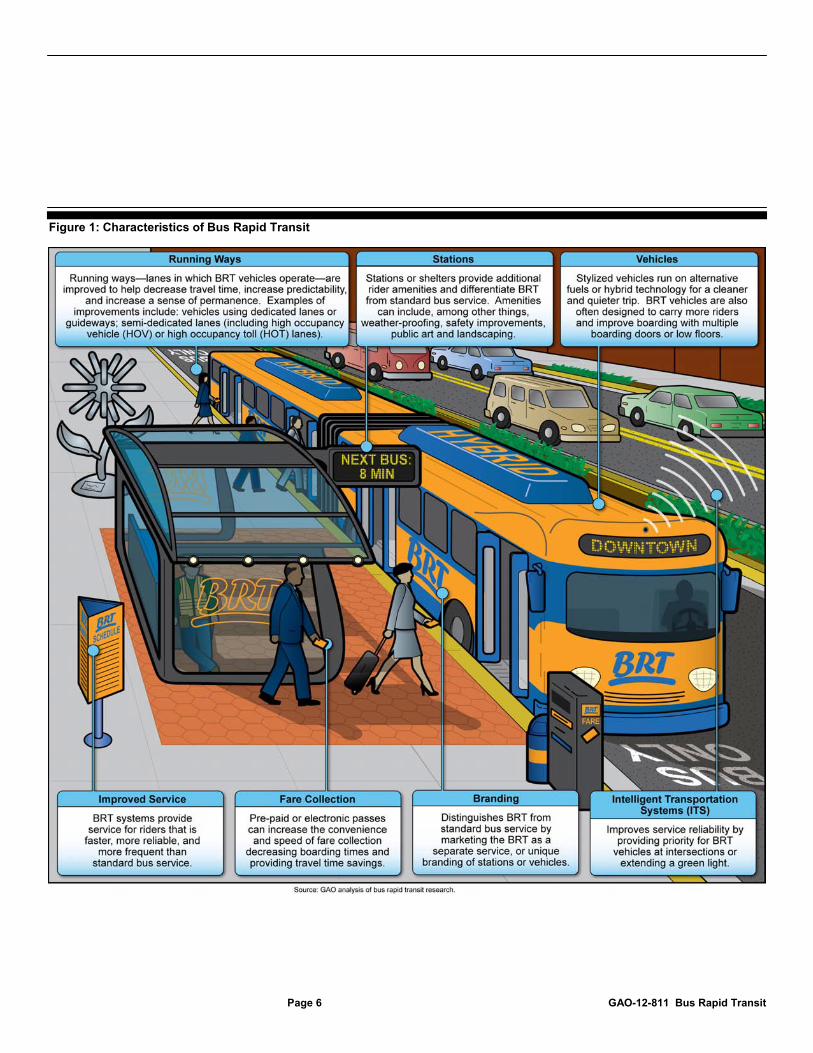
In the U.S., while BRT projects vary in design, they generally include service enhancements designed to attract riders and provide similar transit-related benefits to rail transit. Specifically, as shown in figure 1, BRT generally includes improvements to seven features–running ways,
11 We collected data from five locations; however we are only reporting data from Cleveland and Eugene. For other locations, preliminary analysis did not find changes in land values, data did not separate out land values, or the project was too new to analyze the land values after opening.
Background
Page 5 GAO-12-811 Bus Rapid Transit
stations, vehicles, intelligent transportation systems, fare collection, branding, and service.12
These enhancements are designed to replicate features found in rail transit and provide similar benefits including increases in ridership, travel time savings, and contribution to economic development. While few existing studies have examined the link between BRT and economic development, numerous studies have investigated the link between rail transit and economic development.
13 We have previously reported that, overall, these studies have shown that the presence of rail transit tends to positively impact surrounding land and housing values.14 However, in some cases the increases are modest and the impact throughout an entire system can vary depending on several characteristics. For instance, retail development, higher relative incomes, and proximity to job centers, parks, or other neighborhood amenities tend to increase land and housing values near transit, while non-transit oriented land uses, crime, and poor economic environments around a transit station can limit increases or even be a negative influence.15
12 GAO, Intelligent Transportation Systems: Improved DOT Collaboration and Communication Could Enhance the Use of Technology to Manage Congestion, GAO-12-308. (Washington, D.C.: March, 2012). 13 We identified studies on BRT and economic development which are primarily based on case study examples and are in some cases based on foreign examples and acknowledge limitations. These studies suggest that BRT can increase property values and promote various forms of economic development in nearby communities. 14 GAO, Affordable Housing in Transit-Oriented Development: Key Practices Could Enhance Recent Collaboration Efforts between DOT-FTA and HUD, GAO-09-871, (Washington, D.C.: Sept. 9, 2009). 15 GAO-09-871.
Page 6 GAO-12-811 Bus Rapid Transit
Figure 1: Characteristics of Bus Rapid Transit
Page 7 GAO-12-811 Bus Rapid Transit
In the U.S., multiple federal-funding sources have supported BRT systems. FTA’s Capital Investment Grant program provides capital funds to help project sponsors build larger-dollar new or extensions to existing fixed guideway transit capital systems—often referred to as “New Starts projects.” In 2005, SAFETEA-LU established the Small Starts program within the Capital Investment Grant program; the Small Starts program simplifies the New Starts evaluation and rating criteria and steps in the project development process to lower cost projects. It also added corridor-based bus systems as eligible projects.16 According to FTA’s guidance, BRT projects must (1) meet the definition of a fixed-guideway for at least 50 percent of the project length in the peak period or (2) be a corridor-based bus project with certain elements to qualify as a Small Starts project.17
16 Under the Moving Ahead for Progress in the 21st Century Act, or MAP-21, a corridor-based bus rapid transit project, in which the majority of the project does not operate in a separated right-of-way dedicated for public transportation use during peak periods, is eligible for Small Starts funding; New Starts funding eligibility is limited to those fixed guideway bus rapid transit projects in which the majority of the project operates in a separated right-of-way dedicated for public transportation use during peak periods. See sections 20004 and 20008 of Pub. L. No. 112-141 (July 6, 2012).
FTA subsequently introduced a further streamlined evaluation and rating process for very low cost projects within the Small Starts program, which FTA calls Very Small Starts. Very Small Starts are projects that must contain the same elements as Small Starts projects and also contain the following three features: be located in corridors with more than 3,000 existing transit riders per average weekday who will benefit from the proposed project; have a total capital cost of less than $50 million (for all project elements); and have a per-mile cost of less than $3 million, excluding rolling stock (e.g., buses and train cars). Any transit project that fits the broader definition of a fixed-guideway system is eligible, whether it is a BRT, streetcar, or other rail transit project (e.g.,
17 Fixed-guideway systems use and occupy a separate right-of-way for the exclusive use of public transportation services, such as fixed rail and exclusive lanes for buses and other high-occupancy vehicles. For Small Starts projects, the fixed-guideway portion of the project need not be contiguous, but it should be located to result in faster and more reliable running times. Peak period refers to periods with high ridership or demand.
Page 8 GAO-12-811 Bus Rapid Transit
commuter rail, heavy rail, and light rail).18 BRT projects are also eligible for federal funding from other sources such as Congestion Mitigation and Air Quality Improvement grants, the Urbanized Area Formula grants, and the U.S. Department of Transportation’s Transportation Investment Generating Economic Recovery discretionary grants (TIGER).19
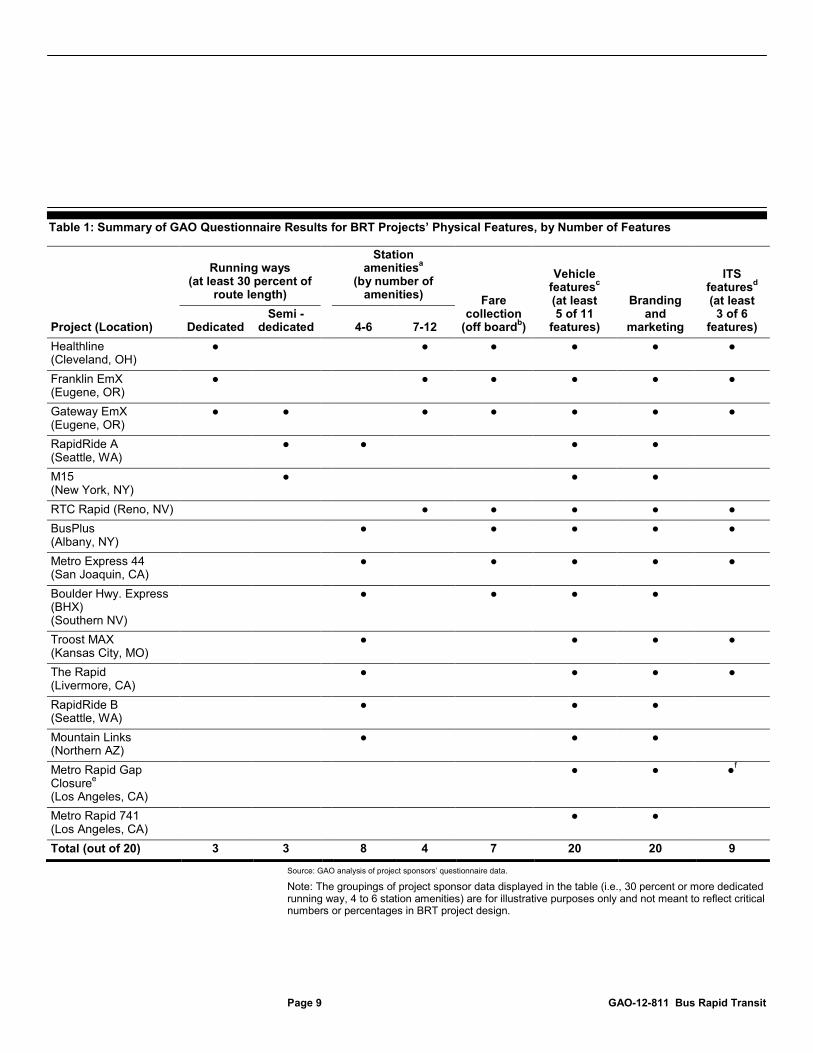
Based on our questionnaire results, we found that many U.S. BRT projects incorporate at least some station amenities and most other BRT features that distinguish them from standard bus service, and improve riders’ transit experience. However, few BRT project sponsors reported the use of dedicated or semi-dedicated running ways for at least 30 percent of the route and less than half use off-board fare collection infrastructure (see Table 1 for an overview of BRT projects’ physical features).20
18 Commuter rail systems operate along electric or diesel-propelled railways and provide train service for local, short distance trips between a central city and adjacent suburbs. Heavy rail systems operate on electric railways with high-volume traffic capacity and are characterized by separated rights-of-way, sophisticated signaling, high platform loading, and high-speed, rapid-acceleration rail cars operating singly or in multi-car trains on fixed rails. Light rail systems operate on electric railways with light-volume traffic capacity and are characterized by shared or exclusive rights-of-way, low or high platform loading, single or double car trains, and overhead electric lines that power rail vehicles. 19 TIGER grants to communities fund road, rail, transit, and port projects expected to have a significant impact on the nation, a region, or a metropolitan area. 20 The table includes the six physical features included in the questionnaire; the improved service feature is discussed later in this report.
U.S. BRT Projects Incorporate Many Features, but Most Lack Dedicated Running Ways
BRT Projects’ Features
Page 9 GAO-12-811 Bus Rapid Transit
Table 1: Summary of GAO Questionnaire Results for BRT Projects’ Physical Features, by Number of Features
Project (Location)
Running ways (at least 30 percent of
route length)
Station amenitiesa
Fare collection
(off board
(by number of
amenities)
b
Vehicle features
)
c
Branding and
marketing
(at least 5 of 11
features)
ITS featuresd
Dedicated
(at least
3 of 6 features)
Semi -dedicated 4-6 7-12
Healthline (Cleveland, OH)
● ● ● ● ● ●
Franklin EmX (Eugene, OR)
● ● ● ● ● ●
Gateway EmX (Eugene, OR)
● ● ● ● ● ● ●
RapidRide A (Seattle, WA)
● ● ● ●
M15 (New York, NY)
● ● ●
RTC Rapid (Reno, NV) ● ● ● ● ● BusPlus (Albany, NY)
● ● ● ● ●
Metro Express 44 (San Joaquin, CA)
● ● ● ● ●
Boulder Hwy. Express (BHX) (Southern NV)
● ● ● ●
Troost MAX (Kansas City, MO)
● ● ● ●
The Rapid (Livermore, CA)
● ● ● ●
RapidRide B (Seattle, WA)
● ● ●
Mountain Links (Northern AZ)
● ● ●
Metro Rapid Gap Closuree
(Los Angeles, CA)
● ● ●
Metro Rapid 741 (Los Angeles, CA)
f
● ●
Total (out of 20) 3 3 8 4 7 20 20 9
Source: GAO analysis of project sponsors’ questionnaire data.
Note: The groupings of project sponsor data displayed in the table (i.e., 30 percent or more dedicated running way, 4 to 6 station amenities) are for illustrative purposes only and not meant to reflect critical numbers or percentages in BRT project design.
Page 10 GAO-12-811 Bus Rapid Transit
aOur questionnaire asked BRT project sponsors to provide information about 12 amenities commonly associated with BRT stations, including: greater curb width or raised curb; route maps and schedules; safety improvements; next bus displays; level boarding; public art, and landscaping; seating; bicycle parking; physically separated passing lane; median-located stations; nearby park and ride lots; and weather protection. bOur questionnaire asked BRT project sponsors to provide information about off-board fare collection infrastructure, including off-board fare card vending machines and off-board barrier systems. cOur questionnaire asked BRT project sponsors to provide information about 11 BRT vehicle features, including: low floors, multiple boarding doors, internal bike racks, vehicle guidance technology, security cameras, audio stop announcements, visual stop announcements, technology for expedited wheelchair boarding, and whether buses were lower-emissions vehicles, articulated, and distinguishable from other buses. dOur questionnaire asked BRT project sponsors to provide information about six intelligent transportation systems: transit signal priority, transit signal preemption, “queue jumps,” vehicle tracking systems, automated scheduling dispatch systems, and collision warning systems. eThe Gap Closure Project includes six Metro Rapid routes: 762, 770, 728, 794, 733, and CC-6. f
Metro Rapid Route 733.
Our questionnaire results indicate that most BRT projects (16 of 20) operate in mixed traffic—primarily arterial streets—for 50 percent or more of their routes.21 In contrast, 5 of the 20 BRT projects travel along a dedicated or semi-dedicated running way for 30 percent or more of their routes.22 According to FTA research, BRT projects with more fully dedicated running ways generally experience the greatest travel time savings as compared to the corridors’ local bus route. (See below for other BRT features that affect travel time savings.) However, our analysis of questionnaire data did not show a correlation between the type of running ways BRT projects operate on and travel time savings.23
21 Arterial streets typically have intersections with traffic signals, whereas freeways have entrance and exit ramps and use methods such as signs and gates to control access.
For example, Cleveland’s Healthline and the M15 in New York City operate along fully or semi-dedicated running ways for at least 60 percent of their routes, but these projects did not achieve the same percentage gains in travel time savings as projects such as Kansas City’s Troost MAX or Mountain Links in Arizona, both of which run in mixed traffic for at least 75 percent of their routes. Some of the difference between our results and those of previous research may be attributable to the relative lack of
22 One of the projects—Eugene’s Gateway EmX—uses both a semi-dedicated running way and a dedicated running way for 30 percent or more of its route; therefore, it is counted only once in this statistic. 23 Four of the 20 BRT project sponsors did not report data on travel time savings because the BRT either did not replace a previous route or it operated for less than a full year when the questionnaire was completed.
Running Ways
Page 11 GAO-12-811 Bus Rapid Transit
congestion in some of the BRT corridors, which helps these projects generate travel time savings while running in mixed traffic. For instance, the Troost MAX reported the highest travel time savings of any project, yet it runs almost entirely in mixed traffic along a corridor with minimal traffic congestion. In contrast, previous BRT research often includes international and other U.S. BRTs, such as the TransMilenio in Bogota, Columbia, and the East Busway in Pittsburgh, Pennsylvania, that have used dedicated running ways to achieve significant travel time savings because of the cities’ congestion levels.
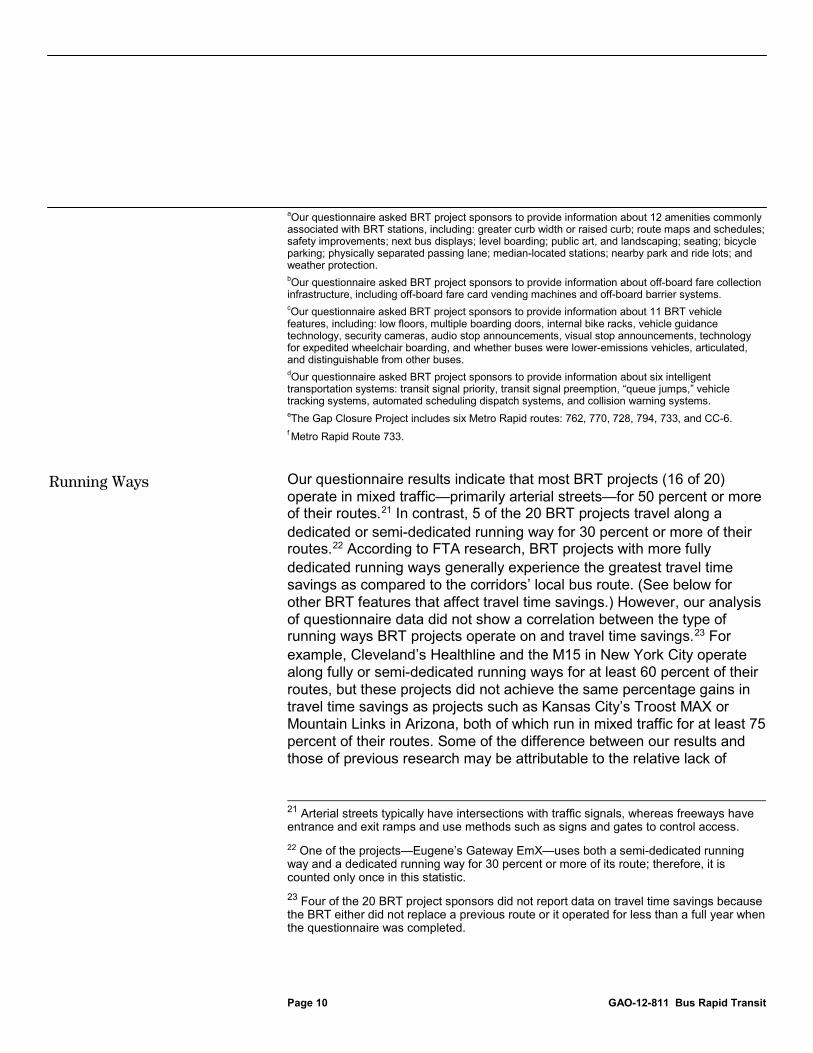
According to FTA research, station amenities can help shape the identity of a BRT project by portraying a premium service and enhancing the local environment. Based on responses to our questionnaire, most BRT projects (12 of 20) have at least four station amenities present at half or more of their stations, while four projects include at least seven amenities. The most common station amenities reported by BRT project sponsors included seating, weather protection, level boarding, and route maps and schedules. (See fig. 2.) Cleveland’s Healthline and Eugene’s Franklin and Gateway EmX incorporate the most station amenities. However, U.S. BRT projects generally do not include stations of the size and scale of those found in Latin American BRT systems such as Curitiba, Brazil; Bogota, Columbia; or Mexico City, Mexico.
Station Amenities
Page 12 GAO-12-811 Bus Rapid Transit
Figure 2: Number of BRT Projects That Reported Select Amenities at Half or More Stations
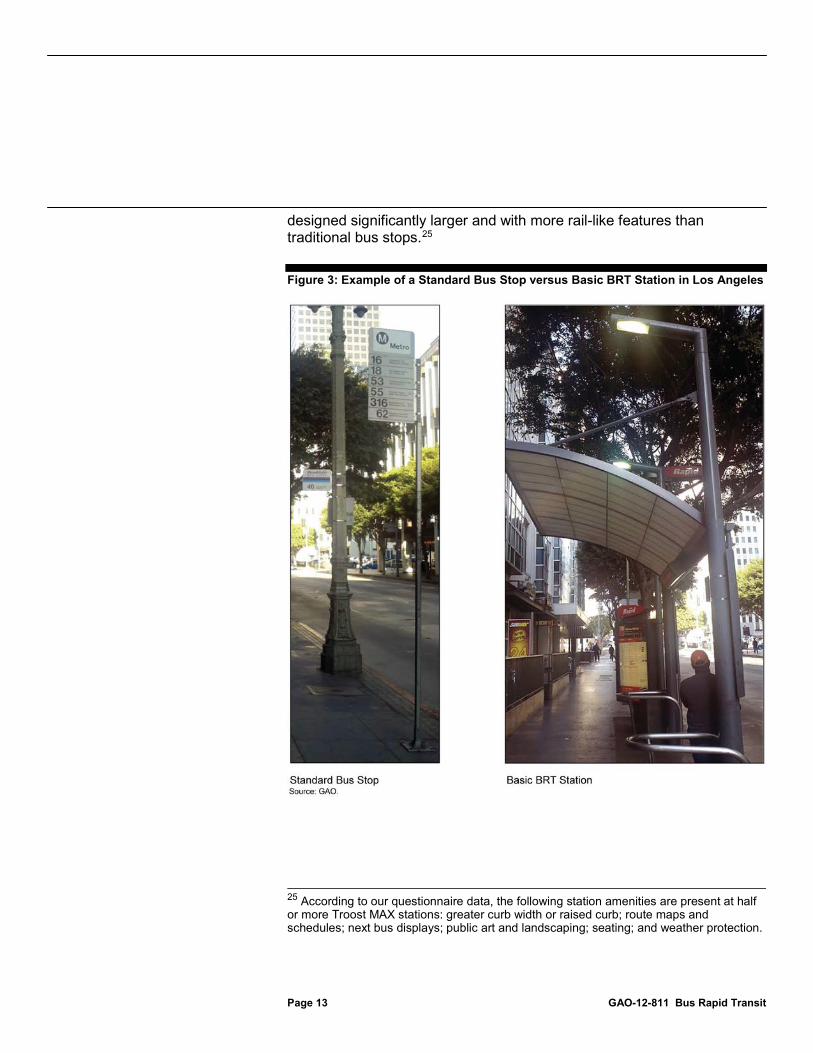
Through our site visits we found that BRT stations providing relatively few amenities may still be enhanced compared to standard bus stops in the same area. For example, in Los Angeles, standard bus stops are designated by a single flagged pole with limited route information, whereas all Metro Rapid stations provide detailed route information and many will have weather protection and safety improvements, such as lighting.24
24 Los Angeles Metro staff informed us that these bus stop improvements have been funded, but not yet implemented in all locations.
(See fig. 3.) Likewise, Kansas City Area Transportation Authority (ATA) officials informed us that Troost MAX stops were
Page 13 GAO-12-811 Bus Rapid Transit
designed significantly larger and with more rail-like features than traditional bus stops.25
Figure 3: Example of a Standard Bus Stop versus Basic BRT Station in Los Angeles
25 According to our questionnaire data, the following station amenities are present at half or more Troost MAX stations: greater curb width or raised curb; route maps and schedules; next bus displays; public art and landscaping; seating; and weather protection.
Page 14 GAO-12-811 Bus Rapid Transit
BRT projects have different combinations of fare collection and verification methods. According to our questionnaire results, most BRT projects (14 of 20) allow on-board driver validation—typical of standard bus service—as a fare collection option for riders.26 Fewer projects incorporate alternative fare collection methods, such as proof-of-payment systems that allow riders to board without presenting payment directly to a driver, or off-board fare collection infrastructure (i.e., fare card vending machines or barrier systems). Specifically, half of the project sponsors (10 of 20) reported that their projects use a proof-of-payment system and seven reported that their projects incorporate off-board fare collection infrastructure.27
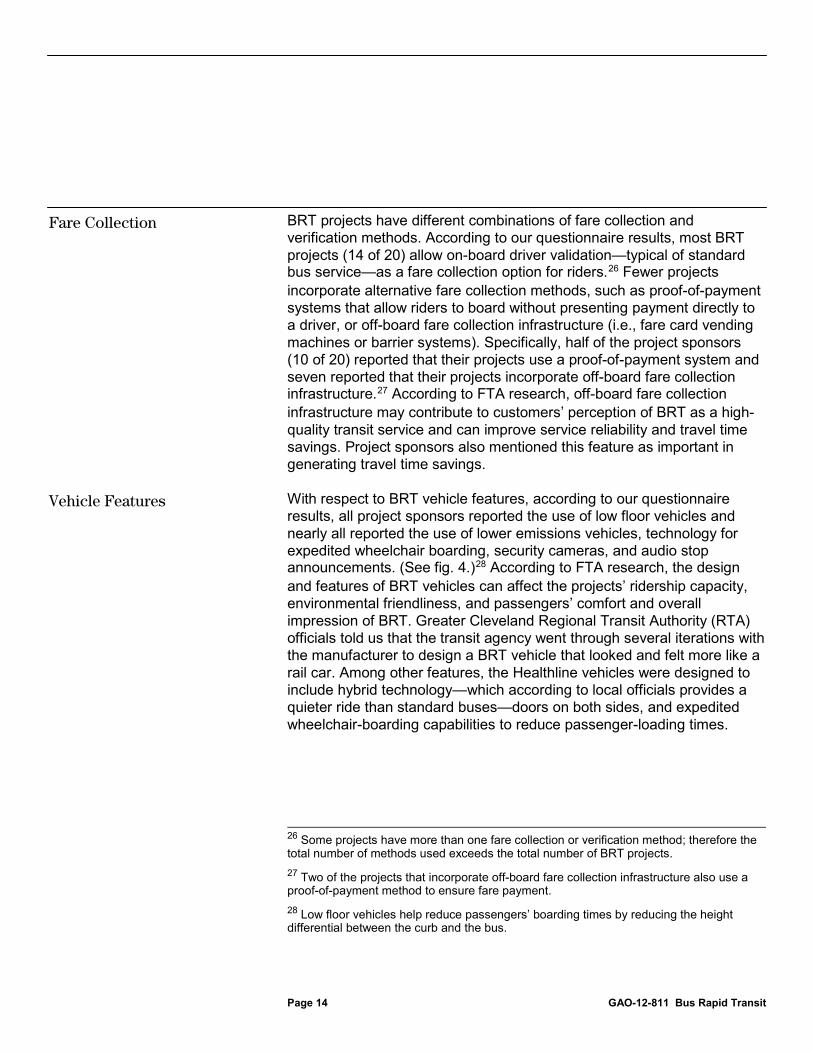
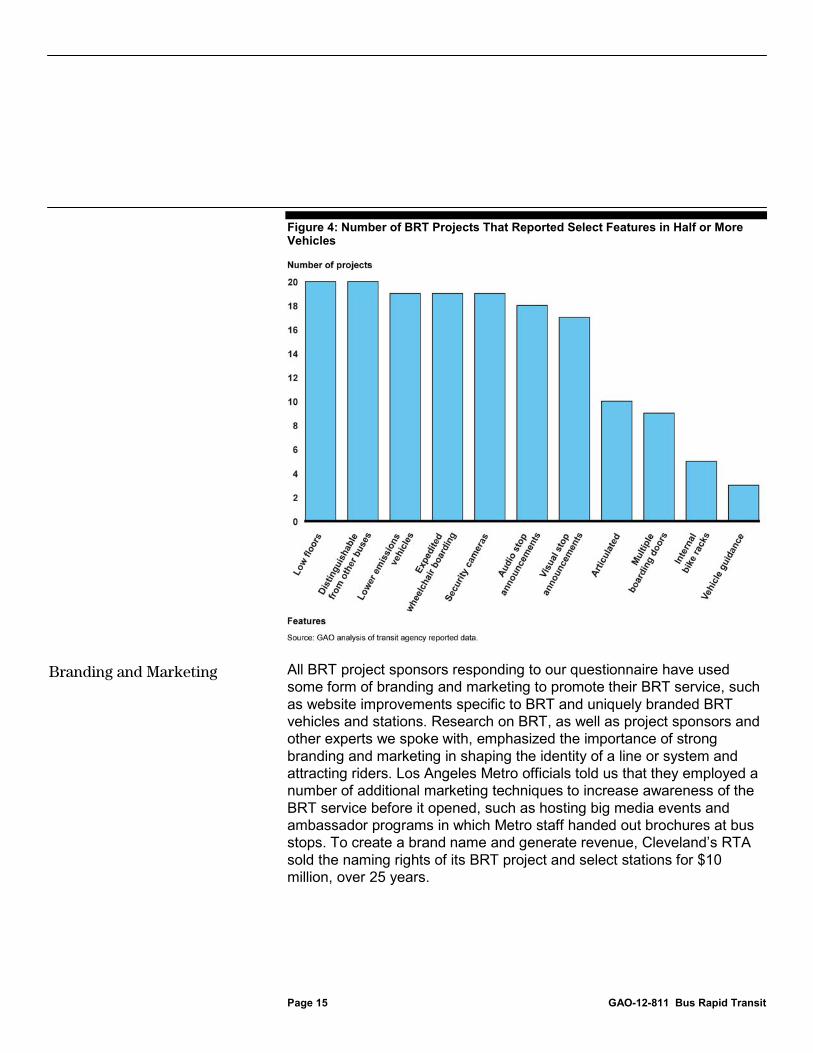
With respect to BRT vehicle features, according to our questionnaire results, all project sponsors reported the use of low floor vehicles and nearly all reported the use of lower emissions vehicles, technology for expedited wheelchair boarding, security cameras, and audio stop announcements. (See fig. 4.)
According to FTA research, off-board fare collection infrastructure may contribute to customers’ perception of BRT as a high-quality transit service and can improve service reliability and travel time savings. Project sponsors also mentioned this feature as important in generating travel time savings.
28
26 Some projects have more than one fare collection or verification method; therefore the total number of methods used exceeds the total number of BRT projects.
According to FTA research, the design and features of BRT vehicles can affect the projects’ ridership capacity, environmental friendliness, and passengers’ comfort and overall impression of BRT. Greater Cleveland Regional Transit Authority (RTA) officials told us that the transit agency went through several iterations with the manufacturer to design a BRT vehicle that looked and felt more like a rail car. Among other features, the Healthline vehicles were designed to include hybrid technology—which according to local officials provides a quieter ride than standard buses—doors on both sides, and expedited wheelchair-boarding capabilities to reduce passenger-loading times.
27 Two of the projects that incorporate off-board fare collection infrastructure also use a proof-of-payment method to ensure fare payment. 28 Low floor vehicles help reduce passengers’ boarding times by reducing the height differential between the curb and the bus.
Fare Collection
Vehicle Features
Page 15 GAO-12-811 Bus Rapid Transit
Figure 4: Number of BRT Projects That Reported Select Features in Half or More Vehicles
All BRT project sponsors responding to our questionnaire have used some form of branding and marketing to promote their BRT service, such as website improvements specific to BRT and uniquely branded BRT vehicles and stations. Research on BRT, as well as project sponsors and other experts we spoke with, emphasized the importance of strong branding and marketing in shaping the identity of a line or system and attracting riders. Los Angeles Metro officials told us that they employed a number of additional marketing techniques to increase awareness of the BRT service before it opened, such as hosting big media events and ambassador programs in which Metro staff handed out brochures at bus stops. To create a brand name and generate revenue, Cleveland’s RTA sold the naming rights of its BRT project and select stations for $10 million, over 25 years.
Branding and Marketing
Page 16 GAO-12-811 Bus Rapid Transit
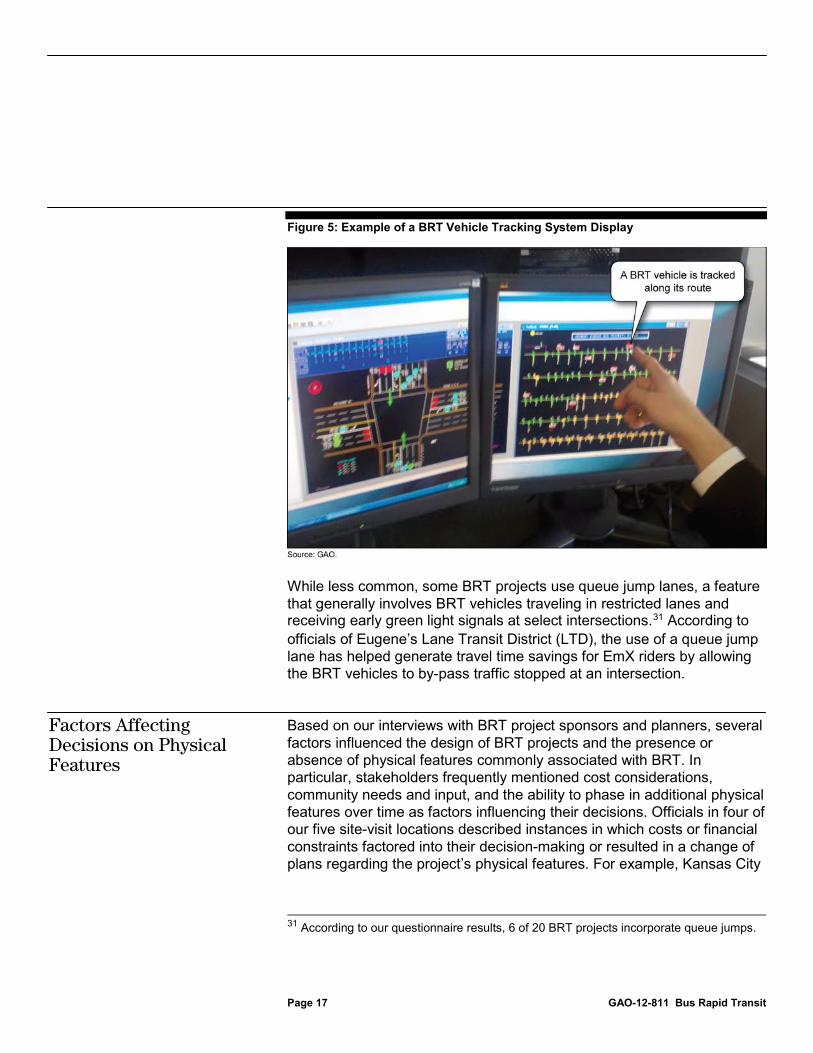
According to responses to our questionnaire, 9 BRT projects have at least 3 of the 6 Intelligent Transportation Systems (ITS) features and almost all (18 of 20) incorporate at least one feature. The most common ITS technologies included as part of BRT projects were transit signal priority systems (18 of 20), and vehicle tracking systems (17 of 20), which monitor vehicles to ensure arrivals are evenly spaced and transit connections are on schedule. (See fig. 5 for an example.)29 Research by FTA and others has found that incorporating ITS into BRT projects can help transit agencies increase safety, operational efficiency, and quality of service. In addition, these systems can improve riders’ access to reliable and timely information. Los Angeles Metro officials told us that traffic signal priority represents one of Metro Rapid’s most important attributes. These officials informed us that while the system does not override traffic lights, it can extend green signals to get BRT vehicles through the lights and to the next stop, helping keep the vehicles on time.30
29 Transit signal priority systems can alter the timing of traffic signals in various ways to give priority to BRT vehicles at intersections. New York City Transit’s M15 project was not included in these counts; however, according to the project sponsors, several ITS technologies will be incorporated throughout 2012 and 2013, including transit signal priority and vehicle tracking systems.
30 Transit signal-preemption systems override traffic signals, for example, by changing a red light to green as a BRT vehicle approaches an intersection. Based on our survey results, none of the existing BRT projects incorporate this feature.
Intelligent Transportation Systems Features
Page 17 GAO-12-811 Bus Rapid Transit
Figure 5: Example of a BRT Vehicle Tracking System Display
While less common, some BRT projects use queue jump lanes, a feature that generally involves BRT vehicles traveling in restricted lanes and receiving early green light signals at select intersections.31
According to officials of Eugene’s Lane Transit District (LTD), the use of a queue jump lane has helped generate travel time savings for EmX riders by allowing the BRT vehicles to by-pass traffic stopped at an intersection.
Based on our interviews with BRT project sponsors and planners, several factors influenced the design of BRT projects and the presence or absence of physical features commonly associated with BRT. In particular, stakeholders frequently mentioned cost considerations, community needs and input, and the ability to phase in additional physical features over time as factors influencing their decisions. Officials in four of our five site-visit locations described instances in which costs or financial constraints factored into their decision-making or resulted in a change of plans regarding the project’s physical features. For example, Kansas City
31 According to our questionnaire results, 6 of 20 BRT projects incorporate queue jumps.
Factors Affecting Decisions on Physical Features
Page 18 GAO-12-811 Bus Rapid Transit
ATA officials told us that a dedicated running way was not acquired for the Troost MAX in part because this feature would have added costs without providing substantial travel time savings benefits given Troost Avenue’s minimal traffic congestion. In Seattle, King County Metro officials told us that several common BRT features, including level or raised boarding and off-board ticket or fare card vending machines, were not incorporated into the RapidRide system because of costs. For instance, they explained that level or raised boarding was not included because of the costs associated with implementing this feature at a large number of stations and stops (120 and 155 respectively) and addressing the limitations of the different sites.
Three projects we visited during site visits were Very Small Starts projects and therefore, had total project capital costs of less than $50 million. (See app. I for the list of our case study projects.) The sponsors of two of these projects told us that while Very Small Starts projects can create incentives for communities to pursue BRT by offering streamlined requirements and grants for up to 80 percent of a project’s total capital cost, the program’s $50-million limit on projects’ total capital costs provides an incentive to keep costs low. As a result, project sponsors may only incorporate those physical features that are the most cost-effective or critical to achieving the projects’ objectives and omit other features commonly associated with BRT.
Several project sponsors we visited also mentioned that the input of community residents, business owners, and other stakeholders affected by a project can help shape final decisions about its design and features, for instance:
• Los Angeles city officials explained that only 80 percent of the Wilshire Metro Rapid route within the city limits will have bus-only lanes during weekday peak hours because some neighborhoods resisted bus-only lanes and were unwilling to give up a travel lane on such a congested street.
• Officials in Eugene told us that the Franklin Avenue EmX was originally intended to run on a dedicated running way for 90 percent of its route. However, in part due to the public input process, which raised concerns over loss of parking and business access, the agency reduced the dedicated portion of the route to 50 percent.
Page 19 GAO-12-811 Bus Rapid Transit
• Kansas City ATA officials explained that residents’ safety concerns along Troost Avenue resulted in well-lighted shelters designed with transparent backings and real-time information displays, which helped increase passengers’ sense of safety while waiting for the bus during the evening. Several major stations were also equipped with security cameras.
Some transit experts we spoke to also pointed out that some BRT features may not be incorporated into a project’s initial design, since—unlike rail transit projects—it is fairly easy to add features to BRT projects after they start operating. Moreover, project sponsors in four of the five site-visit locations told us that they plan to incorporate (or are considering incorporating) additional features into their BRT projects. According to local officials, Eugene’s transit agency may increase the portion of the EmX line that runs on a designated running way, particularly through sections of neighboring Springfield that are planned for redevelopment. These officials noted that stakeholders generally view the EmX’s implementation as an incremental process and its flexibility as an important benefit. In Seattle, transit agency staff explained that although level boarding and off-board fare card vending machines were not incorporated into the initial design of the RapidRide lines, these features will be periodically reevaluated for future lines and off-board fare card vending machines may be added to some locations on existing lines.
Page 20 GAO-12-811 Bus Rapid Transit
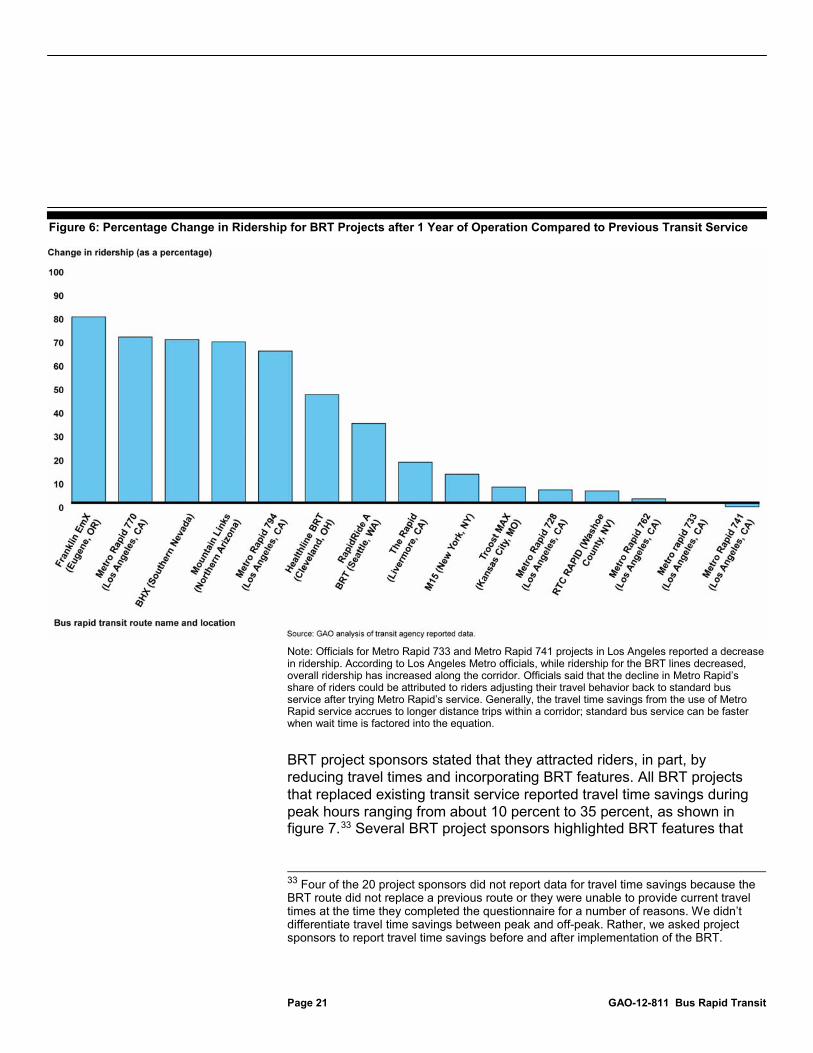
For systems where changes in ridership could be calculated, almost all BRT project sponsors (13 of 15), reported increased ridership over the previous transit service—typically a standard bus service—according to results from our questionnaires (see fig. 6.)32
32 We could not calculate ridership changes for five of the 20 BRT projects because the BRT route either did not replace a previous route or the BRT operated for less than a full year when the project sponsors filled out the questionnaires. Project sponsors were not asked to report the type of service the BRT route replaced.
Of the 13 existing BRT projects that increased ridership, more than half (7 of 13) reported increases of 30 percent or more during the first year of service. Three of the eight BRT project sponsors who reported ridership data for additional years continued to increase ridership. For example, ridership for the RTC Rapid in Nevada increased at least 5 percent each year for the first 3 years of service.
Most BRT Projects Reported Increased Ridership and Improved Service
BRT Increased Ridership and Travel Time Savings, Although Rail Transit Generally Serves More Riders
Page 21 GAO-12-811 Bus Rapid Transit
Figure 6: Percentage Change in Ridership for BRT Projects after 1 Year of Operation Compared to Previous Transit Service
Note: Officials for Metro Rapid 733 and Metro Rapid 741 projects in Los Angeles reported a decrease in ridership. According to Los Angeles Metro officials, while ridership for the BRT lines decreased, overall ridership has increased along the corridor. Officials said that the decline in Metro Rapid’s share of riders could be attributed to riders adjusting their travel behavior back to standard bus service after trying Metro Rapid’s service. Generally, the travel time savings from the use of Metro Rapid service accrues to longer distance trips within a corridor; standard bus service can be faster when wait time is factored into the equation.
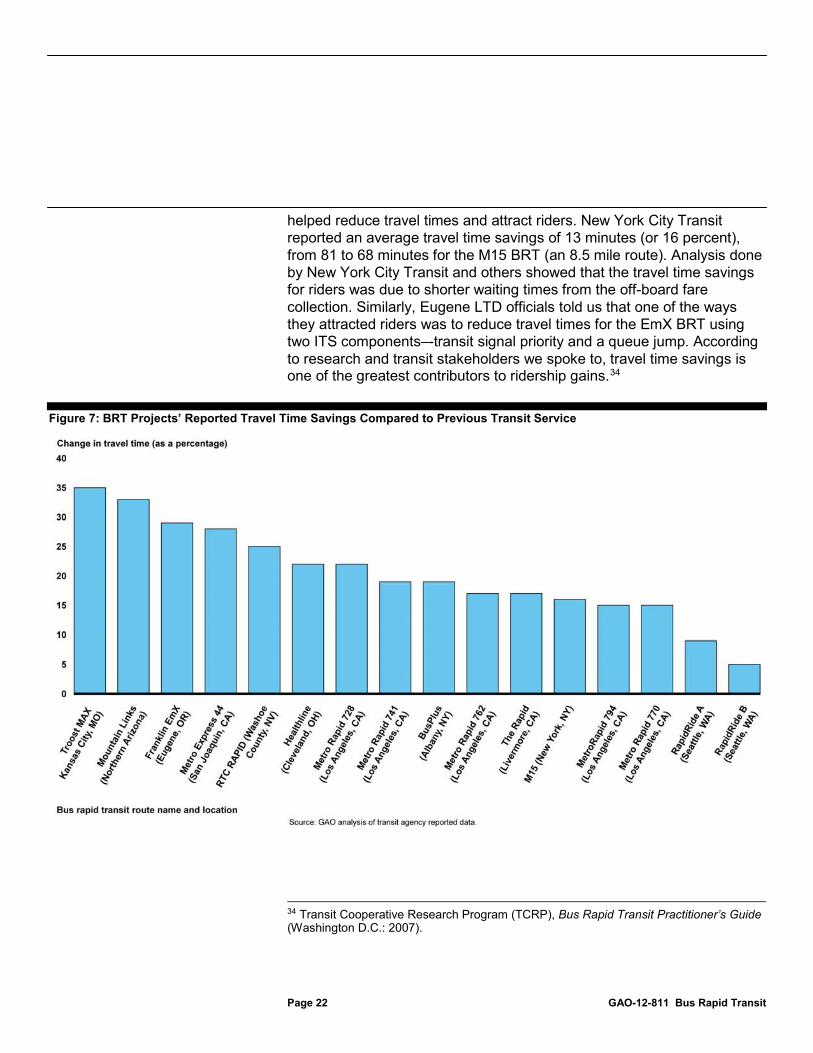
BRT project sponsors stated that they attracted riders, in part, by reducing travel times and incorporating BRT features. All BRT projects that replaced existing transit service reported travel time savings during peak hours ranging from about 10 percent to 35 percent, as shown in figure 7.33
33 Four of the 20 project sponsors did not report data for travel time savings because the BRT route did not replace a previous route or they were unable to provide current travel times at the time they completed the questionnaire for a number of reasons. We didn’t differentiate travel time savings between peak and off-peak. Rather, we asked project sponsors to report travel time savings before and after implementation of the BRT.
Several BRT project sponsors highlighted BRT features that
Page 22 GAO-12-811 Bus Rapid Transit
helped reduce travel times and attract riders. New York City Transit reported an average travel time savings of 13 minutes (or 16 percent), from 81 to 68 minutes for the M15 BRT (an 8.5 mile route). Analysis done by New York City Transit and others showed that the travel time savings for riders was due to shorter waiting times from the off-board fare collection. Similarly, Eugene LTD officials told us that one of the ways they attracted riders was to reduce travel times for the EmX BRT using two ITS components–-transit signal priority and a queue jump. According to research and transit stakeholders we spoke to, travel time savings is one of the greatest contributors to ridership gains.34
Figure 7: BRT Projects’ Reported Travel Time Savings Compared to Previous Transit Service
34 Transit Cooperative Research Program (TCRP), Bus Rapid Transit Practitioner’s Guide (Washington D.C.: 2007).
Page 23 GAO-12-811 Bus Rapid Transit
In addition to decreased travel times, BRT project sponsors also improved ridership by shortening “headways”—the time interval between buses moving in the same direction on a particular route—and decreasing riders’ wait times. More than half of BRT project sponsors (13 of 20) reported having headways of 10 minutes or less during peak hours. Furthermore, during off-peak hours, over half of these existing BRT systems (11 of 20) operated headways of 15 minutes or less. Local officials told us that the EmX’s 10-minute headways—5 minutes shorter than the previous bus route—improved ridership by university students and made it easier for them to live further from campus where rents are less expensive. Moreover, according to FTA guidance and other research, frequent headways are important for riders’ perception of service quality. Specifically, research suggests that during peak hours 10 minutes is the maximum time between vehicles that riders are willing to wait without planning ahead of time.
BRT project sponsors also reported providing service enhancements to attract riders and, in some cases, reduce travel times. Service enhancements included extended hours of service (e.g., more than 16 hours per day), weekend service, and limited-stop service. All project sponsors reported providing at least one service enhancement and almost half (8 of 20) reported offering all three expanded service characteristics in our questionnaire. Project sponsors highlighted how the service enhancements helped reduce travel times. For example, Kansas City ATA officials attributed part of the Troost BRT’s travel time savings to greater spacing between stops which allowed the vehicles to stop less frequently and travel at higher speeds.
Gains in ridership are due in part to the BRT’s ability to attract new riders to transit. All five BRT project sponsors we spoke with attributed a portion of the gains in ridership to an increase in choice riders—those who prefer to use transit even though they have the option to drive. Cleveland RTA’s Healthline BRT, for example, replaced the busiest bus route in the city and surpassed its 5-year ridership projection in the second year of service. Specifically, according to Cleveland RTA officials, some riders are using the Healthline for mid-day trips that they may have previously taken in cars. Similarly, the Seattle’s RapidRide A line also replaced one of the busiest bus routes and achieved an increase in ridership of more than 30 percent in the first year, an increase that included new riders from the local community college, according to King County Metro officials.
Page 24 GAO-12-811 Bus Rapid Transit
Research suggests that at least some of these choice riders would be unwilling to ride a traditional bus, but will ride BRT.35
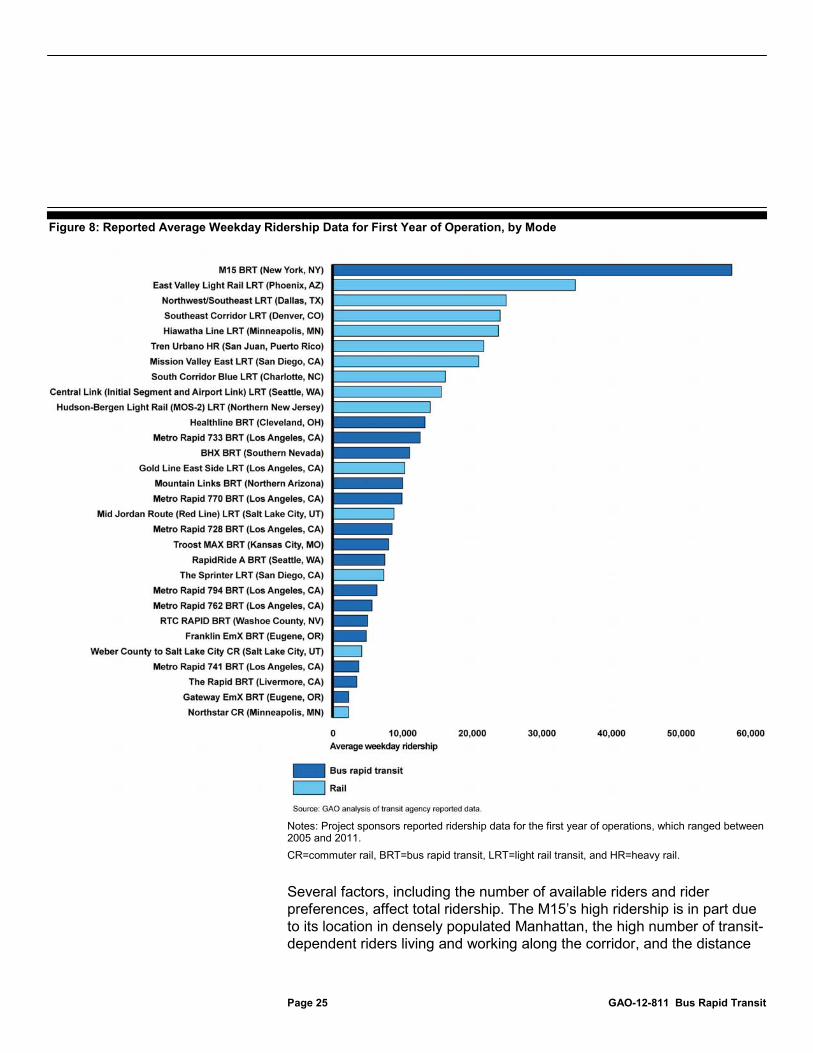
Even with gains in ridership, BRT projects in the U.S. usually carry fewer total riders compared to rail transit projects, based on our analysis of project sponsor questionnaires. The rail transit projects we examined generally had higher average weekday ridership than BRT lines, although there were some exceptions. As figure 8 shows, nine of the 10 projects with the highest total ridership are rail transit projects. However, the M15 BRT in New York City has the highest total ridership of any project—more than 55,000 riders per day. This illustrates how, given the right conditions, BRT projects can generate ridership similar to rail transit. In addition, three other BRT projects—Cleveland’s Healthline, Los Angeles’ Metro Rapid 733, and Southern Nevada’s BHX—average over 10,000 weekday riders, more than light rail projects in Los Angeles, Salt Lake City, and San Diego.
35CALSTART, Bus Rapid Transit Ridership Analysis, a special report prepared at the request of the U.S. Department of Transportation Federal Transit Administration Office of Research, Demonstration and Innovation and Office of Mobility Innovation, Service Innovation Division (June 2005).
BRT Ridership Compared to Rail
Page 25 GAO-12-811 Bus Rapid Transit
Figure 8: Reported Average Weekday Ridership Data for First Year of Operation, by Mode
Notes: Project sponsors reported ridership data for the first year of operations, which ranged between 2005 and 2011. CR=commuter rail, BRT=bus rapid transit, LRT=light rail transit, and HR=heavy rail.
Several factors, including the number of available riders and rider preferences, affect total ridership. The M15’s high ridership is in part due to its location in densely populated Manhattan, the high number of transit-dependent riders living and working along the corridor, and the distance
Page 26 GAO-12-811 Bus Rapid Transit
to the nearest subway line. In comparison, two commuter rail lines we examined were among the five projects with the lowest number of average daily riders likely due to shorter hours of service and the fact that, with the exception of a few peak hours, commuter rail lines generally have fewer trips throughout the day.
Further, we heard from stakeholders that, in general, riders prefer rail transit compared to bus due to the greater perceived prestige of rail transit. Rail transit project sponsors and city officials for all rail projects we looked at told us that their projects would likely not have attracted the same number of riders had they been developed as BRT, citing the perception some riders have about the quality and permanence of bus service. According to project sponsors, rail transit projects have the ability to attract riders who would not be interested in any form of bus given perception and features. Research suggests that many intangible factors, including perception, play a role in making rail transit more attractive than bus. However, as discussed earlier, BRT project sponsors told us that the perceptions about bus for “choice riders” can be overcome with rail-like features. Cleveland RTA officials attribute increased BRT ridership to more professionals and students riding the Healthline. According to these officials, professionals and students find the Healthline attractive because of the increased frequency of service; quicker travel times; enhanced safety; limited stops; quality of ride; and quieter, more attractive, and more fuel-efficient vehicles. In some international cities, however, given their more comprehensive systems, higher population densities, and more positive attitudes about bus service, BRT ridership in some cities exceeds rail transit ridership in the U.S.
Of the planned or completed New, Small, or Very Small Starts projects that received construction grant agreements under FTA’s Capital Investment Grant program from fiscal year 2005 through February 2012, BRT projects generally had lower capital costs than rail transit projects. Median costs for BRT and rail transit projects we examined were about $36.1 million and $575.7 million, respectively. Capital costs for BRT and
BRT Projects Generally Have Lower Capital Costs than Rail Transit
Capital Costs and New Starts Funding
Page 27 GAO-12-811 Bus Rapid Transit
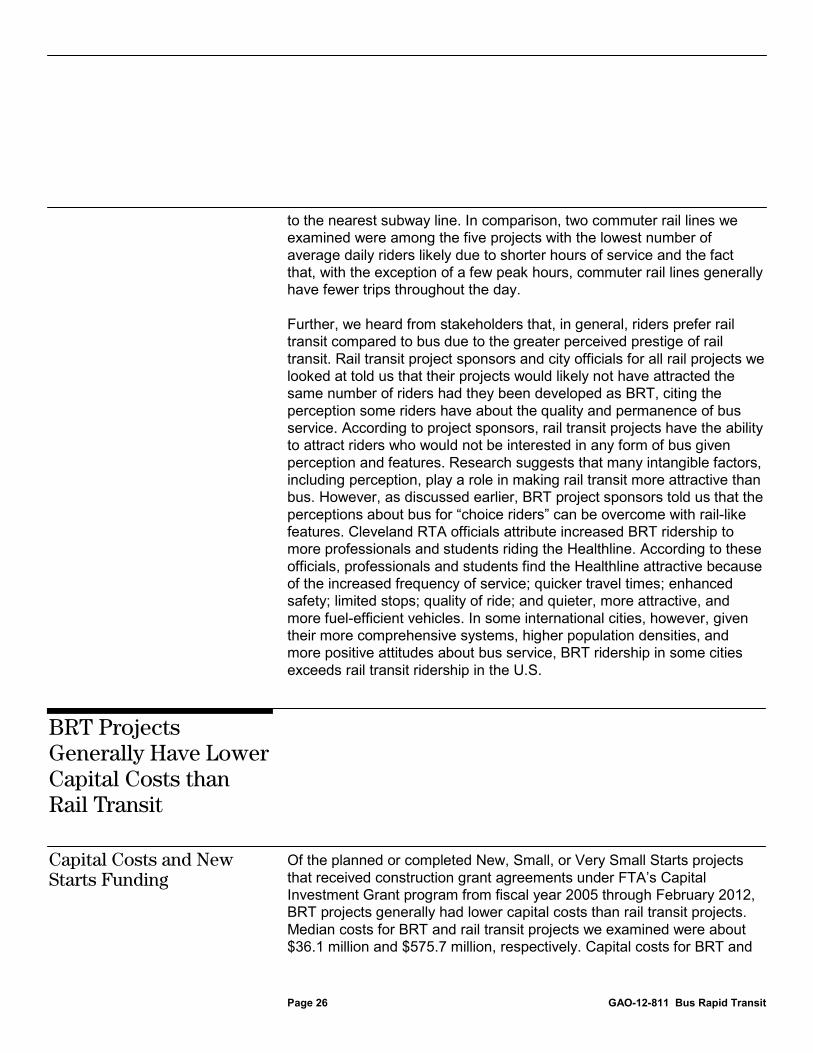
rail transit projects ranged from about $3.5 million to over $567 million and almost $117 million to over $7 billion, respectively. Of the 30 BRT projects with a grant agreement, only five had higher capital costs than the least expensive rail transit project. While initial capital costs are generally lower for BRT than rail transit, capital costs can be considered in context of total riders, as discussed earlier, and other long-term considerations, which we discuss below, depending on the purpose of the analysis. Figure 9 shows the range and individual project capital costs by mode.
Figure 9: Range and Individual Capital Costs for BRT and Rail Transit Projects Receiving a Grant Agreement from Fiscal Year 2005 through February 2012
Note: Exempt projects were excluded from our analysis Cost data for New Starts, Small Starts, and Very Small Starts projects are through February 2012. a
One streetcar project, the Portland Streetcar Loop, is included in this analysis as a light rail project.
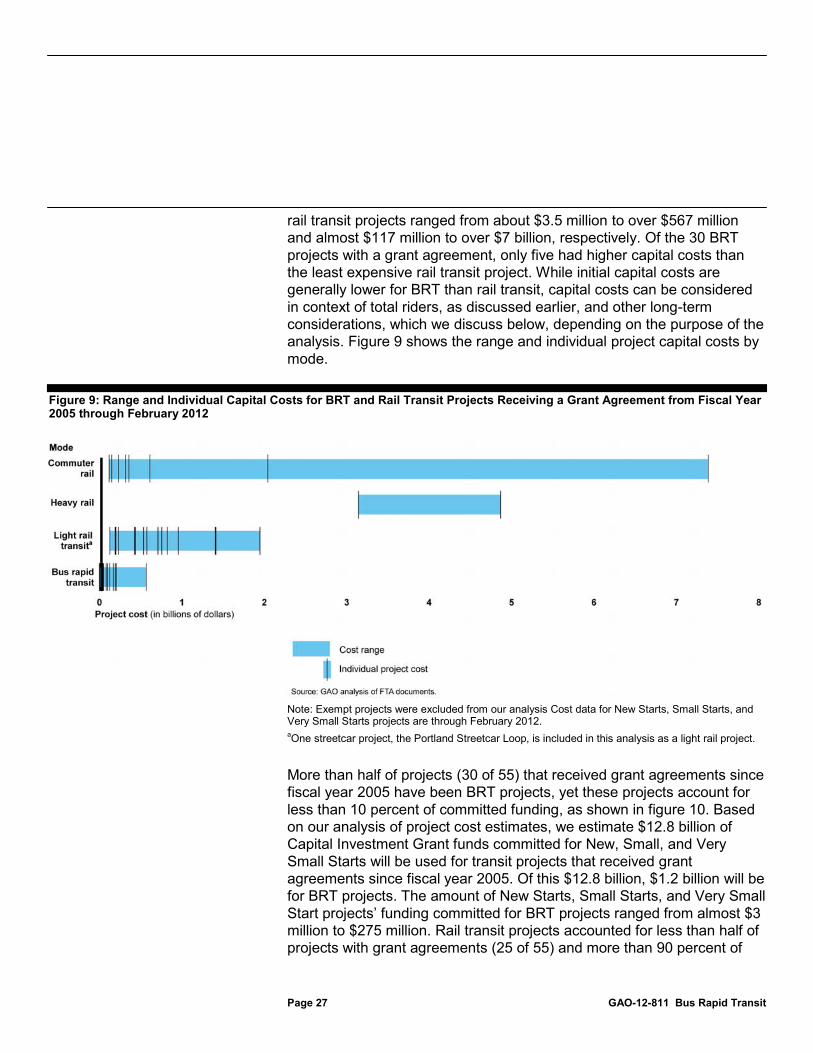
More than half of projects (30 of 55) that received grant agreements since fiscal year 2005 have been BRT projects, yet these projects account for less than 10 percent of committed funding, as shown in figure 10. Based on our analysis of project cost estimates, we estimate $12.8 billion of Capital Investment Grant funds committed for New, Small, and Very Small Starts will be used for transit projects that received grant agreements since fiscal year 2005. Of this $12.8 billion, $1.2 billion will be for BRT projects. The amount of New Starts, Small Starts, and Very Small Start projects’ funding committed for BRT projects ranged from almost $3 million to $275 million. Rail transit projects accounted for less than half of projects with grant agreements (25 of 55) and more than 90 percent of
Page 28 GAO-12-811 Bus Rapid Transit
funding. Federal Capital Investment Grant contributions under the New Starts, Small Starts, or Very Small Start categories for rail transit projects ranged from almost $60 million to over $2 billion.
Figure 10: Total Number of Projects and Percentage of Total New Starts, Small Starts, and Very Small Starts Committed Funding from Fiscal Year 2005 through February 2012
Note: Exempt projects were excluded from our analysis. a
One streetcar project, the Portland Streetcar Loop, is included in this analysis as a light rail project.
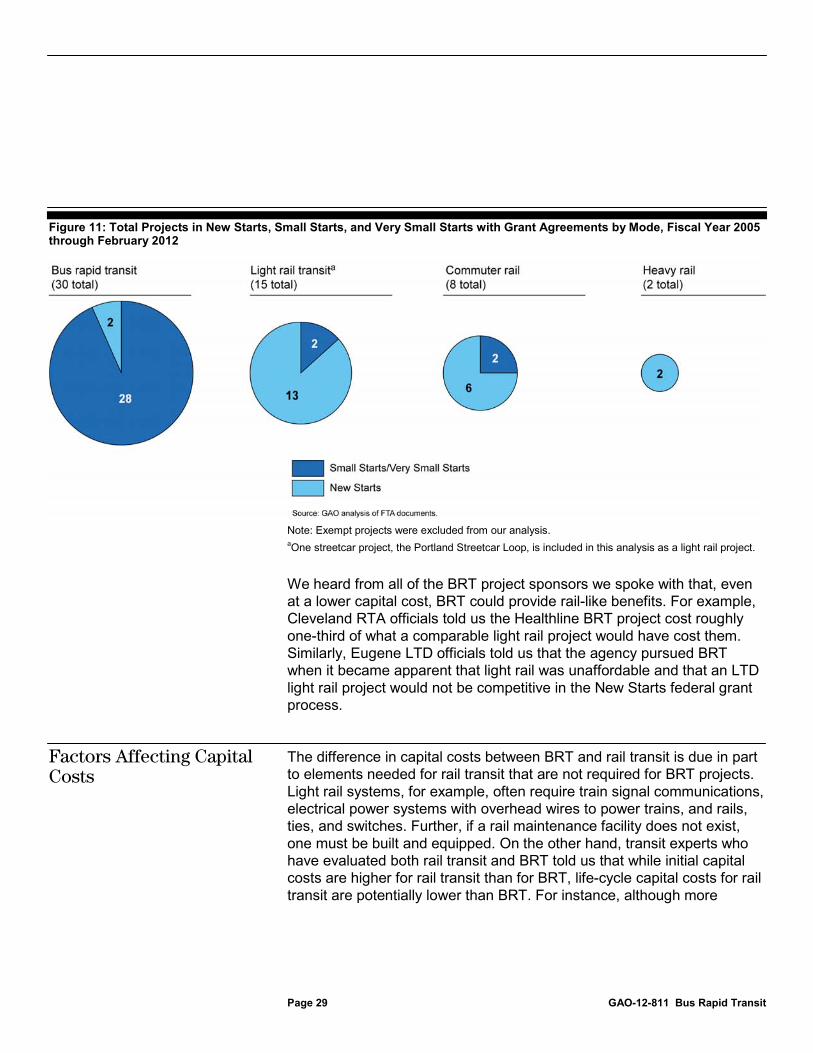
Since fiscal year 2005, most projects with grant agreements under Small Starts and Very Small Starts have been BRT projects while most New Starts projects have been rail transit. With two exceptions, all 30 BRT projects funded since fiscal year 2005 were funded under Small Starts or Very Small Starts. Twenty-one of 25 rail-transit projects were funded under New Starts and the remaining were funded under Small Starts. (See fig. 11.)
Page 29 GAO-12-811 Bus Rapid Transit
Figure 11: Total Projects in New Starts, Small Starts, and Very Small Starts with Grant Agreements by Mode, Fiscal Year 2005 through February 2012
Note: Exempt projects were excluded from our analysis. a
One streetcar project, the Portland Streetcar Loop, is included in this analysis as a light rail project.
We heard from all of the BRT project sponsors we spoke with that, even at a lower capital cost, BRT could provide rail-like benefits. For example, Cleveland RTA officials told us the Healthline BRT project cost roughly one-third of what a comparable light rail project would have cost them. Similarly, Eugene LTD officials told us that the agency pursued BRT when it became apparent that light rail was unaffordable and that an LTD light rail project would not be competitive in the New Starts federal grant process.
The difference in capital costs between BRT and rail transit is due in part to elements needed for rail transit that are not required for BRT projects. Light rail systems, for example, often require train signal communications, electrical power systems with overhead wires to power trains, and rails, ties, and switches. Further, if a rail maintenance facility does not exist, one must be built and equipped. On the other hand, transit experts who have evaluated both rail transit and BRT told us that while initial capital costs are higher for rail transit than for BRT, life-cycle capital costs for rail transit are potentially lower than BRT. For instance, although more
Factors Affecting Capital Costs
Page 30 GAO-12-811 Bus Rapid Transit
expensive up front (typically $1.5 million to $3.4 million per car), life cycles of rail transit cars are longer (typically 25 years or more) than most BRT vehicles (12 to 15 years).36 However circumstances affecting costs will vary among projects, and research has not yet been done to compare life-cycle costs of BRT systems in the U.S., as they are still relatively new.
BRT capital costs depend on each project’s features and service levels. Specifically, costs are affected by:
Type of running way. As mentioned above, most BRT projects we reviewed run in mixed traffic rather than dedicated or semi-dedicated running ways. According to research, capital costs for BRT projects that operate in mixed traffic range from $50,000 to $100,000 per mile compared to $2 to $10 million per mile for projects that have dedicated lanes.37
Right-of-way or property acquisition. Many BRT projects use running ways and stations areas in existing streets and sidewalk space. However, BRT projects designed with rail transit-like dedicated right-of-ways could require more property acquisition or leasing to make room for guideways, stations, or other infrastructure.
Type of vehicles and services selected. Capital costs for BRT vehicles can range from about $400,000 to almost $1 million. The number of BRT vehicles needed for a route can depend on the length of the project, travel time, and peak headway, among other things. For example, Cleveland RTA spent about $21 million dollars for vehicles on the Healthline compared to Kansas City ATA which spent about $6.3 million for vehicles on the Troost MAX BRT. Differences in price were a result of (1) Cleveland’s needing nine more vehicles than Kansas City (24 compared to 15 respectively) to maintain shorter headways and (2) the cost of the vehicles ($900,000 compared to $366,000 respectively).38 Cleveland’s vehicles have more features, including hybrid technology for a quieter ride, multiple boarding doors to expedite boarding, and articulated vehicles to increase capacity.
36 GAO, Transit Rail: Potential Rail Car Cost-Saving Strategies Exist, GAO-10-730 (Washington, D.C.: June 30, 2012).
37 TCRP, 2007.
38 According to Kansas City ATA officials, 4 of the 15 vehicles were hybrid buses that cost $538,000 each.
Page 31 GAO-12-811 Bus Rapid Transit
• Non-transit related features. Some projects’ costs include streetscaping, landscaping, or updates to utilities, while others do not. For example, three of the five project sponsors we met with used federal funding to purchase artwork along the line to increase a sense of permanence and better incorporate the BRT system into the community. (See next section for a discussion of the role of permanence in economic development.)
As with capital costs, a project’s total operating costs can vary based on several project factors, including length of the route, headways, vehicle acquisition, and other non-transit related features. As a result of the many factors involved, it can be challenging to generalize differences in operating costs within and across modes. In some cases BRT projects have lower operating costs than the previous bus service. For example, according to Eugene LTD officials, the Eugene EmX decreased overall operating costs per rider. Officials attributed the savings to improved schedule reliability and travel-time savings from the dedicated right-of-way, which reduced labor costs because fewer buses are needed to maintain the schedule. Cleveland RTA told us the Healthline BRT reduced the overall operating budget and the average costs per rider decreased. For RTA, the 18 vehicles that operate during peak hours replaced the 28 buses that were needed to operate the standard bus service the BRT replaced. Hourly labor costs are about the same for BRT, standard bus service, and heavy rail; however, the cost per rider is lower for the BRT than standard buses due to higher capacities and ridership on the BRT.
We also heard from stakeholders and project sponsors that operating costs for BRT and rail transit depend strongly on the density and ridership in the corridor. For example, according to one transit expert, while signaling and control costs are high for rail transit, there is a tipping point where given a high enough density and ridership, rail transit begins to have lower operating costs overall. New York City Transit officials commented that while construction costs for a street-running BRT are about 1/500th of the cost of building a heavy rail, operating costs for a bus operation can be higher. Two operators can carry close to 2,000 riders on a single heavy rail train, whereas in a BRT system, 24 operators are needed to carry the same number of riders.
Factors Affecting Operating Costs
Page 32 GAO-12-811 Bus Rapid Transit
In general, we found that project sponsors and other stakeholders in each of our five case study locations believe that the BRT project is having some positive effect on economic development. However, these individuals were unsure about how much of the economic activity can be attributed to the presence of BRT versus other factors or circumstances (See table 2 for a summary of economic development activities near the five BRT projects we visited).39
In addition, stakeholders mentioned that the recent recession limited the number of development projects to date, but they expect increased economic development in the future along select areas of the BRT corridors as economic conditions improve.
39 While the term economic development can refer to wide range of activities, for the purposes of our case studies we generally use the term to refer to components of transit-oriented development, such as high-density, mixed-use developments and pedestrian-friendly environments and streetscapes.
Some BRT Projects Have Potential to Contribute to Economic Development and Other Benefits
Overview of Case Study Findings
Page 33 GAO-12-811 Bus Rapid Transit
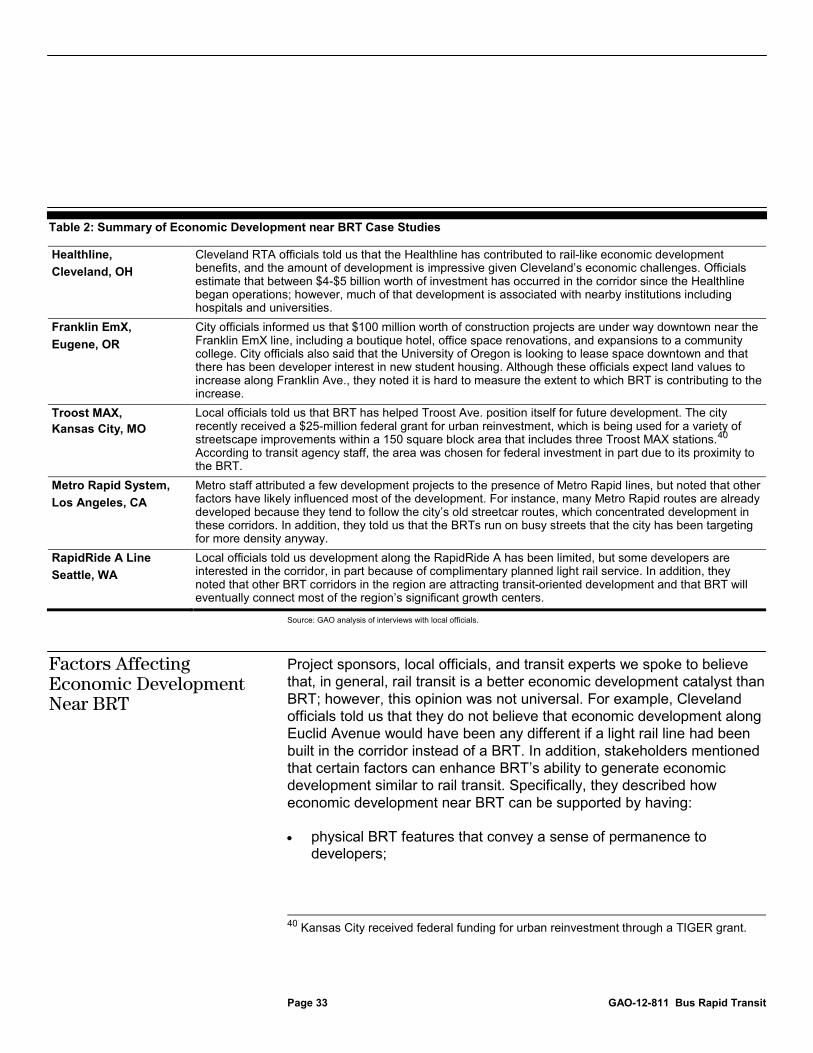
Table 2: Summary of Economic Development near BRT Case Studies
Healthline, Cleveland, OH
Cleveland RTA officials told us that the Healthline has contributed to rail-like economic development benefits, and the amount of development is impressive given Cleveland’s economic challenges. Officials estimate that between $4-$5 billion worth of investment has occurred in the corridor since the Healthline began operations; however, much of that development is associated with nearby institutions including hospitals and universities.
Franklin EmX, Eugene, OR
City officials informed us that $100 million worth of construction projects are under way downtown near the Franklin EmX line, including a boutique hotel, office space renovations, and expansions to a community college. City officials also said that the University of Oregon is looking to lease space downtown and that there has been developer interest in new student housing. Although these officials expect land values to increase along Franklin Ave., they noted it is hard to measure the extent to which BRT is contributing to the increase.
Troost MAX, Kansas City, MO
Local officials told us that BRT has helped Troost Ave. position itself for future development. The city recently received a $25-million federal grant for urban reinvestment, which is being used for a variety of streetscape improvements within a 150 square block area that includes three Troost MAX stations.40
Metro Rapid System,
According to transit agency staff, the area was chosen for federal investment in part due to its proximity to the BRT.
Los Angeles, CA Metro staff attributed a few development projects to the presence of Metro Rapid lines, but noted that other factors have likely influenced most of the development. For instance, many Metro Rapid routes are already developed because they tend to follow the city’s old streetcar routes, which concentrated development in these corridors. In addition, they told us that the BRTs run on busy streets that the city has been targeting for more density anyway.
RapidRide A Line Seattle, WA
Local officials told us development along the RapidRide A has been limited, but some developers are interested in the corridor, in part because of complimentary planned light rail service. In addition, they noted that other BRT corridors in the region are attracting transit-oriented development and that BRT will eventually connect most of the region’s significant growth centers.
Source: GAO analysis of interviews with local officials.
Project sponsors, local officials, and transit experts we spoke to believe that, in general, rail transit is a better economic development catalyst than BRT; however, this opinion was not universal. For example, Cleveland officials told us that they do not believe that economic development along Euclid Avenue would have been any different if a light rail line had been built in the corridor instead of a BRT. In addition, stakeholders mentioned that certain factors can enhance BRT’s ability to generate economic development similar to rail transit. Specifically, they described how economic development near BRT can be supported by having:
• physical BRT features that convey a sense of permanence to developers;
40 Kansas City received federal funding for urban reinvestment through a TIGER grant.
Factors Affecting Economic Development Near BRT
Page 34 GAO-12-811 Bus Rapid Transit
• major institutional, employment, and activity centers along or near the BRT corridor that can sponsor development projects; and
• transit-supportive local policies and development incentives.
A number of project sponsors, local officials, and other stakeholders we spoke to emphasized the importance of BRT projects’ physical features—particularly those that are perceived as permanent—in helping to spur economic development. They explained that BRTs with dedicated running ways, substantial stations with enhanced amenities, and other fixed assets represent a larger investment in the corridor by the public sector and assure developers that the transit service and infrastructure will be maintained for decades into the future. For example, Los Angeles local officials told us that the city’s Orange Line BRT can come close to light rail in terms of economic development because its station infrastructure and enhanced amenities relay a sense of permanence to developers.
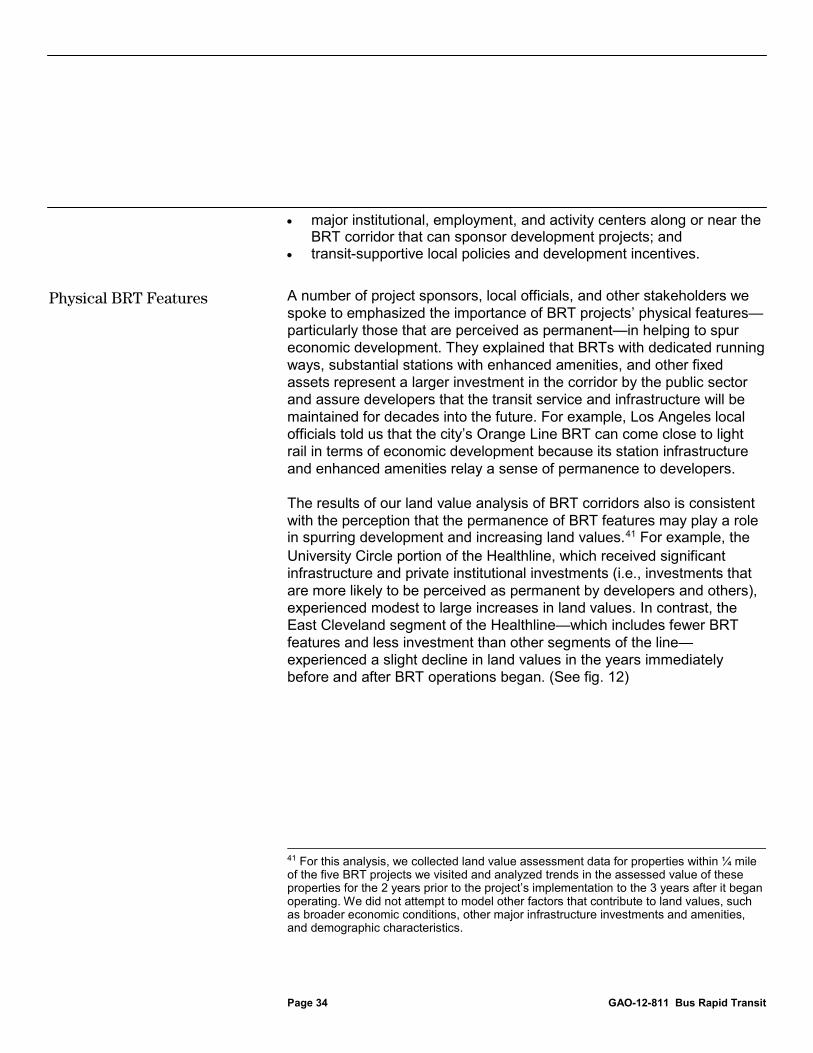
The results of our land value analysis of BRT corridors also is consistent with the perception that the permanence of BRT features may play a role in spurring development and increasing land values.41
41 For this analysis, we collected land value assessment data for properties within ¼ mile of the five BRT projects we visited and analyzed trends in the assessed value of these properties for the 2 years prior to the project’s implementation to the 3 years after it began operating. We did not attempt to model other factors that contribute to land values, such as broader economic conditions, other major infrastructure investments and amenities, and demographic characteristics.
For example, the University Circle portion of the Healthline, which received significant infrastructure and private institutional investments (i.e., investments that are more likely to be perceived as permanent by developers and others), experienced modest to large increases in land values. In contrast, the East Cleveland segment of the Healthline—which includes fewer BRT features and less investment than other segments of the line—experienced a slight decline in land values in the years immediately before and after BRT operations began. (See fig. 12)
Physical BRT Features
Page 35 GAO-12-811 Bus Rapid Transit
Figure 12: Land Value Changes along Cleveland’s Healthline BRT Corridor, 2006 through 2011
Page 36 GAO-12-811 Bus Rapid Transit
During our site visits, local officials noted that major institutions and employment centers are playing an important role in supporting economic development in BRT corridors. In Kansas City, most of the larger development projects along Troost Avenue have been sponsored by universities and medical institutions situated along or near the corridor. For example, the Research Medical Center has partnered with a private developer to build a 13.5 acre senior housing center that will include commercial space and connect to a BRT station.
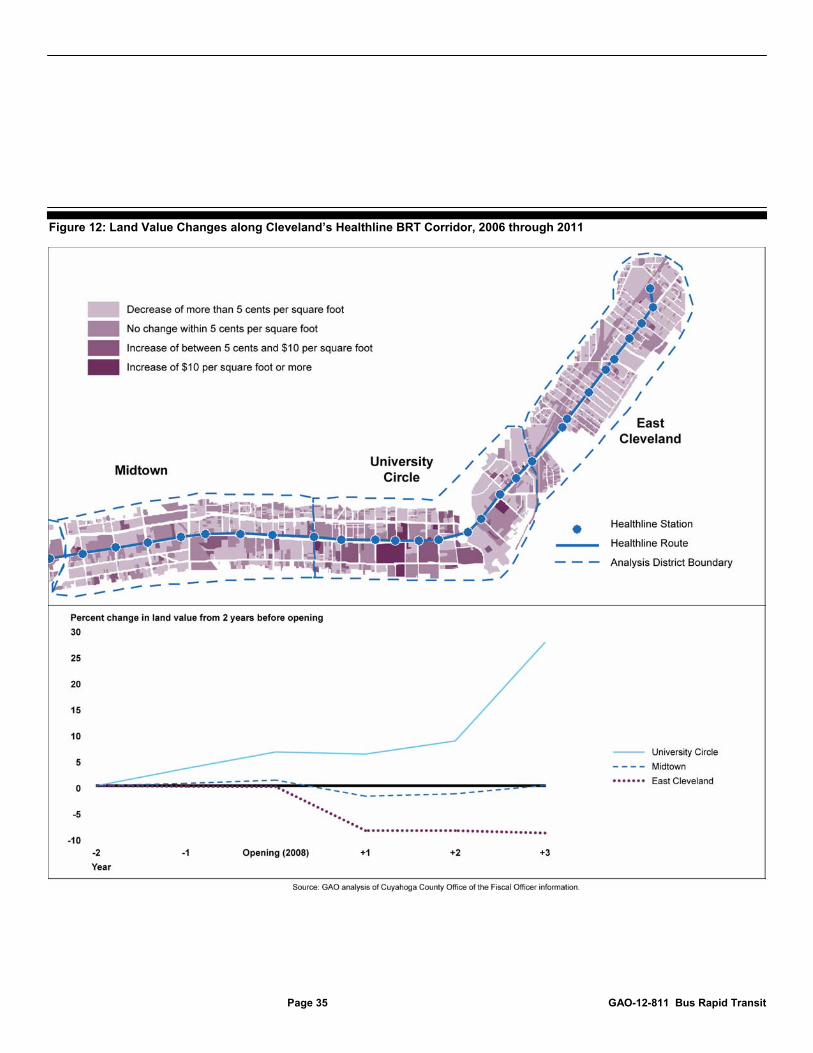
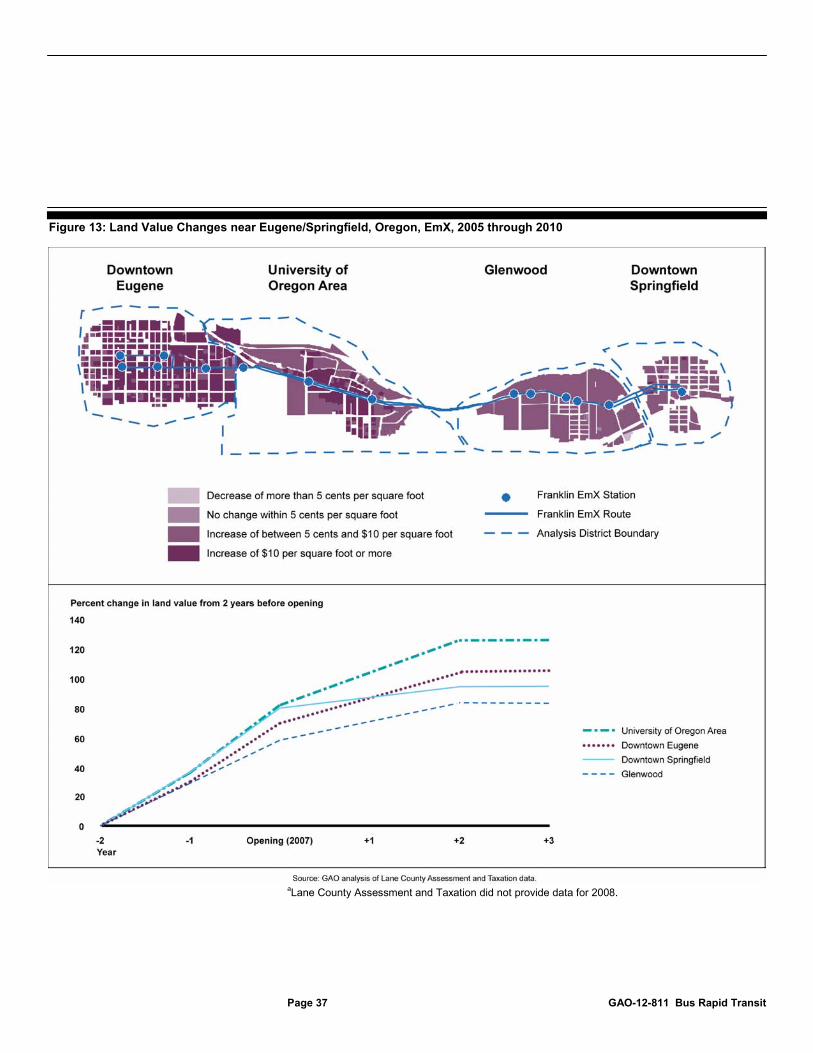
Likewise, in Eugene, city officials told us that the University of Oregon has supported the EmX by supplying land for the line’s running way and recently building a $250-million arena near one of the stations. (See fig. 13.) Moreover, the results of our land value analysis in Eugene suggest that investments by the university are having a positive impact on land values along the Franklin EmX corridor. Specifically, we found that from 2005 through 2010, assessed land values in downtown Eugene and near the University of Oregon campus have increased at a greater rate than other segments of the Franklin EmX corridor.
Institutional, Employment, and Activity Centers
Page 37 GAO-12-811 Bus Rapid Transit
Figure 13: Land Value Changes near Eugene/Springfield, Oregon, EmX, 2005 through 2010
aLane County Assessment and Taxation did not provide data for 2008.
Page 38 GAO-12-811 Bus Rapid Transit
BRT projects also may be aiding development in their corridors simply by providing connections between major employment and activity centers.42
BRT project sponsors and experts we spoke to told us that transit-supportive policies and development incentives can play a crucial role in helping to attract and spur economic development. Local officials in four of our five site-visit locations described policies and incentives that were designed (or are being developed) to attract development near BRT and other transit projects. For example, Los Angeles city officials told us that the city’s mayor recently created a transit-oriented development cabinet tasked with improving and maintaining coordination between Los Angeles Metro and city staff and developing policies and procedures in support of transit-oriented developments. They told us that the city is currently working on lifting requirements that require large amounts of parking and allow for only one- or two-story developments along many of the Metro Rapid lines. Officials in Eugene, Cleveland, and Seattle also told us that local governments either have in place, or are currently drafting, land use policies that are supportive of transit-oriented development. In contrast, Kansas City officials told us that the city has not used local policies and development incentives to generate economic development along Troost Avenue but that it is continuing to look at partnerships for future investments and pursue development opportunities. Much of Troost Avenue has suffered economically for several decades and possesses characteristics that literature suggests can negatively affect land values near transit, such as low household incomes.
According to one transit expert we spoke with, transit projects need to link residential areas to employment centers or attractions, such as hospitals or stadiums, to successfully generate economic development. Without these types of connections, developers are less likely to view the project as capable of drawing sufficient ridership to be attractive for development.
Stakeholders also mentioned several factors that could lead to different amounts and types of economic development in BRT corridors compared to rail transit corridors. For instance, the greater prestige and permanence associated with rail transit may lead to more development and investment in rail transit corridors than in BRT corridors. Transit agency and other local officials also noted that BRT station areas might experience less
42 Project sponsors from each of our five site visit locations told us that BRT has provided new or improved connections between regional employment and activity centers.
Transit-supportive Local Policies and Development Incentives
Other Factors Affecting Development near BRT
Page 39 GAO-12-811 Bus Rapid Transit
investment and development than rail station areas because transit agencies may not own large amounts of land around BRT stations on which to build or support transit-oriented developments.43
Los Angeles city officials told us that one of the primary economic development benefits of light rail is that surplus property around the stations can be developed. Kansas City ATA officials told us that the agency owns only a few properties along Troost Avenue, which limits its ability to incentivize economic development in and around the BRT corridor. One real estate expert we spoke with noted that BRT may be better at supporting small-scale retail and residential developments, affordable housing developments, and medical facilities than rail transit, since these types of developments are often priced out of rail station-area markets.
Although BRT projects have been contributing in various ways to economic development along their corridors, project sponsors informed us that in three of our site-visit locations, economic development was a consideration for the BRT project, but not among the primary objectives. Consequently, project sponsors highlighted several other benefits BRT projects have provided to their communities aside from—or in addition to—economic development. Specifically, they cited BRT’s operational flexibility and shorter implementation time frames as benefits, as well as its ability to serve as a stepping stone for rail transit in the community.
Experts and project sponsors we spoke with mentioned BRT’s operational flexibility as a community benefit, since unlike rail transit, BRT operators can temporarily extend routes and change service plans if necessary, without the construction of additional infrastructure or major service disruptions. For instance, Cleveland RTA officials told us that—although the Healthline is permanent—they avoided otherwise shutting down the service while a movie filmed in the Public Square by detouring the vehicles two blocks for a few days, an option that wouldn’t be available for a rail transit project. Likewise, Kansas City ATA officials told us that when a bridge along Troost Avenue needed repair, the agency was able to reroute the Troost MAX temporarily until the bridge construction was finished.
43 Transit agencies sometimes purchase land beyond what is needed for a future rail transit station to serve as a staging area for equipment during the station’s construction. Transit agencies may use the excess land to build or incentivize development projects.
Other BRT Community Benefits
Page 40 GAO-12-811 Bus Rapid Transit
Local officials in four of our five site-visit locations, as well as transit experts we spoke with, stated that another advantage of BRT projects is the ability to design and build them more quickly than rail transit projects. For instance, King County Metro officials told us that the agency completed two to three RapidRide BRT projects in the time it might have taken to build and design one light rail project. Likewise, in Kansas City, ATA officials informed us that the light rail planning had been ongoing for decades, but stakeholders eventually turned their attention to BRT in part due to projects’ shorter implementation time frames. These shorter time frames could result in communities experiencing economic development benefits sooner than they would have with rail transit, although BRT might ultimately have less of an impact on economic development than rail transit.
Finally, project sponsors and other stakeholders we spoke with mentioned that BRT can benefit communities by laying a foundation for future rail transit service in the corridors. According to one real estate expert we spoke with, a successful BRT line can serve as a precursor to rail transit since it allows nearby property owners to see the actual and potential increase in property values stemming from the presence of transit. Another expert also pointed out that communities can use BRT systems to test out potential corridors for light rail or heavy rail systems and provide some insight into the number and spacing of stops, as well as ridership. Project sponsors and stakeholders in four of our five site-visit locations indicated that the BRT projects could one day transform into rail transit service. Los Angeles Metro officials explained that Wilshire Boulevard, which is currently serviced by the Metro Rapid system, is the preferred location for a long-deferred subway extension project. According to Metro officials, the agency is still interested in establishing a subway line along this corridor, but it might be 20 or 25 years before this happens. In Seattle, King County Metro officials believe that the RapidRide A Line has established the transit agency’s commitment to capital and service investments that build a foundation for future light rail service in the corridor.
Although BRT has become more common in the U.S. in recent years, it remains an evolving and diverse concept. BRT projects encompass a range of designs and physical features and provide varying levels of service, economic development, and other benefits to communities. The flexibility of BRT has allowed cities and regions across the country—with differing public transportation needs and goals—to improve transit service and demonstrate investment in surrounding communities, often at a lower
Concluding Observations
Page 41 GAO-12-811 Bus Rapid Transit
initial capital cost than with rail transit. However, cost differences between U.S. BRT projects and rail transit projects are sensitive to individual project features and each transit agencies’ unique circumstances. Differences in cost partly reflect BRT project sponsors’ limited use of the more costly features commonly associated with BRT—such as dedicated running ways, stations with major infrastructure investments, and off-board fare collection. Cleveland’s Healthline incorporates the most BRT features of any project we examined and cost $200 million to construct, which is comparable to some of the less costly rail transit projects. Some of the more costly BRT features are the same features stakeholders view as critical to contribute to economic development because they portray a sense of permanence to developers and demonstrate investment by the public sector. Therefore, project sponsors in cities with limited transit funding sources and without major congestion issues may find the added cost of these features worthwhile only if economic development is among their projects’ primary objectives.
The limited use of BRT’s more costly features might also partly reflect the relatively large role that the Small and Very Small Starts programs have played in funding recent BRT projects as compared to state and local funding sources. The funding these programs provide to smaller transit projects has allowed communities that otherwise may not have been as competitive in the New Starts process to obtain federal transit support. However, it is possible that limits on the total project cost create incentives for BRT project sponsors to omit more costly BRT features. In general, though, it appears that BRT project sponsors are using the Small and Very Small Starts programs to design and implement projects that address their communities’ current transit needs and align with the projects sponsors’ overall objectives. Moreover, project sponsors may develop initial plans for BRTs that do not include a comprehensive range of features, knowing that they can incorporate additional features into BRT projects incrementally as communities’ transit needs and financial circumstances change.
We provided U.S. Department of Transportation (DOT) with a draft of this report for review and comment. U.S. DOT did not comment on the draft report.
Agency Comments
Page 42 GAO-12-811 Bus Rapid Transit
We are sending copies of this report to interested congressional committees and the Secretary of the Department of Transportation. In addition, this report will be available at no charge on GAO’s website at http://www.gao.gov.
If you or your staff have any questions or would like to discuss this work, please contact me at (202) 512-2834 or [email protected]. Contact points for our Offices of Congressional Relations and Public Affairs may be found on the last page of this report. Individuals making key contributions to this report are listed in appendix III.
David J. Wise, Director, Physical Infrastructure Issues
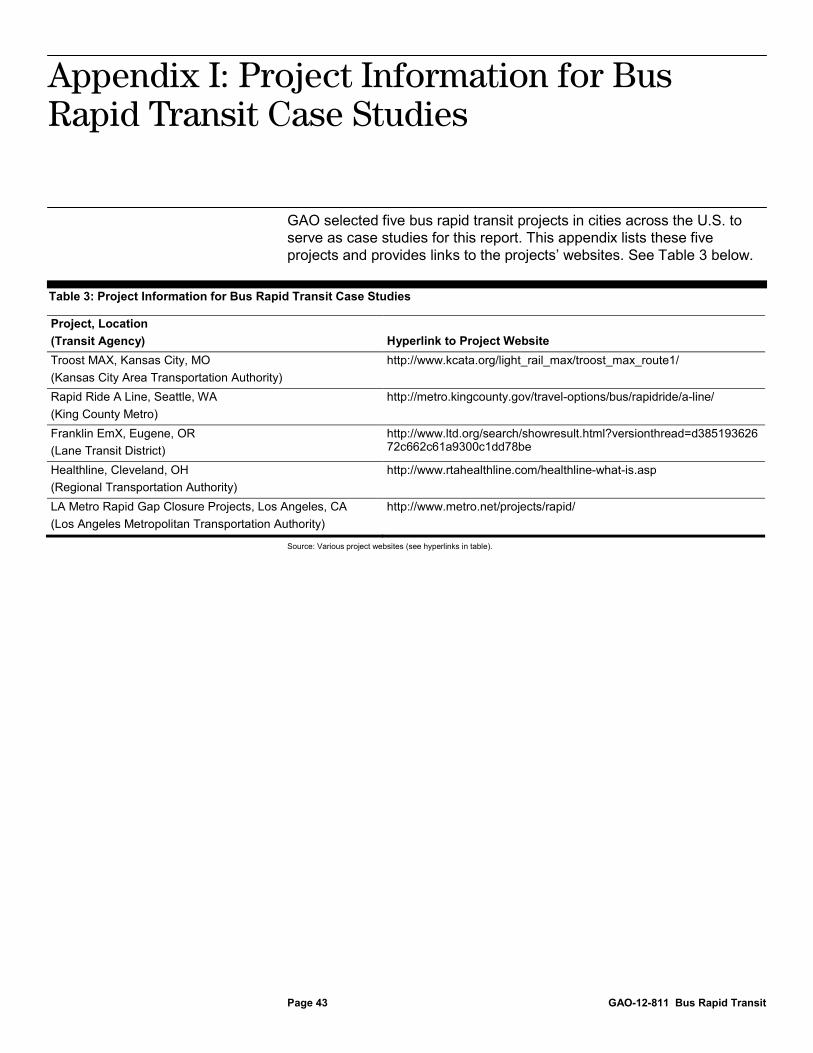
Appendix I: Project Information for Bus Rapid Transit Case Studies
Page 43 GAO-12-811 Bus Rapid Transit
GAO selected five bus rapid transit projects in cities across the U.S. to serve as case studies for this report. This appendix lists these five projects and provides links to the projects’ websites. See Table 3 below.
Table 3: Project Information for Bus Rapid Transit Case Studies
Project, Location (Transit Agency) Hyperlink to Project Website Troost MAX, Kansas City, MO (Kansas City Area Transportation Authority)
http://www.kcata.org/light_rail_max/troost_max_route1/
Rapid Ride A Line, Seattle, WA (King County Metro)
http://metro.kingcounty.gov/travel-options/bus/rapidride/a-line/
Franklin EmX, Eugene, OR (Lane Transit District)
http://www.ltd.org/search/showresult.html?versionthread=d38519362672c662c61a9300c1dd78be
Healthline, Cleveland, OH (Regional Transportation Authority)
http://www.rtahealthline.com/healthline-what-is.asp
LA Metro Rapid Gap Closure Projects, Los Angeles, CA (Los Angeles Metropolitan Transportation Authority)
http://www.metro.net/projects/rapid/
Source: Various project websites (see hyperlinks in table).
Appendix I: Project Information for Bus Rapid Transit Case Studies
Appendix II: Objectives, Scope, and Methodology
Page 44 GAO-12-811 Bus Rapid Transit
To examine the features, costs, and community benefits of Bus Rapid Transit (BRT) projects recommended for funding by the Federal Transit Administration (FTA), we addressed the following four questions:
1. Which BRT features are included in BRT projects and why?
2. How have BRT projects performed in terms of ridership and service and how do they compare to rail transit projects?
3. How do the costs of these projects differ from rail transit projects?
4. To what extent do BRT projects provide economic development and other benefits to communities?
To determine which features are included in BRT projects and why, we sent questionnaires to sponsors of all 20 completed BRT projects FTA recommended for New Start, Small Start, and Very Small Start or Bus and Bus Facilities funding under the Capital Investment Grant Program since fiscal year 2005.1 We limited our scope to BRT projects with upgrades of existing infrastructure so as to institute a fixed guideway or new corridor-based service or a significant extension of an existing route.2 To develop our questionnaire, we reviewed academic literature and interviewed industry officials to identify seven features commonly associated with BRT.3 We then developed questions about these features; ridership; and capital and operating costs. We conducted three telephone pretests for the questionnaire, two with project sponsors of completed BRT projects and one with the National Bus Rapid Transit Institute.4
1 The Capital Investment Grant program also includes Fixed Guideway Modernization grants. 49 U.S.C. § 5309. Among projects we sent questionnaires to, BusPlus, Franklin EmX, MetroRapid 741, M15, BHX, and RTC Rapid received grants through Bus and Bus Facilities. All others received grants through New Starts, Small Starts, or Very Small Starts.
We pre-populated the questionnaires with information obtained from an existing interest group BRT database, project websites, and other
2 To be included in our scope, projects had to be a minimum of 2 miles in length and include at least three stations. 3 Features include: running ways, vehicles, stations, intelligent transportation systems, fare collection, improved service, and branding. 4 We selected the two BRT projects due in part to their variety in terms of the number of BRT features and types and amount of federal funding.
Appendix II: Objectives, Scope, and Methodology
Appendix II: Objectives, Scope, and Methodology
Page 45 GAO-12-811 Bus Rapid Transit
project sponsor documentation submitted to FTA.5 Project sponsors were asked to verify or correct the pre-populated information and complete any missing information. We sent an e-mail announcement with the questionnaire to all 20 BRT project sponsors.6
• the Healthline in Cleveland, Ohio;
We received completed questionnaires for all 20 BRT projects in our scope for a response rate of 100 percent. In addition, we visited five sites, and we obtained information about the presence or absence of BRT projects’ features as well as why BRT features were or were not included through interviews with the sponsors of the following BRT projects:
• the RapidRide A Line in Seattle, Washington; • the Troost MAX in Kansas City, Missouri; • the Metro Rapid System in Los Angeles, California; and • the Franklin EmX in Eugene, Oregon.
We selected site visit locations based on consideration of several factors, including the number and extent of BRT features; ridership, length of route, peak headway, and geographic diversity.7
To assess how BRT projects have performed in terms of ridership and service and how they compare to rail transit projects, we reviewed existing literature on BRT and rail transit projects’ ridership and service levels. In addition, we sent questionnaires to the sponsors of all 20 completed rail transit projects that met the criteria outlined above and compared the responses of BRT project sponsors to those of rail transit
We considered all 20 existing BRT projects that received federal funding and selected projects with a range of each factor listed above. Because we selected a nonprobability sample of projects, the information we obtained from these interviews and visits cannot be generalized to all BRT projects.
5 Specifically, data sources included: the National Bus Rapid Transit Institute’s BRT database, FTA’s Annual Report on Funding Recommendations for fiscal years 2005 through 2012, and project sponsor documentation including, among other things, environmental assessment documents, economic analyses, or other relevant guidance on sponsor’s websites. 6 We collected this information from project sponsors from December 2011 through March 2012. 7 We selected projects that ranged in terms of these features across our broader scope of projects.
Appendix II: Objectives, Scope, and Methodology
Page 46 GAO-12-811 Bus Rapid Transit
project sponsors.8
To assess how BRT projects compare to rail transit projects in terms of capital project costs and the New Starts, Small Starts, and Very Small Starts share of funding, we used FTA project grant data compiled by FTA to identify the 55 (30 BRT and 25 rail transit) existing or planned projects that had signed grant agreements from fiscal years 2005 through February 2012.
We received completed questionnaires for 18 of the 20 rail transit projects in our scope for a response rate of 90 percent. We supplemented the data collected through our questionnaires with information obtained during our site-visit interviews (from the locations listed above).
9
To examine the extent to which BRT projects provide economic development and other benefits to communities, we reviewed existing literature on the impact of transit on economic development and land values. During our site visits, we interviewed project sponsors, transit experts, non-profit business organizations, and economic development professionals about development that has occurred (or is expected to occur) in and around the BRT corridors. To supplement testimonial evidence obtained during site visit interviews, we collected land value assessment data for properties located within ¼ mile of the five BRT projects we visited and analyzed trends in the assessed value of these properties for the 2 years prior to the project’s implementation to the 3
We then used project cost data from FTA’s Annual Reports on Funding Recommendations for fiscal years 2005 through 2012 to ensure that we had the most recent project cost estimates. We discussed data collection and maintenance with FTA and determined the data are reliable for our purposes. In addition to collecting data from FTA, we also reviewed relevant academic literature on BRT and rail transit capital costs and interviewed academic experts, BRT stakeholders, and select BRT project sponsors to better understand how BRT and rail transit projects compare in terms of costs.
8 Questionnaires sent to rail transit projects sponsors resembled those sent to BRT project sponsors and were also pre-populated based on the sources identified above with the exception of the National Bus Rapid Transit Institute. In addition, we pre-tested our rail questionnaire with two rail project sponsors over the phone. 9 We received the New Starts data on April 6, 2012, for projects through February 2012 and Small Starts and Very Small Starts data on March 21, 2012.
Appendix II: Objectives, Scope, and Methodology
Page 47 GAO-12-811 Bus Rapid Transit
years after operations began.10
We conducted this performance audit from July 2011 through July 2012 in accordance with generally accepted government auditing standards. Those standards require that we plan and perform the audit to obtain sufficient, appropriate evidence to provide a reasonable basis for our findings and conclusions based on our audit objectives. We believe that the evidence obtained provides a reasonable basis for our findings and conclusions based on our audit objectives.
We used the gross domestic product price index compiled by Department of Commerce, Bureau of Economic Analysis, to convert the nominal land value into constant 2010 dollars. We did not attempt to model other factors that contribute to land values, such as broader economic conditions, other major infrastructure investments and amenities, and demographic characteristics.
10 We collected data from five locations; however, we are only reporting data from Cleveland and Eugene. For other locations, preliminary analysis did not find changes in land values, data did not separate out land values, or the project was too new to analyze the land values after opening.
Appendix III: GAO Contact and Staff Acknowledgments
Page 48 GAO-12-811 Bus Rapid Transit
David J. Wise, (202) 512-2834 or [email protected]
In addition to the contact named above, Cathy Colwell (Assistant Director), Nathan Bowen, Lorraine Ettaro, Colin Fallon, Kathleen Gilhooly, Terence Lam, Matthew LaTour, Jaclyn Nidoh, Josh Ormond, and Melissa Swearingen made key contributions to this report.
Appendix III: GAO Contact and Staff Acknowledgments
GAO Contact
Staff Acknowledgments
(542191)
The Government Accountability Office, the audit, evaluation, and investigative arm of Congress, exists to support Congress in meeting its constitutional responsibilities and to help improve the performance and accountability of the federal government for the American people. GAO examines the use of public funds; evaluates federal programs and policies; and provides analyses, recommendations, and other assistance to help Congress make informed oversight, policy, and funding decisions. GAO’s commitment to good government is reflected in its core values of accountability, integrity, and reliability.
The fastest and easiest way to obtain copies of GAO documents at no cost is through GAO’s website (www.gao.gov). Each weekday afternoon, GAO posts on its website newly released reports, testimony, and correspondence. To have GAO e-mail you a list of newly posted products, go to www.gao.gov and select “E-mail Updates.”
The price of each GAO publication reflects GAO’s actual cost of production and distribution and depends on the number of pages in the publication and whether the publication is printed in color or black and white. Pricing and ordering information is posted on GAO’s website, http://www.gao.gov/ordering.htm.
Place orders by calling (202) 512-6000, toll free (866) 801-7077, or TDD (202) 512-2537.
Orders may be paid for using American Express, Discover Card, MasterCard, Visa, check, or money order. Call for additional information.
Connect with GAO on Facebook, Flickr, Twitter, and YouTube. Subscribe to our RSS Feeds or E-mail Updates. Listen to our Podcasts . Visit GAO on the web at www.gao.gov.
Contact:
Website: www.gao.gov/fraudnet/fraudnet.htm E-mail: [email protected] Automated answering system: (800) 424-5454 or (202) 512-7470
Katherine Siggerud, Managing Director, [email protected], (202) 512-4400, U.S. Government Accountability Office, 441 G Street NW, Room 7125, Washington, DC 20548
Chuck Young, Managing Director, [email protected], (202) 512-4800 U.S. Government Accountability Office, 441 G Street NW, Room 7149 Washington, DC 20548
GAO’s Mission
Obtaining Copies of GAO Reports and Testimony
Order by Phone
Connect with GAO
To Report Fraud, Waste, and Abuse in Federal Programs
Congressional Relations
Public Affairs
Please Print on Recycled Paper.