Embed Size (px)
Citation preview
U.S. DEPARTMENT OF AGRICULTURE
Additional Data Analysis Could Enhance Monitoring of U.S. Cattle Market
Report to Congressional Requesters
April 2018
GAO-18-296
United States Government Accountability Office

United States Government Accountability Office
Highlights of GAO-18-296, a report to congressional requesters
April 2018
U.S. DEPARTMENT OF AGRICULTURE Additional Data Analysis Could Enhance Monitoring of U.S. Cattle Market
What GAO Found Supply and demand factors, such as a drought that affected the price of cattle feed, affected changes in prices of fed cattle—those ready for slaughter from 2013 through 2016. According to industry experts and GAO’s analysis, a drought from late 2010 to early 2013 led the cattle inventory to fall and rise and, in turn, fed cattle prices to fluctuate (see figure). GAO’s analysis of cattle market data from the U.S. Department of Agriculture (USDA) also indicated that competition levels among packers that slaughter and process fed cattle did not appear to affect the national price changes in the fed cattle market in 2015 but that areas of the country with less competition among packers had lower cattle prices.
Fed Cattle Prices in Relation to the U.S. Cattle Inventory, 2008 through 2017
The Commodity Futures Trading Commission (CFTC)—an agency that regulates cattle futures markets where participants buy and sell standardized agreements for cattle at an agreed-upon price at a specified date in the future—did not find evidence of trading irregularities in the cattle futures market in 2015. However, to better align futures contracts with the actual fed cattle market, CFTC reviewed changes to contract terms and will continue to monitor those changes.
The Packers & Stockyards Program (P&SP), which oversees the cattle industry within USDA’s Agricultural Marketing Service (AMS), does not have routine access to daily data for transactions between feedlot operators, which produce fed cattle, and packers. Those data are collected by AMS’s price reporting group, which does not routinely share them with P&SP because officials said it is prohibited by statute from doing so. The Livestock Mandatory Reporting Act of 1999 specifies that the Secretary of Agriculture may authorize the sharing of these data for enforcement purposes, which USDA interprets as an ongoing investigation, not market monitoring. In November 2017, USDA reorganized P&SP under AMS and officials said it was too early in the reorganization to determine whether AMS would view routine sharing of these data any differently. Reviewing the extent to which these data can be shared with P&SP provides an opportunity to enhance P&SP’s oversight of the fed cattle market. Determining whether it is advisable to request additional exceptions from information disclosure restrictions from Congress would help USDA strengthen its oversight.
View GAO-18-296. For more information, contact Steve Morris at (202) 512-3841 or [email protected], or Oliver Richard at (202) 512-2700 or [email protected].
Why GAO Did This Study The U.S. cattle industry accounted for about $64 billion in receipts in 2016, according to USDA. The price of fed cattle has fluctuated widely from 2013 through 2016 and experienced a sharp downturn beginning in late 2015, raising concerns about the market and questions about USDA’s oversight.
GAO was asked to review issues related to the U.S. cattle market. This report (1) describes key factors that affected changes in fed cattle prices from 2013 through 2016; (2) describes what CFTC found about possible trading irregularities in the futures market for fed cattle in 2015 and any changes to the futures contract for fed cattle since 2015; and (3) examines factors that may affect USDA’s routine monitoring to ensure against discriminatory or anticompetitive practices in the fed cattle market. GAO reviewed economic data and USDA and CFTC documentation; analyzed transaction data on beef packer purchases from 2013 through 2015; and interviewed recognized experts, cattle industry stakeholders such as feedlot operators and packers, and agency officials.
What GAO Recommends GAO is making two recommendations, including that USDA review the extent to which, under statute, the price reporting group can share daily transaction data with P&SP, and if USDA determines the statute does not permit such sharing and it is advisable, submit to Congress a proposal to allow such sharing. USDA agreed and subsequently determined that the act does not allow for such sharing and it would not be advisable citing concerns about the public’s trust in the program.

Page i GAO-18-296 Structure of U.S. Cattle Markets
Letter 1
Background 5 A Variety of Supply and Demand Factors Affected Fed Cattle
Price Changes from 2013 through 2016 12 CFTC Did Not Find Evidence of Trading Irregularities in the
Futures Market for Fed Cattle in 2015, and Is Overseeing Changes to Address Contract Concerns 17
P&SP Does Not Analyze Some Key Transaction Data 21 Conclusions 24 Recommendations for Executive Action 25 Agency Comments and Our Evaluation 26
Appendix I Objectives, Scope, and Methodology 28
Appendix II Supplemental Information on Trends in the Fed Cattle Market 32
Appendix III Econometric Model to Estimate the Impact of Market Power on Fed Cattle Transaction Prices 44
Appendix IV Recognized Experts That We Interviewed 52
Appendix V Comments from the U.S. Department of Agriculture 54
Appendix VI GAO Contacts and Staff Acknowledgments 56
Related GAO Products 57
Table
Table 1: Estimation Results for Fed Cattle, Negotiated Cash Transaction Prices Model, Using Instrumental Variables 49
Contents

Page ii GAO-18-296 Structure of U.S. Cattle Markets
Figures
Figure 1: The Beef and Cattle Industry from Animal Breeding to Consumption 6
Figure 2: Locations of Cattle in Feedlots 7 Figure 3: Monthly Average Inflation-Adjusted Prices for Fed Cattle,
2008 through 2017 8 Figure 4: Fed Cattle Prices in Relation to the U.S. Cattle
Inventory, 2008 through 2017 13 Figure 5: Average Inflation-Adjusted Prices for Fed Cattle Futures
Compared with Historical Volatility in that Market, 2008 through 2017 18
Figure 6: Fed Cattle Transaction Methods, November 2002 through September 2017 34
Figure 7: Percent of U.S. Land Mass in Drought, January 2000 through May 2017 36
Figure 8: Beef Cow Inventory, 1920 through 2016 38 Figure 9: Average Monthly and Annual Cattle Weights, November
2002 through September 2017 40 Figure 10: Per Capita Consumption of Beef, Pork and Chicken in
the United States, 1970 through 2016 41 Figure 11: Historical Price Spread for Beef, January 1970 through
December 2016 43

Page iii GAO-18-296 Structure of U.S. Cattle Markets
Abbreviations AMS Agricultural Marketing Service BSE bovine spongiform encephalopathy CFTC Commodity Futures Trading Commission Feeders feedlot operators HHI Herfindahl-Hirschman Index P&SP Packers & Stockyards Program Packer Beef packer Price reporting group AMS’ Livestock Mandatory Reporting program USDA U.S. Department of Agriculture
This is a work of the U.S. government and is not subject to copyright protection in the United States. The published product may be reproduced and distributed in its entirety without further permission from GAO. However, because this work may contain copyrighted images or other material, permission from the copyright holder may be necessary if you wish to reproduce this material separately.

Page 1 GAO-18-296 Structure of U.S. Cattle Markets
441 G St. N.W. Washington, DC 20548
April 10, 2018
The Honorable Chuck Grassley Chairman Committee on the Judiciary United States Senate
The Honorable Mike Lee Chairman The Honorable Amy Klobuchar Ranking Member Subcommittee on Antitrust, Competition Policy and Consumer Rights Committee on the Judiciary United States Senate
The Honorable Patrick Leahy United States Senate
The U.S. cattle industry is an important part of the nation’s economy, accounting for about $78 billion in receipts in 2015 and about $64 billion in 2016, according to U.S. Department of Agriculture (USDA) documents. Prices for fed cattle—cattle ready for slaughter and processing for human consumption—fluctuated widely in recent years. Specifically, prices increased from 2013 through 2014, decreased somewhat in early 2015, and then decreased rapidly starting in August 2015. These fluctuations may have affected profitability for some market participants, and some producers who raise and feed cattle (i.e., cow-calf and feedlot operators) have expressed concerns about the downturn and raised questions about whether the prices they received for their cattle decreased because of potential market manipulation and industry consolidation. Underlying some market participants’ concerns about the recent price fluctuations are questions about the level of competition at the slaughter and processing level. Specifically, according to USDA documents, four beef packers (packers)—businesses that slaughter and process fed cattle—comprise more than 80 percent of the national packing market and have done so since the mid-1990s.
USDA agencies have statutory responsibilities to oversee and facilitate the functioning of the cattle market. For example, within USDA’s Agricultural Marketing Service (AMS), the Packers & Stockyards Program
Letter
Page 2 GAO-18-296 Structure of U.S. Cattle Markets
(P&SP)1 is an oversight program that, among other things, is responsible for monitoring the cattle industry and halting unfair and anticompetitive marketing practices. In addition, AMS’s Livestock Mandatory Reporting program (price reporting group) collects information on packers’ daily livestock purchases and provides public price summaries to facilitate open markets and provide market participants, both large and small, with comparable levels of market information for fed cattle, according to USDA.
The cattle industry has long used futures contracts—standardized agreements to buy or sell cattle at an agreed-upon price on a specified date in the future—to manage the risks associated with price changes. However, the futures market for fed cattle—where participants buy and sell such contracts—has experienced a relatively high degree of volatility since late 2015, which has been a source of concern for some futures market participants. Some experts have also raised questions about whether fed cattle and futures prices are appropriately converging—meaning that the futures prices, which usually start out higher, move closer to the cash price as a futures contract nears its expiration date. If prices do not converge appropriately, futures contracts become less useful as a tool for managing risks associated with price changes.2 The Commodity Futures Trading Commission (CFTC) is responsible for the oversight of the futures markets, including the Chicago Mercantile Exchange, a self-regulatory organization that operates the futures market for fed cattle. In our past work, we have reviewed the relationship between market concentration and prices for cattle and other commodities as well as USDA’s role in facilitating the effective function of
1P&SP previously was part of USDA’s Grain Inspection, Packers & Stockyards Administration. In November 2017, USDA eliminated the Grain Inspection, Packers & Stockyards Administration as a standalone agency and moved P&SP to AMS under the agency’s newly created Fair Trade Practices Program. As of March 2018, USDA renamed the program to Packers and Stockyards Division; however, at the time of our review, it was still known as P&SP. 2The contract market for fed cattle is the “Live Cattle” futures contract market, listed for trading by the Chicago Mercantile Exchange. For purposes of simplicity, this report will refer to this contract market as the “futures market for fed cattle.”
Page 3 GAO-18-296 Structure of U.S. Cattle Markets
the market and made recommendations to strengthen oversight of the market.3
You asked us to review issues related to the U.S. cattle market. This report (1) describes key factors that affected fed cattle price changes from 2013 through 2016; (2) describes what CFTC found about possible trading irregularities in the futures market for fed cattle in 2015 and any changes to the futures contract for fed cattle since 2015; and (3) examines factors that may affect USDA’s routine monitoring to ensure against discriminatory or anticompetitive practices in the fed cattle market.
To describe the key factors that affected fed cattle price changes from 2013 through 2016, we analyzed economic and other market data collected by federal agencies, including data from USDA’s Economic Research Service, National Agricultural Statistics Service, and AMS. We also collected USDA transaction data for 2013 through 2015 on packer purchases of fed cattle and analyzed these data using a variety of methods, including econometric analysis to identify key factors that affected fed cattle price changes.4 We did not quantify or rank the impact of various factors. To assess the reliability of the economic and transactions data, we interviewed officials who maintain the data, reviewed related documentation, and tested the data for missing or erroneous values. We determined that the data were sufficiently reliable for our purposes. In addition to analyzing these data, we reviewed a P&SP investigation on the 2015 drop in fed cattle prices.
To describe what CFTC found about possible trading irregularities in the futures market for fed cattle in 2015 and any changes to the futures contract for fed cattle since 2015, we reviewed and summarized CFTC documentation on the agency’s oversight activities. We also reviewed 3GAO, U.S. Agriculture: Retail Food Prices Grew Faster Than the Prices Farmers Received for Agricultural Commodities, but Economic Research Has Not Established That Concentration Has Affected These Trends, GAO-09-746R (Washington, D.C.: June 30, 2009); Economic Models of Cattle Prices: How USDA Can Act to Improve Models to Explain Cattle Prices, GAO-02-246 (Washington, D.C.: Mar. 15, 2002); Packers and Stockyards Programs: Actions Needed to Improve Investigations of Competitive Practices, GAO/RCED-00-242 (Washington, D.C.: Sept. 21, 2000); and Beef Industry: Packer Market Concentration and Cattle Prices, GAO/RCED-91-28 (Washington, D.C.: Dec. 6, 1990). 4We used data through 2015 because it was the most recent year for which data was available at the time of our analysis.
Page 4 GAO-18-296 Structure of U.S. Cattle Markets
CFTC data and its analyses of trading patterns on specific dates in 2015. To assess the reliability of these data and analyses, we conducted a review of the data and methods that CFTC used in these analyses by, for example, interviewing knowledgeable officials, and determined the work to be sufficiently reliable for our purposes. In addition, we reviewed and summarized documentary evidence from the Chicago Mercantile Exchange on its analysis of the market and on its changes to terms in futures contracts for fed cattle.
To examine factors that may affect USDA’s routine monitoring to ensure against discriminatory or anticompetitive practices in the fed cattle market, we met with officials in AMS’s P&SP and price reporting group to discuss their roles and responsibilities, and we gathered relevant oversight documentation. We also used the results of our analysis of USDA transaction data on packer purchases of fed cattle. We compared USDA actions with standards for internal control in the federal government, specifically those related to the communication and use of quality information.5
To address all our objectives, we conducted interviews with (1) experts in cattle markets, identified by recognition in the professional or academic community, and relevance of published work or research to cattle markets; (2) stakeholders selected to represent a variety of views, including representatives of small and large feedlot operators (feeders), packers, futures market speculators,6 the Chicago Mercantile Exchange, and an organization that focuses on competition and antitrust issues; and (3) agency officials from AMS’s P&SP and price reporting group, USDA’s Office of the General Counsel, and CFTC. We then performed a content analysis of all interviews. The views of the experts and stakeholders we interviewed cannot be generalized to all others with expertise in the cattle markets or all cattle market stakeholders, but they provided valuable insights to our work. Appendix I presents a more detailed description of the scope and methodology of our review.
We conducted this performance audit from August 2016 to March 2018 in accordance with generally accepted government auditing standards.
5GAO, Standards for Internal Control in the Federal Government, GAO-14-704G (Washington, D.C.: September 2014). 6Speculators are market participants who do not have a commercial interest in the cattle business but attempt to profit through trading.
Page 5 GAO-18-296 Structure of U.S. Cattle Markets
Those standards require that we plan and perform the audit to obtain sufficient, appropriate evidence to provide a reasonable basis for our findings and conclusions based on our audit objectives. We believe that the evidence obtained provides a reasonable basis for our findings and conclusions based on our audit objectives.
The livelihood of cattle producers, such as cow-calf operators and feeders, depends fundamentally on the price they receive for their cattle and the cost to produce these cattle. Numerous supply and demand factors can affect this. For example, the long production cycle for cattle means that producers must make decisions about herd size long before they can price and sell their cattle. Producers’ profits also hinge on how weather affects the supply and cost of forage and feed grains. Additionally, the outcome for producers depends on the effect of consumer preferences on demand for and price of beef. International trade in cattle and beef and competition from other protein sources—such as poultry and pork—are also among the many supply and demand factors that influence cattle prices and producers’ incomes.
The cattle production cycle, which runs from birth to slaughter, for most cattle generally ranges from 15 months to 24 months. Calves are usually weaned from cows when they weigh about 500 pounds. They may then move to stocker or growing operations until they weigh 600 to 800 pounds. At this point, they move to feedlots, which produce fed cattle. Specifically, feedlots specialize in feeding cattle a concentrated diet of corn and other grains to enable them to reach between 950 and 1,300 pounds. They are then transported to and slaughtered at a packing plant. Feedlots and packing plants are located throughout the United States but are concentrated in states such as Texas, Oklahoma, Kansas, Nebraska, Colorado, South Dakota, and Iowa.7 Figure 1 traces the movement of cattle from breeding to processing and consumption. Figure 2 shows the locations of cattle in feedlots.
7USDA’s National Agricultural Statistics Service estimated that approximately 2,200 feedlots with the capacity to hold 1,000 head of cattle or more fed 20.9 million head of cattle in 2016. P&SP oversees several hundred packing plants, including very small plants. According to AMS documents, 36 packing plants slaughtered at least 125,000 head of cattle per year as of 2017.
Background
Cattle Production Cycle and Recent Price Trends for Fed Cattle

Page 6 GAO-18-296 Structure of U.S. Cattle Markets
Figure 1: The Beef and Cattle Industry from Animal Breeding to Consumption
Note: A small proportion of U.S. cattle, such as those that are organic or grass fed, are not raised using this process and typically do not enter feedlots.

Page 7 GAO-18-296 Structure of U.S. Cattle Markets
Figure 2: Locations of Cattle in Feedlots
Note: Information is from the National Agricultural Statistics Service’s 2002 Census of Agriculture. The Census of Agriculture is conducted every 5 years, and data from the 2002 census was the last used to produce a map of cattle in feedlots.
According to price data from AMS’s price reporting group, inflation-adjusted fed cattle prices have generally been increasing since about 2010. Fed cattle prices rose from about $125 per hundred pounds (live weight) in July 2013 and began to increase rapidly in fall 2013.8 Prices
8We adjusted prices shown in this paragraph for inflation, which are in December 2016 dollars.

Page 8 GAO-18-296 Structure of U.S. Cattle Markets
reached a historical high of about $173 per hundred pounds in November 2014, began to drop at the beginning of 2015, and then decreased dramatically in August and September of 2015, decreasing to about $123 per hundred pounds by the end of that year—an overall drop of about 30 percent from November 2014. In 2016, after briefly increasing, prices dropped further throughout much of the year to about $100 per hundred pounds—an overall drop of about 40 percent from November 2014. Prices then rose in the first half of 2017 before dropping again midyear. See figure 3 for more detailed information on fed cattle price changes over the past 10 years, including a trend line.
Figure 3: Monthly Average Inflation-Adjusted Prices for Fed Cattle, 2008 through 2017
Note: Data represent the monthly average of publicly reported cattle prices from the Agricultural Marketing Services’ daily “five-area” weighted average price report. The five areas are: Texas/Oklahoma/New Mexico, Kansas, Nebraska, Colorado, and Iowa/Minnesota. The long-term price trend line uses data starting in November 2002, the earliest date that price data are available from AMS.
Market participants use the futures market for fed cattle to manage the risk associated with price changes, determine prices, or speculate on price changes. Futures contract terms that reflect the underlying fed cattle
Function of the Futures Market for Fed Cattle
Page 9 GAO-18-296 Structure of U.S. Cattle Markets
market help ensure that prices in both the fed cattle and futures markets are closely linked because they are influenced over the long run by the same market forces. The two markets also show similar patterns because participants in both markets tend to rely on the same types of information when entering into transactions. The Chicago Mercantile Exchange establishes the terms of futures contracts, including the quantity, quality, and locations to which fed cattle bought and sold on the futures market may be delivered. The only aspect left unspecified is the price at which each individual contract will be bought or sold.
The futures market provides cattle market participants with a means to hedge—shift unwanted price risk to others more willing to assume the risk. Some buyers and sellers in the fed cattle market, such as packers and feeders, trade in futures contracts to hedge the risks of price changes in the fed cattle or wholesale and retail beef markets. For example, a feeder concerned that fed cattle prices may decline in the future may decide to lock in his or her sell price by selling futures contracts: if fed cattle prices decline, profits from the futures contracts will generally offset losses from the lower fed cattle prices. The same is true for a meat packer concerned about prices going up. The packer might buy a futures contract to lock in a purchase price, with futures profits offsetting higher fed cattle prices. Other futures market participants—generally, speculators—may take a view about whether the price of fed cattle may go up or down and, based on that view, enter into the market as a buyer or seller. For example, speculators could purchase futures contracts from cattle market participants if they think that futures prices may increase in the future or, conversely, sell a futures contract if they believe prices may decline. These speculators provide the market with additional liquidity so that cattle market participants have willing buyers and sellers with whom to conduct transactions.
Within USDA, AMS’s P&SP and price reporting group play specific roles in the cattle market. For example, P&SP performs various functions to help USDA execute its oversight responsibilities for cattle markets, which include halting unfair and anticompetitive marketing practices. To help USDA execute these oversight responsibilities, P&SP collects the following types of information to conduct both routine monitoring and targeted investigations:
• Packers’ annual reports. Under the Packers & Stockyards Act, each packer must submit an annual summary of operations to P&SP that includes information on the dollar volume of cattle purchased, number
Cattle Market Oversight Roles and Responsibilities of USDA and CFTC

Page 10 GAO-18-296 Structure of U.S. Cattle Markets
of head purchased, and some proprietary financial information.9 P&SP officials use this information to, among other things, review the financial status of packers and their ability to stay solvent to pay for their purchases.
• Transaction data from the four largest packers. P&SP officials told us that they send letters annually to the industry’s four largest packers requesting data on their transactions with feeders. According to P&SP officials, the packers provide P&SP with information on every transaction made during that year. P&SP officials told us that they also ask for new marketing agreements the packers have entered into throughout the year, to allow officials to track marketing agreements over time.
• Investigation information. During investigations, P&SP officials collect evidence such as business records and witness testimony from packers and others. P&SP can conduct investigations based on its own initiative or based on complaints from market participants.
If, in the course of its oversight work, P&SP determines that a competition violation may have occurred, P&SP officials refer the case to USDA’s Office of the General Counsel, which may pursue the case or further refer the case to the U.S. Department of Justice.
The price reporting group’s role in the cattle market is to implement the Livestock Mandatory Reporting program as required by the Livestock Mandatory Reporting Act of 1999.10 According to AMS, the purpose of the group is, among other things, to provide information regarding the marketing of livestock and encourage competition in the marketplace for livestock and livestock products. To fulfill this role, the price reporting group collects information on packers’ daily livestock purchases on both mandatory and voluntary bases.
• Mandatory. Under the Livestock Mandatory Reporting Act of 1999, all qualifying packers must report information on all their purchases and
9The act (7 U.S.C. 181-229c) also covers (1) other livestock, such as sheep, goats, and poultry and (2) the protection of industry participants by, among other things, ensuring that sellers are paid promptly and that the animals are weighed accurately. This report focuses primarily on the agency’s responsibilities to address competition-related concerns involving cattle. 10Pub. L. No. 106-78, tit. IX, 113 Stat. 1188.

Page 11 GAO-18-296 Structure of U.S. Cattle Markets
sales on a daily basis.11 The price reporting group receives daily price data on all fed cattle that a packing plant purchases, and all the beef it sells. According to price reporting group officials, they aggregate and summarize the information by sector and publish it within an hour of receipt. For example, the price reporting group publishes information on the number of cattle transacted, proportion of each of the four transaction types used, and the average weight and price of cattle transacted. The price reporting group does not report information on individual transactions or summarized information if there is a risk that the packer may lose confidentiality due to low reporting numbers.
• Voluntary. The price reporting group collects additional voluntary information from packers, such as data on feeder cattle transactions and on new or unique markets (e.g., the market for grass-fed cattle).
CFTC, an independent agency of the federal government, has exclusive jurisdiction over futures and other derivatives markets, except otherwise provided in law.12 Consistent with the Commodity Exchange Act,13 CFTC’s mission is to protect market users and the public from fraud, manipulation, abusive practices, and systemic risk related to derivatives, and to foster open, competitive, and financially sound futures markets. This mission is achieved through a regulatory scheme that is based on federal oversight of industry self-regulation through organizations such as the Chicago Mercantile Exchange. As a self-regulatory organization, the Chicago Mercantile Exchange is responsible for, among other things, establishing and enforcing rules governing the conduct and trading of its members and preventing market manipulation.
11According to statute, a qualifying packer includes any person engaged in the business of buying cattle for purposes of slaughter or of manufacturing or marketing meats or meat food products; however, qualifying packers are only beef packing plants that are federally inspected and that slaughter at least 125,000 head of cattle per year. 7 U.S.C. § 1635d(5). As of 2017, 36 packing plants from 14 different packing companies reported data to AMS. 12Financial derivatives are globally used financial products that unbundle exposure to an underlying asset and transfer risks—the exposure to financial loss caused by adverse changes in the values of assets or liabilities—from entities less able or willing to manage them to those more willing or able to do so. The values of financial derivatives are based on an underlying reference item or items, such as equities, debt, exchange rates, and interest rates. 137 U.S.C. §§ 1-26.

Page 12 GAO-18-296 Structure of U.S. Cattle Markets
Our review identified several supply and demand factors—such as a prolonged drought that affected the price of cattle feed and the availability of relatively less expensive protein substitutes such as pork—that affected changes in fed cattle prices from 2013 through 2016. Furthermore, we found that varying competition levels among packers did not appear to explain the large national price changes but may have contributed to variations in fed cattle prices in different areas of the country.
Based on interviews with some experts, stakeholders, officials from USDA and CFTC, and our analysis of cattle market data, several interrelated supply and demand factors affected the large national changes in fed cattle prices from 2013 through 2016. These factors included drought, costs for feed, and the price of substitute proteins, such as pork. As it relates to supply factors, from 2010 through early 2013 a prolonged drought—beginning in the southern United States in late 2010 and expanding to the High Plains in 2012—affected major cattle areas.14 This drought caused the supply of young cattle to decrease and then increase and, correspondingly, the national price of fed cattle to increase and then decrease when those cattle came to market as fed cattle. Some experts and stakeholders we interviewed told us that cow-calf operators may have liquidated their herds in 2012 and 2013 because the droughts reduced the supply of forage available to raise younger cattle, and cow-calf operators could not feed as many cattle on available pasture and rangeland. The domestic cattle inventory decreased from about 96.5 million in 2007 to about 88.5 million in 2014. This decrease in inventory reduced the supply of fed cattle available for sale in 2013 and 2014, which could have driven up prices for fed cattle. As the drought eased in late 2013, it became more feasible to feed herds on forage, creating incentives for cow-calf operators to expand their herds throughout 2014 and 2015. This increased the number of fed cattle sold for slaughter by late 2015, and prices began to drop at that time. See figure 4 for information on the relationship between fed cattle price changes and the U.S. cattle inventory over the past 10 years. See appendix II for more
14The National Centers for Environmental Information divides the country into six climate regions. The southern U.S. climate region includes Texas, Oklahoma, Arkansas, Louisiana, Mississippi and Tennessee. The High Plains climate region includes Kansas, Colorado, Nebraska, Wyoming, South Dakota, and North Dakota.
A Variety of Supply and Demand Factors Affected Fed Cattle Price Changes from 2013 through 2016
Several Supply and Demand Factors Including Drought and the Retail Price of Substitute Proteins Affected Fed Cattle Price Changes

Page 13 GAO-18-296 Structure of U.S. Cattle Markets
information on the number of U.S. cattle at various points in the supply chain.
Figure 4: Fed Cattle Prices in Relation to the U.S. Cattle Inventory, 2008 through 2017
Note: For fed cattle prices, we used average monthly inflation-adjusted data. The U.S. cattle inventory is an estimate made by the National Agricultural Statistics Service using survey data from cattle producers. We used data from January 1 of each year.
Costs for feed also affected the fed cattle supply, contributing to the large changes in fed cattle prices from 2013 through 2016. An easing of the widespread drought in late 2013 reduced the price of corn and other grains used to feed cattle, which, according to some experts and P&SP officials, may have created an incentive for feeders to grow their cattle to heavier weights before marketing them to packers. For example, the price of corn decreased from about $6.87 per bushel in late 2012 to about $3.50 per bushel in late 2014. According to data from USDA’s price reporting group, fed cattle weight increases from 2003 through 2013 averaged about 14 pounds per year; however, our analysis of cattle market data from USDA showed average fed cattle weights increased by about 40 pounds in 2015. For additional longer-term information on increases in cattle weights, see appendix II. However, particularly heavy cattle can receive lower prices per pound, in part because packers told us
Page 14 GAO-18-296 Structure of U.S. Cattle Markets
that unusually large cuts of beef can be more difficult to sell. In 2014 when the fed cattle supply was low, P&SP officials reported that packers were not necessarily paying lower prices for over-heavy cattle, so feeders would not have received this price indicator to keep the cattle they sold below certain weights. According to some experts, these heavier weights, combined with the larger overall number of cattle offered for sale in 2015, resulted in increased supply, exacerbating the price decline.
Reduced demand for wholesale beef and for fed cattle also affected the large national changes in fed cattle prices. Our analysis of cattle market and other economic data showed that several factors reduced demand for beef; this in turn reduced demand for fed cattle. These factors included (1) higher wholesale beef prices and concurrently lower relative prices of pork and chicken, which are substitutes for beef for consumers and which would reduce demand for retail beef; (2) increases in the amount of beef in cold storage,15 also limiting packer demand for fed cattle; and (3) fluctuations in the strength of the U.S. dollar, which would shift consumer purchases toward or away from relatively less expensive imported beef, as well as contribute to shifts in net exports—that is, total exports minus total imports. In addition, according to some experts and stakeholders, an overall reduction in packing capacity when packers closed several plants, including one large plant in Texas, may have also limited packer demand for fed cattle.
P&SP officials conducted an investigation into the price drop beginning in August 2015. P&SP officials told us that as they saw fed cattle prices rapidly decreasing in August and September 2015, they included this investigation in the agency’s annual work plan for 2016. They also told us that P&SP conducted the work based on its own initiative and not as the result of a request from a market participant or because it received specific information on possible wrongdoing. The P&SP investigation reviewed changes in price spreads between fed cattle and wholesale—or boxed—beef because such price spreads can serve as a rough indicator of packer profit. P&SP found that packers may have benefitted for a short period as the prices they paid for fed cattle decreased more quickly than the prices they received for boxed beef, but it also found that those price differences quickly diminished to smaller levels than before the price drop. The report concluded that the sharp price decrease in 2015 was
15According to USDA, beef in cold storage is frozen beef held in commercial and public warehouses prior to being offered for sale to consumers.
Page 15 GAO-18-296 Structure of U.S. Cattle Markets
likely due to a number of market factors that affected both supply and demand, such as an increased number of fed cattle sold for slaughter and lower relative prices for pork and chicken.
Competition levels among packers varied in different areas of the country. These variations did not appear to explain the large national changes in fed cattle prices from 2013 through 2015 but may have contributed to variations in fed cattle prices in different areas of the country. Specifically, at the national level, packer competition levels were stable from 2013 through 2015. Using P&SP’s annual data on transactions between packers and feeders during this time frame, we estimated the degree of competition in any given area by calculating market concentration levels among packers using a measure called the Herfindahl-Hirschman Index (HHI).16 From a practical perspective, a lower HHI indicates generally that there is more competition in a market. In particular, an HHI is lowest when a market is occupied by a large number of firms of relatively equal size and is highest when a market is controlled by a single firm (i.e., there is no competition in that market). Some large packing plants closed from 2013 through 2015, but the average HHI level varied by only one percentage point (from about 51 to about 52 percent), whereas the total price decrease from November 2014 through December 2015 was about 30 percent. Because of this, it was unlikely that variations in competition affected the large price decrease.
However, variations in competition levels in different areas of the country may have contributed to price differences we observed in those areas. The data show that the average competition level was about 51 percent, suggesting that, on average, a given feedlot had two packing plants to which it could sell its fed cattle. Competition levels tended to be higher in states such as Texas, Oklahoma, Kansas, Nebraska, Colorado, South Dakota, and Iowa, where there are more cattle on feed as we showed in figure 2, suggesting that feeders in those areas had more packing plants to choose from. Competition levels tended to be lower in areas that had fewer cattle on feed, such as in the northeast and the Pacific Northwest, 16According to the U.S. Department of Justice, the HHI is a commonly accepted measure of market concentration. The index takes into account the number of firms in a market, as well as the market share of each firm. We generated HHIs for individual counties. Each county’s HHI used information for all transactions in that county based on feedlot location. HHIs did not require that feeders sell to packers within that county or some distance of that county but rather allowed geographic markets to define themselves based on transactions conducted.
Competition Levels among Packers Did Not Appear to Affect National Price Changes in the Fed Cattle Market but May Have Contributed to Price Variations in Different Areas of the Country
Page 16 GAO-18-296 Structure of U.S. Cattle Markets
suggesting that feeders in those areas had fewer packing plants to which they could sell their cattle.
Using an econometric model, after controlling for other factors that could affect price—such as the supply and demand factors we discuss above,17 or attributes of the beef produced by fed cattle such as yield and quality grade18—we found that less packer competition in any given area was associated with lower fed cattle prices in that area.19 Specifically, our model estimated that fed cattle prices in less concentrated areas (those with an HHI in the 25th percentile of our analysis) may have been about 9 percent higher than in more concentrated areas (those with an HHI in the 75th percentile of our analysis). Such competition effects can exist in legitimately functioning markets. The results of our analysis suggest that some packers may have been able to exercise market power in areas with less competition. Evidence of this effect alone does not imply that packers engaged in anticompetitive or improper behavior. For more detailed information on our analysis, see appendix III.
17In the model, we control for these factors using a set of variables to control for “prevailing market conditions.” See appendix III for more information on these variables. 18According to USDA, beef yield grades range from 1 to 5 and indicate the amount of usable meat from a carcass. Yield grade 1 is the highest grade and denotes the greatest ratio of lean meat to fat; yield grade 5 is the lowest yield ratio. As it relates to beef quality, there are eight grades. Prime grade beef is produced from young, well-fed beef cattle and has abundant marbling, or fat dispersed throughout the muscle. Choice grade beef is high quality but has less marbling than Prime beef. Select grade beef is very uniform in quality and normally leaner than the Prime and Choice grades. Standard and Commercial grades are frequently sold as ungraded or as “store-brand” meat. Utility, Cutter, and Canner grades are seldom, if ever, sold at retail but are used instead to make ground beef and processed products. 19For example, in an area with less competition, a packer could more successfully bid a lower price because there are fewer or no other packers to bid against that packer. In this case, we are examining a market with either one or a small number of buyers—that is, packers—and a large number of sellers—that is, feeders. This is known as a monopsony (single buyer) or oligopsony (few buyers).
Page 17 GAO-18-296 Structure of U.S. Cattle Markets
CFTC’s regular monitoring efforts and its analysis of trading patterns, including of particularly volatile trading days, did not find evidence of irregularities in the futures market for fed cattle in 2015. However, CFTC and others have expressed concern that certain terms in futures contracts for fed cattle—such as the quality of beef represented in the contract—did not sufficiently mirror the specifics of the fed cattle market, which could make them less useful to cattle market participants for hedging risk. In response, the Chicago Mercantile Exchange submitted changes to contract terms to CFTC. CFTC reviewed those changes, and where the agency found the changes consistent with the Commodity Exchange Act and regulations, allowed or expressly approved those changes.
CFTC’s daily monitoring of the futures market for fed cattle did not find evidence of trading irregularities. In addition, CFTC conducted a more in-depth review of volatile trading days in 2015 and did not identify evidence of trading anomalies or that certain groups of traders, such as speculators, unduly influenced the market. Our analysis of trading data confirmed that the futures market for fed cattle experienced episodes of higher volatility beginning in late 2015 and going through 2017 than it had experienced in years immediately prior, and some market participants expressed concern that this volatility could be due to possible trading irregularities. Specifically, variations in futures market prices were generally higher in late 2015 than in 2013 or 2014 and more frequently reached the maximum allowed change in price for any given day, based on rules set by the Chicago Mercantile Exchange.20 See figure 5 for information on average futures prices for fed cattle and historical volatility from 2008 through 2017.
20In the futures market for fed cattle, the Chicago Mercantile Exchange allows futures prices to move $3.00 per hundred pounds either above or below the previous day’s settlement price. Once prices reach that limit, trades may not go beyond that threshold. On trading days immediately following a day when the $3.00 per hundred pounds was reached for either of the two contracts closest to expiration, the limit for all contracts moves to $4.50 per hundred pounds.
CFTC Did Not Find Evidence of Trading Irregularities in the Futures Market for Fed Cattle in 2015, and Is Overseeing Changes to Address Contract Concerns
CFTC’s Monitoring and Analysis of Volatile Trading Days Did Not Find Evidence of Trading Irregularities

Page 18 GAO-18-296 Structure of U.S. Cattle Markets
Figure 5: Average Inflation-Adjusted Prices for Fed Cattle Futures Compared with Historical Volatility in that Market, 2008 through 2017
Note: Currently, the futures market for fed cattle has contracts for even months (Feb, Apr, Jun, Aug, Oct, and Dec). Based on this, we show volatilities above based on even months only. Historical volatility is presented as annualized historical volatility.
Some experts told us that high volatility in the futures market generally can be the result of uncertainty or shocks in the futures or fed cattle markets. For example, the futures market experienced high levels of volatility in late 2003 through 2005 after bovine spongiform encephalopathy (BSE) was first detected in a cow in the United States in December 2003 (see appendix II for more information on BSE events since 2003 and their impact on U.S. beef exports). More recently, the market also experienced high levels of volatility during the financial crisis that began in 2008 as well as in the latter part of 2015 as the price of fed cattle rapidly decreased. However, some cow-calf operators and feeders, including members of the National Cattleman’s Beef Association and the Ranchers-Cattlemen Action Legal Fund United Stockgrowers of America raised questions about whether the futures market volatility in 2015 might be due to manipulation or to high-frequency trading, a specific type of
Page 19 GAO-18-296 Structure of U.S. Cattle Markets
activity in which a speculator makes numerous trades at very high speeds in an effort to profit from small changes in the market.21
Both CFTC and the Chicago Mercantile Exchange conduct daily monitoring of the futures market for fed cattle, and CFTC officials told us that they did not identify evidence of trading irregularities in 2015. In addition, in response to concerns and a request from some cattle market participants, CFTC analyzed trading patterns in the market, including reviewing particularly volatile days in 2015. CFTC did not find evidence of trading anomalies or that certain groups of traders, such as speculators, unduly influenced the market. The Chicago Mercantile Exchange conducted a similar review and came to similar conclusions. Both CFTC and the Chicago Mercantile Exchange also concluded that high-frequency trading did not contribute substantially to volatility on the days they reviewed. Specifically, the Chicago Mercantile Exchange concluded that the futures market volatility was predominantly the result of non-high frequency traders placing and executing large, aggressive futures orders.
Furthermore, as a way of comparing the use of automated and high-frequency trading in the futures market for fed cattle to related markets, CFTC officials told us that their review found that futures contract markets for other agricultural commodities from 2014 through 2016—including for corn, wheat, soybeans, and pork—were characterized by a greater percentage of automated trading, including high-frequency trading, than the futures market for fed cattle. Finally, according to documentation from the Chicago Mercantile Exchange, the high levels of volatility in the futures market could be related to both the swift declines in fed cattle prices and the fact that an increasing number of fed cattle are sold during the last few business days of the week, rather than throughout the week. Concentrating purchases to one or two days of the business week decreases the number of price signals that the fed cattle market can provide futures market participants. According to Chicago Mercantile Exchange documentation, a decrease in the frequency of price signals creates information gaps for market participants and likely contributes to price volatility.
21There is no commonly accepted definition of high-frequency trading, and for that reason definitions of this term vary by entity.

Page 20 GAO-18-296 Structure of U.S. Cattle Markets
CFTC and some stakeholders expressed concern that the terms of cattle futures contracts did not adequately reflect structural changes in the fed cattle market and that differences between the terms of futures contracts and the fed cattle market could cause futures contracts to become less useful to cattle market participants to hedge risks. According to Chicago Mercantile Exchange documents, futures contract terms are designed to match relevant commodities markets and industry standards to help ensure that there is a two-way relationship between the futures market and the relevant commodity market. When contract terms reflect the market and futures markets operate properly, prices in the fed cattle and futures markets may initially diverge, but over time should generally converge by the time a contract expires. If the prices do not converge, contracts become less useful to market participants as a way to hedge risks. For example, prior to October 2017, cattle futures contracts specified that at least 55 percent of the fed cattle in those contracts were to produce a beef quality grade of Choice or better. From fiscal years 2013 through 2017, the percentage of beef graded nationally as Choice or better has been higher than this—at times as high as about 80 percent, although proportions have varied by region. Stakeholders have expressed concern that because the beef quality specifications in futures contracts for fed cattle are lower than the beef quality produced by animals traded in the fed cattle market, this difference may decrease the value of those futures contracts. Additionally, stakeholders expressed concern that this difference can negatively impact whether prices in the futures and fed cattle markets effectively converge as expected.
In response to these concerns, the Chicago Mercantile Exchange made changes to the terms of futures contracts for fed cattle in 2016 and 2017, which were reviewed and approved by CFTC. To better align futures contracts with the fed cattle market, the Chicago Mercantile Exchange has increased the quality percentage of Choice or better quality beef to 60 percent, starting with October 2017 futures contracts, and to 65 percent Choice or better quality beef, starting with October 2018 futures contracts.
In 2016, also in response to concerns raised by stakeholders, CFTC asked the Chicago Mercantile Exchange to provide information on additional measures under consideration by the exchange, such as changing the terms in futures contracts for fed cattle and making them more consistent with the fed cattle market. As a result of dialogue between the two entities, the Chicago Mercantile Exchange revised its delivery process and expanded the timeframe for making deliveries,
CFTC and Some Stakeholders Expressed Concern about Cattle Futures Contract Terms, and CFTC Is Overseeing Related Changes
Page 21 GAO-18-296 Structure of U.S. Cattle Markets
which has allowed it to add locations where cattle can be delivered to satisfy a futures contract.22 According to CFTC, this change made delivery more accessible and improved the connection between the fed cattle and futures markets. The Chicago Mercantile Exchange submitted these and similar changes to CFTC. CFTC reviewed those changes, and where the agency found the changes consistent with the Commodity Exchange Act and regulations, allowed or expressly approved those changes. Chicago Mercantile Exchange representatives told us that these changes will help futures contracts better reflect the fed cattle market. CFTC officials said that they believe the changes have the potential to strengthen the performance of the futures market for fed cattle as a risk management and price discovery tool, but will continue to monitor the effectiveness of the changes.
Two factors affect P&SP’s routine monitoring to ensure against discriminatory or anticompetitive practices in the fed cattle market. First, USDA’s view of its legal authority does not allow P&SP routine access to the data from AMS’s price reporting group on daily transactions between packers and cattle feeders. Second, P&SP does not periodically analyze the transaction data that it collects from packers to learn more about the operation of the fed cattle market.
22According to Chicago Mercantile Exchange documents, a futures contract for fed cattle is a standardized agreement to buy or sell livestock that specifies the quantity and quality of fed cattle to be delivered to a specified delivery point. In practice, few contracts result in actual delivery of fed cattle; rather, most futures contracts are closed out, or “offset,” prior to delivery by taking an opposite position in the same contract in the same delivery month. However, the “threat” of actual delivery is theoretically what helps tie the fed cattle and futures markets together.
P&SP Does Not Analyze Some Key Transaction Data

Page 22 GAO-18-296 Structure of U.S. Cattle Markets
P&SP carries out its oversight responsibilities through monitoring and investigations. The price reporting group, housed within AMS with P&SP (which moved to AMS in November 2017), collects extensive data on transactions between packers and feeders via livestock mandatory price reporting as required by law.23 The price reporting group does not regularly share these data with P&SP, so the data are not available for P&SP to use for regular monitoring activities to flag potential issues for investigation. Currently, according to USDA officials, P&SP officials may request and receive only specific portions of price reporting data based on individual investigations it has already decided to conduct. For example, P&SP was able to analyze price reporting data in the course of its investigation into the price drop in 2015.
Based on USDA’s reading of the Livestock Mandatory Reporting Act of 1999 provisions that prohibit the disclosure of facts or information acquired through the mandatory reporting program, the price reporting group has not routinely shared the data with P&SP. The act provides some exceptions to the disclosure prohibition. For example, the act allows the price reporting group to share data, as directed by the Secretary of Agriculture, for enforcement purposes.24 USDA officials told us that they do not believe this exception allows the price reporting group to provide routine access to the data for monitoring activities. The officials told us that while the statute does allow for sharing of price reporting data for enforcement purposes, they interpret the term “enforcement purposes” to be a specific ongoing investigation, not market oversight. USDA officials note that the act does not discuss market oversight; rather, it was established to help market participants make business decisions through USDA’s collection and dissemination of price data.
P&SP officials told us that regular access to price reporting data would allow them to more routinely conduct analyses as part of their routine market monitoring activities similar to those carried out in their
23Through the Livestock Mandatory Reporting Act of 1999, Pub. L. No. 106-78, tit. IX, 113-Stat. 1188, livestock mandatory price reporting was developed to facilitate open, transparent price discovery and provide all market participants, both large and small, with comparable levels of market information for fed cattle, swine, sheep, boxed beef, lamb meat, and wholesale pork, according to USDA. The requirement was most recently reauthorized as part of the Agriculture Reauthorizations Act of 2015, Pub. L. No. 114-54 § 101, 129 Stat. 513. 247 U.S.C. § 1636(b).
P&SP Does Not Have Routine Access to Daily Transaction Data That the Price Reporting Group Collects
Page 23 GAO-18-296 Structure of U.S. Cattle Markets
investigations as part of their routine market monitoring activities. Specifically, the officials said that going forward, price reporting data could be used to detect price outliers more quickly and help P&SP identify potential anticompetitive behavior; for example, where buyers might agree to take turns buying cattle at different times so as to avoid competing with one another. Under federal internal control standards, an agency’s management should internally communicate the necessary quality information to achieve the entity’s objectives.25 Such information is, for example, communicated down, across, up, and around reporting lines to all levels of the entity.
Because USDA eliminated the Grain Inspection, Packers & Stockyards Administration and reorganized P&SP under AMS in November 2017, the reorganization provides an opportunity for USDA to review the extent to which price reporting data could be shared with P&SP under the act—now that both P&SP and the price reporting group are within the same agency. However, USDA officials told us in November 2017 that it was too early in the reorganization process to determine whether AMS leadership would view routine sharing of these data any differently. By reviewing the extent to which AMS’s price reporting group can share daily transaction data with P&SP to strengthen the effectiveness of its oversight, USDA has an opportunity to allow P&SP to more effectively carry out its responsibilities to ensure against discriminatory or anticompetitive practices in the fed cattle market. In reviewing its authority to share these data, determining whether it is necessary or advisable to request additional exceptions from the current information disclosure restrictions from Congress would position USDA to strengthen its oversight of that market.
P&SP does not periodically analyze the transaction data that it collects from packers to learn more about the operation of the fed cattle market. As part of its monitoring program, P&SP reviews publicly available, summarized price data on a weekly basis but it does not routinely review the data it collects on transactions between packers and feeders, a potentially useful source of data from packers that would enable P&SP to conduct more detailed monitoring.
25GAO-14-704G.
P&SP Does Not Conduct Detailed Periodic Analyses of Transaction Data Collected from Packers
Page 24 GAO-18-296 Structure of U.S. Cattle Markets
We conducted several in-depth analyses of P&SP’s transaction data, and found that some of these analyses could provide useful information to agency management when it makes oversight decisions. For example, as discussed earlier in this report, one of our analyses found that different areas of the country experienced differing levels of competition and that, controlling for other possible sources of price variation, areas with less packer competition were associated with lower fed cattle prices. Such analyses may allow P&SP to better monitor changes in competition and prices over time, which may help inform its decisions on where to direct its investigative resources and better fulfill its mission to ensure against discriminatory or anticompetitive practices in the fed cattle market.
Other federal agencies conduct routine, in-depth analyses to efficiently direct their investigative resources. For example, as we reported in March 2012, as required by statute, USDA routinely conducts in-depth analyses of crop insurance data to detect potential program fraud, waste, and abuse by farmers, insurance agents, and loss adjusters.26 The agency then uses these analyses to direct its investigative resources. Federal internal control standards specify that management should use quality information to achieve the entity’s objectives including processing the obtained data into quality information and then evaluating the processed information.27
P&SP officials told us that they typically do not receive all of the previous year’s transaction data from packers until the following May. As a result, P&SP has previously considered the use of packer transaction data for routine monitoring to be somewhat limited by the lack of timeliness. However, these officials also told us that the analyses we suggested could still provide useful information. By routinely conducting in-depth analysis of the transaction data it collects, USDA could enhance its monitoring of the fed cattle market. Such analysis could include but not be limited to examining competition levels in different areas of the country.28
The cattle industry is an important part of the nation’s agricultural sector and contributes tens of billions of dollars to the U.S. economy. Amid 26GAO, Crop Insurance: Savings Would Result from Program Changes and Greater Use of Data Mining, GAO-12-256 (Washington, D.C.: Mar. 13, 2012). 27GAO-14-704G. 28For a detailed description of the analyses we conducted, see appendix III.
Conclusions
Page 25 GAO-18-296 Structure of U.S. Cattle Markets
concerns about the drop in fed cattle prices beginning in late 2015 and ongoing questions about anticompetitive behavior in the fed cattle market, P&SP’s role in overseeing this market is paramount.
While P&SP routinely conducts monitoring and investigations, the program does not have routine access to daily price reporting data or periodically analyze the transaction data that it currently collects from packers. The Livestock Mandatory Reporting Act of 1999 allows AMS’s price reporting group to share data with P&SP for enforcement purposes, as directed by the Secretary of Agriculture, but USDA does not believe it has the authority to do so, based on its interpretation of “enforcement purposes” in the statute. Although both P&SP and the price reporting group are within AMS because of a November 2017 departmental reorganization, USDA officials told us that it was too early in the reorganization process to determine whether AMS leadership would view routine sharing of these data any differently. By reviewing the extent to which AMS’s price reporting group can share daily transaction data with P&SP to strengthen the effectiveness of its oversight, USDA has an opportunity to allow P&SP to more effectively carry out its responsibilities to ensure against discriminatory or anticompetitive practices in the fed cattle market. In reviewing its authority to share these data, determining whether it is necessary or advisable to request additional exceptions from the current information disclosure restrictions from Congress would position USDA to strengthen its oversight of that market. Furthermore, as part of its monitoring, P&SP does not periodically analyze the transaction data that it collects from packers to learn more about the operation of the fed cattle market. In analyzing P&SP’s transaction data, we found that while less competition among packers did not appear to result in lower national cattle prices from 2013 through 2015 on a national level, it did account for variations in prices in different parts of the country. By routinely conducting in-depth analysis of the transaction data it collects, USDA could enhance its monitoring of the fed cattle market. Such analysis could include but not be limited to examining competition levels in different areas of the country.
We are making the following two recommendations to USDA:
The Secretary of Agriculture should review the extent to which, under the Livestock Mandatory Reporting Act of 1999, the price reporting group can share daily transaction data with P&SP to allow P&SP to strengthen the effectiveness of its oversight. After reviewing that authority, if the Secretary determines that the statute does not permit the price reporting
Recommendations for Executive Action

Page 26 GAO-18-296 Structure of U.S. Cattle Markets
group to share data with P&SP for routine monitoring purposes, and that routine sharing is advisable in light of the purposes behind the statutory disclosure restrictions, the Secretary should submit to Congress a proposal to allow such sharing. (Recommendation 1)
The Secretary of Agriculture should direct the AMS administrator to ensure that P&SP routinely conducts in-depth analysis of the transaction data that it collects. Such analysis could include but not be limited to examining competition levels in different areas of the country. (Recommendation 2)
We provided a draft of this product to USDA and CFTC for comment. In written comments, reproduced in appendix V, USDA agreed with our two recommendations and described actions it has taken and will take to implement them. CFTC only provided technical comments, which we incorporated as appropriate.
With respect to our first recommendation, USDA stated that it took action and reviewed the authority provided by the Livestock Mandatory Reporting Act of 1999 and determined that the act does not allow for data sharing for routine monitoring purposes. Further, USDA stated that the agency believes considering a statutory amendment to allow for routine data sharing is not advisable, due to the agency’s concerns about maintaining the public’s trust in USDA’s administration of the Livestock Mandatory Reporting program. We believe the steps USDA has taken address our recommendation.
Concerning our second recommendation, USDA agreed that routine in-depth analysis of packer transaction data would enhance USDA’s monitoring of the fed cattle market to ensure against discriminatory or anticompetitive practices. USDA stated that it plans to create a new competition branch in P&SP—now known as the Packers and Stockyards Division—that will be staffed by employees with economic expertise. USDA stated that this new branch will be responsible for reviewing the transactions data P&SP receives from packers and conducting in-depth analyses that would help the agency to monitor changes in competition and prices over time to inform USDA decisions on where to direct its resources. Routinely conducting such analyses would address our recommendation.
USDA also provided technical comments. We incorporated these comments as appropriate.
Agency Comments and Our Evaluation
Page 27 GAO-18-296 Structure of U.S. Cattle Markets
We are sending copies of this report to the appropriate congressional committees, the Secretary of Agriculture, the Chairman of the Commodity Futures Trading Commission, and other interested parties. In addition, the report is available at no charge on the GAO website at http://www.gao.gov.
If you or your staff members have any questions regarding this report, please contact Steve Morris at (202) 512-3841 or [email protected] or Oliver Richard at (202) 512-2700 or [email protected]. Contact points for our Offices of Congressional Relations and Public Affairs may be found on the last page of this report. Key contributors to this report are listed in appendix VI.
Steve D. Morris Director, Natural Resources and Environment
Oliver Richard Chief Economist and Director, Applied Research and Methods

Appendix I: Objectives, Scope, and Methodology
Page 28 GAO-18-296 Structure of U.S. Cattle Markets
This report (1) describes key factors that affected fed cattle price changes from 2013 through 2016; (2) describes what CFTC found about possible trading irregularities in the futures market for fed cattle in 2015 and any changes to the futures contract for fed cattle since 2015; and (3) examines factors that may affect the U.S. Department of Agriculture’s (USDA) routine monitoring to ensure against discriminatory or anticompetitive practices in the fed cattle market.
To describe the key factors that affected fed cattle price changes from 2013 through 2016 and to understand changes and trends in the U.S. cattle market since 2000, we analyzed economic and other market data collected by federal agencies. These data included information about cattle and beef prices, quality, and inventories; cattle and beef transactions; feed prices and feedlot sizes; transaction methods; national drought patterns; and consumption trends for beef, pork, and chicken. We gathered these data from USDA’s Agricultural Marketing Service (AMS), Economic Research Service, National Agricultural Statistics Service, and World Agricultural Outlook Board, among others. For example, we reviewed AMS data on fed cattle prices from November 2002 through August 2017, and we used it to, among other things, develop a long term price trend line. We did not quantify or rank the impact of various factors. We assessed the reliability of the data we analyzed by interviewing officials who maintain the data, reviewing related documentation, and testing the data for missing or erroneous values, and determined that the data were sufficiently reliable for our purposes. When we found discrepancies such as data entry errors, we brought them to the agencies’ attention and worked with the agencies to correct the discrepancies before conducting our analyses.
We also collected USDA transaction data on beef packer (packer) purchases of fed cattle from 2013 through 2015 and we analyzed these data using a variety of methods, including econometric analysis.1 For more on the methods and results of this analysis, see appendix III. We assessed the reliability of the transactions data we analyzed by interviewing officials who maintain the data, reviewing related documentation, and testing the data for missing or erroneous values. We determined that the data were sufficiently reliable for our purposes. In addition to analyzing these data, we reviewed an investigation by AMS’s
1We used data through 2015 because it was the most recent year for which data was available at the time of our analysis.
Appendix I: Objectives, Scope, and Methodology

Appendix I: Objectives, Scope, and Methodology
Page 29 GAO-18-296 Structure of U.S. Cattle Markets
Packers & Stockyards Program (P&SP) on the 2015 drop in fed cattle prices. We did not obtain and review internal packer documents, so the scope of our analysis did not include a review of whether packers engaged in anticompetitive behavior. Such specific investigations would typically be carried out by entities with subpoena authority such as the Federal Trade Commission of the Antitrust Division in the Department of Justice.
To describe what CFTC found about possible trading irregularities in the futures market for fed cattle in 2015 and any changes to the futures contract for fed cattle since 2015, we reviewed and summarized relevant statutes and regulations, such as the Commodity Exchange Act and Commodity Futures Trading Commission (CFTC) regulations for futures exchanges.2 We compared that information with CFTC documentation on its oversight activities related to the futures market for fed cattle, such as its 2013 review of the Chicago Mercantile Exchange and the Chicago Board of Trade to verify the exchange’s ongoing compliance with standards intended to, among other things, prevent market manipulation. Such rule enforcement reviews include oversight into whether designated contract markets comply with core principles as outlined by CFTC. We also reviewed CFTC analyses of trading patterns on specific dates in 2015 after conducting a review of the analyses data and methods and determining the work to be sufficiently reliable for our purposes. In addition, we reviewed and summarized documentary evidence from the Chicago Mercantile Exchange on its analysis of the market and on its changes to terms in futures contracts for fed cattle. To better understand the volatility in the market in 2015, we gathered and analyzed price data from Bloomberg on the futures market for fed cattle.
To examine factors that may affect USDA’s routine monitoring to ensure against discriminatory or anticompetitive practices in the fed cattle market, we gathered and reviewed relevant oversight documentation, including P&SP annual reports and investigative policies and procedures. In addition, we met with officials from AMS’s P&SP and Livestock Mandatory Reporting program (price reporting group) to discuss their roles and responsibilities. We also used the results of our analysis of USDA transaction data on packer purchases of fed cattle. We compared USDA actions with standards for internal control in the federal 2The exchanges are referred to as designated contract markets, and they operate under the oversight of CFTC. The designated contract market for fed cattle futures is the Chicago Mercantile Exchange.
Appendix I: Objectives, Scope, and Methodology
Page 30 GAO-18-296 Structure of U.S. Cattle Markets
government, specifically those related to the communication and use of quality information.3
To address all our objectives, we conducted interviews with (1) cattle market experts; (2) stakeholders selected to represent a variety of views including small and large feedlot operators (feeders), packers, futures market speculators, the Chicago Mercantile Exchange, and an organization specializing in competition and antitrust issues; and (3) agency officials from AMS’s P&SP and price reporting group, and USDA’s Office of the General Counsel, as well as CFTC. We used the following criteria to identify cattle market experts:
• the expert’s recognition in the professional or academic community, and
• the relevance to cattle markets of his or her published work or research to cattle markets.
We identified these experts through our prior work, the recommendations of USDA or CFTC officials, stakeholders, or other recognized experts. We conducted semi-structured interviews with 34 individuals or groups of experts, stakeholders, and officials, and performed a content analysis of relevant responses to our questions. To characterize responses and quantify interviewees’ views throughout this report, we defined modifiers (e.g., “some”) as follows:
• “some” users represents 2 to 5 users,
• “several” users represents 6 to 9 users,
• “many” users represents 10 to 15 users,
• “most” users represents 16 to 24 users, and
• “nearly all” users represents 25 to 29 users.
The views of the experts and stakeholders we interviewed cannot be generalized to all others with expertise in the cattle markets or all cattle market stakeholders, but they provided valuable insights to our work. Appendix IV presents a list of recognized experts that we interviewed.
We conducted this performance audit from August 2016 to March 2018 in accordance with generally accepted government auditing standards. 3GAO, Standards for Internal Control in the Federal Government, GAO-14-704G (Washington, D.C.: September 2014).

Appendix I: Objectives, Scope, and Methodology
Page 31 GAO-18-296 Structure of U.S. Cattle Markets
Those standards require that we plan and perform the audit to obtain sufficient, appropriate evidence to provide a reasonable basis for our findings and conclusions based on our audit objectives. We believe that the evidence obtained provides a reasonable basis for our findings and conclusions based on our audit objectives.

Appendix II: Supplemental Information on Trends in the Fed Cattle Market
Page 32 GAO-18-296 Structure of U.S. Cattle Markets
This appendix provides supplemental information on trends in the fed cattle market. The sections below provide information from analyses and interviews we conducted as part of our review of the fed cattle market, including on fed cattle transaction methods, drought, number of U.S. cattle, feedlot consolidation and size, cattle weights, consumption trends, product differentiation and branded beef, beef price spread, and factors affecting beef exports.
Beef packers (packers) and cattle feedlot operators (feeders) generally use one of four transaction methods to buy and sell fed cattle, and their use of these methods has changed over time for various reasons.1 The four transaction methods are:
• Cash (also referred to as spot or negotiated). A purchase price is determined through buyer-seller interaction. The price is known at the time of agreement, and delivery to the packing plant may take place up to 30 days later.
• Negotiated grid. A base price is negotiated between buyer and seller and is known at the time of agreement. Delivery to the packing plant is usually expected within 14 days. Unlike a cash transaction, the final net price is determined by applying a series of premiums and discounts after slaughter based on carcass performance (usually related to weight, beef yield grade, and beef quality).2
• Forward contract. An agreement for the purchase of cattle, executed in advance of slaughter, under which the base price is established by reference to prices quoted on the Chicago Mercantile Exchange and can be set any time prior to the transaction.
1A relatively small percentage of fed cattle are cattle that packers own for at least 14 days immediately before slaughter. These packer-owned cattle have declined in the last decade due to two packers selling off their feedlots. 2According to USDA, beef yield grades range from 1 to 5 and indicate the amount of usable meat from a carcass. Yield grade 1 is the highest grade and denotes the greatest ratio of lean meat to fat; yield grade 5 is the lowest yield ratio. As it relates to beef quality, there are eight grades. Prime grade beef is produced from young, well-fed beef cattle and has abundant marbling, or fat dispersed throughout the muscle. Choice grade beef is high quality but has less marbling than Prime beef. Select grade beef is very uniform in quality and normally leaner than the Prime and Choice grades. Standard and Commercial grades are frequently sold as ungraded or as “store-brand” meat. Utility, Cutter, and Canner grades are seldom, if ever, sold at retail but are used instead to make ground beef and processed products.
Appendix II: Supplemental Information on Trends in the Fed Cattle Market
Fed Cattle Transaction Methods
Appendix II: Supplemental Information on Trends in the Fed Cattle Market
Page 33 GAO-18-296 Structure of U.S. Cattle Markets
• Formula contract. An advance commitment of cattle—by any method other than cash, negotiated grid, or forward contract—in advance of slaughter. Formula contracts use a method of calculating price in which the price often is not known until a later date. For example, a feeder and a packer may enter into a formula contract several months in advance of slaughter. According to U.S. Department of Agriculture’s (USDA) Agricultural Marketing Service (AMS) officials and others we interviewed, formula contracts often use the cash price from AMS’ Livestock Mandatory Reporting price summaries around the time of slaughter as a base upon which the contract then applies additional premiums and discounts.
Since 2002, the share of fed cattle sold via cash transactions has decreased and the share of cattle sold through formula and forward contracts has increased proportionally. According to our analysis of AMS data, approximately 50 percent of cattle were traded using cash transactions in 2002, but the share fell as low as 22 percent of cattle transactions in 2015. Conversely, the use of other types of transactions—formula and forward contracts and negotiated grid arrangements—increased from about 50 percent of cattle in 2002 to approximately 78 percent in 2015. However, the use of the cash transactions slightly increased again from 2016 through 2017.3 Figure 6 shows the share of fed cattle transactions by method from November 2002 through September 2017.
3We analyzed data from November 2002 through September 2017, the latest month for which data were available at the time of our review.
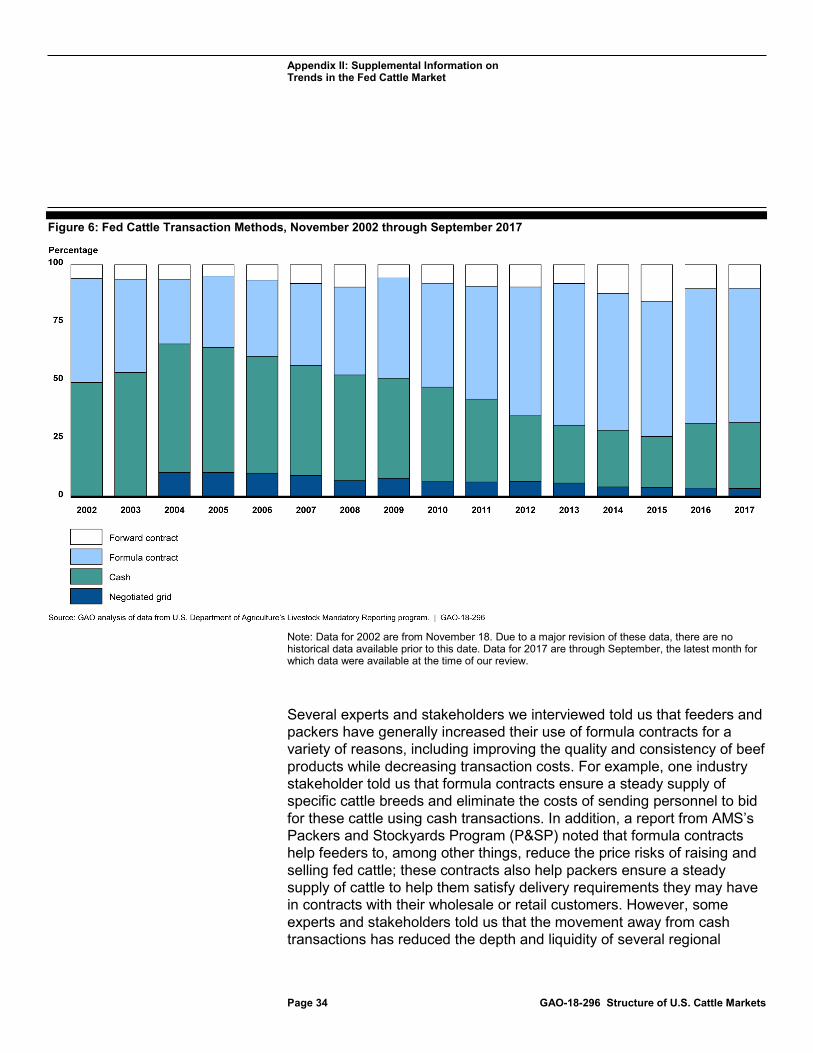
Appendix II: Supplemental Information on Trends in the Fed Cattle Market
Page 34 GAO-18-296 Structure of U.S. Cattle Markets
Figure 6: Fed Cattle Transaction Methods, November 2002 through September 2017
Note: Data for 2002 are from November 18. Due to a major revision of these data, there are no historical data available prior to this date. Data for 2017 are through September, the latest month for which data were available at the time of our review.
Several experts and stakeholders we interviewed told us that feeders and packers have generally increased their use of formula contracts for a variety of reasons, including improving the quality and consistency of beef products while decreasing transaction costs. For example, one industry stakeholder told us that formula contracts ensure a steady supply of specific cattle breeds and eliminate the costs of sending personnel to bid for these cattle using cash transactions. In addition, a report from AMS’s Packers and Stockyards Program (P&SP) noted that formula contracts help feeders to, among other things, reduce the price risks of raising and selling fed cattle; these contracts also help packers ensure a steady supply of cattle to help them satisfy delivery requirements they may have in contracts with their wholesale or retail customers. However, some experts and stakeholders told us that the movement away from cash transactions has reduced the depth and liquidity of several regional
Appendix II: Supplemental Information on Trends in the Fed Cattle Market
Page 35 GAO-18-296 Structure of U.S. Cattle Markets
markets, which may make it more difficult for market participants to accurately determine the market price of cattle (e.g., for a cash sale) because there are fewer observed price points. Moreover, the effect of this difficulty in determining market prices is not limited to cash transactions because cash prices are often used to establish a base price in formula contracts. This reduction of depth and liquidity may also make the fed cattle market more susceptible to wider price fluctuations, according to some experts we interviewed.
Several experts and stakeholders told us that options such as an online fed cattle exchange, established in May 2016, may help address this issue by providing a transparent forum for feeders and packers to sell and purchase fed cattle. However, the exchange is still in its early stages and, as of September 2017, comprised a small fraction of total fed cattle transactions.
Prolonged drought may cause cow-calf operators to liquidate their herds. This is because drought can reduce the supply of forage used to raise younger cattle, so that cow-calf operators cannot feed as many cattle on available pasture and rangeland. From 2000 to 2010 the United States saw periods of both extensive drought and extensive wetness on a broad scale, according to the National Oceanic and Atmospheric Administration. Following that, in early 2010, little of the country was experiencing drought, according to the U.S. Drought Monitor;4 however, drought conditions worsened throughout the second half of that year and improved through the first half of 2011 before worsening in the second half of 2011. This drought impacted some areas of the United States particularly hard with nearly 12 percent of the country in an exceptional drought by the third quarter of 2011. Although the winter months of January 2012 through March 2012 were dry, extreme drought levels improved through early 2012 before a widespread drought began in the summer of 2012. By July 2012, more than 80 percent of the country was at least abnormally dry and more than 60 percent of the country was experiencing drought.
From 2013 through early 2015, drought conditions generally improved. Overall drought conditions continued to improve in 2015, except in the 4The U.S. Drought Monitor is a weekly analysis of drought conditions produced jointly by the National Oceanic and Atmospheric Administration, the U.S. Department of Agriculture, and the National Drought Mitigation Center at the University of Nebraska-Lincoln.
Drought
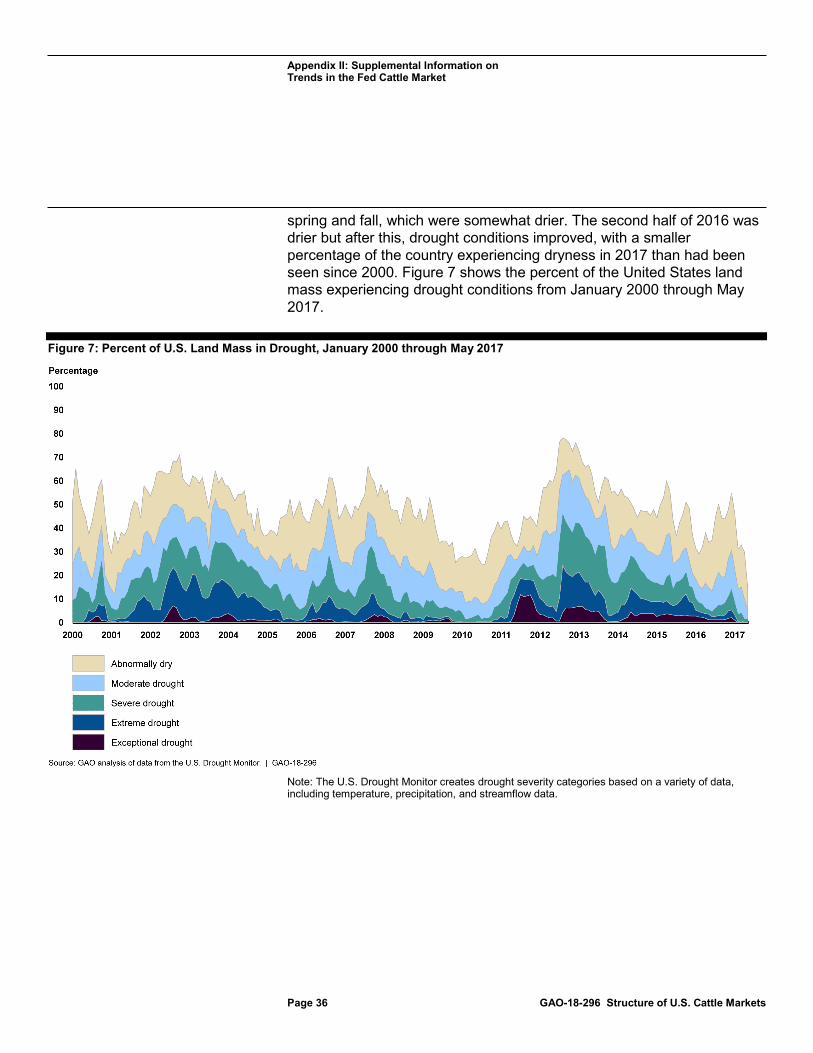
Appendix II: Supplemental Information on Trends in the Fed Cattle Market
Page 36 GAO-18-296 Structure of U.S. Cattle Markets
spring and fall, which were somewhat drier. The second half of 2016 was drier but after this, drought conditions improved, with a smaller percentage of the country experiencing dryness in 2017 than had been seen since 2000. Figure 7 shows the percent of the United States land mass experiencing drought conditions from January 2000 through May 2017.
Figure 7: Percent of U.S. Land Mass in Drought, January 2000 through May 2017
Note: The U.S. Drought Monitor creates drought severity categories based on a variety of data, including temperature, precipitation, and streamflow data.

Appendix II: Supplemental Information on Trends in the Fed Cattle Market
Page 37 GAO-18-296 Structure of U.S. Cattle Markets
The number of cattle at different points in the supply chain can provide various levels of insight into fed cattle market supply. Specifically, the beef cow inventory provides insight into what may happen in the fed cattle market in a few years, 5 and the number of cattle on feed can give an indication of what may happen in the fed cattle market in the next few months. The number of cattle sold for slaughter (also called marketings) is an indication of current supply levels in the fed cattle market.
The beef cow inventory drives the size of the overall cattle inventory and therefore the number of fed cattle coming to market. As such, the size of the beef cow inventory provides a sense of how the fed cattle industry may change over the following 2 years. Our analysis of inventory data from USDA’s National Agricultural Statistics Service indicated that the beef cow inventory declined from 2006 through 2014, at which point it started to increase. In the most recent period of contraction the year-over-year period with the highest rate of contraction in the beef cow inventory was from July 2011 to July 2012, during which the beef cow inventory decreased by 3.0 percent—a rate of contraction not seen in a single year-over-year period since July 1988 to July 1989. The inventory then began to expand in 2014, increasing rapidly by mid-2014, and continued to expand through 2016. From January 2016 to January 2017, the beef cow inventory expanded 3.5 percent, the highest rate of expansion in a single year-over-year period since January 1993 to January 1994. Prior to the late 1980s, higher rates of expansion and contraction were common, but during the next 20 years, annual changes in the beef cow inventory were more gradual, with rates of expansion staying below 0.5 percent. Figure 8 shows the beef cow inventory from 1920—the first year for which we have data—through 2016, with an overall downward trend since the mid-1970s.
5In the United States the beef industry is largely separate from the dairy industry. The term “beef cow” refers to a breeding animal for beef production, and the beef cow inventory includes all cows available for breeding to produce beef cattle.
Number of U.S. Cattle at Various Points in the Supply Chain
Beef Cow Inventory
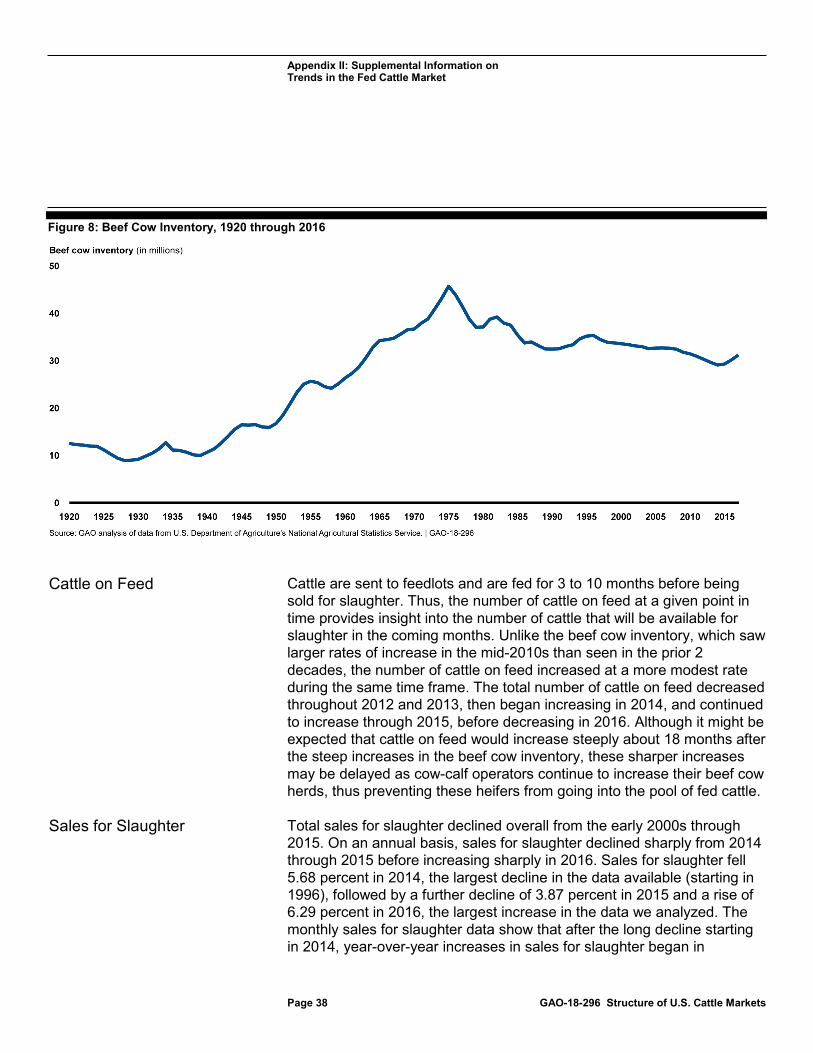
Appendix II: Supplemental Information on Trends in the Fed Cattle Market
Page 38 GAO-18-296 Structure of U.S. Cattle Markets
Figure 8: Beef Cow Inventory, 1920 through 2016
Cattle are sent to feedlots and are fed for 3 to 10 months before being sold for slaughter. Thus, the number of cattle on feed at a given point in time provides insight into the number of cattle that will be available for slaughter in the coming months. Unlike the beef cow inventory, which saw larger rates of increase in the mid-2010s than seen in the prior 2 decades, the number of cattle on feed increased at a more modest rate during the same time frame. The total number of cattle on feed decreased throughout 2012 and 2013, then began increasing in 2014, and continued to increase through 2015, before decreasing in 2016. Although it might be expected that cattle on feed would increase steeply about 18 months after the steep increases in the beef cow inventory, these sharper increases may be delayed as cow-calf operators continue to increase their beef cow herds, thus preventing these heifers from going into the pool of fed cattle.
Total sales for slaughter declined overall from the early 2000s through 2015. On an annual basis, sales for slaughter declined sharply from 2014 through 2015 before increasing sharply in 2016. Sales for slaughter fell 5.68 percent in 2014, the largest decline in the data available (starting in 1996), followed by a further decline of 3.87 percent in 2015 and a rise of 6.29 percent in 2016, the largest increase in the data we analyzed. The monthly sales for slaughter data show that after the long decline starting in 2014, year-over-year increases in sales for slaughter began in
Cattle on Feed
Sales for Slaughter
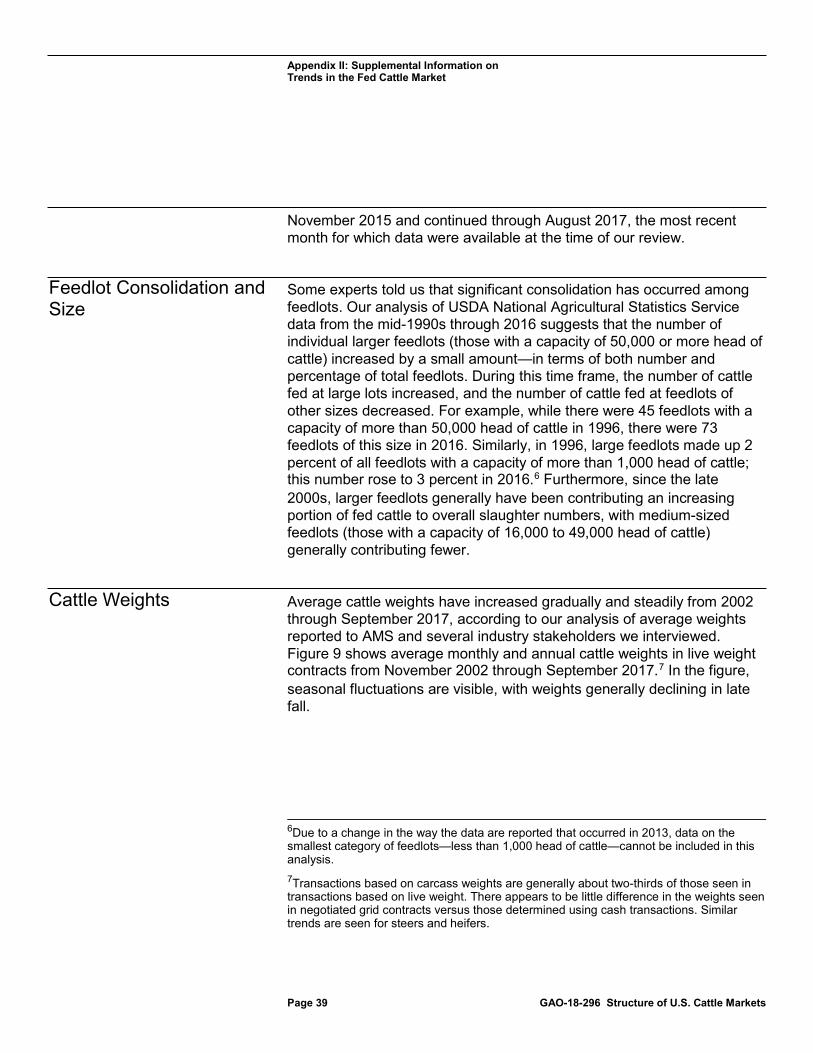
Appendix II: Supplemental Information on Trends in the Fed Cattle Market
Page 39 GAO-18-296 Structure of U.S. Cattle Markets
November 2015 and continued through August 2017, the most recent month for which data were available at the time of our review.
Some experts told us that significant consolidation has occurred among feedlots. Our analysis of USDA National Agricultural Statistics Service data from the mid-1990s through 2016 suggests that the number of individual larger feedlots (those with a capacity of 50,000 or more head of cattle) increased by a small amount—in terms of both number and percentage of total feedlots. During this time frame, the number of cattle fed at large lots increased, and the number of cattle fed at feedlots of other sizes decreased. For example, while there were 45 feedlots with a capacity of more than 50,000 head of cattle in 1996, there were 73 feedlots of this size in 2016. Similarly, in 1996, large feedlots made up 2 percent of all feedlots with a capacity of more than 1,000 head of cattle; this number rose to 3 percent in 2016.6 Furthermore, since the late 2000s, larger feedlots generally have been contributing an increasing portion of fed cattle to overall slaughter numbers, with medium-sized feedlots (those with a capacity of 16,000 to 49,000 head of cattle) generally contributing fewer.
Average cattle weights have increased gradually and steadily from 2002 through September 2017, according to our analysis of average weights reported to AMS and several industry stakeholders we interviewed. Figure 9 shows average monthly and annual cattle weights in live weight contracts from November 2002 through September 2017.7 In the figure, seasonal fluctuations are visible, with weights generally declining in late fall.
6Due to a change in the way the data are reported that occurred in 2013, data on the smallest category of feedlots—less than 1,000 head of cattle—cannot be included in this analysis. 7Transactions based on carcass weights are generally about two-thirds of those seen in transactions based on live weight. There appears to be little difference in the weights seen in negotiated grid contracts versus those determined using cash transactions. Similar trends are seen for steers and heifers.
Feedlot Consolidation and Size
Cattle Weights
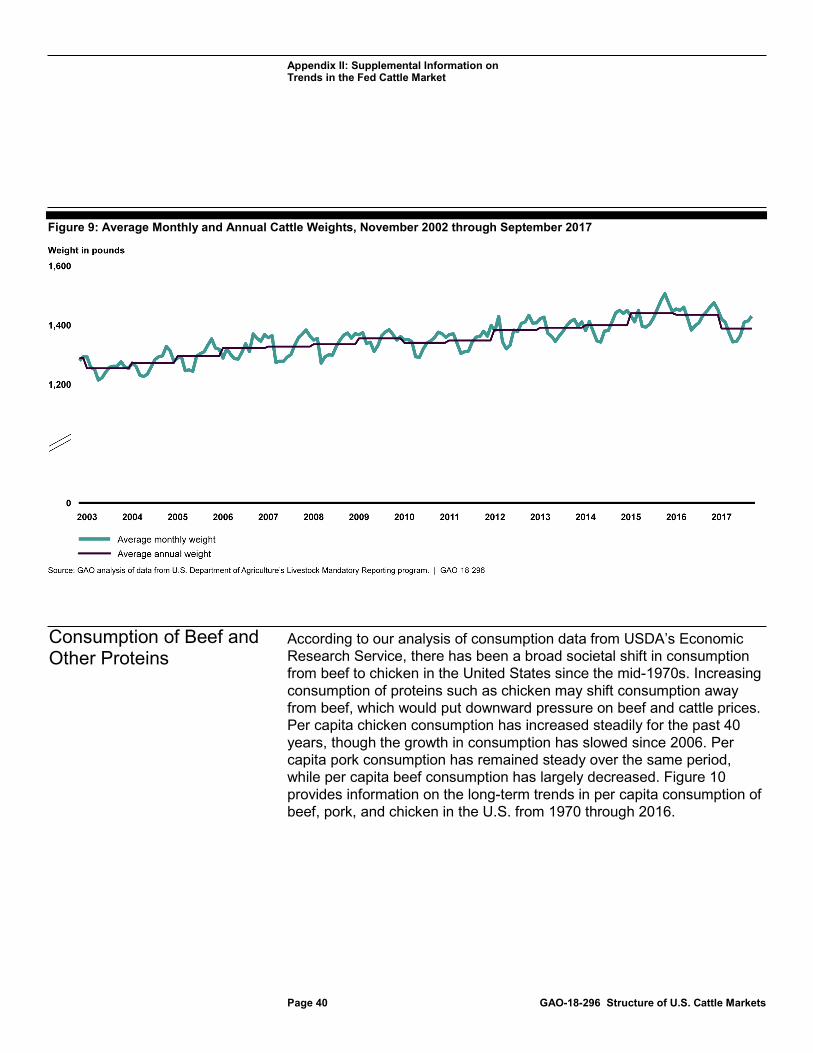
Appendix II: Supplemental Information on Trends in the Fed Cattle Market
Page 40 GAO-18-296 Structure of U.S. Cattle Markets
Figure 9: Average Monthly and Annual Cattle Weights, November 2002 through September 2017
According to our analysis of consumption data from USDA’s Economic Research Service, there has been a broad societal shift in consumption from beef to chicken in the United States since the mid-1970s. Increasing consumption of proteins such as chicken may shift consumption away from beef, which would put downward pressure on beef and cattle prices. Per capita chicken consumption has increased steadily for the past 40 years, though the growth in consumption has slowed since 2006. Per capita pork consumption has remained steady over the same period, while per capita beef consumption has largely decreased. Figure 10 provides information on the long-term trends in per capita consumption of beef, pork, and chicken in the U.S. from 1970 through 2016.
Consumption of Beef and Other Proteins
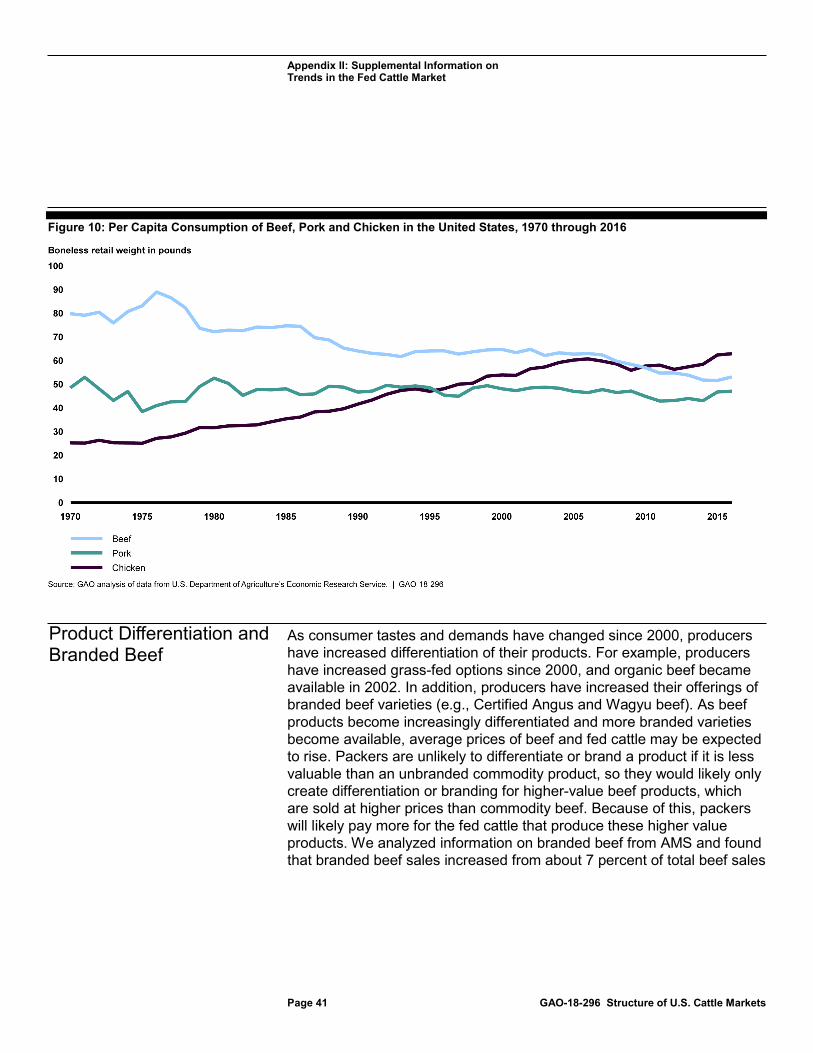
Appendix II: Supplemental Information on Trends in the Fed Cattle Market
Page 41 GAO-18-296 Structure of U.S. Cattle Markets
Figure 10: Per Capita Consumption of Beef, Pork and Chicken in the United States, 1970 through 2016
As consumer tastes and demands have changed since 2000, producers have increased differentiation of their products. For example, producers have increased grass-fed options since 2000, and organic beef became available in 2002. In addition, producers have increased their offerings of branded beef varieties (e.g., Certified Angus and Wagyu beef). As beef products become increasingly differentiated and more branded varieties become available, average prices of beef and fed cattle may be expected to rise. Packers are unlikely to differentiate or brand a product if it is less valuable than an unbranded commodity product, so they would likely only create differentiation or branding for higher-value beef products, which are sold at higher prices than commodity beef. Because of this, packers will likely pay more for the fed cattle that produce these higher value products. We analyzed information on branded beef from AMS and found that branded beef sales increased from about 7 percent of total beef sales
Product Differentiation and Branded Beef
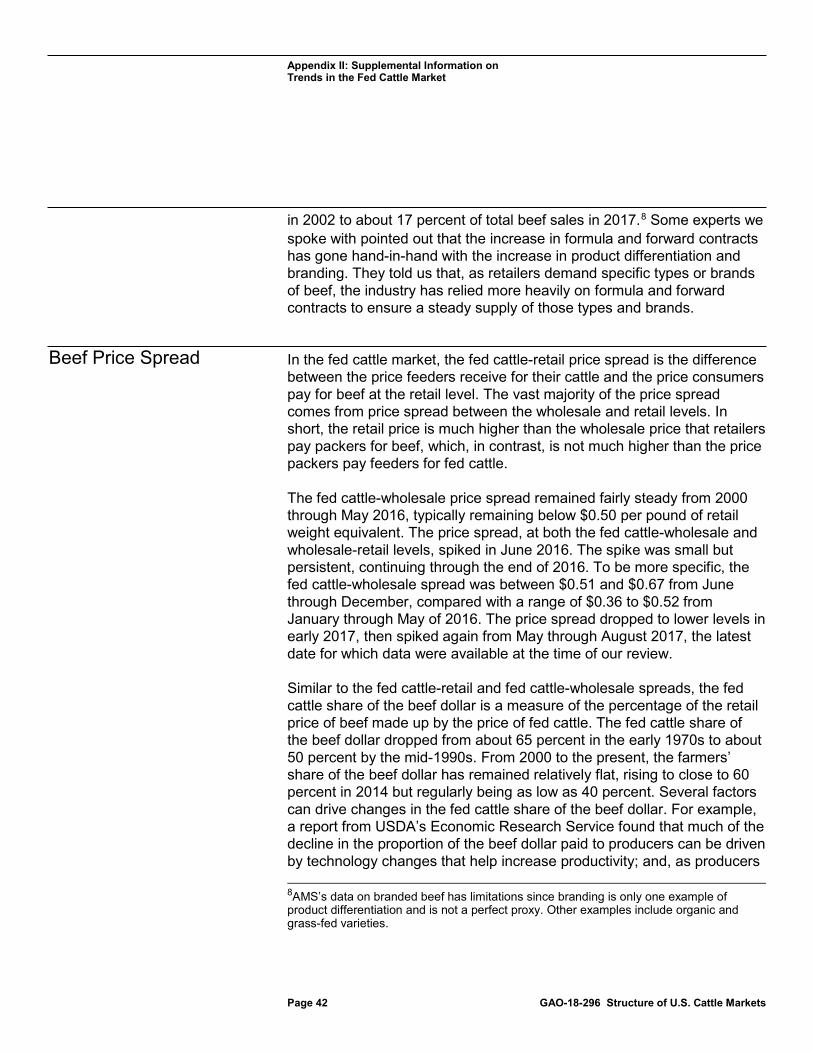
Appendix II: Supplemental Information on Trends in the Fed Cattle Market
Page 42 GAO-18-296 Structure of U.S. Cattle Markets
in 2002 to about 17 percent of total beef sales in 2017.8 Some experts we spoke with pointed out that the increase in formula and forward contracts has gone hand-in-hand with the increase in product differentiation and branding. They told us that, as retailers demand specific types or brands of beef, the industry has relied more heavily on formula and forward contracts to ensure a steady supply of those types and brands.
In the fed cattle market, the fed cattle-retail price spread is the difference between the price feeders receive for their cattle and the price consumers pay for beef at the retail level. The vast majority of the price spread comes from price spread between the wholesale and retail levels. In short, the retail price is much higher than the wholesale price that retailers pay packers for beef, which, in contrast, is not much higher than the price packers pay feeders for fed cattle.
The fed cattle-wholesale price spread remained fairly steady from 2000 through May 2016, typically remaining below $0.50 per pound of retail weight equivalent. The price spread, at both the fed cattle-wholesale and wholesale-retail levels, spiked in June 2016. The spike was small but persistent, continuing through the end of 2016. To be more specific, the fed cattle-wholesale spread was between $0.51 and $0.67 from June through December, compared with a range of $0.36 to $0.52 from January through May of 2016. The price spread dropped to lower levels in early 2017, then spiked again from May through August 2017, the latest date for which data were available at the time of our review.
Similar to the fed cattle-retail and fed cattle-wholesale spreads, the fed cattle share of the beef dollar is a measure of the percentage of the retail price of beef made up by the price of fed cattle. The fed cattle share of the beef dollar dropped from about 65 percent in the early 1970s to about 50 percent by the mid-1990s. From 2000 to the present, the farmers’ share of the beef dollar has remained relatively flat, rising to close to 60 percent in 2014 but regularly being as low as 40 percent. Several factors can drive changes in the fed cattle share of the beef dollar. For example, a report from USDA’s Economic Research Service found that much of the decline in the proportion of the beef dollar paid to producers can be driven by technology changes that help increase productivity; and, as producers 8AMS’s data on branded beef has limitations since branding is only one example of product differentiation and is not a perfect proxy. Other examples include organic and grass-fed varieties.
Beef Price Spread

Appendix II: Supplemental Information on Trends in the Fed Cattle Market
Page 43 GAO-18-296 Structure of U.S. Cattle Markets
have become more productive, they have been willing and able to supply more animals to packers at lower prices. Figure 11 shows the historical price spread for beef from January 1970 through December 2016.
Figure 11: Historical Price Spread for Beef, January 1970 through December 2016
Some industry stakeholders told us that the bovine spongiform encephalopathy (BSE) event—in which the disease was detected in a cow in the United States in 2003—has had a lasting effect on beef exports from the United States. Specifically, these industry stakeholders told us that the 2003 event—and additional BSE events in 2005 and 2006—has continued to depress demand for beef by closing certain foreign markets to U.S. beef. Based on our review of ERS export data, the total tonnage of beef exports plummeted in January 2004 due to the BSE outbreak in the United States and did not consistently return to levels seen before the BSE outbreak until May 2010.
Bovine Spongiform Encephalopathy and Beef Exports

Appendix III: Econometric Model to Estimate the Impact of Market Power on Fed Cattle Transaction Prices
Page 44 GAO-18-296 Structure of U.S. Cattle Markets
This appendix provides information on the econometric model we used to estimate the impact of market power on transaction prices for fed cattle. It describes our econometric model in detail, provides the results of our analysis, and discusses some limitations.
We developed an econometric model to analyze the effect of market concentration on the cash price of fed cattle. Specifically, we analyzed how the level of market concentration of beef packers (packers) affected the cash price of fed cattle. The U.S. fed cattle market is characterized by a large number of feedlot operators (feeders) that sell to a small number of packers for slaughter at packing plants; approximately 83 to 85 percent of the total amount of packing market is conducted by four major packing companies. To analyze the packing market, we obtained transaction data from the Agricultural Marketing Service’s Packers and Stockyards Program (P&SP) within the U.S. Department of Agriculture (USDA).1 The data we used for our analysis comprised transactions collected from these four largest packers for about 127,000 cash transactions from 2013 through 2015.
The data identified the packing plant involved in each transaction; however, we generally could not identify the specific feedlot involved, especially when comparing transactions across different packers. The data were administrative data from each packer, and in some instances, a packing plant may have used a unique set of identifying codes for the feedlots with which it did business. Therefore, we could only consistently identify different feedlots associated with a given packing plant. The same feedlot may have done business with a different plant but we were unable to identify this information consistently across plants. The data contained 963 different dates on which transactions occurred, 970 counties where feedlots were located, and 23 packing plants that purchased fed cattle.
To reduce distortion from dissimilar transactions and outliers, we eliminated transactions that were not cash transactions as well as cash
1P&SP was previously part of USDA’s Grain Inspection, Packers & Stockyards Administration. In November 2017, USDA eliminated the Grain Inspection, Packers & Stockyards Administration as a standalone agency and moved P&SP to the Agricultural Marketing Service under a newly-created Fair Trade Practices Program area within that agency.
Appendix III: Econometric Model to Estimate the Impact of Market Power on Fed Cattle Transaction Prices
Econometric Model

Appendix III: Econometric Model to Estimate the Impact of Market Power on Fed Cattle Transaction Prices
Page 45 GAO-18-296 Structure of U.S. Cattle Markets
transactions that met certain parameters.2 Specifically, we excluded transactions with (1) fewer than 10 animals; (2) a per-pound carcass price of less than 1 dollar or of 10 dollars or more; (3) an average weight per animal that was less than 500 pounds or more than 2,000 pounds; (4) a slaughter date that preceded the number of days from the purchase date by more than 14 days; (5) more than 10 percent cows in the lot; and (6) more than 10 percent ungraded cattle in the lot.
Our dependent variable in the model was the logarithm of the transaction price per carcass-based pound (not including freight) between a packing plant and a feedlot on a given purchase date.
Our model included a variety of explanatory variables, including the Herfindahl-Hirschman Index (HHI),3 beef quality and yield grades, feedlots, live weights, and fixed effects for time and geographic location of the feeder and packing plants.
• HHI. The key variable in the model was the HHI, a measure of packer market concentration faced by feedlots in a given geographic area—analyzed in the model by county—on a given purchase date. The HHI takes the same value for any transaction in a given county on a given purchase date (it varies only at the county level and over time).4 Our calculation used a 90-day moving average window (current day and the 89 days prior) to calculate the HHI for each county on each date.
2Specifically, we eliminated transactions using negotiated grid, forward contract, or formula contract methods. A negotiated grid transaction is one in which a base price is negotiated between buyer and seller and is known at the time of agreement; unlike a cash transaction, the final net price is determined by applying a series of premiums and discounts after slaughter based on carcass performance (usually related to weight, beef yield grade, and beef quality). A forward contract transaction is an agreement for the purchase of cattle, executed in advance of slaughter, under which the base price is established by reference to prices quoted on the Chicago Mercantile Exchange and can be set any time prior to the transaction. A formula contract transaction refers to the advance commitment of cattle for slaughter by any method other than cash, negotiated grid, or forward contract; formula contracts use a method of calculating price in which the price is not known until a later date. 3According to the U.S. Department of Justice, the HHI is a commonly accepted measure of market concentration. The index takes into account the number of firms in a market and the market share of each firm. 4Our methodology for calculating the HHI was based on the method used by Kessler and. McClellan to analyze hospital markets. Kessler and McClellan, “Is Hospital Competition Socially Wasteful?” The Quarterly Journal of Economics, vol. 115, no. 2 (May, 2000), 577-615.
Dependent Variable
Explanatory Variables

Appendix III: Econometric Model to Estimate the Impact of Market Power on Fed Cattle Transaction Prices
Page 46 GAO-18-296 Structure of U.S. Cattle Markets
Although our model included only cash transactions, we calculated the HHI using all transactions; that is, we included formula contracts, forward contracts, negotiated grid transactions, and cash transactions.5 However, we excluded transactions involving packer-owned feedlots and feedlots not in the United States from our HHI calculation. Econometric analysis that uses HHIs to explain prices generally considers the possibility that the HHI variable is endogenous and is possibly correlated with the error term and to address this issue, we instrumented our HHI variable.6
• Beef quality and yield grades. For each lot of cattle transacted, we used as controls the percent of fed cattle in each transaction whose beef graded as Choice or better. We also used as a control the percent of fed cattle in each transaction whose beef yield was rated grades 1 or 2. In addition, we included a measure of the percentages of Holstein cattle, ungraded cattle, and cows in the lot.
• Large feedlots. We used an indicator (dummy) variable for large feedlots—specifically feedlots that were in the 95th percentile of feedlots for the packing plant with which the transaction occurred. We used this variable to control for possible extra bargaining leverage that large feedlots may have with packers.
• Live weight. We controlled for the average live weight of the cattle lot by including categorical variables (dummies) for: less than 1,050 pounds and more than 1,500 pounds (the 1,050 pounds to 1,500 pounds category is the omitted comparison category). We selected these category cut-off values because generally prices are reduced for cattle lots with an average weight of less than 1,050 pounds or more than 1,500 pounds.
• Fixed effects. We used a set of indicator variables to account for fixed effects associated with packing plants, time, and individual counties. Specifically, we used a set of packing plant indicator variables to account for effects pertaining to individual packing plants, such as a plant’s location. We also used a set of time indicator variables—one for each purchase date in the data—to account for
5We calculated the HHI using all transactions because market power and market share is generally not derived from the cash market alone. The size and influence of a packer is likely to be reflected in the totality of transactions with feeders. 6Other work on the effects of market concentration on prices has instrumented the key concentration measures. W. N. Evans et al. “Endogeneity in the Concentration-Price Relationship: Causes, Consequences, and Cures.” The Journal of Industrial Economics, vol. XLI, no. 4 (December 1993).

Appendix III: Econometric Model to Estimate the Impact of Market Power on Fed Cattle Transaction Prices
Page 47 GAO-18-296 Structure of U.S. Cattle Markets
prevailing market conditions on that particular day, such as whether prices were generally low or high on that day.7 Last, we used a set of county indicator variables to account for local or regional effects that are time invariant, such as a county’s transportation availability or proximity to inexpensive sources of feed.
Our model was written as:
𝑦𝑦𝑖𝑖,𝑡𝑡 = 𝑋𝑋𝑖𝑖,𝑡𝑡𝛽𝛽 + 𝜀𝜀𝑖𝑖,𝑡𝑡 , 𝑖𝑖 = 1, … ,𝑁𝑁𝑡𝑡; 𝑡𝑡 = 1, … ,𝑇𝑇.
• 𝑦𝑦𝑖𝑖,𝑡𝑡 was the dependent variable in our model; namely, the logarithm of the transaction price per pound.
• 𝑋𝑋𝑖𝑖,𝑡𝑡 was the list of control variables used in the model including the sets of fixed effects for plants, counties and purchase dates.
• β was the list of parameters associated with the control variables (𝑋𝑋𝑖𝑖,𝑡𝑡).
• 𝜀𝜀𝑖𝑖,𝑡𝑡. was an error term.
Each observation in the model was a single transaction between a packing plant and a feedlot. The subscript i represented a transaction between a feedlot and a packing plant, and the subscript t represented the purchase date of that transaction. The term 𝑁𝑁𝑡𝑡 expressed the fact that the number of transactions may have varied across purchase dates.
Our results suggest that when there is a more concentrated market of buyers (packers), those packers will have more negotiating and market power, and therefore, with other factors held constant, these packers will be able to purchase fed cattle at lower prices from feeders. We found a significant negative parameter estimate for our HHI explanatory variable. This estimate suggests that for each 0.01 increase in the HHI8—meaning, a greater degree of packer concentration—there is about a 0.86 percent reduction in the price of cattle. The interquartile range for the HHI is from approximately 0.45 to 0.55, which implies an approximate price effect of 9 percent across that range. For a carcass price of about $2.22 per pound—the average for 2013 through 2015, based on the data from 7This method was used to account for varying daily market conditions by Ajewole et. al. “Price Reporting in a Thin Market.” Journal of Agriculture and Applied Economics, vol. 48, no. 4 (2016), 345-365. 8Our HHI is calculated such that it can range between zero and one.
The Model
Results
Appendix III: Econometric Model to Estimate the Impact of Market Power on Fed Cattle Transaction Prices
Page 48 GAO-18-296 Structure of U.S. Cattle Markets
P&SP—that translates to a difference of about 20 cents per pound variation across this HHI range.
The variables used in the model to control for effects other than HHI had the expected directional effect on price or else were not significant. Parameter estimates for the indicator variables for beef quality and yield were both significant and positive, suggesting that fed cattle with higher beef quality grade and yield levels have a higher price. The indicator variables for the lots with weights of less than 1,050 pounds average weight suggest that lots with very low weight received lower prices. However, the variable for lots with more than 1,500 pounds was not significant. The feedlot size variable was not statistically significant. Our controls for the percent of Holsteins and ungraded cattle in the lot were both negative and statistically significant, as expected. The percent of cows in the lot was not statistically significant. Finally, our measure of feedlot size was positive and statistically significant, suggesting that larger feedlots may be able to obtain higher prices from packers.
Our results suggest that instrumenting the HHI variable was appropriate. We used a measure of the proportion of total fed cattle traded by the packer using non-cash transaction methods as an instrument.9 Our results satisfied the essential specification tests for appropriate use of instruments:
• The endogeneity tests rejected the null hypothesis that the endogenous variable (HHI) can be treated as exogenous. Thus it is appropriate to instrument the HHI variable.
• Our results rejected the null hypothesis of weak instruments—Sanderson-Windmeijer, Stock-Wright and Anderson-Rubin. The F-Statistic from the first stage of the regression (20.36) is highly significant and exceeded the critical Stock-Yogo value for the 10 percent maximal instrumental variable size (16.38). Thus the instruments had sufficient explanatory power in the first-stage regression equation.
See Table 1 for a more detailed description of our results.
9This measure was calculated using a 7-day moving window; that is, using data from the date of the transaction and the 6 days prior to the trade. Non-cash transaction methods include formula contract, forward contract, and negotiated grid transactions.
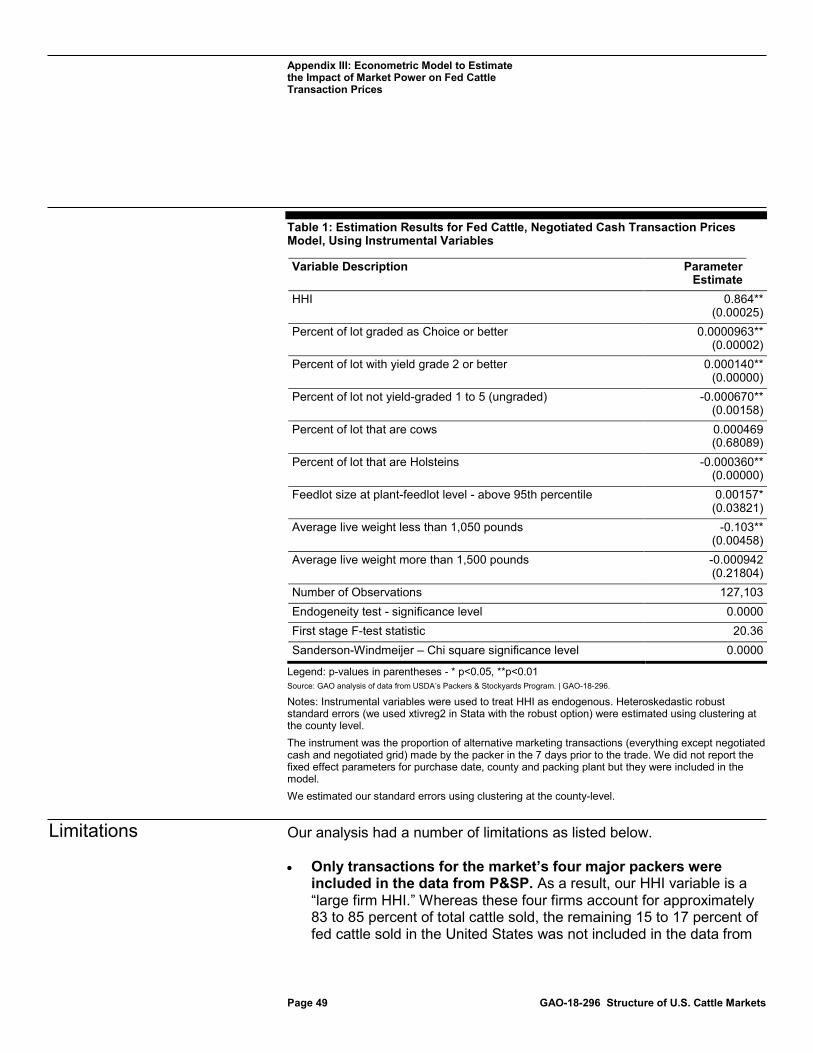
Appendix III: Econometric Model to Estimate the Impact of Market Power on Fed Cattle Transaction Prices
Page 49 GAO-18-296 Structure of U.S. Cattle Markets
Table 1: Estimation Results for Fed Cattle, Negotiated Cash Transaction Prices Model, Using Instrumental Variables
Variable Description Parameter Estimate
HHI 0.864** (0.00025)
Percent of lot graded as Choice or better 0.0000963** (0.00002)
Percent of lot with yield grade 2 or better 0.000140** (0.00000)
Percent of lot not yield-graded 1 to 5 (ungraded) -0.000670** (0.00158)
Percent of lot that are cows 0.000469 (0.68089)
Percent of lot that are Holsteins -0.000360** (0.00000)
Feedlot size at plant-feedlot level - above 95th percentile 0.00157* (0.03821)
Average live weight less than 1,050 pounds -0.103** (0.00458)
Average live weight more than 1,500 pounds -0.000942 (0.21804)
Number of Observations 127,103 Endogeneity test - significance level 0.0000 First stage F-test statistic 20.36 Sanderson-Windmeijer – Chi square significance level 0.0000
Legend: p-values in parentheses - * p<0.05, **p<0.01 Source: GAO analysis of data from USDA’s Packers & Stockyards Program. | GAO-18-296.
Notes: Instrumental variables were used to treat HHI as endogenous. Heteroskedastic robust standard errors (we used xtivreg2 in Stata with the robust option) were estimated using clustering at the county level. The instrument was the proportion of alternative marketing transactions (everything except negotiated cash and negotiated grid) made by the packer in the 7 days prior to the trade. We did not report the fixed effect parameters for purchase date, county and packing plant but they were included in the model. We estimated our standard errors using clustering at the county-level.
Our analysis had a number of limitations as listed below.
• Only transactions for the market’s four major packers were included in the data from P&SP. As a result, our HHI variable is a “large firm HHI.” Whereas these four firms account for approximately 83 to 85 percent of total cattle sold, the remaining 15 to 17 percent of fed cattle sold in the United States was not included in the data from
Limitations
Appendix III: Econometric Model to Estimate the Impact of Market Power on Fed Cattle Transaction Prices
Page 50 GAO-18-296 Structure of U.S. Cattle Markets
P&SP. In addition, we did not use some of the four large packers’ plant-level data because the data was missing key variables, such as the purchase date. Therefore, our estimates of HHI in any location are likely to be overestimates, and in general, our HHI estimates for any location should be viewed only as relative to other locations in this analysis and should not be compared with measures in other studies or industries.
• The feedlot location may not be in the city listed for it. In some cases, the feedlot city that is named in the data from P&SP as the location of the feedlot is not the exact feedlot location. The feedlot may be somewhat outside the city or at a headquarters location.
• Feedlot concentration differs across counties. The analysis reflects the fact that, on average, in any given area, feedlots are far more numerous and packing plants are relatively few in number. However, this is not generalizable to all areas. Although there are a relatively large number of feedlots in the United States in general, in some cases, it is possible that a relatively small number of feedlots account for a relatively large proportion of cattle sold to some packing plants. Our data could only identify a feedlot that sold cattle to a particular packing plant, so we could not identify which feedlots might have sold fed cattle to multiple plants. We control for this in the regression model in part by including an indicator variable for packing plants’ transactions that were with a large feedlot (in the 95th percentile for that particular packing plant).
• HHI calculations must use a geographic definition. In our analysis, we include fixed effects for each packing plant as well as fixed effects for each county, which controls for variations in market conditions in different areas that are constant over time. The calculation of the HHI takes into account transactions flowing from different counties to the same packing plants and from a single county to different packing plants, so the HHI calculations by necessity must use some geographic definition. However, our HHI calculation does not depend upon a county to define a market, but simply measures market concentration conditions that the feedlots in that county face.
• The level of detail and scope in the data varied across the different packing plants in our data set. For example, a detailed breakdown of the type of cattle was not available on a consistent basis across all packers and packing plants. Therefore, we were unable to control for some variation in quality and type of cattle in our model. However, this may be mitigated by our use of fixed effects if certain transaction characteristics—for instance, the type or breed of cattle sold—are fairly constant over time in a given county or plant.

Appendix III: Econometric Model to Estimate the Impact of Market Power on Fed Cattle Transaction Prices
Page 51 GAO-18-296 Structure of U.S. Cattle Markets
• As in any model, there is the possibility of misspecification or bias. We used various econometric tests for our instrumental variables estimation (two-stage least-squares): endogeneity of the HHI measure, J-statistic for identification, and weak instrument tests. However, in any instrumental model there is a possibility that the instruments are inappropriate or the estimators are biased, and that bias may be exacerbated in the presence of outliers.10 Sargan recommends a simple procedure for assessing the efficacy of two-stage least-squares versus ordinary least squares. Our results using this criterion suggests our use of two-stage least squares is justified.11
• Packing plants from the same company likely did not compete with one another. Our HHI measure was calculated treating each packing plant as a separate entity rather than at the packing company level, despite the fact that multiple plants are owned by each of the four major packing companies. Therefore, we assumed that packing plants “compete” to some extent regardless of whether they are owned by the same company. However, in the data we used for our model, there were no plants owned by the same packing company in the same city.
• There may be noise in the data. The data were administrative data and may have random noise associated with issues such as different administrative procedures of a plant, affecting when and how the data are entered. We cleaned the data to remove observations that appeared unreasonable or not easily explained, but some variation in prices remains. Specifically, in the data that was used in our model, the median intra-day price variation was about 18 percent for the 1st to 99th percentile and about 11 percent for the 5th to the 95th percentile.
10Alwyn Young, “Consistency without Inference: Instrumental Variables in Practical Application.” London School of Economics working paper, November 2017. 11J.D. Sargan “The Estimation of Economic Relationships Using Instrumental Variables.” Econometrica, vol 26, (1958), 393-415.
Appendix IV: Recognized Experts That We Interviewed
Page 52 GAO-18-296 Structure of U.S. Cattle Markets
Randy Blach President and CEO, CattleFax
Don Close Senior Analyst, Rabobank
Brian Coffey Assistant Professor, Department of Agricultural Economics, Kansas State University
John M. Crespi Professor, Department of Economics, Iowa State University
Philip Garcia Professor, Department of Agricultural and Consumer Economics, University of Illinois
Joel Greene Analyst in Agricultural Policy, Congressional Research Service
Steve Kay Editor and Publisher, Cattle Buyers Weekly
Stephen Koontz Professor, Agricultural & Resource Economics, Colorado State University
James MacDonald Structure, Technology and Productivity Branch Chief, Economic Research Service, United States Department of Agriculture
Derrell Peel Breedlove Professor of Agribusiness, Department of Agricultural Economics, Oklahoma State University
James Robb Director, Livestock Marketing Information Center
Tina Saitone Cooperative Extension Specialist, Livestock and Rangeland Economics, Department of Agricultural and Resource Economics, University of California at Davis
Appendix IV: Recognized Experts That We Interviewed
Appendix IV: Recognized Experts That We Interviewed
Page 53 GAO-18-296 Structure of U.S. Cattle Markets
Ted Schroeder University Distinguished Professor, Department of Agricultural Economics, Kansas State University
Richard Sexton Professor, Department of Agricultural and Resource Economics, University of California at Davis
Lee Schulz Assistant Professor, Department of Economics, Iowa State University
Kyle Stiegert Professor, Agricultural and Applied Economics, University of Wisconsin at Madison
C. Robert Taylor Professor Emeritus, Agricultural Economics and Rural Sociology, Auburn University

Appendix V: Comments from the U.S. Department of Agriculture
Page 54 GAO-18-296 Structure of U.S. Cattle Markets
Appendix V: Comments from the U.S. Department of Agriculture

Appendix V: Comments from the U.S. Department of Agriculture
Page 55 GAO-18-296 Structure of U.S. Cattle Markets

Appendix VI: GAO Contacts and Staff Acknowledgments
Page 56 GAO-18-296 Structure of U.S. Cattle Markets
Steve D. Morris, (202) 512-3841 or [email protected] Oliver Richard, (202) 512-2700 or [email protected]
In addition to the contacts named above, Thomas Cook (Assistant Director), Michael Kendix (Assistant Director), Kevin Bray, Candace Carpenter, Tara Congdon, Jaci Evans, Dan Royer, Monica Savoy, Kiki Theodoropoulos, Richard Tsuhara, and Jarrod West made key
contributions to this report.
Appendix VI: GAO Contacts and Staff Acknowledgments
GAO Contacts
Staff Acknowledgments
Related GAO Products
Page 57 GAO-18-296 Structure of U.S. Cattle Markets
U.S. Agriculture: Retail Food Prices Grew Faster Than the Prices Farmers Received for Agricultural Commodities, but Economic Research Has Not Established That Concentration Has Affected These Trends. GAO-09-746R. Washington, D.C.: June 30, 2009.
Livestock Market Reporting: USDA Has Taken Some Steps to Ensure Quality, but Additional Efforts Are Needed. GAO-06-202. Washington, D.C.: December 9, 2005.
Economic Models of Cattle Prices: How USDA Can Act to Improve Models to Explain Cattle Prices, GAO-02-246. Washington, D.C.: March 15, 2002.
Packers and Stockyards Programs: Actions Needed to Improve Investigations of Competitive Practices, GAO/RCED-00-242. Washington, D.C.: September 21, 2000.
Beef Industry: Packer Market Concentration and Cattle Prices, GAO/RCED-91-28. Washington, D.C.: December 6, 1990.
Related GAO Products
(101092)
The Government Accountability Office, the audit, evaluation, and investigative arm of Congress, exists to support Congress in meeting its constitutional responsibilities and to help improve the performance and accountability of the federal government for the American people. GAO examines the use of public funds; evaluates federal programs and policies; and provides analyses, recommendations, and other assistance to help Congress make informed oversight, policy, and funding decisions. GAO’s commitment to good government is reflected in its core values of accountability, integrity, and reliability.
The fastest and easiest way to obtain copies of GAO documents at no cost is through GAO’s website (https://www.gao.gov). Each weekday afternoon, GAO posts on its website newly released reports, testimony, and correspondence. To have GAO e-mail you a list of newly posted products, go to https://www.gao.gov and select “E-mail Updates.”
The price of each GAO publication reflects GAO’s actual cost of production and distribution and depends on the number of pages in the publication and whether the publication is printed in color or black and white. Pricing and ordering information is posted on GAO’s website, https://www.gao.gov/ordering.htm.
Place orders by calling (202) 512-6000, toll free (866) 801-7077, or TDD (202) 512-2537.
Orders may be paid for using American Express, Discover Card, MasterCard, Visa, check, or money order. Call for additional information.
Connect with GAO on Facebook, Flickr, Twitter, and YouTube. Subscribe to our RSS Feeds or E-mail Updates. Listen to our Podcasts. Visit GAO on the web at https://www.gao.gov.
Contact:
Website: https://www.gao.gov/fraudnet/fraudnet.htm Automated answering system: (800) 424-5454 or (202) 512-7470
Orice Williams Brown, Managing Director, [email protected], (202) 512-4400, U.S. Government Accountability Office, 441 G Street NW, Room 7125, Washington, DC 20548
Chuck Young, Managing Director, [email protected], (202) 512-4800 U.S. Government Accountability Office, 441 G Street NW, Room 7149 Washington, DC 20548
James-Christian Blockwood, Managing Director, [email protected], (202) 512-4707 U.S. Government Accountability Office, 441 G Street NW, Room 7814, Washington, DC 20548
GAO’s Mission
Obtaining Copies of GAO Reports and Testimony Order by Phone
Connect with GAO
To Report Fraud, Waste, and Abuse in Federal Programs
Congressional Relations
Public Affairs
Strategic Planning and External Liaison
Please Print on Recycled Paper.