Embed Size (px)
Citation preview
GAP VIII: Eighth Communication and Public Relations Generally Accepted Practices Study (Q4 2013 data) Draft 6/12/14
Report 1: Corporate Findings
2 2 2
About the SCPRC Launched 2002
Mission: Advance the study, practice and value of the
communication/public relations function
• Serve as COM/PR Think Tank
• Conduct applied research in partnership with other like-minded
organizations
• Help bridge the academic/practitioner gap
• Inform/drive PR/COM curricula
2
3 3 3
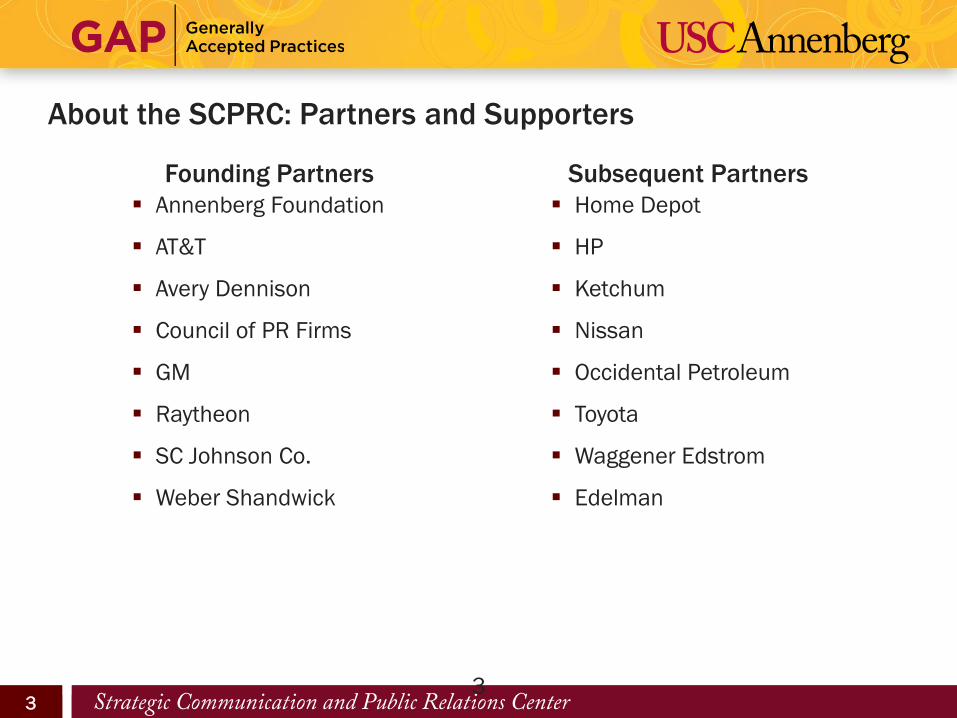
About the SCPRC: Partners and Supporters
Founding Partners
Annenberg Foundation
AT&T
Avery Dennison
Council of PR Firms
GM
Raytheon
SC Johnson Co.
Weber Shandwick
Subsequent Partners
Home Depot
HP
Ketchum
Nissan
Occidental Petroleum
Toyota
Waggener Edstrom
Edelman
3
4 4 4
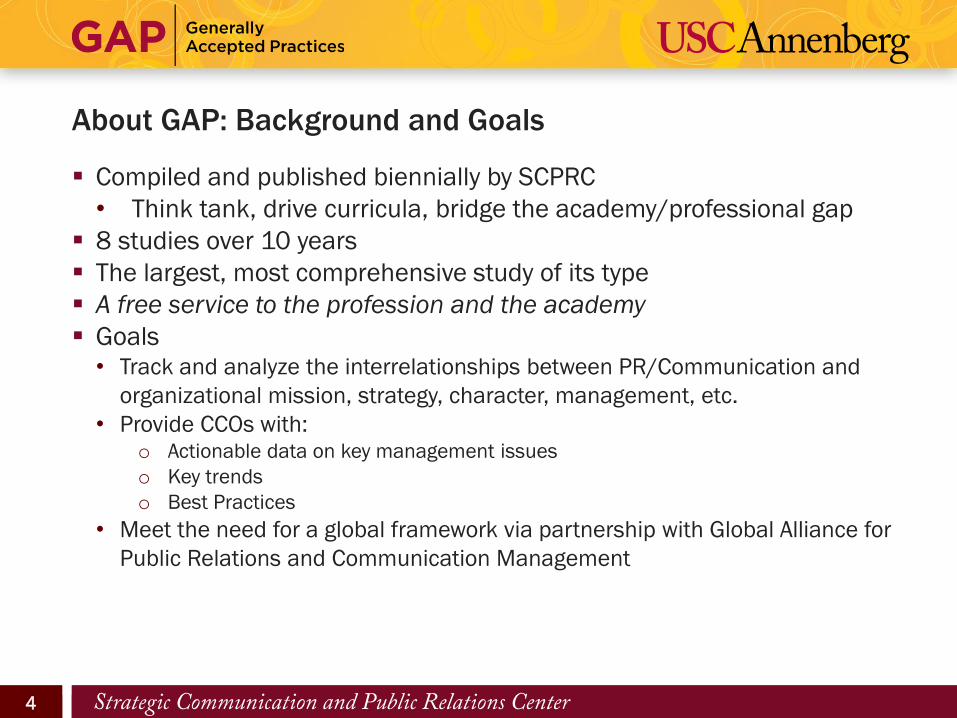
About GAP: Background and Goals
Compiled and published biennially by SCPRC
• Think tank, drive curricula, bridge the academy/professional gap
8 studies over 10 years
The largest, most comprehensive study of its type
A free service to the profession and the academy
Goals • Track and analyze the interrelationships between PR/Communication and
organizational mission, strategy, character, management, etc.
• Provide CCOs with: o Actionable data on key management issues
o Key trends
o Best Practices
• Meet the need for a global framework via partnership with Global Alliance for
Public Relations and Communication Management
5 5 5
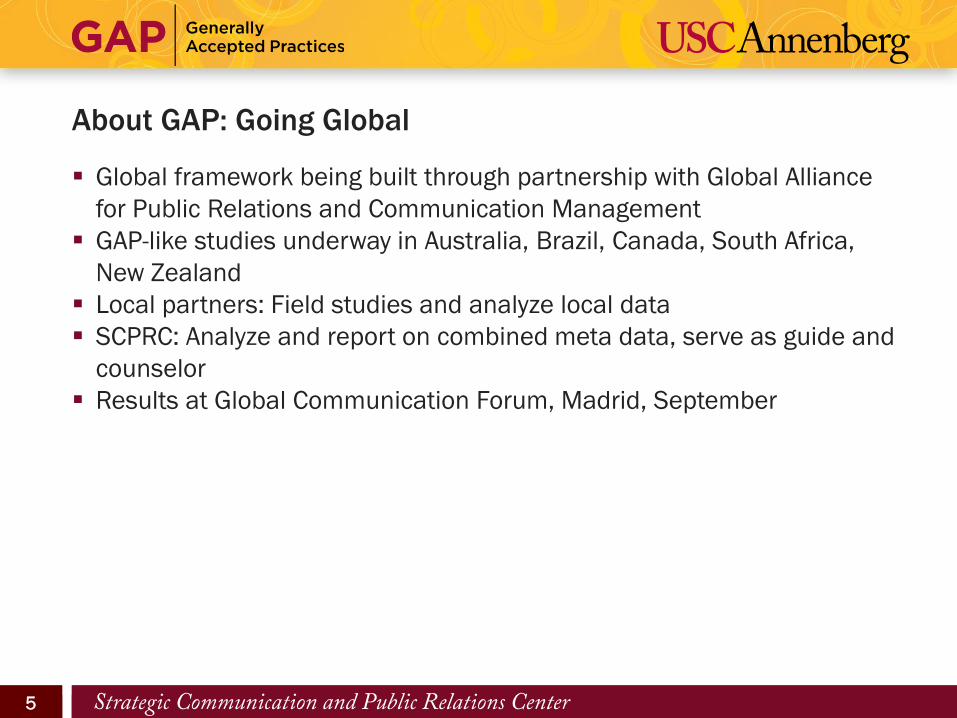
About GAP: Going Global
Global framework being built through partnership with Global Alliance
for Public Relations and Communication Management
GAP-like studies underway in Australia, Brazil, Canada, South Africa,
New Zealand
Local partners: Field studies and analyze local data
SCPRC: Analyze and report on combined meta data, serve as guide and
counselor
Results at Global Communication Forum, Madrid, September
6 6 6
GAP VIII: The Team
Jerry Swerling, M.A.
Director, PR Studies
Director SCPRC
Kjerstin Thorson, Ph.D.
Assistant Professor
Research Director SCPRC
Burghardt Tenderich, Ph.D.
Associate Professor
Associate Director SCPRC
Aimei Yang, Ph.D.
Assistant Professor
USC Annenberg School for Communication and Journalism
Zongchao (Cathy) Li
PhD in Strategic Communication (‘15) University of Miami.
Emily Gee, Emily Savastano
Masters in Strategic Public Relations
USC Annenberg (’14/’15)
In Consultation With
David Michaelson, Ph.D., Managing Director, Teneo Strategy
Forrest Anderson, MBA, Communications Research and Strategy Consultant
7 7 7 7
GAP VIII: Professional Support
GAP VIII has been supported by these leading professional organizations:
The Arthur W. Page Society, the 400+ members of which are generally the heads of communication in major U.S. organizations
Institute for Public Relations (IPR), which serves as research partner, contributing its expertise in researching the science underlying the practice of communication
International Association of Business Communicators (IABC), with its 13,000 member global network of communicators
Public Relations Society of America (PRSA) with its 21,000 members
8 8 8
GAP VIII: Sample, Methodology, Etc. More content re. role of the function in culture, values, strategy, etc.
More emphasis on large (vs. very small) organizations
Believed to be the largest and most comprehensive ongoing study of senior-
level PR/Comm practitioners in the US
Sampled from combined, multiple lists of senior-level practitioners • Each received multiple invitations to participate
• Tightly screened for status, level of responsibility, etc.
Online survey, Q4 2013; 1000+ responses; 347 qualified participants
Believed to be representative of the broad population of senior practitioners.
Note 1: Direct Y/Y comparisons may be problematic due to changes in sample.
Nonetheless, cumulative findings are generally consistent and compelling,
particularly with regard to the relationships between specific practices and
beliefs, and specific successful outcomes.
Note 2: While correlation does not prove causality consistent patterns across
multiple studies are highly compelling and should not be dismissed.
Note 3: To be deemed statistically valid, combinations of variables were tested
to achieve a strength (coefficient, or r2 ) having a degree of significance
(probability, or p) of .05 or greater.
For more information email [email protected].
9 9 9
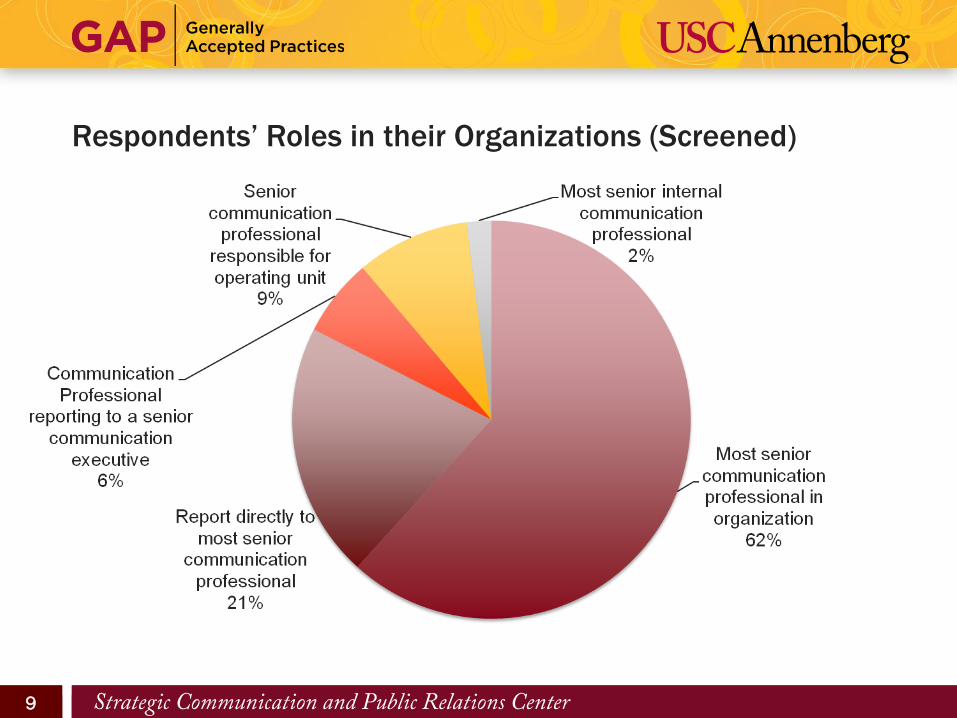
Respondents’ Roles in their Organizations (Screened)
10 10 10
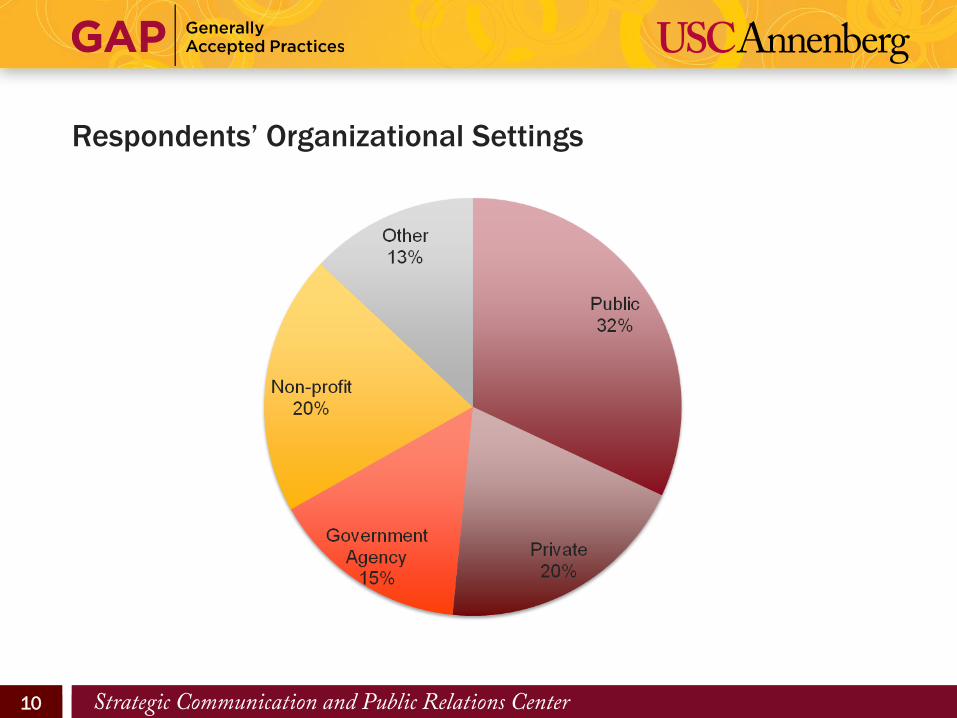
Respondents’ Organizational Settings
11 11 11 11
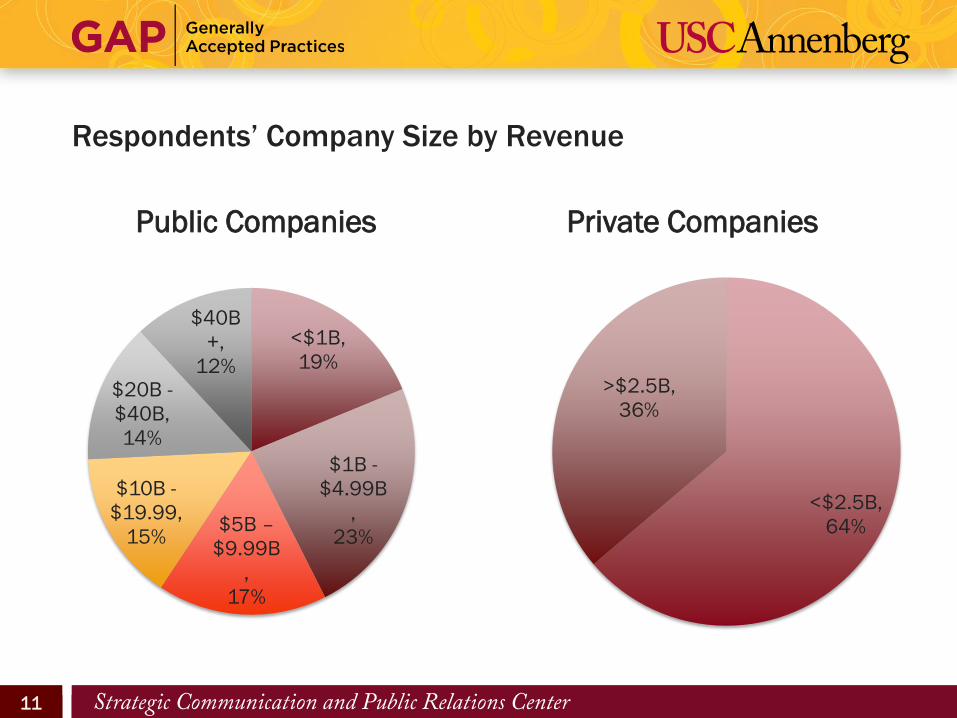
Respondents’ Company Size by Revenue
Public Companies Private Companies
<$2.5B,
64%
>$2.5B,
36%
<$1B,
19%
$1B -
$4.99B
,
23% $5B –
$9.99B
,
17%
$10B -
$19.99,
15%
$20B -
$40B,
14%
$40B
+,
12%
12 12 12
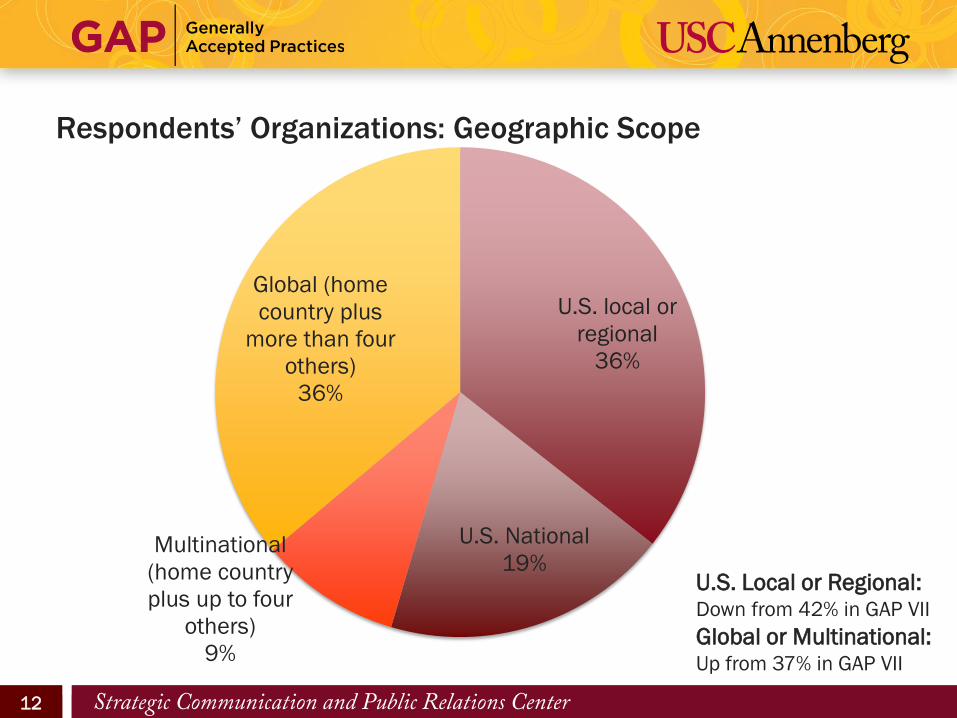
Respondents’ Organizations: Geographic Scope
U.S. local or
regional
36%
U.S. National
19% Multinational
(home country
plus up to four
others)
9%
Global (home
country plus
more than four
others)
36%
U.S. Local or Regional: Down from 42% in GAP VII
Global or Multinational: Up from 37% in GAP VII
13 13 13
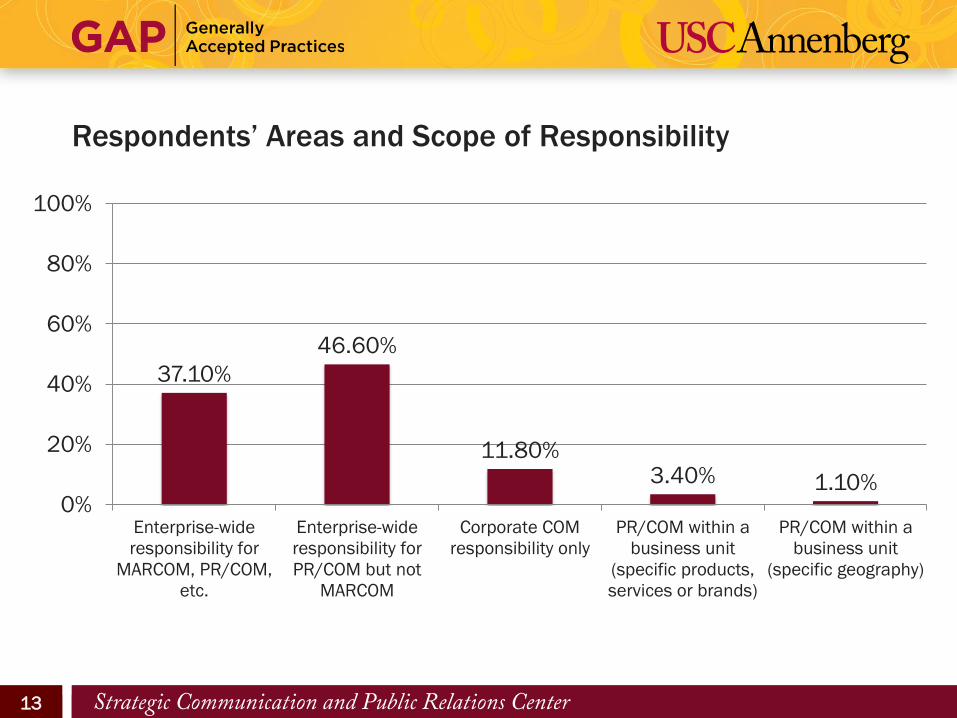
Respondents’ Areas and Scope of Responsibility
37.10%
46.60%
11.80% 3.40% 1.10%
0%
20%
40%
60%
80%
100%
Enterprise-wide
responsibility for
MARCOM, PR/COM,
etc.
Enterprise-wide
responsibility for
PR/COM but not
MARCOM
Corporate COM
responsibility only
PR/COM within a
business unit
(specific products,
services or brands)
PR/COM within a
business unit
(specific geography)
14 14 14
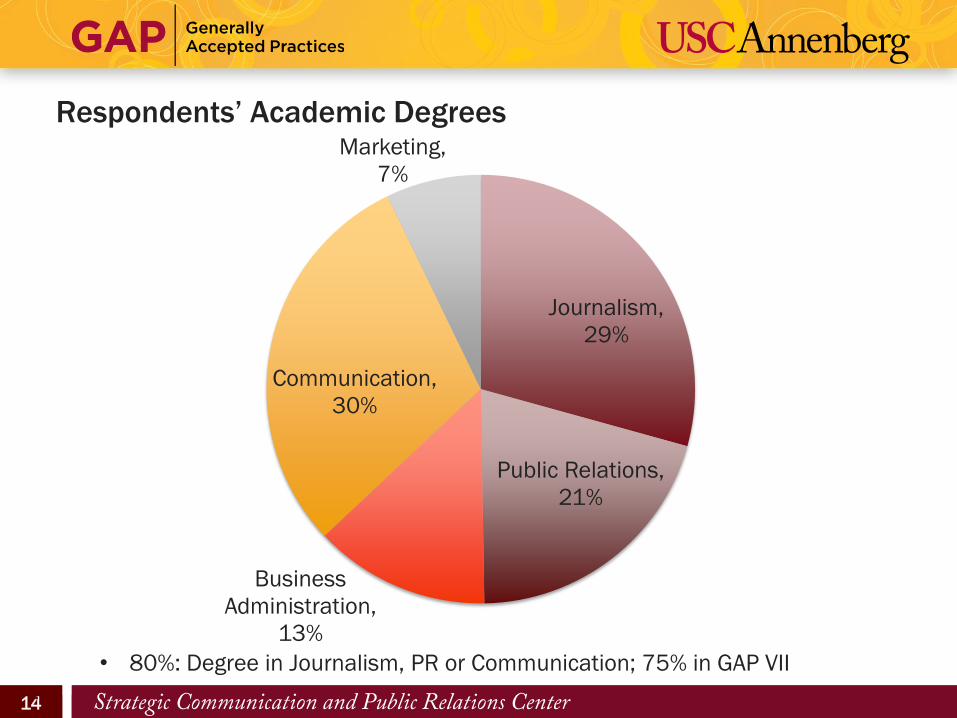
Respondents’ Academic Degrees
• 80%: Degree in Journalism, PR or Communication; 75% in GAP VII
.
Journalism,
29%
Public Relations,
21%
Business
Administration,
13%
Communication,
30%
Marketing,
7%
15 15 15
GAP VIII: Corporate Data - Topics by Section
1. Roles, Perceptions and Expectations of the COM/PR Function
2. Organizational Integration
3. Organization and Reporting
4. Budgets
5. Staffing
6. Functions and Responsibilities
7. The Media Environment
8. Measurement and Evaluation
9. Agency Relationships
10. Excellence and Best Practices
16 16 16 16
Roles, Perceptions and Expectations of the COM/PR Function
GAP VIII, Section 1
17 17 17 17
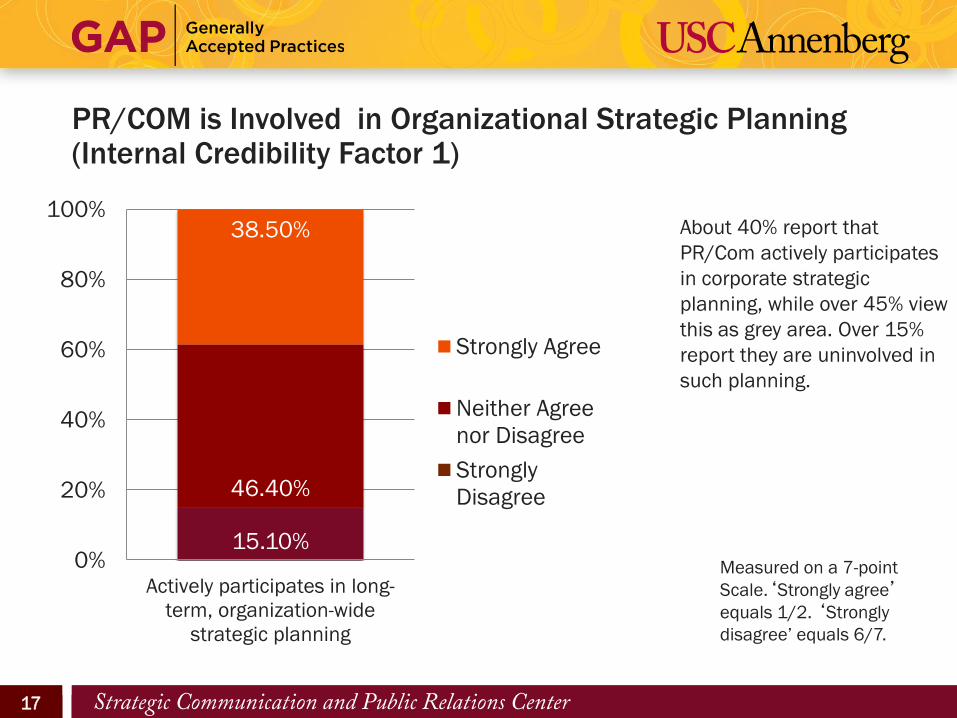
PR/COM is Involved in Organizational Strategic Planning (Internal Credibility Factor 1)
Measured on a 7-point
Scale.‘Strongly agree’
equals 1/2. ‘Strongly
disagree’ equals 6/7.
15.10%
46.40%
38.50%
0%
20%
40%
60%
80%
100%
Actively participates in long-
term, organization-wide
strategic planning
Strongly Agree
Neither Agree
nor Disagree
Strongly
Disagree
About 40% report that
PR/Com actively participates
in corporate strategic
planning, while over 45% view
this as grey area. Over 15%
report they are uninvolved in
such planning.
18 18 18
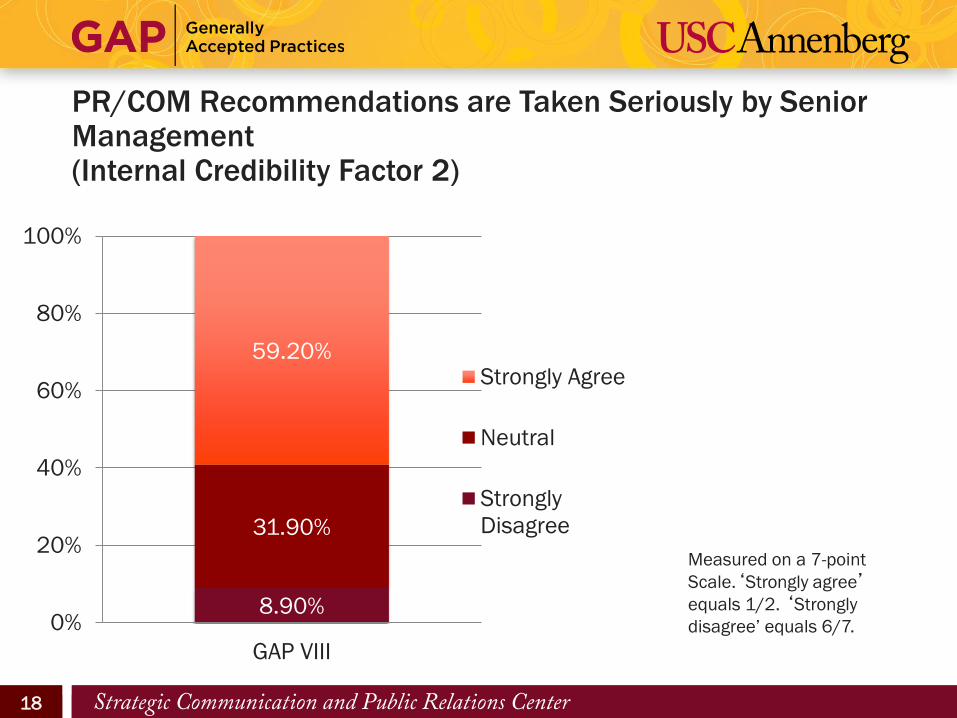
PR/COM Recommendations are Taken Seriously by Senior Management (Internal Credibility Factor 2)
8.90%
31.90%
59.20%
0%
20%
40%
60%
80%
100%
GAP VIII
Strongly Agree
Neutral
Strongly
Disagree
Measured on a 7-point
Scale.‘Strongly agree’
equals 1/2. ‘Strongly
disagree’ equals 6/7.
19 19 19
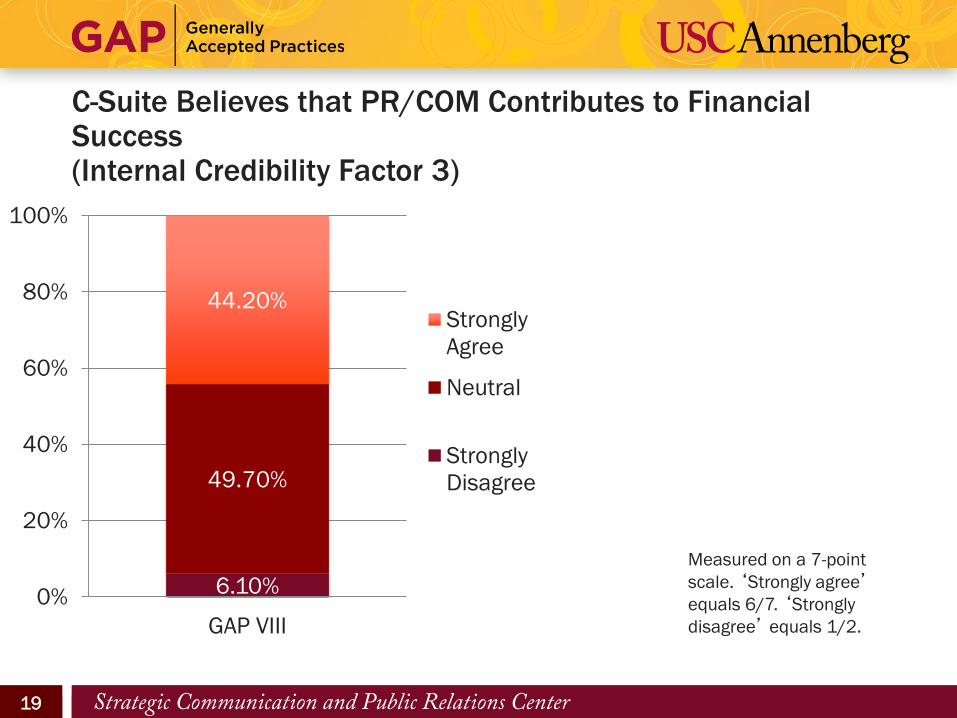
C-Suite Believes that PR/COM Contributes to Financial Success (Internal Credibility Factor 3)
Measured on a 7-point
scale. ‘Strongly agree’
equals 6/7. ‘Strongly
disagree’ equals 1/2.
6.10%
49.70%
44.20%
0%
20%
40%
60%
80%
100%
GAP VIII
Strongly
Agree
Neutral
Strongly
Disagree
20 20 20
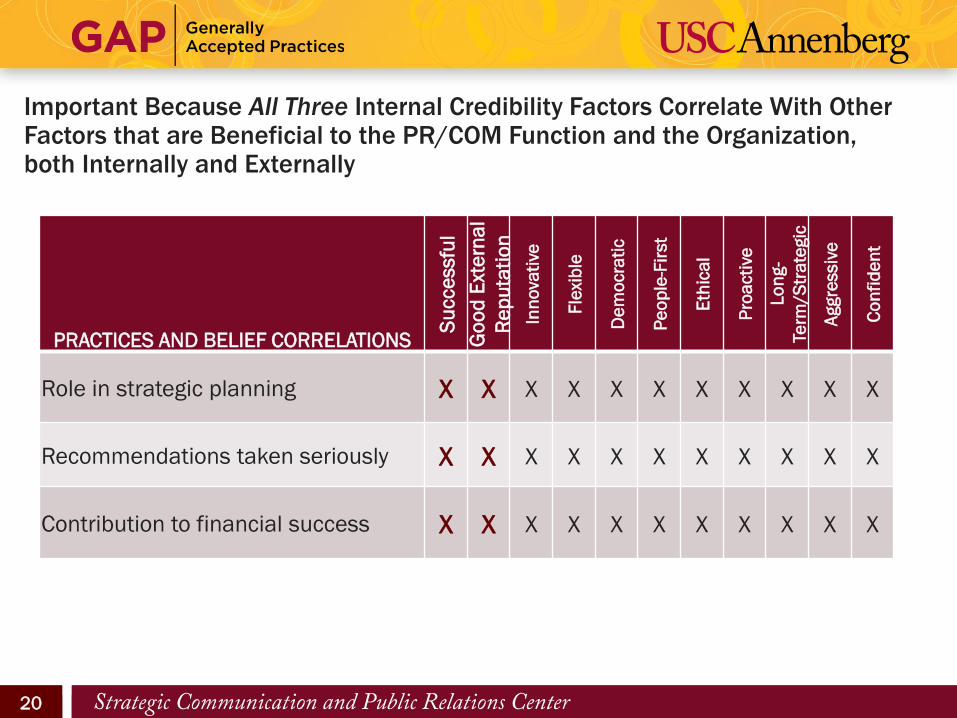
Important Because All Three Internal Credibility Factors Correlate With Other Factors that are Beneficial to the PR/COM Function and the Organization, both Internally and Externally
PRACTICES AND BELIEF CORRELATIONS
Su
cce
ssfu
l
Go
od
Ext
ern
al
Re
pu
tati
on
Inn
ova
tive
Fle
xib
le
De
mo
cra
tic
Pe
op
le-F
irst
Eth
ica
l
Pro
acti
ve
Lo
ng-
Term
/S
tra
tegic
Aggre
ssiv
e
Co
nfi
de
nt
Role in strategic planning X X X X X X X X X X X
Recommendations taken seriously X X X X X X X X X X X
Contribution to financial success X X X X X X X X X X X
21 21 21
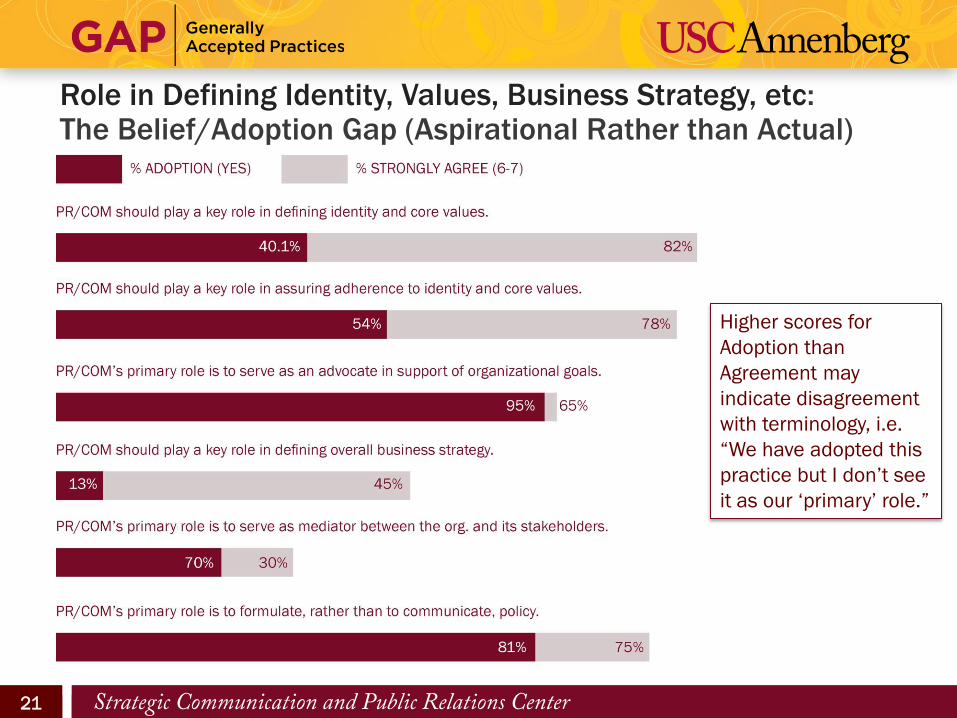
Role in Defining Identity, Values, Business Strategy, etc: The Belief/Adoption Gap (Aspirational Rather than Actual)
Higher scores for
Adoption than
Agreement may
indicate disagreement
with terminology, i.e.
“We have adopted this
practice but I don’t see
it as our ‘primary’ role.”
22 22 22
PRACTICES AND BELIEFS
CORRELATIONS
Me
an
(1
- 7
)
% S
tro
ngly
Agre
e
% A
do
pti
on
Su
cce
ssfu
l
Go
od
Ext
ern
al
Re
pu
tati
on
Inn
ova
tive
Fle
xib
le
De
mo
cra
tic
Pe
op
le-F
irst
Eth
ica
l
Pro
acti
ve
Lo
ng--Te
rm
Str
ate
gic
Aggre
ssiv
e
Co
nfi
de
nt
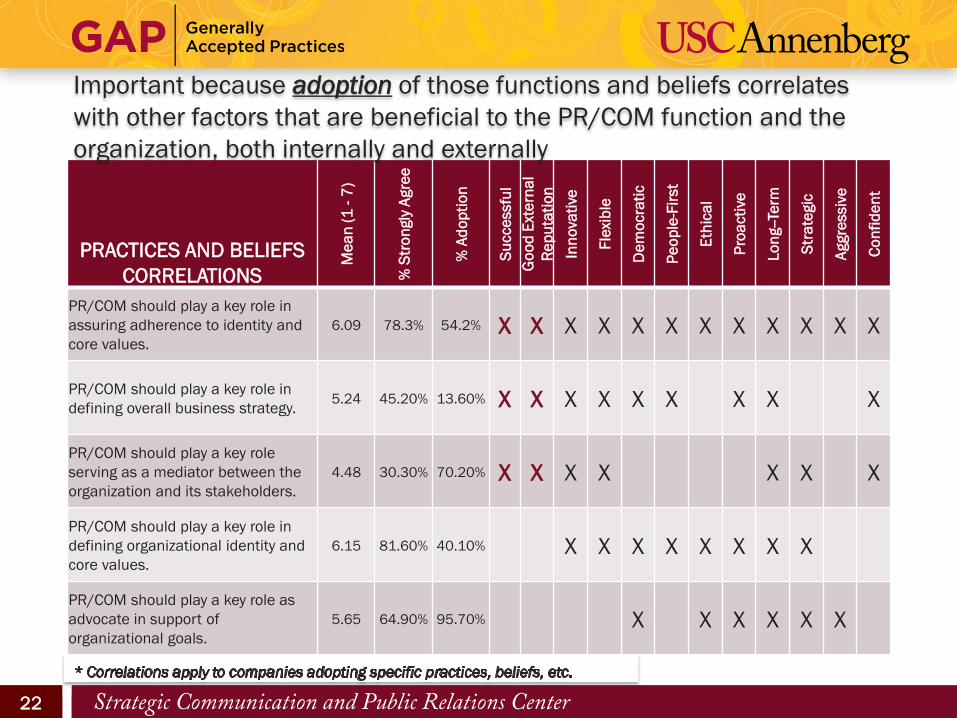
PR/COM should play a key role in
assuring adherence to identity and
core values.
6.09 78.3% 54.2% X X X X X X X X X X X X
PR/COM should play a key role in
defining overall business strategy. 5.24 45.20% 13.60% X X X X X X X X X
PR/COM should play a key role
serving as a mediator between the
organization and its stakeholders.
4.48 30.30% 70.20% X X X X X X X
PR/COM should play a key role in
defining organizational identity and
core values.
6.15 81.60% 40.10% X X X X X X X X
PR/COM should play a key role as
advocate in support of
organizational goals.
5.65 64.90% 95.70% X X X X X X
Important because adoption of those functions and beliefs correlates
with other factors that are beneficial to the PR/COM function and the
organization, both internally and externally
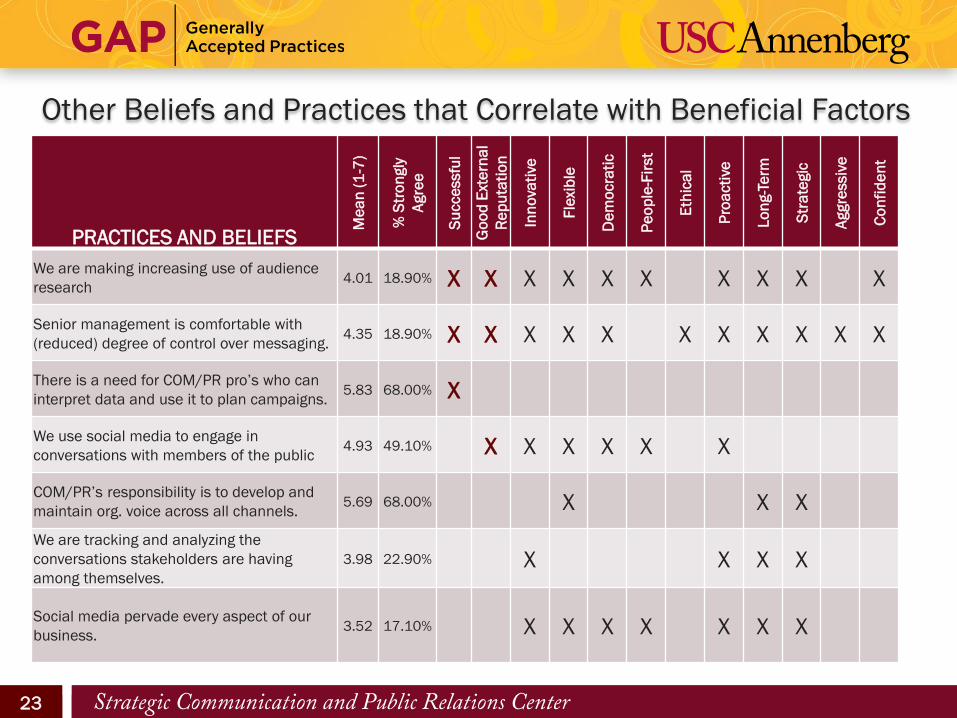
23 23 23
PRACTICES AND BELIEFS
Me
an
(1
-7)
% S
tro
ngly
Agre
e
Su
cce
ssfu
l
Go
od
Ext
ern
al
Re
pu
tati
on
Inn
ova
tive
Fle
xib
le
De
mo
cra
tic
Pe
op
le-F
irst
Eth
ica
l
Pro
acti
ve
Lo
ng-T
erm
Str
ate
gic
Aggre
ssiv
e
Co
nfi
de
nt
We are making increasing use of audience
research 4.01 18.90% X X X X X X X X X X
Senior management is comfortable with
(reduced) degree of control over messaging. 4.35 18.90% X X X X X X X X X X X
There is a need for COM/PR pro’s who can
interpret data and use it to plan campaigns. 5.83 68.00% X
We use social media to engage in
conversations with members of the public 4.93 49.10% X X X X X X
COM/PR’s responsibility is to develop and
maintain org. voice across all channels. 5.69 68.00% X X X
We are tracking and analyzing the
conversations stakeholders are having
among themselves.
3.98 22.90% X X X X
Social media pervade every aspect of our
business. 3.52 17.10% X X X X X X X
Other Beliefs and Practices that Correlate with Beneficial Factors
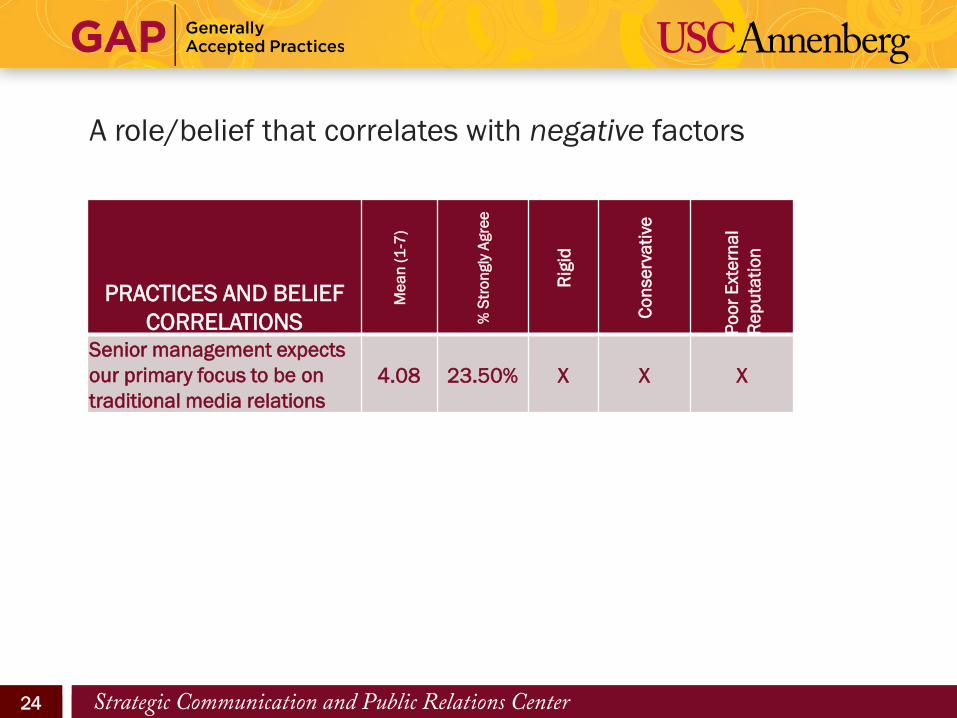
24 24 24
PRACTICES AND BELIEF
CORRELATIONS
Me
an
(1
-7)
% S
tro
ngly
Agre
e
Rig
id
Co
nse
rva
tive
Po
or
Ext
ern
al
Re
pu
tati
on
Senior management expects
our primary focus to be on
traditional media relations
4.08 23.50% X X X
A role/belief that correlates with negative factors
25 25 25 25
Organizational Integration and Coordination
GAP VIII, Section 2
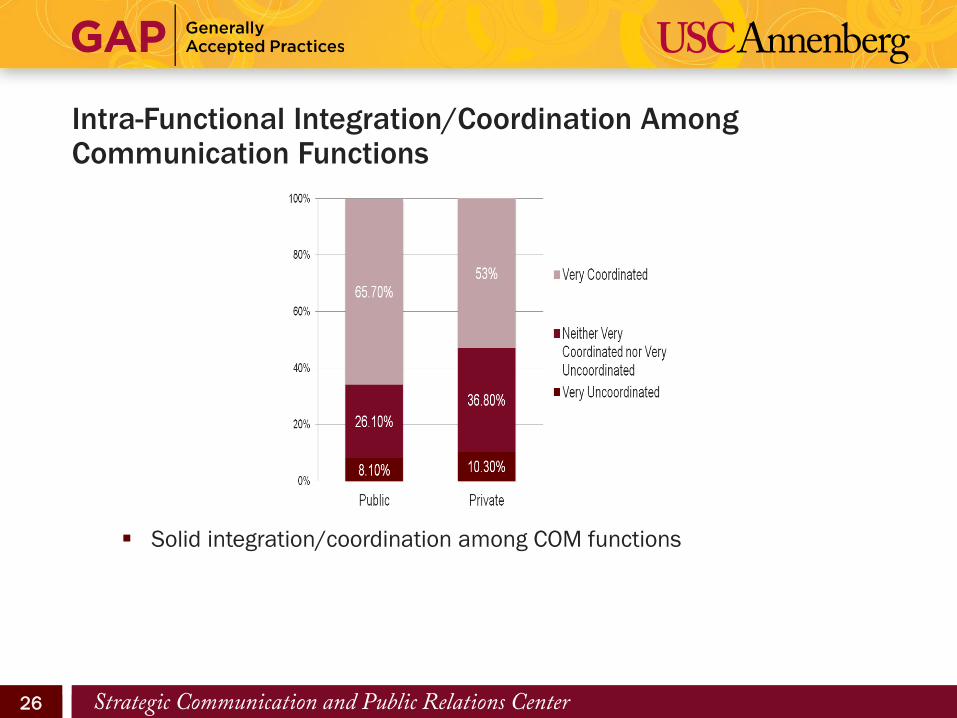
26 26 26
Intra-Functional Integration/Coordination Among Communication Functions
Solid integration/coordination among COM functions
27 27 27
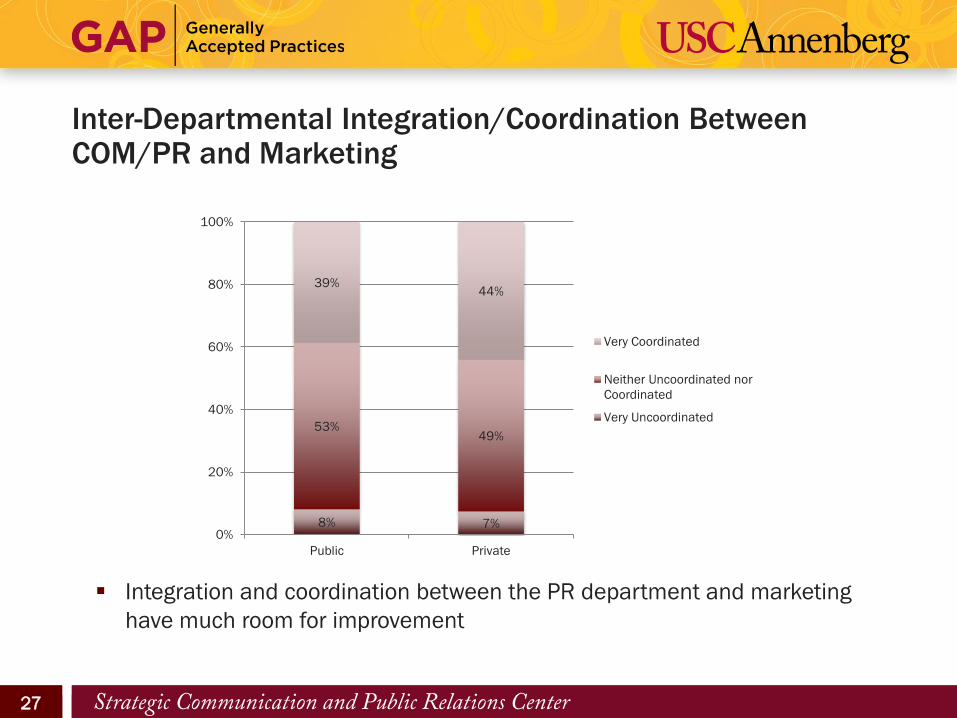
Inter-Departmental Integration/Coordination Between COM/PR and Marketing
8% 7%
53% 49%
39% 44%
0%
20%
40%
60%
80%
100%
Public Private
Very Coordinated
Neither Uncoordinated nor
Coordinated
Very Uncoordinated
Integration and coordination between the PR department and marketing
have much room for improvement
28 28 28
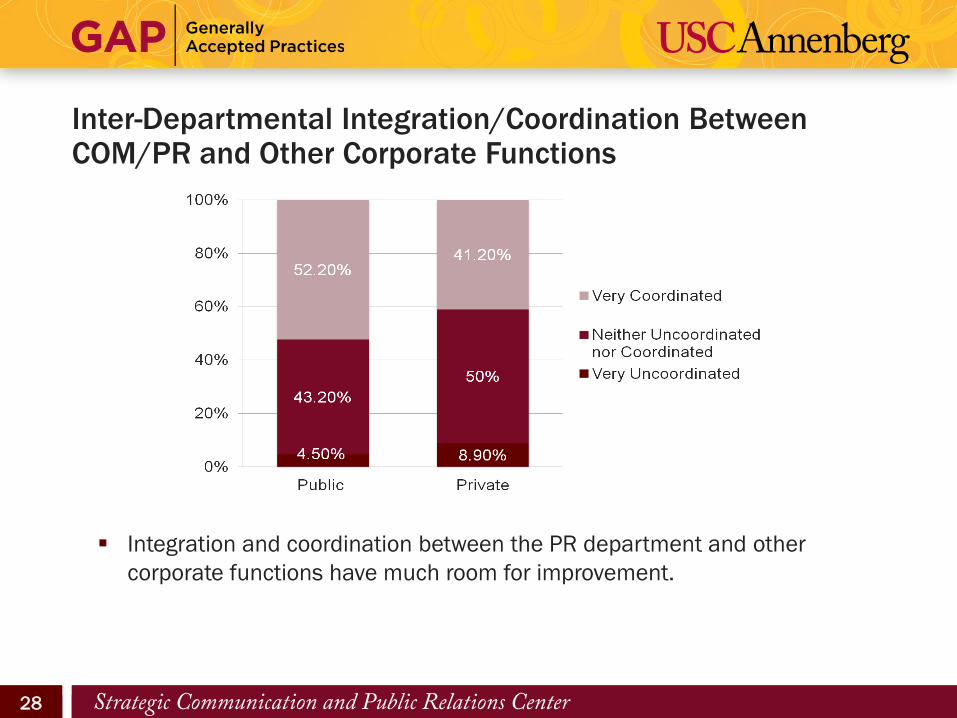
Inter-Departmental Integration/Coordination Between COM/PR and Other Corporate Functions
Integration and coordination between the PR department and other
corporate functions have much room for improvement.
29 29 29
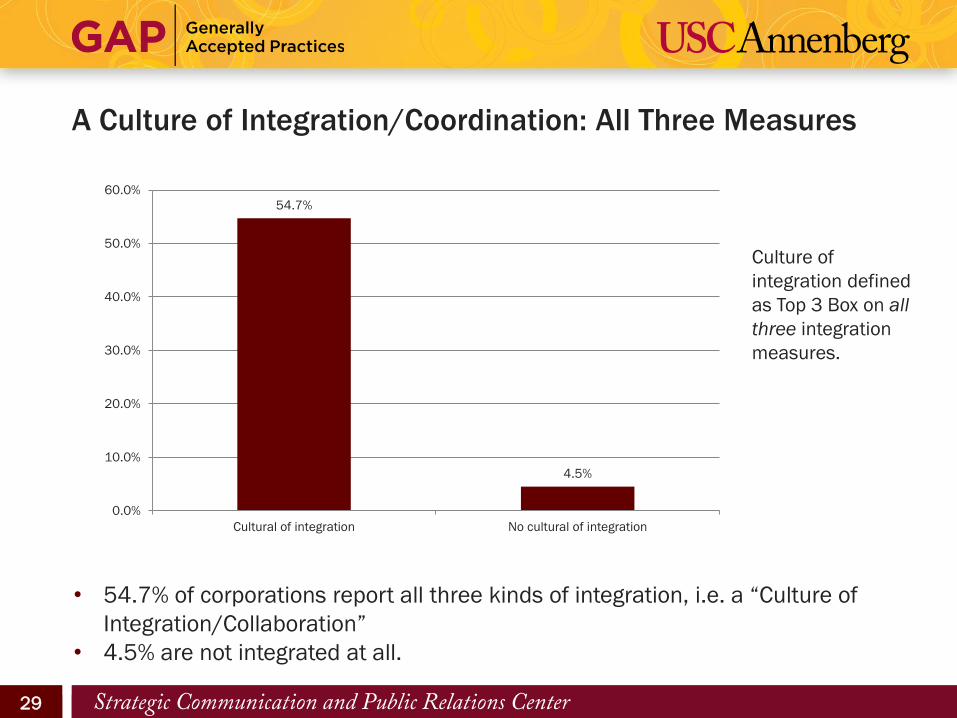
A Culture of Integration/Coordination: All Three Measures
• 54.7% of corporations report all three kinds of integration, i.e. a “Culture of
Integration/Collaboration”
• 4.5% are not integrated at all.
Culture of
integration defined
as Top 3 Box on all
three integration
measures.
54.7%
4.5%
0.0%
10.0%
20.0%
30.0%
40.0%
50.0%
60.0%
Cultural of integration No cultural of integration
30 30 30
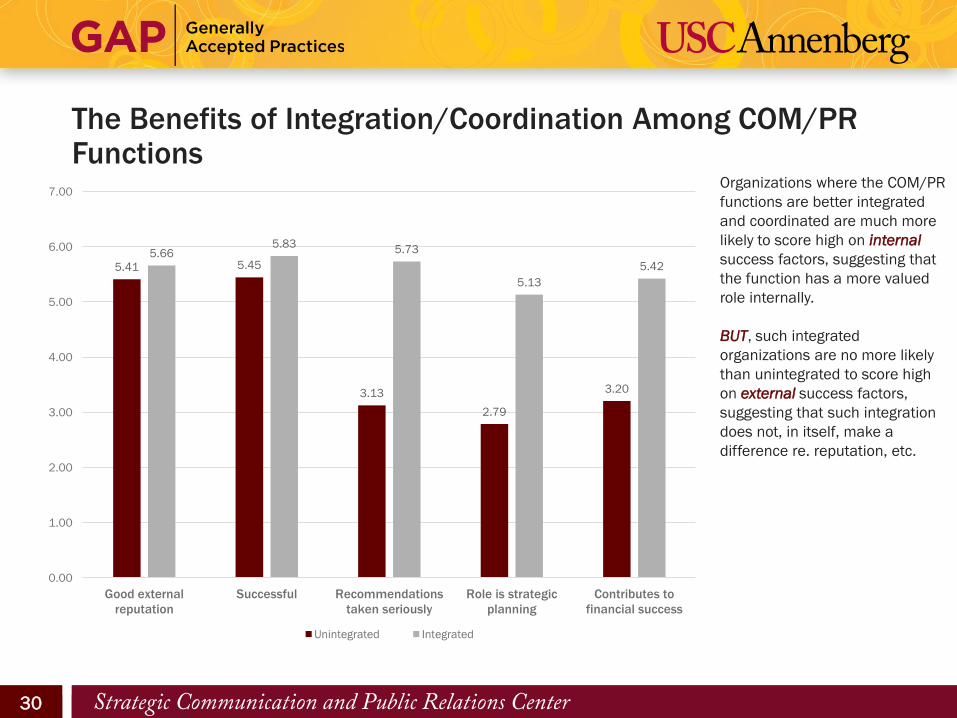
The Benefits of Integration/Coordination Among COM/PR Functions
Organizations where the COM/PR
functions are better integrated
and coordinated are much more
likely to score high on internal
success factors, suggesting that
the function has a more valued
role internally.
BUT, such integrated
organizations are no more likely
than unintegrated to score high
on external success factors,
suggesting that such integration
does not, in itself, make a
difference re. reputation, etc.
5.41 5.45
3.13
2.79
3.20
5.66 5.83
5.73
5.13
5.42
0.00
1.00
2.00
3.00
4.00
5.00
6.00
7.00
Good external
reputation
Successful Recommendations
taken seriously
Role is strategic
planning
Contributes to
financial success
Unintegrated Integrated
31 31 31
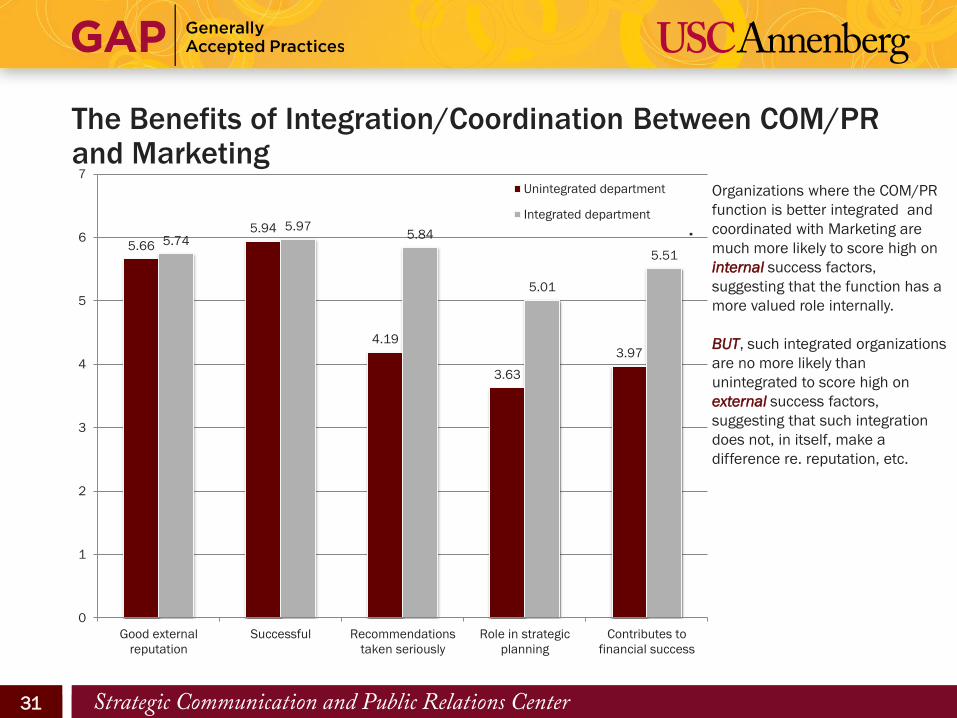
The Benefits of Integration/Coordination Between COM/PR and Marketing
.
Organizations where the COM/PR
function is better integrated and
coordinated with Marketing are
much more likely to score high on
internal success factors,
suggesting that the function has a
more valued role internally.
BUT, such integrated organizations
are no more likely than
unintegrated to score high on
external success factors,
suggesting that such integration
does not, in itself, make a
difference re. reputation, etc.
5.66
5.94
4.19
3.63
3.97
5.74 5.97
5.84
5.01
5.51
0
1
2
3
4
5
6
7
Good external
reputation
Successful Recommendations
taken seriously
Role in strategic
planning
Contributes to
financial success
Unintegrated department
Integrated department
32 32 32
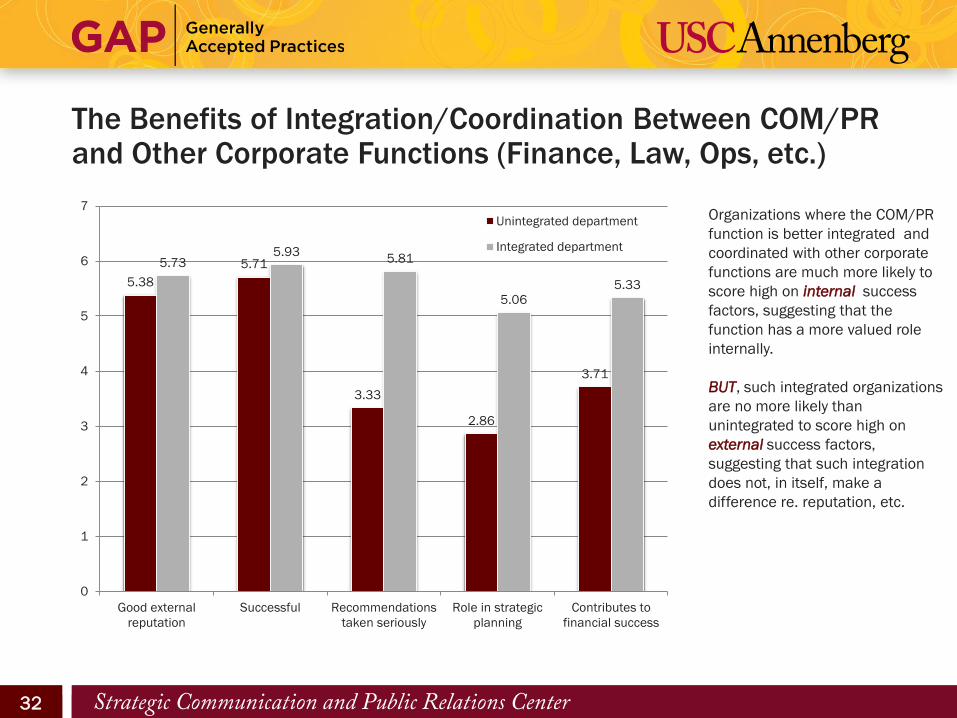
The Benefits of Integration/Coordination Between COM/PR and Other Corporate Functions (Finance, Law, Ops, etc.)
Organizations where the COM/PR
function is better integrated and
coordinated with other corporate
functions are much more likely to
score high on internal success
factors, suggesting that the
function has a more valued role
internally.
BUT, such integrated organizations
are no more likely than
unintegrated to score high on
external success factors,
suggesting that such integration
does not, in itself, make a
difference re. reputation, etc.
5.38
5.71
3.33
2.86
3.71
5.73 5.93
5.81
5.06
5.33
0
1
2
3
4
5
6
7
Good external
reputation
Successful Recommendations
taken seriously
Role in strategic
planning
Contributes to
financial success
Unintegrated department
Integrated department
33 33 33
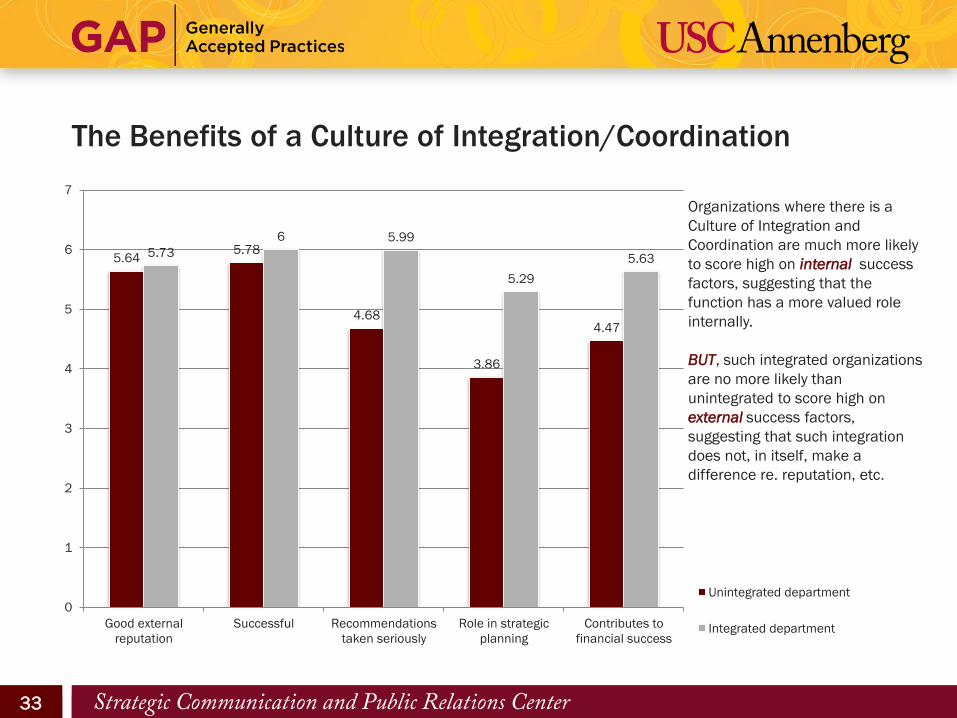
The Benefits of a Culture of Integration/Coordination
Organizations where there is a
Culture of Integration and
Coordination are much more likely
to score high on internal success
factors, suggesting that the
function has a more valued role
internally.
BUT, such integrated organizations
are no more likely than
unintegrated to score high on
external success factors,
suggesting that such integration
does not, in itself, make a
difference re. reputation, etc.
5.64 5.78
4.68
3.86
4.47
5.73
6 5.99
5.29
5.63
0
1
2
3
4
5
6
7
Good external
reputation
Successful Recommendations
taken seriously
Role in strategic
planning
Contributes to
financial success
Unintegrated department
Integrated department
34 34 34
DATA BEG THIS QUESTION:
• Why are all forms of collaboration associated with three powerful internal success factors, but no more likely to be associated with important external success factors (e.g. good external reputation)?
WHEN CONSIDERING THE ANSWER REMEMBER THIS:
• Per the following slide, all three internal success factors associated with greater internal collaboration are themselves associated with multiple internal AND EXTERNAL success factors.
35 35 35
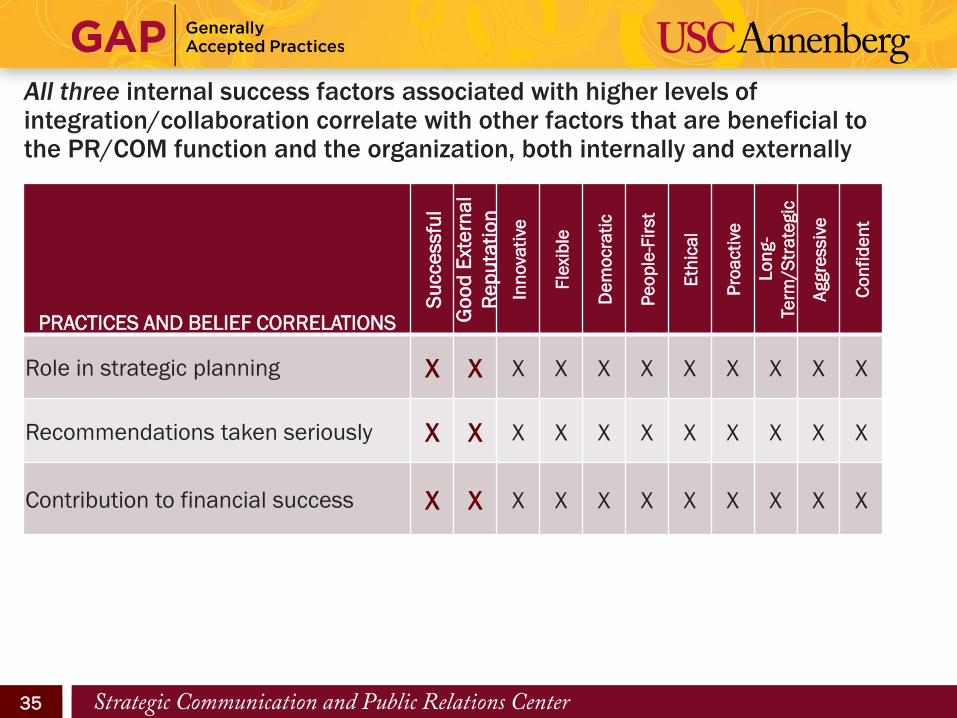
All three internal success factors associated with higher levels of integration/collaboration correlate with other factors that are beneficial to the PR/COM function and the organization, both internally and externally
PRACTICES AND BELIEF CORRELATIONS
Su
cce
ssfu
l
Go
od
Ext
ern
al
Re
pu
tati
on
Inn
ova
tive
Fle
xib
le
De
mo
cra
tic
Pe
op
le-F
irst
Eth
ica
l
Pro
acti
ve
Lo
ng-
Term
/S
tra
tegic
Aggre
ssiv
e
Co
nfi
de
nt
Role in strategic planning X X X X X X X X X X X
Recommendations taken seriously X X X X X X X X X X X
Contribution to financial success X X X X X X X X X X X
36 36 36
HYPOTHESIS: A Process for Optimizing the CCO Role and the Communication Function
• In many organizations, championing coordination/collaboration (i.e.
fostering a culture of integration/collaboration) is an effective strategy
for creating an internal environment in which the PR/COM function can
be optimized...
• Such optimization can lead to an enhanced role in organizational
planning, internal credibility for the function, etc…
• That enhanced role leads to greater influence on external factors such
as Success, External Reputation, etc.
37 37 37 37
Organization and Reporting
GAP VIII, Section 3
38 38 38
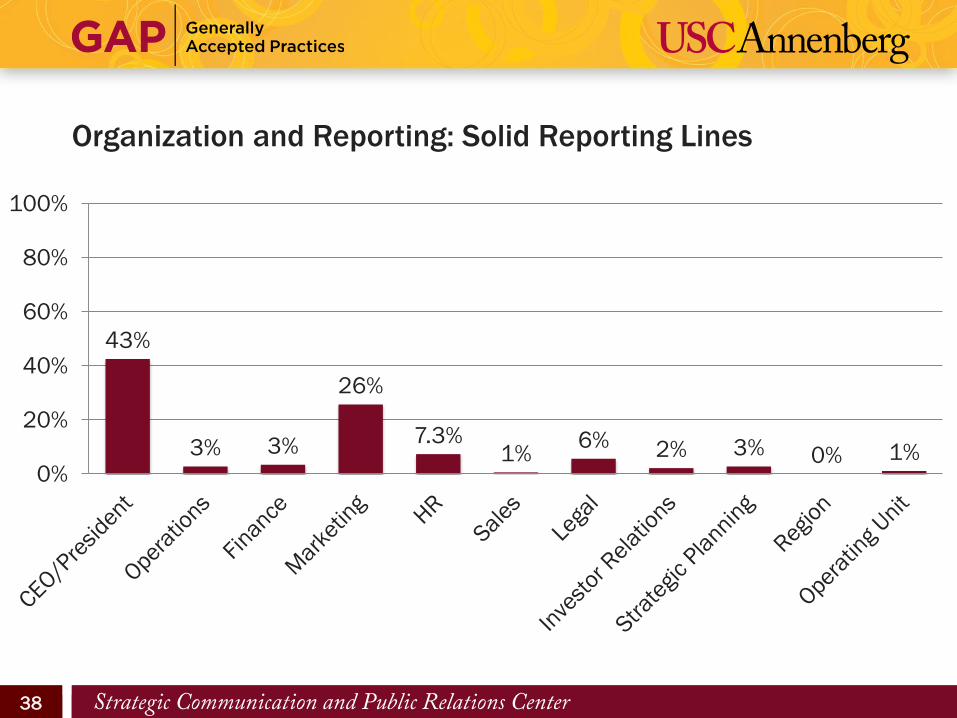
Organization and Reporting: Solid Reporting Lines
43%
3% 3%
26%
7.3% 1%
6% 2% 3% 0% 1% 0%
20%
40%
60%
80%
100%
39 39 39
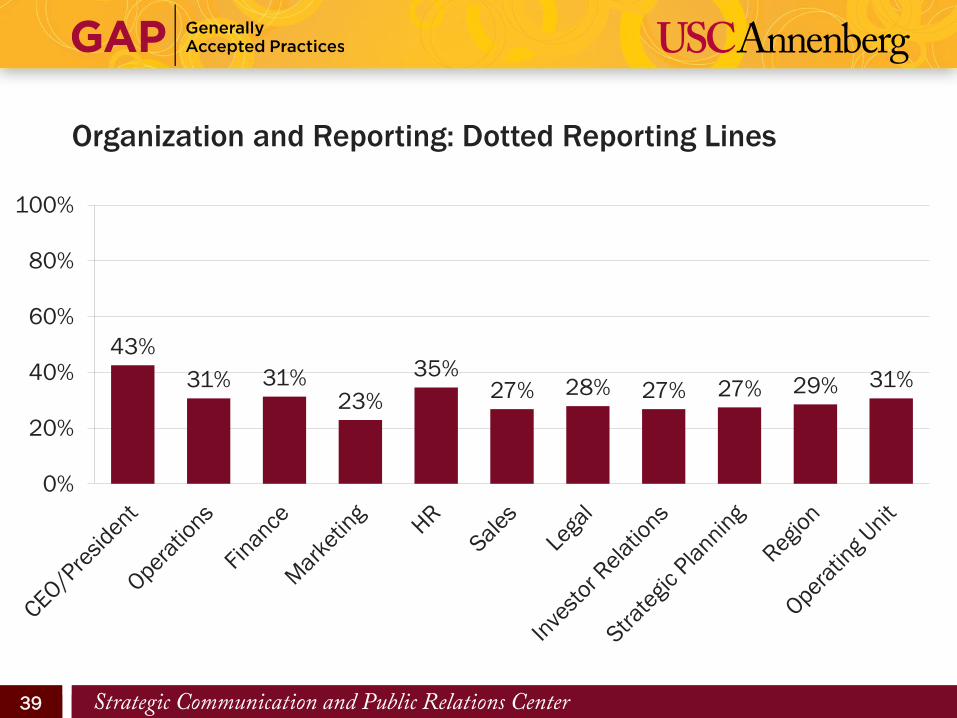
Organization and Reporting: Dotted Reporting Lines
43%
31% 31% 23%
35% 27% 28% 27% 27% 29% 31%
0%
20%
40%
60%
80%
100%
40 40 40
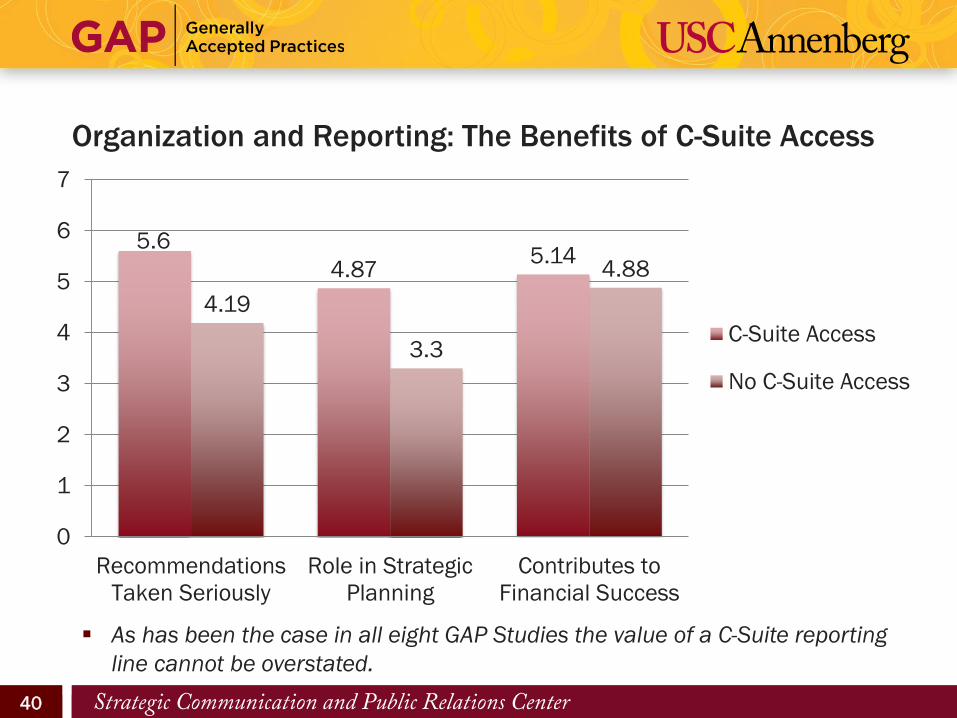
Organization and Reporting: The Benefits of C-Suite Access
5.6
4.87 5.14
4.19
3.3
4.88
0
1
2
3
4
5
6
7
Recommendations
Taken Seriously
Role in Strategic
Planning
Contributes to
Financial Success
C-Suite Access
No C-Suite Access
As has been the case in all eight GAP Studies the value of a C-Suite reporting
line cannot be overstated.
41 41 41
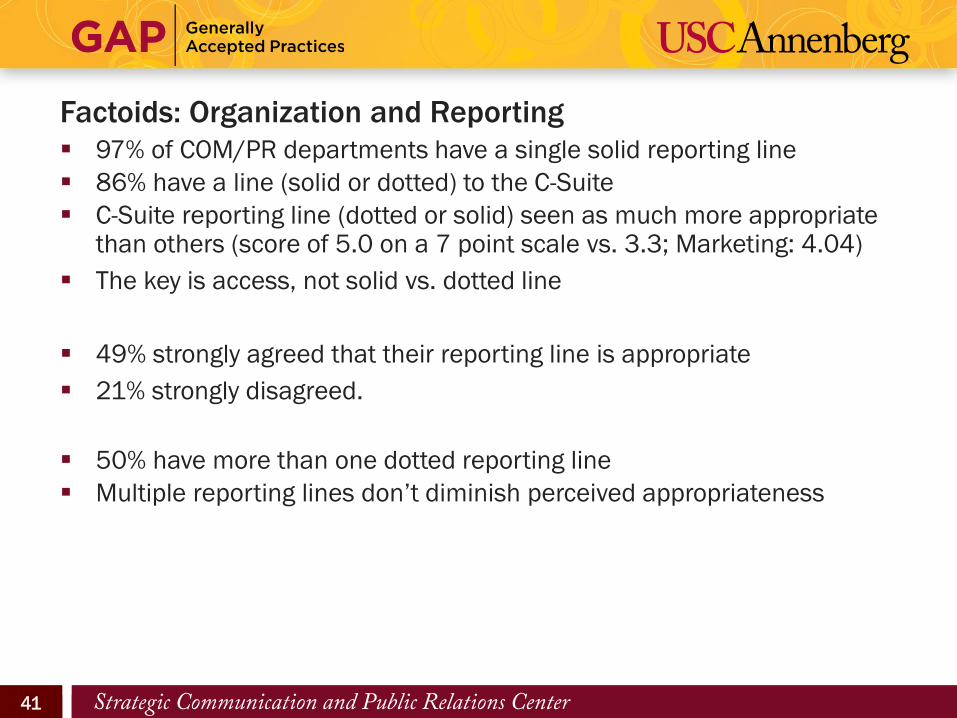
Factoids: Organization and Reporting
97% of COM/PR departments have a single solid reporting line
86% have a line (solid or dotted) to the C-Suite
C-Suite reporting line (dotted or solid) seen as much more appropriate than others (score of 5.0 on a 7 point scale vs. 3.3; Marketing: 4.04)
The key is access, not solid vs. dotted line
49% strongly agreed that their reporting line is appropriate
21% strongly disagreed.
50% have more than one dotted reporting line
Multiple reporting lines don’t diminish perceived appropriateness
42 42 42
Factoids: The Relationship Between Reporting Line and Integration/Coordination
Respondents with access to the C-Suite (solid or dotted line)
report:
• A higher level of intra-departmental integration/coordination than
those who do not (5.5 vs. 5.15)
• A higher level of integration/coordination with marketing than those
who do not (5.1 vs. 4.4)
• A higher level of integration/coordination with other corporate
functions than those who do not (5.3 vs. 4.8)
Bottom line:
• C-Suite access is associated with higher levels of internal collaboration
• Higher levels of internal collaboration are associated with higher levels
of internal influence, credibility, etc.
• Higher levels of internal influence, credibility etc. better enable
PR/Comm to influence reputation, success, etc.
43 43 43 43
Budgets
GAP VIII, Section 4
44 44 44
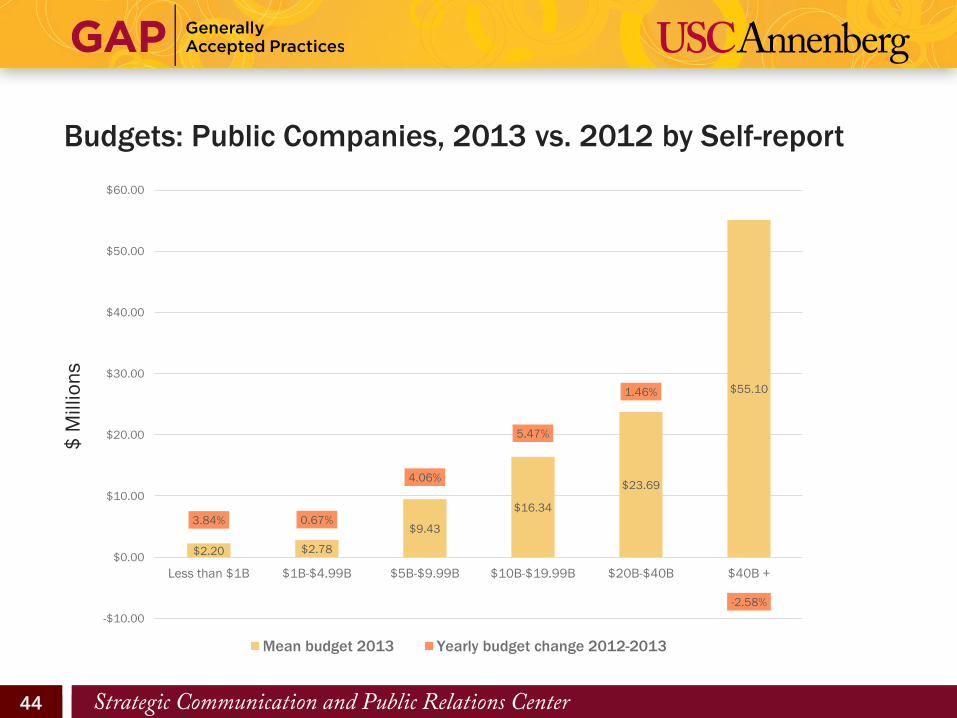
Budgets: Public Companies, 2013 vs. 2012 by Self-report
$2.20 $2.78
$9.43
$16.34
$23.69
$55.10
3.84% 0.67%
4.06%
5.47%
1.46%
-2.58%
-$10.00
$0.00
$10.00
$20.00
$30.00
$40.00
$50.00
$60.00
Less than $1B $1B-$4.99B $5B-$9.99B $10B-$19.99B $20B-$40B $40B +
Mean budget 2013 Yearly budget change 2012-2013
$ M
illio
ns
45 45 45
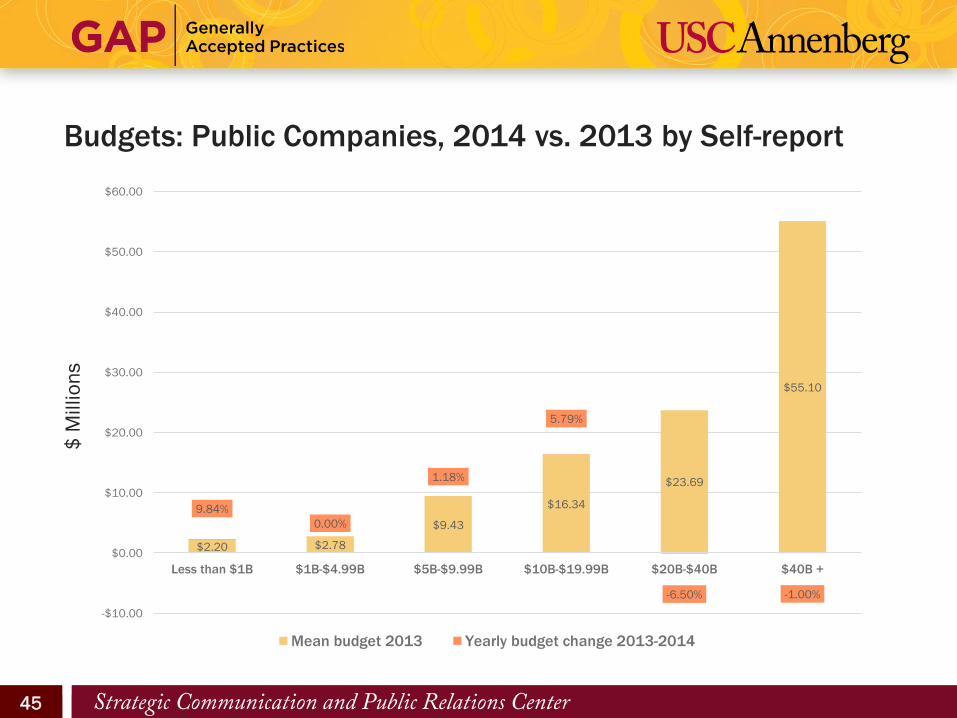
Budgets: Public Companies, 2014 vs. 2013 by Self-report
$ M
illio
ns
$2.20 $2.78
$9.43
$16.34
$23.69
$55.10
9.84%
0.00%
1.18%
5.79%
-6.50% -1.00%
-$10.00
$0.00
$10.00
$20.00
$30.00
$40.00
$50.00
$60.00
Less than $1B $1B-$4.99B $5B-$9.99B $10B-$19.99B $20B-$40B $40B +
Mean budget 2013 Yearly budget change 2013-2014
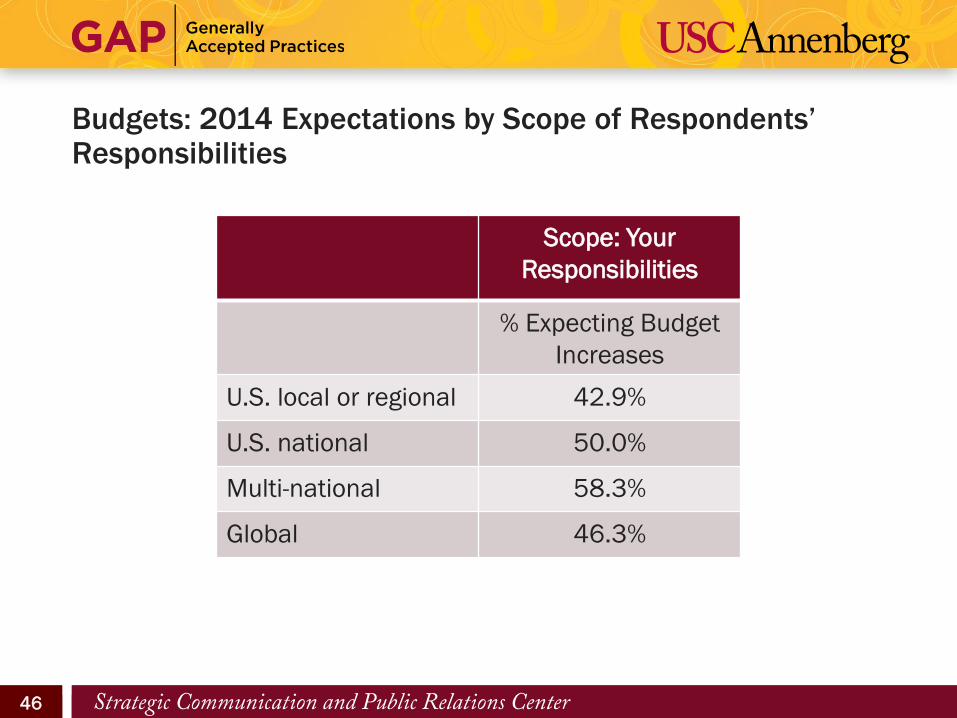
46 46 46
Budgets: 2014 Expectations by Scope of Respondents’ Responsibilities
Scope: Your
Responsibilities
% Expecting Budget
Increases
U.S. local or regional 42.9%
U.S. national 50.0%
Multi-national 58.3%
Global 46.3%
47 47 47
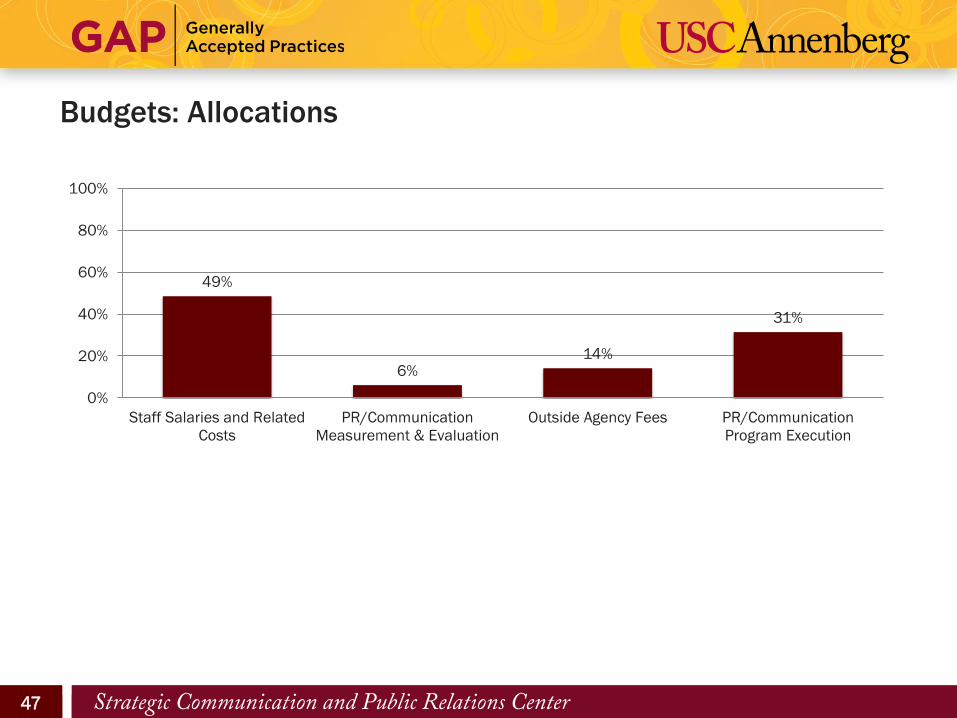
Budgets: Allocations
49%
6% 14%
31%
0%
20%
40%
60%
80%
100%
Staff Salaries and Related
Costs
PR/Communication
Measurement & Evaluation
Outside Agency Fees PR/Communication
Program Execution
48 48 48
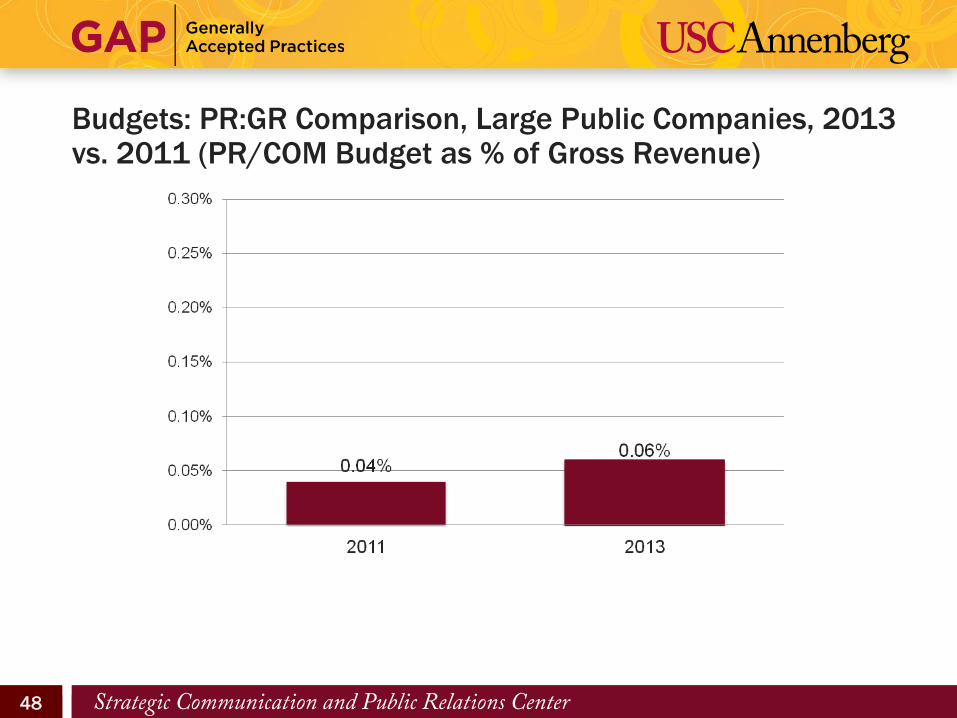
Budgets: PR:GR Comparison, Large Public Companies, 2013 vs. 2011 (PR/COM Budget as % of Gross Revenue)
49 49 49
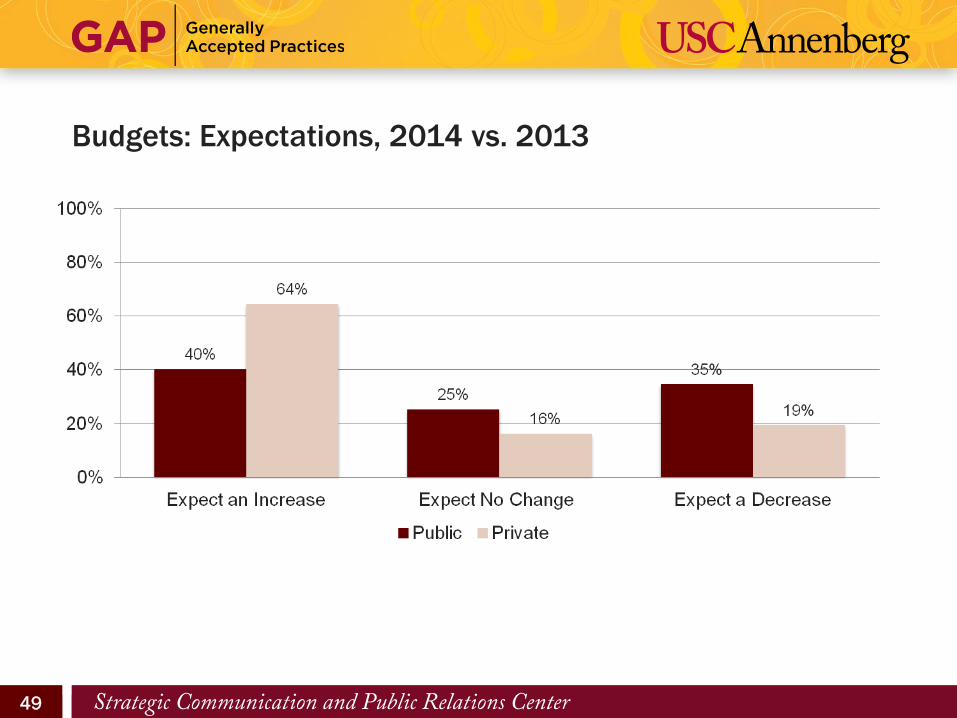
Budgets: Expectations, 2014 vs. 2013
50 50 50 50
Staffing
GAP VIII, Section 5
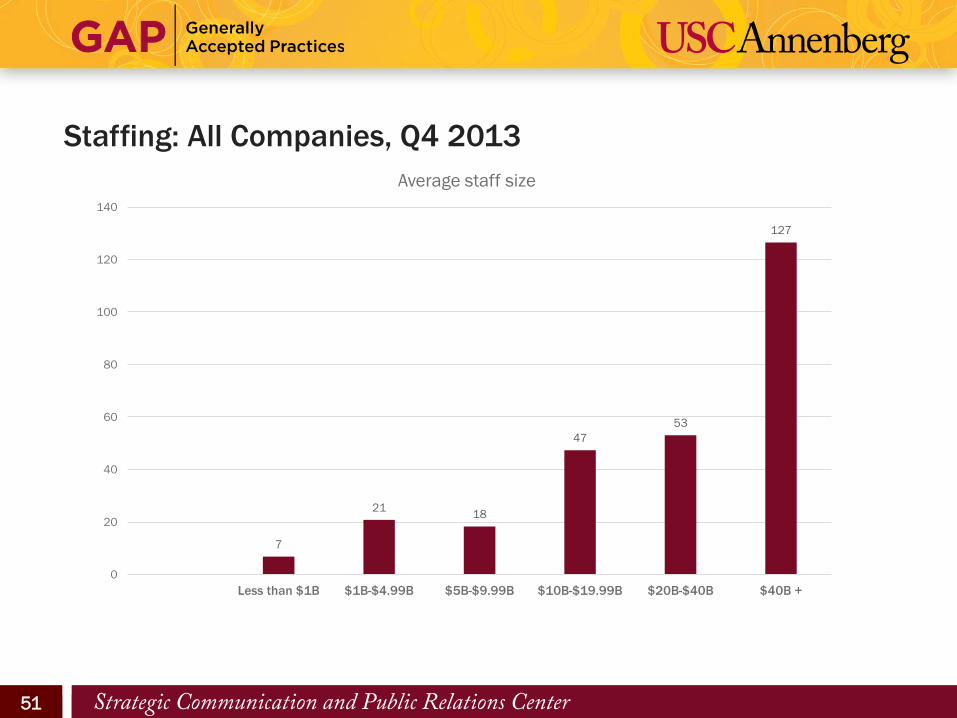
51 51 51
Staffing: All Companies, Q4 2013
7
21 18
47
53
127
0
20
40
60
80
100
120
140
Less than $1B $1B-$4.99B $5B-$9.99B $10B-$19.99B $20B-$40B $40B +
Average staff size
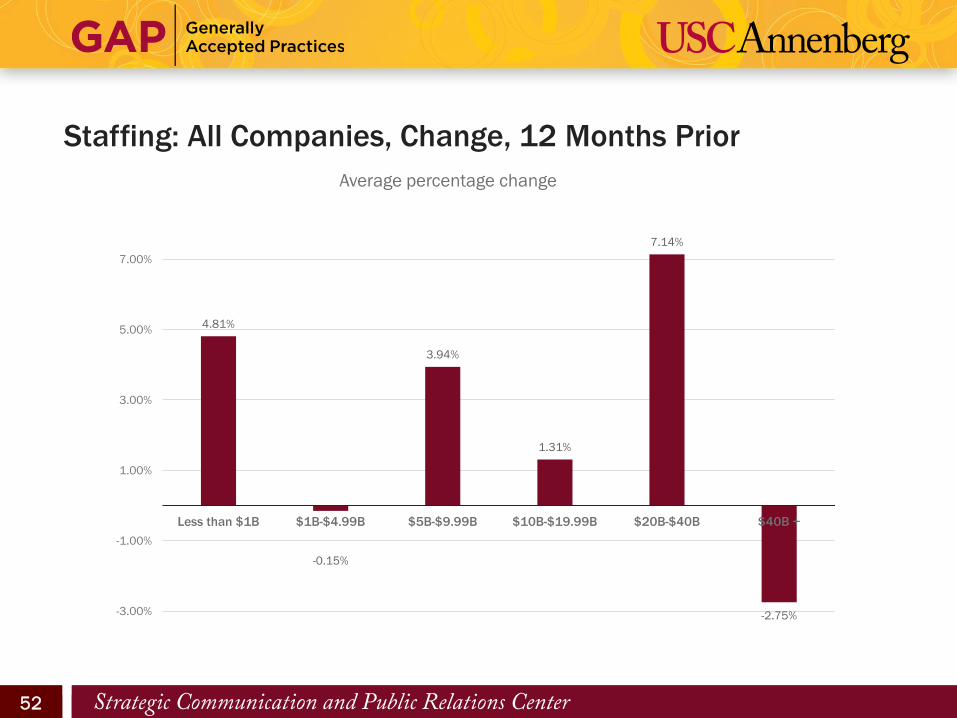
52 52 52
Staffing: All Companies, Change, 12 Months Prior
4.81%
-0.15%
3.94%
1.31%
7.14%
-2.75% -3.00%
-1.00%
1.00%
3.00%
5.00%
7.00%
Less than $1B $1B-$4.99B $5B-$9.99B $10B-$19.99B $20B-$40B $40B +
Average percentage change
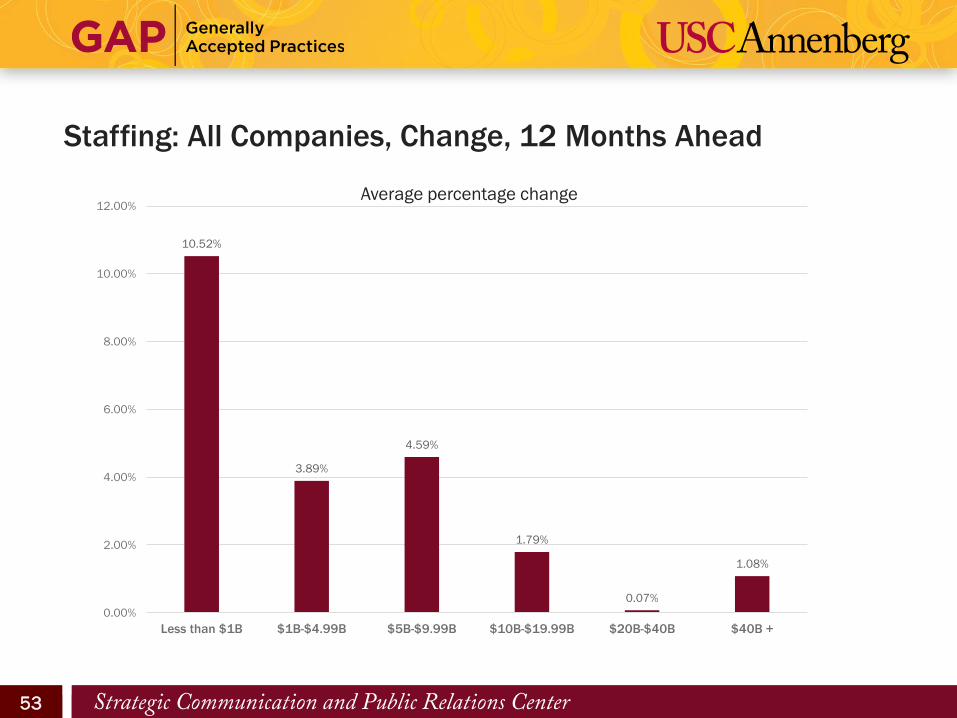
53 53 53
Staffing: All Companies, Change, 12 Months Ahead
10.52%
3.89%
4.59%
1.79%
0.07%
1.08%
0.00%
2.00%
4.00%
6.00%
8.00%
10.00%
12.00%
Less than $1B $1B-$4.99B $5B-$9.99B $10B-$19.99B $20B-$40B $40B +
Average percentage change
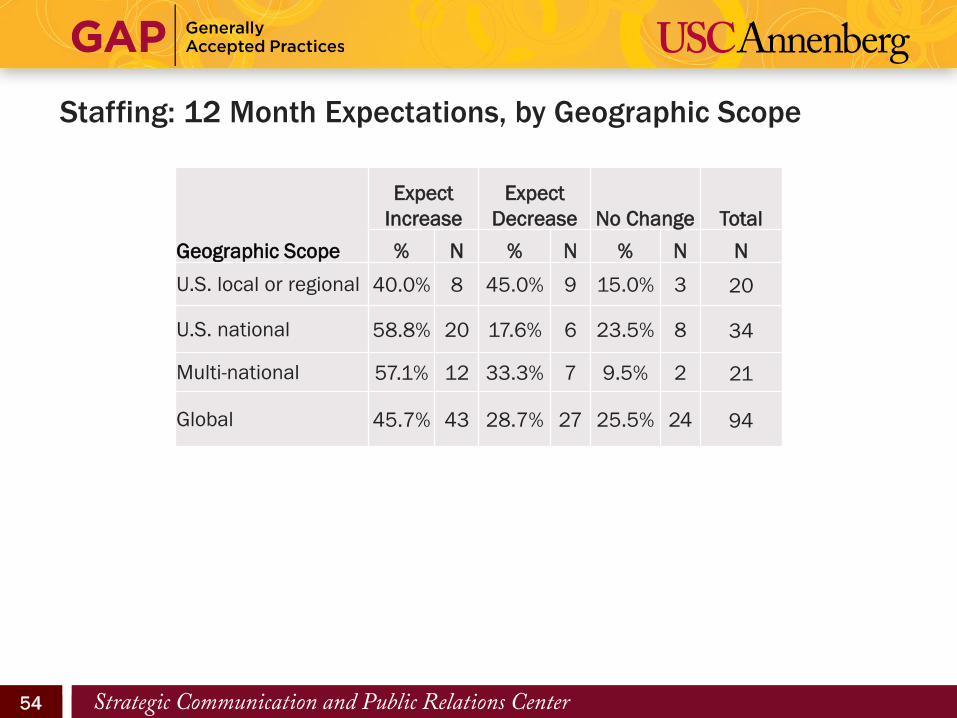
54 54 54
Staffing: 12 Month Expectations, by Geographic Scope
Geographic Scope
Expect
Increase
Expect
Decrease No Change Total
% N % N % N N
U.S. local or regional 40.0% 8 45.0% 9 15.0% 3 20
U.S. national 58.8% 20 17.6% 6 23.5% 8 34
Multi-national 57.1% 12 33.3% 7 9.5% 2 21
Global 45.7% 43 28.7% 27 25.5% 24 94
55 55 55
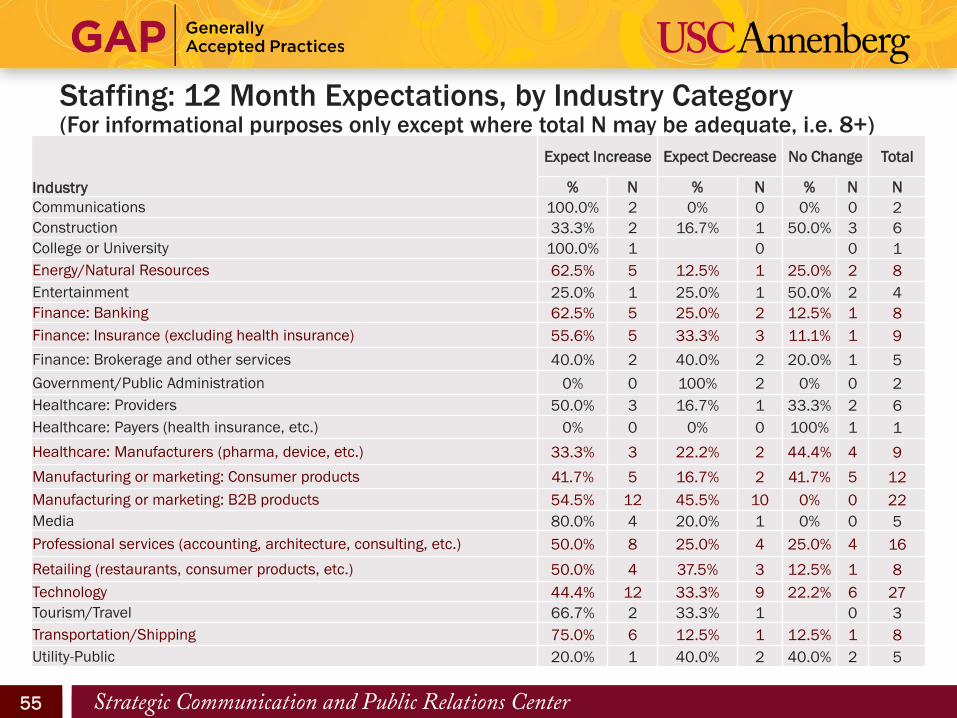
Staffing: 12 Month Expectations, by Industry Category (For informational purposes only except where total N may be adequate, i.e. 8+)
Industry
Expect Increase Expect Decrease No Change Total
% N % N % N N
Communications 100.0% 2 0% 0 0% 0 2
Construction 33.3% 2 16.7% 1 50.0% 3 6
College or University 100.0% 1 0 0 1
Energy/Natural Resources 62.5% 5 12.5% 1 25.0% 2 8
Entertainment 25.0% 1 25.0% 1 50.0% 2 4
Finance: Banking 62.5% 5 25.0% 2 12.5% 1 8
Finance: Insurance (excluding health insurance) 55.6% 5 33.3% 3 11.1% 1 9
Finance: Brokerage and other services 40.0% 2 40.0% 2 20.0% 1 5
Government/Public Administration 0% 0 100% 2 0% 0 2
Healthcare: Providers 50.0% 3 16.7% 1 33.3% 2 6
Healthcare: Payers (health insurance, etc.) 0% 0 0% 0 100% 1 1
Healthcare: Manufacturers (pharma, device, etc.) 33.3% 3 22.2% 2 44.4% 4 9
Manufacturing or marketing: Consumer products 41.7% 5 16.7% 2 41.7% 5 12
Manufacturing or marketing: B2B products 54.5% 12 45.5% 10 0% 0 22
Media 80.0% 4 20.0% 1 0% 0 5
Professional services (accounting, architecture, consulting, etc.) 50.0% 8 25.0% 4 25.0% 4 16
Retailing (restaurants, consumer products, etc.) 50.0% 4 37.5% 3 12.5% 1 8
Technology 44.4% 12 33.3% 9 22.2% 6 27
Tourism/Travel 66.7% 2 33.3% 1 0 3
Transportation/Shipping 75.0% 6 12.5% 1 12.5% 1 8
Utility-Public 20.0% 1 40.0% 2 40.0% 2 5
56 56 56 56
Functions and Responsibilities
GAP VIII, Section 6
57 57 57
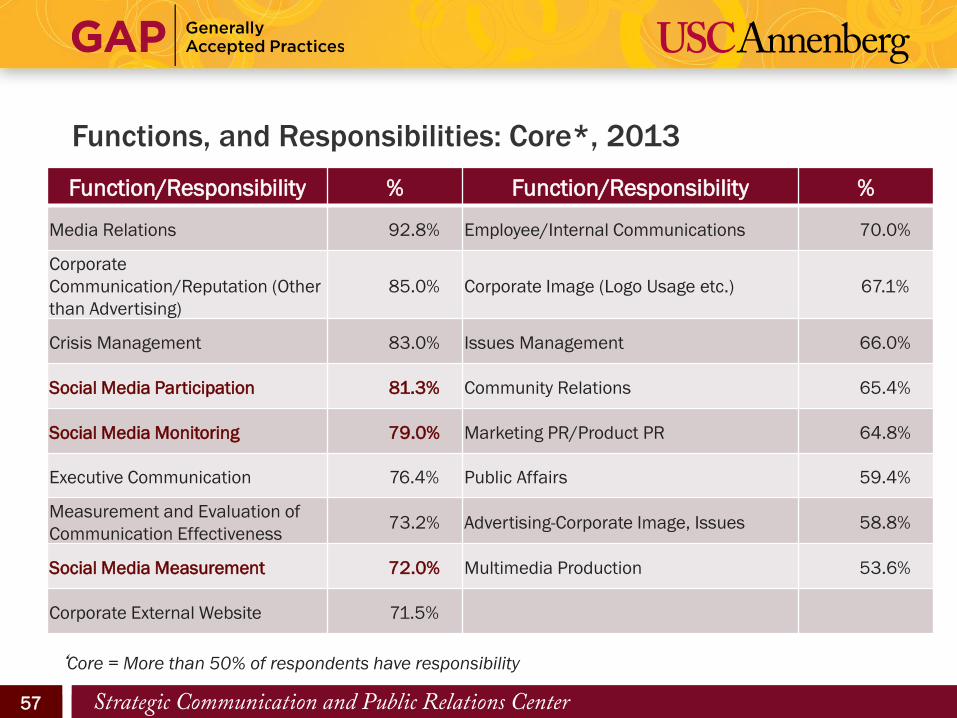
Functions, and Responsibilities: Core*, 2013
Function/Responsibility % Function/Responsibility %
Media Relations 92.8% Employee/Internal Communications 70.0%
Corporate
Communication/Reputation (Other
than Advertising)
85.0% Corporate Image (Logo Usage etc.) 67.1%
Crisis Management 83.0% Issues Management 66.0%
Social Media Participation 81.3% Community Relations 65.4%
Social Media Monitoring 79.0% Marketing PR/Product PR 64.8%
Executive Communication 76.4% Public Affairs 59.4%
Measurement and Evaluation of
Communication Effectiveness 73.2% Advertising-Corporate Image, Issues 58.8%
Social Media Measurement 72.0% Multimedia Production 53.6%
Corporate External Website 71.5%
‘Core = More than 50% of respondents have responsibility
58 58 58
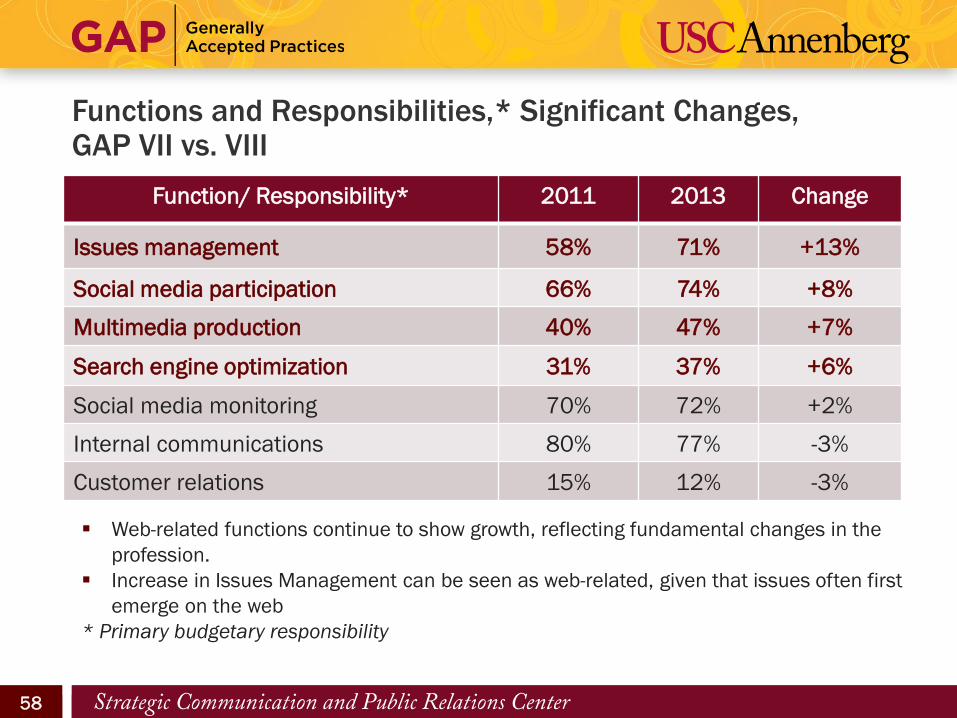
Functions and Responsibilities,* Significant Changes, GAP VII vs. VIII
Function/ Responsibility* 2011 2013 Change
Issues management 58% 71% +13%
Social media participation 66% 74% +8%
Multimedia production 40% 47% +7%
Search engine optimization 31% 37% +6%
Social media monitoring 70% 72% +2%
Internal communications 80% 77% -3%
Customer relations 15% 12% -3%
Web-related functions continue to show growth, reflecting fundamental changes in the
profession.
Increase in Issues Management can be seen as web-related, given that issues often first
emerge on the web
* Primary budgetary responsibility
59 59 59
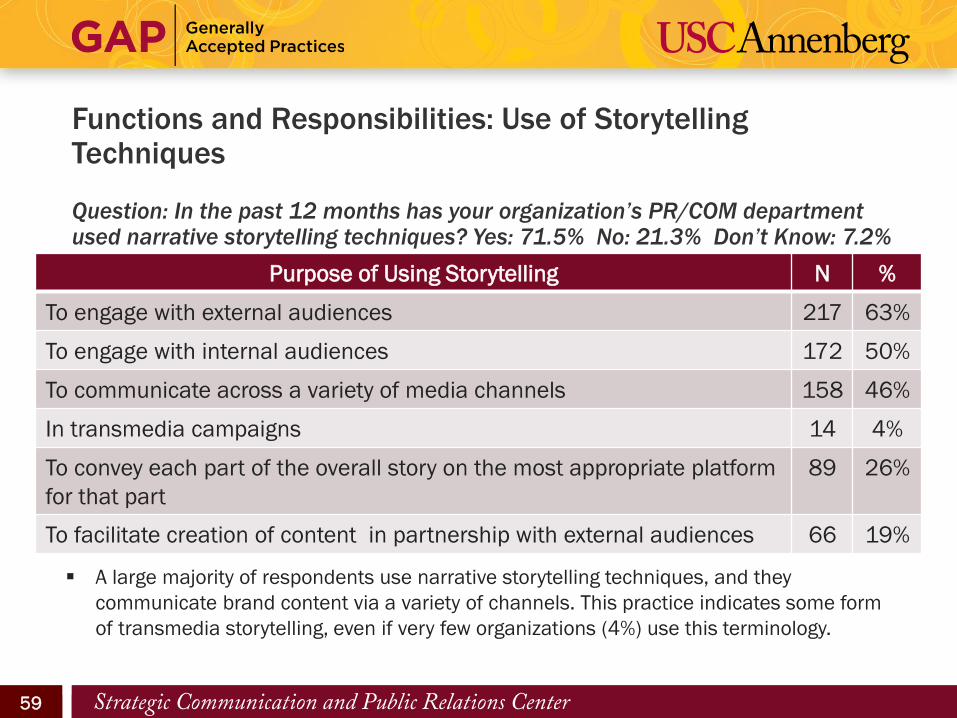
Question: In the past 12 months has your organization’s PR/COM department used narrative storytelling techniques? Yes: 71.5% No: 21.3% Don’t Know: 7.2%
A large majority of respondents use narrative storytelling techniques, and they
communicate brand content via a variety of channels. This practice indicates some form
of transmedia storytelling, even if very few organizations (4%) use this terminology.
Functions and Responsibilities: Use of Storytelling Techniques
Purpose of Using Storytelling N %
To engage with external audiences 217 63%
To engage with internal audiences 172 50%
To communicate across a variety of media channels 158 46%
In transmedia campaigns 14 4%
To convey each part of the overall story on the most appropriate platform
for that part
89 26%
To facilitate creation of content in partnership with external audiences 66 19%
60 60 60 60
The Media Environment
GAP VIII, Section 7
61 61 61
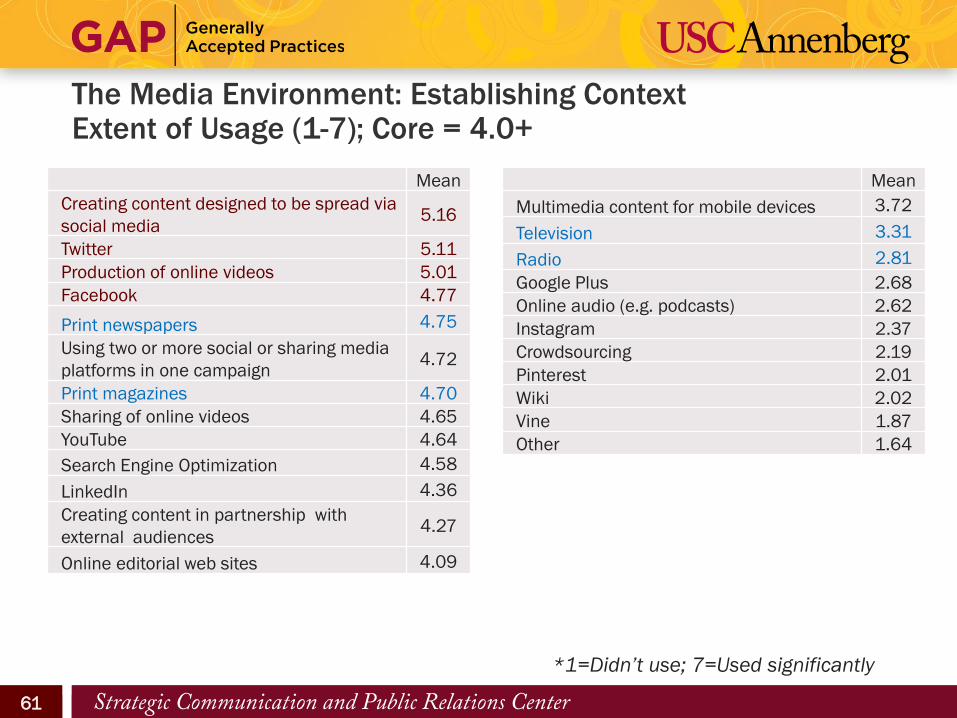
The Media Environment: Establishing Context Extent of Usage (1-7); Core = 4.0+
*1=Didn’t use; 7=Used significantly
Mean
Creating content designed to be spread via
social media 5.16
Twitter 5.11
Production of online videos 5.01
Facebook 4.77
Print newspapers 4.75
Using two or more social or sharing media
platforms in one campaign 4.72
Print magazines 4.70
Sharing of online videos 4.65
YouTube 4.64
Search Engine Optimization 4.58
LinkedIn 4.36
Creating content in partnership with
external audiences 4.27
Online editorial web sites 4.09
Mean
Multimedia content for mobile devices 3.72
Television 3.31
Radio 2.81
Google Plus 2.68
Online audio (e.g. podcasts) 2.62
Instagram 2.37
Crowdsourcing 2.19
Pinterest 2.01
Wiki 2.02
Vine 1.87
Other 1.64
62 62 62
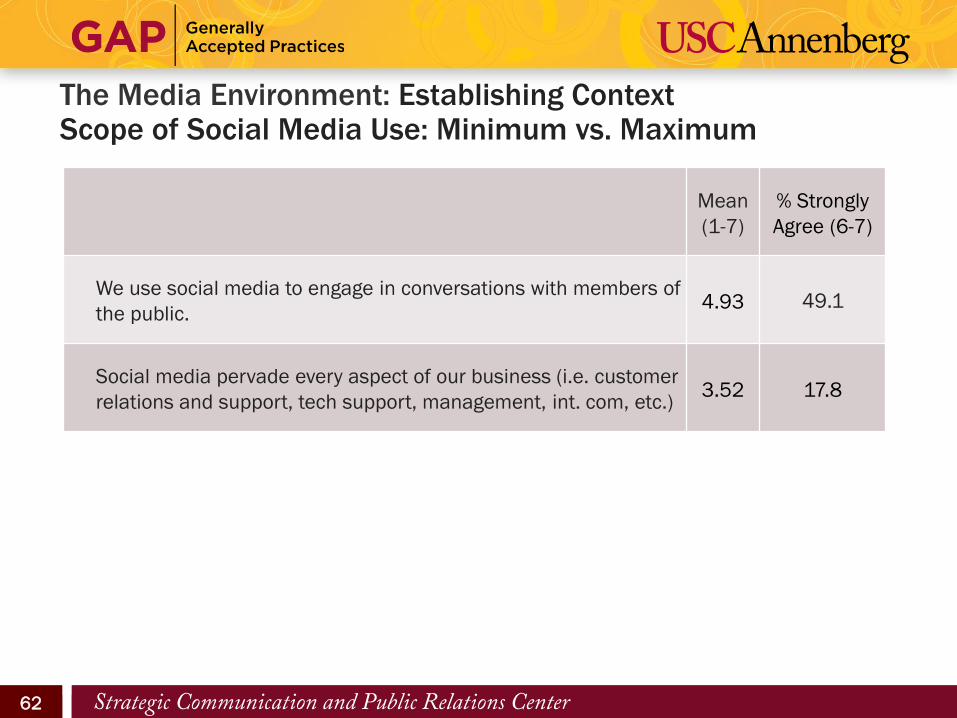
The Media Environment: Establishing Context Scope of Social Media Use: Minimum vs. Maximum
Mean
(1-7)
% Strongly
Agree (6-7)
We use social media to engage in conversations with members of
the public. 4.93 49.1
Social media pervade every aspect of our business (i.e. customer
relations and support, tech support, management, int. com, etc.) 3.52 17.8
63 63 63
.
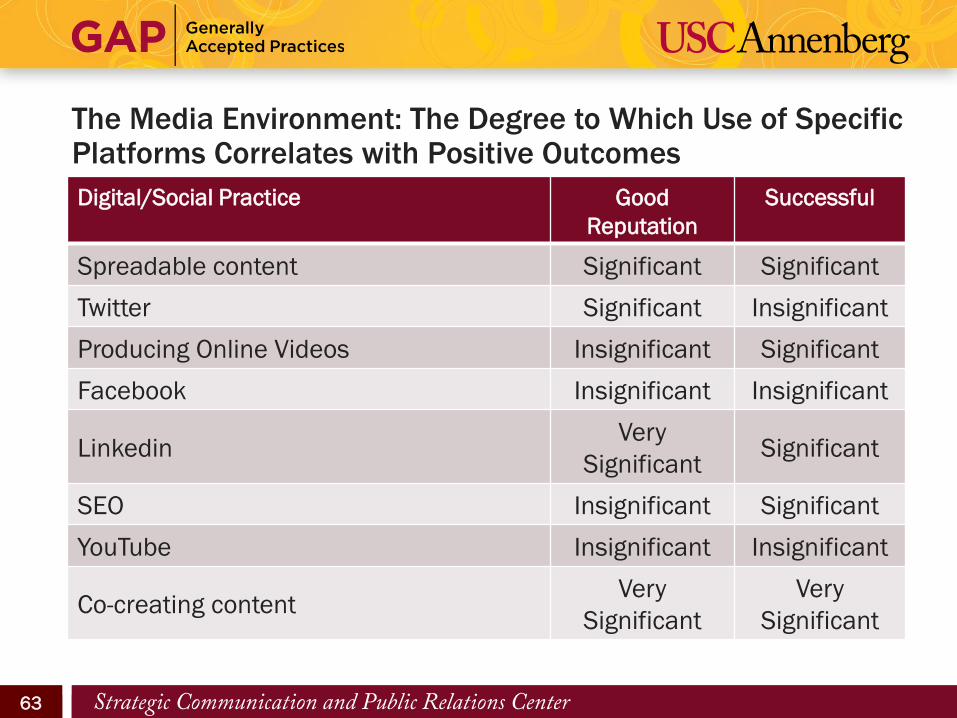
The Media Environment: The Degree to Which Use of Specific Platforms Correlates with Positive Outcomes
Digital/Social Practice Good
Reputation
Successful
Spreadable content Significant Significant
Twitter Significant Insignificant
Producing Online Videos Insignificant Significant
Facebook Insignificant Insignificant
Linkedin Very
Significant Significant
SEO Insignificant Significant
YouTube Insignificant Insignificant
Co-creating content Very
Significant
Very
Significant
64 64 64
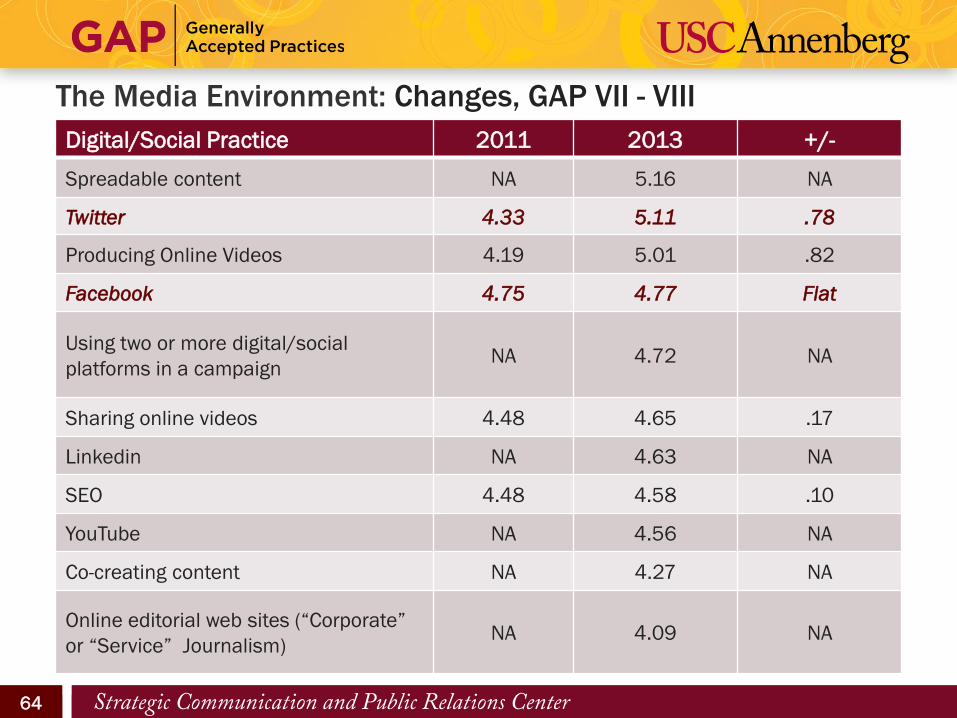
The Media Environment: Changes, GAP VII - VIII
Digital/Social Practice 2011 2013 +/-
Spreadable content NA 5.16 NA
Twitter 4.33 5.11 .78
Producing Online Videos 4.19 5.01 .82
Facebook 4.75 4.77 Flat
Using two or more digital/social
platforms in a campaign NA 4.72
NA
Sharing online videos 4.48 4.65 .17
Linkedin NA 4.63 NA
SEO 4.48 4.58 .10
YouTube NA 4.56 NA
Co-creating content NA 4.27 NA
Online editorial web sites (“Corporate”
or “Service” Journalism) NA 4.09 NA
65 65 65
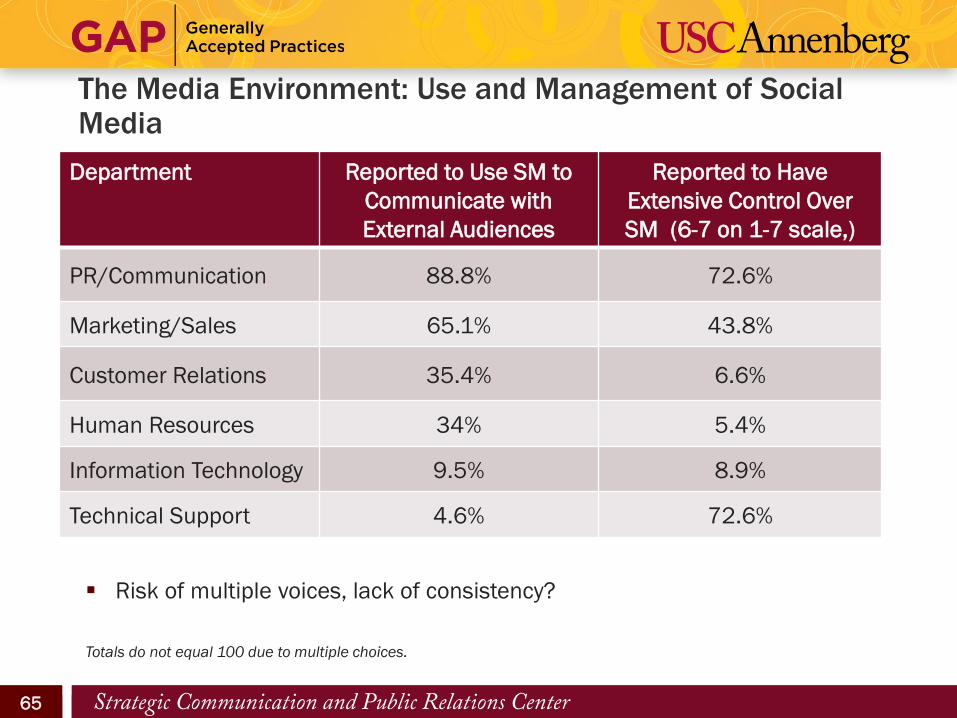
The Media Environment: Use and Management of Social Media
Department Reported to Use SM to
Communicate with
External Audiences
Reported to Have
Extensive Control Over
SM (6-7 on 1-7 scale,)
PR/Communication 88.8% 72.6%
Marketing/Sales 65.1% 43.8%
Customer Relations 35.4% 6.6%
Human Resources 34% 5.4%
Information Technology 9.5% 8.9%
Technical Support 4.6% 72.6%
Totals do not equal 100 due to multiple choices.
Risk of multiple voices, lack of consistency?
66 66 66
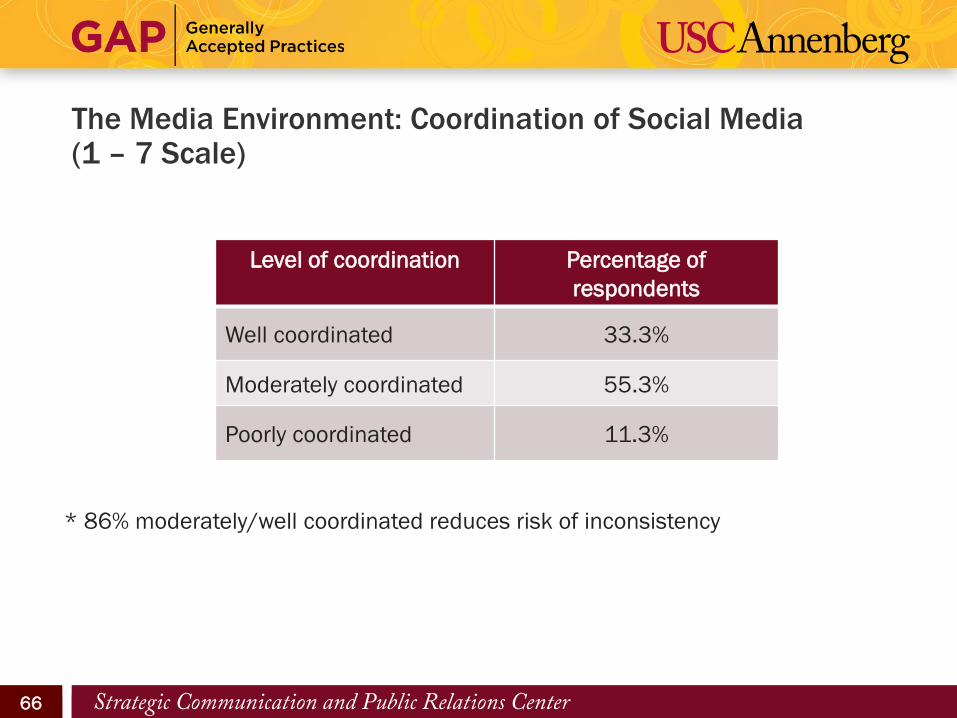
* 86% moderately/well coordinated reduces risk of inconsistency
The Media Environment: Coordination of Social Media (1 – 7 Scale)
Level of coordination Percentage of
respondents
Well coordinated 33.3%
Moderately coordinated 55.3%
Poorly coordinated 11.3%
67 67 67 67
Measurement and Evaluation
GAP VIII, Section 8
68 68 68
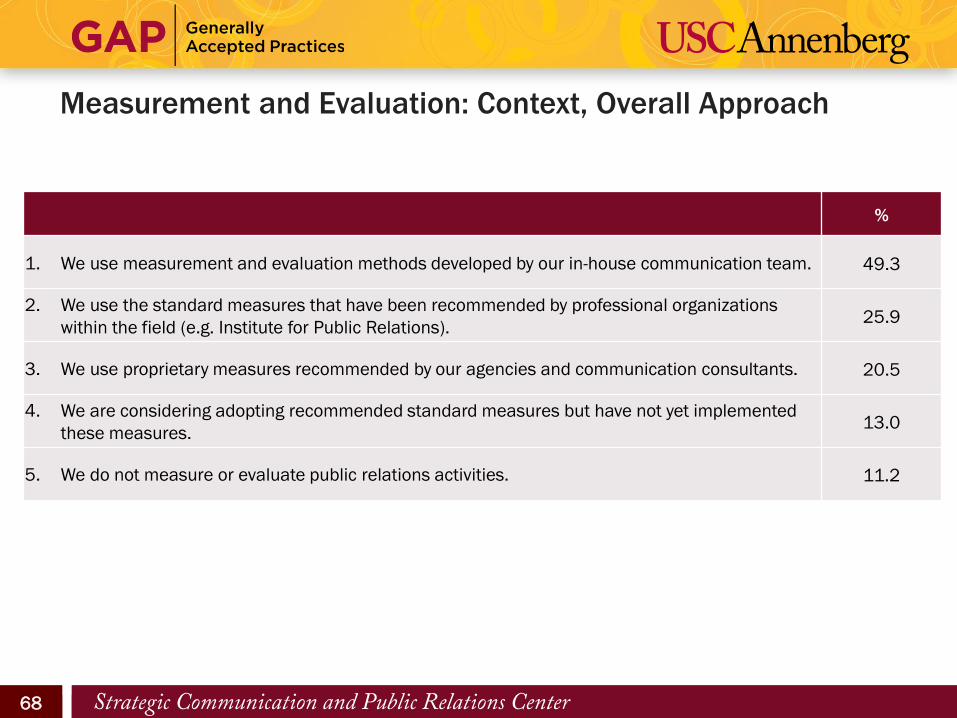
Measurement and Evaluation: Context, Overall Approach
.
%
1. We use measurement and evaluation methods developed by our in-house communication team. 49.3
2. We use the standard measures that have been recommended by professional organizations
within the field (e.g. Institute for Public Relations). 25.9
3. We use proprietary measures recommended by our agencies and communication consultants. 20.5
4. We are considering adopting recommended standard measures but have not yet implemented
these measures. 13.0
5. We do not measure or evaluate public relations activities. 11.2
69 69 69
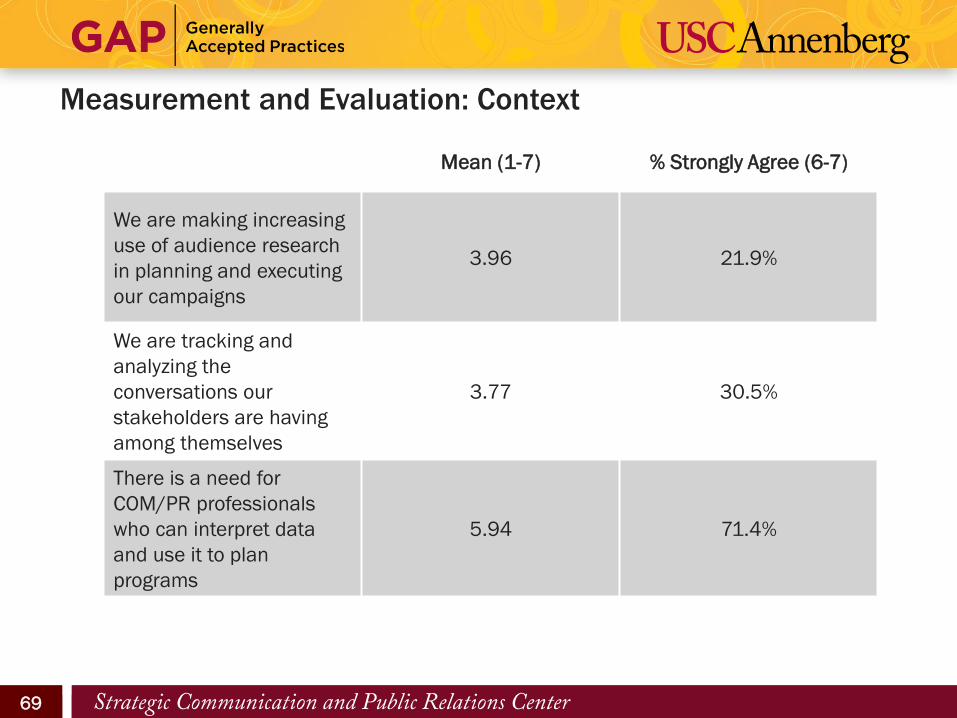
Measurement and Evaluation: Context
Mean (1-7) % Strongly Agree (6-7)
We are making increasing
use of audience research
in planning and executing
our campaigns
3.96 21.9%
We are tracking and
analyzing the
conversations our
stakeholders are having
among themselves
3.77 30.5%
There is a need for
COM/PR professionals
who can interpret data
and use it to plan
programs
5.94 71.4%
70 70 70
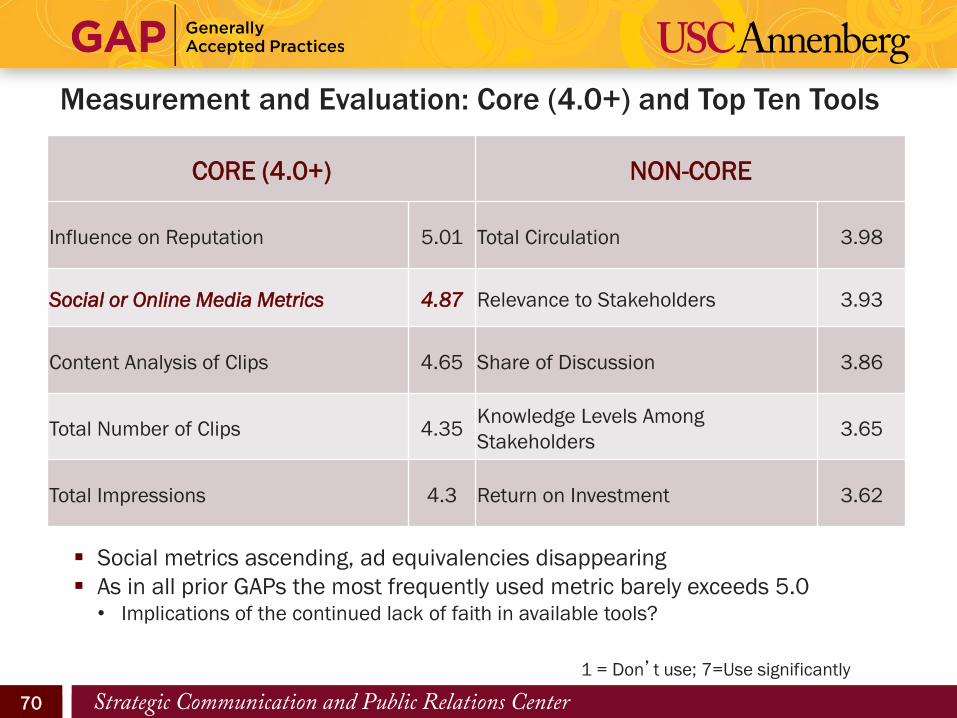
CORE (4.0+) NON-CORE
Influence on Reputation 5.01 Total Circulation 3.98
Social or Online Media Metrics 4.87 Relevance to Stakeholders 3.93
Content Analysis of Clips 4.65 Share of Discussion 3.86
Total Number of Clips 4.35 Knowledge Levels Among
Stakeholders 3.65
Total Impressions 4.3 Return on Investment 3.62
1 = Don’t use; 7=Use significantly
Measurement and Evaluation: Core (4.0+) and Top Ten Tools
Social metrics ascending, ad equivalencies disappearing
As in all prior GAPs the most frequently used metric barely exceeds 5.0 • Implications of the continued lack of faith in available tools?
71 71 71
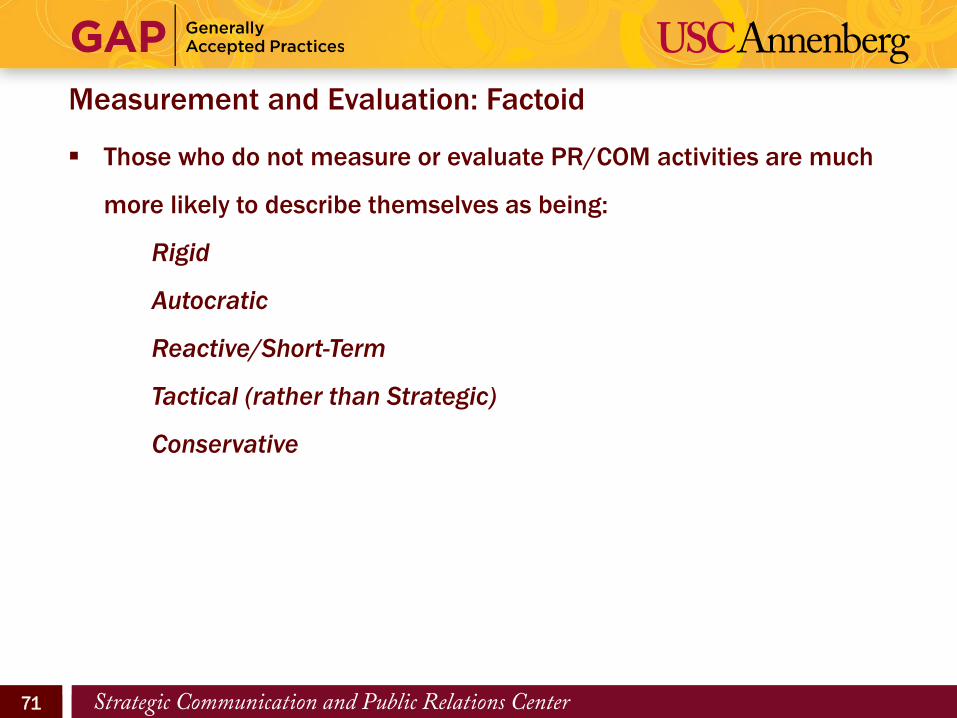
Those who do not measure or evaluate PR/COM activities are much
more likely to describe themselves as being:
Rigid
Autocratic
Reactive/Short-Term
Tactical (rather than Strategic)
Conservative
Measurement and Evaluation: Factoid
72 72 72 72
Agency Relationships
GAP VIII, Section 9
73 73 73
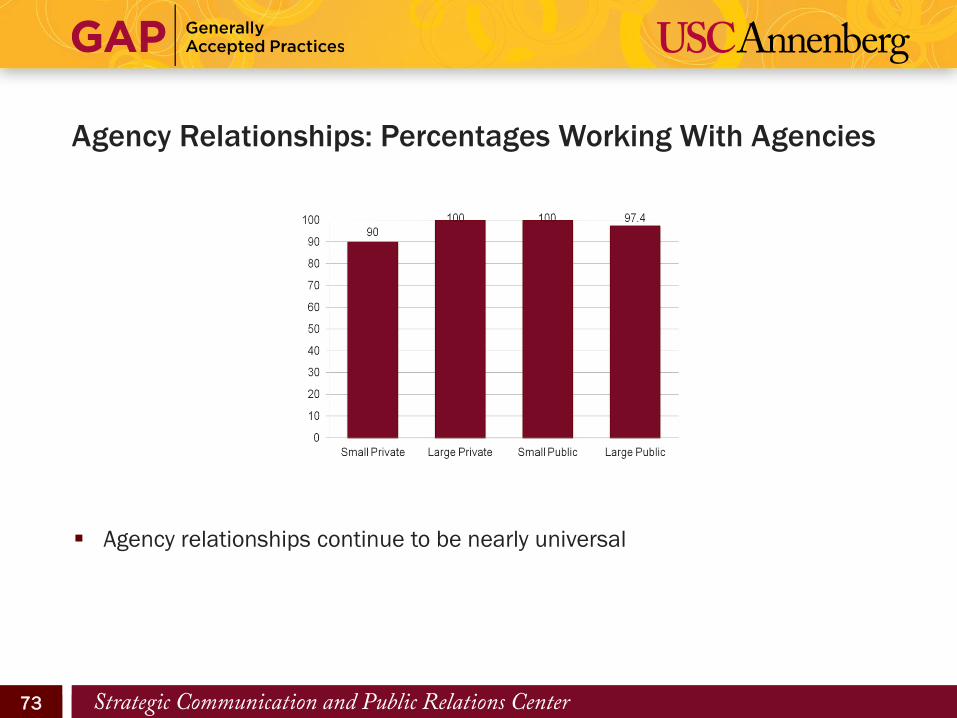
Agency Relationships: Percentages Working With Agencies
Agency relationships continue to be nearly universal
74 74 74
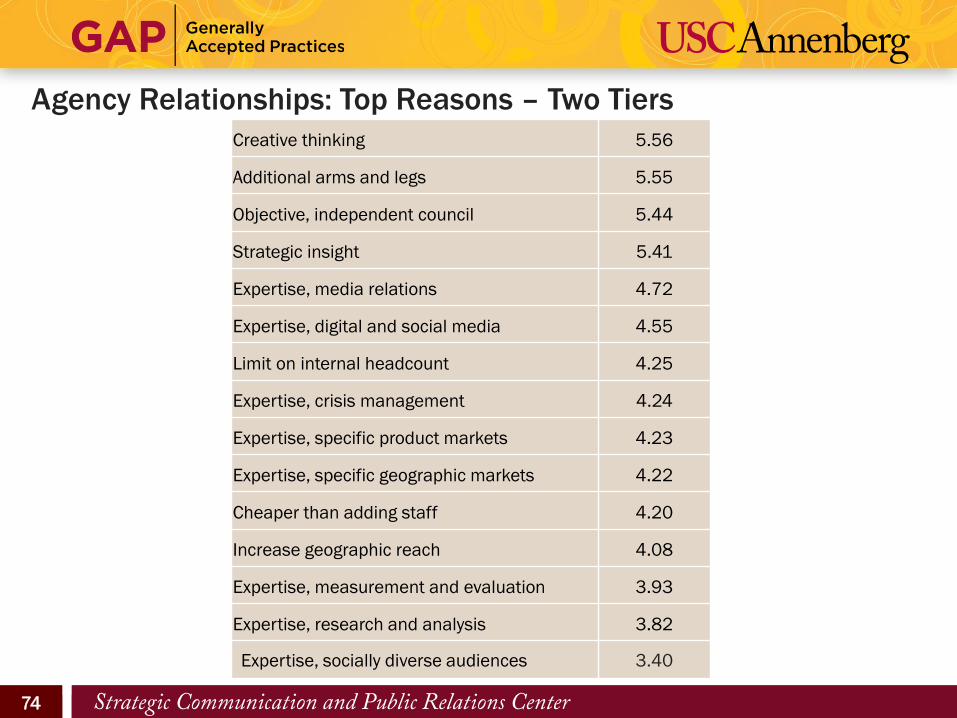
Agency Relationships: Top Reasons – Two Tiers
Creative thinking 5.56
Additional arms and legs 5.55
Objective, independent council 5.44
Strategic insight 5.41
Expertise, media relations 4.72
Expertise, digital and social media 4.55
Limit on internal headcount 4.25
Expertise, crisis management 4.24
Expertise, specific product markets 4.23
Expertise, specific geographic markets 4.22
Cheaper than adding staff 4.20
Increase geographic reach 4.08
Expertise, measurement and evaluation 3.93
Expertise, research and analysis 3.82
Expertise, socially diverse audiences 3.40
75 75 75
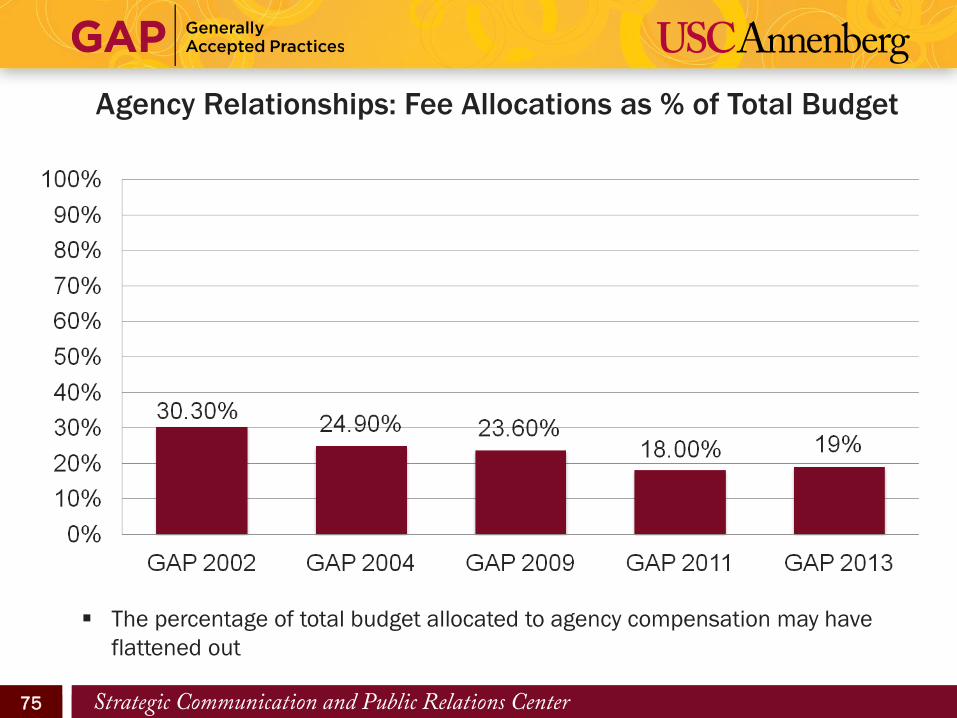
Agency Relationships: Fee Allocations as % of Total Budget
The percentage of total budget allocated to agency compensation may have
flattened out
76 76 76
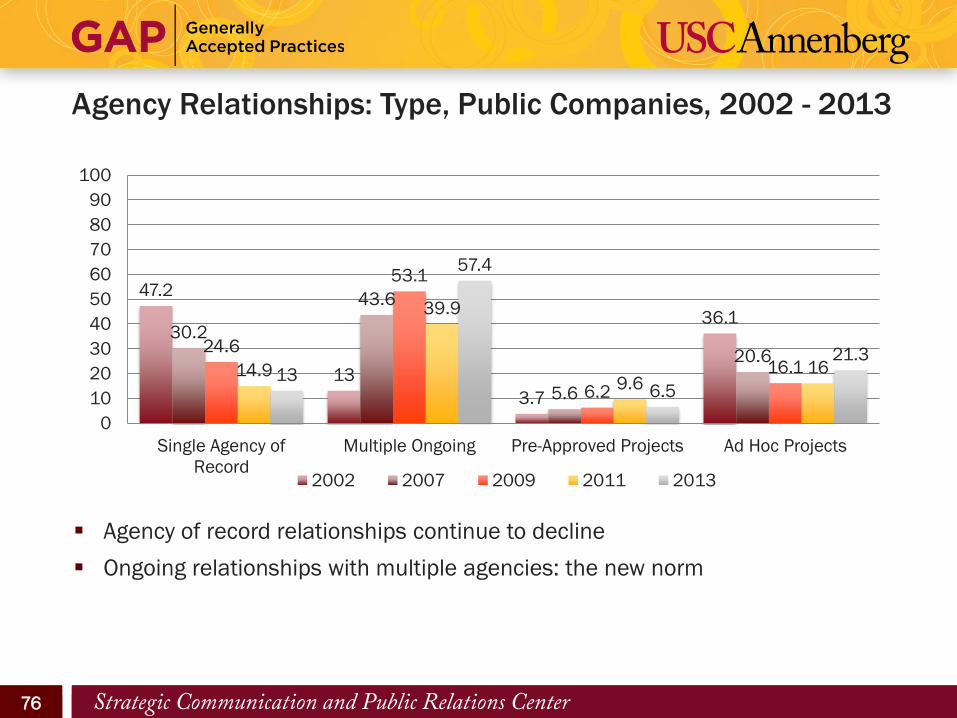
Agency Relationships: Type, Public Companies, 2002 - 2013
Agency of record relationships continue to decline
Ongoing relationships with multiple agencies: the new norm
47.2
13
3.7
36.1 30.2
43.6
5.6
20.6 24.6
53.1
6.2
16.1 14.9
39.9
9.6 16 13
57.4
6.5
21.3
0
10
20
30
40
50
60
70
80
90
100
Single Agency of
Record
Multiple Ongoing Pre-Approved Projects Ad Hoc Projects
2002 2007 2009 2011 2013
77 77 77
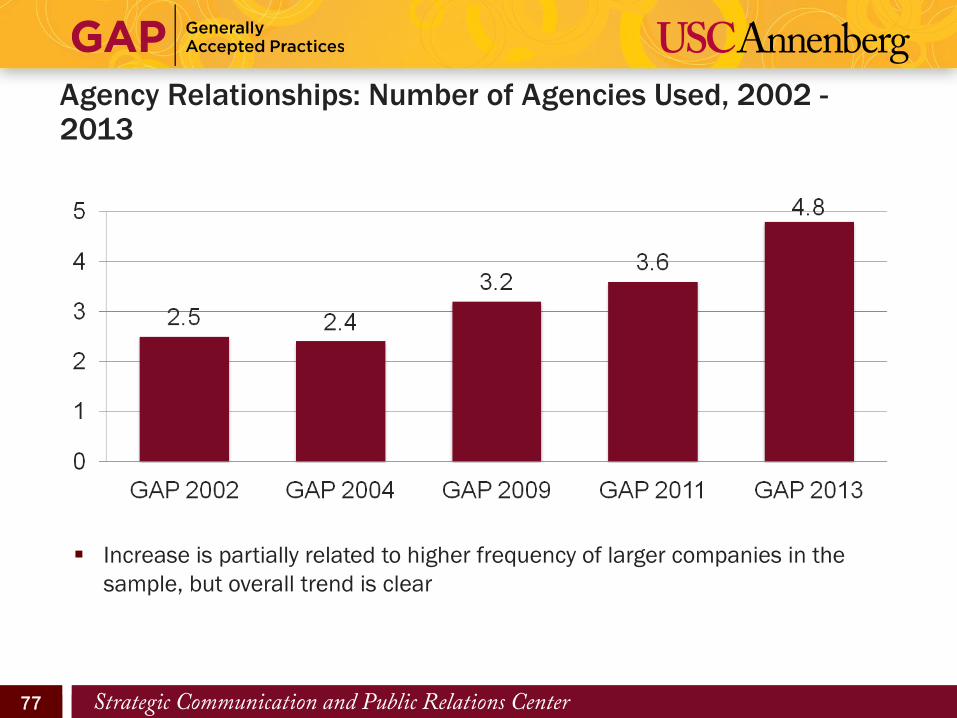
Agency Relationships: Number of Agencies Used, 2002 - 2013
Increase is partially related to higher frequency of larger companies in the
sample, but overall trend is clear
78 78 78 78
Excellence and Best Practices
GAP VIII, Section 10
79 79 79
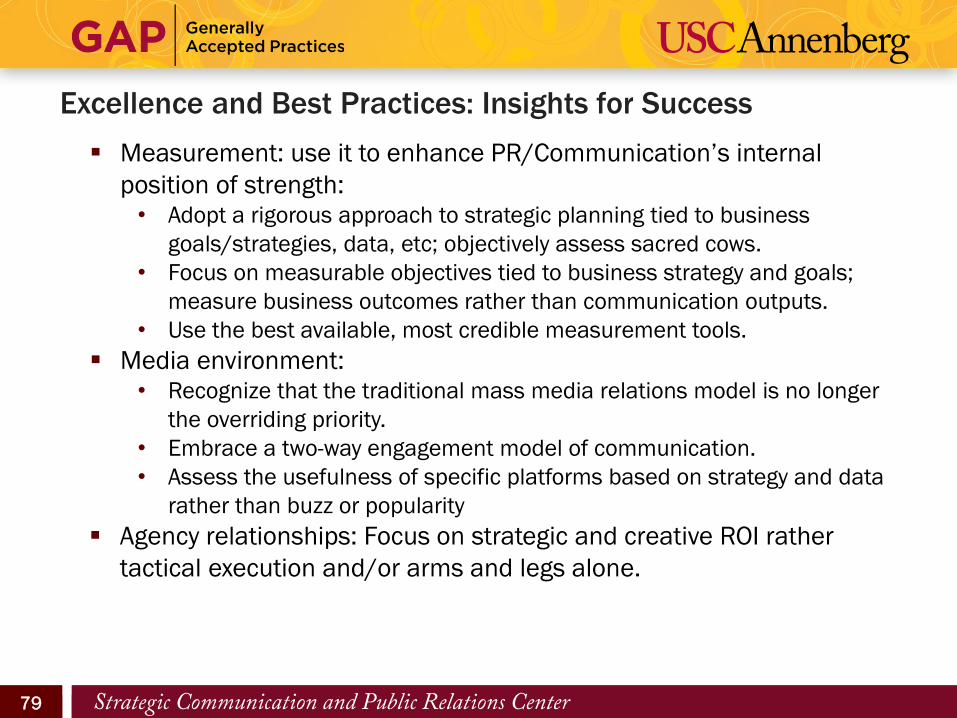
Excellence and Best Practices: Insights for Success
Measurement: use it to enhance PR/Communication’s internal
position of strength: • Adopt a rigorous approach to strategic planning tied to business
goals/strategies, data, etc; objectively assess sacred cows.
• Focus on measurable objectives tied to business strategy and goals;
measure business outcomes rather than communication outputs.
• Use the best available, most credible measurement tools.
Media environment: • Recognize that the traditional mass media relations model is no longer
the overriding priority.
• Embrace a two-way engagement model of communication.
• Assess the usefulness of specific platforms based on strategy and data
rather than buzz or popularity
Agency relationships: Focus on strategic and creative ROI rather
tactical execution and/or arms and legs alone.
80 80 80
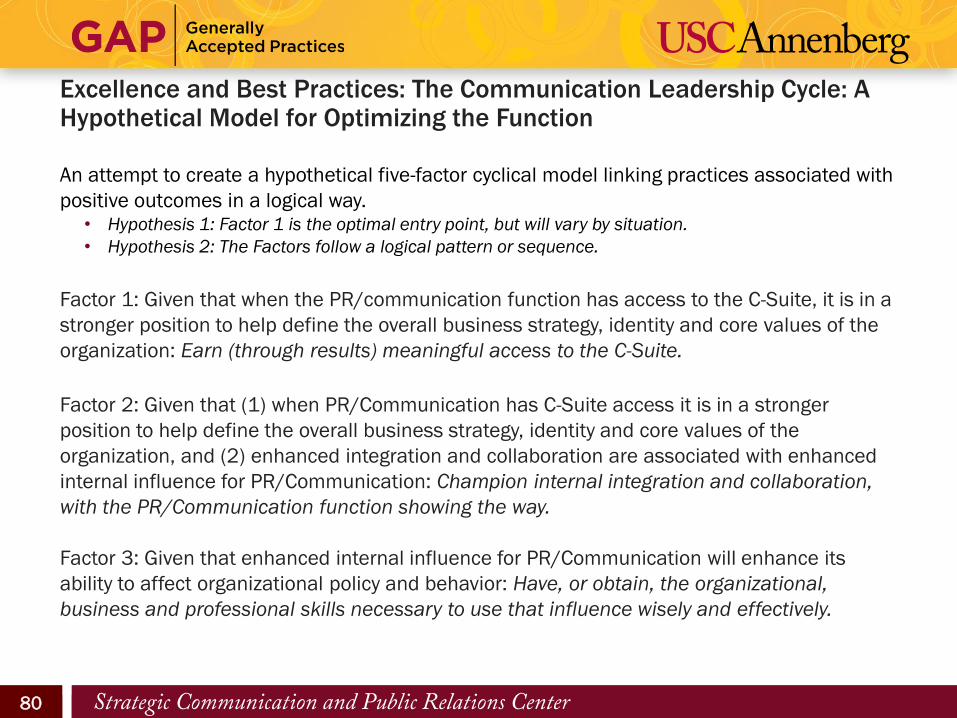
Excellence and Best Practices: The Communication Leadership Cycle: A Hypothetical Model for Optimizing the Function
An attempt to create a hypothetical five-factor cyclical model linking practices associated with
positive outcomes in a logical way. • Hypothesis 1: Factor 1 is the optimal entry point, but will vary by situation.
• Hypothesis 2: The Factors follow a logical pattern or sequence.
Factor 1: Given that when the PR/communication function has access to the C-Suite, it is in a
stronger position to help define the overall business strategy, identity and core values of the
organization: Earn (through results) meaningful access to the C-Suite.
Factor 2: Given that (1) when PR/Communication has C-Suite access it is in a stronger
position to help define the overall business strategy, identity and core values of the
organization, and (2) enhanced integration and collaboration are associated with enhanced
internal influence for PR/Communication: Champion internal integration and collaboration,
with the PR/Communication function showing the way.
Factor 3: Given that enhanced internal influence for PR/Communication will enhance its
ability to affect organizational policy and behavior: Have, or obtain, the organizational,
business and professional skills necessary to use that influence wisely and effectively.
81 81 81
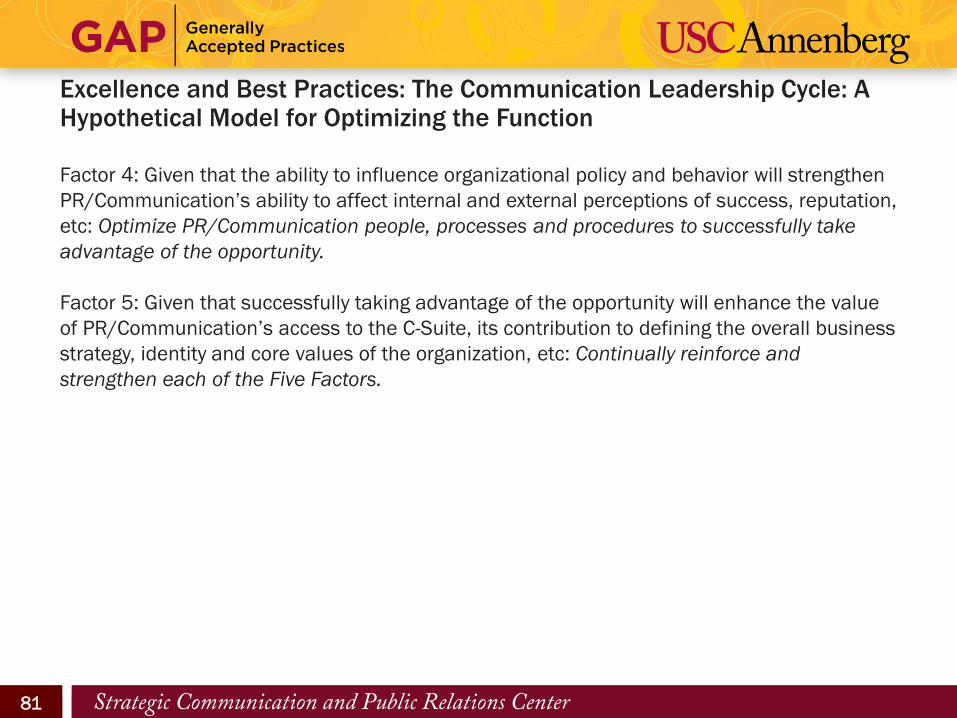
Excellence and Best Practices: The Communication Leadership Cycle: A Hypothetical Model for Optimizing the Function
Factor 4: Given that the ability to influence organizational policy and behavior will strengthen
PR/Communication’s ability to affect internal and external perceptions of success, reputation,
etc: Optimize PR/Communication people, processes and procedures to successfully take
advantage of the opportunity.
Factor 5: Given that successfully taking advantage of the opportunity will enhance the value
of PR/Communication’s access to the C-Suite, its contribution to defining the overall business
strategy, identity and core values of the organization, etc: Continually reinforce and
strengthen each of the Five Factors.
82 82 82 82
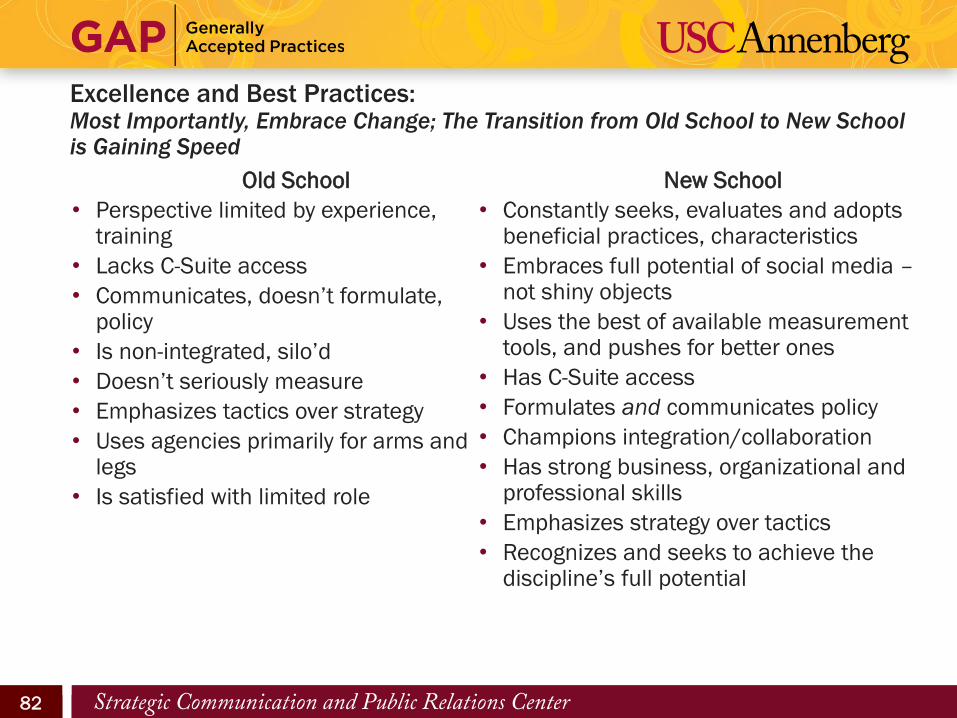
Excellence and Best Practices: Most Importantly, Embrace Change; The Transition from Old School to New School is Gaining Speed
Old School
• Perspective limited by experience, training
• Lacks C-Suite access
• Communicates, doesn’t formulate, policy
• Is non-integrated, silo’d
• Doesn’t seriously measure
• Emphasizes tactics over strategy
• Uses agencies primarily for arms and legs
• Is satisfied with limited role
New School
• Constantly seeks, evaluates and adopts beneficial practices, characteristics
• Embraces full potential of social media – not shiny objects
• Uses the best of available measurement tools, and pushes for better ones
• Has C-Suite access
• Formulates and communicates policy
• Champions integration/collaboration
• Has strong business, organizational and professional skills
• Emphasizes strategy over tactics
• Recognizes and seeks to achieve the discipline’s full potential
83 83 83
FIN