Embed Size (px)
Citation preview
ISSN: 2278-3369
International Journal of Advances in Management and Economics
Available online at www.managementjournal.info
RESEARCH ARTICLE
Mantovani Daielly Mn et. al.| Sep.-Oct. 2013 | Vol.2 | Issue 5|30-39 30
Quality Gap Analysis on Education Services
Mantovani Daielly MN1*, Gouvea Maria A2, Conejero Marco A3
1 Business Department, Faculdades Metropolitanas Unidas (FMU), Brazil.
2 Business Department, University of São Paulo (USP), Brazil.
3 Business Department, College of Campo Limpo Paulista (FACAMP), Brazil.
*Corresponding Author: E-mail: [email protected]
Abstract
Services quality has been studied since the 80’s, however only recently education services have been considered
under this theoretical approach. Education may be considered as a service since local and global competition have
been becoming stronger and higher education institutions are forced toadopt a market-oriented vision in order to
keep their performance levels and to satisfy their students. This articleaims to assessquality gaps of adistance
Public Administration undergraduate course. Therefore, we applied a quality gaps model to ten courses belonging to
the Open University system in Brazil, researching course coordinatorsand students. Themulti-methods
researchnoticed that institutionsgenerallydo not adopta market-oriented model for decision-making in their courses
and, therefore do not own a well-defined process to identify students’ expectations and, consequently,to create
quality strategies andpoliciesbased on theseexpectations. On the otherhand, althoughhigher educationis
legallyregulatedby the Ministry ofEducation, institutions seekdifferentiation in the market byhiring and retaining
qualified and caring personnel and by thedevelopment ofinnovativeandexcitinglearning activitiesthat
stimulatestudent motivation. These actions are strategically differentiated and help reducing barriers related to
distance education. Theinfrastructure which is vital to thesuccess of atechnology-based courseis, still,a
limitationinremote areas.Finally, a t-test showed there was a favorableperception of quality for both students
andcoordinators, but the latterwere moreoptimistic.
Keywords: Distance education, Education services, Gap analysis, Services marketing; Services quality.
Introduction
The study of services quality date of 1980’s. These
studies began with Parasuraman, Zeithaml and
Berry published papers. Until then quality used
to be studied only by operations field, which focus
on tangible products quality. In operations quality
means the absence of defects or compliance with
the requirements of production [1].
Operations approach to quality assessment
proved inadequate for the study of services, given
its peculiar characteristics: intangibility,
heterogeneity and inseparability .Intangibility
means the inability to account for, store and test a
service before its delivery. The heterogeneity
comes from the intrinsic variability of the service,
it means, a service will have different
performance depending on the service provider,
the client engagement and the context in which
service is provided. Finally, inseparability
concerns to the fact that a service is consumed
simultaneously to its production. These unique
characteristics make it difficult to assess quality
for a service [1].
Parasuraman et al. were pioneers in assessing
quality in services.Their approach was so
successful that it has been used since the 80’s. For
the authors, unlike tangible products, the quality
of a service refers to the perception customers
have about it[1] and this perception occurs during
the interaction between the client and the service
provider [2].
Under this perspective, perceived quality is
measured by the difference between the perceived
performance of a service and the initial
expectations about it (service quality = perception
of service performance - expectations about the
service). This approach considers that
expectations refer to the service desired by the
customer and the minimum level of service
acceptable in his/her point of view. Then, a zone of
Available online at www.managementjournal.info
Mantovani Daielly Mn et. al.| Sep.-Oct. 2013 | Vol.2 | Issue 5|30-39 31
tolerance is created, determining satisfactory and
acceptable levels of service [3].Difference between
perception of service performance and initial
expectations gave rise to what is called “gaps
model of service quality”, the object of this study.
Pioneer studies focused on banking services
quality, credit card and maintenance services [1].
Services quality assessment became popular and
other services began to be studied in the same
light. Higher education can be understood under
services point of view, since education market has
become client-oriented (considering student as a
client). This means education market is no longer
purely education-oriented (pedagogy-oriented),
which makes it possible to consider education
institutions as providers of educational products
and services [4]. It is important to note that
education is not a common service, like banking or
restaurant services, since it owns a key role in
society and has a non-business mission to develop
criticalcitizens. Education core mission is social,
non-commercial; it means education aims to
develop better human beings and better citizens
[5].
Higher education institutions (HEIs) have been
facing fierce local and global competition, besides
of challenges, such as high dropout rates and
limited understanding of the market and
students’ needs. Online distance education has
outstanding participation in increasing
competitiveness among institutions around the
world, which makes the market-oriented
approach feasible for education comprehension
[6].
In Brazil, distance education has been gaining
importance. In 2010, 14.6 % of college students
were attending distance education course,
compared to just 0.2 % in 2002 [7]. This scenario
can be explained by the expansion of education in
Brazil, with the creation of new institutions,
creation of new vacancies and creation of the
Open University of Brazil (UAB), subject matter
of the article. Distance education, for its peculiar
characteristics (space and temporal separation
between instructor and student, technology
intensive use, learner empowerment etc.) faces its
own challenges, such as student motivation
difficulties, high dropout rates and time
management trouble.
Given social importance of education, the growing
role of distance education in Brazil and the
challenges faced by this modality, the purpose of
this article is to assess quality gaps in a distance
education undergraduate course. We studied
Public Administration undergraduate distance
course from the Open University of Brazil, using
the perspective of services quality. Thus, we
compared students’ and managers’ (course
coordinators) perceptions about the education
services provided. We collected data from
institutions belonging to UAB project and applied
both qualitative and quantitative methods in a
multi-method research approach.
Quality Gaps
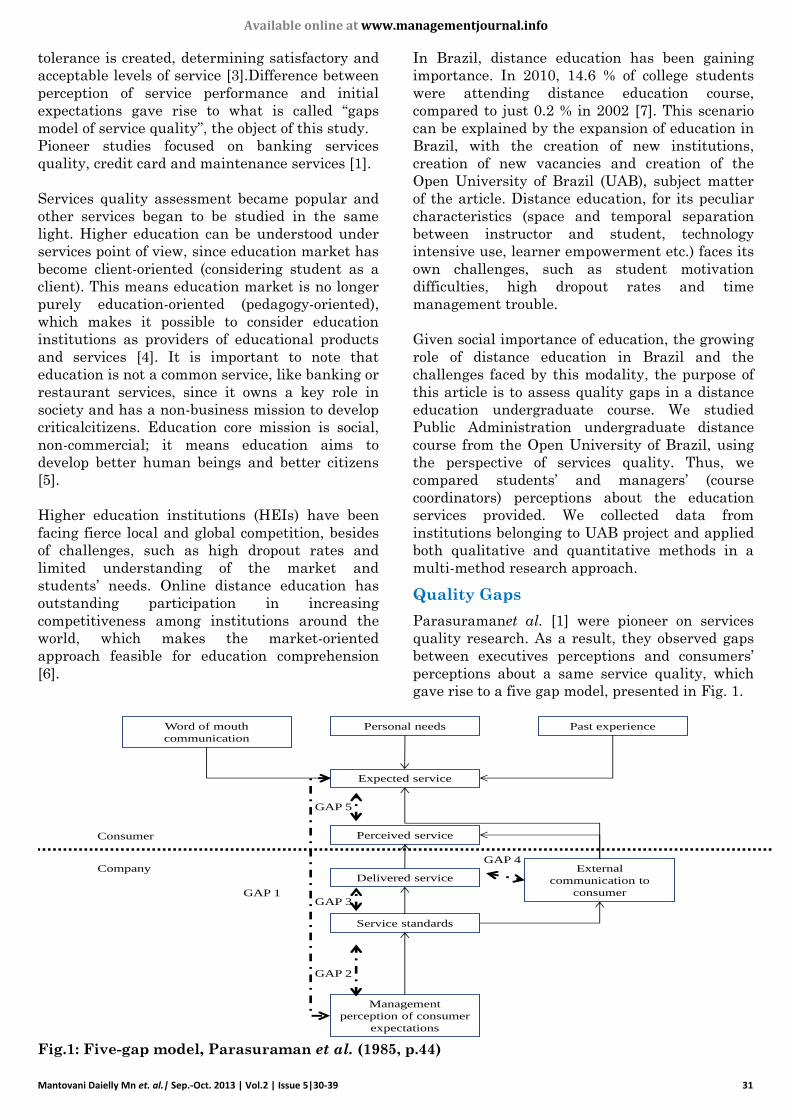
Parasuramanet al. [1] were pioneer on services
quality research. As a result, they observed gaps
between executives perceptions and consumers’
perceptions about a same service quality, which
gave rise to a five gap model, presented in Fig. 1.
Word of mouth
communication
Personal needs Past experience
Expected service
Delivered service
Perceived service
Service standards
External
communication to
consumer
Management
perception of consumer
expectations
Consumer
Company
GAP 1
GAP 2
GAP 3
GAP 4
GAP 5
Fig.1: Five-gap model, Parasuraman et al. (1985, p.44)
Available online at www.managementjournal.info
Mantovani Daielly Mn et. al.| Sep.-Oct. 2013 | Vol.2 | Issue 5|30-39 32
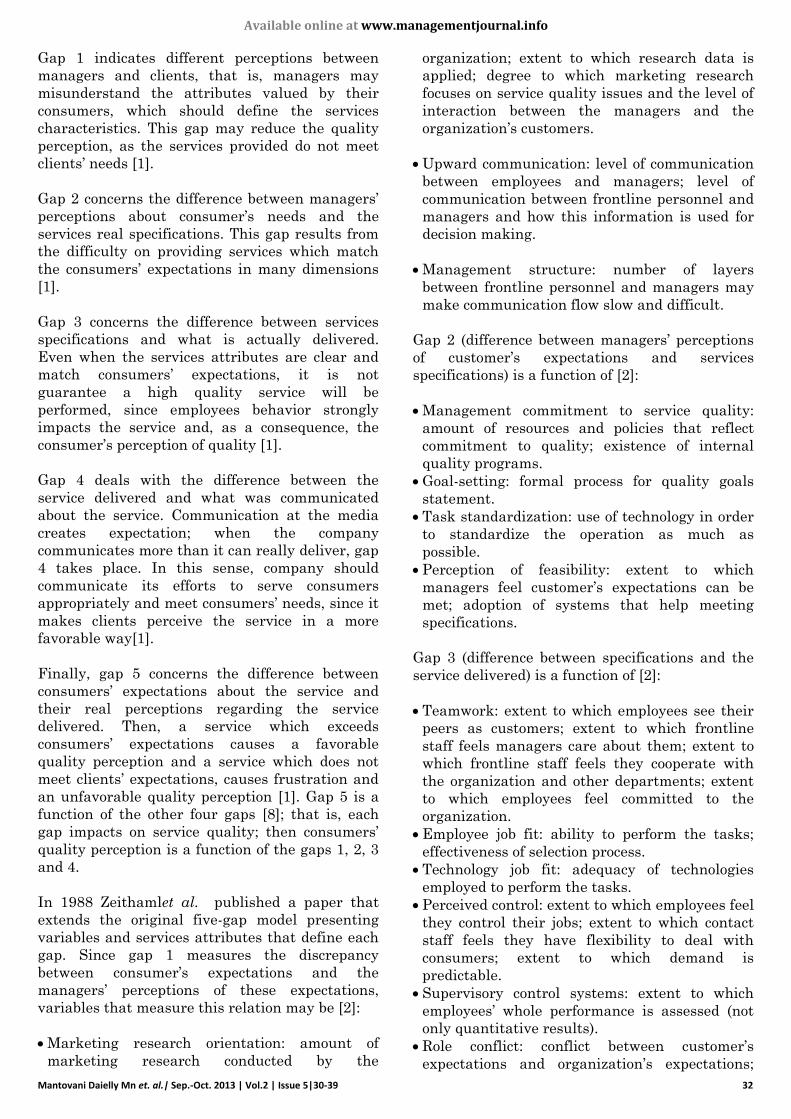
Gap 1 indicates different perceptions between
managers and clients, that is, managers may
misunderstand the attributes valued by their
consumers, which should define the services
characteristics. This gap may reduce the quality
perception, as the services provided do not meet
clients’ needs [1].
Gap 2 concerns the difference between managers’
perceptions about consumer’s needs and the
services real specifications. This gap results from
the difficulty on providing services which match
the consumers’ expectations in many dimensions
[1].
Gap 3 concerns the difference between services
specifications and what is actually delivered.
Even when the services attributes are clear and
match consumers’ expectations, it is not
guarantee a high quality service will be
performed, since employees behavior strongly
impacts the service and, as a consequence, the
consumer’s perception of quality [1].
Gap 4 deals with the difference between the
service delivered and what was communicated
about the service. Communication at the media
creates expectation; when the company
communicates more than it can really deliver, gap
4 takes place. In this sense, company should
communicate its efforts to serve consumers
appropriately and meet consumers’ needs, since it
makes clients perceive the service in a more
favorable way[1].
Finally, gap 5 concerns the difference between
consumers’ expectations about the service and
their real perceptions regarding the service
delivered. Then, a service which exceeds
consumers’ expectations causes a favorable
quality perception and a service which does not
meet clients’ expectations, causes frustration and
an unfavorable quality perception [1]. Gap 5 is a
function of the other four gaps [8]; that is, each
gap impacts on service quality; then consumers’
quality perception is a function of the gaps 1, 2, 3
and 4.
In 1988 Zeithamlet al. published a paper that
extends the original five-gap model presenting
variables and services attributes that define each
gap. Since gap 1 measures the discrepancy
between consumer’s expectations and the
managers’ perceptions of these expectations,
variables that measure this relation may be [2]:
Marketing research orientation: amount of
marketing research conducted by the
organization; extent to which research data is
applied; degree to which marketing research
focuses on service quality issues and the level of
interaction between the managers and the
organization’s customers.
Upward communication: level of communication
between employees and managers; level of
communication between frontline personnel and
managers and how this information is used for
decision making.
Management structure: number of layers
between frontline personnel and managers may
make communication flow slow and difficult.
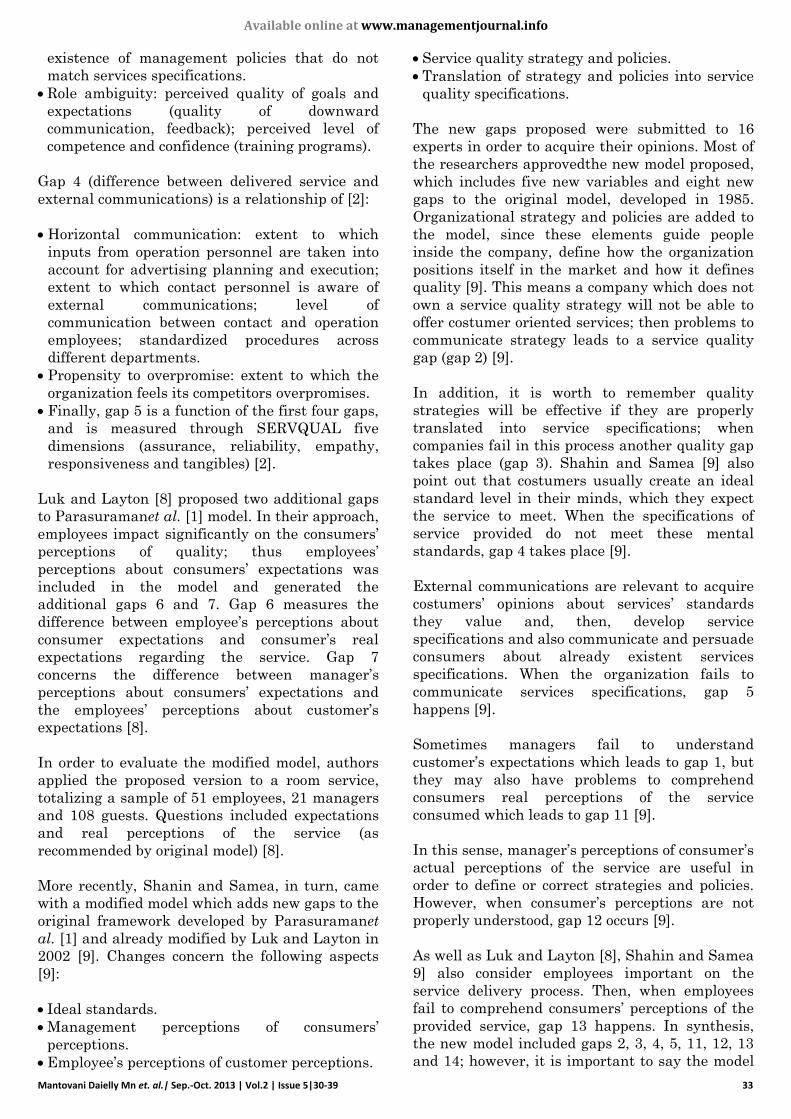
Gap 2 (difference between managers’ perceptions
of customer’s expectations and services
specifications) is a function of [2]:
Management commitment to service quality:
amount of resources and policies that reflect
commitment to quality; existence of internal
quality programs.
Goal-setting: formal process for quality goals
statement.
Task standardization: use of technology in order
to standardize the operation as much as
possible.
Perception of feasibility: extent to which
managers feel customer’s expectations can be
met; adoption of systems that help meeting
specifications.
Gap 3 (difference between specifications and the
service delivered) is a function of [2]:
Teamwork: extent to which employees see their
peers as customers; extent to which frontline
staff feels managers care about them; extent to
which frontline staff feels they cooperate with
the organization and other departments; extent
to which employees feel committed to the
organization.
Employee job fit: ability to perform the tasks;
effectiveness of selection process.
Technology job fit: adequacy of technologies
employed to perform the tasks.
Perceived control: extent to which employees feel
they control their jobs; extent to which contact
staff feels they have flexibility to deal with
consumers; extent to which demand is
predictable.
Supervisory control systems: extent to which
employees’ whole performance is assessed (not
only quantitative results).
Role conflict: conflict between customer’s
expectations and organization’s expectations;
Available online at www.managementjournal.info
Mantovani Daielly Mn et. al.| Sep.-Oct. 2013 | Vol.2 | Issue 5|30-39 33
existence of management policies that do not
match services specifications.
Role ambiguity: perceived quality of goals and
expectations (quality of downward
communication, feedback); perceived level of
competence and confidence (training programs).
Gap 4 (difference between delivered service and
external communications) is a relationship of [2]:
Horizontal communication: extent to which
inputs from operation personnel are taken into
account for advertising planning and execution;
extent to which contact personnel is aware of
external communications; level of
communication between contact and operation
employees; standardized procedures across
different departments.
Propensity to overpromise: extent to which the
organization feels its competitors overpromises.
Finally, gap 5 is a function of the first four gaps,
and is measured through SERVQUAL five
dimensions (assurance, reliability, empathy,
responsiveness and tangibles) [2].
Luk and Layton [8] proposed two additional gaps
to Parasuramanet al. [1] model. In their approach,
employees impact significantly on the consumers’
perceptions of quality; thus employees’
perceptions about consumers’ expectations was
included in the model and generated the
additional gaps 6 and 7. Gap 6 measures the
difference between employee’s perceptions about
consumer expectations and consumer’s real
expectations regarding the service. Gap 7
concerns the difference between manager’s
perceptions about consumers’ expectations and
the employees’ perceptions about customer’s
expectations [8].
In order to evaluate the modified model, authors
applied the proposed version to a room service,
totalizing a sample of 51 employees, 21 managers
and 108 guests. Questions included expectations
and real perceptions of the service (as
recommended by original model) [8].
More recently, Shanin and Samea, in turn, came
with a modified model which adds new gaps to the
original framework developed by Parasuramanet
al. [1] and already modified by Luk and Layton in
2002 [9]. Changes concern the following aspects
[9]:
Ideal standards.
Management perceptions of consumers’
perceptions.
Employee’s perceptions of customer perceptions.
Service quality strategy and policies.
Translation of strategy and policies into service
quality specifications.
The new gaps proposed were submitted to 16
experts in order to acquire their opinions. Most of
the researchers approvedthe new model proposed,
which includes five new variables and eight new
gaps to the original model, developed in 1985.
Organizational strategy and policies are added to
the model, since these elements guide people
inside the company, define how the organization
positions itself in the market and how it defines
quality [9]. This means a company which does not
own a service quality strategy will not be able to
offer costumer oriented services; then problems to
communicate strategy leads to a service quality
gap (gap 2) [9].
In addition, it is worth to remember quality
strategies will be effective if they are properly
translated into service specifications; when
companies fail in this process another quality gap
takes place (gap 3). Shahin and Samea [9] also
point out that costumers usually create an ideal
standard level in their minds, which they expect
the service to meet. When the specifications of
service provided do not meet these mental
standards, gap 4 takes place [9].
External communications are relevant to acquire
costumers’ opinions about services’ standards
they value and, then, develop service
specifications and also communicate and persuade
consumers about already existent services
specifications. When the organization fails to
communicate services specifications, gap 5
happens [9].
Sometimes managers fail to understand
customer’s expectations which leads to gap 1, but
they may also have problems to comprehend
consumers real perceptions of the service
consumed which leads to gap 11 [9].
In this sense, manager’s perceptions of consumer’s
actual perceptions of the service are useful in
order to define or correct strategies and policies.
However, when consumer’s perceptions are not
properly understood, gap 12 occurs [9].
As well as Luk and Layton [8], Shahin and Samea
9] also consider employees important on the
service delivery process. Then, when employees
fail to comprehend consumers’ perceptions of the
provided service, gap 13 happens. In synthesis,
the new model included gaps 2, 3, 4, 5, 11, 12, 13
and 14; however, it is important to say the model

Available online at www.managementjournal.info
Mantovani Daielly Mn et. al.| Sep.-Oct. 2013 | Vol.2 | Issue 5|30-39 34
was not applied to a real data basis; so it is
necessary to validate it in order to evaluate its
accuracy [9]. Present research proposes to analyze
some of the proposed gaps in an education service.
The 14 gaps are summarized below and can be
observed on Fig. 2 [9].
Gap 1: difference between employees’
perceptions of customer’s perceptions and the
service delivered.
Gap 2: difference between management
perception of customer expectations and quality
strategy.
Gap 3: difference between quality strategy and
service quality specifications.
Gap 4: difference between costumer’s ideal
standards and services actual specifications.
Gap 5: difference between external
communications and services specifications.
Gap 6: difference between service specification
and service delivered.
Gap 7: difference between external
communication and service delivered.
Gap 8: difference between expected service and
perceived service.
Gap 9: difference between expected service and
employees’ perceptions of customer’s
expectations.
Gap 10: difference between employees’
perceptions of consumer’s expectations and
management perceptions of customers’
expectations.
Gap 11: difference between consumer’s
perceptions of the service and manager’s
perceptions of customer’s perceptions.
Gap 12: difference between managers’
perceptions of customer’s perceptions and
service strategy.
Gap 13: difference between customer’s
perceptions about the service and employees’
perceptions about customers’ perceptions.
Gap 14: difference between management
perceptions of customer’s perceptions and
employees’ perceptions of customer’s
perceptions.
Method
A search can take different designs on a
continuum ranging from purely qualitative
research to purely quantitative research. Between
the extremes (qualitative and quantitative) are
multi-methods research, which mixes qualitative
and quantitative approaches for data gathering
and analysis [10].
This study aimed to evaluate quality gaps
observed in education services provided by Public
Administration undergraduate distance course
Fig.2: 14 Gap model, (Shahin; Samea, 2010, p.11)
Available online at www.managementjournal.info
Mantovani Daielly Mn et. al.| Sep.-Oct. 2013 | Vol.2 | Issue 5|30-39 35
from the Open University of Brazil. To reach that
goal we carried out a survey design with multi-
methods approach, we used qualitative and
quantitative techniques for data collection and
data analysis.
Gap quality assessment was performed by
comparing perceptions Public Administration
students and the respective course
coordinators.UAB undergraduate distance course
(Public Administration), at data gathering time
(first semester of 2012), was offered by 36
Brazilian public universities [12]. UAB system
uses federal and state universities infra-structure
and personnel, which offer traditional higher
education courses, to offer distance courses under
UAB brand and management. All of the 36
institutions were contacted and invited to
participate in the survey, but only ten of them
accepted participation (for confidentiality
purposes institutionsare named A to J in this
paper). For each institution course coordinator
was interviewed was asked to attribute a degree
of agreement (five points Likert scale, where one
means complete disagreement and five means full
agreement)to five service dimensions (reliability,
assurance, empathy, tangibles, responsiveness)
and service’s overall quality; they were also asked
to describe specific characteristics of services
provided by their institutions.
Students from each institution were invited by
the coordinator to participate of an online survey.
Students were sent a link to an electronic
questionnaire containing questions measured on a
five-point Likert scale, related to the five
dimensions of services quality (portal content,
reliability, responsiveness, assurance and
empathy) as well. Survey instrument was adapted
from the work of Udo et al . and 593 valid
questionnaires were obtained from students.Udo
et al. adapted original SERVQUAL variables for
distance education services [11].
Although the model of quality gaps and Samea
Shanin [9] presents 14 gap, this paper aimed to
assess only some of the gaps in the proposed
model, due to the great difficulty in obtaining
data for the evaluation of all gaps. We evaluated
the following gaps:
Gap 2: difference between management
perception of customer expectations and quality
strategy.
Gap 6: difference between service specification
and service delivered.
Gap 7: difference between external
communication and service delivered.
Gap 11: difference between consumer’s
perceptions of the service and manager’s
perceptions of customer’s perceptions.
In this sense, some hypotheses can be evaluated:
H1: There is no gap between manager perception
about student’s expectations and institution’s
strategies and policies for quality.
H2: There is no gap between service’s
specifications and the actual delivered service.
H3: There is no gap between actual service
delivered and external communications.
H4: There is no quality gap between student’s
perceptions of service delivered and coordinator’s
perceptions about student’s perceptions.
Evidences for analyzing hypothesis 1 to 3 are
qualitative and were obtained through deep
interview with course managers. On the other
hand, gap 11 (hypothesis 4) was assessed through
a one sample t-test, considering 5% significance
level. It is worth to notice parametric tests
suppose normal distribution, which was tested
through a Kolmogorov-Smirnov univariate test.
Results
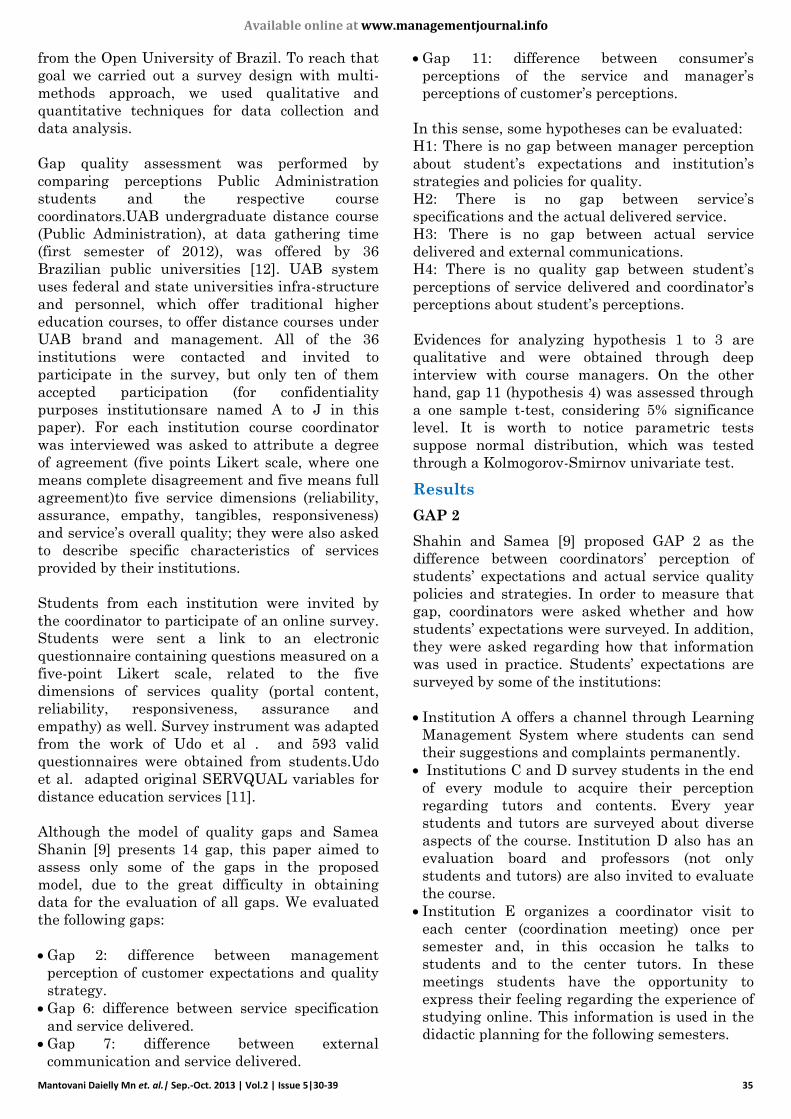
GAP 2
Shahin and Samea [9] proposed GAP 2 as the
difference between coordinators’ perception of
students’ expectations and actual service quality
policies and strategies. In order to measure that
gap, coordinators were asked whether and how
students’ expectations were surveyed. In addition,
they were asked regarding how that information
was used in practice. Students’ expectations are
surveyed by some of the institutions:
Institution A offers a channel through Learning
Management System where students can send
their suggestions and complaints permanently.
Institutions C and D survey students in the end
of every module to acquire their perception
regarding tutors and contents. Every year
students and tutors are surveyed about diverse
aspects of the course. Institution D also has an
evaluation board and professors (not only
students and tutors) are also invited to evaluate
the course.
Institution E organizes a coordinator visit to
each center (coordination meeting) once per
semester and, in this occasion he talks to
students and to the center tutors. In these
meetings students have the opportunity to
express their feeling regarding the experience of
studying online. This information is used in the
didactic planning for the following semesters.
Available online at www.managementjournal.info
Mantovani Daielly Mn et. al.| Sep.-Oct. 2013 | Vol.2 | Issue 5|30-39 36
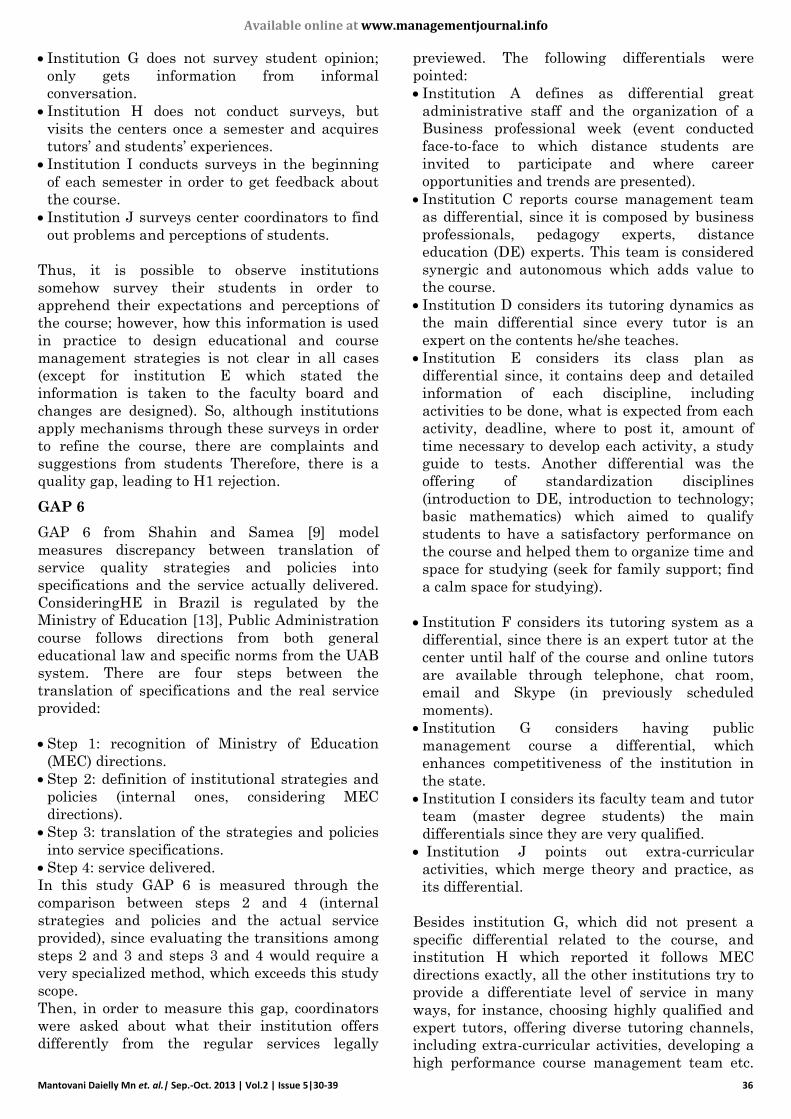
Institution G does not survey student opinion;
only gets information from informal
conversation.
Institution H does not conduct surveys, but
visits the centers once a semester and acquires
tutors’ and students’ experiences.
Institution I conducts surveys in the beginning
of each semester in order to get feedback about
the course.
Institution J surveys center coordinators to find
out problems and perceptions of students.
Thus, it is possible to observe institutions
somehow survey their students in order to
apprehend their expectations and perceptions of
the course; however, how this information is used
in practice to design educational and course
management strategies is not clear in all cases
(except for institution E which stated the
information is taken to the faculty board and
changes are designed). So, although institutions
apply mechanisms through these surveys in order
to refine the course, there are complaints and
suggestions from students Therefore, there is a
quality gap, leading to H1 rejection.
GAP 6
GAP 6 from Shahin and Samea [9] model
measures discrepancy between translation of
service quality strategies and policies into
specifications and the service actually delivered.
ConsideringHE in Brazil is regulated by the
Ministry of Education [13], Public Administration
course follows directions from both general
educational law and specific norms from the UAB
system. There are four steps between the
translation of specifications and the real service
provided:
Step 1: recognition of Ministry of Education
(MEC) directions.
Step 2: definition of institutional strategies and
policies (internal ones, considering MEC
directions).
Step 3: translation of the strategies and policies
into service specifications.
Step 4: service delivered.
In this study GAP 6 is measured through the
comparison between steps 2 and 4 (internal
strategies and policies and the actual service
provided), since evaluating the transitions among
steps 2 and 3 and steps 3 and 4 would require a
very specialized method, which exceeds this study
scope.
Then, in order to measure this gap, coordinators
were asked about what their institution offers
differently from the regular services legally
previewed. The following differentials were
pointed:
Institution A defines as differential great
administrative staff and the organization of a
Business professional week (event conducted
face-to-face to which distance students are
invited to participate and where career
opportunities and trends are presented).
Institution C reports course management team
as differential, since it is composed by business
professionals, pedagogy experts, distance
education (DE) experts. This team is considered
synergic and autonomous which adds value to
the course.
Institution D considers its tutoring dynamics as
the main differential since every tutor is an
expert on the contents he/she teaches.
Institution E considers its class plan as
differential since, it contains deep and detailed
information of each discipline, including
activities to be done, what is expected from each
activity, deadline, where to post it, amount of
time necessary to develop each activity, a study
guide to tests. Another differential was the
offering of standardization disciplines
(introduction to DE, introduction to technology;
basic mathematics) which aimed to qualify
students to have a satisfactory performance on
the course and helped them to organize time and
space for studying (seek for family support; find
a calm space for studying).
Institution F considers its tutoring system as a
differential, since there is an expert tutor at the
center until half of the course and online tutors
are available through telephone, chat room,
email and Skype (in previously scheduled
moments).
Institution G considers having public
management course a differential, which
enhances competitiveness of the institution in
the state.
Institution I considers its faculty team and tutor
team (master degree students) the main
differentials since they are very qualified.
Institution J points out extra-curricular
activities, which merge theory and practice, as
its differential.
Besides institution G, which did not present a
specific differential related to the course, and
institution H which reported it follows MEC
directions exactly, all the other institutions try to
provide a differentiate level of service in many
ways, for instance, choosing highly qualified and
expert tutors, offering diverse tutoring channels,
including extra-curricular activities, developing a
high performance course management team etc.
Available online at www.managementjournal.info
Mantovani Daielly Mn et. al.| Sep.-Oct. 2013 | Vol.2 | Issue 5|30-39 37
This suggests GAP 6 happens; however, it is a
positive gap, showing institutions are concerned
about the service provided (H2 is rejected).
GAP7
GAP 7 tries to identify whether the service
delivered is according to external
communications; that is, whether the service
delivers what was announced in the press and in
official communications. In order to measure this
gap, coordinators were asked whether something
previewed on the course project was not
implemented. All the institutions reported that
since implementation follows MEC orientations,
only activities planned to happen in the last
semesters were not implemented, as classes are
still in course, for instance, internship and
conclusion dissertation work which aim to guide
students to an area of expertise (government
management, municipal management, health
system management) and will take place in the
previewed semesters. However, the UAB website
published, support centers should have
appropriate infrastructure provided by local city
halls or state government. Coordinators
mentioned during the interviews that
infrastructure is an issue specially in remote
areas from every state. Thus it suggests there is a
quality gap (GAP7), in a negative direction; in
other words, communication offers a higher level
of service than that really provided. This leads to
the rejection of H3.
GAP 11
Students showed positive opinions on course
quality, satisfaction, loyalty, image and
institutional support. Coordinators also reported
strengths and weaknesses they can identify in the
courses. Specifically considering quality
assessment, quality gap model was applied in
order to identify differences between students’
and coordinators’ opinions regarding the course.
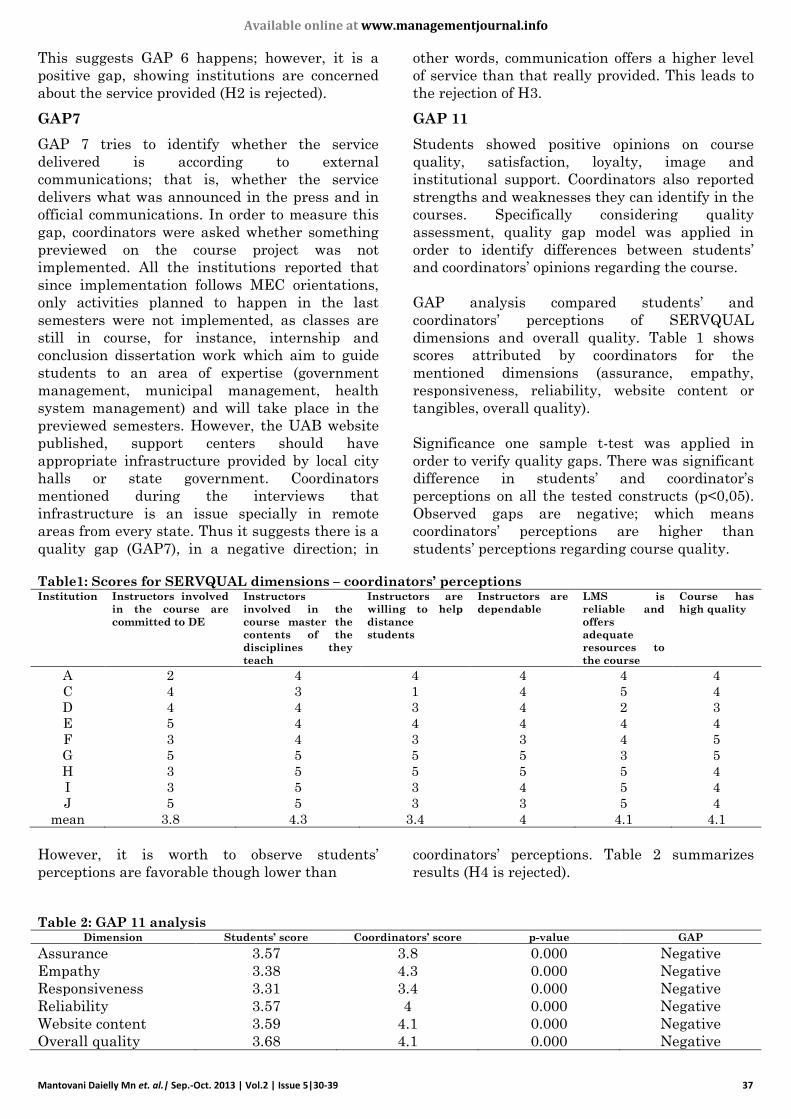
GAP analysis compared students’ and
coordinators’ perceptions of SERVQUAL
dimensions and overall quality. Table 1 shows
scores attributed by coordinators for the
mentioned dimensions (assurance, empathy,
responsiveness, reliability, website content or
tangibles, overall quality).
Significance one sample t-test was applied in
order to verify quality gaps. There was significant
difference in students’ and coordinator’s
perceptions on all the tested constructs (p<0,05).
Observed gaps are negative; which means
coordinators’ perceptions are higher than
students’ perceptions regarding course quality.
Table1: Scores for SERVQUAL dimensions – coordinators’ perceptions Institution Instructors involved
in the course are
committed to DE
Instructors
involved in the
course master the
contents of the
disciplines they
teach
Instructors are
willing to help
distance
students
Instructors are
dependable
LMS is
reliable and
offers
adequate
resources to
the course
Course has
high quality
A 2 4 4 4 4 4
C 4 3 1 4 5 4
D 4 4 3 4 2 3
E 5 4 4 4 4 4
F 3 4 3 3 4 5
G 5 5 5 5 3 5
H 3 5 5 5 5 4
I 3 5 3 4 5 4
J 5 5 3 3 5 4
mean 3.8 4.3 3.4 4 4.1 4.1
However, it is worth to observe students’
perceptions are favorable though lower than
coordinators’ perceptions. Table 2 summarizes
results (H4 is rejected).
Table 2: GAP 11 analysis Dimension Students’ score Coordinators’ score p-value GAP
Assurance 3.57 3.8 0.000 Negative
Empathy 3.38 4.3 0.000 Negative
Responsiveness 3.31 3.4 0.000 Negative
Reliability 3.57 4 0.000 Negative
Website content 3.59 4.1 0.000 Negative
Overall quality 3.68 4.1 0.000 Negative
Available online at www.managementjournal.info
Mantovani Daielly Mn et. al.| Sep.-Oct. 2013 | Vol.2 | Issue 5|30-39 38
Discussions
This paper aimed to assess quality gaps in
education services provided by a Public
Administration undergraduate distance course
from Brazil. Therefore, students and course
coordinators were surveyed. Ten institutions
participated on the study and their course
managers were depth interviewed as well as 593
students composed a final sample of our electronic
survey. In other words, the article proposes the
use of a business perspective to evaluate distance
education services, whereas this can be
considered a service, but with distinct
characteristics of other non-educational services.
From this perspective, education can be studied
through a market orientation lens, focusing on
high quality perception and, therefore, student
satisfaction and reducing levels of dropout and
high level of student motivation.
Collected data led to four quality gaps analysis,
considering expanded model proposed by Samea
and Shanin [9]. It was observed that the
educational institutions have not yet adopted the
business approach in their courses. They own a
well-structured process to identify students’
expectations and needs. In general, courses
strictly follow the guidelines from Brazilian
Ministry of Education and some institutions had
done some level of research to identify potential
and current problems, according to students and
teachers/tutors points of view.
However, even in those cases, where information
is gathered, it is not strategically used to outline
policies and action plans focusing on reaching
quality perception and satisfaction, as wells as
meeting students expectations. The report
indicates that coordinators, in general, collect
information, but there is no well structure system
to use information and make changes in course
and respond to environment demands.
Additionally, considering that every
undergraduate course in Brazil should follow
legal regulation from Ministry of Education, it
was observed that some institutions sought to
differentiate itself in the market by offering
highly qualified manpower (highly qualified
teachers and tutors, these professionals are
differentiated in both knowledge in their research
areas and in student assistance) and by
developing diverse educational activities, which
implies a positive gap.
It was also observed that there is a negative gap
in relation to what is communicated about the
course and what is actually offered. The official
UAB website indicates that the support centers
have appropriate infrastructure to distance course
which impliesintensive use of technology.
However, coordinators have reported difficulties
in terms of internet access in centers located in
remote areas of the country, which becomes an
obstacle and can harm course performance. Other
features disclosed are actually translated into
specifications of service .
Finally, when comparing students and managers
views of students aboutquality dimensions, we
observed favorable average score for coordinators
and students. However, the t-test of significance
states coordinators' opinion is more favorable
than students’, it means coordinators are more
optimistic than the students about quality in the
distance course, which can lead to erroneous
strategic decisions about the course.
The approach of service quality can be
incorporated into educational management,
complementing methods already used by
educational institutions, adding business insights
that help strategic positioning.A more market-
oriented approach is indicated for both public and
private institutions, since this strategy can help
them get differentiated in an increasingly
competitive context. It is noteworthy that
education is not a conventional service and its
social mission, which is to train and develop
human beings and citizens, should be primarily
taken into account in the design of management
processes.
The article provides interesting insights into the
use of a business perspective in the educational
context, giving input for strategic decision
making.
As a future study we propose the application of
the whole gap model (not only a few gaps) to other
education services cases, in both public and
private institutions. In addition, other education
services stake holders might be studied in order to
better understand quality gap, such as instructors
and support staff, then new gaps can be
discovered and an extended model might emerge.
Acknowledgements
CAPES (Coordination for Higher Education Personnel
Improvement) – BEX 4186/11-7.
References
1. Parasuraman A, Zeithaml VA, Berry LL (1985) A
conceptual model of service quality and its
implications for future research. J.
Marketing,49(4):41-50.
2. Zeithaml VA, Berry LL, Parasuraman (1988) A
communication and control processes in the delivery
of service quality. J. Marketing, 52(2):35.
Available online at www.managementjournal.info
Mantovani Daielly Mn et. al.| Sep.-Oct. 2013 | Vol.2 | Issue 5|30-39 39
3. Parasuraman A, Zeithaml VA, Berry LL (1994)
Reassessment of expectations as a comparison
standard in measuring service quality: Implications
for Further Research. J. Marketing, 58(1):111-24.
4. Kuo YK, Ye KD (2009) The causal relationship
between service quality, corporate image and
adults’ learning satisfaction and loyalty: A study of
professional training programmes in a Taiwanese
vocational institute. Total Quality Management &
Business Excellence,20(7):749-62.
5. Kenney MG, Khanfar NM (2009) Antecedents of
repurchase intention: propositions towards using
marketing strategy to mitigate the attrition of
online students. Services Marketing
Quarterly,30(3):270-86.
6. Celsi RL, Wolfinbarger M (2002) Discontinuous
Classroom innovation: Waves of change for
marketing education. J. Marketing
Education,24(1):64-72, 1 abr.
7. INEP. Instituto Nacional de Estudos e Pesquisas
Educacionais Anísio Teixeira. Censo da Educação
Superior 2010. Brasília, 2012. Available in:
<http://portal.inep.gov.br/web/censo-da-educacao-
superior>. Access in: jul.1st. 2012.
8. Luk STK, Layton R (2002) Perception Gaps in
Customer Expectations : Managers Versus Service
Providers and Customers. The Service Industries
Journal, 22(2):109-128.
9. Shahin A, Samea M (2010) Developing the Models
of Service Quality Gaps : A Critical Discussion.
Business Management and Strategy,1(1):1-12.
10. Creswell, John W (2009) Research design:
Qualitative, quantitative and mixed methods
approaches. Thousand Oaks: Sage, 3 ed, 260 p.
11. Udo GJ, Bagchi KK, Kirs PJ (2011) Using
SERVQUAL to assess the quality of e-learning
experience. Computers in Human Behavior,
27(3):1272-1283.
12. UAB – Universidade Aberta do Brasil. Available in:
<http://www.uab.capes.gov.br/>. Access in: sep. 18th
2013.
13. MEC-Ministério da Educação. Available in:
www.mec.gov.br. Access in: sep. 18th 2013.