Embed Size (px)
Citation preview
G.A.Prodi - INFN and Università di Trento, ItalyInternational Gravitational Event Collaboration
http://igec.lnl.infn.it
ALLEGRO group: ALLEGRO (LSU) http://gravity.phys.lsu.eduLouisiana State University, Baton Rouge - Louisiana
AURIGA group: AURIGA (INFN-LNL) http://www.auriga.lnl.infn.itINFN of Padova, Trento, Ferrara, Firenze, LNLUniversities of Padova, Trento, Ferrara, FirenzeIFN- CNR, Trento – Italia
NIOBE group: NIOBE (UWA) http://www.gravity.pd.uwa.edu.auUniversity of Western Australia, Perth, Australia
ROG group: EXPLORER (CERN) http://www.roma1.infn.it/rog/rogmain.htmlNAUTILUS (INFN-LNF)
INFN of Roma and LNFUniversities of Roma, L’AquilaCNR IFSI and IESS, Roma - Italia
Results of the 1997-2000 Search for Burst Gw by IGEC
GWDAW 2002
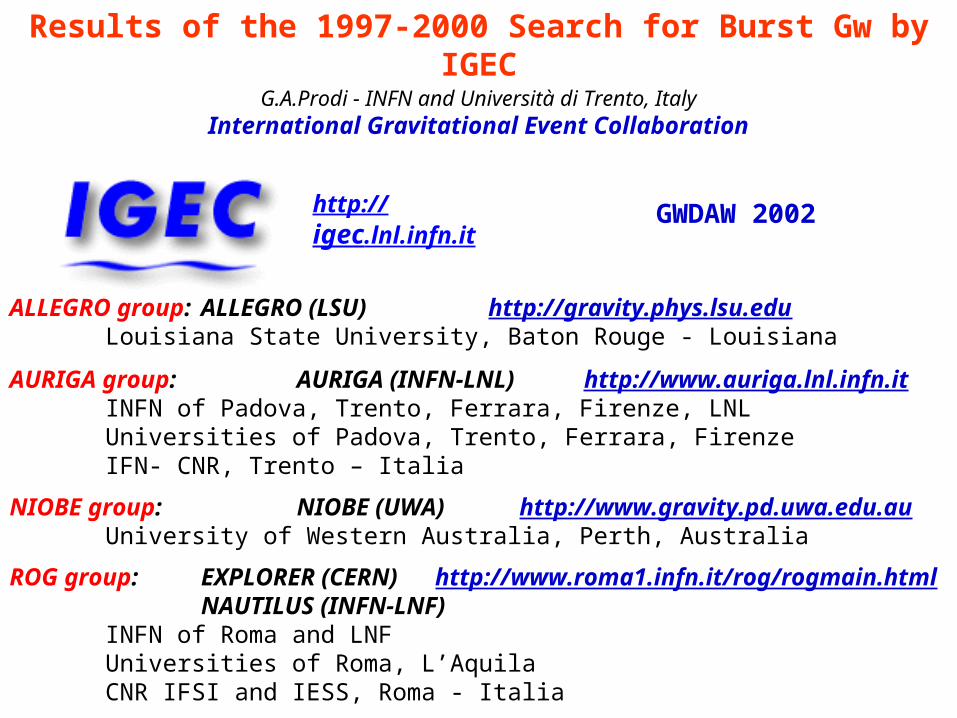
overview of the EXCHANGED DATA SET 1997-2000sensitivity and observation timecandidate burst gw events
OUTLINEGWDAW 2002
multiple detector DATA ANALYSISdirectional search strategy search as a function of amplitude threshold false dismissal or detection efficiencyestimation of accidental coincidences by time shifts
RESULTSaccidental coincidences are Poisson r.v.compatibility with null hypothesisupper limit on the rate of detected gw…unfolding the sources (not yet)
methods L.Baggio tomorrow
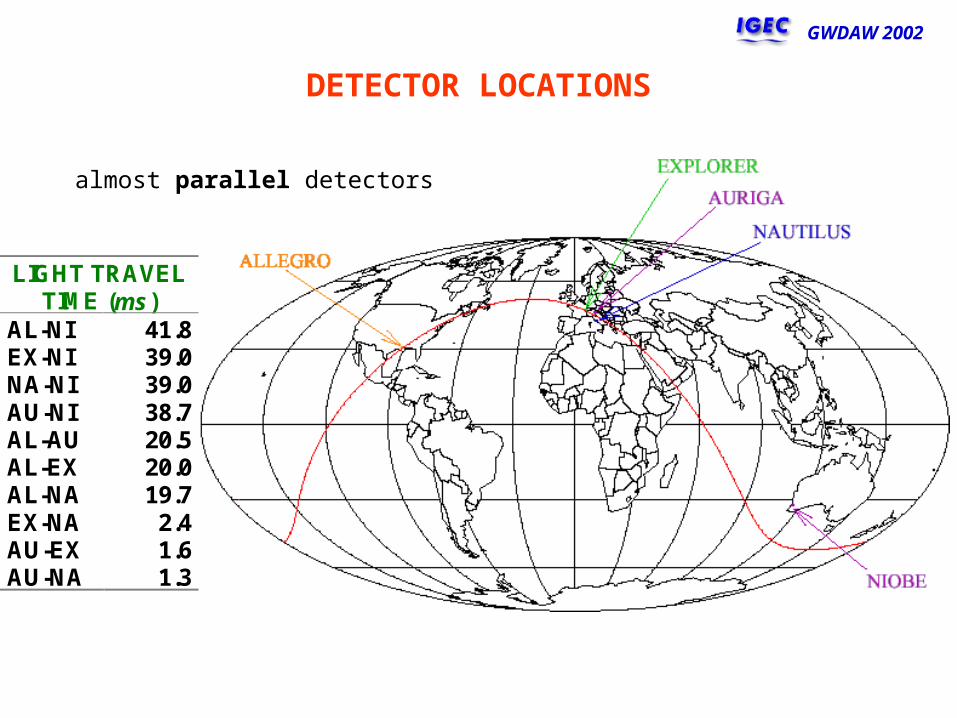
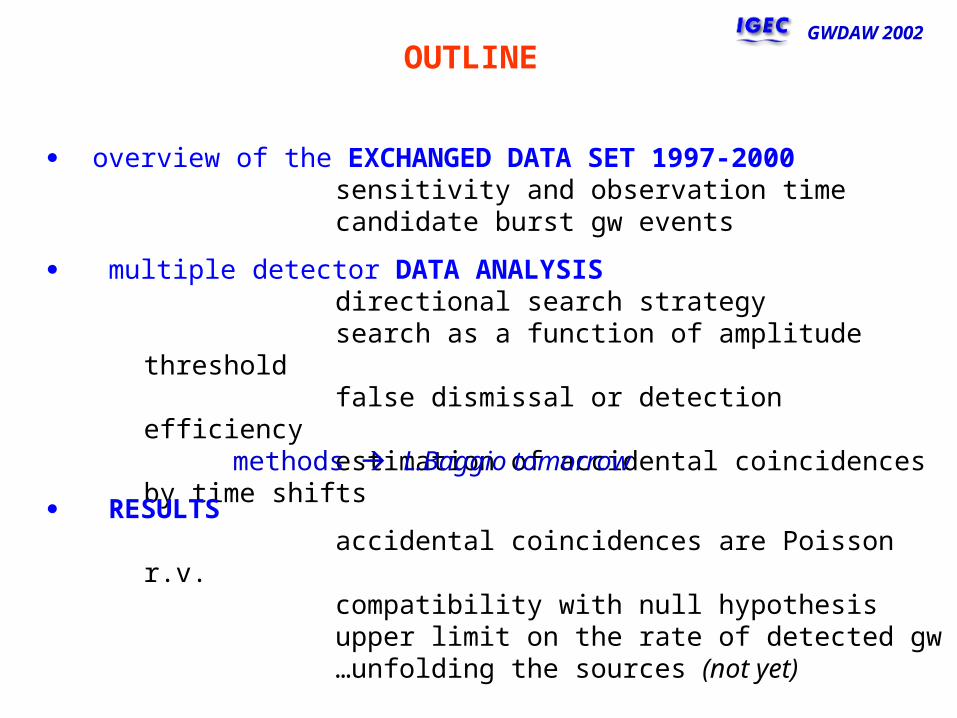
DETECTOR LOCATIONS
GWDAW 2002
LIGHT TRAVEL TIME (ms)
AL-NI 41.8 EX-NI 39.0 NA-NI 39.0 AU-NI 38.7 AL-AU 20.5 AL-EX 20.0 AL-NA 19.7 EX-NA 2.4 AU-EX 1.6 AU-NA 1.3
almost parallel detectors
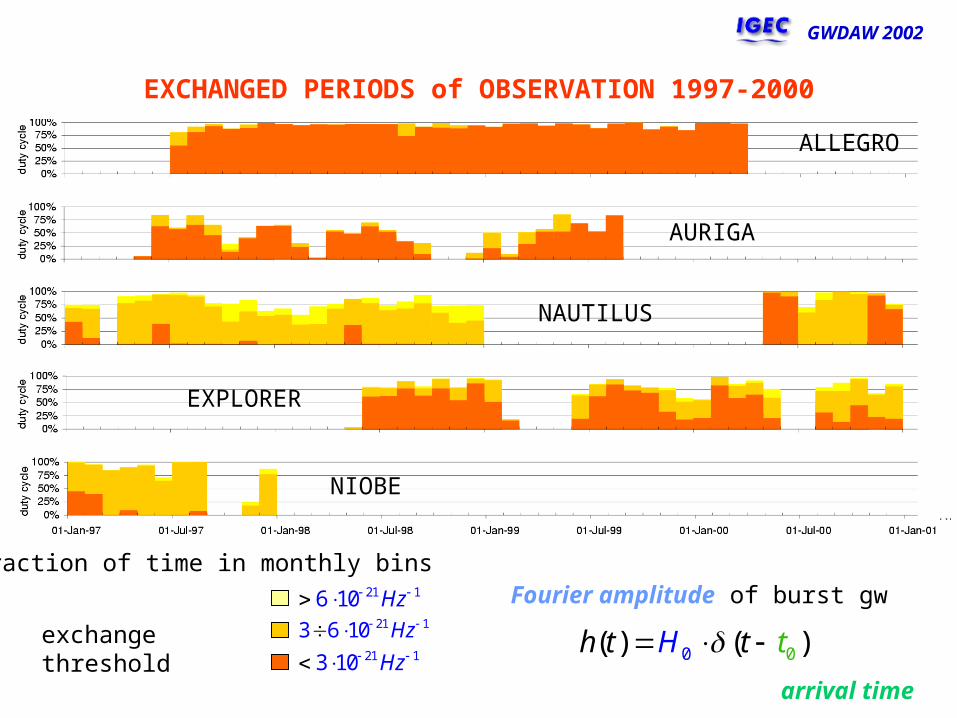
EXCHANGED PERIODS of OBSERVATION 1997-2000
GWDAW 2002
fraction of time in monthly bins
exchange threshold
21 16 10 Hz 21 13 6 10 Hz
21 13 10 Hz
Fourier amplitude of burst gw
0 0( ) ( )h Ht tt arrival time
ALLEGRO
AURIGA
NAUTILUS
EXPLORER
NIOBE
0.0
0.1
0.2
0.3
0.4
0.5
0.6
0.7
0.8
0.9
1.0
0 6 12 18 24 30 36 42 48 54 60
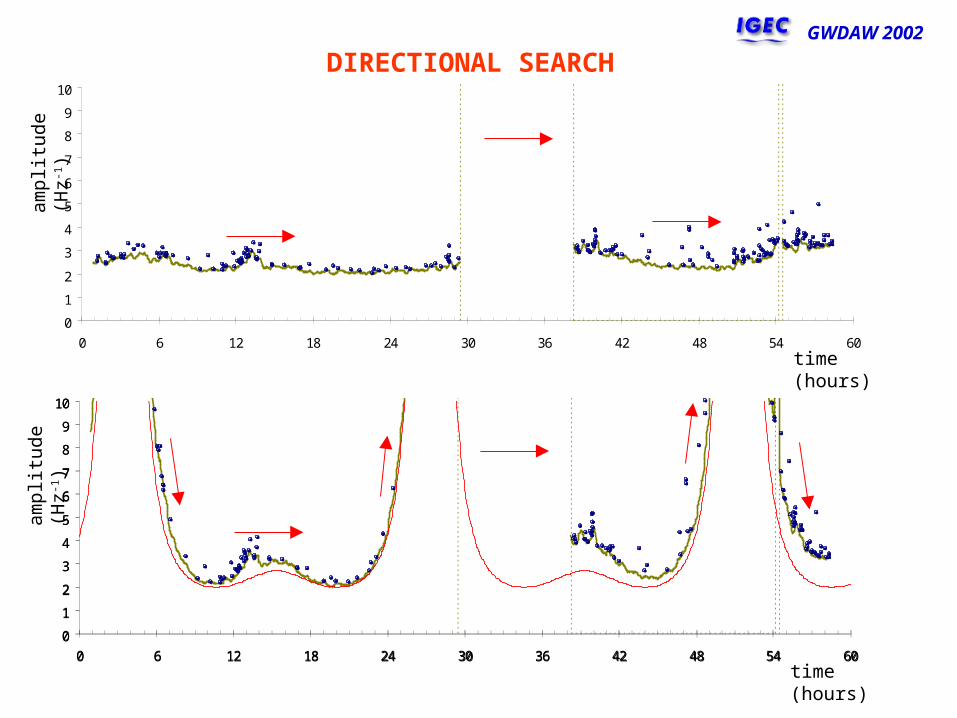
amplitude directional sensitivity
2sin GC
0
1
2
3
4
5
0 6 12 18 24 30 36 42 48 54 60
2sin GC
0
1
2
3
4
5
6
7
8
9
10
0 6 12 18 24 30 36 42 48 54 60
0
1
2
3
4
5
6
7
8
9
10
0 6 12 18 24 30 36 42 48 54 60
0
1
2
3
4
5
6
7
8
9
10
0 6 12 18 24 30 36 42 48 54 60
0
1
2
3
4
5
6
7
8
9
10
0 6 12 18 24 30 36 42 48 54 60
0
1
2
3
4
5
6
7
8
9
10
0 6 12 18 24 30 36 42 48 54 60
0
1
2
3
4
5
6
7
8
9
10
0 6 12 18 24 30 36 42 48 54 60
0
1
2
3
4
5
6
7
8
9
10
0 6 12 18 24 30 36 42 48 54 60
0
1
2
3
4
5
6
7
8
9
10
0 6 12 18 24 30 36 42 48 54 60
0
1
2
3
4
5
6
7
8
9
10
0 6 12 18 24 30 36 42 48 54 60
time (hours)
ampl
itude
(H
z-1)
time (hours)
ampl
itude
(H
z-1)
GWDAW 2002
DIRECTIONAL SEARCH
0
1
2
3
4
5
6
7
8
9
10
0 6 12 18 24 30 36 42 48 54 60
time (hours)
ampl
itude
(H
z-1)
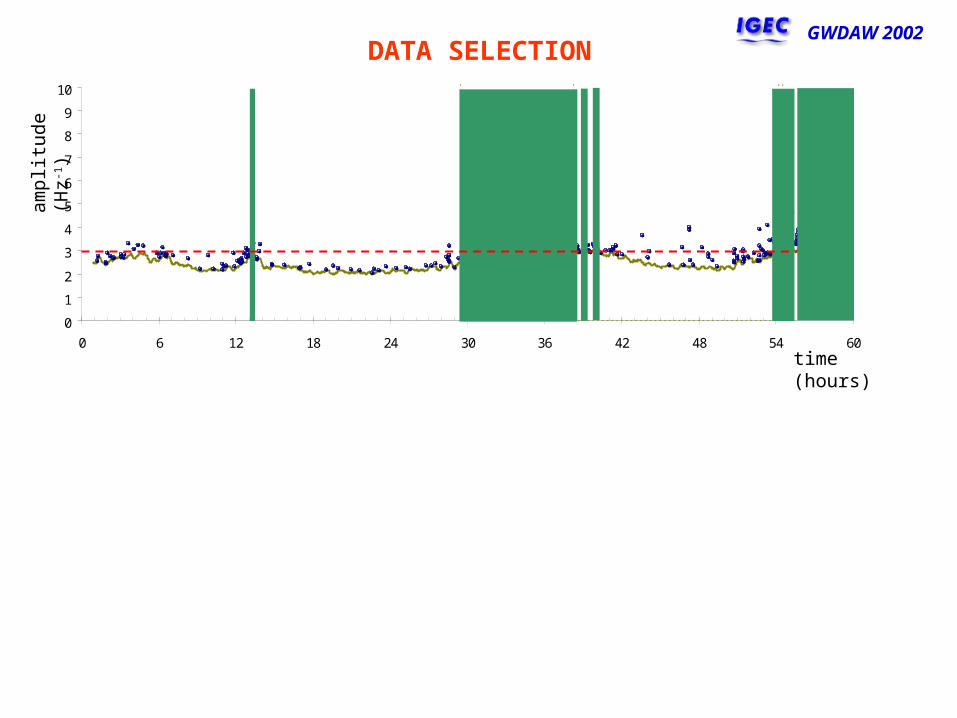
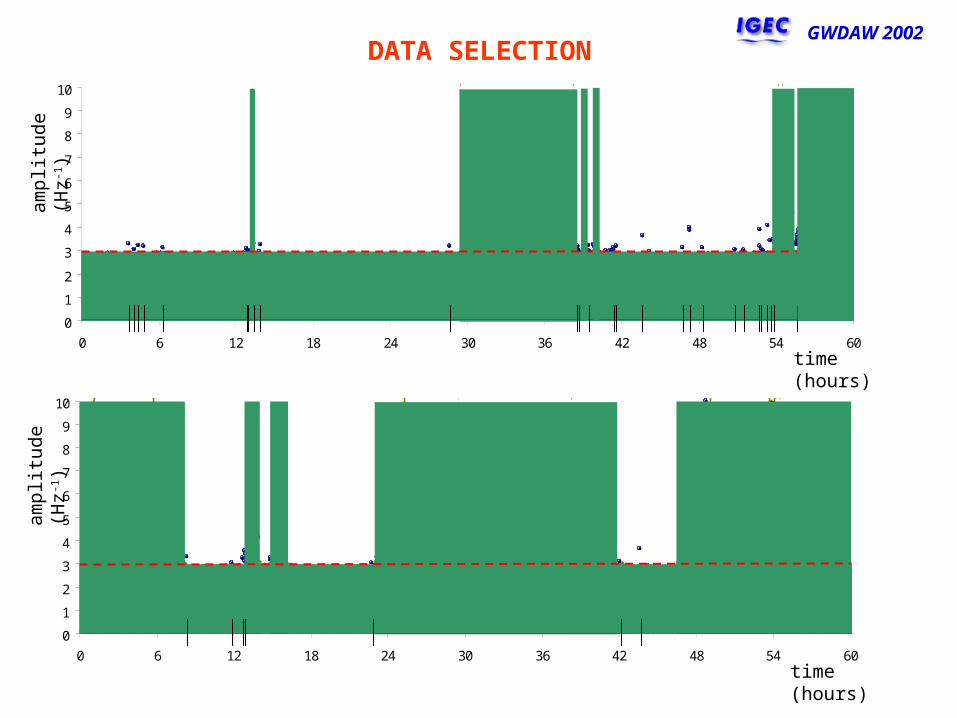
GWDAW 2002DATA SELECTION
amplitude of burst gw
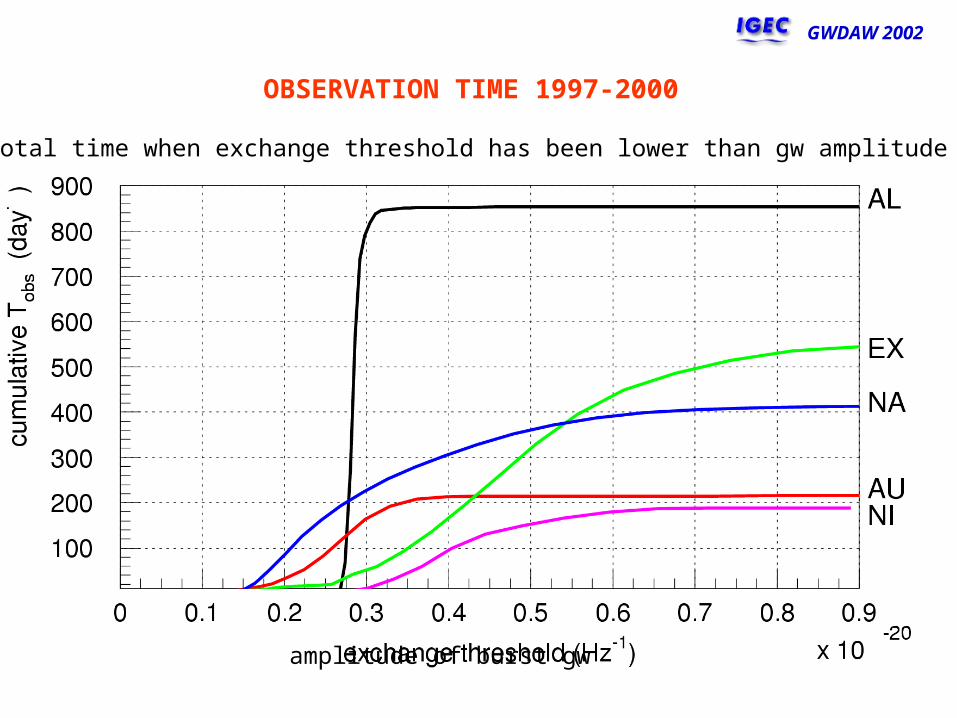
OBSERVATION TIME 1997-2000
GWDAW 2002
total time when exchange threshold has been lower than gw amplitude
0
1
2
3
4
5
6
7
8
9
10
0 6 12 18 24 30 36 42 48 54 60
0
1
2
3
4
5
6
7
8
9
10
0 6 12 18 24 30 36 42 48 54 60
time (hours)
ampl
itude
(H
z-1)
ampl
itude
(H
z-1)
time (hours)
GWDAW 2002DATA SELECTION
time (hours)
time (hours)
GWDAW 2002
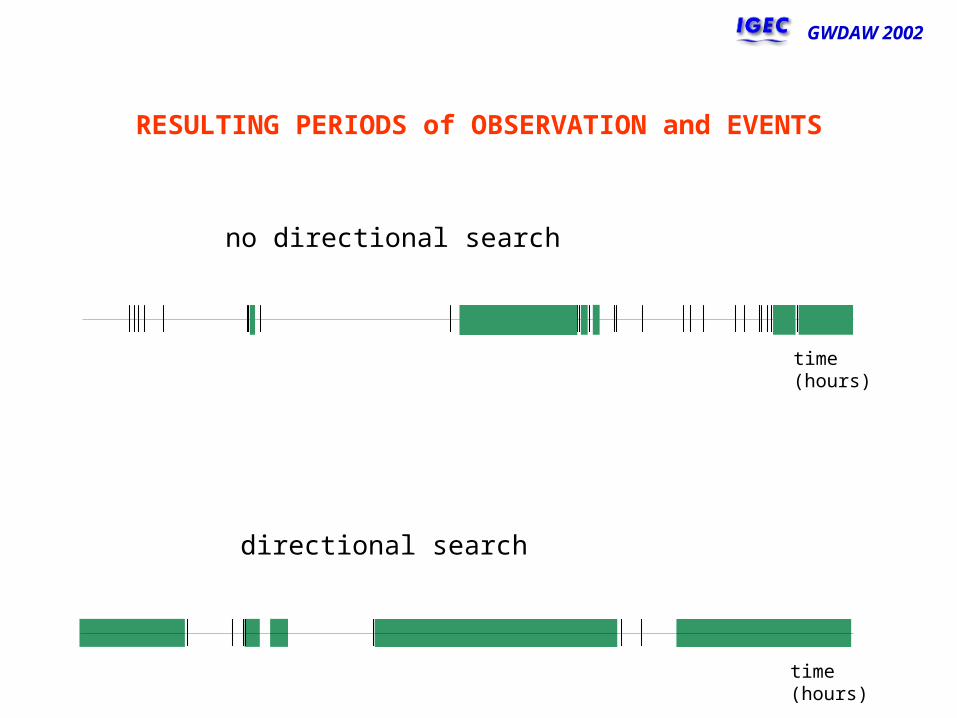
RESULTING PERIODS of OBSERVATION and EVENTS
no directional search
directional search
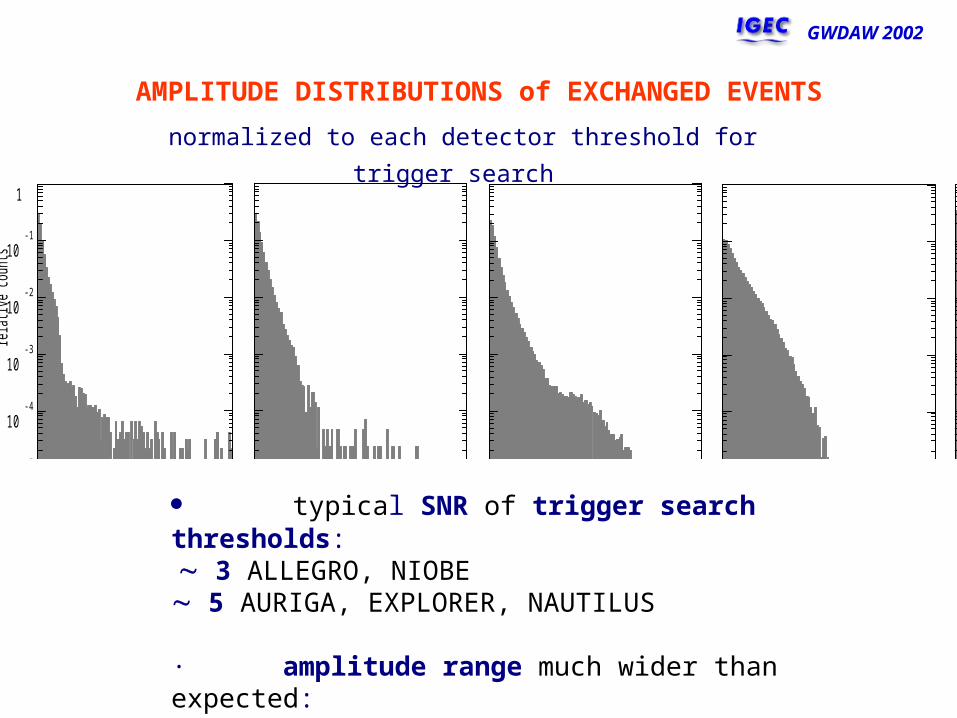
AMPLITUDE DISTRIBUTIONS of EXCHANGED EVENTS
GWDAW 2002
relat
ive c
ount
s
10-5
10-4
10-3
10-2
10-1
1
relat
ive c
ount
s
10-5
10-4
10-3
10-2
10-1
1
NIOBENIOBEAMP/THR1 10
NAUTILUSNAUTILUSAMP/THR1 10
AURIGAAURIGAAMP/THR1 10
ALLEGROALLEGROAMP/THR1 10
EXPLOREREXPLORERAMP/THR1 10
normalized to each detector threshold for trigger search
typical SNR of trigger search thresholds: 3 ALLEGRO, NIOBE 5 AURIGA, EXPLORER, NAUTILUS · amplitude range much wider than expected:non modeled outliers dominating at high SNR
time
amplitude
time
amplitude
time
amplitude
time
amplitude
A
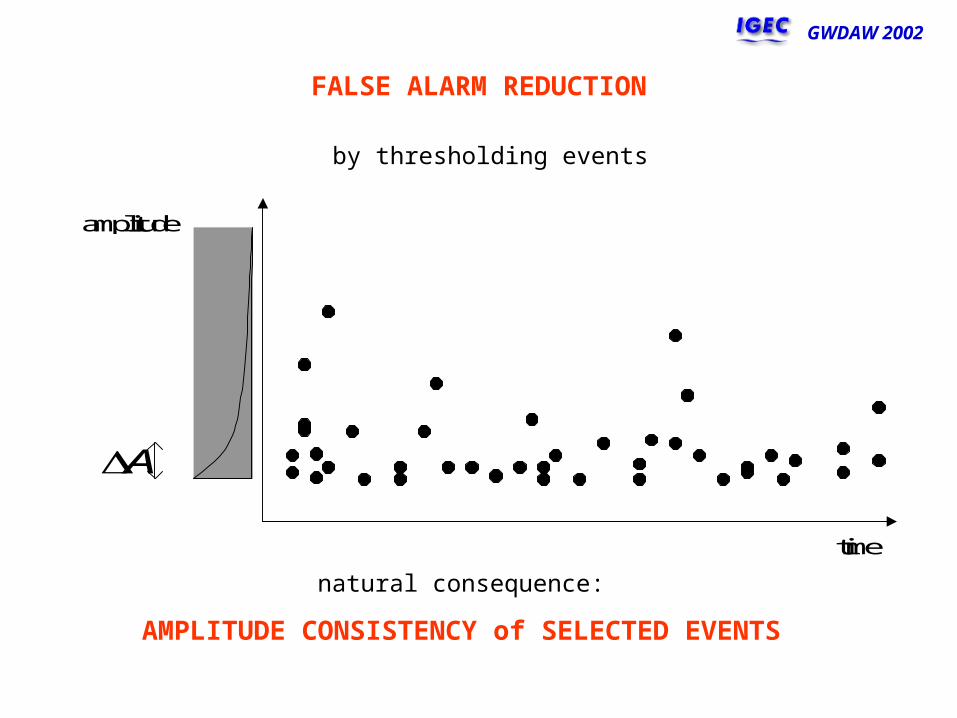
by thresholding events
GWDAW 2002
FALSE ALARM REDUCTION
natural consequence:
AMPLITUDE CONSISTENCY of SELECTED EVENTS
FALSE DISMISSAL PROBABILITY
GWDAW 2002
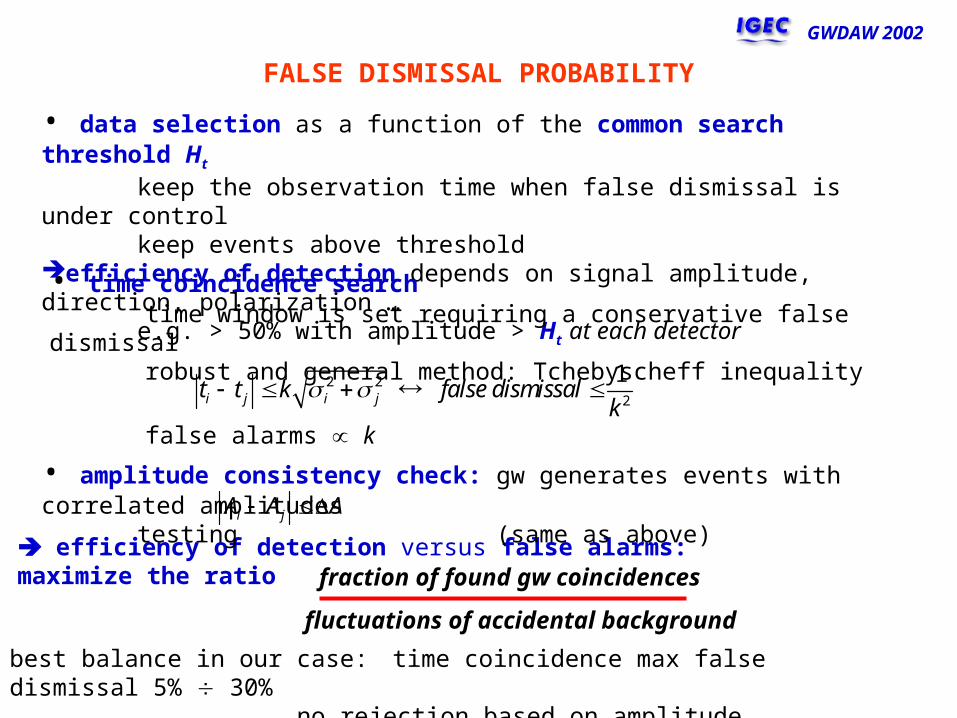
• data selection as a function of the common search threshold Ht
keep the observation time when false dismissal is under controlkeep events above threshold
efficiency of detection depends on signal amplitude, direction, polarization …e.g. > 50% with amplitude > Ht at each detector
• time coincidence searchtime window is set requiring a conservative false dismissalrobust and general method: Tchebyscheff inequality
fraction of found gw coincidences
fluctuations of accidental background
2 22
1i j i jt t k false dismissal
k
best balance in our case: time coincidence max false dismissal 5% 30% no rejection based on amplitude consistency test
efficiency of detection versus false alarms:maximize the ratio
false alarms k
• amplitude consistency check: gw generates events with correlated amplitudes testing (same as above) i jA A A
POISSON STATISTICS of ACCIDENTAL COINCIDENCES
GWDAW 2002
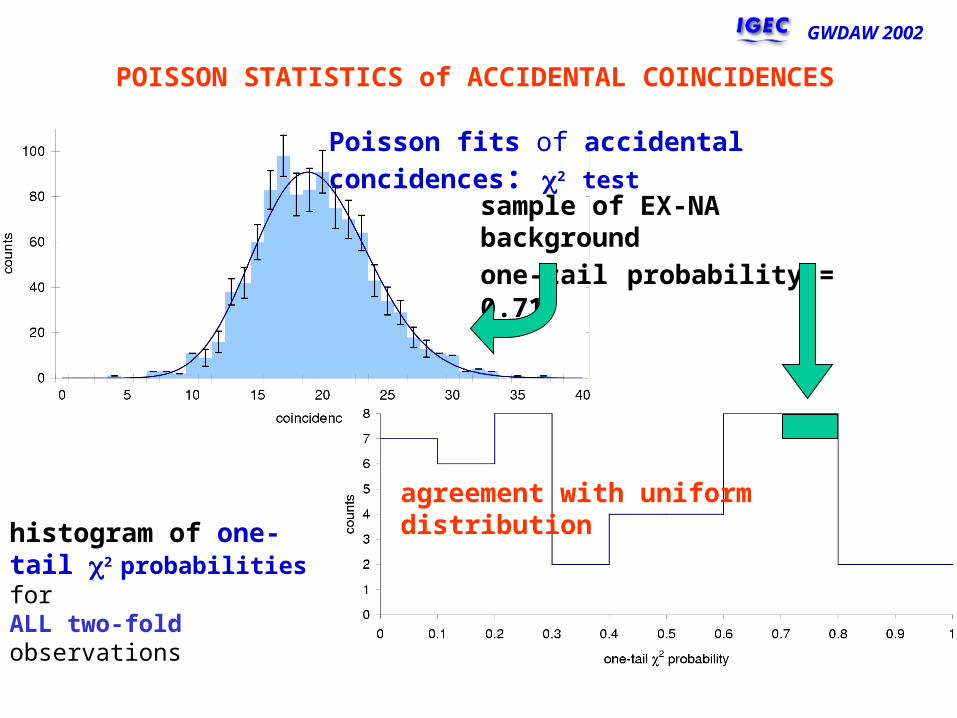
Poisson fits of accidental concidences: 2 test
sample of EX-NA background
one-tail probability = 0.71
histogram of one-tail 2
probabilities for ALL two-fold observations
agreement with uniform distribution
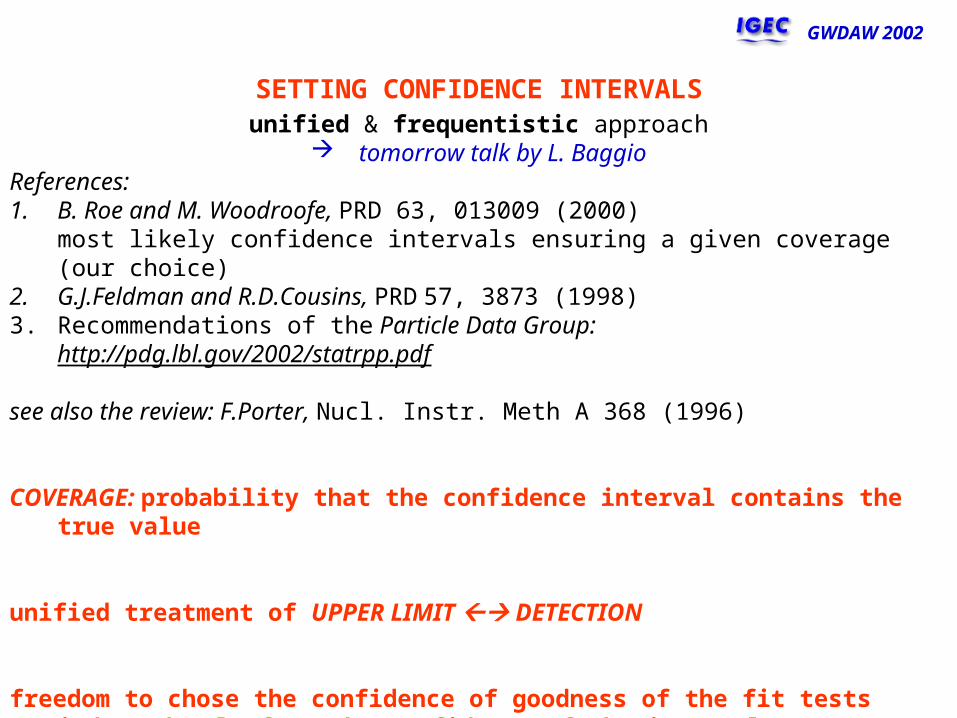
SETTING CONFIDENCE INTERVALS
GWDAW 2002
unified & frequentistic approach tomorrow talk by L. Baggio
References: 1. B. Roe and M. Woodroofe, PRD 63, 013009 (2000)
most likely confidence intervals ensuring a given coverage (our choice)2. G.J.Feldman and R.D.Cousins, PRD 57, 3873 (1998)3. Recommendations of the Particle Data Group: http://pdg.lbl.gov/2002/statrpp.pdf
see also the review: F.Porter, Nucl. Instr. Meth A 368 (1996)
COVERAGE: probability that the confidence interval contains the true value
unified treatment of UPPER LIMIT DETECTION
freedom to chose the confidence of goodness of the fit tests independently from the confidence of the interval
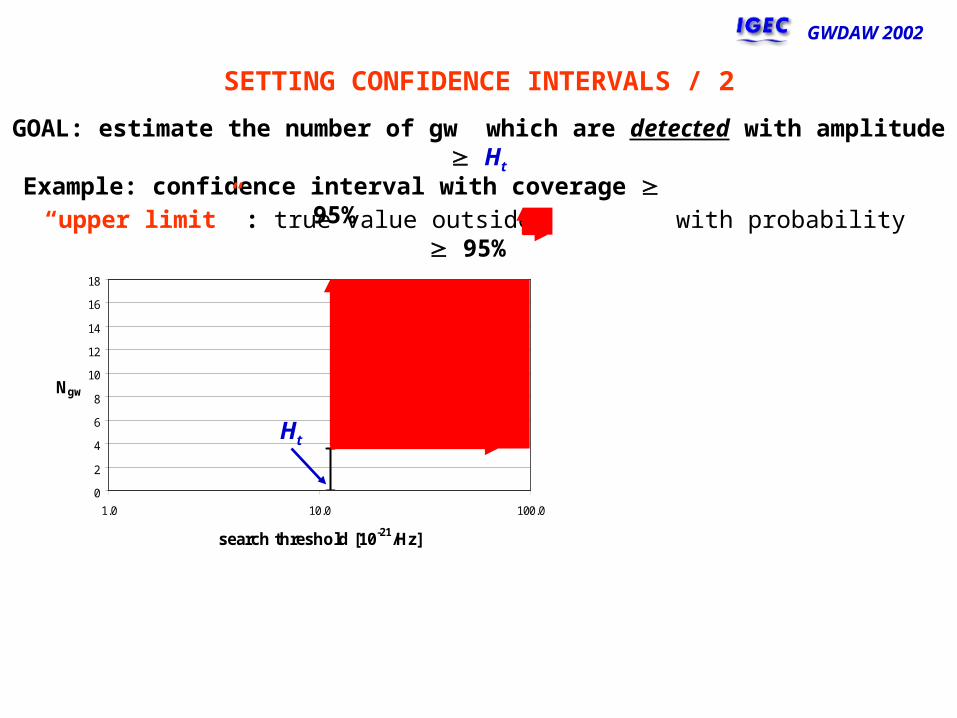
SETTING CONFIDENCE INTERVALS / 2
GWDAW 2002
Example: confidence interval with coverage 95%
0
2
4
6
8
10
12
14
16
18
1.0 10.0 100.0
search threshold [10-21/Hz]
Ngw
Ht
“upper limit” : true value outside with probability 95%
GOAL: estimate the number of gw which are detected with amplitude Ht
0
2
4
6
8
10
12
14
16
18
1.0 10.0 100.0
search threshold [10-21/Hz]
Ngw
GWDAW 2002
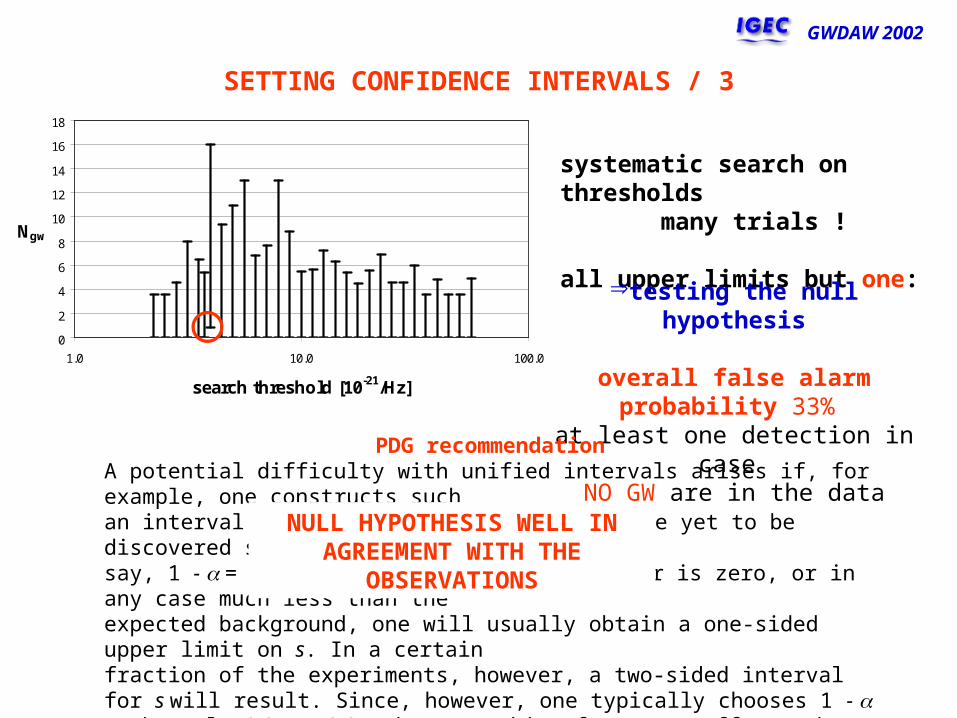
SETTING CONFIDENCE INTERVALS / 3
systematic search on thresholdsmany trials !
all upper limits but one:
testing the null hypothesis
overall false alarm probability 33%
at least one detection in case NO GW are in the dataPDG recommendation
A potential difficulty with unified intervals arises if, for example, one constructs suchan interval for a Poisson parameter s of some yet to be discovered signal process with,say, 1 - = 0:9. If the true signal parameter is zero, or in any case much less than theexpected background, one will usually obtain a one-sided upper limit on s. In a certainfraction of the experiments, however, a two-sided interval for s will result. Since, however, one typically chooses 1 - to be only 0:9 or 0:95 when searching for a new effect, the value s = 0 may be excluded from the interval before the existence of the effect is well established. It must then be communicated carefully that in excluding s = 0 from the interval, one is not necessarily claiming to have discovered the effect.
NULL HYPOTHESIS WELL IN AGREEMENT WITH THE
OBSERVATIONS
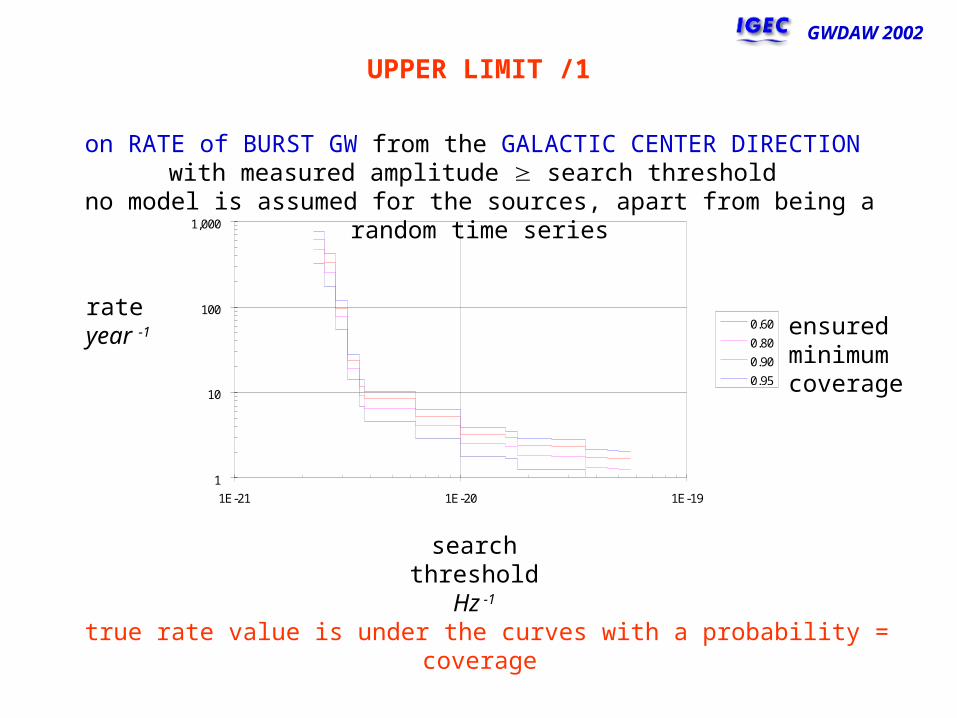
UPPER LIMIT /1
GWDAW 2002
1
10
100
1,000
1E-21 1E-20 1E-19
0.60
0.80
0.90
0.95
on RATE of BURST GW from the GALACTIC CENTER DIRECTION with measured amplitude search threshold
no model is assumed for the sources, apart from being a random time series
rateyear -1
search thresholdHz -1
ensured minimumcoverage
true rate value is under the curves with a probability = coverage
1
10
100
1,000
1E-21 1E-20 1E-19
0.60
0.80
0.90
0.95
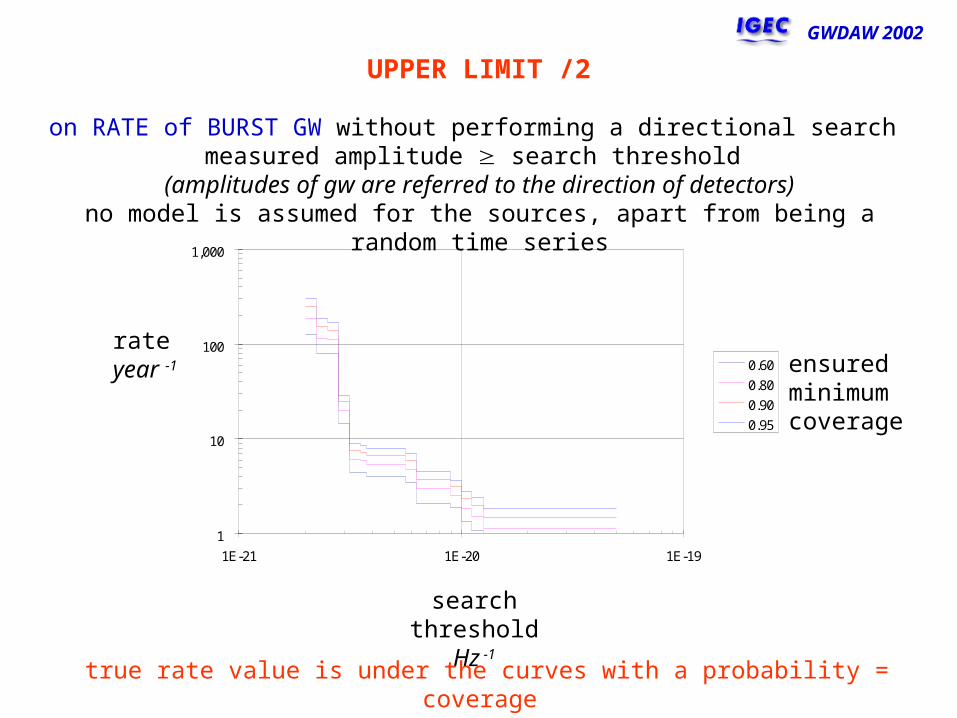
UPPER LIMIT /2
GWDAW 2002
on RATE of BURST GW without performing a directional search measured amplitude search threshold
(amplitudes of gw are referred to the direction of detectors)no model is assumed for the sources, apart from being a random time series
rateyear -1
search thresholdHz -1
ensured minimumcoverage
true rate value is under the curves with a probability = coverage