Embed Size (px)
Citation preview
IBM Software Group
®
WebSphere® Support Technical Exchange
JVM Performance Tuning with respect to Garbage Collection(GC) policies for WebSphere Application Server V6.1 - Part 1
Giribabu ParamkushamAjay Bhalodia
IBM Software Group
WebSphere® Support Technical Exchange 2
Objectives
� Understand Java5 Garbage Collection for IBM®
JVMs
� Selecting the Correct GC Policy
� Analyze GC output and provide suggestions
� Tuning Java™ heap for performance
� Questions/Answers
IBM Software Group
WebSphere® Support Technical Exchange 3
What is Garbage Collection
� Responsible for allocation and freeing of memory
� Allocates objects using a contiguous section of Java heap
� Ensures the object remains on the heap as long as it is in use
� Reclaims objects that are no longer referenced
IBM Software Group
WebSphere® Support Technical Exchange 4
Understanding Garbage Collection� Two main technologies used to remove the garbage:
� Mark Sweep Collector
� Copy Collector
� IBM uses a mark sweep collector
� or a combination for generational (gencon)
� Garbage Collection can be broken down into 3 steps
� Mark: Find all live objects in the system
� Sweep: Reclaim objects that are no longer referenced
� Compact: Converts many small holes into fewer large ones to
avoid fragmentation
� All steps are in a single stop-the-world (STW) phase
� Application “pauses” while garbage collection is running
IBM Software Group
WebSphere® Support Technical Exchange 5
Why different GC policies?
� GC performance issues can take many forms
� Definition of a performance problem is user centric
�User requirement may be for:
• Very short GC “pause” times• Maximum throughput• A balance of both
� First step is to ensure that the correct GC policy has been selected for the workload type
� Second step is to ensure heap sizing is correct
� Third step is to look for specific performance issues
IBM Software Group
WebSphere® Support Technical Exchange 6
Few but simple GC policies in IBM
IBM provides four simple GC “Policies”, optimized for scenarios
1. -Xgcpolicy:optthruput optimized for throughput (default gc policy)
2. -Xgcpolicy:gencon optimized for short lived objects to
reduce pause times while maintaining good throughput
3. -Xgcpolicy:optavgpause optimized for applications with
responsiveness criteria by greatly reducing STW times.
Reduction usually between 90% to 95%. Eg. Portal applications
4. -Xgcpolicy:subpools optimized for multi processor
systems (recommended for 16 or more processors)

IBM Software Group
WebSphere® Support Technical Exchange 7
Generational and Concurrent GC (gencon)
IBM Software Group
WebSphere® Support Technical Exchange 8
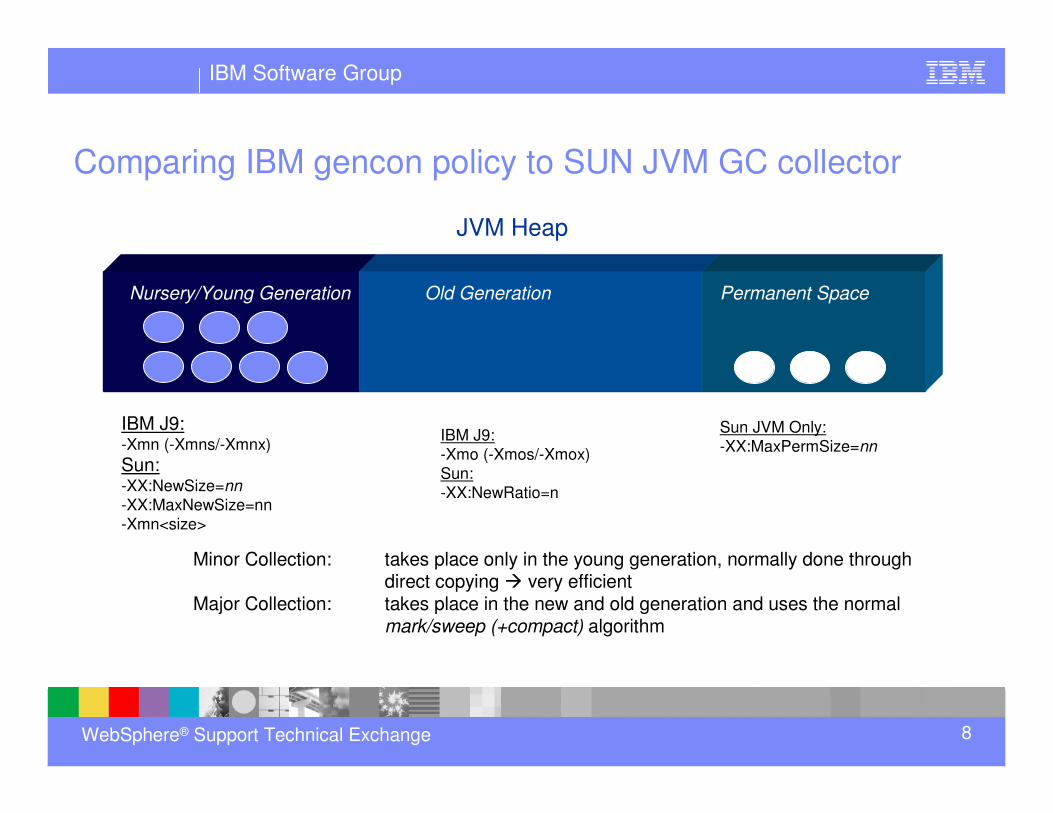
Comparing IBM gencon policy to SUN JVM GC collector
IBM J9:-Xmn (-Xmns/-Xmnx)
Sun:-XX:NewSize=nn
-XX:MaxNewSize=nn-Xmn<size>
Sun JVM Only:-XX:MaxPermSize=nn
Nursery/Young Generation Old Generation Permanent Space
JVM Heap
IBM J9:-Xmo (-Xmos/-Xmox)Sun:-XX:NewRatio=n
Minor Collection: takes place only in the young generation, normally done through direct copying � very efficient
Major Collection: takes place in the new and old generation and uses the normal mark/sweep (+compact) algorithm
IBM Software Group
WebSphere® Support Technical Exchange 9

IBM Software Group
WebSphere® Support Technical Exchange 10
Sample verbosegc for optthroughput (default)
<af type="tenured" id="1" timestamp="Sun Mar 12 19:12:55 2006" intervalms="0.000">
<minimum requested_bytes="16" />
<time exclusiveaccessms="0.025" />
<tenured freebytes="23592960" totalbytes="471859200" percent="5" >
<soa freebytes="0" totalbytes="448266240" percent="0" />
<loa freebytes="23592960" totalbytes="23592960" percent="100" />
</tenured>
<gc type="global" id="3" totalid="3" intervalms="11620.259">
<refs_cleared soft="0" weak="72" phantom="0" />
<finalization objectsqueued="9" />
<timesms mark="74.734" sweep="7.611" compact="0.000" total="82.420" />
<tenured freebytes="409273392" totalbytes="471859200" percent="86" >
<soa freebytes="385680432" totalbytes="448266240" percent="86" />
<loa freebytes="23592960" totalbytes="23592960" percent="100" />
</tenured>
</gc>
<tenured freebytes="409272720" totalbytes="471859200" percent="86" >
<soa freebytes="385679760" totalbytes="448266240" percent="86" />
<loa freebytes="23592960" totalbytes="23592960" percent="100" />
</tenured>
<time totalms="83.227" />
</af>
Allocation request
details. And state of
heap before
collection
Heap occupancy
details after
running GC
Heap occupancy
details after the
request that
triggered the
allocation was
satisfied.
IBM Software Group
WebSphere® Support Technical Exchange 11
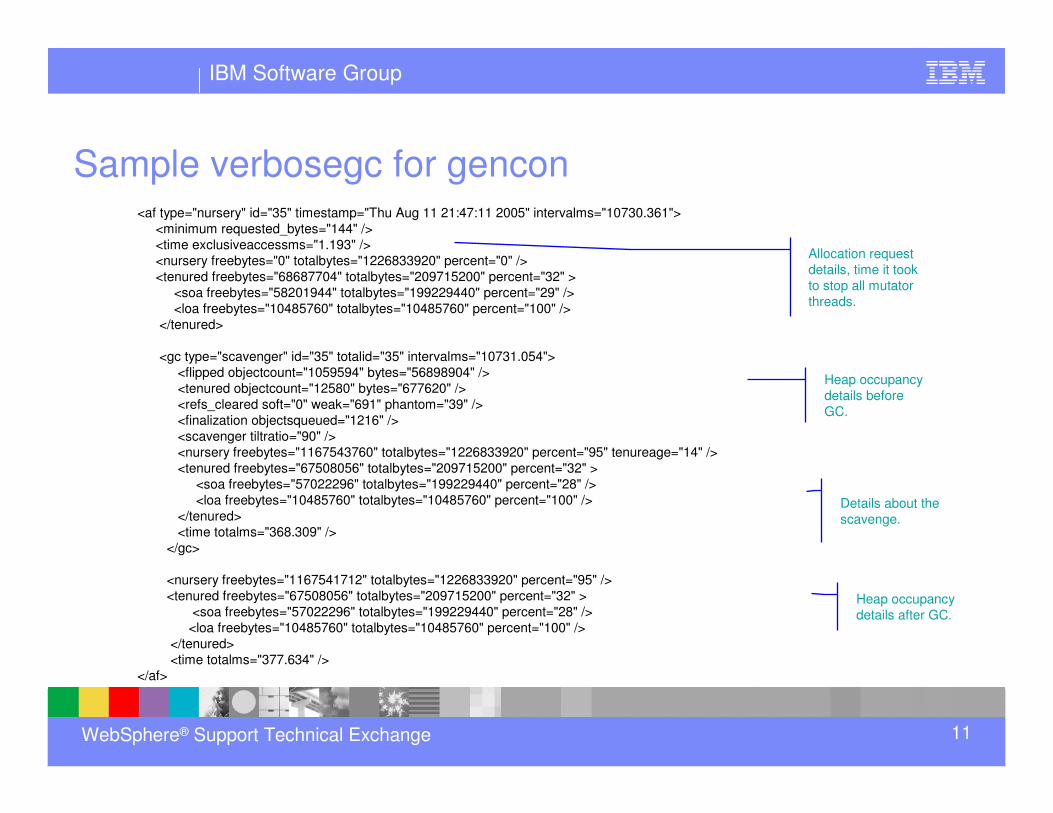
Sample verbosegc for gencon<af type="nursery" id="35" timestamp="Thu Aug 11 21:47:11 2005" intervalms="10730.361">
<minimum requested_bytes="144" />
<time exclusiveaccessms="1.193" />
<nursery freebytes="0" totalbytes="1226833920" percent="0" />
<tenured freebytes="68687704" totalbytes="209715200" percent="32" >
<soa freebytes="58201944" totalbytes="199229440" percent="29" />
<loa freebytes="10485760" totalbytes="10485760" percent="100" />
</tenured>
<gc type="scavenger" id="35" totalid="35" intervalms="10731.054">
<flipped objectcount="1059594" bytes="56898904" />
<tenured objectcount="12580" bytes="677620" />
<refs_cleared soft="0" weak="691" phantom="39" />
<finalization objectsqueued="1216" />
<scavenger tiltratio="90" />
<nursery freebytes="1167543760" totalbytes="1226833920" percent="95" tenureage="14" />
<tenured freebytes="67508056" totalbytes="209715200" percent="32" >
<soa freebytes="57022296" totalbytes="199229440" percent="28" />
<loa freebytes="10485760" totalbytes="10485760" percent="100" />
</tenured>
<time totalms="368.309" />
</gc>
<nursery freebytes="1167541712" totalbytes="1226833920" percent="95" />
<tenured freebytes="67508056" totalbytes="209715200" percent="32" >
<soa freebytes="57022296" totalbytes="199229440" percent="28" />
<loa freebytes="10485760" totalbytes="10485760" percent="100" />
</tenured>
<time totalms="377.634" />
</af>
Allocation request
details, time it took
to stop all mutator
threads.
Heap occupancy
details before
GC.
Heap occupancy
details after GC.
Details about the
scavenge.
IBM Software Group
WebSphere® Support Technical Exchange 12
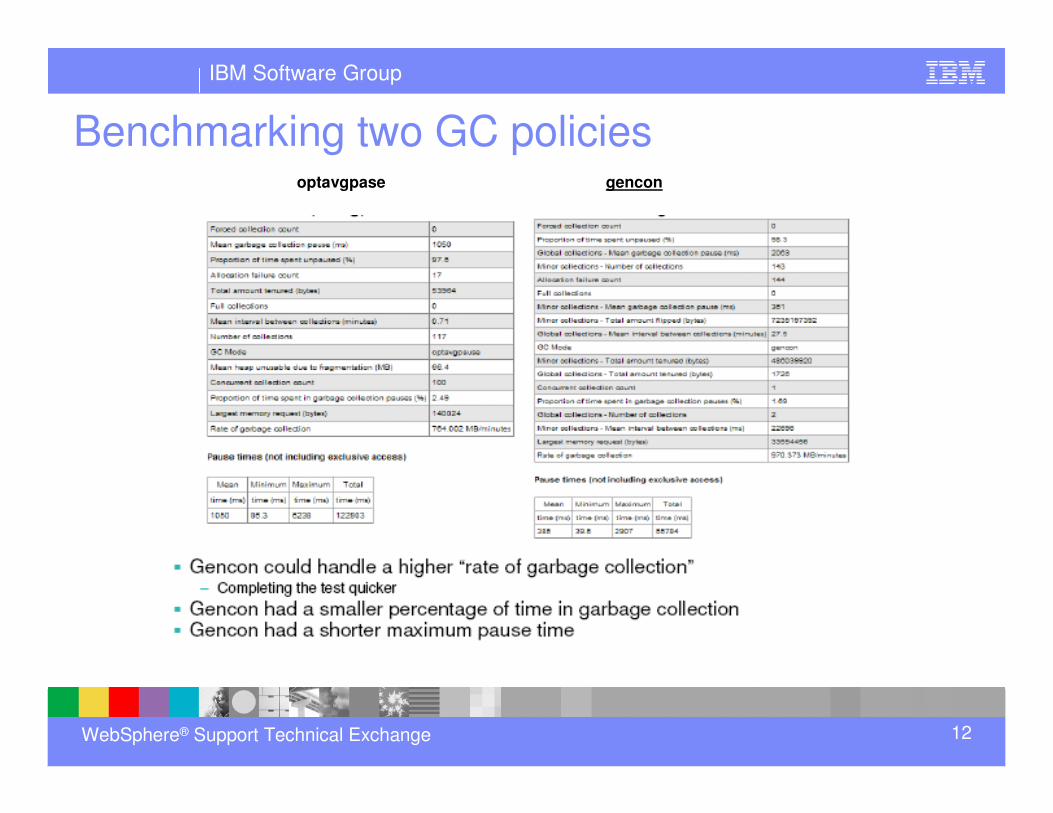
Benchmarking two GC policiesoptavgpase gencon
IBM Software Group
WebSphere® Support Technical Exchange 13
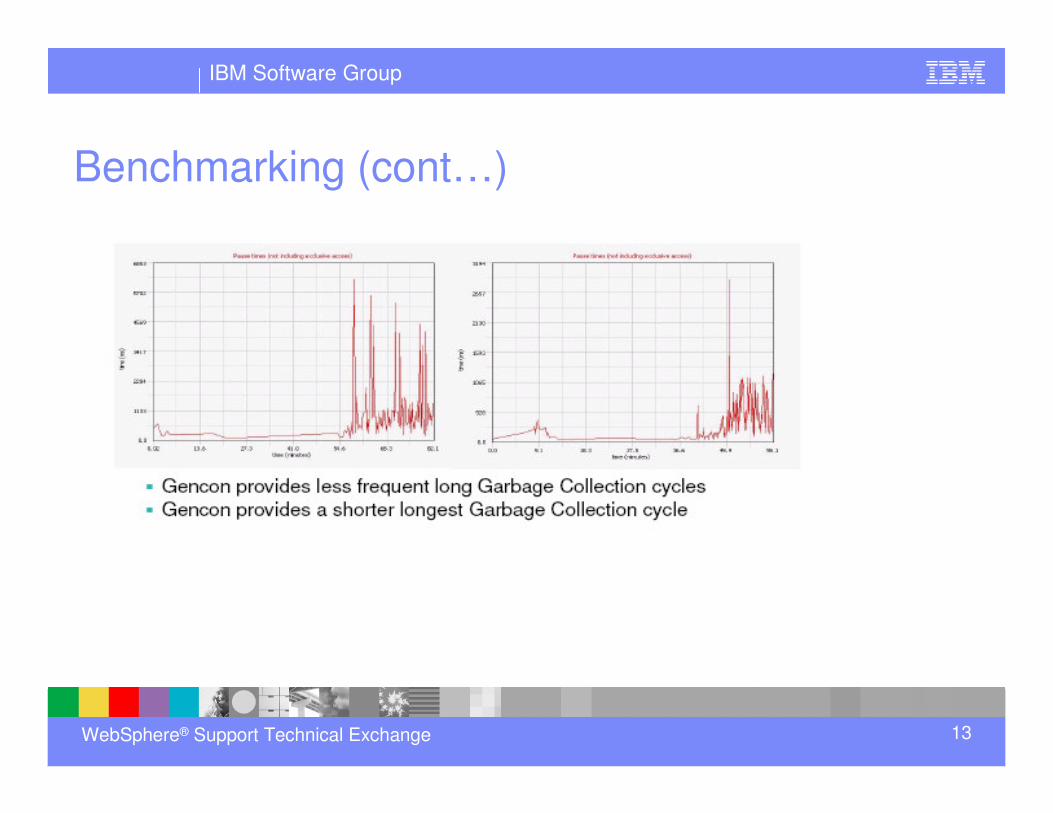
Benchmarking (cont…)
IBM Software Group
WebSphere® Support Technical Exchange 14
Tuning Java heap for performance
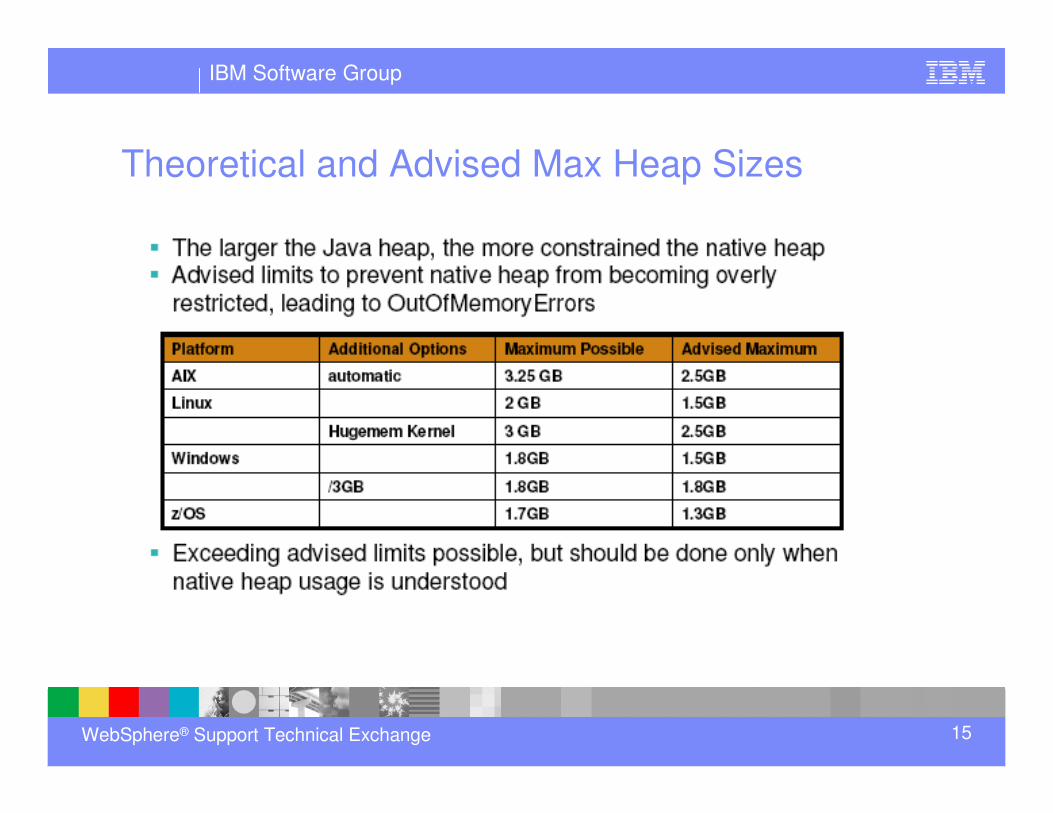
� Maximum possible Java heap sizes
� The “correct” Java heap size
� Fixed heap sizes vs. Variable heap sizes
� Heap Sizing for Generational GC
� 32 bit Java processes have maximum possible heap size
� 32 bit architecture has addressable space of 2^32
� Which is 4GigaBytes
� Determined by the process memory layout
� 64 bit processes do not have this limit
� Limit exists, but is so large it can be effectively ignored
� Addressability usually between 2^44 and 2^64
� Which is 16+ TeraBytes
IBM Software Group
WebSphere® Support Technical Exchange 15
Theoretical and Advised Max Heap Sizes
IBM Software Group
WebSphere® Support Technical Exchange 16
Things to consider when moving to 64 bit
� Moving to 64bit removes the Java heap size constraint
� However, ability to use more memory is not “free”
�64bit applications perform slower
• More data has to be manipulated• Cache performance is reduced
�64bit applications require more memory
• Java Object references are larger• Internal pointers are larger
� Major improvements to this in Java 6.0 due to compressed pointers
IBM Software Group
WebSphere® Support Technical Exchange 17
The “correct” Java heap size
� GC will adapt heap size to keep occupancy between 40% and 70%
� Heap occupancy over 70% causes frequent GC cycles
• Which generally means reduced performance
� Heap occupancy below 40% means infrequent GC cycles, but cycles longer than they need to be
• Which means longer pause times than necessary
• Which generally means reduced performance
� The maximum heap size setting should therefore be above 40% larger than the maximum occupancy of the application. For example 43%:
� Maximum occupancy + 43% means occupancy at 70% of total heap
• Eg. For 70MB occupancy, 100MB Max heap required, which is 70MB + 43% of 70MB
IBM Software Group
WebSphere® Support Technical Exchange 18
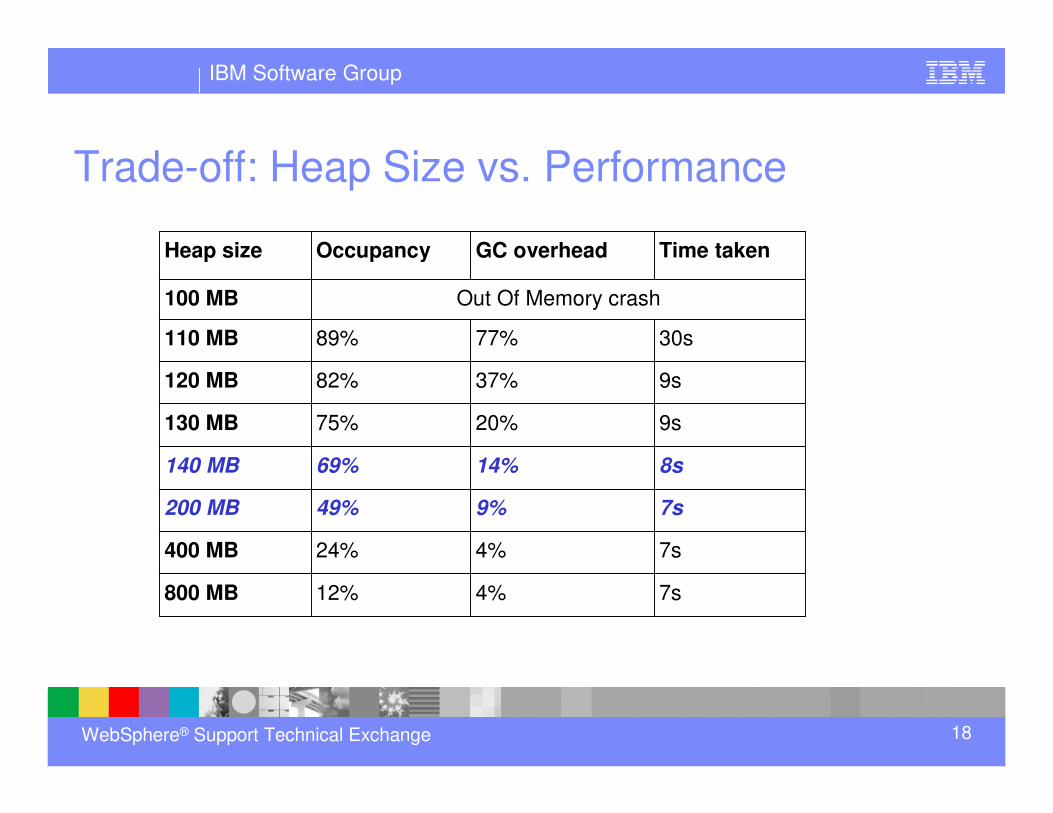
Trade-off: Heap Size vs. Performance
Heap size Occupancy GC overhead Time taken
100 MB Out Of Memory crash
110 MB 89% 77% 30s
120 MB 82% 37% 9s
130 MB 75% 20% 9s
140 MB 69% 14% 8s
200 MB 49% 9% 7s
400 MB 24% 4% 7s
800 MB 12% 4% 7s
IBM Software Group
WebSphere® Support Technical Exchange 19
Fixed heap sizes vs. Variable heap sizes
� Should the heap size be “fixed”?
� i.e. Minimum heap size (-Xms) = Maximum heap size (-Xmx)?
� Dependent on application
� For “flat” memory usage, use fixed
� For widely varying memory usage, consider variable
� Variable provides more flexibility and ability to avoid
OutOfMemoryErrors
� Variable Heap Sizes
� GC will adapt heap size to keep occupancy between 40% and 70%
IBM Software Group
WebSphere® Support Technical Exchange 20
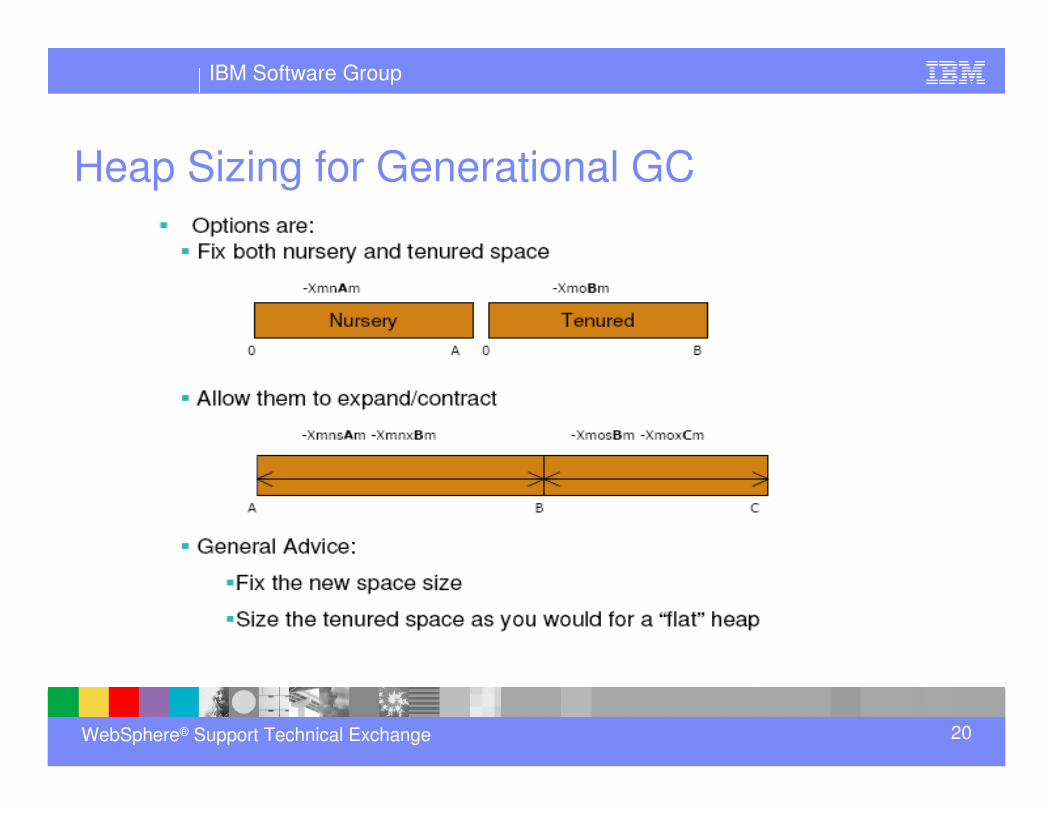
Heap Sizing for Generational GC
IBM Software Group
WebSphere® Support Technical Exchange 21
Sizing the Nursery
� “Copying” from Allocate to Survivor or to Tenured space is expensive
� Physical data is copied (similar to compaction which is also expensive
� Ideally “survival” rates should be as low as possible
� Less data needs to be copied
� Less tenured/global collects that will occur� The larger the nursery:
� the greater the time between collects
� the less objects that should survive
� Recommendation is to have a nursery as large as possible
� Whilst not being so large that nursery collect times affect the application responsiveness
IBM Software Group
WebSphere® Support Technical Exchange 22
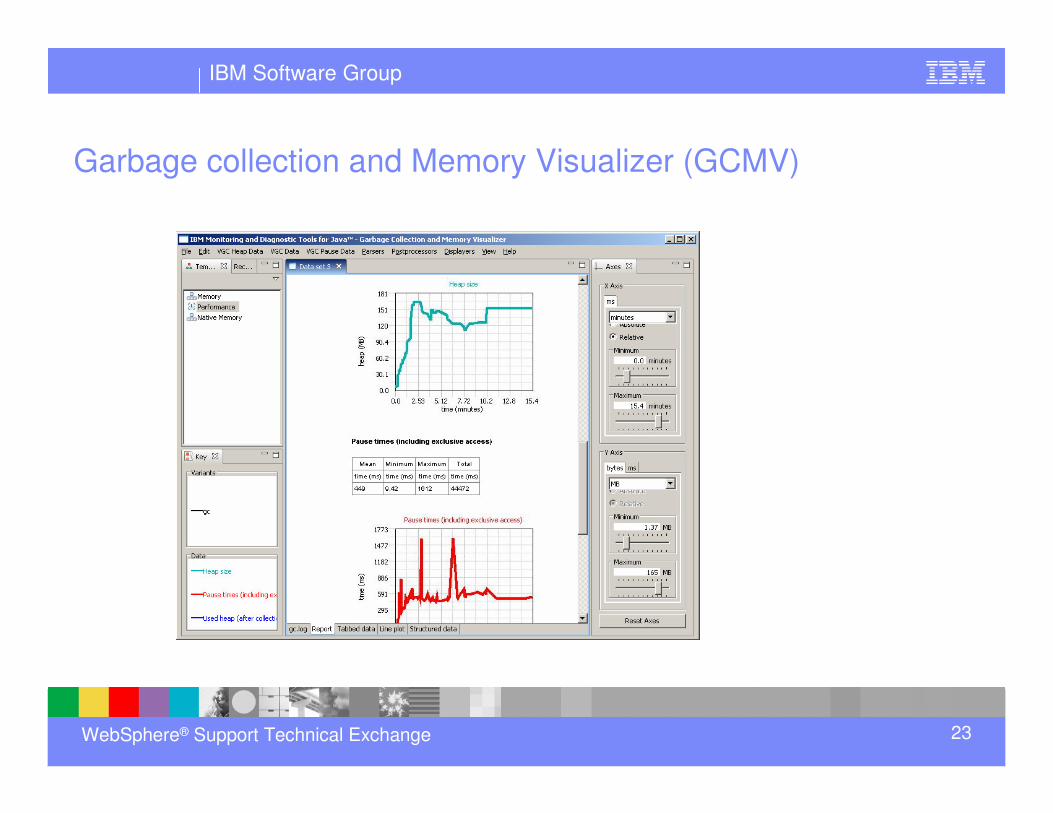
Tools - GCMV Features
� Parse and plot IBM verbose GC logs
� Analyses heap usage, heap size, pause times, and many other properties
� Compare multiple logs in the same plots and reports
� Handles optthruput, optavgpause, and gencon GC modes.
� Many views on data
� Reports
� Graphs
� Tables
� Can save data to
� HTML reports
� JPEG pictures
� CSV files
IBM Software Group
WebSphere® Support Technical Exchange 23
Garbage collection and Memory Visualizer (GCMV)
IBM Software Group
WebSphere® Support Technical Exchange 24
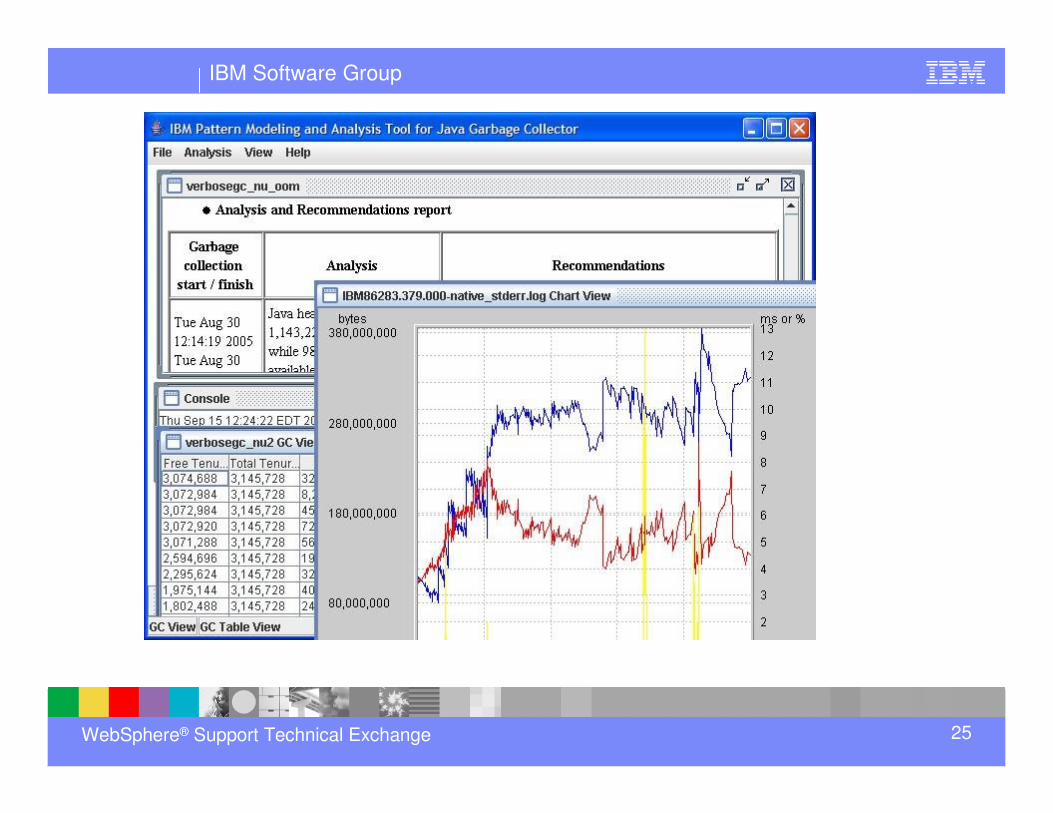
Tools – PMAT Features
� The following features are included:
� GC analysis
� GC table view
� Allocation failure summary
� GC usage summary
� GC duration summary
� GC graph view
� GC pattern analysis
� Zoom in/out/selection/center of chart view
� Option of changing chart color.
� The tool can also parse IBM, SUN and HP JVM
� Handles optthruput, optavgpause, and gencon GC modes.
IBM Software Group
WebSphere® Support Technical Exchange 25
IBM Software Group
WebSphere® Support Technical Exchange 26
Summary
� How the GC works and various GC policies in 1.5 IBM JDK.
� How to select the right GC Policy based on application scenario
� How to interpret verbose GC output
� Tuning Java Heap for performance
� Available Tools to parse gc data and provide recommendations
IBM Software Group
WebSphere® Support Technical Exchange 27
References� IBM JDK 5.0: Java Diagnostics Guide
http://publib.boulder.ibm.com/infocenter/javasdk/v5r0/index.jsp
� Analyzing Verbose GC Outputhttp://www-1.ibm.com/support/docview.wss?uid=swg21222488
� GCMV - GC and Memory Visualizer (GCMV) from ISAhttps://www14.software.ibm.com/webapp/iwm/web/preLogin.do?source=isa
� IBM Pattern Modeling and Analysis Tool for Java Garbage Collector (PMAT): http://www.alphaworks.ibm.com/tech/pmat
� Garbage Collection policies (Part 1)http://www.ibm.com/developerworks/java/library/j-ibmjava2/
� Garbage Collection policies (Part2) http://www.ibm.com/developerworks/java/library/j-ibmjava3/
IBM Software Group
WebSphere® Support Technical Exchange 28
Additional WebSphere Product Resources
� Discover the latest trends in WebSphere® Technology and implementation, participate in technically-focused briefings, webcasts and podcasts at: http://www.ibm.com/developerworks/websphere/community/
� Learn about other upcoming webcasts, conferences and events: http://www.ibm.com/software/websphere/events_1.html
� Join the Global WebSphere User Group Community: http://www.websphere.org
� Access key product show-me demos and tutorials by visiting IBM Education Assistant: http://www.ibm.com/software/info/education/assistant
� View a Flash replay with step-by-step instructions for using the Electronic Service Request (ESR) tool for submitting problems electronically: http://www.ibm.com/software/websphere/support/d2w.html
� Sign up to receive weekly technical My support emails: http://www.ibm.com/software/support/einfo.html
IBM Software Group
WebSphere® Support Technical Exchange 29
Questions and Answers