Embed Size (px)
Citation preview

Gary Gereffi Duke University
Center on Globalization, Governance & Competitiveness http://[email protected]
Gary Gereffi Duke University
Center on Globalization, Governance & Competitiveness http://[email protected]
COMESA ConferenceSeychelles
March 12-13, 2008
Global Value Chains and Industrial
Upgrading
in Developing Economies:
A Comparison of Africa, China, and Latin
America

Agenda
• Global Value Chain Analysis and Industrial Upgrading
• Africa and China
• Comparing Latin America, Africa and China
• Case Studies: China vs. Mexico
• Challenges and Opportunities
2
Global Value Chain Analysis
and Industrial Upgrading
Global Value Chain Analysis
and Industrial Upgrading
3

What is Global Value Chain Analysis?
Actors in global industries, and how their roles are changing (lead firms plus supply chains)
Power in the chain (brands, global buyers)
Linkages – between GVC activities (firms, intra-firm, networks)
Geography – locate domestic and national industries in their global context
Institutions – Government, unions, trade associations, NGOs, multi-lateral agencies and regulations
http://www.globalvaluechains.org/ 4

Upgrading
5
Upgrading refers to the acquisition of technological capabilities and market linkages that enable firms to improve their competitiveness and move into higher-value activities. Analyses of upgrading from a value chain perspective pay particular attention to the ways in which value chain linkages facilitate or obstruct upgrading.
Product and Process
UpgradingFunctional
Upgrading
Inter-Chain
Upgrading

Africa and ChinaAfrica and China
6

Africa’s share of world exports has been declining
7

Africa’s Exports are still in Raw Form, Resulting in Little Value-Added Being Extracted on the Continent
8

Top 10 Exports COMESA to the World, 2006
9
2006 $Bil 68-Non-ferrous metals 3.3 34-Gas,natural and manufactured 3.0 93-Special transactions & commod.,not class.t 1.7 66-Non-metallic mineral manufactures,n.e.s. 1.4 03-Fish,crustaceans,mollucs,preparations ther 1.4 97-Gold,non-monetary 1.2 33-Petroleum,petroleum products and related m 1.2 84-Articles of apparel and clothing accessories 1.1 07-Coffee,tea,cocoa,spices,manufactures there 1.0 28-Metalliferous ores and metal scrap 0.9
Source: UN Comtrade

Chinese trade with Africa, 2007 (US$ bill)
10

China Imports from Africa % Share
11

Top 10 Chinese Imports from COMESA
HS Description D2007US$ million
2709 Crude Oil From Petroleum And Bituminous Minerals 18,503.75 2605 Cobalt Ores And Concentrates 244.37 7402 Unrefnd Cppr; Cppr Anods F Elctroltc Refining 172.99 2603 Copper Ores And Concentrates 131.83 2515 Marble, Travertine Etc. And Alabaster, Crude Etc. 120.63 2401 Tobacco, Unmanufactured; Tobacco Refuse 119.15 7403 Refined Copper & Alloys (No Mast Alloy), Unwrought 108.41 8105 Cobalt Mattes Etc, Cobalt & Art, Inc Waste & Scrap 99.08 1207 Oil Seeds & Oleaginous Fruits Nesoi, Broken Or Not 82.97 7401 Copper Mattes; Cement Copper (Precipitated Copper) 57.34
Source: World Trade Atlas
12

Top 10 Chinese Exports to COMESAHS Description D2007
US$ million
8517 Electric Apparatus For Line Telephony Etc, Parts 764.92 7308 Structures Nesoi & Parts Thereof, Of Iron Or Steel 215.09 9801 Expts Of Repaired Impts; Impts Of Returned Expts 209.95 5407 Woven Fab Of Syn Fil Yn, Incl Monofil 67 Dec Etc 207.88 6104 Women's Or Girls' Suits, Ensemb Etc, Knit Or Croch 204.87 8711 Motorcycles (Incl Mopeds) & Cycles With Aux Motor 202.98 6103 Men's Or Boys' Suits, Ensembles Etc, Knit Or Croch 200.66 4011 New Pneumatic Tires, Of Rubber 191.17 8704 Motor Vehicles For Transport Of Goods 185.96 6402 Footwear, Outer Sole & Upper Rubber Or Plast Nesoi 181.61
Source: World Trade Atlas
13

Opportunities for COMESA• Engage and encourage trade with China• Involvement in higher value added
activities• Upgrading key industries in which COMESA
is already exporting raw materials
14

Case Studies: Latin America and ChinaCase Studies: Latin America and China
15
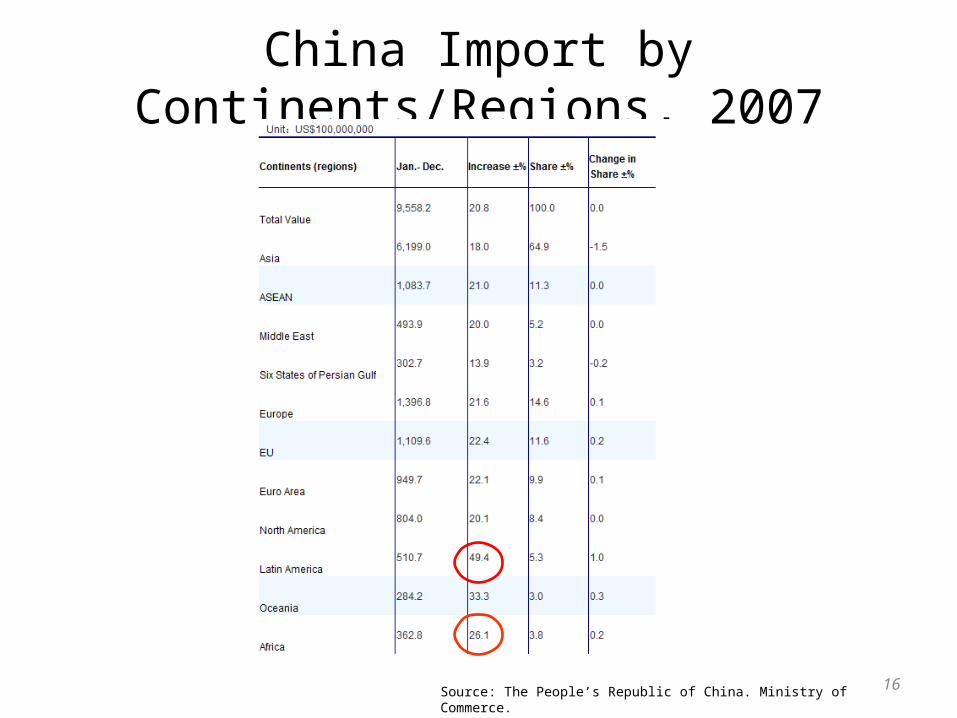
China Import by Continents/Regions, 2007
16Source: The People’s Republic of China. Ministry of Commerce.

China’s Trade with Latin America, 1995-2005
17

The Commodity Composition of China-Latin American Trade, 1999-2005
18

China’s commodity Imports from Latin America,1999 and 2005
19

China’s Commodity Exports to Latin America, 1999 and 2005
20

China’s Trade with Latin America and Africa
• Both regions export a diversified set of raw materials to China
• Latin America’s commodity exports to China are more processed than those from Africa
• China’s manufactured exports to Latin America are diversified than those to Africa
• A key challenge for both Latin America and Africa is to avoid declining terms of trade with China, where the cost of raw material exports rises less than manufactured imports

Case Studies: China Vs MexicoCase Studies: China Vs Mexico
22

Mexico vs. China
Head-to-head competition in U.S. market China is world’s leading exporter of many
manufactures, esp. consumer goods China and Mexico are typically among the top
three exporters to the U.S. market in many product categories
China is moving ahead of Mexico with dominant market shares in the United States, especially in 2000-2005 period
23

24
Composition of Mexico’s Exports to the World Market, 1986-2006
Source: UN Comtrade.
2502141881651611581661361171109680615246272623202119
0
10
20
30
40
50
60
1986 1988 1990 1992 1994 1996 1998 2000 2002 2004 2006
% E
xpor
t M
arke
t
Primary Products
Resource Based Manufactures
Low Tech Manufactures
Medium Tech Manufactures
High Tech Manufactures
TotalExportsUS $B

25
Composition of China’s Exports to the World Market, 1987-2006
Source: UN Comtrade.
96976259343832626624919518418315114912192857262534839
0
10
20
30
40
50
60
1987 1989 1991 1993 1995 1997 1999 2001 2003 2005
% E
xpor
t M
arke
tPrimary Products
Resource Based Manufactures
Low Tech Manufactures
Medium Tech Manufactures
High Tech Manufactures
TotalExportsUS $B

Product (SITC categories)% Market Share in
USA
Change in % Market Share
2000-2007Product (SITC categories)
% Market Share in
USA
Change in % Market Share
2000-2007
054 Vegetables, fresh, chilled, frozen; roots, tubers and other edible vegs
59.9 -1.0 894 Baby carriages, toys, games and sporting goods 83.9 19.3
773 Equipment for distributing electricity, n.e.s.
50.8 -9.9 763 Sound recorders; television image and sound recorders 76.1 53.9
761 TV receivers (including video monitors & projectors)
48.0 -15.5 831 Trunks, suitcases, vanity cases, binocular, camera cases, handbags, wallets, etc.
74.2 24.3
782 Motor vehicles for the transport of goods 46.6 15.0 851 Footwear 72.8 10.9772 Electrical apparatus for switching or
protecting electrical circuits28.3 3.9 697 Household equipment of base metal, n.e.s. 66.4 30.7
872 Instruments and appliances for medical, surgical, dental or veterinary purposes
26.9 6.7 813 Lighting fixtures and fittings, n.e.s. 65.5 7.1
741 Heating and cooling equipment and parts thereof, n.e.s
25.8 1.5 848 Articles of apparel and clothing accessories; non-textile fabrics
56.2 11.4
775 Household type electrical and nonelectrical equip.
25.6 5.9 752 Automatic data processing machines; magnetic or optical readers;
49.3 38.0
658 Made-up articles of textile 48.8 24.7821 Furniture and parts; bedding, mattresses, supports,
cushions47.7 24.1
762 Radio-broadcast receivers 45.4 10.0759 Parts and accessories for use office machines 44.5 33.0775 Household type electrical and nonelectrical equip. 44.2 7.0893 Articles, n.e.s. of plastics 42.8 11.9842 Women's or girls' coats, capes, jackets, suits, trousers,
dresses, skirts, underwear, etc. of woven textiles42.4 26.6
751 Office machines 41.9 12.7761 TV receivers (including video monitors & projectors) 38.7 36.2764 Telecommunications equipment, n.e.s. and
telecommunications accessories37.3 27.0
771 Electric power machinery 32.6 10.8899 Miscellaneous manufactured articles 31.8 -11.0699 Manufactures of base metal, n.e.s. 31.2 17.6845 Articles of apparel, of textile fabrics, whether or not knitted
or crocheted31.2 20.4
778 Electrical machinery and apparatus 26.6 14.7844 Women's or Girls' Coats, Capes, Jackets, Suits, Trousers,
Dresses, Underwear, etc. (except swimwear and coated etc. apparel), knitted or crocheted
29.3 25.3
625 Rubber Tires, Interchangeable Tire Treads, Tire Flaps and Inner Tubes
26.0 19.4
Source: United States International Trade Commission and US Department of Commerce. (http://dataweb.usitc.gov) downloaded Feb. '081Criteria: Over 2 Billion in US Imports from China or Mexico in 2007 at the 3 digit SITC level
Mexico China
Top US Imports in which Mexico and/or China hold 40% or more of the US market, 2007
26

Mexico's and China's Competing Exports to the United States, 2000-2007
27

28Source: USITC http://dataweb.usitc.gov downloaded Feb 22, 2008
Source: USITC http://dataweb.usitc.gov downloaded Feb 22, 2008
Main Competitors in the U.S. Market for Automatic Data Processing Machines and Units(SITC 752)
0%
10%
20%
30%
40%
50%
60%
2000 2001 2002 2003 2004 2005 2006 2007
Year
Pe
rcen
t o
f U
.S.
Mar
ket
China
Malaysia
Mexico
Thailand
Singapore
Japan

29Source: USITC http://dataweb.usitc.gov downloaded Feb 22, 2008
Source: USITC http://dataweb.usitc.gov downloaded Feb 22, 2008
Main Competitors in the U.S. Market for Telecommunication Equipment and Parts (SITC 764)
0%
10%
20%
30%
40%
2000 2001 2002 2003 2004 2005 2006 2007
Year
Per
cen
t o
f U
.S.
Mar
ket
China
Mexico
Korea
Japan
Malaysia
Canada

30Source: USITC http://dataweb.usitc.gov downloaded Feb 22, 2008
Source: USITC http://dataweb.usitc.gov downloaded Feb 22, 2008
Main Competitors in the U.S. Market for Furniture and Parts (SITC 821)
0%
10%
20%
30%
40%
50%
2000 2001 2002 2003 2004 2005 2006 2007
Year
Per
cen
t o
f U
.S.
Mar
ket
China
Canada
Mexico
Vietnam
Italy

31Source: USITC http://dataweb.usitc.gov downloaded Feb 22, 2008
Source: USITC http://dataweb.usitc.gov downloaded Feb 22, 2008
Main Competitors in the U.S. Market for Articles of Apparel and Clothing (SITC 84)
0%
10%
20%
30%
40%
2000 2001 2002 2003 2004 2005 2006 2007
Year
Pe
rcen
t o
f U
.S.
Mar
ket
China
Mexico
Vietnam
Indonesia
India
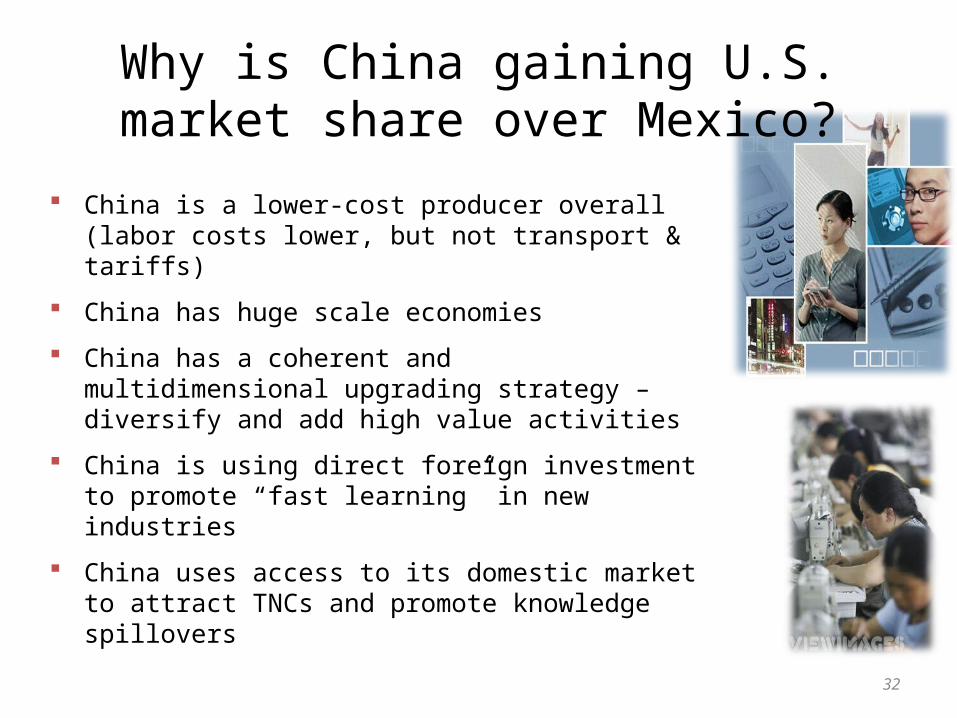
Why is China gaining U.S. market share over Mexico?
China is a lower-cost producer overall (labor costs lower, but not transport & tariffs)
China has huge scale economies
China has a coherent and multidimensional upgrading strategy – diversify and add high value activities
China is using direct foreign investment to promote “fast learning” in new industries
China uses access to its domestic market to attract TNCs and promote knowledge spillovers
32
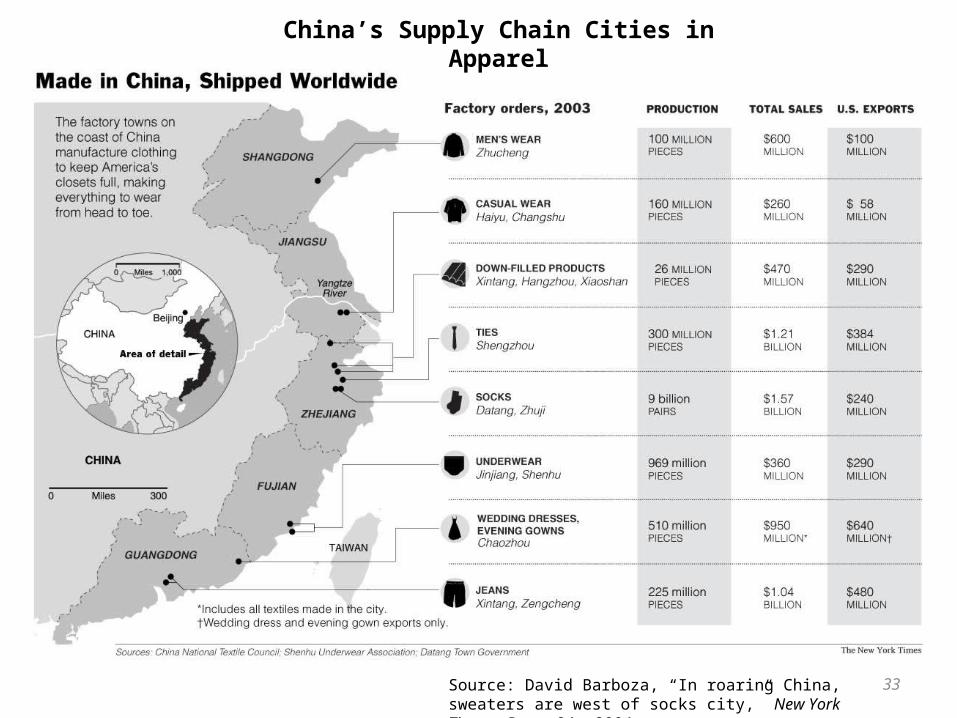
China’s Supply Chain Cities in Apparel
Source: David Barboza, “In roaring China, sweaters are west of socks city,” New York Times, Dec. 24, 2004.
33

34
What kinds of work are Chinese, Indian, and American engineers actually doing?• Answer: Not just product adaptation,
but cutting-edge research & commercialization
China: More than 1,000 MNC R&D Centers• GE’s China Technology Center:
Advanced research in energy storage, environmental management
• Microsoft Research Asia: Cutting-edge graphics & multimedia research
MNC R&D Centers in China, How are engineers being used?

Challenges and OpportunitiesChallenges and Opportunities
35

36
New actors (global buyers, global suppliers, and global intermediaries)
Rapid rise of new production centers (Taiwan, Korea, China, Mexico, India)
Higher capabilities required to enter chains (health and safety, speed, quality, responsiveness, IT)
Widening gap between connected and disconnected in developing world
Growing global consolidation (supply chains, countries)
Where we are today

Global Challenges and Opportunities
• Commodity export boom (L. America, Africa)• Find GVC niches (specialization, high value
products, local sourcing, fresh produce)• Take advantage of regional integration• Differentiated global services (tourism, finance,
IT)• Invest in R&D• Go “green” with environmentally friendly goods
and services (corporate sustainability)

Thank you for your attention!
Gary Gereffi, Director, CGGCDuke University
Center on Globalization, Governance & Competitiveness
[email protected]@soc.duke.edu


![[PPT]PowerPoint Presentation - Duke University · Web viewPowerPoint Presentation Last modified by Gary Thompson Company Duke Medicine](https://img.pdfslide.net/doc/110x75/5af151ed7f8b9a572b909831/pptpowerpoint-presentation-duke-university-viewpowerpoint-presentation-last.jpg)