Embed Size (px)
Citation preview

Gary Lagerloef, PhDScience on Tap, 7 April 20091
Apollo 17
December 1972
Climate Science
in the Space AgeGary Lagerloef
Oceanographer & Climate Scientist
Earth & Space Research
AZA, 16 September 2009Portland, OR
Gary Lagerloef, PhDScience on Tap, 7 April 20092
NASA Earth Observatories

Gary Lagerloef, PhDScience on Tap, 7 April 2009Climate Science in the
Space Age3
What is Measured by SatellitesWhat is Measured by Satellites
• Atmosphere– Temperature– Tropical Storms– Ozone– Humidity– Rainfall– Cloud structure– Evaporation– Aerosols– Carbon Dioxide– Carbon Monoxide– Energy balance
• This is not a complete list
• Atmosphere– Temperature– Tropical Storms– Ozone– Humidity– Rainfall– Cloud structure– Evaporation– Aerosols– Carbon Dioxide– Carbon Monoxide– Energy balance
• This is not a complete list
• Ocean– Sea level– Surface winds– Surface currents– Surface temperature– Ocean Salinity (coming
soon)– Ocean color (biology)
• Cryosphere– Sea ice cover– Ice sheet mass– Ice sheet elevation
• Ocean– Sea level– Surface winds– Surface currents– Surface temperature– Ocean Salinity (coming
soon)– Ocean color (biology)
• Cryosphere– Sea ice cover– Ice sheet mass– Ice sheet elevation

Gary Lagerloef, PhDScience on Tap, 7 April 2009Climate Science in the
Space Age4
Mapping Sea Level with SatellitesMapping Sea Level with Satellites
Sea water expands as it warms.
Very accurate satellite radar altimeters can measure changes in sea level with an accuracy of about 2 cm (less than an inch) from 800 miles high.
Jason-1

Gary Lagerloef, PhDScience on Tap, 7 April 2009Climate Science in the
Space Age5
Measuring Ocean Winds from Space
Measuring Ocean Winds from Space
Tropical Storm Emilia, July 26, 2006
Gary Lagerloef, PhDScience on Tap, 7 April 2009Climate Science in the
Space Age6
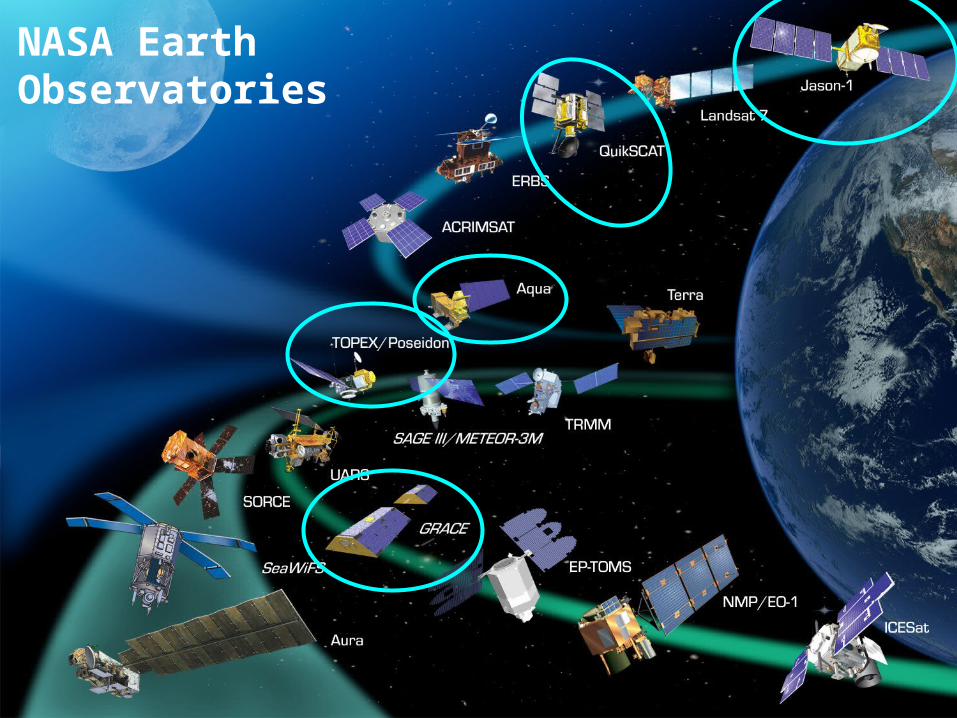
Ocean Currents from Satellite DataOcean Currents from Satellite Data
www.oscar.noaa.gov

Gary Lagerloef, PhDScience on Tap, 7 April 2009Climate Science in the
Space Age7
Apollo 17
Intergovernmental Panel on Climate Change (IPCC), Fourth Assessment (2007)
The Warming of Earth’s ClimateThe Warming of Earth’s Climate
Temperature rise during the past 25 years is about 0.18ºC (0.32º F) per decade.
This is about 4X faster than the past 150 years
Temperature rise during the past 25 years is about 0.18ºC (0.32º F) per decade.
This is about 4X faster than the past 150 years
Most of the satellite capability has developed during the past few decades when we also observed the most rapid increase in global warming

Gary Lagerloef, PhDScience on Tap, 7 April 2009Climate Science in the
Space Age8
Satellite Radar Altimeter Global Average Sea Level
Rise
Satellite Radar Altimeter Global Average Sea Level
Rise
About half the sea level rise is due to expansion as the ocean warms, and the other half is water added to the ocean from melting land ice.
About half the sea level rise is due to expansion as the ocean warms, and the other half is water added to the ocean from melting land ice.
Sea level is presently rising at about 1 foot (33 cm) per century.
This is about twice the 20th Century average
Sea level is presently rising at about 1 foot (33 cm) per century.
This is about twice the 20th Century average
Gary Lagerloef, PhDScience on Tap, 7 April 2009Climate Science in the
Space Age9
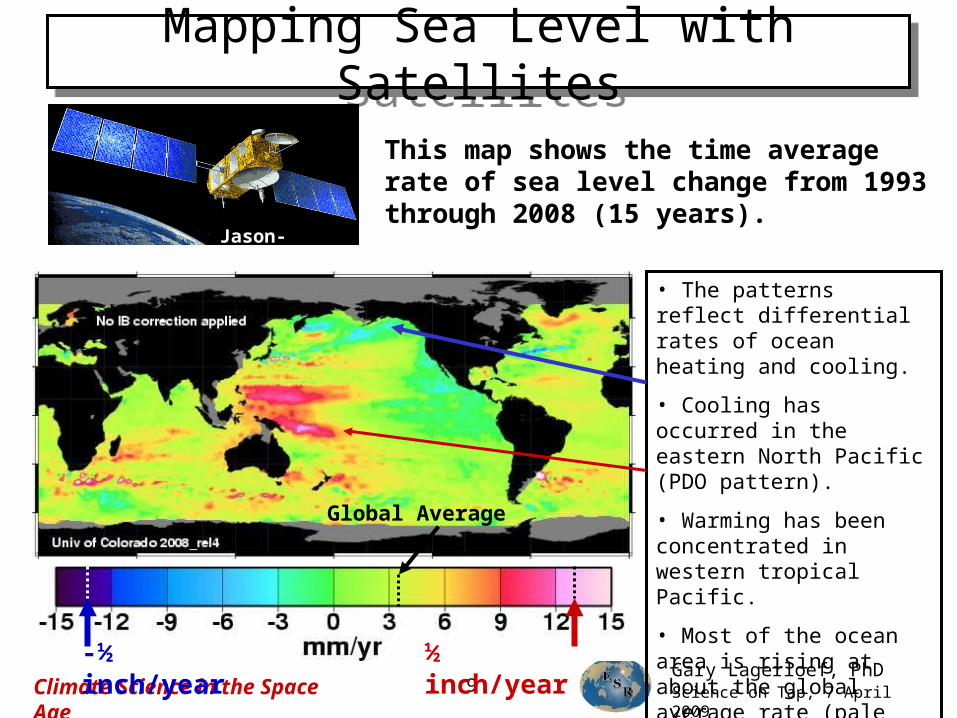
Mapping Sea Level with SatellitesMapping Sea Level with Satellites
This map shows the time average rate of sea level change from 1993 through 2008 (15 years).
Jason-1
• The patterns reflect differential rates of ocean heating and cooling.
• Cooling has occurred in the eastern North Pacific (PDO pattern).
• Warming has been concentrated in western tropical Pacific.
• Most of the ocean area is rising at about the global average rate (pale green color).
½ inch/year-½ inch/year
Global Average
Gary Lagerloef, PhDScience on Tap, 7 April 200910
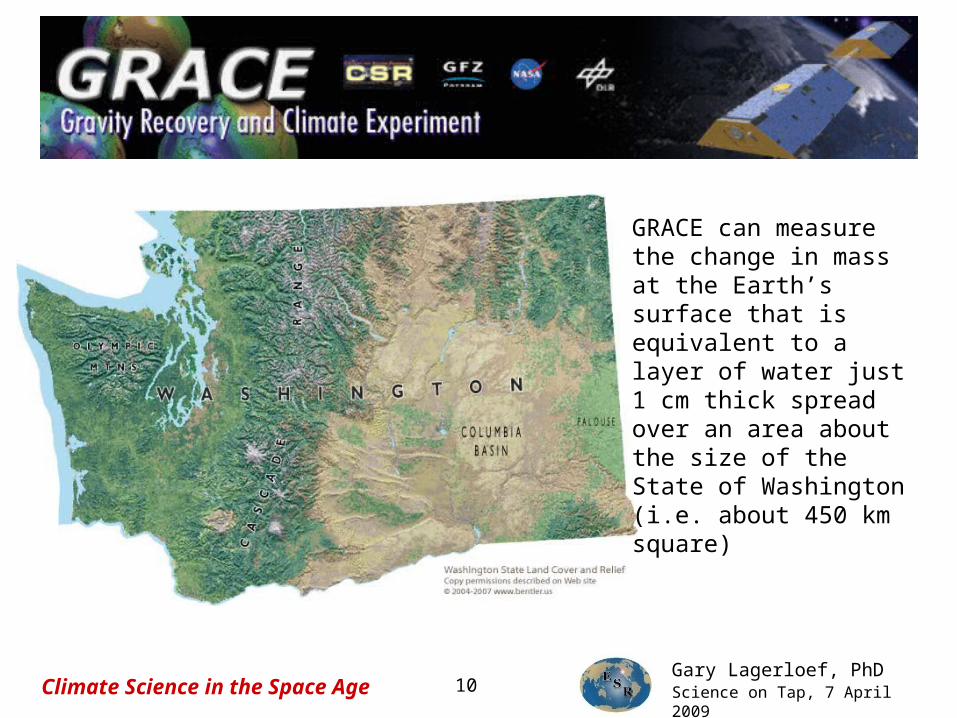
GRACE can measure the change in mass at the Earth’s surface that is equivalent to a layer of water just 1 cm thick spread over an area about the size of the State of Washington (i.e. about 450 km square)
Climate Science in the Space Age
Gary Lagerloef, PhDScience on Tap, 7 April 2009Climate Science in the
Space Age11
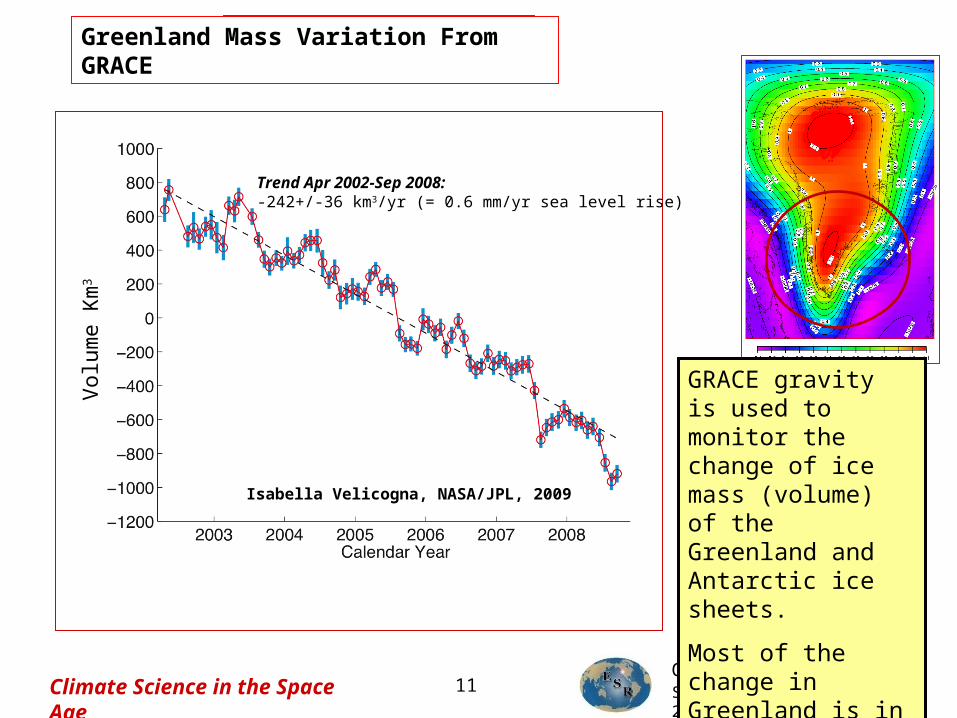
Trend, Apr 02-Jun07: -238 km3/yrGreenland Mass Variation From GRACE
Trend Apr 2002-Sep 2008: -242+/-36 km3/yr (= 0.6 mm/yr sea level rise)
Isabella Velicogna, NASA/JPL, 2009
GRACE gravity is used to monitor the change of ice mass (volume) of the Greenland and Antarctic ice sheets.
Most of the change in Greenland is in the southern half.
Vol
ume
Km
3

Gary Lagerloef, PhDScience on Tap, 7 April 2009Climate Science in the
Space Age
Vol
ume
Km
3
12
Antarctica Ice mass Change
---- Apr ‘02-Sep ‘07: -133 +/-80 km3/yr
-133 +/-80 km3/yr = 0.4 mm/yr sea level rise
Velicogna, 2008
Most of the Antarctic ice loss is from West Antarctica
The ice mass loss from Greenland and Antarctica together account for one third of the total observed sea level rise.
Trend Apr 2002-Sep 2008:
---- Apr ‘02-Sep 08: -174 +/-80 km3/yr ~ 0.5 mm/yr sea level
rise
Isabella Velicogna, NASA/JPL, 2009
Gary Lagerloef, PhDScience on Tap, 7 April 2009Climate Science in the
Space Age13
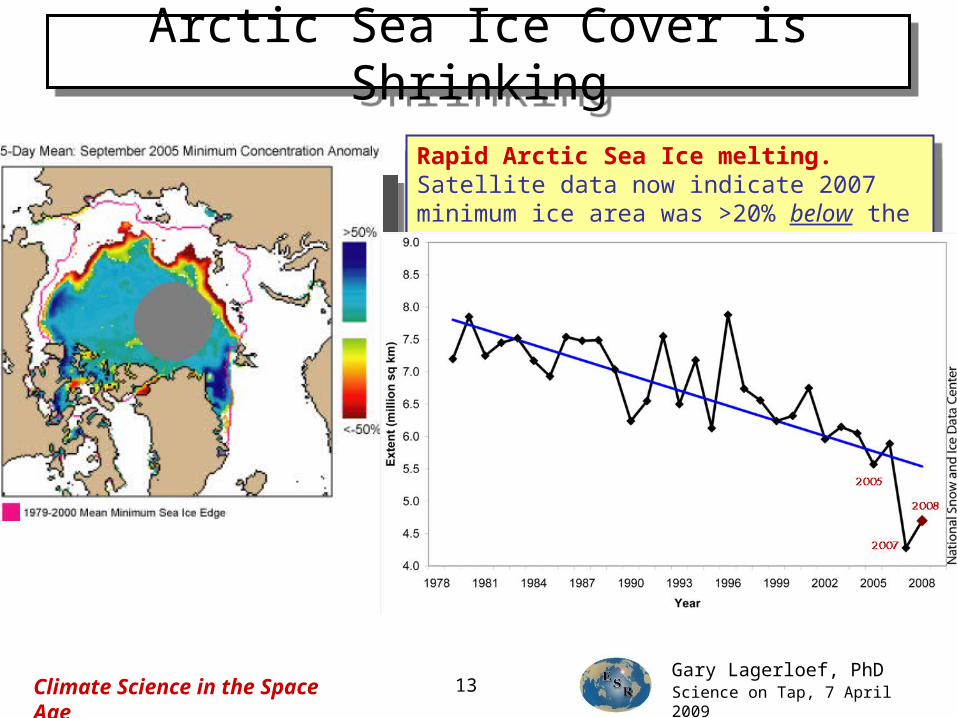
2007 2005
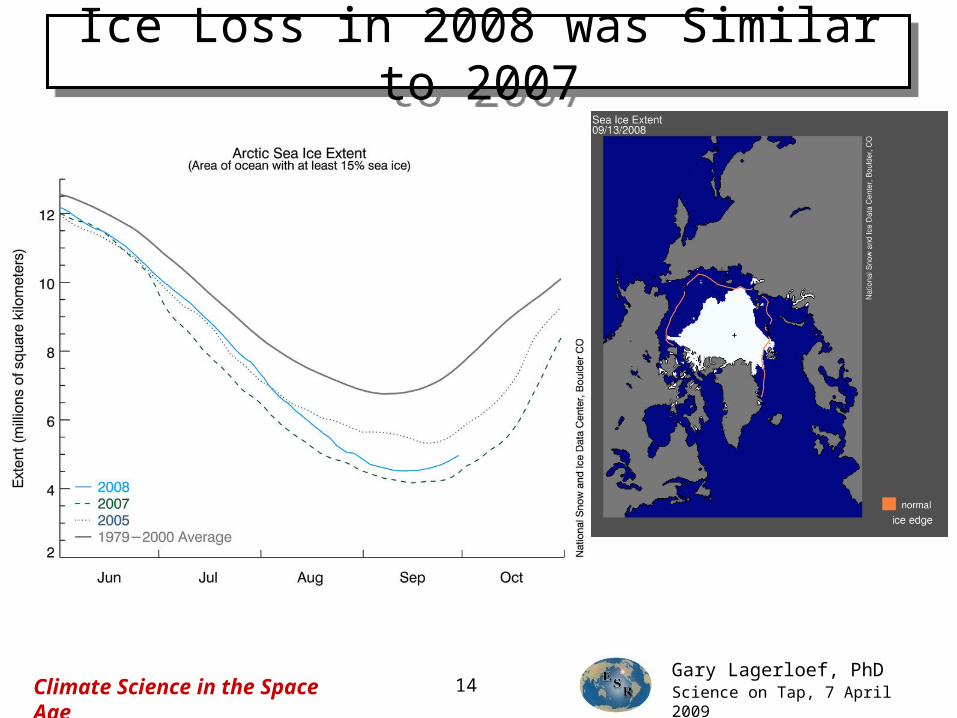
Arctic Sea Ice Cover is ShrinkingArctic Sea Ice Cover is Shrinking
Satellite data shows about 15% reduction since 1978, until a record minimum in 2005
Satellite data shows about 15% reduction since 1978, until a record minimum in 2005
Rapid Arctic Sea Ice melting. Satellite data now indicate 2007 minimum ice area was >20% below the previous low in 2005
Rapid Arctic Sea Ice melting. Satellite data now indicate 2007 minimum ice area was >20% below the previous low in 2005
Gary Lagerloef, PhDScience on Tap, 7 April 2009Climate Science in the
Space Age14
Ice Loss in 2008 was Similar to 2007
Ice Loss in 2008 was Similar to 2007

Gary Lagerloef, PhDScience on Tap, 7 April 2009Climate Science in the
Space Age15
Arctic Sea Ice Video in 2008Arctic Sea Ice Video in 2008

Gary Lagerloef, PhDScience on Tap, 7 April 2009Climate Science in the
Space Age16
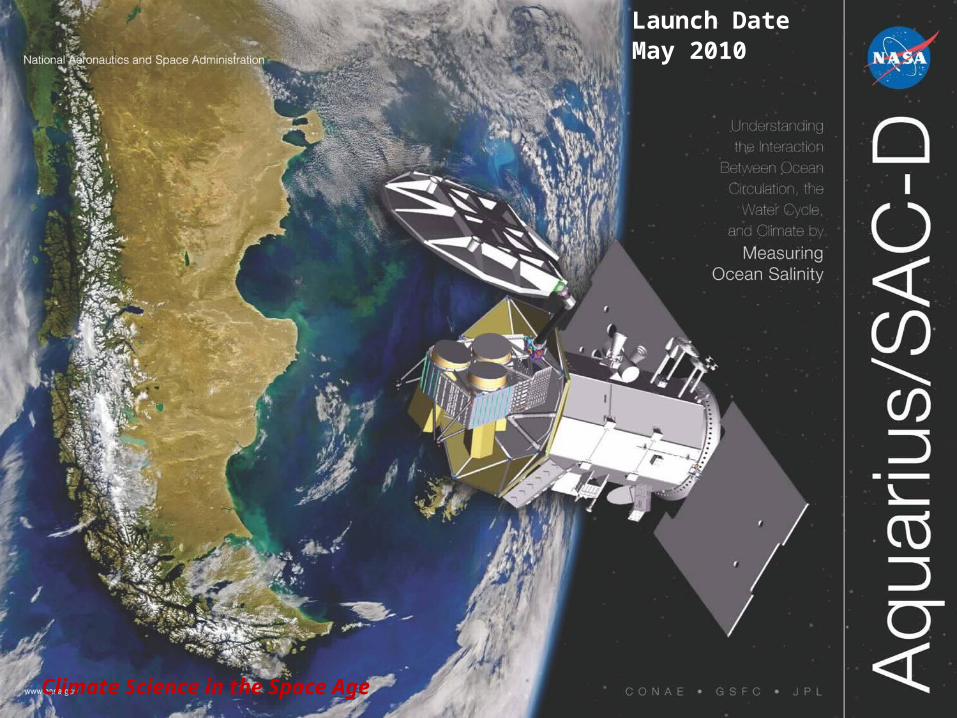
Understanding the Interactions Between the Ocean Circulation, Global Water Cycle and Climate by Measuring Sea Surface Salinity
Ocean Salinity; the Next Challenge
Ocean Salinity; the Next Challenge
WOA 2001 NOAA/NODC
Global salinity patterns are linked to rainfall and evaporation
Salinity affects seawater density, which in turn governs ocean circulation and climate
The higher salinity of the Atlantic sustains the oceanic deep overturning circulation
Salinity variations are driven by precipitation, evaporation, runoff and ice freezing and melting
Gary Lagerloef, PhDScience on Tap, 7 April 200917
Launch DateMay 2010
Climate Science in the Space Age


![EGU 2013, 8-12 April 2013, Vienna Session OS4.9 SMOS and Aquarius Inter-Comparison Over Oceans [and Land] Gary S.E. Lagerloef, Francois Cabot, Rajat Bindlish,](https://img.pdfslide.net/doc/110x75/55163861550346a2308b630a/egu-2013-8-12-april-2013-vienna-session-os49-smos-and-aquarius-inter-comparison-over-oceans-and-land-gary-se-lagerloef-francois-cabot-rajat-bindlish.jpg)