Embed Size (px)
Citation preview
Phone: (212) 787-6923 Fax: (212) 721-9028 e-mail: [email protected]
Allegro ENERGY CONSULTING
P.O. BOX 230592NEW YORK, NY 10023
CHERYL J. TRENCHPRESIDENT
Safety Incidents on Natural Gas Distribution Systems:
Understanding the Hazards
A report prepared for the
Office of Pipeline Safety U.S. Department of Transportation
April 2005
Cheryl J. Trench, 2005
Allegro Energy Consulting
The author gratefully acknowledges the many contributions of her associates
H. P. J. Rowland and J.T. Dibble to this report and its research.
The preliminary findings related to this research have been previously presented at the Office of Pipeline Safety Public Meeting on Enhancing Integrity Management of Gas Distribution
Pipelines (December 16, 2004, Washington, DC). They are also posted to Docket 19854 and are available at http://dms.dot.gov/search/document.cfm?documentid=315946&docketid=19854.
The preliminary findings have been finalized for this narrative, and some numbers differ slightly from those previously published.
The revisions have not resulted in a material change to any of the preliminary conclusions.
The compilations of PHMSA Form F 7100.1 data in this report are based on the PHMSA database as of October 2004.
Safety Incidents on Natural Gas Distribution Systems: Understanding the Hazards Table of Contents
Allegro Energy Consulting
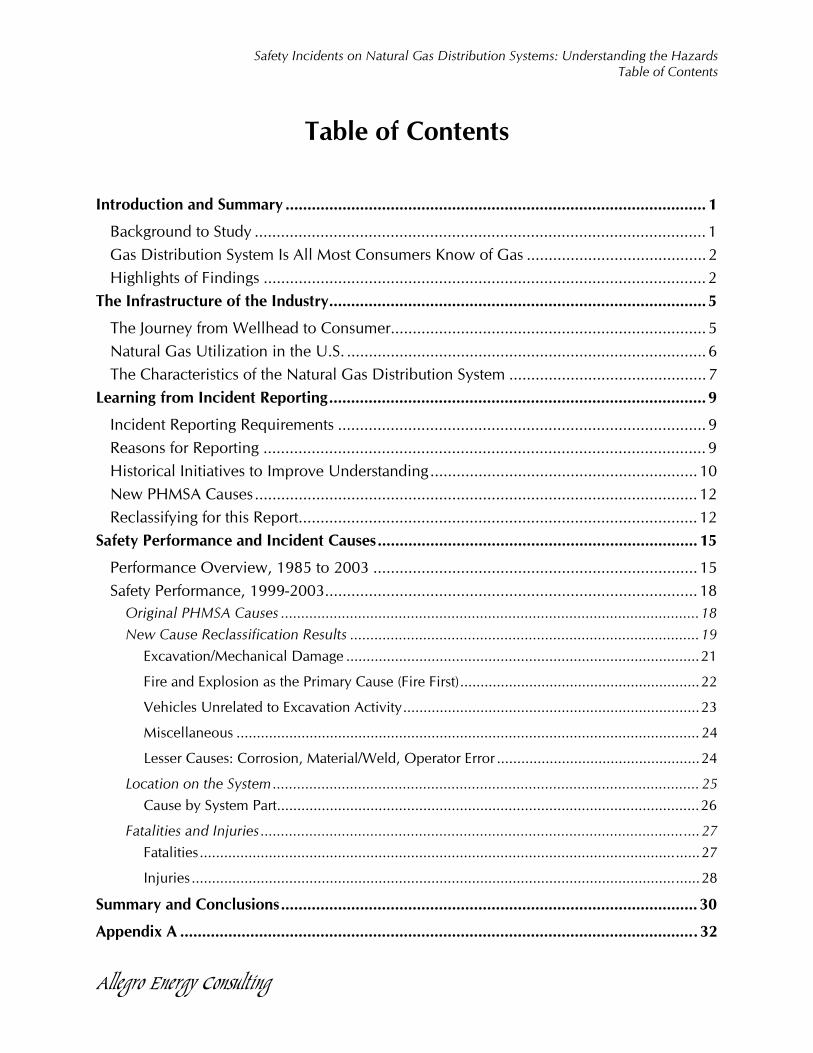
Table of Contents
Introduction and Summary ................................................................................................ 1
Background to Study ....................................................................................................... 1 Gas Distribution System Is All Most Consumers Know of Gas ......................................... 2 Highlights of Findings ..................................................................................................... 2
The Infrastructure of the Industry...................................................................................... 5
The Journey from Wellhead to Consumer........................................................................ 5 Natural Gas Utilization in the U.S. .................................................................................. 6 The Characteristics of the Natural Gas Distribution System ............................................. 7
Learning from Incident Reporting...................................................................................... 9
Incident Reporting Requirements .................................................................................... 9 Reasons for Reporting ..................................................................................................... 9 Historical Initiatives to Improve Understanding.............................................................10 New PHMSA Causes.....................................................................................................12 Reclassifying for this Report...........................................................................................12
Safety Performance and Incident Causes.........................................................................15
Performance Overview, 1985 to 2003 ..........................................................................15 Safety Performance, 1999-2003.....................................................................................18
Original PHMSA Causes .......................................................................................................18 New Cause Reclassification Results ......................................................................................19
Excavation/Mechanical Damage .......................................................................................21 Fire and Explosion as the Primary Cause (Fire First)...........................................................22 Vehicles Unrelated to Excavation Activity.........................................................................23 Miscellaneous .................................................................................................................. 24 Lesser Causes: Corrosion, Material/Weld, Operator Error ..................................................24
Location on the System......................................................................................................... 25 Cause by System Part........................................................................................................26
Fatalities and Injuries ............................................................................................................27 Fatalities...........................................................................................................................27 Injuries .............................................................................................................................28
Summary and Conclusions...............................................................................................30
Appendix A ......................................................................................................................32
Safety Incidents on Natural Gas Distribution Systems: Understanding the Hazards Table of Contents
Allegro Energy Consulting
Sample Narratives from PHMSA Form F 7100.1, 1999-2003.........................................32 Appendix B ......................................................................................................................34
Summary of Gas Distribution Incidents by Cause, 1999-2003.......................................34 Appendix C ......................................................................................................................35
Allegro Energy Consulting Classifications v OPS Old 5 Causes, 1999-2003 ..................35
Safety Incidents on Natural Gas Distribution Systems: Understanding the Hazards Introduction and Summary
Allegro Energy Consulting 1
Introduction and Summary
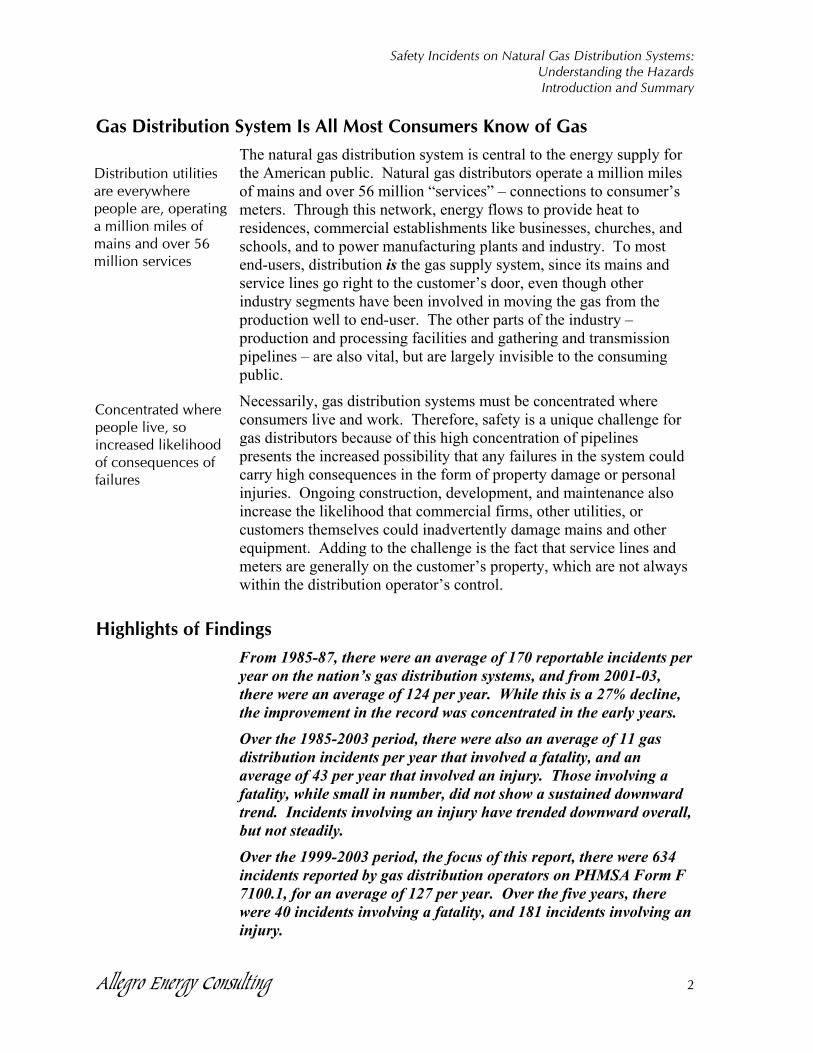
Background to Study This report examines the safety record of the natural gas distribution system over the period 1985 – 2003, with special emphasis on the incidents reported to the U.S. Department of Transportation’s Office of Pipeline Safety (OPS) for the years 1999 through 2003. OPS contracted with Allegro Energy Consulting to undertake this work as part of the agency’s multi-faceted initiative to improve the safety record of these systems. Gas distribution systems are involved in far more fatalities and injuries than the other types of pipelines that the agency regulates (gas transmission and hazardous liquid), and often are in the news because of incidents involving explosions and evacuations, a fact that has focused the attention of regulators, the Congress, industry and the public.
Strategies for improving the safety performance can only be developed after examining the record. This report takes this first step, examining in detail the information provided by the industry to the OPS regarding reportable safety incidents. That information was then reclassified into the diverse hazards reflected in the record. With the better understanding of the hazards – the causes and circumstances surrounding the incidents – a broad partnership of stakeholders can develop more finely targeted strategies to manage and control the risks involved. The ultimate goal is to prevent incidents from occurring.
Data for this report are drawn mainly from the Department of Transportation's Pipeline and Hazardous Materials Administration (“PHMSA”)1, which is the primary Federal regulator of the safety-related aspects of natural gas pipeline operations through its Office of Pipeline Safety ("OPS"). Most of the data have been taken directly from the agency's website, http://ops.dot.gov.
1 PHMSA, established in February 2005, is the successor agency to Research and Special Programs Administration ("RSPA").
Undertaken for the Office of Pipeline Safety, this study evaluates the safety record of gas distribution systems
Data for this study from DOT’s PHMSA, available on the internet
Understanding the diverse hazards was a central goal
Safety Incidents on Natural Gas Distribution Systems: Understanding the Hazards Introduction and Summary
Allegro Energy Consulting 2
Gas Distribution System Is All Most Consumers Know of Gas The natural gas distribution system is central to the energy supply for the American public. Natural gas distributors operate a million miles of mains and over 56 million “services” – connections to consumer’s meters. Through this network, energy flows to provide heat to residences, commercial establishments like businesses, churches, and schools, and to power manufacturing plants and industry. To most end-users, distribution is the gas supply system, since its mains and service lines go right to the customer’s door, even though other industry segments have been involved in moving the gas from the production well to end-user. The other parts of the industry – production and processing facilities and gathering and transmission pipelines – are also vital, but are largely invisible to the consuming public.
Necessarily, gas distribution systems must be concentrated where consumers live and work. Therefore, safety is a unique challenge for gas distributors because of this high concentration of pipelines presents the increased possibility that any failures in the system could carry high consequences in the form of property damage or personal injuries. Ongoing construction, development, and maintenance also increase the likelihood that commercial firms, other utilities, or customers themselves could inadvertently damage mains and other equipment. Adding to the challenge is the fact that service lines and meters are generally on the customer’s property, which are not always within the distribution operator’s control.
Highlights of Findings From 1985-87, there were an average of 170 reportable incidents per year on the nation’s gas distribution systems, and from 2001-03, there were an average of 124 per year. While this is a 27% decline, the improvement in the record was concentrated in the early years.
Over the 1985-2003 period, there were also an average of 11 gas distribution incidents per year that involved a fatality, and an average of 43 per year that involved an injury. Those involving a fatality, while small in number, did not show a sustained downward trend. Incidents involving an injury have trended downward overall, but not steadily.
Over the 1999-2003 period, the focus of this report, there were 634 incidents reported by gas distribution operators on PHMSA Form F 7100.1, for an average of 127 per year. Over the five years, there were 40 incidents involving a fatality, and 181 incidents involving an injury.
Distribution utilities are everywhere people are, operating a million miles of mains and over 56 million services
Concentrated where people live, so increased likelihood of consequences of failures
Safety Incidents on Natural Gas Distribution Systems: Understanding the Hazards Introduction and Summary
Allegro Energy Consulting 3
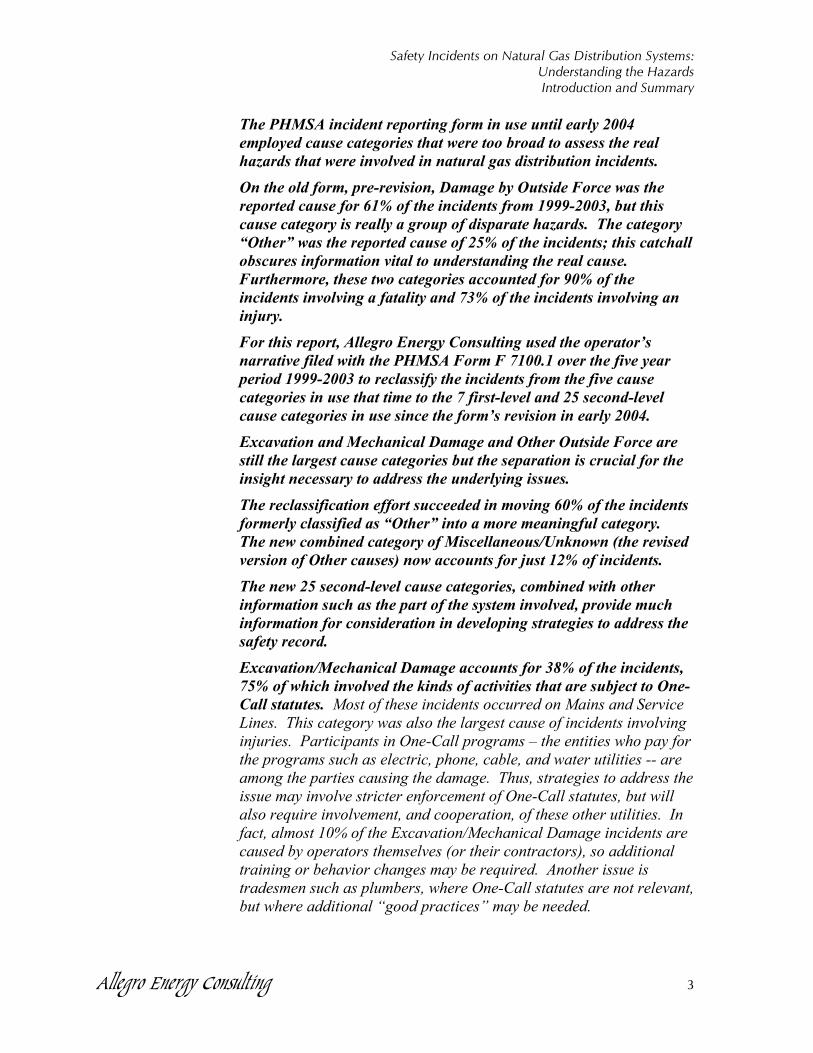
The PHMSA incident reporting form in use until early 2004 employed cause categories that were too broad to assess the real hazards that were involved in natural gas distribution incidents.
On the old form, pre-revision, Damage by Outside Force was the reported cause for 61% of the incidents from 1999-2003, but this cause category is really a group of disparate hazards. The category “Other” was the reported cause of 25% of the incidents; this catchall obscures information vital to understanding the real cause. Furthermore, these two categories accounted for 90% of the incidents involving a fatality and 73% of the incidents involving an injury.
For this report, Allegro Energy Consulting used the operator’s narrative filed with the PHMSA Form F 7100.1 over the five year period 1999-2003 to reclassify the incidents from the five cause categories in use that time to the 7 first-level and 25 second-level cause categories in use since the form’s revision in early 2004.
Excavation and Mechanical Damage and Other Outside Force are still the largest cause categories but the separation is crucial for the insight necessary to address the underlying issues.
The reclassification effort succeeded in moving 60% of the incidents formerly classified as “Other” into a more meaningful category. The new combined category of Miscellaneous/Unknown (the revised version of Other causes) now accounts for just 12% of incidents.
The new 25 second-level cause categories, combined with other information such as the part of the system involved, provide much information for consideration in developing strategies to address the safety record.
Excavation/Mechanical Damage accounts for 38% of the incidents, 75% of which involved the kinds of activities that are subject to One-Call statutes. Most of these incidents occurred on Mains and Service Lines. This category was also the largest cause of incidents involving injuries. Participants in One-Call programs – the entities who pay for the programs such as electric, phone, cable, and water utilities -- are among the parties causing the damage. Thus, strategies to address the issue may involve stricter enforcement of One-Call statutes, but will also require involvement, and cooperation, of these other utilities. In fact, almost 10% of the Excavation/Mechanical Damage incidents are caused by operators themselves (or their contractors), so additional training or behavior changes may be required. Another issue is tradesmen such as plumbers, where One-Call statutes are not relevant, but where additional “good practices” may be needed.
Safety Incidents on Natural Gas Distribution Systems: Understanding the Hazards Introduction and Summary
Allegro Energy Consulting 4
Fire/Explosion as the Primary Cause (“Fire First” in this report) accounts for 11% of the incidents. In these incidents, a fire caused by other factors such as faulty wiring secondarily involves an otherwise sound natural gas system. During the 1999-2003 period, the guidance in the instructions for Form 7100.1 directed operators not to report these incidents “unless the damage to facilities subject to Part 192 exceeds $50,000.” Since most damage is to residences or other buildings, not facilities subject to Part 192, most of these incidents did not get reported. Reporting is inconsistent, however, with one utility accounting for 25 out of the 71 Fire First incidents. The reporting of these incidents will increase, however, since it is now an accepted cause category. Thus, these incidents must be addressed. Particularly since these incidents largely involve non-jurisdictional facilities, and facilities outside the operator’s control, formulating an effective strategy for dealing with the incidents will require a broad partnership of stakeholders.
Vehicles Unrelated to Excavation Activity cause 11% of the incidents, 2/3 of them involving Meter Set Assemblies. These incidents are an excellent illustration of the difference between the hazards faced by the gas distribution system and other pipeline types that PHMSA regulates, such as gas transmission and oil pipelines. Vehicles were involved in 25% of the incidents causing a fatality, the largest share of any of the 25 causes. Again, only a coalition of stakeholders can develop an approach to reducing these incidents.
Non-jurisdictional assets or facilities are also an issue in the incidents involving “Miscellaneous” causes, where 23 out of 40 (at least) occurred on customer piping or appliances.
Operator Error, which accounts for just 6% of all reportable incidents, causes 16% of the incidents involving an injury, an over-representation.
This examination clearly points out many ways that the hazards causing gas distribution incidents are diverse, different from those faced by gas transmission and oil pipelines, often outside of the operator’s control, and often outside of the regulatory reach of the Office of Pipeline Safety. Because these incidents clearly have a societal impact, in deaths, injuries, property damage, burden on first responders in the community, and in a host of other ways, they must be addressed, however. Formulating a set of strategies that will reduce their occurrence and mitigate their impact will require a broad partnership of stakeholders.
Safety Incidents on Natural Gas Distribution Systems: Understanding the Hazards
The Infrastructure of the Industry
Allegro Energy Consulting 5
The Infrastructure of the Industry
The Journey from Wellhead to Consumer When the millions of consumers who use it think about natural gas – if they do at all – they think in terms of results: a warm home, for instance. The physical characteristics of natural gas – a colorless gas composed primarily of methane – dictate that it be transported by pipeline for each step of its journey from the producing field to the consumer.2 While some storage exists, the natural gas system is operated continuously.
Bringing natural gas to the consumer’s residence also requires a huge gathering and transmission system that, while virtually invisible to the consumer, is essential in getting the gas from the wellhead to the burner tip. The gathering system is made up of the small diameter pipelines that take the gas from various wellheads to the large transmission lines, much like small commuter airlines feed passengers to large mainline carriers. The transmission system is made up of large-diameter, high-pressure pipelines that carry the gas thousands of miles from the producing regions on the Gulf Coast to consuming regions, such as the Midwest and Northeast. They also bring gas from Canada’s western producing provinces to the U.S. West Coast, Midwest, and Northeast. There the long-distance lines connect with the distribution systems, which deliver the gas to consumers. To the customer, this process is both transparent and seamless.
The consumer is most familiar with the natural gas distribution system – the local utility companies that receive supplies from the large transmission lines and deliver it to individual consumers such as homeowners, offices or stores, and manufacturing plants. The distribution system’s lines are by definition located in market areas with high population density. The lines generally are small in diameter, cover a shorter geographic distance, and are operated at a relatively lower pressure than the transmission system. It is this part of the natural gas system that is the subject of this report.
2 Gas is sometimes liquefied for transoceanic transport from distant foreign suppliers. This liquefied natural gas (LNG) is re-gasified for pipeline transport to the ultimate consumer. More common abroad than in the United States, LNG currently accounts for only a small share of U.S. supplies. It is slated to grow rapidly in the next few years.
The consumer only sees the distribution system, not the rest of the pipelines between a gas producing field and city gate
The gas distribution system’s lines are smaller, shorter, and operate at lower pressure
Safety Incidents on Natural Gas Distribution Systems: Understanding the Hazards
The Infrastructure of the Industry
Allegro Energy Consulting 6
An understanding of the industry’s scope and infrastructure is useful as a backdrop for examining its safety record.
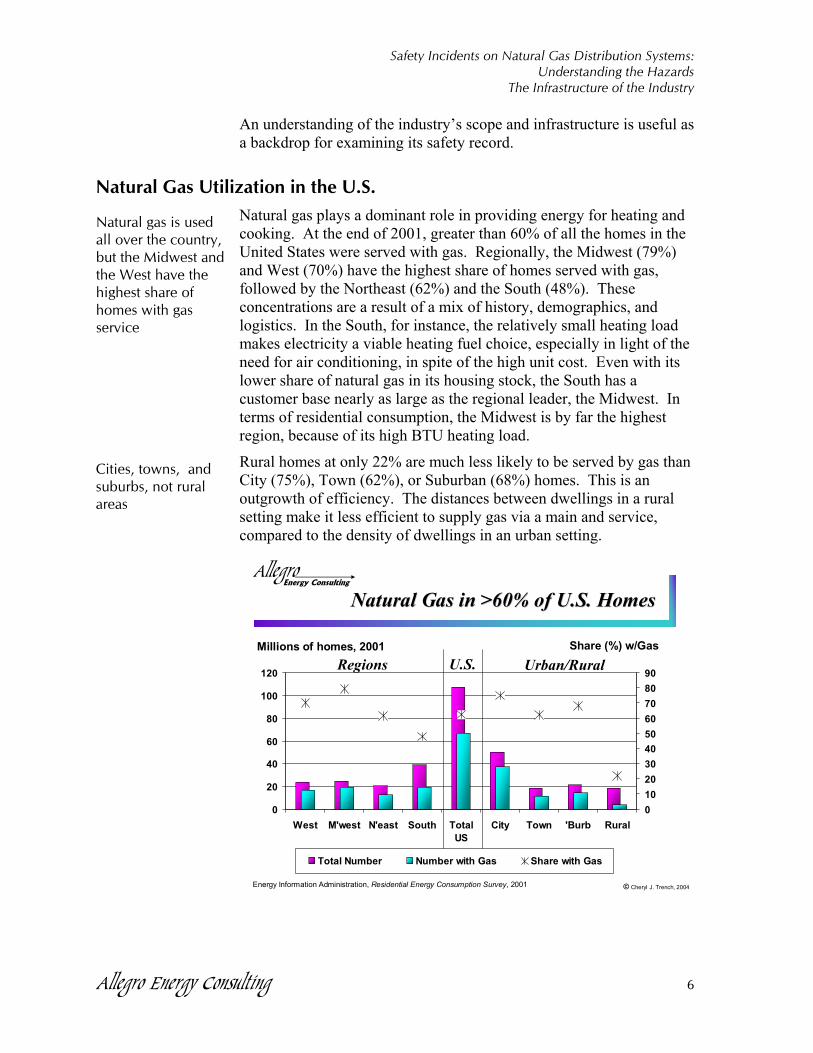
Natural Gas Utilization in the U.S. Natural gas plays a dominant role in providing energy for heating and cooking. At the end of 2001, greater than 60% of all the homes in the United States were served with gas. Regionally, the Midwest (79%) and West (70%) have the highest share of homes served with gas, followed by the Northeast (62%) and the South (48%). These concentrations are a result of a mix of history, demographics, and logistics. In the South, for instance, the relatively small heating load makes electricity a viable heating fuel choice, especially in light of the need for air conditioning, in spite of the high unit cost. Even with its lower share of natural gas in its housing stock, the South has a customer base nearly as large as the regional leader, the Midwest. In terms of residential consumption, the Midwest is by far the highest region, because of its high BTU heating load.
Rural homes at only 22% are much less likely to be served by gas than City (75%), Town (62%), or Suburban (68%) homes. This is an outgrowth of efficiency. The distances between dwellings in a rural setting make it less efficient to supply gas via a main and service, compared to the density of dwellings in an urban setting.
AllegroEnergy Consulting
© Cheryl J. Trench, 2004
Natural Gas in >60% of U.S. HomesNatural Gas in >60% of U.S. Homes
0
20
40
60
80
100
120
West M'west N'east South TotalUS
City Town 'Burb Rural0102030405060708090
Total Number Number with Gas Share with Gas
Millions of homes, 2001 Share (%) w/Gas
Regions U.S. Urban/Rural
Energy Information Administration, Residential Energy Consumption Survey, 2001
Natural gas is used all over the country, but the Midwest and the West have the highest share of homes with gas service
Cities, towns, and suburbs, not rural areas
Safety Incidents on Natural Gas Distribution Systems: Understanding the Hazards
The Infrastructure of the Industry
Allegro Energy Consulting 7
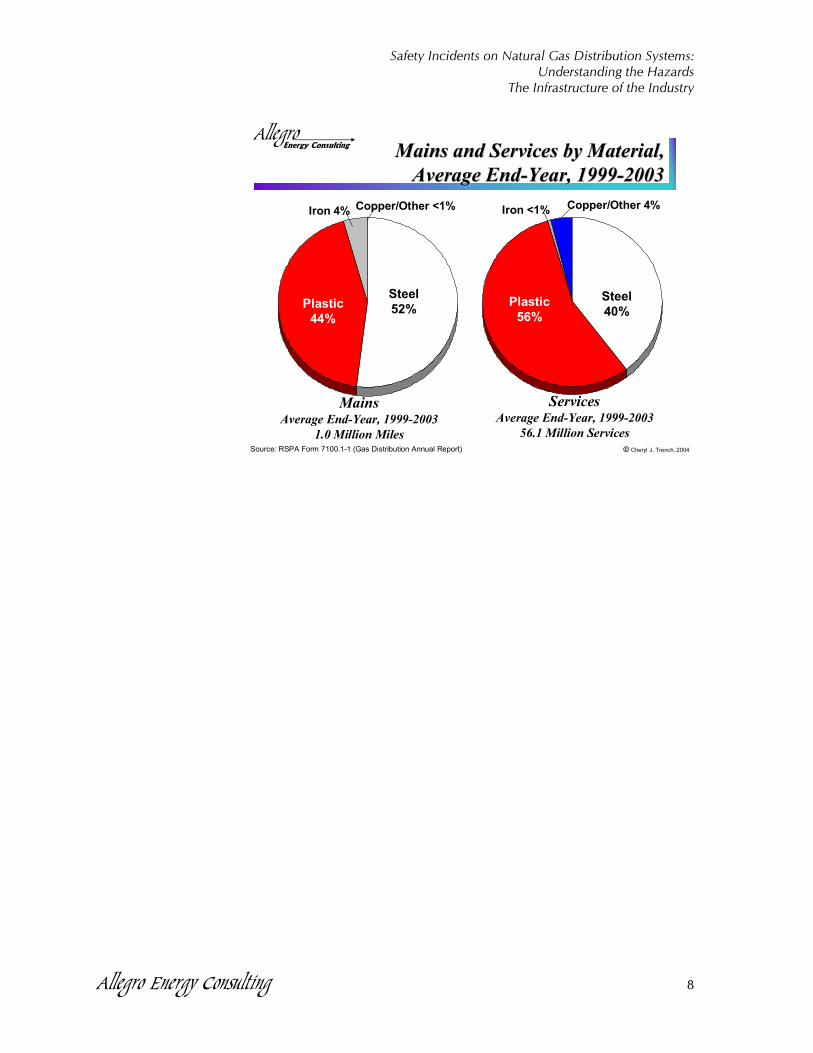
The Characteristics of the Natural Gas Distribution System PHMSA's reporting regulations (in Chapter 49, Part 191 of the Code of Federal Regulations) require operators of natural gas distribution systems to file PHMSA Form 7100.1-1, an annual report on system characteristics such as miles of main, type of pipe material, pipe diameter, and leaks. PHMSA’s Annual Report also asks for the number of each operator’s Service Lines or “services,” a measure of the individual connections to customer meters.3 It is not the same as the number of customers, as a Service Line may serve more than one customer. Even so, the number of services provides some additional insight into the industry, its infrastructure, and its challenges.
The materials used in the mains and services are an element in assessing the safety record. Transmission pipelines employ almost exclusively steel pipeline for the long distance routes they follow. In contrast, other materials – polyethylene in particular – are important in the distribution system’s infrastructure.
The pie charts illustrate that over half of the one million miles of main pipelines are constructed of steel, with polyethylene accounting for 44% of the pipeline miles. These two materials are by far the most important, with the third-ranked, cast iron pipe, accounting for just 4% of the total miles.
Cast iron pipe is no longer installed, so it is largely a vestige of an earlier infrastructure. Unlike the other materials which are more evenly spread across regions, cast iron pipe is concentrated in the Northeast: 51% of the cast iron pipe is in the Northeast where it accounts for 15% of the region’s mains.
Steel is less important in the Service Lines: more than half, 56%, of the 56 million services are constructed of polyethylene, and steel accounts for 40% of the services.
3 According to PHMSA regulations, a “main” line is a distribution line that serves as a common source of supply for more than one service line. A “service” line is a distribution line that transports gas from a common source of supply [i.e., a main] to a customer meter or the connection to a customer’s piping
Operators file an annual report on infrastructure
Steel, polyethylene for both mains and services
Steel more important in mains
Little cast iron, mainly in Northeast
Polyethylene more important in Service Lines
Safety Incidents on Natural Gas Distribution Systems: Understanding the Hazards
The Infrastructure of the Industry
Allegro Energy Consulting 8
AllegroEnergy Consulting
© Cheryl J. Trench, 2004
Mains and Services by Material,Mains and Services by Material,Average EndAverage End--Year, 1999Year, 1999--20032003
Steel52%Plastic
44%
Iron 4% Copper/Other <1%
MainsAverage End-Year, 1999-2003
1.0 Million Miles
Steel40%
Plastic56%
Copper/Other 4%
ServicesAverage End-Year, 1999-2003
56.1 Million Services
Iron <1%
Source: RSPA Form 7100.1-1 (Gas Distribution Annual Report)
Safety Incidents on Natural Gas Distribution Systems: Understanding the Hazards
Learning from Incident Reporting
Allegro Energy Consulting 9
Learning from Incident Reporting
Incident Reporting Requirements In addition to the annual report on infrastructure, Part 191 of PHMSA's regulations require operators of natural gas distribution systems to file a written account of each reportable safety incident. The Office of Pipeline Safety’s database of these incidents is the primary source for the data presented here.
Operators of natural gas distribution systems must file a PHMSA Form 7100.1 for:
(1) An event that involves a release of gas from a pipeline or of liquefied natural gas or gas from an LNG facility and
(i) A death, or personal injury necessitating in-patient hospitalization; or
(ii) Estimated property damage, including cost of gas lost, of the operator or others, or both, of $50,000 or more.
(2) An event that results in an emergency shutdown of an LNG facility.
(3) An event that is significant, in the judgment of the operator, even though it did not meet the criteria of paragraphs (1) or (2).
The report includes the site of the incident, the relative population density of the surrounding area, and the part of the system (Main, Service Line, Meter Set Assembly, or Other Part) where it occurred. Operators also report about the physical pipeline (pipe material, diameter, thickness, manufacturer, year manufactured, whether it is coated, whether it is cathodically protected), about operating conditions (operating pressure at the time of the incident, maximum operating pressure), and about other information.
Reasons for Reporting This report focuses on the period 1999 through 2003. The gas distribution industry reported 634 safety incidents in the United States over this period of time. Of these incidents, 33% were reportable because they involved a fatality or an injury and 48% were reported due to property damage alone. About 9% of the incidents were reported only because the operator considered them “significant;” they
Operators file a report for fatality, injury or $50,000 property damage
Safety Incidents on Natural Gas Distribution Systems: Understanding the Hazards
Learning from Incident Reporting
Allegro Energy Consulting 10
met none of the other reporting thresholds. A further 4% met the damage threshold and were significant in the view of the operator. Finally, 6% appear not to have met any criteria that made them reportable. Some of these incidents, for instance, occurred on customer lines and appliances that are beyond the scope of PHMSA’s regulations; distribution operators use their discretion as to whether to report incidents occurring on such facilities. For the purpose of this report, all 634 incidents were reviewed, including the incidents that appeared to be non-reportable.
It must be remembered that the vast majority of leaks on gas distribution systems occur without meeting any of the criteria that would make them a reportable “incident.” Events only become reportable incidents if they involve a high consequence such as a death or an injury or high property damage. Hundreds of thousands of leaks are repaired each year -- approximately 170,000 on mains and 369,000 on services annually from 1999-03 -- without the consequences reaching a regulatory threshold for reporting. This is a testament to the responsiveness of the industry in dealing with leaks in a safe manner. It is also a reminder that the frequency of high consequence incidents cannot be assessed from the reportable incidents alone. For instance, one cannot look at reportable incidents caused by corrosion and conclude that a high share of corrosion leaks involve injuries. In fact, the vast majority of corrosion leaks involve no high consequence outcome.
Historical Initiatives to Improve Understanding Understanding the causes of safety incidents is paramount in evaluating and reducing the likelihood of their occurrence. Putting the incidents in the right “bucket” for classification allows observers to learn from them more effectively, and alter procedures, hardware and behavior appropriately.
The causes used on the OPS pipeline incident reporting forms were extremely broad, however, and included a wide diversity of hazards. For the gas distribution reporting, the causes in use prior to 2004 were: Accidentally Caused by Operator, Construction Defect or Operation Error, Corrosion, Damage by Outside Force, and Other. These old “Big Bucket” PHMSA causes clearly resulted in large numbers of incidents that fall into categories which are too general to allow for analysis.
The limitation inherent in the breadth of the cause categories has been recognized for decades, resulting in:
• industry initiatives to reclassify to narrower cause categories,
Vast majority of leaks and other events are not reportable; no high consequence
First, classify the incident in the right “bucket”
Even big bucket categories must include similar hazards
Safety Incidents on Natural Gas Distribution Systems: Understanding the Hazards
Learning from Incident Reporting
Allegro Energy Consulting 11
• an oil pipeline industry initiative to construct an entire voluntary spill reporting structure to capture more detail and more useful cause information, and
• the OPS redesign of the incident reporting forms for each of its regulated pipeline segments – hazardous liquids, gas transmission and gas distribution.
While the evolution of incident reporting may appear a simple historical transition, the enhanced data has provided important insights that can be translated directly into improved performance. As the different parts of the pipeline industry have become more knowledgeable about the diversity of the hazards, they have been able to allocate resources more intelligently to address them.
The first of the efforts to understand the causes of incidents involved the liquids pipelines (through the American Society of Mechanical Engineers’ B31.4 Committee), followed by the gas transmission pipelines (through PRCI, a subscriptions-based industry research and development group). Industry groups took the operator reports of safety incidents filed with PHMSA data and “audited” the original submissions, using the narrative filed by the operator to reclassify incidents into a more detailed set of cause categories. Because these cause categories more closely parallel the operational challenges, the industry groups could make responsive changes to operating standards. Kiefner & Associates of Worthington, OH, has done the audit and reclassification work for both the liquids and gas transmission pipelines.
Under contract to Allegro Energy Consulting for an earlier report, Kiefner & Associates also performed a similar audit and reclassification of the gas distribution system incident reports, marking the first time such an effort had been undertaken for the gas distribution industry’s reports on PHMSA Form 7100.1. The Kiefner & Associates audit covered incidents occurring from 1996-99. The reclassification work clearly demonstrated that the very large category Damage by Outside Force included many incidents that were not traditional excavation damage. (See Allegro Energy Consulting, The Safety Performance of Natural Gas Distribution Systems, prepared for Gas Research Institute, Topical Report GRI 01/0041, February 2001.)
The oil pipeline industry advanced the use of the more clearly delineated cause categories in its voluntary spill reporting system, Pipeline Performance Tracking System (“PPTS”). Industry-run and maintained, the establishment of this program in 1999 was a watershed event. PPTS receives reports of releases as small as 5 gallons plus all spills to water (compared to the OPS reporting threshold at the time of 2100 gallons), and gathers significantly more detail than had
Improved data is a first step toward improved performance
Earlier efforts have reclassified incident causes for both liquids and gas transmission pipelines
Earlier work on gas distribution revealed that Damage by Outside Force was more than just excavation
Safety Incidents on Natural Gas Distribution Systems: Understanding the Hazards
Learning from Incident Reporting
Allegro Energy Consulting 12
previously been collected. More important, the industry set up a committee structure to learn from the new detail, and report back to participants on its findings. The compilations from PPTS have contributed to significantly finer understanding of the role of different hazards and issues impacting public safety.
New PHMSA Causes OPS re-designed each of its incident report forms over the 2002-2004 period. Following the industry’s lead, the agency’s new forms include significant new detail, and more narrowly defined causes.
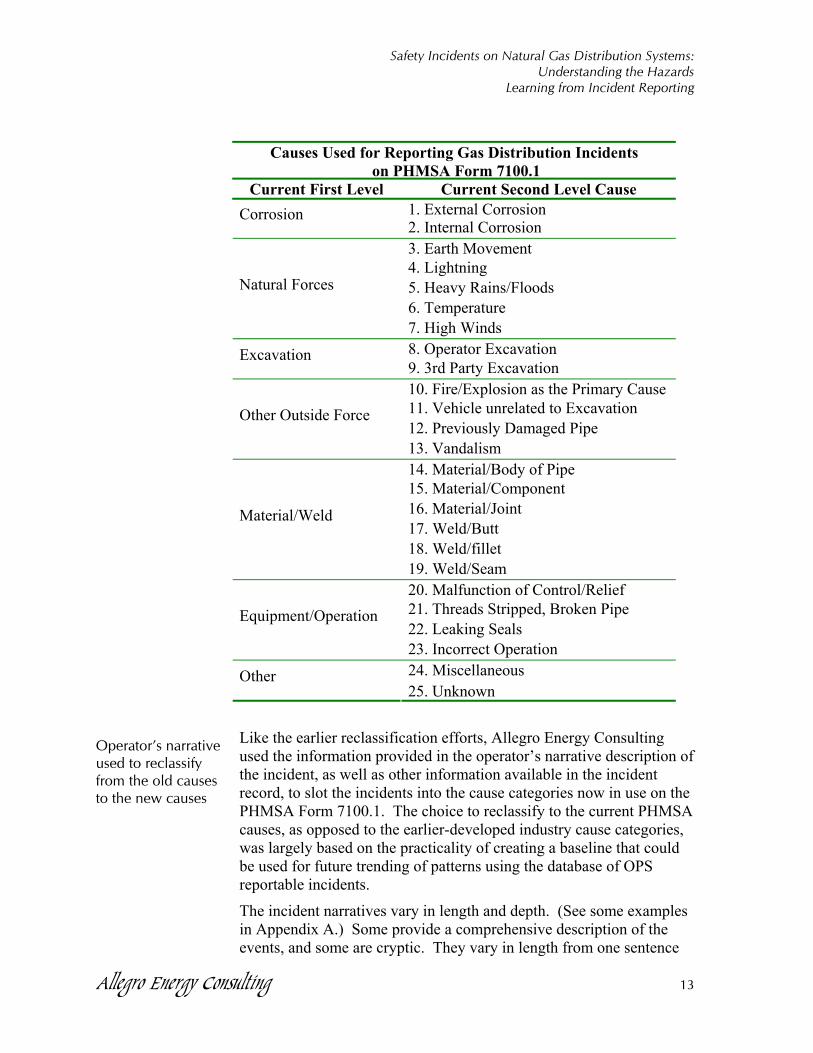
The revised PHMSA Form 7100.1 that went into use in early 2004 called for more specificity in the reporting of causes. The five old first-level causes -- “Big Buckets” -- were replaced by seven Big Bucket, first-level causes and 25 second-level causes. The new 25 “Small Buckets” allow for a more detailed analysis of the incidents. The new first-level and second-level causes are listed in the table on the next page.
The causes, while not identical to those adopted by the industry in its reclassifications, are nonetheless significantly modeled on the concept of grouping like-hazards together. Natural Forces, for instance, are now a stand-alone first-level category, with appropriate subcategories. Formerly, natural force damage was a subset of “Damage by Outside Force.” Likewise, Excavation Damage is now its own first-level category and is split into Operator Excavation and 3rd Party Excavation. It is important both to break out the category and to recognize the role of operators in causing excavation damage. The recognition of “Other Outside Force Damage” as a stand-alone category is also worthwhile, since these incidents – especially those caused by vehicles, fires, vandalism -- will not be prevented at all by programs aimed at excavation damage. Understanding the role of Other Outside Force incidents is critical to understanding the hazards involved in gas distribution safety incidents.
Reclassifying for this Report Given Allegro Energy Consulting’s earlier work analyzing liquids pipeline incidents from OPS and from the industry’s PPTS, as well as its earlier reports on gas transmission and gas distribution incidents, this report on the gas distribution record, from the beginning, centered around reclassifying the incidents to a narrower set of cause categories that brought the hazards into sharper focus and fostered new insights.
New PHMSA form has smaller, better-delineated buckets
Safety Incidents on Natural Gas Distribution Systems: Understanding the Hazards
Learning from Incident Reporting
Allegro Energy Consulting 13
Causes Used for Reporting Gas Distribution Incidents on PHMSA Form 7100.1
Current First Level Current Second Level Cause 1. External CorrosionCorrosion 2. Internal Corrosion 3. Earth Movement 4. Lightning 5. Heavy Rains/Floods 6. Temperature
Natural Forces
7. High Winds 8. Operator Excavation Excavation 9. 3rd Party Excavation 10. Fire/Explosion as the Primary Cause 11. Vehicle unrelated to Excavation 12. Previously Damaged Pipe
Other Outside Force
13. Vandalism 14. Material/Body of Pipe 15. Material/Component 16. Material/Joint 17. Weld/Butt 18. Weld/fillet
Material/Weld
19. Weld/Seam 20. Malfunction of Control/Relief 21. Threads Stripped, Broken Pipe 22. Leaking Seals
Equipment/Operation
23. Incorrect Operation 24. Miscellaneous Other 25. Unknown
Like the earlier reclassification efforts, Allegro Energy Consulting used the information provided in the operator’s narrative description of the incident, as well as other information available in the incident record, to slot the incidents into the cause categories now in use on the PHMSA Form 7100.1. The choice to reclassify to the current PHMSA causes, as opposed to the earlier-developed industry cause categories, was largely based on the practicality of creating a baseline that could be used for future trending of patterns using the database of OPS reportable incidents.
The incident narratives vary in length and depth. (See some examples in Appendix A.) Some provide a comprehensive description of the events, and some are cryptic. They vary in length from one sentence
Operator’s narrative used to reclassify from the old causes to the new causes
Safety Incidents on Natural Gas Distribution Systems: Understanding the Hazards
Learning from Incident Reporting
Allegro Energy Consulting 14
to more than a page. Insights gained from the narratives, along with the other information available in the reports, were used to reclassify the incident causes for the years 1999-2003. Almost all of the incidents provided enough information to make the classification with reasonable confidence. Any remaining ambiguities might result in moving a particular incident from one category to another, but are too few to have a material effect one the overall picture of the incidents causes and their impacts.
Incidents from the old five “Big Bucket” causes were placed into the new seven “Big Bucket” first-level causes and then into the 25 “Small Bucket” second-level causes. In addition, the reclassifications aggressively addressed the incidents that were previously classified under “Other” as a cause, and the incidents that were missing other designations such as the part of the system on which the incident occurred.
Special attention to reclassifying incidents attributed to “Other”
Narratives not perfect, but enough information to have confidence in outcome
Safety Incidents on Natural Gas Distribution Systems: Understanding the Hazards
Safety Performance
Allegro Energy Consulting 15
Safety Performance and Incident Causes
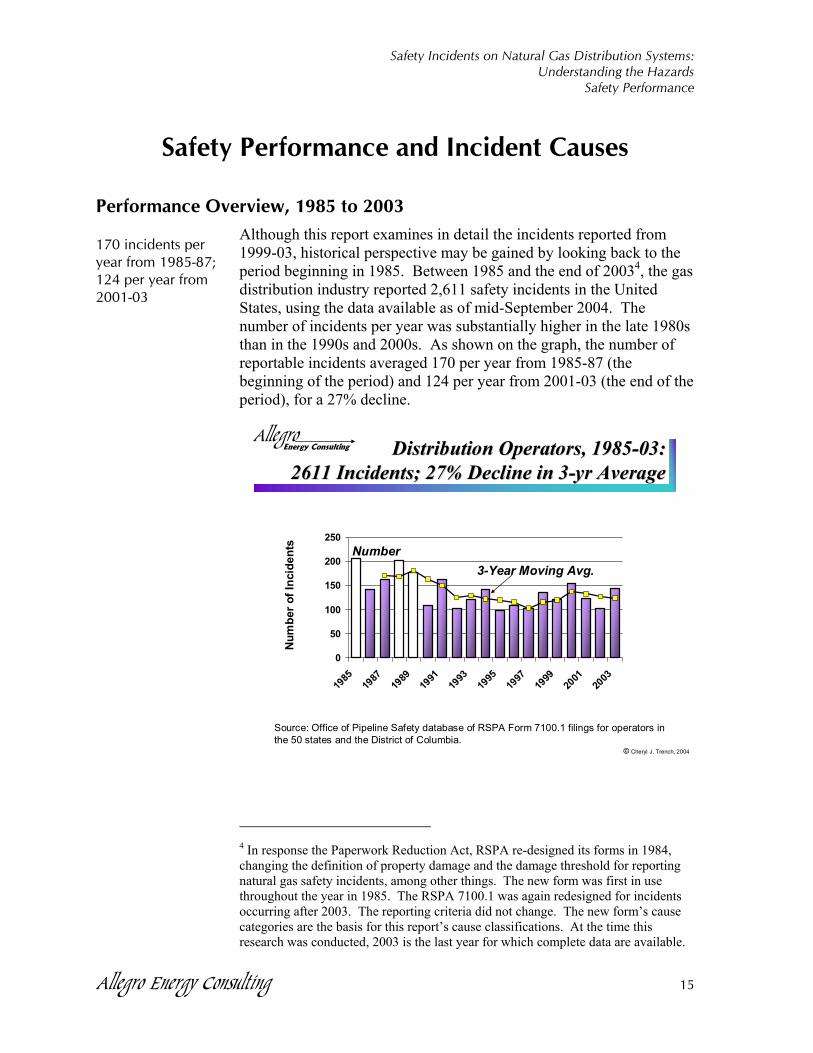
Performance Overview, 1985 to 2003 Although this report examines in detail the incidents reported from 1999-03, historical perspective may be gained by looking back to the period beginning in 1985. Between 1985 and the end of 20034, the gas distribution industry reported 2,611 safety incidents in the United States, using the data available as of mid-September 2004. The number of incidents per year was substantially higher in the late 1980s than in the 1990s and 2000s. As shown on the graph, the number of reportable incidents averaged 170 per year from 1985-87 (the beginning of the period) and 124 per year from 2001-03 (the end of the period), for a 27% decline.
AllegroEnergy Consulting
© Cheryl J. Trench, 2004
Distribution Operators, 1985Distribution Operators, 1985--03:03:2611 Incidents; 27% Decline in 32611 Incidents; 27% Decline in 3--yr Averageyr Average
Source: Office of Pipeline Safety database of RSPA Form 7100.1 filings for operators inthe 50 states and the District of Columbia.
Number3-Year Moving Avg.
Num
ber o
f Inc
iden
ts
0
50
100
150
200
250
1985
1987
1989
1991
1993
1995
1997
1999
2001
2003
4 In response the Paperwork Reduction Act, RSPA re-designed its forms in 1984, changing the definition of property damage and the damage threshold for reporting natural gas safety incidents, among other things. The new form was first in use throughout the year in 1985. The RSPA 7100.1 was again redesigned for incidents occurring after 2003. The reporting criteria did not change. The new form’s cause categories are the basis for this report’s cause classifications. At the time this research was conducted, 2003 is the last year for which complete data are available.
170 incidents per year from 1985-87; 124 per year from 2001-03
Safety Incidents on Natural Gas Distribution Systems: Understanding the Hazards
Safety Performance
Allegro Energy Consulting 16
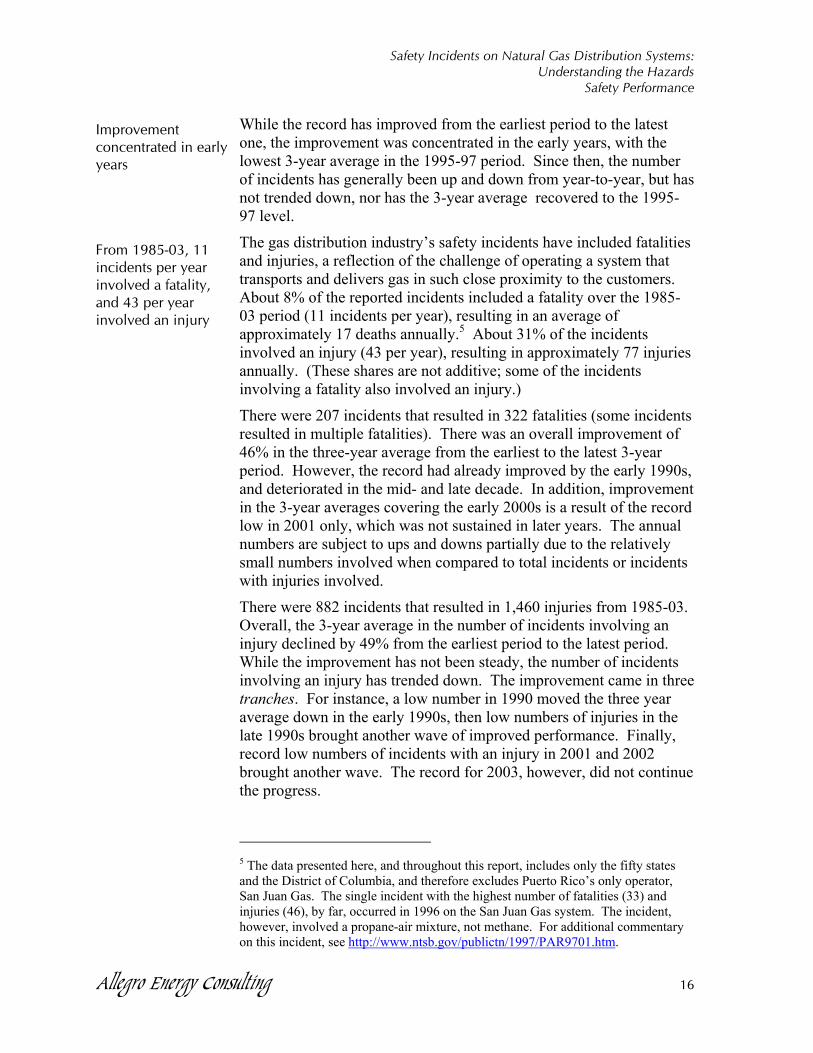
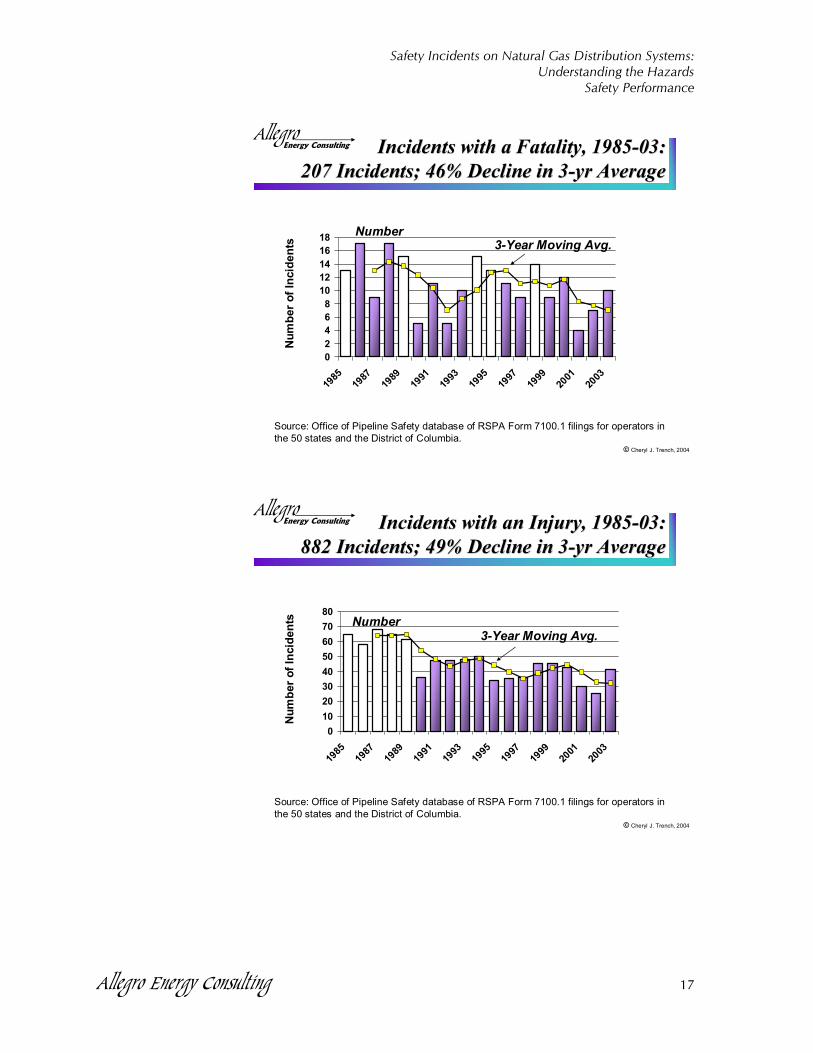
While the record has improved from the earliest period to the latest one, the improvement was concentrated in the early years, with the lowest 3-year average in the 1995-97 period. Since then, the number of incidents has generally been up and down from year-to-year, but has not trended down, nor has the 3-year average recovered to the 1995-97 level.
The gas distribution industry’s safety incidents have included fatalities and injuries, a reflection of the challenge of operating a system that transports and delivers gas in such close proximity to the customers. About 8% of the reported incidents included a fatality over the 1985-03 period (11 incidents per year), resulting in an average of approximately 17 deaths annually.5 About 31% of the incidents involved an injury (43 per year), resulting in approximately 77 injuries annually. (These shares are not additive; some of the incidents involving a fatality also involved an injury.)
There were 207 incidents that resulted in 322 fatalities (some incidents resulted in multiple fatalities). There was an overall improvement of 46% in the three-year average from the earliest to the latest 3-year period. However, the record had already improved by the early 1990s, and deteriorated in the mid- and late decade. In addition, improvement in the 3-year averages covering the early 2000s is a result of the record low in 2001 only, which was not sustained in later years. The annual numbers are subject to ups and downs partially due to the relatively small numbers involved when compared to total incidents or incidents with injuries involved.
There were 882 incidents that resulted in 1,460 injuries from 1985-03. Overall, the 3-year average in the number of incidents involving an injury declined by 49% from the earliest period to the latest period. While the improvement has not been steady, the number of incidents involving an injury has trended down. The improvement came in three tranches. For instance, a low number in 1990 moved the three year average down in the early 1990s, then low numbers of injuries in the late 1990s brought another wave of improved performance. Finally, record low numbers of incidents with an injury in 2001 and 2002 brought another wave. The record for 2003, however, did not continue the progress.
5 The data presented here, and throughout this report, includes only the fifty states and the District of Columbia, and therefore excludes Puerto Rico’s only operator, San Juan Gas. The single incident with the highest number of fatalities (33) and injuries (46), by far, occurred in 1996 on the San Juan Gas system. The incident, however, involved a propane-air mixture, not methane. For additional commentary on this incident, see http://www.ntsb.gov/publictn/1997/PAR9701.htm.
Improvement concentrated in early years
From 1985-03, 11 incidents per year involved a fatality, and 43 per year involved an injury
Safety Incidents on Natural Gas Distribution Systems: Understanding the Hazards
Safety Performance
Allegro Energy Consulting 17
AllegroEnergy Consulting
© Cheryl J. Trench, 2004
02468
1012141618
1985
1987
1989
1991
1993
1995
1997
1999
2001
2003
Incidents with a Fatality, 1985Incidents with a Fatality, 1985--03:03:207 Incidents; 46% Decline in 3207 Incidents; 46% Decline in 3--yr Averageyr Average
Source: Office of Pipeline Safety database of RSPA Form 7100.1 filings for operators inthe 50 states and the District of Columbia.
Number3-Year Moving Avg.
Num
ber o
f Inc
iden
ts
AllegroEnergy Consulting
© Cheryl J. Trench, 2004
01020304050607080
1985
1987
1989
1991
1993
1995
1997
1999
2001
2003
Incidents with an Injury, 1985Incidents with an Injury, 1985--03:03:882 Incidents; 49% Decline in 3882 Incidents; 49% Decline in 3--yr Averageyr Average
Source: Office of Pipeline Safety database of RSPA Form 7100.1 filings for operators inthe 50 states and the District of Columbia.
Number3-Year Moving Avg.
Num
ber o
f Inc
iden
ts
Safety Incidents on Natural Gas Distribution Systems: Understanding the Hazards
Safety Performance
Allegro Energy Consulting 18
Safety Performance, 1999-2003 The lack of continued improvement in the number of reportable incidents and their public safety consequences was the major impetus for a variety of initiatives that have been undertaken by the Office of Pipeline Safety to improve gas distribution system safety.6 The redesign of the PHMSA Form 7100.1 was another important step, providing more detail, and hence better understanding of the hazards involved in the incidents.
The rest of this report focuses on the five-year period 1999-2003. Allegro Energy Consulting used the narrative filed by the operator with the PHMSA Form 7100.1 to reclassify the incident causes from the five in use at the time to the new, more detailed 25 causes now in use with the revised form. The greater detail provides critical insight for understanding the factors contributing to the incidents.
Over the 1999-2003 period, there were 634 incidents, an average of 127 per year, with the highest year, 2000, at 154, and the lowest, 2002, at 102. The incidents included 40 with a fatality (60 people) and 181 with an injury (282 people); some incidents involved both.
Original PHMSA Causes
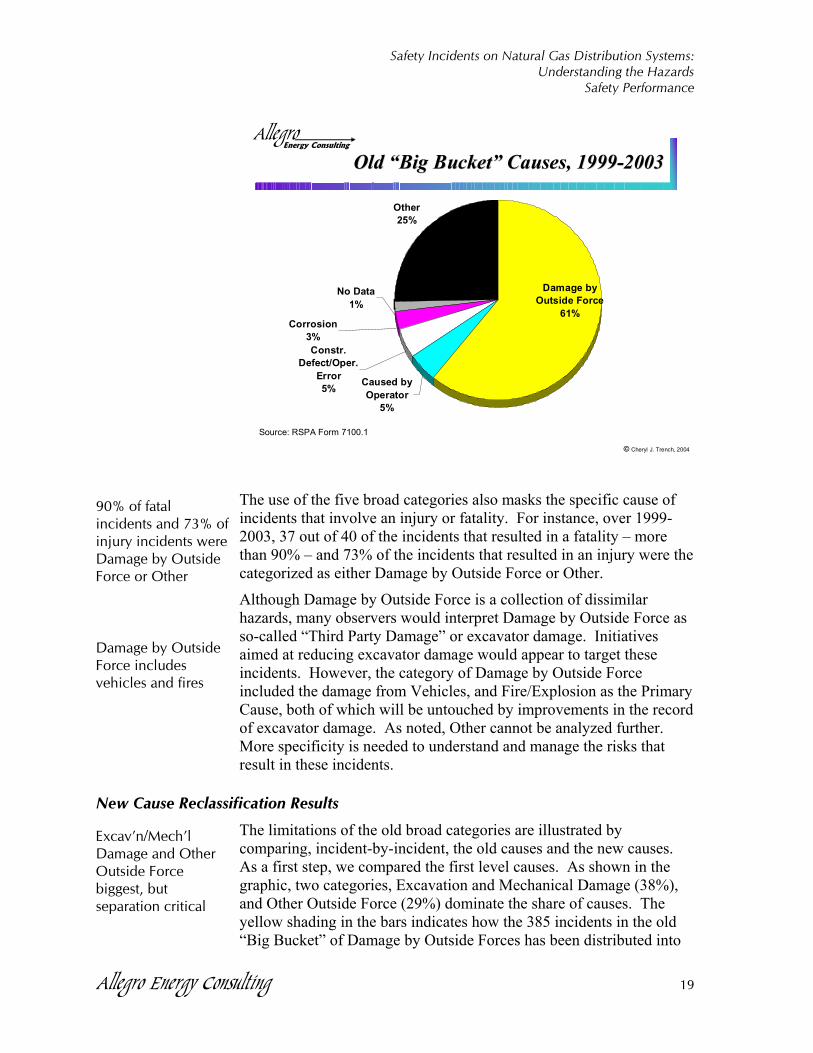
The PHMSA Form 7100.1 in use prior to early 2004 classified the cause of an incident into five categories: Accidentally Caused by Operator, Construction Defect or Operation Error, Corrosion, Damage by Outside Force, and Other. These broad categories made it difficult to identify the real hazards. For instance, the category “Damage by Outside Force” accounted for 61% of the incidents, but lumped together incidents caused by Excavation and Mechanical Damage, those caused by Natural Forces, and those caused “Other Outside Force” such as vehicles and fires. These causes involve different hazards and different actors, and will require different strategies to manage the risks. A full 25% of the incident causes were reported in the category “Other” which is effectively a black hole of reporting. This catchall category obscures any useful information regarding the actual cause of the incident or any insights into the hazards involved.
6 See, for instance, the information in the Docket RSPA-2004-19854, Enhancing Integrity Management of Gas Distribution Pipelines.
Lack of continued improvement prompted OPS initiatives
Old form: 61% of incidents lumped in Damage by Outside Force and 25% obscured in Other
Safety Incidents on Natural Gas Distribution Systems: Understanding the Hazards
Safety Performance
Allegro Energy Consulting 19
AllegroEnergy Consulting
© Cheryl J. Trench, 2004
Old “Big Bucket” Causes, 1999Old “Big Bucket” Causes, 1999--2003 2003
Other25%
No Data1%
Corrosion3%Constr.
Defect/Oper. Error5% Caused by
Operator5%
Damage by Outside Force
61%
Source: RSPA Form 7100.1
The use of the five broad categories also masks the specific cause of incidents that involve an injury or fatality. For instance, over 1999-2003, 37 out of 40 of the incidents that resulted in a fatality – more than 90% – and 73% of the incidents that resulted in an injury were the categorized as either Damage by Outside Force or Other.
Although Damage by Outside Force is a collection of dissimilar hazards, many observers would interpret Damage by Outside Force as so-called “Third Party Damage” or excavator damage. Initiatives aimed at reducing excavator damage would appear to target these incidents. However, the category of Damage by Outside Force included the damage from Vehicles, and Fire/Explosion as the Primary Cause, both of which will be untouched by improvements in the record of excavator damage. As noted, Other cannot be analyzed further. More specificity is needed to understand and manage the risks that result in these incidents.
New Cause Reclassification Results
The limitations of the old broad categories are illustrated by comparing, incident-by-incident, the old causes and the new causes. As a first step, we compared the first level causes. As shown in the graphic, two categories, Excavation and Mechanical Damage (38%), and Other Outside Force (29%) dominate the share of causes. The yellow shading in the bars indicates how the 385 incidents in the old “Big Bucket” of Damage by Outside Forces has been distributed into
90% of fatal incidents and 73% of injury incidents were Damage by Outside Force or Other
Damage by Outside Force includes vehicles and fires
Excav’n/Mech’l Damage and Other Outside Force biggest, but separation critical
Safety Incidents on Natural Gas Distribution Systems: Understanding the Hazards
Safety Performance
Allegro Energy Consulting 20
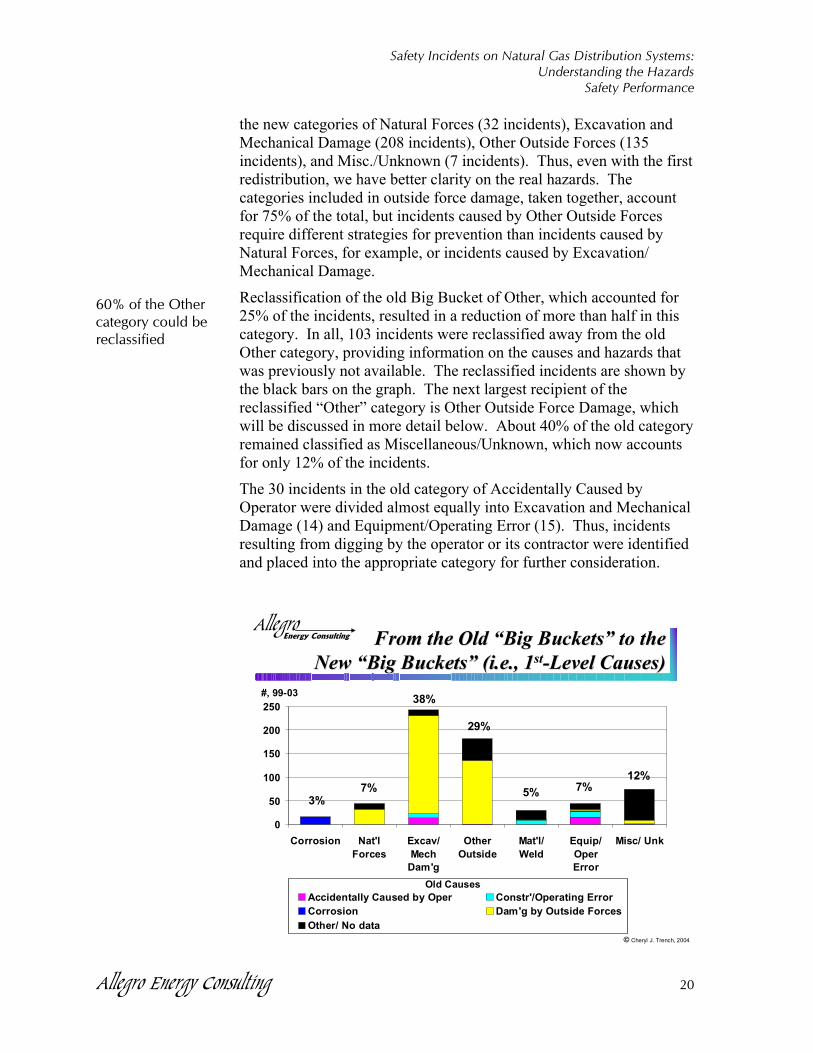
the new categories of Natural Forces (32 incidents), Excavation and Mechanical Damage (208 incidents), Other Outside Forces (135 incidents), and Misc./Unknown (7 incidents). Thus, even with the first redistribution, we have better clarity on the real hazards. The categories included in outside force damage, taken together, account for 75% of the total, but incidents caused by Other Outside Forces require different strategies for prevention than incidents caused by Natural Forces, for example, or incidents caused by Excavation/ Mechanical Damage.
Reclassification of the old Big Bucket of Other, which accounted for 25% of the incidents, resulted in a reduction of more than half in this category. In all, 103 incidents were reclassified away from the old Other category, providing information on the causes and hazards that was previously not available. The reclassified incidents are shown by the black bars on the graph. The next largest recipient of the reclassified “Other” category is Other Outside Force Damage, which will be discussed in more detail below. About 40% of the old category remained classified as Miscellaneous/Unknown, which now accounts for only 12% of the incidents.
The 30 incidents in the old category of Accidentally Caused by Operator were divided almost equally into Excavation and Mechanical Damage (14) and Equipment/Operating Error (15). Thus, incidents resulting from digging by the operator or its contractor were identified and placed into the appropriate category for further consideration.
AllegroEnergy Consulting
© Cheryl J. Trench, 2004
From the Old “Big Buckets” to the From the Old “Big Buckets” to the New “Big Buckets” (i.e., 1New “Big Buckets” (i.e., 1stst--Level Causes)Level Causes)
0
50
100
150
200
250
Corrosion Nat'lForces
Excav/Mech
Dam'g
OtherOutside
Mat'l/Weld
Equip/OperError
Misc/ Unk
Accidentally Caused by Oper Constr'/Operating ErrorCorrosion Dam'g by Outside ForcesOther/ No data
3%7%
38%
29%
5% 7%12%
#, 99-03
Old Causes
60% of the Other category could be reclassified
Safety Incidents on Natural Gas Distribution Systems: Understanding the Hazards
Safety Performance
Allegro Energy Consulting 21
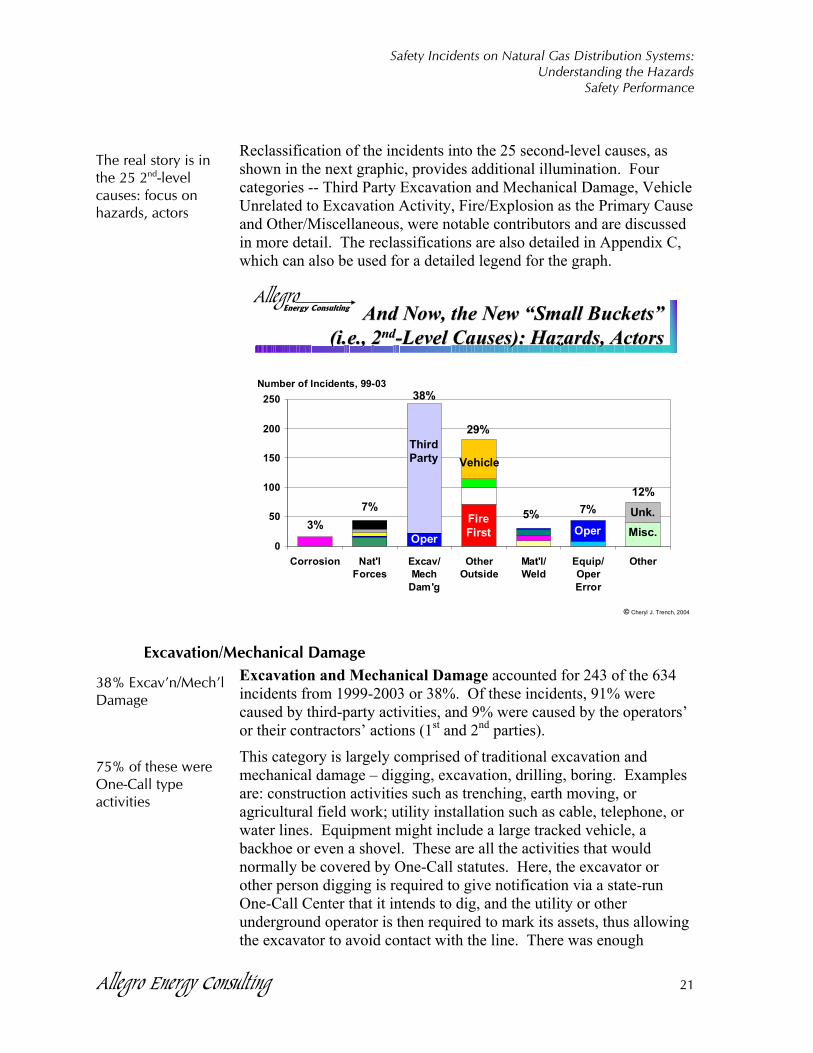
Reclassification of the incidents into the 25 second-level causes, as shown in the next graphic, provides additional illumination. Four categories -- Third Party Excavation and Mechanical Damage, Vehicle Unrelated to Excavation Activity, Fire/Explosion as the Primary Cause and Other/Miscellaneous, were notable contributors and are discussed in more detail. The reclassifications are also detailed in Appendix C, which can also be used for a detailed legend for the graph.
AllegroEnergy Consulting
© Cheryl J. Trench, 2004
And Now, the New “Small Buckets” And Now, the New “Small Buckets” (i.e., 2(i.e., 2ndnd--Level Causes): Hazards, ActorsLevel Causes): Hazards, Actors
0
50
100
150
200
250
Corrosion Nat'lForces
Excav/Mech
Dam'g
OtherOutside
Mat'l/Weld
Equip/OperError
Other
ThirdParty
FireFirstOper
Vehicle
Misc.Oper
Number of Incidents, 99-03
3%7%
38%
29%
5% 7%12%
Unk.
Excavation/Mechanical Damage Excavation and Mechanical Damage accounted for 243 of the 634 incidents from 1999-2003 or 38%. Of these incidents, 91% were caused by third-party activities, and 9% were caused by the operators’ or their contractors’ actions (1st and 2nd parties).
This category is largely comprised of traditional excavation and mechanical damage – digging, excavation, drilling, boring. Examples are: construction activities such as trenching, earth moving, or agricultural field work; utility installation such as cable, telephone, or water lines. Equipment might include a large tracked vehicle, a backhoe or even a shovel. These are all the activities that would normally be covered by One-Call statutes. Here, the excavator or other person digging is required to give notification via a state-run One-Call Center that it intends to dig, and the utility or other underground operator is then required to mark its assets, thus allowing the excavator to avoid contact with the line. There was enough
The real story is in the 25 2nd-level causes: focus on hazards, actors
38% Excav’n/Mech’l Damage
75% of these were One-Call type activities
Safety Incidents on Natural Gas Distribution Systems: Understanding the Hazards
Safety Performance
Allegro Energy Consulting 22
information in the narrative to classify about 75% of these third party excavation/mechanical incidents as One-Call type activities (a share that could be characterized as “at least”). The One-Call system, however, must work like an unbroken chain, with each party doing its part. In fact, it suffers from many vulnerabilities, starting with whether the would-be excavator makes the call and waits the appropriate time before undertaking the project.
All underground facilities operators are part of the system, receiving requests to locate their assets and paying for the One-Call system by fees imposed by the state; these entities should be particularly sensitive to the need to avoid contact with a gas or utility line. Not every narrative specified who the “damaging party” was – utility, sewer, cable, electric, etc. However, the information available seems to confirm what the oil pipeline industry has observed via its reporting system, PPTS: these entities that are part of the system are among the most important actors in causing the damage. Furthermore, as noted above, 9% of the excavation/ mechanical damage incidents were caused by operators or their contractors, who should know the most about the location of their systems, but are not going to provide One-Call notification to themselves.
This category also includes other non-excavation activities conducted by homeowners or tradesmen such as plumbers. For instance, a plumber might melt a polyethylene riser with the use of a blowtorch nearby. This type of activity would not generally be subject to One-Call, but good workmanlike practice would have dictated a different procedure. Any approach to addressing these failures will require a broad coalition that includes tradesmen and their organizations to develop good practices for working around a residence or building with natural gas service.
Fire and Explosion as the Primary Cause (Fire First) Fire and Explosion as the Primary Cause (Fire First) is an event where a building is on fire and the utility responds, typically to shut off the gas service, but the fire itself is not a result of a gas leak. Fire first represents 11% of the incidents or 71 of the 634. Fire or explosion is not a criterion that makes a gas incident reportable, even if the gas was the primary fuel. In such an instance, however, it may represent a failure of the gas system. However, the “fire first” category is designed to capture fires and explosions that were not caused by a gas leak, but where any failure of the gas system is secondary. These fires, caused by faulty wiring or carelessness with candles, do not represent a failure of the gas system nor a failure of the utility to control a hazard.
Participants in One-Call –utilities, phone, cable -- are among those causing the damage
Need add’l good practices for tradesmen, too
With “Fire First,” an existing fire involves the gas system
Safety Incidents on Natural Gas Distribution Systems: Understanding the Hazards
Safety Performance
Allegro Energy Consulting 23
The PHMSA Form 7100.1 in use over the 1999-2003 period did not have a cause category corresponding to “fire first.” In fact, the instructions in use at the time stated: “Damage from secondary ignition need not be reported unless the damage to facilities subject to Part 192 exceeds $50,000 [emphasis added]. Secondary ignition is a gas fire where the cause is unrelated to the gas facilities such as electrical fires, arson, etc.” Thus, because a house is not a facility subject to Part 192, even its total destruction would not have triggered the reporting requirement based on the damage threshold. Furthermore, some of the narratives specifically note that the damaged facilities were non-jurisdictional.
Given the guidance in the instructions, it is not surprising that most operators reported few if any of these incidents. However, one utility, Enstar in Alaska, reported 25 of the 71 Fire First incidents over the 1999-2003 period. Intuitively, such incidents must be common across the country. But other operators report none, one, or two, with the next highest being eight incidents. This clear inconsistency further undermines the category’s usefulness in assessing the true impact of this hazard.
While over-reporting is not generally helpful to understanding the real avenues for failure, Fire First is now a recognized cause category, so these incidents are likely to continue to be reported. They will assuredly continue to happen. It may be that these incidents highlight a secondary hazard to society’s reliance on natural gas. Many of them, for instance, involved the gas system because a polyethylene Service Line or riser melted. An examination of possible strategies for reducing the likelihood of the gas system’s secondary involvement may be worthwhile. Parties to such an effort might include fire marshals and insurers, both of which bear a burden in responding to these events when they occur.
Vehicles Unrelated to Excavation Activity Vehicle-related incidents accounted for 67 of the 634 incidents or 11%. These incidents typically involve an automobile crash and a fire. Some involve a DUI, and some a rollaway vehicle, a riding lawnmower, or snow plow. One even involved a railroad incident. In the majority of cases, the Meter Set Assembly is damaged (44 or 66%).
These vehicle-related incidents are an example of the large differences in the hazards encountered by gas distribution operators and the ones encountered by oil pipeline or gas transmission operators. For these other pipelines, incidents caused by vehicles (other than excavation-related vehicles) are extremely uncommon. Generally, the pipe is buried and facilities are fenced. Contrast the gas distribution system,
Over 1999-2003, a “fire first” incident was not in itself reportable, and reporting is inconsistent
Now a recognized cause category; industry and OPS must address even if not a failure of the gas system.
Vehicles: 11% of incidents, 2/3 of which damage Meter Set Assemblies
Safety Incidents on Natural Gas Distribution Systems: Understanding the Hazards
Safety Performance
Allegro Energy Consulting 24
where parts are aboveground, on customer property and unprotected. The importance of these incidents can only be fully evaluated in light of their role in fatalities: they accounted for 25% of the incidents involving a fatality, as discussed more fully below.
Miscellaneous The Miscellaneous category is a collection of varied causes amounting to 40 of the 634 incidents or about 6%. More than half of the incidents with a Miscellaneous cause (23) involve customer piping and appliances such as furnaces and water heaters. The miscellany reflects the many different types of mishaps that may occur inside a home. Since these are downstream of the Meter Set Assembly, they are considered non-jurisdictional with respect to OPS. Customer piping is discussed further in the next section.
Lesser Causes: Corrosion, Material/Weld, Operator Error Also of interest are the categories that are only small contributors to reportable incidents. For instance, only 3% of the incidents were caused by Corrosion, all of it external corrosion. This is a marked departure from the situation with other types of pipeline systems such as gas transmission and oil pipelines, where corrosion is one of the leading causes of reportable incidents. It is interesting that the reason for this difference does not seem to lie in the use of polyethylene mains and services that do not corrode. Even in steel assets, corrosion accounts for less than 4% of the reportable incidents for gas distribution systems. One factor is that corrosion leaks, while plentiful, can usually be repaired without the kind of consequence that will make it a reportable incident. Another consideration is that the pipe wall thickness on these small diameter pipes is relatively greater than it is for larger diameter transmission lines, providing an extra margin of safety before a corrosion pit fails. (If the small diameter lines had the same ratio of wall thickness to diameter as the large diameter lines, they would be too thin to maintain structural integrity in regular use.)
Another category with relatively few incidents is Material and/or weld failures, which account for just 5% of the total incidents. This is good news for safety advocates who can then focus on behavior instead of material.
Operator error also accounts for a relatively low share of the incidents, 7%. However, as noted below, it accounts for a disproportionate share of injuries.
“Miscellaneous” causes: 23 of 40 incidents on customer piping
Corrosion much less important in gas distribution than in gas transmission or oil pipelines
Operator Error a minor cause, but over-represented in injuries
Safety Incidents on Natural Gas Distribution Systems: Understanding the Hazards
Safety Performance
Allegro Energy Consulting 25
Location on the System
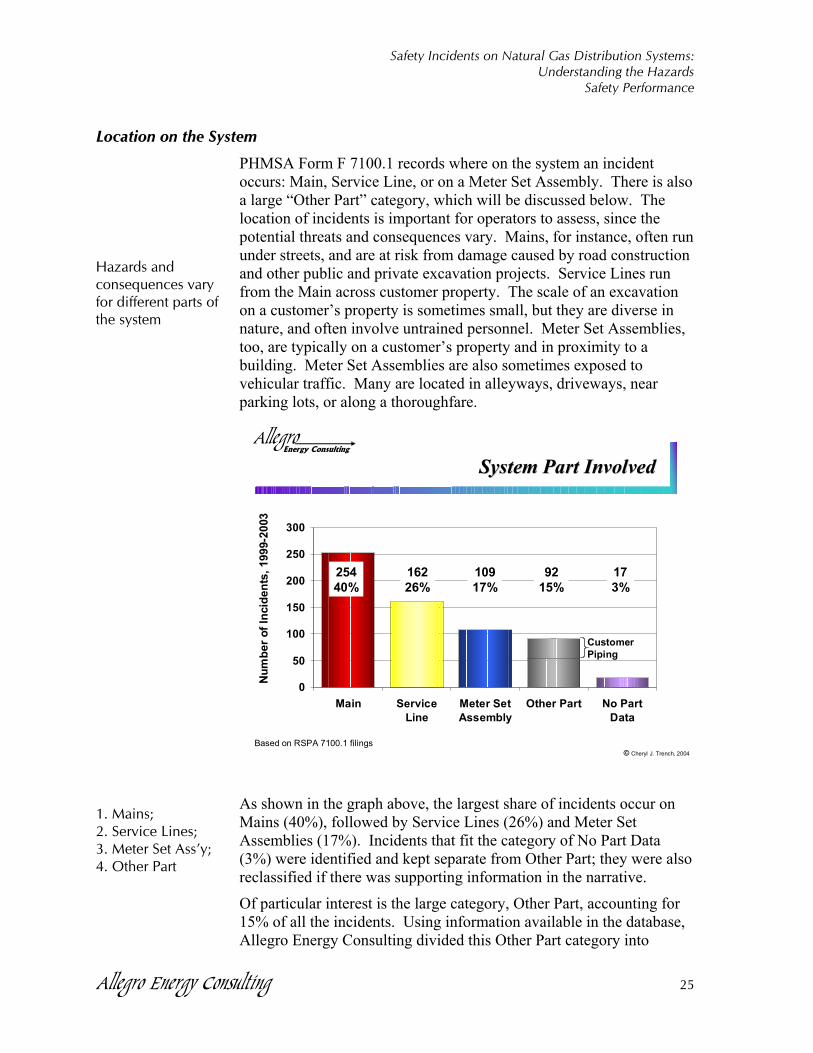
PHMSA Form F 7100.1 records where on the system an incident occurs: Main, Service Line, or on a Meter Set Assembly. There is also a large “Other Part” category, which will be discussed below. The location of incidents is important for operators to assess, since the potential threats and consequences vary. Mains, for instance, often run under streets, and are at risk from damage caused by road construction and other public and private excavation projects. Service Lines run from the Main across customer property. The scale of an excavation on a customer’s property is sometimes small, but they are diverse in nature, and often involve untrained personnel. Meter Set Assemblies, too, are typically on a customer’s property and in proximity to a building. Meter Set Assemblies are also sometimes exposed to vehicular traffic. Many are located in alleyways, driveways, near parking lots, or along a thoroughfare.
AllegroEnergy Consulting
© Cheryl J. Trench, 2004
System Part Involved System Part Involved
0
50
100
150
200
250
300
Main ServiceLine
Meter SetAssembly
Other Part No PartData
25440%
9215%
16226%
10917%
173%
Num
ber o
f Inc
iden
ts, 1
999-
2003
Based on RSPA 7100.1 filings
CustomerPiping
As shown in the graph above, the largest share of incidents occur on Mains (40%), followed by Service Lines (26%) and Meter Set Assemblies (17%). Incidents that fit the category of No Part Data (3%) were identified and kept separate from Other Part; they were also reclassified if there was supporting information in the narrative.
Of particular interest is the large category, Other Part, accounting for 15% of all the incidents. Using information available in the database, Allegro Energy Consulting divided this Other Part category into
Hazards and consequences vary for different parts of the system
1. Mains; 2. Service Lines; 3. Meter Set Ass’y; 4. Other Part
Safety Incidents on Natural Gas Distribution Systems: Understanding the Hazards
Safety Performance
Allegro Energy Consulting 26
incidents occurring on customers’ lines or appliances versus incidents that occurred in diverse locations. The incidents occurring in customer lines or appliances account for 42% of the Other Part category (39 out of 92 incidents). They account for about 6% of all incidents. These incidents are particularly notable because they occur within a building. There is a great diversity of hazards involved that result in these incidents, ranging from disconnected appliances, to burning holes in piping with blowtorches, to broken pipes from overloaded floors collapsing, to the improper installation of appliances.
As noted, such facilities are outside the scope of PHMSA regulation and operators use their discretion as to whether to file a PHMSA 7100.1 to report incidents. It is useful to separate these incidents (to the extent they are included in the database) because the gas distribution operator’s only involvement in these incidents would be to respond to and remedy the problem. The role of the operator is circumscribed when it comes to implementing safety measures inside of a customer’s home. The incident records underscore that a broad partnership is necessary, including the consumers themselves, building codes and inspectors, architects, builders, tradesmen, and the appliance industry in order to reduce these diverse hazards.
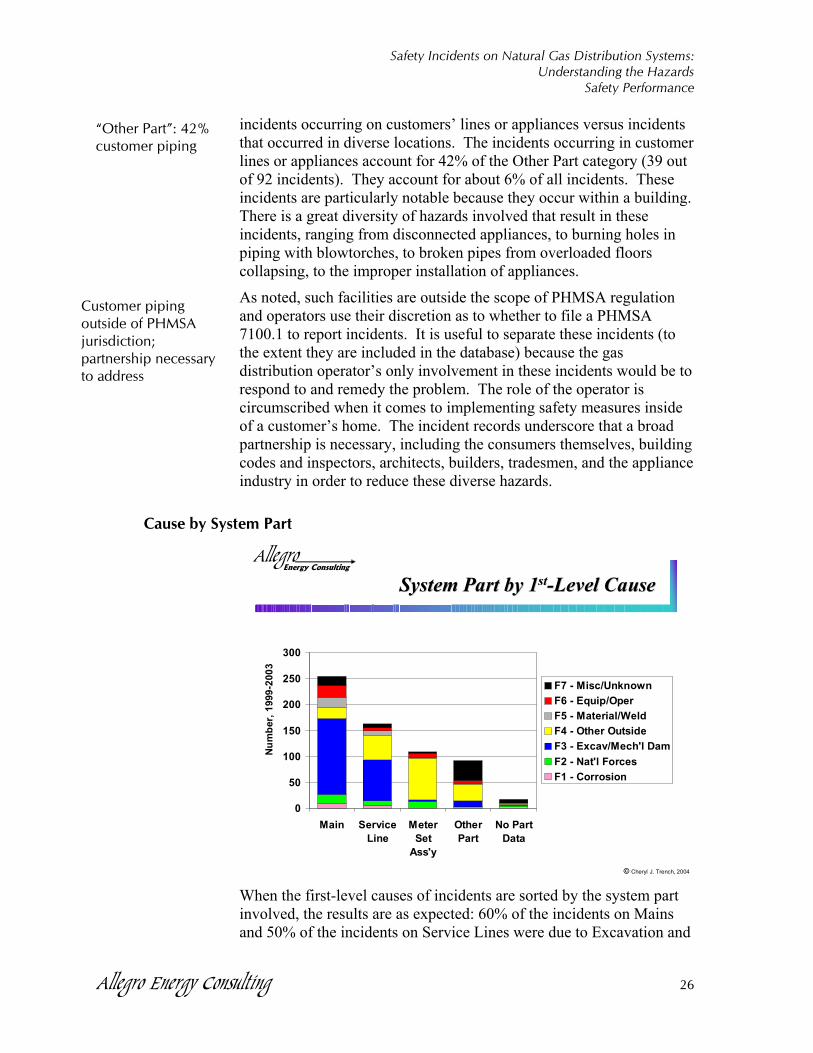
Cause by System Part
AllegroEnergy Consulting
© Cheryl J. Trench, 2004
System Part by 1System Part by 1stst--Level CauseLevel Cause
0
50
100
150
200
250
300
Main ServiceLine
MeterSet
Ass'y
OtherPart
No PartData
F7 - Misc/UnknownF6 - Equip/OperF5 - Material/WeldF4 - Other OutsideF3 - Excav/Mech'l DamF2 - Nat'l ForcesF1 - Corrosion
Num
ber,
199
9-20
03
When the first-level causes of incidents are sorted by the system part involved, the results are as expected: 60% of the incidents on Mains and 50% of the incidents on Service Lines were due to Excavation and
Customer piping outside of PHMSA jurisdiction; partnership necessary to address
“Other Part”: 42% customer piping
Safety Incidents on Natural Gas Distribution Systems: Understanding the Hazards
Safety Performance
Allegro Energy Consulting 27
Mechanical Damage. Mains and Service Lines are particularly susceptible to Excavation and Mechanical Damage. Street and road construction and maintenance, and sewer and other utility installation and maintenance all involve digging, trenching, and boring in areas where Mains and Service Lines are buried.
Meter Set Assemblies, in contrast, are susceptible to damage by Other Outside Forces, which accounted for 73% of the incidents -- 43% of the incidents were Vehicle-related, and 30% were a result of Fire First. Again, the exposed location of the Meter Set Assemblies makes them vulnerable. Other Outside Forces also caused 30% of the Service Line incidents and 34% of the incidents involving Other Parts of the system. They only caused 9% of the incidents occurring on Mains.
Clearly, different strategies are needed for the different parts of the system to manage the different risks.
Fatalities and Injuries
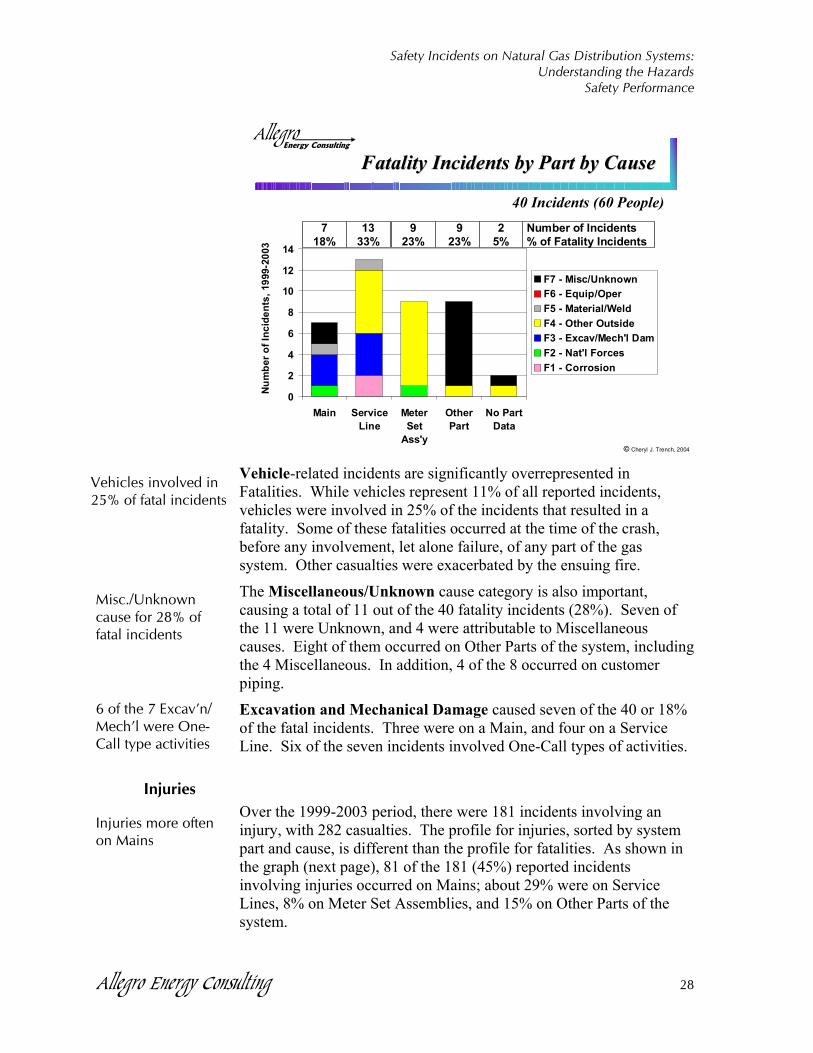
Fatalities There were 40 incidents involving a fatality over the 1999-2003 period; 60 people died. As shown in the graph, incidents involving fatalities occur relatively less often on Mains, and more often on other parts of the system. About 18% of the fatal incidents occur on Mains, 33% on Service Lines, 23% on Meter Set Assemblies, and 28% on Other Parts of the system.*7 Thus, Mains are relatively under-represented with respect to fatality incidents, but Service Lines, Meter Set Assemblies and Other Parts of the system are over-represented. Again, the “Other Parts” of the system include incidents on customer lines or involving customer appliances, well outside of the gas distribution operator’s control.
Other Outside Force Damage was the first-level cause of 16 of the 40 fatal incidents, or 40%. It was leading cause of fatal incidents on Service Lines (6 out of 13), and the overwhelming leading cause of fatal incidents involving Meter Set Assemblies (8 out of 9), and one each in the categories of Other Part and No Part Data. Of the 16 incidents, Vehicle-related incidents are the most important, with 10. In addition, three were caused by the Rupture of Previously Damaged Pipe, two were Fire First, and one Vandalism.
7 Does not add to 100% because of rounding.
More fatal incidents on Service Lines, Meter Set Ass’y and “Other Part” than on Mains
Excav’n/Mech’l on Mains and Service Lines . . .Vehicles and fires on Meter Set Assemblies
Diverse hazards; diverse strategies
Other Outside Force caused 40% of fatal incidents, including . . .
Safety Incidents on Natural Gas Distribution Systems: Understanding the Hazards
Safety Performance
Allegro Energy Consulting 28
AllegroEnergy Consulting
© Cheryl J. Trench, 2004
Fatality Incidents by Part by CauseFatality Incidents by Part by Cause
0
2
4
6
8
10
12
14
Main ServiceLine
MeterSet
Ass'y
OtherPart
No PartData
F7 - Misc/UnknownF6 - Equip/OperF5 - Material/WeldF4 - Other OutsideF3 - Excav/Mech'l DamF2 - Nat'l ForcesF1 - Corrosion
Num
ber o
f Inc
iden
ts, 1
999-
2003
40 Incidents (60 People)7
18%13
33%9
23%9
23%2
5%Number of Incidents% of Fatality Incidents
Vehicle-related incidents are significantly overrepresented in Fatalities. While vehicles represent 11% of all reported incidents, vehicles were involved in 25% of the incidents that resulted in a fatality. Some of these fatalities occurred at the time of the crash, before any involvement, let alone failure, of any part of the gas system. Other casualties were exacerbated by the ensuing fire.
The Miscellaneous/Unknown cause category is also important, causing a total of 11 out of the 40 fatality incidents (28%). Seven of the 11 were Unknown, and 4 were attributable to Miscellaneous causes. Eight of them occurred on Other Parts of the system, including the 4 Miscellaneous. In addition, 4 of the 8 occurred on customer piping.
Excavation and Mechanical Damage caused seven of the 40 or 18% of the fatal incidents. Three were on a Main, and four on a Service Line. Six of the seven incidents involved One-Call types of activities.
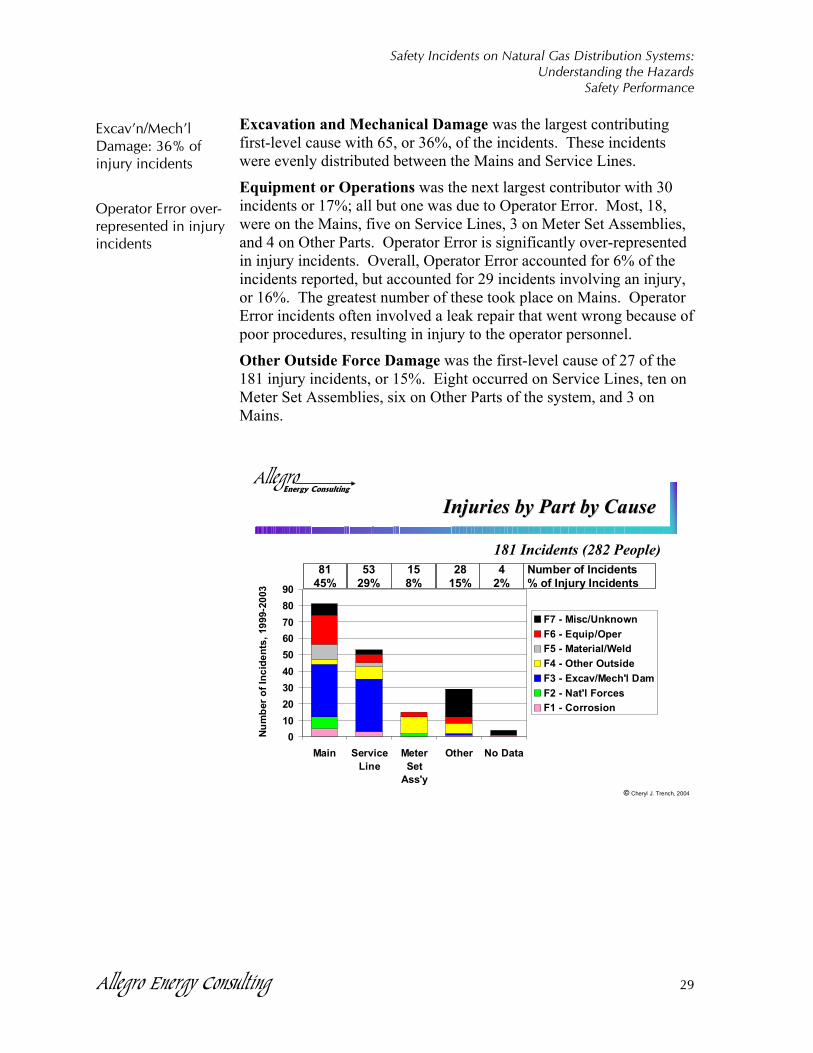
Injuries Over the 1999-2003 period, there were 181 incidents involving an injury, with 282 casualties. The profile for injuries, sorted by system part and cause, is different than the profile for fatalities. As shown in the graph (next page), 81 of the 181 (45%) reported incidents involving injuries occurred on Mains; about 29% were on Service Lines, 8% on Meter Set Assemblies, and 15% on Other Parts of the system.
Misc./Unknown cause for 28% of fatal incidents
6 of the 7 Excav’n/ Mech’l were One-Call type activities
Injuries more often on Mains
Vehicles involved in 25% of fatal incidents
Safety Incidents on Natural Gas Distribution Systems: Understanding the Hazards
Safety Performance
Allegro Energy Consulting 29
Excavation and Mechanical Damage was the largest contributing first-level cause with 65, or 36%, of the incidents. These incidents were evenly distributed between the Mains and Service Lines.
Equipment or Operations was the next largest contributor with 30 incidents or 17%; all but one was due to Operator Error. Most, 18, were on the Mains, five on Service Lines, 3 on Meter Set Assemblies, and 4 on Other Parts. Operator Error is significantly over-represented in injury incidents. Overall, Operator Error accounted for 6% of the incidents reported, but accounted for 29 incidents involving an injury, or 16%. The greatest number of these took place on Mains. Operator Error incidents often involved a leak repair that went wrong because of poor procedures, resulting in injury to the operator personnel.
Other Outside Force Damage was the first-level cause of 27 of the 181 injury incidents, or 15%. Eight occurred on Service Lines, ten on Meter Set Assemblies, six on Other Parts of the system, and 3 on Mains.
AllegroEnergy Consulting
© Cheryl J. Trench, 2004
Injuries by Part by CauseInjuries by Part by Cause
0102030405060708090
Main ServiceLine
MeterSet
Ass'y
Other No Data
F7 - Misc/UnknownF6 - Equip/OperF5 - Material/WeldF4 - Other OutsideF3 - Excav/Mech'l DamF2 - Nat'l ForcesF1 - Corrosion
Num
ber o
f Inc
iden
ts, 1
999-
2003
181 Incidents (282 People)81
45%53
29%158%
2815%
42%
Number of Incidents% of Injury Incidents
Operator Error over-represented in injury incidents
Excav’n/Mech’l Damage: 36% of injury incidents
Safety Incidents on Natural Gas Distribution Systems: Understanding the Hazards
Summary
Allegro Energy Consulting 30
Summary and Conclusions
This examination of safety incidents filed by gas distribution operators on PHMSA Form F 7100.1 has highlighted a number of factors that are central to understanding the performance of these systems:
♦ The conventional wisdom that the preponderance of gas distribution incidents are caused by outside force damage is correct, but is based on categories that are too broad to allow the development of effective strategies for performance improvement.
♦ By reclassifying incidents to the 7 first-level and 25 second-level cause categories of the revised PHMSA Form F 7100.1, we begin to see the diversity of hazards involved in reportable gas distribution incidents.
♦ Excavation and Mechanical Damage, while it accounts for the greatest share of incidents at 38%, is only part of the story. “Other Outside Force Damage,” which includes vehicle-related incidents and incidents caused by an existing fire or explosion unrelated to the gas system, is also important. It accounted for 29% of all incidents, and caused the largest share of incidents (73%) involving a Meter Set Assembly.
♦ In fact, Other Outside Force Damage causes the highest share of incidents involving a fatality – 40%. Vehicle-related incidents alone, a subset of Other Outside Force Damage, account for 25% of the incidents involving a fatality.
♦ The largest cause of incidents involving an injury is Excavation and Mechanical Damage, and they occurred primarily on Mains and Service Lines.
♦ Reclassification of the old category “Other,” which formerly accounted for 25% of the incidents, successfully distributed more than half of the incidents to a more meaningful cause category. The remaining incidents classified as Miscellaneous illustrate the diversity of the hazards involved in the gas distribution safety incidents. Some of these occurred on customer piping, outside of OPS jurisdiction.
♦ The issue of OPS jurisdiction is also important in the Other Outside Force Category, some of which involved customer piping, and some of which reflect the secondary involvement of the gas system during an unrelated fire.
Safety Incidents on Natural Gas Distribution Systems: Understanding the Hazards
Summary
Allegro Energy Consulting 31
♦ There is inconsistent reporting of incidents that involve facilities outside of OPS jurisdiction. The inconsistency carries a variety of problems. For instance, the data cannot be compared state-to-state or utility-to-utility. Furthermore, the inconsistency also obscures the real picture of failures on gas distribution systems, and thus the data can only be used with extreme caution in measuring, for instance, the success of regulation in enhancing public safety.
The issue of the incidents on non-jurisdictional facilities highlights the fact that the role of natural gas in modern life is such that its safety impacts touch everyone. That the activity or equipment involved in an incident is outside of DOT jurisdiction (or reportable criteria) does not mean that the incident did not occur, or that it did not have an impact on people, communities and their resources. It does mean that the hazard that caused the incident is unlikely to be “fixed” with the wave of DOT’s regulatory wand, or operator qualification standards, or even the most strictly enforced One-Call statutes.
Because of the diversity of the hazards, as well as the jurisdictional issues, only a broad partnership of stakeholders will succeed in developing the breadth of programs that might improve the record and prevent deaths and injuries as well as property damage and other consequences. Such a broad approach may be one way to address the underlying issues without heavy-handed regulation, or protracted debate that comes with trying to assign blame among different parties. This partnership might include:
♦ DOT ♦ Operators and their trade associations and education foundations ♦ States, including State Fire Marshals, utility regulators, pipeline
safety regulators ♦ Other utilities (electric, telephone, cable, water, sewer) ♦ Building trades; developers; architects; City/town zoning boards ♦ Damage prevention organizations such as Common Ground
Alliance ♦ Insurers and insurance underwriters ♦ Homeowners and other customers
This report reviews the safety record and in so doing, identifies some of the issues and targets areas for further exploration. The development of specific strategies to address these issues is outside the scope of this work, and as noted, will best be undertaken by a broad coalition that can improve the safety for all.
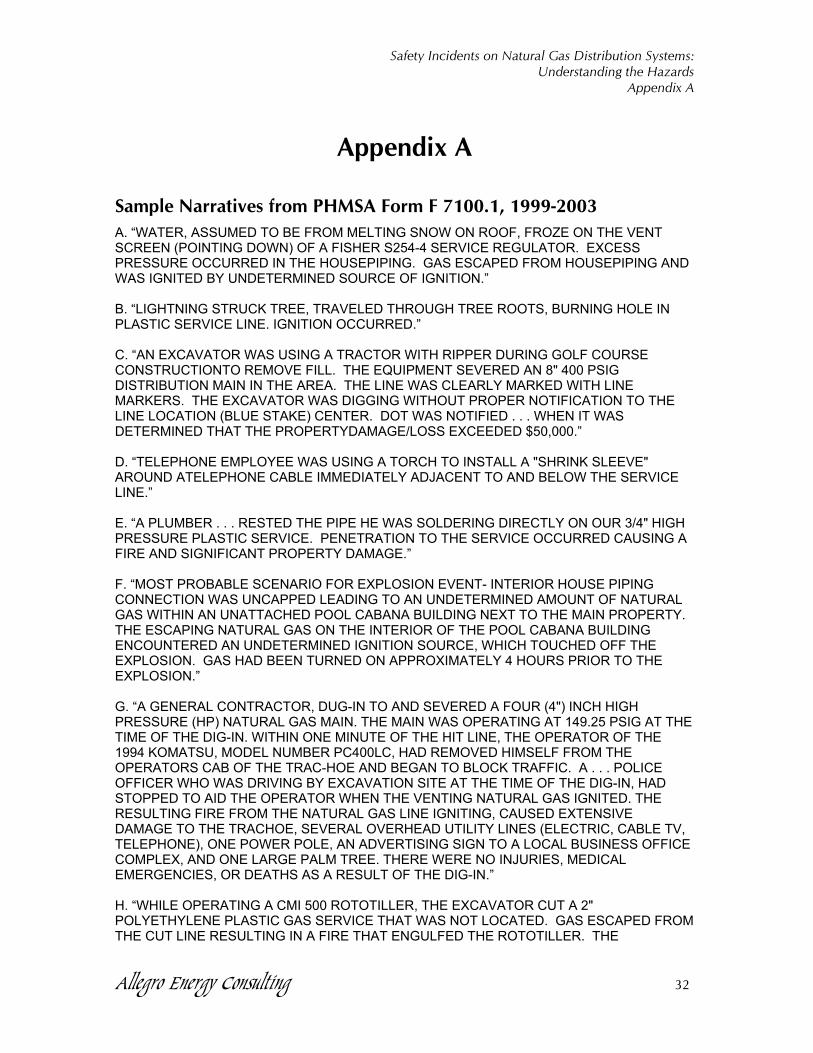
Safety Incidents on Natural Gas Distribution Systems: Understanding the Hazards
Appendix A
Allegro Energy Consulting 32
Appendix A
Sample Narratives from PHMSA Form F 7100.1, 1999-2003 A. “WATER, ASSUMED TO BE FROM MELTING SNOW ON ROOF, FROZE ON THE VENT SCREEN (POINTING DOWN) OF A FISHER S254-4 SERVICE REGULATOR. EXCESS PRESSURE OCCURRED IN THE HOUSEPIPING. GAS ESCAPED FROM HOUSEPIPING AND WAS IGNITED BY UNDETERMINED SOURCE OF IGNITION.” B. “LIGHTNING STRUCK TREE, TRAVELED THROUGH TREE ROOTS, BURNING HOLE IN PLASTIC SERVICE LINE. IGNITION OCCURRED.” C. “AN EXCAVATOR WAS USING A TRACTOR WITH RIPPER DURING GOLF COURSE CONSTRUCTIONTO REMOVE FILL. THE EQUIPMENT SEVERED AN 8" 400 PSIG DISTRIBUTION MAIN IN THE AREA. THE LINE WAS CLEARLY MARKED WITH LINE MARKERS. THE EXCAVATOR WAS DIGGING WITHOUT PROPER NOTIFICATION TO THE LINE LOCATION (BLUE STAKE) CENTER. DOT WAS NOTIFIED . . . WHEN IT WAS DETERMINED THAT THE PROPERTYDAMAGE/LOSS EXCEEDED $50,000.” D. “TELEPHONE EMPLOYEE WAS USING A TORCH TO INSTALL A "SHRINK SLEEVE" AROUND ATELEPHONE CABLE IMMEDIATELY ADJACENT TO AND BELOW THE SERVICE LINE.” E. “A PLUMBER . . . RESTED THE PIPE HE WAS SOLDERING DIRECTLY ON OUR 3/4" HIGH PRESSURE PLASTIC SERVICE. PENETRATION TO THE SERVICE OCCURRED CAUSING A FIRE AND SIGNIFICANT PROPERTY DAMAGE.” F. “MOST PROBABLE SCENARIO FOR EXPLOSION EVENT- INTERIOR HOUSE PIPING CONNECTION WAS UNCAPPED LEADING TO AN UNDETERMINED AMOUNT OF NATURAL GAS WITHIN AN UNATTACHED POOL CABANA BUILDING NEXT TO THE MAIN PROPERTY. THE ESCAPING NATURAL GAS ON THE INTERIOR OF THE POOL CABANA BUILDING ENCOUNTERED AN UNDETERMINED IGNITION SOURCE, WHICH TOUCHED OFF THE EXPLOSION. GAS HAD BEEN TURNED ON APPROXIMATELY 4 HOURS PRIOR TO THE EXPLOSION.” G. “A GENERAL CONTRACTOR, DUG-IN TO AND SEVERED A FOUR (4") INCH HIGH PRESSURE (HP) NATURAL GAS MAIN. THE MAIN WAS OPERATING AT 149.25 PSIG AT THE TIME OF THE DIG-IN. WITHIN ONE MINUTE OF THE HIT LINE, THE OPERATOR OF THE 1994 KOMATSU, MODEL NUMBER PC400LC, HAD REMOVED HIMSELF FROM THE OPERATORS CAB OF THE TRAC-HOE AND BEGAN TO BLOCK TRAFFIC. A . . . POLICE OFFICER WHO WAS DRIVING BY EXCAVATION SITE AT THE TIME OF THE DIG-IN, HAD STOPPED TO AID THE OPERATOR WHEN THE VENTING NATURAL GAS IGNITED. THE RESULTING FIRE FROM THE NATURAL GAS LINE IGNITING, CAUSED EXTENSIVE DAMAGE TO THE TRACHOE, SEVERAL OVERHEAD UTILITY LINES (ELECTRIC, CABLE TV, TELEPHONE), ONE POWER POLE, AN ADVERTISING SIGN TO A LOCAL BUSINESS OFFICE COMPLEX, AND ONE LARGE PALM TREE. THERE WERE NO INJURIES, MEDICAL EMERGENCIES, OR DEATHS AS A RESULT OF THE DIG-IN.” H. “WHILE OPERATING A CMI 500 ROTOTILLER, THE EXCAVATOR CUT A 2" POLYETHYLENE PLASTIC GAS SERVICE THAT WAS NOT LOCATED. GAS ESCAPED FROM THE CUT LINE RESULTING IN A FIRE THAT ENGULFED THE ROTOTILLER. THE
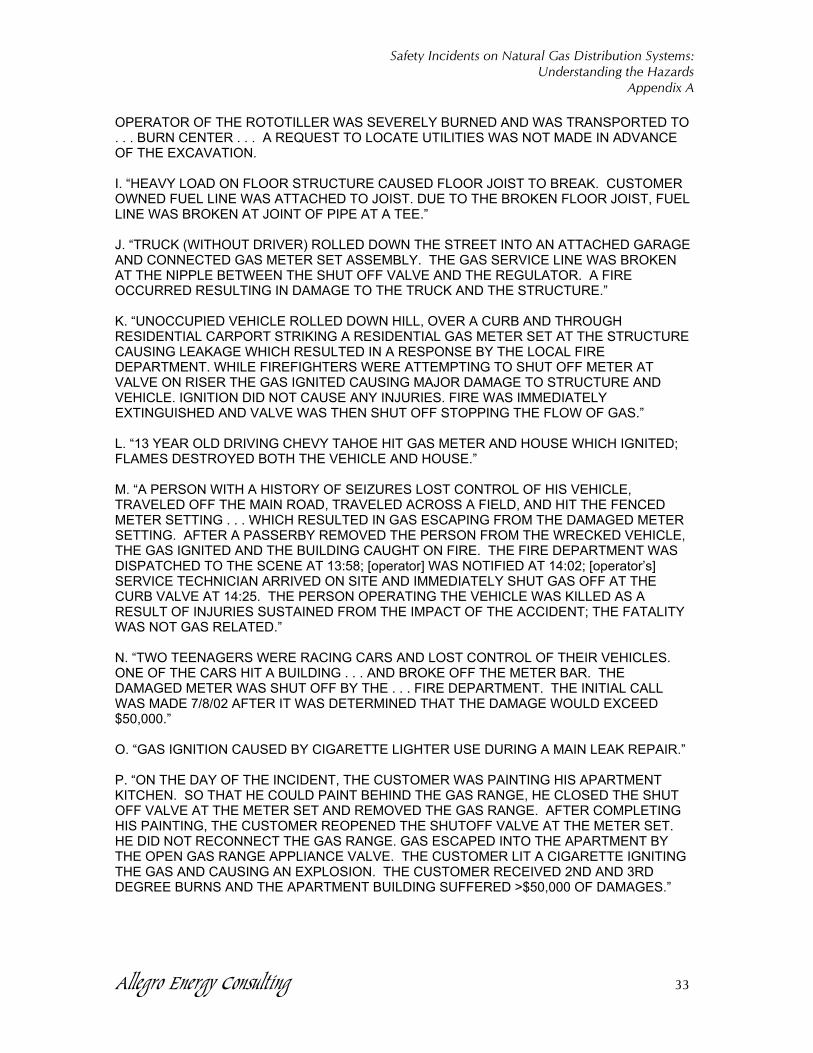
Safety Incidents on Natural Gas Distribution Systems: Understanding the Hazards
Appendix A
Allegro Energy Consulting 33
OPERATOR OF THE ROTOTILLER WAS SEVERELY BURNED AND WAS TRANSPORTED TO . . . BURN CENTER . . . A REQUEST TO LOCATE UTILITIES WAS NOT MADE IN ADVANCE OF THE EXCAVATION. I. “HEAVY LOAD ON FLOOR STRUCTURE CAUSED FLOOR JOIST TO BREAK. CUSTOMER OWNED FUEL LINE WAS ATTACHED TO JOIST. DUE TO THE BROKEN FLOOR JOIST, FUEL LINE WAS BROKEN AT JOINT OF PIPE AT A TEE.” J. “TRUCK (WITHOUT DRIVER) ROLLED DOWN THE STREET INTO AN ATTACHED GARAGE AND CONNECTED GAS METER SET ASSEMBLY. THE GAS SERVICE LINE WAS BROKEN AT THE NIPPLE BETWEEN THE SHUT OFF VALVE AND THE REGULATOR. A FIRE OCCURRED RESULTING IN DAMAGE TO THE TRUCK AND THE STRUCTURE.” K. “UNOCCUPIED VEHICLE ROLLED DOWN HILL, OVER A CURB AND THROUGH RESIDENTIAL CARPORT STRIKING A RESIDENTIAL GAS METER SET AT THE STRUCTURE CAUSING LEAKAGE WHICH RESULTED IN A RESPONSE BY THE LOCAL FIRE DEPARTMENT. WHILE FIREFIGHTERS WERE ATTEMPTING TO SHUT OFF METER AT VALVE ON RISER THE GAS IGNITED CAUSING MAJOR DAMAGE TO STRUCTURE AND VEHICLE. IGNITION DID NOT CAUSE ANY INJURIES. FIRE WAS IMMEDIATELY EXTINGUISHED AND VALVE WAS THEN SHUT OFF STOPPING THE FLOW OF GAS.” L. “13 YEAR OLD DRIVING CHEVY TAHOE HIT GAS METER AND HOUSE WHICH IGNITED; FLAMES DESTROYED BOTH THE VEHICLE AND HOUSE.” M. “A PERSON WITH A HISTORY OF SEIZURES LOST CONTROL OF HIS VEHICLE, TRAVELED OFF THE MAIN ROAD, TRAVELED ACROSS A FIELD, AND HIT THE FENCED METER SETTING . . . WHICH RESULTED IN GAS ESCAPING FROM THE DAMAGED METER SETTING. AFTER A PASSERBY REMOVED THE PERSON FROM THE WRECKED VEHICLE, THE GAS IGNITED AND THE BUILDING CAUGHT ON FIRE. THE FIRE DEPARTMENT WAS DISPATCHED TO THE SCENE AT 13:58; [operator] WAS NOTIFIED AT 14:02; [operator’s] SERVICE TECHNICIAN ARRIVED ON SITE AND IMMEDIATELY SHUT GAS OFF AT THE CURB VALVE AT 14:25. THE PERSON OPERATING THE VEHICLE WAS KILLED AS A RESULT OF INJURIES SUSTAINED FROM THE IMPACT OF THE ACCIDENT; THE FATALITY WAS NOT GAS RELATED.” N. “TWO TEENAGERS WERE RACING CARS AND LOST CONTROL OF THEIR VEHICLES. ONE OF THE CARS HIT A BUILDING . . . AND BROKE OFF THE METER BAR. THE DAMAGED METER WAS SHUT OFF BY THE . . . FIRE DEPARTMENT. THE INITIAL CALL WAS MADE 7/8/02 AFTER IT WAS DETERMINED THAT THE DAMAGE WOULD EXCEED $50,000.” O. “GAS IGNITION CAUSED BY CIGARETTE LIGHTER USE DURING A MAIN LEAK REPAIR.” P. “ON THE DAY OF THE INCIDENT, THE CUSTOMER WAS PAINTING HIS APARTMENT KITCHEN. SO THAT HE COULD PAINT BEHIND THE GAS RANGE, HE CLOSED THE SHUT OFF VALVE AT THE METER SET AND REMOVED THE GAS RANGE. AFTER COMPLETING HIS PAINTING, THE CUSTOMER REOPENED THE SHUTOFF VALVE AT THE METER SET. HE DID NOT RECONNECT THE GAS RANGE. GAS ESCAPED INTO THE APARTMENT BY THE OPEN GAS RANGE APPLIANCE VALVE. THE CUSTOMER LIT A CIGARETTE IGNITING THE GAS AND CAUSING AN EXPLOSION. THE CUSTOMER RECEIVED 2ND AND 3RD DEGREE BURNS AND THE APARTMENT BUILDING SUFFERED >$50,000 OF DAMAGES.”
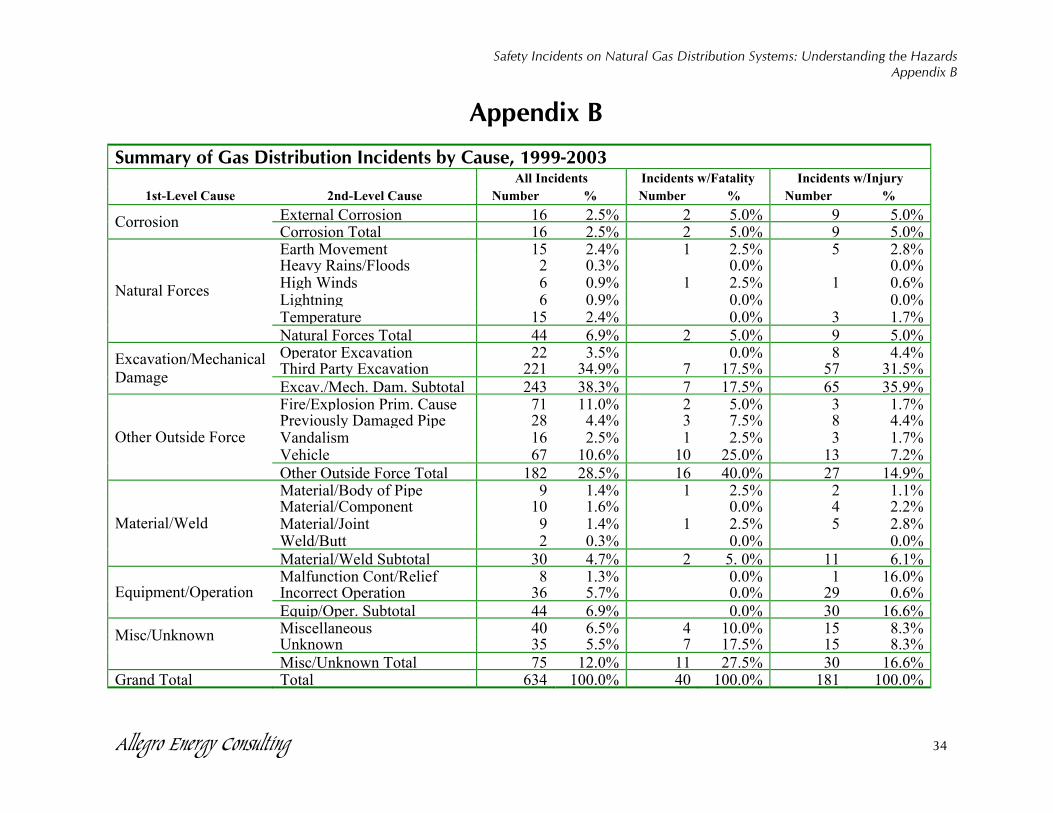
Safety Incidents on Natural Gas Distribution Systems: Understanding the Hazards Appendix B
Allegro Energy Consulting 34
Appendix B
Summary of Gas Distribution Incidents by Cause, 1999-2003 All Incidents Incidents w/Fatality Incidents w/Injury
1st-Level Cause 2nd-Level Cause Number % Number % Number % External Corrosion 16 2.5% 2 5.0% 9 5.0%Corrosion Corrosion Total 16 2.5% 2 5.0% 9 5.0%Earth Movement 15 2.4% 1 2.5% 5 2.8%Heavy Rains/Floods 2 0.3% 0.0% 0.0%High Winds 6 0.9% 1 2.5% 1 0.6%Lightning 6 0.9% 0.0% 0.0%Temperature 15 2.4% 0.0% 3 1.7%
Natural Forces
Natural Forces Total 44 6.9% 2 5.0% 9 5.0%Operator Excavation 22 3.5% 0.0% 8 4.4%Third Party Excavation 221 34.9% 7 17.5% 57 31.5%Excavation/Mechanical
Damage Excav./Mech. Dam. Subtotal 243 38.3% 7 17.5% 65 35.9%Fire/Explosion Prim. Cause 71 11.0% 2 5.0% 3 1.7%Previously Damaged Pipe 28 4.4% 3 7.5% 8 4.4%Vandalism 16 2.5% 1 2.5% 3 1.7%Vehicle 67 10.6% 10 25.0% 13 7.2%
Other Outside Force
Other Outside Force Total 182 28.5% 16 40.0% 27 14.9%Material/Body of Pipe 9 1.4% 1 2.5% 2 1.1%Material/Component 10 1.6% 0.0% 4 2.2%Material/Joint 9 1.4% 1 2.5% 5 2.8%Weld/Butt 2 0.3% 0.0% 0.0%
Material/Weld
Material/Weld Subtotal 30 4.7% 2 5. 0% 11 6.1%Malfunction Cont/Relief 8 1.3% 0.0% 1 16.0%Incorrect Operation 36 5.7% 0.0% 29 0.6%Equipment/Operation Equip/Oper. Subtotal 44 6.9% 0.0% 30 16.6%Miscellaneous 40 6.5% 4 10.0% 15 8.3%Misc/Unknown Unknown 35 5.5% 7 17.5% 15 8.3%
Misc/Unknown Total 75 12.0% 11 27.5% 30 16.6%Grand Total Total 634 100.0% 40 100.0% 181 100.0%
Safety Incidents on Natural Gas Distribution Systems: Understanding the Hazards Appendix C
Allegro Energy Consulting 35
Appendix C
Allegro Energy Consulting Classifications v OPS Old 5 Causes, 1999-2003 The table shows the proportion of incidents from 1999-2003 classified by Allegro Energy Consulting from the 5 cause-categories available on pre-2004 (plus “No Data”) to the 7 first-level and 25 second-level OPS causes currently in use.
Pre-2004 OPS Causes (Share of Incidents)
Current First Level Cause
Current Second Level Cause Corrosion
Construction Operating
Error
Accidentally Caused By Operator
Outside Force
Damage Other No Data Grand
Total
Corrosion External Corrosion 79% 1% 3% Total 79% 1% 3% Natural Forces Earth Movement 3% 2% 11% 2% Heavy Rains/Floods 1% -% High Winds 1% 1% 1% Lightning 1% 1% 11% 1% Temperature 3% 2% 2% Total 8% 6% 22% 7%
Operator Excavation 20% 33% 1% 2% 3% 3rd Party Excavation 10% 13% 53% 6% 35%
Excavation/Mechan'l Damage
Total 30% 47% 54% 7% 38% Other Outside Force Fire/Explosion 13% 12% 11% 11% Prev. Damaged Pipe 7% 1% 4% Vandalism 1% 9% 3% Vehicle 3% 15% 6% 11% Total 3% 35% 27% 11% 29%
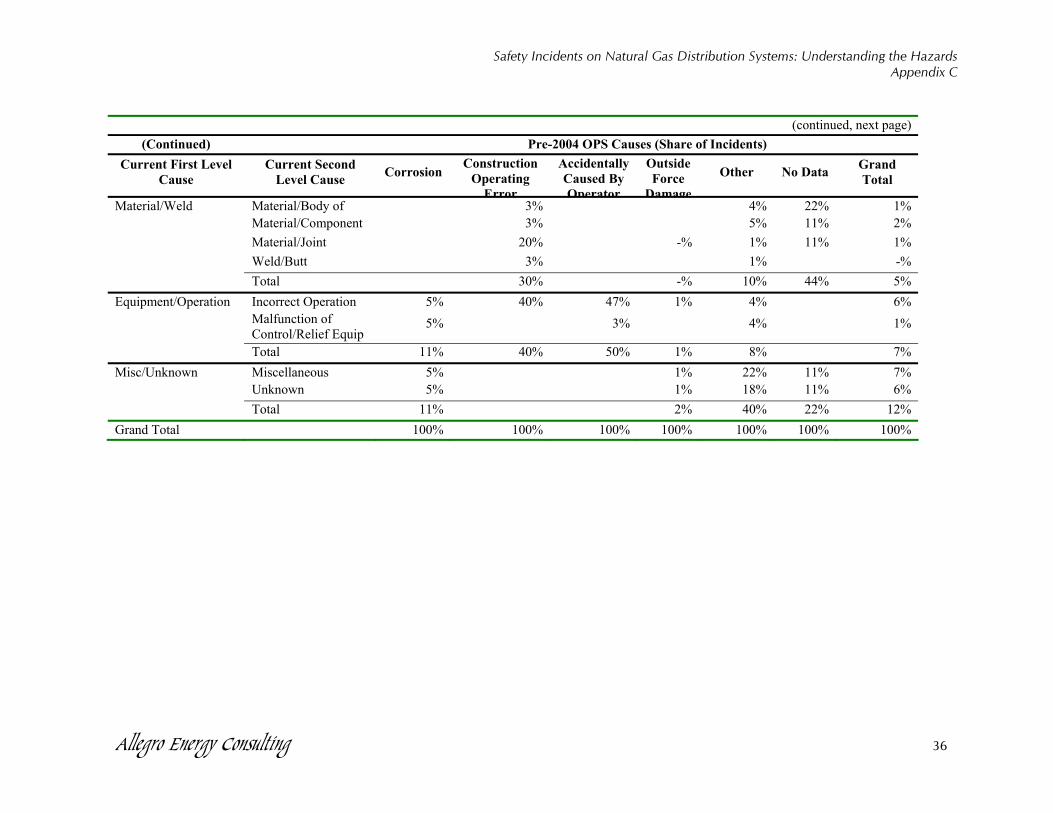
Safety Incidents on Natural Gas Distribution Systems: Understanding the Hazards Appendix C
Allegro Energy Consulting 36
(continued, next page) (Continued) Pre-2004 OPS Causes (Share of Incidents)
Current First Level Cause
Current Second Level Cause Corrosion Construction
Operating Error
Accidentally Caused By Operator
Outside Force
Damage
Other No Data Grand Total
Material/Weld Material/Body of 3% 4% 22% 1% Material/Component 3% 5% 11% 2% Material/Joint 20% -% 1% 11% 1% Weld/Butt 3% 1% -% Total 30% -% 10% 44% 5% Equipment/Operation Incorrect Operation 5% 40% 47% 1% 4% 6% Malfunction of
Control/Relief Equip 5% 3% 4% 1%
Total 11% 40% 50% 1% 8% 7% Misc/Unknown Miscellaneous 5% 1% 22% 11% 7% Unknown 5% 1% 18% 11% 6% Total 11% 2% 40% 22% 12% Grand Total 100% 100% 100% 100% 100% 100% 100%