Embed Size (px)
Citation preview
ENERDAY 2019 - 13th International Conference on Energy Economics and Technology
1
Gas Flows and Gas Prices in Europe:
What is the Impact of Nord Stream 2
Maik Günther1, Volker Nissen2
1 Stadtwerke München GmbH, Energy Strategy and Policy, Emmy-Noether-Str. 2, 86920 Munich,
Germany, [email protected]
2 TU Ilmenau, Department of Service Information Systems Engineering, Ehrenbergstraße 29,
98693 Ilmenau, Germany, [email protected]
Abstract: Natural gas plays an important role in Europe. It is a bridging technology for the transi-
tion of the electricity system and has also a significant potential to reduce CO2 emission in the
mobility and heating sectors. Nevertheless, Europe is strongly dependent on imports of natural gas.
While it is expected that European gas demand declines in long-term, indigenous production in
Europe also declines. Thus, European import dependency persists. An important supplier of natural
gas is Russia. Even if Russia should increase its market share, there is still enough transport capac-
ity existing to bring Russian gas to Europe. However, the pipeline Nord Stream 2 with an additional
annual capacity of 55 billion cubic meters (bcm) is under construction. This pipeline probably
starts operation in 2020 and has the potential to change gas flows in Europe significantly.
Stadtwerke München GmbH (SWM) operate the worldwide gas market model WEGA to calculate
gas flows and gas prices in daily resolution until 2040. This model is based on the commercial
solution Pegasus from Pöyry Management Consulting. Public sources as well as commercial ser-
vices are used by SWM to constantly update the dataset of WEGA. For plausibility checks, NBP,
NCG and TTF future prices are also frequently calculated. To analyse the impact of Nord Stream
2 on European gas flows, different scenarios are calculated in WEGA. The following exemplary
results of 2028 reveal that Nord Stream 2 has significant effects on European gas flows: Transit
flows through Germany increase by 17 bcm in comparison to a scenario without Nord Stream 2.
On the other hand, gas flows from Poland to Germany are reduced by 14 bcm due to Nord Stream
2. Other effects are reduced gas flows via Ukraine and a redirection of Norwegian gas (13 bcm)
from Germany to other Northwest European countries. Furthermore, Nord Stream 2 has also an
impact on European gas prices. In general, this pipeline has a moderate dampening effect, with gas
prices in Western Europe falling slightly more than in Eastern Europe.
Keywords: WEGA, Nord Stream 2, pipelines, gas flows, gas price, gas market model
ENERDAY 2019 - 13th International Conference on Energy Economics and Technology
2
1 Introduction and Related Work
Natural gas plays an important role in energy supply and its fields of application are diverse: heat
generation, hot water preparation, power generation and industrial applications. The world's largest
growth potential among fossil fuels is attributed to the demand for natural gas. BP expects annual
growth of 1.7 % worldwide by 2040 [1].
Gas demand in Europe is expected to fall by 2040, with some studies also forecasting relatively
constant gas demand. At the same time, however, a significant decline in domestic production in
Europe is to be expected, so that Europe will be even more dependent on gas imports in the long
term. This additional import demand will be met primarily by Russian pipeline gas and LNG. [1],
[7], [18], [26]
The Nord Stream 2 Baltic Sea pipeline would not be necessary considering only sufficient gas
imports to Europe. The EU has enough pipelines and LNG terminals to import all the gas it needs
[6]. There would also be alternatives to this pipeline from an economic point of view. The con-
struction of Nord Stream 2 with a capacity of 55 bcm per year costs approximately 9.5 billion €.
In comparison to this, the costs to renovate transit pipelines in Ukraine with a capacity of 160 bcm
per year are expected to stand at 6 billion €, according to the European Political Strategy Centre
[6]. But from a Russian perspective, the reasons for building Nord Stream 2 are strongly politically
driven. Gazprom is aiming to minimize gas transit through Ukraine [23], and it is even possible to
reduce it to zero [24]. This is intended to break the monopoly of Eastern European states for Rus-
sian transit gas, which is having a severe impact on Ukraine and Poland, among others. Nord
Stream 2 leads to diminishing transit revenues for Ukraine and Poland [10]. It is also often argued
that with Nord Stream 2 Russia is able to cut supply to specific Eastern European countries without
hurting other consumers in Europe.
With two additional strings of Nord Stream 2 and two strings of Turkish Stream, there is a non-
Ukrainian transit capacity of 205.9 bcm per year available for Russian gas exports to Europe [23].
However, Pirani and Yafimava [24] and Pirani [23] also introduce scenarios of higher Russian gas
demand in Europe and a non-Ukrainian transit capacity, where transit flows through Ukraine are
still required, especially from a seasonal point of view with a higher gas demand at peak times.
With the construction of Nord Stream 1 and the expansion of interconnection capacities west-east
gas flows have increased and traditional east-west gas flows have decreased. This boosted gas-on-
gas competition in Eastern Europe, where Russian gas from Nord Stream 1 competed with Russian
gas from existing long-term contracts [22]. Goldthau [10] expects the same effect for gas prices if
Nord Stream 2 comes online. He argues that Ukraine is moving from a situation where it gets high
transit fees, but pays a high price for Russian gas to a situation where it gets small transit fees, but
pays a cheaper price for Russian gas.
Kotek, Selei and Tóth [19] use the gas market model EGMM to calculate the impact of Nord
Stream 2 on gas prices and competition in 2020. This model only focuses on 35 European countries
and computes the equilibrium prices and gas flows in monthly resolution. The calculation for 2020
ENERDAY 2019 - 13th International Conference on Energy Economics and Technology
3
shows that gas prices in Western Europe are not affected by the construction of Nord Stream 2, but
they increase in Eastern Europe. The authors conclude that Nord Stream 2 creates bottlenecks in
gas flows from Western to Eastern Europe which result in lower available capacity for short term
(spot) gas competition. Furthermore, it is assumed that LNG is relatively cheap and can push Rus-
sian gas out of the market if enough interconnection capacity would be available. The calculated
overall welfare impact for Western and Eastern Europe of Nord Stream 2 is negative in 2020 (-2.1
billion €).
Hecking and Weiser [15] analyse the impact of Nord Stream 2 on European gas prices and gas
flows by using the models COLUMBUS und TIGER. COLUMBUS is a long-term model for the
global gas market and allows strategic behaviour of gas exporters. Investments into production
capacities and infrastructure as well as marginal supply cost curves per country are a result of the
model. In a second step the dispatching model TIGER is used with the results of COLUMBUS.
The output of TIGER are gas flows and gas prices. Hecking and Weiser show that gas prices in all
European countries are decreasing due to Nord Stream 2. In some countries prices are up to 32 %
lower. This significant price effect is based on less imports of very expensive LNG to Europe if
Nord Stream 2 will be built. The authors also show the cost curves of LNG in 2020, 2025 and
2030. If these cost curves would be lower, Nord Stream 2 would have a reduced price effect. It has
to be noted that the study was commissioned by the Nord Stream 2 AG. Hecking and Weiser also
calculate gas flows in scenarios with and without Nord Stream 2. It can be seen that gas flows from
Norway are not significantly affected. Interestingly very high gas flows from Slovakia to Ukraine
occur in all scenarios whereas no gas flows exist from Ukraine to Romania. The authors conclude
that Nord Stream 2 has an overall welfare benefit of 7.9 to 24.4 billion €.
In another study from Kruse and Berkhahn [21], also commissioned by Nord Stream 2 AG, the
economic benefit of Nord Stream 2 is calculated, but without a gas market model. According to
the authors of this study the project adds 2.26 billion € in GDP and creates around 31,000 full-time
equivalents over a period of five years.
All the above analyses have weaknesses: too rough a calculation of gas flows on a monthly basis,
no consideration of global gas flows, exogenous specification of LNG imports in Europe and LNG
prices that are too low or too high. Against this background, the question arises as to how the gas
flows will change in Europe in the long-term through Nord Stream 2, and what price effects this
will have for the individual European countries. These questions are the focus of our paper that is
structured as follows: The WEGA gas market model is used to analyse gas prices and gas flows.
This is explained in the following chapter. It also discusses the basic scenario used, in which Nord
Stream 2 is included at 55 bcm per year. Chapter 3 then discusses the results compared to a scenario
without Nord Stream 2. A summary of the main results then concludes our paper.
ENERDAY 2019 - 13th International Conference on Energy Economics and Technology
4
2 Gas Market Model WEGA and Base Case
SWM has been using the WEGA gas market model since 2013 to analyse global gas flows and gas
prices until 2040. The consulting firm Pöyry Management Consulting (UK) Ltd. developed the
model under the name PEGASUS [3], [25] and uses it for its own analyses and for the preparation
of its own fee-based reports. To ensure that WEGA is up to date, SWM obtains an annual data
update from Pöyry and modifies it with its own assumptions. For example, SWM has its own
assumptions on the development of the oil price, exchange rates, marginal costs of storage facili-
ties, gas demand or production volumes from individual sources. These modifications are based
on SWM analyses, on publicly accessible sources or come from other commercial providers, some
of which maintain their own gas market models. For this reason, the results of this work are not
the view of PÖYRY, but of SWM within scenarios. Changes to the scenarios would lead to differ-
ent results. For plausibility checks, NCG, NBP and TTF future prices are frequently calculated to
make sure that WEGA is generating accurate market prices for the next years. In addition, results
are discussed with experts of SWM and other companies.
Gas market models can be divided into two classes: On the one hand, models in which market
power is exercised by the players and, on the other hand, models which operate with full competi-
tion. For an overview of gas market models, see the work of Chyong and Hobbs [2], Holz et al.
[16] and the work of the Energy Modeling Forum [4]. The WEGA gas market model works with
perfect foresight and full competition. Market power of individual players and investment deci-
sions are fixed in scenarios. For example, the construction of the Nord Stream 2 Baltic Sea pipeline
can be stored in WEGA. This assumes a scenario in which Russia deliberately creates overcapac-
ities for the transport of natural gas in order to make it more difficult for other participants to enter
the market. In any other scenario, additional price specifications from producers or a possible with-
holding of quantities can be assumed.
WEGA is a global gas market model. The mapping of global gas flows is important, as the increas-
ing trade in liquefied natural gas (LNG) means that markets can no longer be viewed in isolation.
According to BP, LNG will account for a larger share of global gas trade than pipeline gas in the
long term [1]. While pipeline transport is linked to a fixed start and end point, LNG can be trans-
ported by ship from a liquefaction terminal to any regasification terminal in the world. Gas market
models with a regional focus, which, for example, only consider North America or Europe and
specify LNG flows, do not therefore reflect reality with sufficient accuracy.
With the help of different types at nodes and edges, the worldwide gas market is mapped in WEGA.
A distinction is made between the nodes:
Demand zone: These can be countries, regions or trading points. For example, NetConnect
Germany (NCG) or Henry Hub (HH) in the USA are mapped as trading points in the model.
Another example is the region Southeast Europe where some small countries with low gas
demand are merged to a group. Each demand zone is assigned a daily gas demand until
2040.
ENERDAY 2019 - 13th International Conference on Energy Economics and Technology
5
Local source: These gas fields represent own production within the demand zone. Produc-
tion capacity, production costs and any production profiles during the year (e.g. seasonal
production profiles at the Groningen gas field) are stored until 2040.
Pipe source: In the model, gas fields are combined into larger groups in order to reduce the
computing time. Gas fields have a capacity, production costs, and – if applicable – a pro-
duction profile during the year and a minimum capacity. These data are given until 2040.
One gas field in WEGA, for example, is the Yamal gas field in Russia.
Pipe delivery point (DP): Pipelines are linked to a demand zone by means of a landing
point. This landing point has a maximum capacity. An example is the landing station in
Lubmin near Greifswald for the Nord Stream Baltic Sea pipeline.
LNG source: This node is used to model LNG liquefaction terminals. They have a capacity,
production costs, and possibly a production profile during the course of the year and a
minimum capacity. The logic is identical to gas fields with pipeline connection. A distinc-
tion is made between gas fields with pipeline connection and gas fields with connection to
LNG terminals in order to facilitate the evaluation of the results. Here an expansion path
for the liquefaction capacity up to 2040 is specified in the model.
LNG delivery point (DP): All worldwide import terminals are shown in the model. A pos-
sible expansion path for each demand zone is also stored here. Import terminals also have
a capacity and costs.
Gas storage: All gas storage facilities in Europe are modelled individually. They have an
injection and withdrawal capacity as well as costs. Gas storage facilities in North America
or China have been grouped together. Any extensions, new buildings or shutdowns are
shown until 2040.
Options for flexibility in demand zones (DS): These include price limits for the coal gas
switch as well as for customers who can be switched off. There is also demand shedding to
prevent the optimization problem from becoming insolvable. If load shedding occurs, the
model is not sufficiently calibrated and must be readjusted.
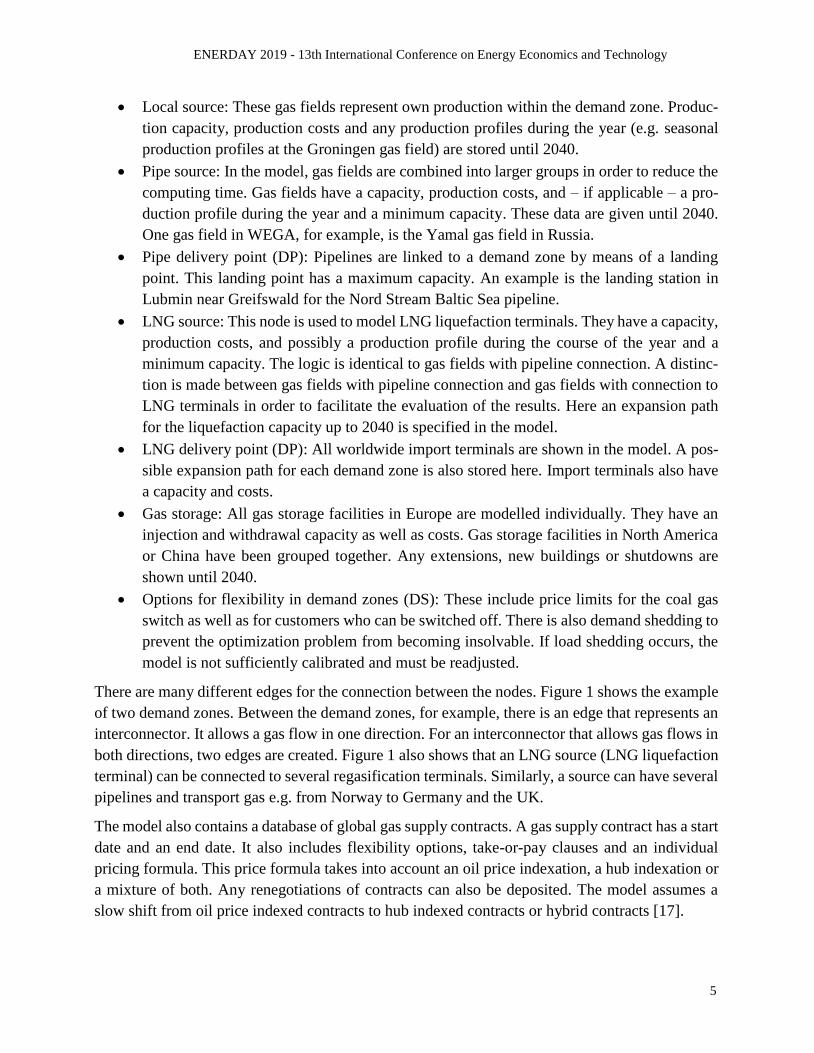
There are many different edges for the connection between the nodes. Figure 1 shows the example
of two demand zones. Between the demand zones, for example, there is an edge that represents an
interconnector. It allows a gas flow in one direction. For an interconnector that allows gas flows in
both directions, two edges are created. Figure 1 also shows that an LNG source (LNG liquefaction
terminal) can be connected to several regasification terminals. Similarly, a source can have several
pipelines and transport gas e.g. from Norway to Germany and the UK.
The model also contains a database of global gas supply contracts. A gas supply contract has a start
date and an end date. It also includes flexibility options, take-or-pay clauses and an individual
pricing formula. This price formula takes into account an oil price indexation, a hub indexation or
a mixture of both. Any renegotiations of contracts can also be deposited. The model assumes a
slow shift from oil price indexed contracts to hub indexed contracts or hybrid contracts [17].
ENERDAY 2019 - 13th International Conference on Energy Economics and Technology
6
Figure 1: Example with two demand zones.
WEGA uses Linear Programming (LP) and was created in the Xpress Optimization Suite. A sce-
nario until 2040 is calculated by WEGA on an RX600 with 1 TB RAM and 32 x 2 GHz in about
25 minutes. Each gas year is optimized separately by the model, whereby the gas year is broken
down into individual days d. The goal of the optimization is to minimize the total cost C to cover
the daily gas demand of a gas year (see Formula 1). The total costs consist of the daily production
costs CProdd, transport costs CTranspd, storage costs CStored and flexibility costs CFlexd.
There are numerous constraints to be met in minimising overall costs. A hard constraint is the
coverage of the gas demand of each demand zone z on each day d (see Formula 2). In Formula 2,
In means an inflow to the demand zone and Out means an outflow. The daily gas demand of a
demand zone z is covered by inflows and outflows of the pipelines belonging to the demand zone,
LNG regasification terminals (LNGInz,d) or LNG export terminals (LNGOutz,d), interconnectors,
storage facilities and flexibility options. There are also inflows from own production within the
demand zone.
Min C = ∑ (CProdd + CTranspd + CStored + CFlexd)D
d=1 (1)
ENERDAY 2019 - 13th International Conference on Energy Economics and Technology
7
Demandz,d = PipelineInz,d - PipelineOutz,d +
LNGInz,d - LNGOutz,d +
InterconnectorInz,d - InterconnectorOutz,d +
StorageInz,d - StorageOutz,d +
FlexibilityInz,d + IndigenousProductionInz,d ∀ z∈Z, d∈D
(2)
Other constraints refer to the previously mentioned properties of nodes, edges, and contracts. For
example, the maximum capacity of a pipeline or LNG regasification terminal may not be exceeded.
Contractual agreements arising from long-term supply contracts must also be observed.
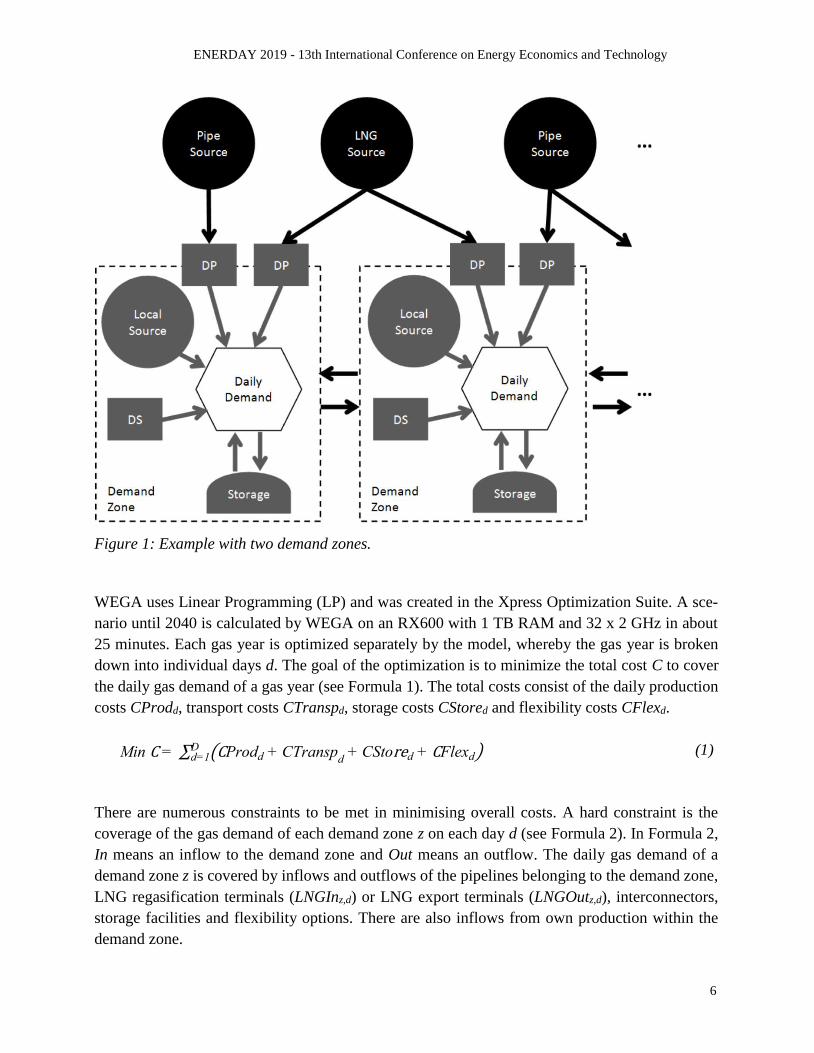
The business intelligence software Tableau is integrated into the gas market model to visualize the
large number of input data and results. Figure 2 shows a screenshot of WEGA. The number one
marks the area in which new scenarios can be created or existing scenarios selected. Below this,
predefined views of a scenario can be selected in the area with the number two, which are then
displayed in the area with the number three. Input data can also be changed there.
Figure 2: Screenshot of WEGA with data on gas storages in Germany
For the experiments of this work a base case in WEGA is generated, in which Nord Stream 2 is
completed with 55 bcm per year. It is unlikely that Nord Stream 2 is operating at full capacity at
the end of 2019 [23]. Thus, it is assumed for the base case that Nord Stream 2 starts operation
ENERDAY 2019 - 13th International Conference on Energy Economics and Technology
8
during 2020. It is also expected that Turkish Stream with 31.5 bcm per year and Trans Adriatic
Pipeline (TAP) with 10 bcm per year will be build. Furthermore, it is assumed that the projects
from the Ten-Year Network Development Plan (TYNDP) of ENTSOG [5] are built.
It is the intention of the EU to keep Ukraine a transit state for Russian gas [10], but the transit
pipelines need to be refurbished [20]. Ukrainian transit pipelines are relatively old with some pipe-
lines older than 50 years. At the moment only Urengoy-Pomary-Uzhgorod (UPU) pipeline with an
annual capacity of 30 bcm is being refurbished. Financing for the other pipelines is not secured, so
that their long-term operation is questionable. Therefore, transit flows of Russian gas through
Ukraine are limited.
With regard to gas demand, the base case is grounded on the New Policies Scenario of the World
Energy Outlook [18]. This results in a drop in demand for Europe of about 15 % between 2018 and
2040. In the same period, indigenous production in Europe falls to about 40 % of the 2018 level
and production in Norway falls to 55 % of the 2018 level. Further information on WEGA and the
model assumptions can be found in the papers [8], [9], [11], [12], [13] and [14].
3 Results and Discussion
To analyse the impact of Nord Stream 2 on gas prices and gas flows two scenario are created: the
base case from chapter 2 and an identical scenario but without Nord Stream 2. This chapter first
discusses the gas flows with Nord Stream 2. As exemplary years for analysis of gas flows 2028
and 2035 are chosen. Figure 3 shows pipeline flows for 2028 in bcm and Figure 4 for 2035. 2028
was chosen as an exemplary year because this year all pipelines discussed today like Turkish
Stream, TAP and TANAP will be built and also the second wave of LNG liquefaction terminals
will be constructed. Moreover, 2028 is not too far in the future, which reduces the uncertainty
regarding the multitude of model parameters. The year 2035 then allows an outlook on further
developments in regular operation. The arrows in figures indicate gas flows in pipelines between
two countries without showing exact pipeline routes.1 Gas flows < 1 bcm per year were neglected.
In addition, the values were rounded.
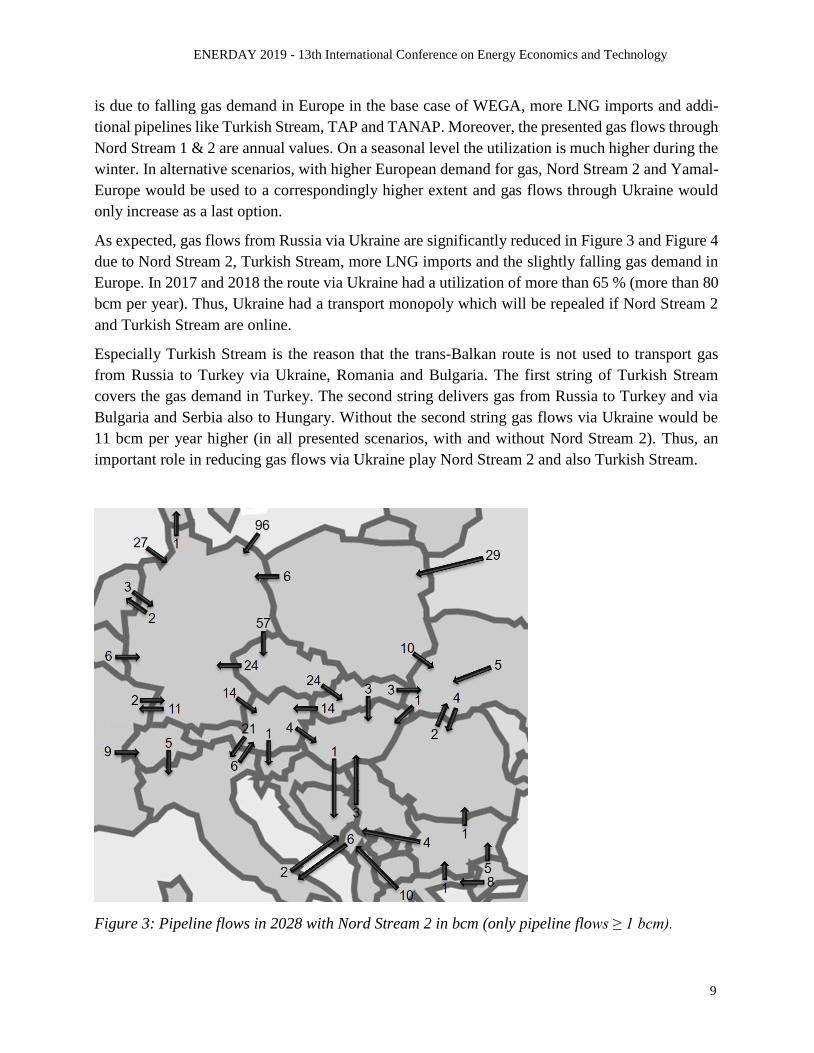
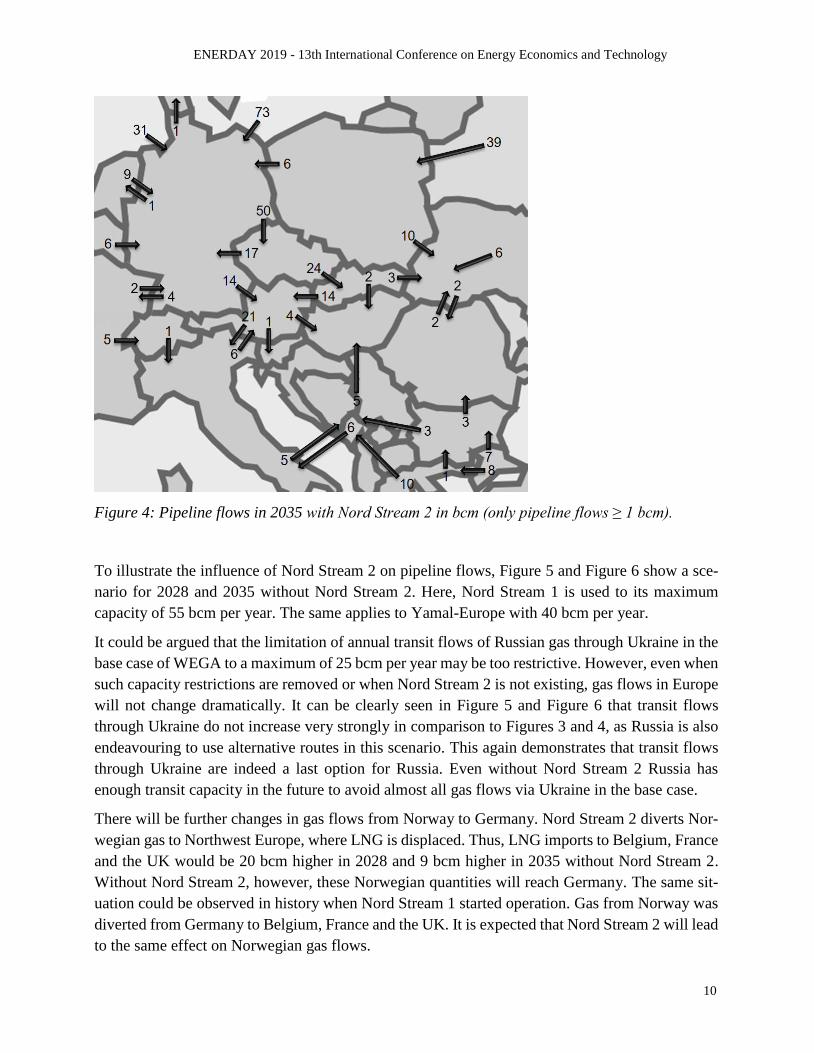
Figure 3 and Figure 4 show that the Russian gas is transported from Nord Stream 1 & 2 via OPAL
and EUGAL to the Czech Republic, among other places, from where it is then transported to Slo-
vakia and via the Gazelle to southern Germany. It can be seen in both Figures that transit flows via
the Yamal-Europe route (transit from Northern Lights to Germany through Poland) are reduced to
6 bcm in 2028 and 2035. In 2017 and 2018 this route was nearly utilized at full capacity. In addi-
tion, the capacity of Nord Stream 2 will not be fully used, neither in 2028 nor in 2035 (96 bcm and
73 bcm respectively, instead of 110 bcm maximum capacity per year of Nord Stream 1 & 2). This
1 Note: Albania, Bosnia and Herzegovina, Montenegro, Serbia and the Republic of North Macedonia are merged to
one demand zone in Figures 3, 4, 5, and 6.
ENERDAY 2019 - 13th International Conference on Energy Economics and Technology
9
is due to falling gas demand in Europe in the base case of WEGA, more LNG imports and addi-
tional pipelines like Turkish Stream, TAP and TANAP. Moreover, the presented gas flows through
Nord Stream 1 & 2 are annual values. On a seasonal level the utilization is much higher during the
winter. In alternative scenarios, with higher European demand for gas, Nord Stream 2 and Yamal-
Europe would be used to a correspondingly higher extent and gas flows through Ukraine would
only increase as a last option.
As expected, gas flows from Russia via Ukraine are significantly reduced in Figure 3 and Figure 4
due to Nord Stream 2, Turkish Stream, more LNG imports and the slightly falling gas demand in
Europe. In 2017 and 2018 the route via Ukraine had a utilization of more than 65 % (more than 80
bcm per year). Thus, Ukraine had a transport monopoly which will be repealed if Nord Stream 2
and Turkish Stream are online.
Especially Turkish Stream is the reason that the trans-Balkan route is not used to transport gas
from Russia to Turkey via Ukraine, Romania and Bulgaria. The first string of Turkish Stream
covers the gas demand in Turkey. The second string delivers gas from Russia to Turkey and via
Bulgaria and Serbia also to Hungary. Without the second string gas flows via Ukraine would be
11 bcm per year higher (in all presented scenarios, with and without Nord Stream 2). Thus, an
important role in reducing gas flows via Ukraine play Nord Stream 2 and also Turkish Stream.
Figure 3: Pipeline flows in 2028 with Nord Stream 2 in bcm (only pipeline flows ≥ 1 bcm).
ENERDAY 2019 - 13th International Conference on Energy Economics and Technology
10
Figure 4: Pipeline flows in 2035 with Nord Stream 2 in bcm (only pipeline flows ≥ 1 bcm).
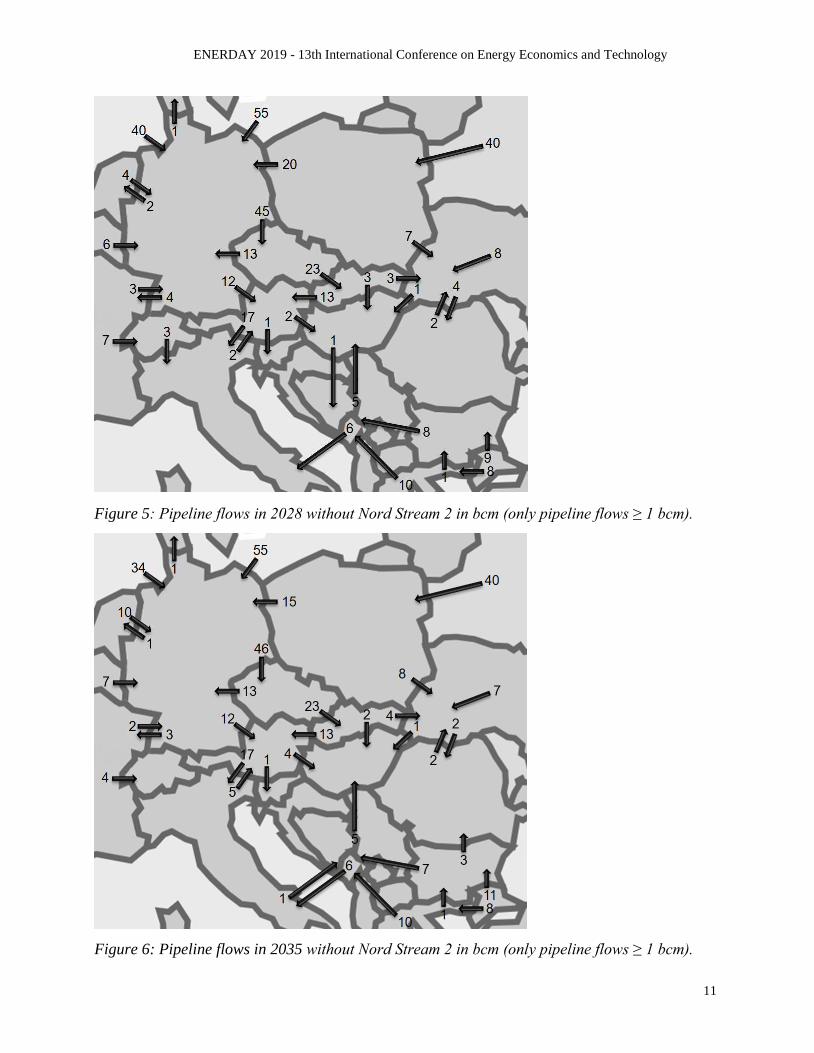
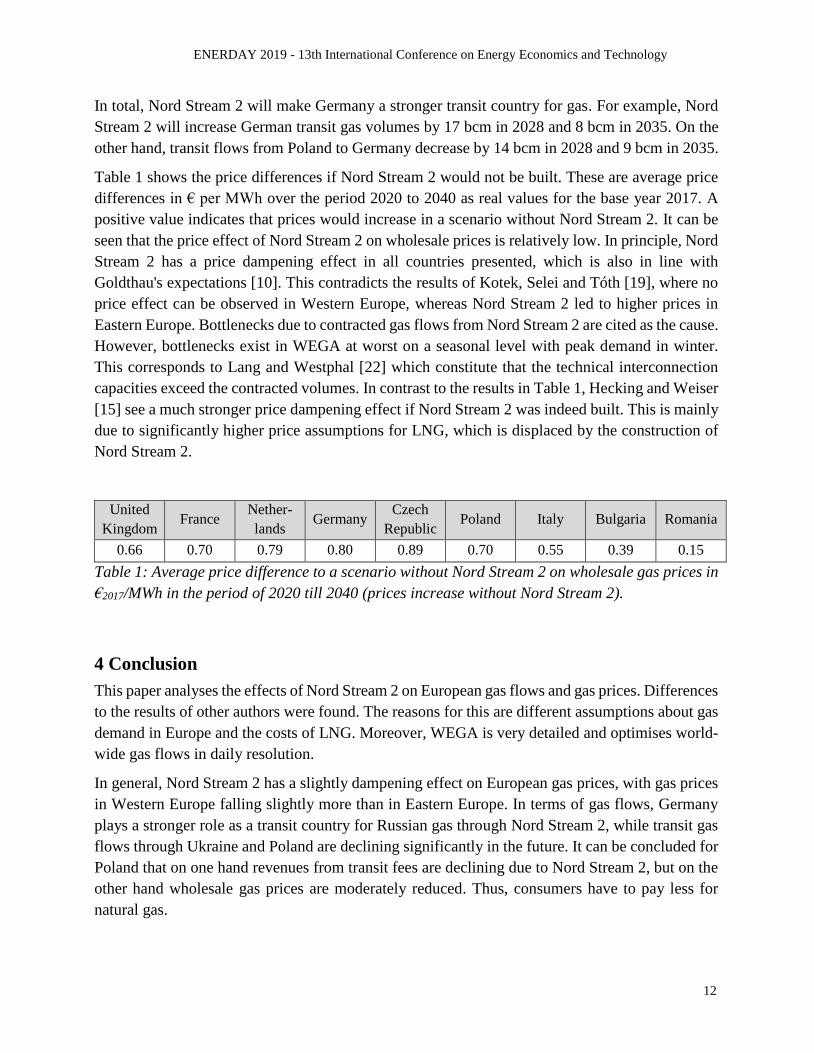
To illustrate the influence of Nord Stream 2 on pipeline flows, Figure 5 and Figure 6 show a sce-
nario for 2028 and 2035 without Nord Stream 2. Here, Nord Stream 1 is used to its maximum
capacity of 55 bcm per year. The same applies to Yamal-Europe with 40 bcm per year.
It could be argued that the limitation of annual transit flows of Russian gas through Ukraine in the
base case of WEGA to a maximum of 25 bcm per year may be too restrictive. However, even when
such capacity restrictions are removed or when Nord Stream 2 is not existing, gas flows in Europe
will not change dramatically. It can be clearly seen in Figure 5 and Figure 6 that transit flows
through Ukraine do not increase very strongly in comparison to Figures 3 and 4, as Russia is also
endeavouring to use alternative routes in this scenario. This again demonstrates that transit flows
through Ukraine are indeed a last option for Russia. Even without Nord Stream 2 Russia has
enough transit capacity in the future to avoid almost all gas flows via Ukraine in the base case.
There will be further changes in gas flows from Norway to Germany. Nord Stream 2 diverts Nor-
wegian gas to Northwest Europe, where LNG is displaced. Thus, LNG imports to Belgium, France
and the UK would be 20 bcm higher in 2028 and 9 bcm higher in 2035 without Nord Stream 2.
Without Nord Stream 2, however, these Norwegian quantities will reach Germany. The same sit-
uation could be observed in history when Nord Stream 1 started operation. Gas from Norway was
diverted from Germany to Belgium, France and the UK. It is expected that Nord Stream 2 will lead
to the same effect on Norwegian gas flows.
ENERDAY 2019 - 13th International Conference on Energy Economics and Technology
11
Figure 5: Pipeline flows in 2028 without Nord Stream 2 in bcm (only pipeline flows ≥ 1 bcm).
Figure 6: Pipeline flows in 2035 without Nord Stream 2 in bcm (only pipeline flows ≥ 1 bcm).
ENERDAY 2019 - 13th International Conference on Energy Economics and Technology
12
In total, Nord Stream 2 will make Germany a stronger transit country for gas. For example, Nord
Stream 2 will increase German transit gas volumes by 17 bcm in 2028 and 8 bcm in 2035. On the
other hand, transit flows from Poland to Germany decrease by 14 bcm in 2028 and 9 bcm in 2035.
Table 1 shows the price differences if Nord Stream 2 would not be built. These are average price
differences in € per MWh over the period 2020 to 2040 as real values for the base year 2017. A
positive value indicates that prices would increase in a scenario without Nord Stream 2. It can be
seen that the price effect of Nord Stream 2 on wholesale prices is relatively low. In principle, Nord
Stream 2 has a price dampening effect in all countries presented, which is also in line with
Goldthau's expectations [10]. This contradicts the results of Kotek, Selei and Tóth [19], where no
price effect can be observed in Western Europe, whereas Nord Stream 2 led to higher prices in
Eastern Europe. Bottlenecks due to contracted gas flows from Nord Stream 2 are cited as the cause.
However, bottlenecks exist in WEGA at worst on a seasonal level with peak demand in winter.
This corresponds to Lang and Westphal [22] which constitute that the technical interconnection
capacities exceed the contracted volumes. In contrast to the results in Table 1, Hecking and Weiser
[15] see a much stronger price dampening effect if Nord Stream 2 was indeed built. This is mainly
due to significantly higher price assumptions for LNG, which is displaced by the construction of
Nord Stream 2.
United
Kingdom France
Nether-
lands Germany
Czech
Republic Poland Italy Bulgaria Romania
0.66 0.70 0.79 0.80 0.89 0.70 0.55 0.39 0.15
Table 1: Average price difference to a scenario without Nord Stream 2 on wholesale gas prices in
€2017/MWh in the period of 2020 till 2040 (prices increase without Nord Stream 2).
4 Conclusion
This paper analyses the effects of Nord Stream 2 on European gas flows and gas prices. Differences
to the results of other authors were found. The reasons for this are different assumptions about gas
demand in Europe and the costs of LNG. Moreover, WEGA is very detailed and optimises world-
wide gas flows in daily resolution.
In general, Nord Stream 2 has a slightly dampening effect on European gas prices, with gas prices
in Western Europe falling slightly more than in Eastern Europe. In terms of gas flows, Germany
plays a stronger role as a transit country for Russian gas through Nord Stream 2, while transit gas
flows through Ukraine and Poland are declining significantly in the future. It can be concluded for
Poland that on one hand revenues from transit fees are declining due to Nord Stream 2, but on the
other hand wholesale gas prices are moderately reduced. Thus, consumers have to pay less for
natural gas.
ENERDAY 2019 - 13th International Conference on Energy Economics and Technology
13
It was shown in the scenarios that even without Nord Stream 2, Russia would have avoided gas
flows through Ukraine as much as possible, so that alternative routes such as Nord Stream 1,
Yamal-Europe, Blue Stream and Turkish Stream would have priority. However, Russia's overall
gas exports to Europe are 5 bcm per year higher in a scenario with Nord Stream 2.
In this paper also the effect of Turkish Stream was shown. Due to this pipeline, and especially the
second string of this pipeline, gas flows via the trans-Balkan route are not used in the future to
transport gas from Russia to Turkey via Ukraine, Romania and Bulgaria. Moreover, gas from the
second string of Turkish Stream will reach Hungary via Serbia and Bulgaria.
Nord Stream 2 also has an impact on gas flows in Northwest Europe. For example, it displaces
Norwegian gas from Germany. This does not mean that Norwegian gas is not needed and Norway
will produce less gas in the future. These Norwegian volumes are needed and will be piped to
Belgium, France and the UK where it displaces LNG.
Future investigations of gas prices and gas flows through Nord Stream 2 will focus, among other
things, on sensitivities to changes in demand for natural gas, various price scenarios for LNG and
Russia's price strategies.
References
[1] BP (2019): BP Energy Outlook 2019 edition.
[2] Chyong, C. K.; Hobbs, B. F. (2014): Strategic Eurasian Natural Gas Market Model for En-
ergy Security and Policy Analysis, in: Energy Economics, Vol. 44(9), pp. 198-211.
[3] Davies, G.; Sarsfield-Hall, R. (2004): Gas SCR – Cost Benefit Analysis for a Demand-Side
Response Mechanism. A report to Ofgem, Pöyry.
[4] EMF (2007): Prices and Trade in a Globalizing Natural Gas Market, EMF Report 23.
[5] ENTSOG (2019): Ten-Year Network Development Plan. https://www.entsog.eu/tyndp, vis-
ited: 13.03.2019.
[6] European Political Strategy Centre (2017): Nord Stream 2 – Divide et Impera Again? Avoid-
ing a Zero-Sum Game.
[7] Exxon Mobile (2018): 2018 Outlook for Energy: A View to 2040.
[8] Fallahnejad, M.; Eberl, B.; Günther, M. (2017): Long-Term Forecast of Residential & Com-
mercial Gas Demand in Germany, in: Book of Abstracts of the Vienna Young Scientists
Symposium (VSS 2017), pp. 108-109.
[9] Fallahnejad, M.; Günther, M.; Eberl, B. (2016): Creating Standard Load Profiles in Resi-
dential and Commercial Sectors in Germany for 2016, 2025 and 2040, in: Optimization
Online.
ENERDAY 2019 - 13th International Conference on Energy Economics and Technology
14
[10] Goldthau, A. (2016): Assessing Nord Stream 2: regulation, geopolitics & energy security in
the EU, Central Eastern Europe & the UK, EUCERS, Strategy Paper 10.
[11] Günther, M.; Fallahnejad, M. (in press): Analysis of NCG prices under different shapes of
oil price recovery with a worldwide gas market model, in: Goutte, S.; Nguyen, K. D. (eds.):
Handbook of Energy Finance. Theories, Practices and Simulations, World Scientific Pub-
lishing.
[12] Günther, M. (2017): Practical Application of a Worldwide Gasmarket Model at Stadtwerke
München, in: Dörner, K. F.; Ljubic, I.; Pflug, G.; Tragler, G. (eds.): Operations Research
Proceedings 2015 (OR 2015), pp. 715-721.
[13] Günther, M. (2016): Einsatz eines Gasmarktmodells zur Bewertung von Risiken, in: Mayr,
H. C.; Pinzinger, M. (eds.): INFORMATIK 2016, Lecture Notes in Informatics (LNI), Vol.
P-259, pp. 635-648.
[14] Günther, M.; Schimpf, M. (2016): Auswirkungen von Energieeinsparungen auf den Gasbe-
darf und den Gaspreis in Deutschland bis 2040, in: Mayr, H. C.; Pinzinger, M. (eds.):
INFORMATIK 2016, Lecture Notes in Informatics (LNI), Vol. P-259, pp. 1213-1226.
[15] Hecking, H.; Weiser, F. (2017): Impacts of Nord Stream 2 on the EU Natural Gas Market,
ewi.
[16] Holz, F.; von Hirschhausen, C.; Kemfert, C. (2008): A Strategic Model of European Gas
Supply (GASMOD), in: Energy Economics, Vol. 30(8), pp. 766-788.
[17] IGU (2018): Wholesale Gas Price Survey 2018 Edition. A Global Review of Price Formation
Mechanisms 2005 to 2017.
[18] International Energy Agency (2018): World Energy Outlook 2018.
[19] Kotek, P.; Selei, A.; Tóth, B. T. (2017): The Impact Of The Construction Of The Nord Stream
2 Gas Pipeline On Gas Prices and Competition, Regional Centre for Energy Policy Re-
search.
[20] KPMG (2017), Situation of the Ukrainian natural gas market and transit system, Market
Study.
[21] Kruse, M.; Berkhahn, A. (2017): Economic impact of Europe of the Nord Stream 2 project.
Analysis of effects on job creation and GDP, Arthur D. Little.
[22] Lang, K.-O.; Westphal, K. (2017): Nord Stream 2 – A Political and Economic Contextuali-
sation, SWP Research Paper, RP 3.
[23] Pirani, S. (2018): Russian gas transit through Ukraine after 2019: the options, Oxford En-
ergy Insight: 41.
[24] Pirani, S.; Yafimava, K. (2016): Russian Gas Transit Across Ukraine Post-2019: pipeline
scenarios, gas flow consequences, and regulatory constraints, OIES Paper: NG 105.
ENERDAY 2019 - 13th International Conference on Energy Economics and Technology
15
[25] Pöyry (2012): How will intermittency change Europe's gas markets?
[26] Prognos (2017): Status und Perspektiven der europäischen Gasbilanz. Untersuchung für die
EU28 und die Schweiz.