Embed Size (px)
Citation preview
CONFERENCE ON ‘THE CYPRUS ECONOMY’
LSE , 10 TH FEBRUARY 2012
RICK VAN DER PLOEG
OXCARRE, UNIVERSITY OF OXFORD
SEE WWW.OXCARRE.OX .AC .UK FOR RESEARCH AND POLICY PAPERS
Gas in Cyprus: How to avoid the curse?
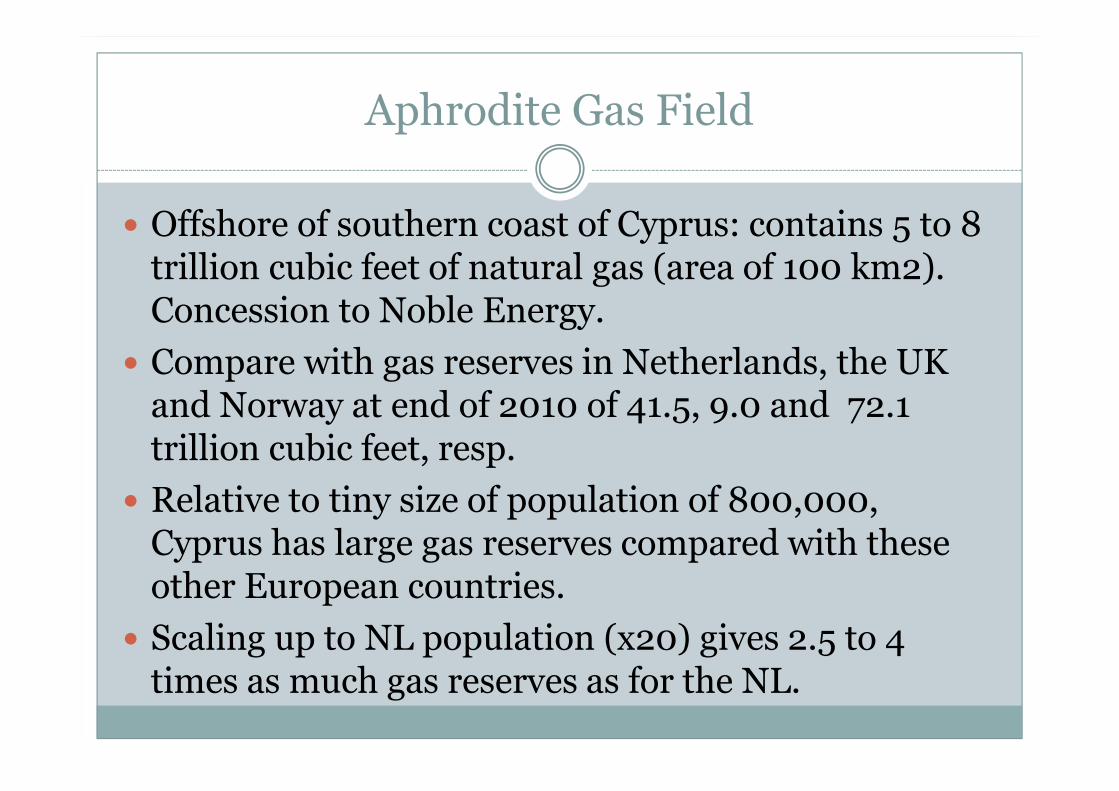
Aphrodite Gas Field
� Offshore of southern coast of Cyprus: contains 5 to 8 trillion cubic feet of natural gas (area of 100 km2). Concession to Noble Energy.
� Compare with gas reserves in Netherlands, the UK and Norway at end of 2010 of 41.5, 9.0 and 72.1 trillion cubic feet, resp.
� Relative to tiny size of population of 800,000, Cyprus has large gas reserves compared with these other European countries.
� Scaling up to NL population (x20) gives 2.5 to 4 times as much gas reserves as for the NL.
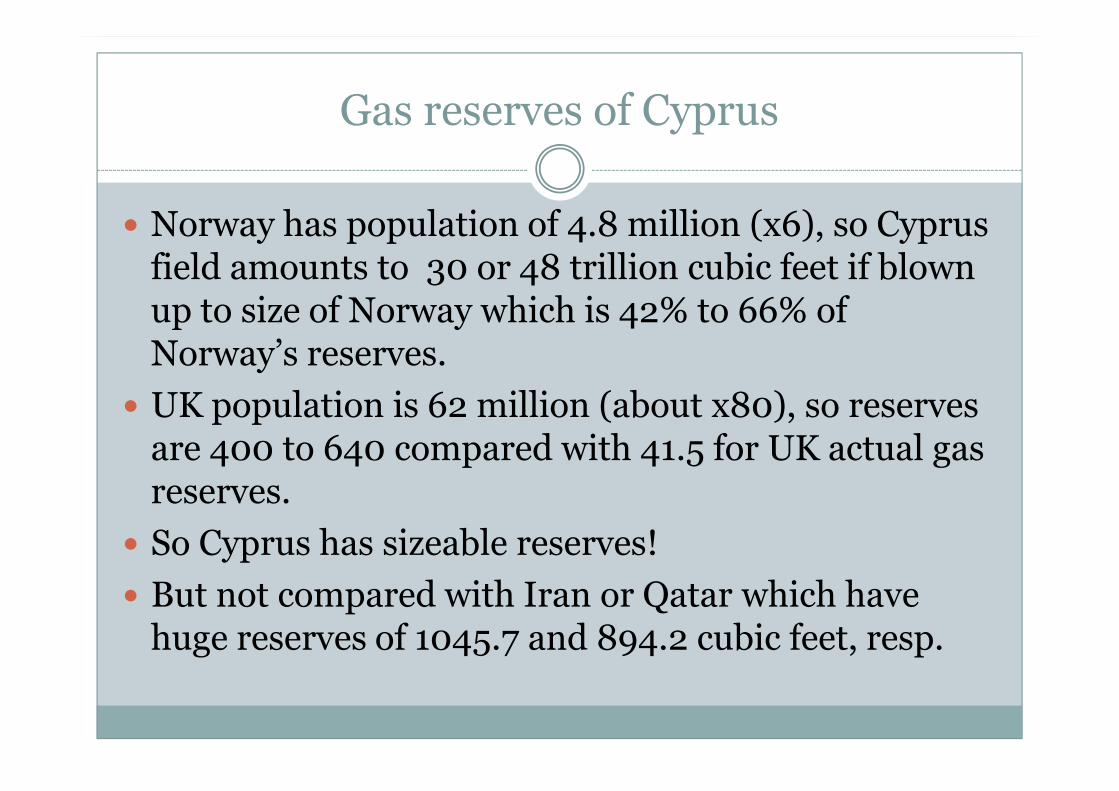
Gas reserves of Cyprus
� Norway has population of 4.8 million (x6), so Cyprus field amounts to 30 or 48 trillion cubic feet if blown up to size of Norway which is 42% to 66% of Norway’s reserves.
� UK population is 62 million (about x80), so reserves are 400 to 640 compared with 41.5 for UK actual gas reserves.
� So Cyprus has sizeable reserves!
� But not compared with Iran or Qatar which have huge reserves of 1045.7 and 894.2 cubic feet, resp.
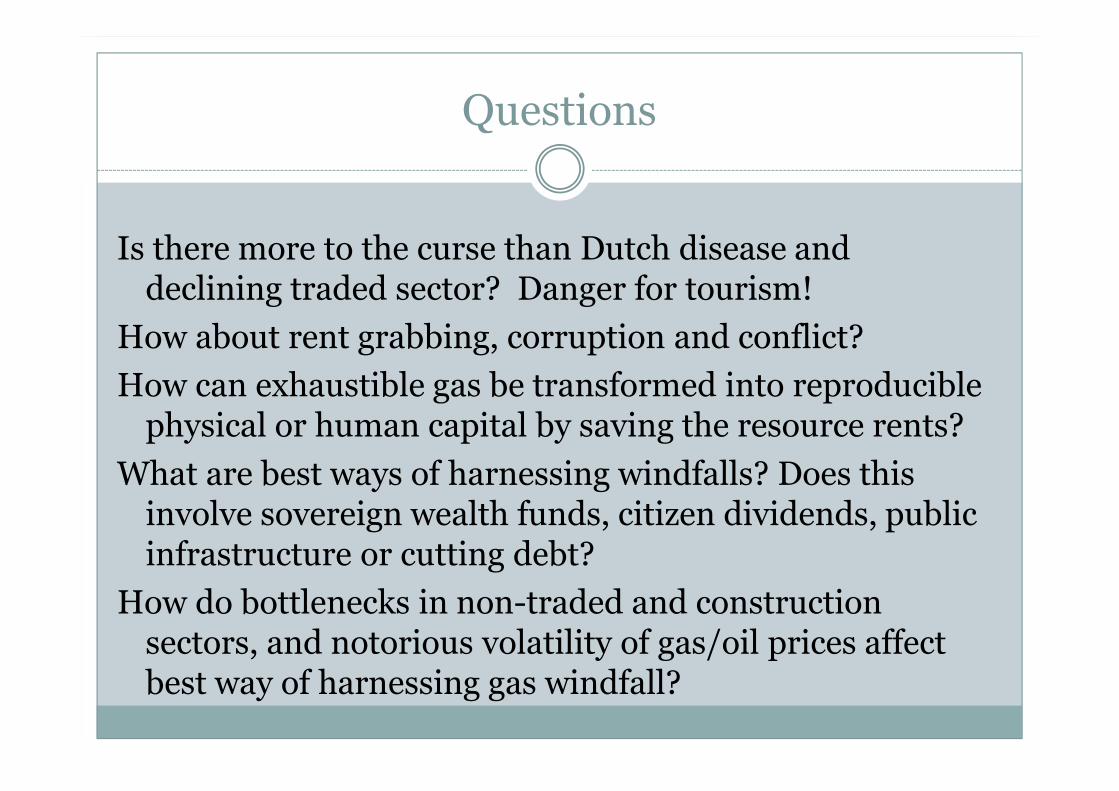
Questions
Is there more to the curse than Dutch disease and declining traded sector? Danger for tourism!
How about rent grabbing, corruption and conflict?
How can exhaustible gas be transformed into reproducible physical or human capital by saving the resource rents?
What are best ways of harnessing windfalls? Does this involve sovereign wealth funds, citizen dividends, public infrastructure or cutting debt?
How do bottlenecks in non-traded and construction sectors, and notorious volatility of gas/oil prices affect best way of harnessing gas windfall?
5
Disappointing performance despite natural resources
� 17th century Spain despite gold/silver from New World. Resource-poor Holland did much better.
� Negative growth rates during past decades: e.g., Venezuela, Iran,Libya, Kuwait, Quatar.
� Decline in OPEC GDP/ capita during last few decades while other countries enjoyed growth.
� Gold boom in 70’s did not help South Africa much (Stokke, 2005).
� Dutch economy and the Slochteren natural gas reserves led to unsustainable welfare state.
6
JapanUnited States
India
Switzerland
Italy
Korea, Rep.
United KingdomSpain
TurkeyFrance
Mexico
PakistanAustria
Burkina Faso
Hungary
IsraelGreece
Niger
Jordan
Portugal
ArgentinaMali
Burundi
Hong Kong, China
SwedenBrazil
BeninChad
Malta
Finland
Taiwan, China
Cambodia
Egypt, Arab Rep.
Paraguay
Norway
Colombia
Uruguay
Australia
Central African Republic
CanadaBelgium
Indonesia
Madagascar
Congo, Rep.
Tunisia
Panama
Denmark
Thailand
Congo, Dem. Rep.
PhilippinesGuatemala
Chile
Nigeria
Ecuador
Bolivia
Morocco
Sao Tome and Principe
Sudan
Peru
Netherlands
Ireland
SenegalEl Salvador
Togo
Ghana
CameroonNew Zealand
Costa Rica
Sri Lanka
Malawi
Algeria
Nicaragua
Honduras
Venezuela, RB
Solomon Islands
Cote d'Ivoire
Fiji
Malaysia
MauritaniaSuriname
GabonSaudi Arabia
Guyana
Trinidad and Tobago
Zambia
Libya
Kuwait
Liberia
Singapore
-50
5Ave
rage
yea
rly rea
l GD
P p
er c
apita
gro
wth
197
0-20
04
0 20 40 60 80Natural Resources exports in percent of GDP, 1970
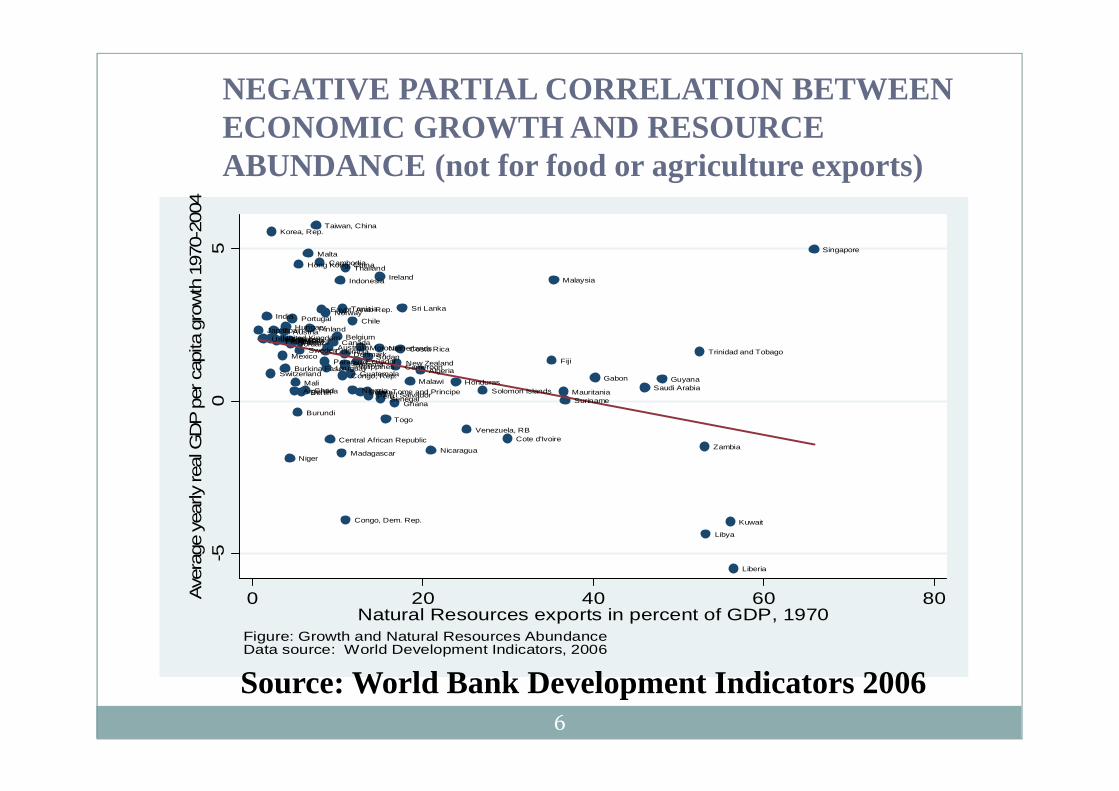
Figure: Growth and Natural Resources AbundanceData source: World Development Indicators, 2006
NEGATIVE PARTIAL CORRELATION BETWEENECONOMIC GROWTH AND RESOURCEABUNDANCE (not for food or agriculture exports)
Source: World Bank Development Indicators 2006
7
P0sitive experiences
� Botswana: 40% of GDP stems from diamonds but has second highest education/GNP and highest growth rates since 1965. GDP/capita is ten times that of Nigeria.
� Norway had huge growth in oil exports since 1971 and third largest exporter after Saudi-Arabia, but has fared fairly well.
� United Arab Emirates also turned curse into blessing by investing in modernizing infrastructure and investing in welfare state and free access to education. But avoid speculative booms (Kazakhstan).
� Mineral abundance US mid 19th to mid 20th century explains much of subsequent growth: driven by learning, IRTS and US government claimed no ultimate title to mineral rights (Habbakuk, 1962; David and Wright, 1977; Wright and Czelusta, 2004). Also, Germany and UK late 19th century.
� Lessons: avoid corruption, diversify, education, and exploit complementarities linkages of manufacturing with resource sector.
8
Resource Abundance Associated With:
� Crowding out of non-resource exports and foreign direct investment. Less openness.
� Elicits corruption and extreme rent seeking.� Crowds out foreign capital, social capital, human
capital and financial capital.� Deters FDI in non-resource sectors� Erodes legal system.� Bigger Gini index of inequality.� Less school enrolment and expected years of
schooling (Botwana exception).� Delays development of financial institutions.� Armed conflicts and civil wars.
9
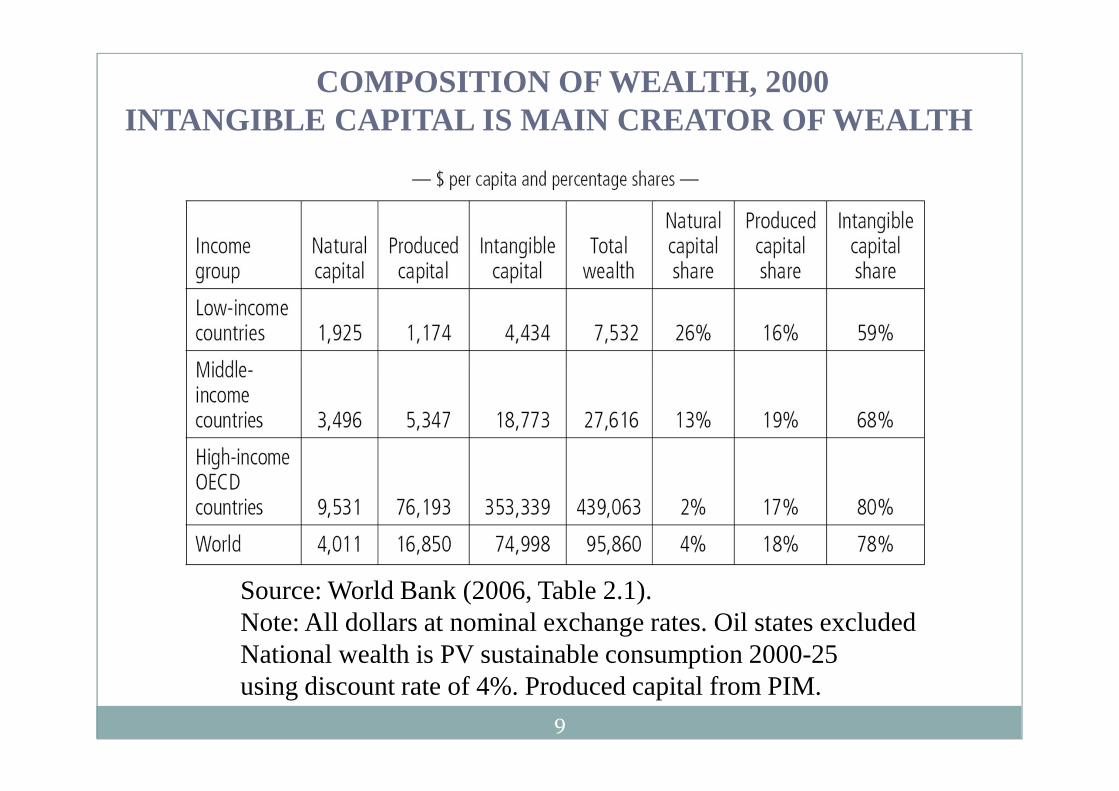
COMPOSITION OF WEALTH, 2000INTANGIBLE CAPITAL IS MAIN CREATOR OF WEALTH
Source: World Bank (2006, Table 2.1).Note: All dollars at nominal exchange rates. Oil states excludedNational wealth is PV sustainable consumption 2000-25 using discount rate of 4%. Produced capital from PIM.
10
I. Dutch Disease and Gas Curse
� Windfall gain in demand for gas from abroad induces an appreciation of the real exchange rate.
� Non-resource export sectors go in decline: tourism.
� The sheltered sector gets a boost as labour and other factors move from traded to sheltered sectors.
� ‘It seems ungrateful to talk of a disease’ (The Economist)
� Decline of exposed sectors may be efficient response to the gas boom.
� However, if there is learning by doing in the non-gas export sectors, there may be falls in output growth and welfare.
11
Extraction of Gas Requires Labour and Capital
Resource movement as well as spending effects of gas boom. Labour is drawn both out NT and T to gas sectors.
� Within context of Heckscher-Ohlin the Rybczynski theorem implies output of capital-intensive non-gas sector expands.
� If T-sector is K-intensive, gas boom induces pro-industrialisation if spending effect is not too large. Strong in small (island) economies.
12
II. Volatility and the Gas Curse
� ‘What commodity price lack in trend, they make up for in variance’ (Deaton, JEcPersp, 1999).
� Resource rich economies are vulnerable to high volatility of resource prices, especially as supply is fairly inelastic.
� Particularly bad as many resource rich economies are not diversified: specialised in resources and small sheltered sector. In fact, they specialise away from non-resource traded goods which causes even more volatility and interest rate rises! Traded sector shrinks until it vanishes (Hausmann & Rigobon).
� Volatility also bad for growth, investment, income distribution, poverty and educational attainment (Ramey & Ramey, Aizenman & Marion, Flug et al)
13
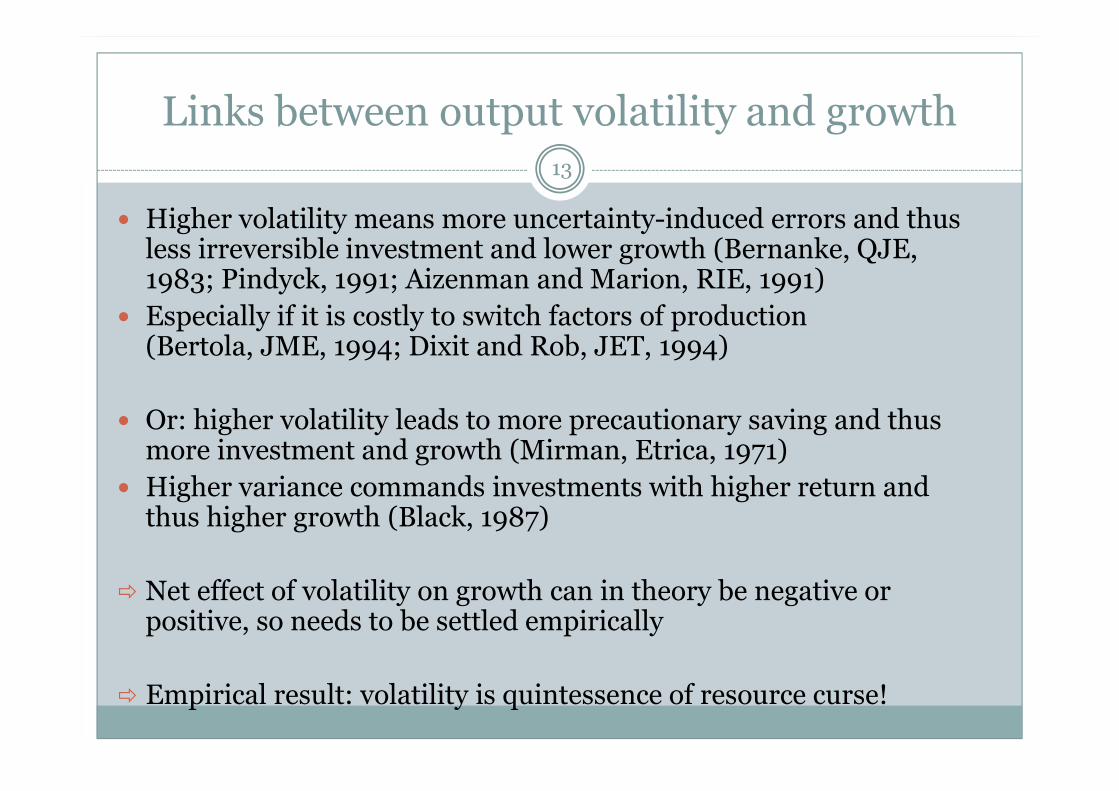
Links between output volatility and growth
� Higher volatility means more uncertainty-induced errors and thus less irreversible investment and lower growth (Bernanke, QJE, 1983; Pindyck, 1991; Aizenman and Marion, RIE, 1991)
� Especially if it is costly to switch factors of production(Bertola, JME, 1994; Dixit and Rob, JET, 1994)
� Or: higher volatility leads to more precautionary saving and thus more investment and growth (Mirman, Etrica, 1971)
� Higher variance commands investments with higher return and thus higher growth (Black, 1987)
� Net effect of volatility on growth can in theory be negative or positive, so needs to be settled empirically
� Empirical result: volatility is quintessence of resource curse!
14
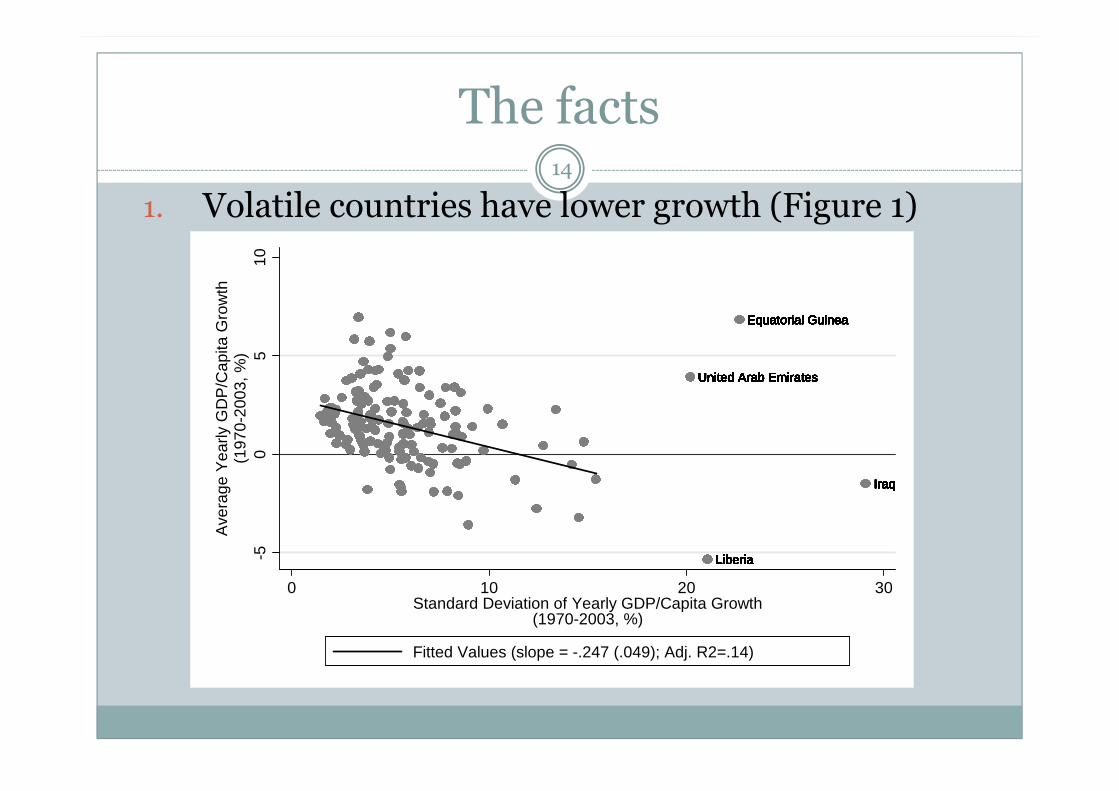
The facts
1. Volatile countries have lower growth (Figure 1)
Equatorial GuineaEquatorial GuineaEquatorial GuineaEquatorial GuineaEquatorial GuineaEquatorial GuineaEquatorial GuineaEquatorial GuineaEquatorial GuineaEquatorial GuineaEquatorial GuineaEquatorial GuineaEquatorial GuineaEquatorial GuineaEquatorial GuineaEquatorial GuineaEquatorial GuineaEquatorial GuineaEquatorial GuineaEquatorial GuineaEquatorial GuineaEquatorial GuineaEquatorial GuineaEquatorial GuineaEquatorial GuineaEquatorial GuineaEquatorial GuineaEquatorial GuineaEquatorial GuineaEquatorial GuineaEquatorial GuineaEquatorial GuineaEquatorial GuineaEquatorial GuineaEquatorial GuineaEquatorial Guinea
IraqIraqIraqIraqIraqIraqIraqIraqIraqIraqIraqIraqIraqIraqIraqIraqIraqIraqIraqIraqIraqIraqIraqIraqIraqIraqIraqIraqIraqIraqIraqIraqIraqIraqIraqIraq
LiberiaLiberiaLiberiaLiberiaLiberiaLiberiaLiberiaLiberiaLiberiaLiberiaLiberiaLiberiaLiberiaLiberiaLiberiaLiberiaLiberiaLiberiaLiberiaLiberiaLiberiaLiberiaLiberiaLiberiaLiberiaLiberiaLiberiaLiberiaLiberiaLiberiaLiberiaLiberiaLiberiaLiberiaLiberiaLiberia
United Arab EmiratesUnited Arab EmiratesUnited Arab EmiratesUnited Arab EmiratesUnited Arab EmiratesUnited Arab EmiratesUnited Arab EmiratesUnited Arab EmiratesUnited Arab EmiratesUnited Arab EmiratesUnited Arab EmiratesUnited Arab EmiratesUnited Arab EmiratesUnited Arab EmiratesUnited Arab EmiratesUnited Arab EmiratesUnited Arab EmiratesUnited Arab EmiratesUnited Arab EmiratesUnited Arab EmiratesUnited Arab EmiratesUnited Arab EmiratesUnited Arab EmiratesUnited Arab EmiratesUnited Arab EmiratesUnited Arab EmiratesUnited Arab EmiratesUnited Arab EmiratesUnited Arab EmiratesUnited Arab EmiratesUnited Arab EmiratesUnited Arab EmiratesUnited Arab EmiratesUnited Arab EmiratesUnited Arab EmiratesUnited Arab Emirates
-50
510
Ave
rage
Yea
rly G
DP
/Cap
ita G
row
th(1
970-
2003
, %)
0 10 20 30Standard Deviation of Yearly GDP/Capita Growth
(1970-2003, %)
Fitted Values (slope = -.247 (.049); Adj. R2=.14)
15
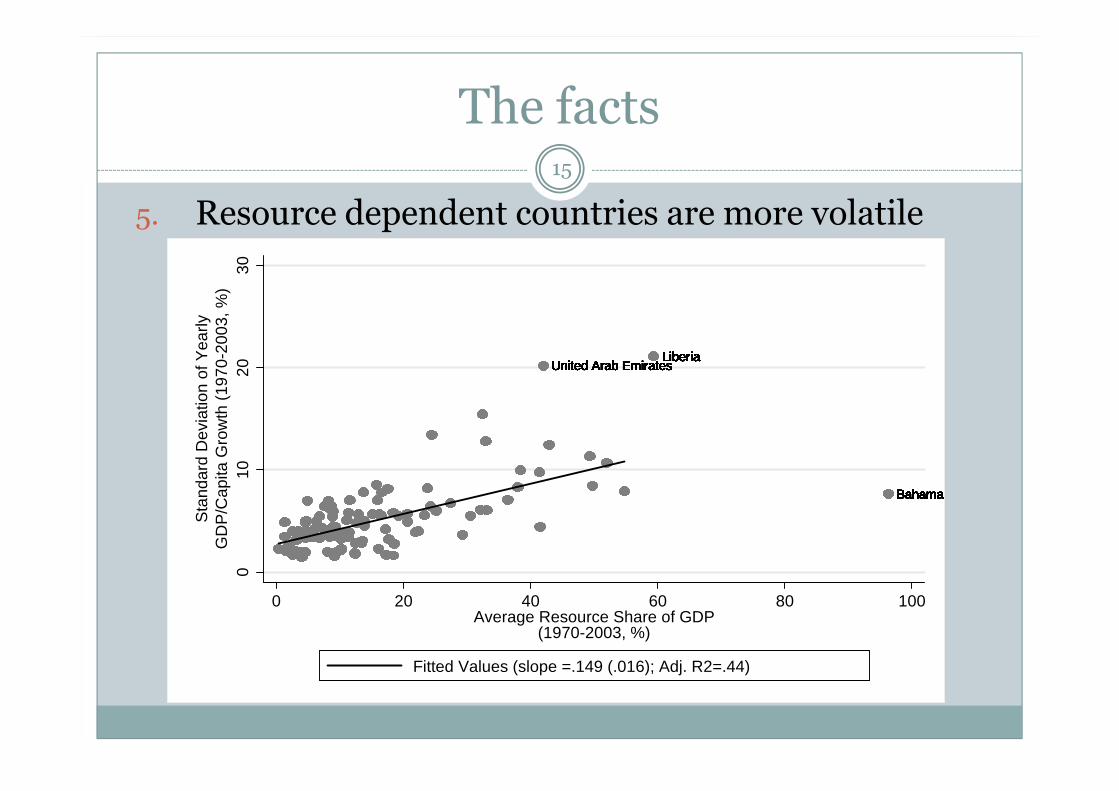
The facts
5. Resource dependent countries are more volatile
Bahamas, TheBahamas, TheBahamas, TheBahamas, TheBahamas, TheBahamas, TheBahamas, TheBahamas, TheBahamas, TheBahamas, TheBahamas, TheBahamas, TheBahamas, TheBahamas, TheBahamas, TheBahamas, TheBahamas, TheBahamas, TheBahamas, TheBahamas, TheBahamas, TheBahamas, TheBahamas, TheBahamas, TheBahamas, TheBahamas, TheBahamas, TheBahamas, TheBahamas, TheBahamas, TheBahamas, TheBahamas, TheBahamas, TheBahamas, TheBahamas, TheBahamas, The
LiberiaLiberiaLiberiaLiberiaLiberiaLiberiaLiberiaLiberiaLiberiaLiberiaLiberiaLiberiaLiberiaLiberiaLiberiaLiberiaLiberiaLiberiaLiberiaLiberiaLiberiaLiberiaLiberiaLiberiaLiberiaLiberiaLiberiaLiberiaLiberiaLiberiaLiberiaLiberiaLiberiaLiberiaLiberiaLiberiaUnited Arab EmiratesUnited Arab EmiratesUnited Arab EmiratesUnited Arab EmiratesUnited Arab EmiratesUnited Arab EmiratesUnited Arab EmiratesUnited Arab EmiratesUnited Arab EmiratesUnited Arab EmiratesUnited Arab EmiratesUnited Arab EmiratesUnited Arab EmiratesUnited Arab EmiratesUnited Arab EmiratesUnited Arab EmiratesUnited Arab EmiratesUnited Arab EmiratesUnited Arab EmiratesUnited Arab EmiratesUnited Arab EmiratesUnited Arab EmiratesUnited Arab EmiratesUnited Arab EmiratesUnited Arab EmiratesUnited Arab EmiratesUnited Arab EmiratesUnited Arab EmiratesUnited Arab EmiratesUnited Arab EmiratesUnited Arab EmiratesUnited Arab EmiratesUnited Arab EmiratesUnited Arab EmiratesUnited Arab EmiratesUnited Arab Emirates
010
2030
Sta
ndar
d D
evia
tion
of Y
early
GD
P/C
apita
Gro
wth
(19
70-2
003,
%)
0 20 40 60 80 100Average Resource Share of GDP
(1970-2003, %)
Fitted Values (slope =.149 (.016); Adj. R2=.44)
16
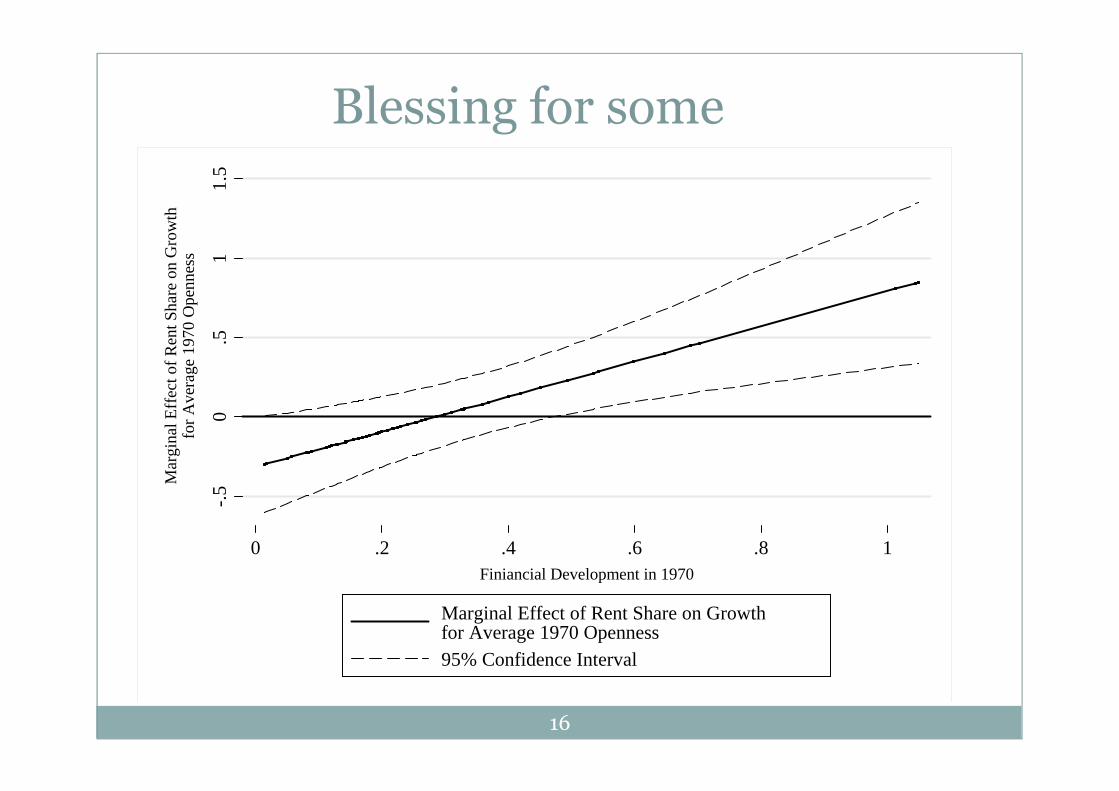
Blessing for some
-.5
0.5
11.
5
Mar
gina
l Eff
ect o
f Ren
t Sha
re o
n G
row
thfo
r A
vera
ge 1
970
Ope
nnes
s
0 .2 .4 .6 .8 1Finiancial Development in 1970
Marginal Effect of Rent Share on Growthfor Average 1970 Openness95% Confidence Interval
17
The Volatility Curse
� Volatility of unanticipated output growth is quintessential feature of the natural resource curse!
� Positive direct effect of the level of natural resource exports on growth is swamped by negative indirect effect of volatility on growth performance.
� Countries with high degrees of financial development can turn resource wealth into blessing and boon for growth.
� Point-base impact stronger than diffuse resources.
18
III. Windfalls encourage unsustainable policies
� Erosion of critical faculties of politicians.
� Netherlands in the seventies dressed up the welfare state and governments since 1989 have been trying to have a sustainable welfare state.
� Induces excessive borrowing (Manzano and Rigobon, 2002) & invest in ‘prestige’ projects.
� Loose sight of growth-promoting policies and value-for-money management. E.g.: FES in Netherlands
� State-led industrialisation through import substitution and heavy subsidies for manufacturing.
19
IV. Resources ⇒⇒⇒⇒rent seeking, corruption and conflict
� Allocation of talent: countries with many rent seekers and lawyers grow more slowly than countries with lots of engineers (Murphy et al)
� Corruption, political instability, bureaucratic inefficiency, assassinations and conflict also hamper economic growth (Mauro, 1995; Leite and Weidmann, 1999). Bad effects of resource growth mainly operates via worsening of institutions, rule of law, etc.
� Increases civil strife and wars, especially in sub-Saharan Africa thru’ weakening of state or finance of rebels (Collier and Hoeffler, 2004; Ross, 2004). War lord competition (Skaperdas, 2004). Distinguish between grievance and greed (Ollson and Fors, 2004).
� Especially bad for point-based rather than diffuse resources.
20
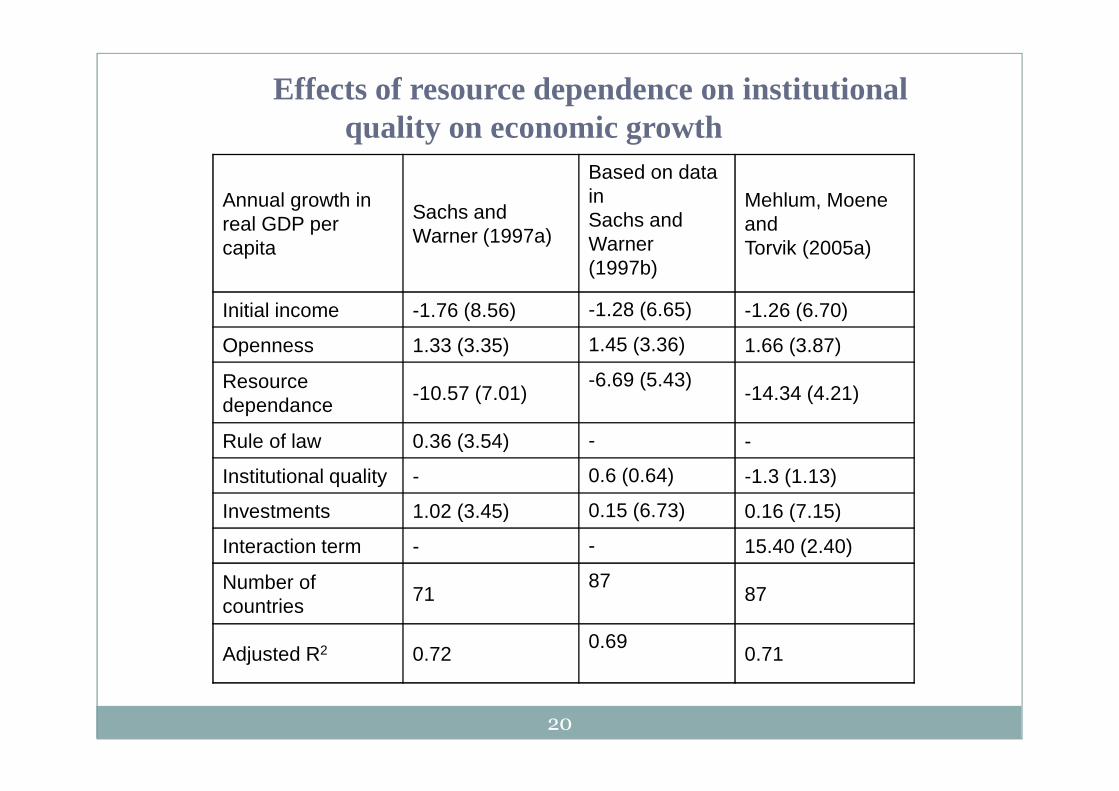
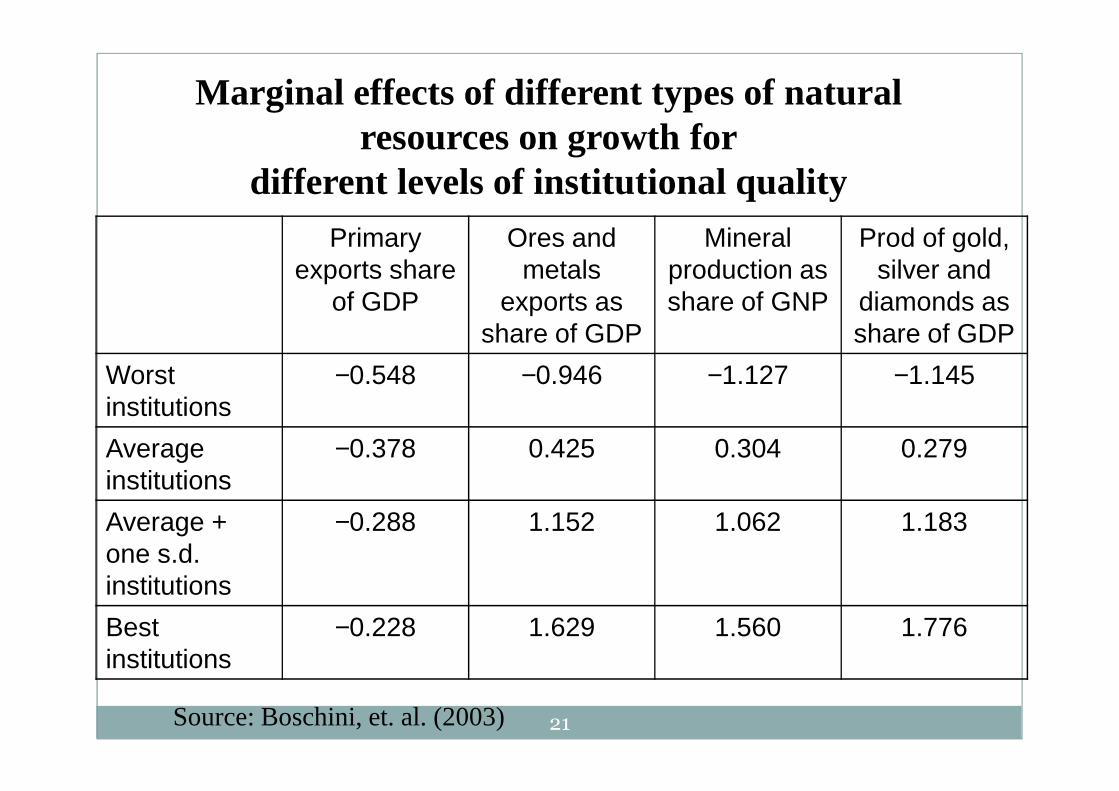
Effects of resource dependence on institutional quality on economic growth
Annual growth in real GDP per capita
Sachs and Warner (1997a)
Based on data inSachs and Warner(1997b)
Mehlum, Moene andTorvik (2005a)
Initial income -1.76 (8.56) -1.28 (6.65) -1.26 (6.70)
Openness 1.33 (3.35) 1.45 (3.36) 1.66 (3.87)
Resource dependance
-10.57 (7.01)-6.69 (5.43)
-14.34 (4.21)
Rule of law 0.36 (3.54) - -
Institutional quality - 0.6 (0.64) -1.3 (1.13)
Investments 1.02 (3.45) 0.15 (6.73) 0.16 (7.15)
Interaction term - - 15.40 (2.40)
Number of countries
7187
87
Adjusted R2 0.720.69
0.71
21
Marginal effects of different types of natural resources on growth for
different levels of institutional qualityPrimary
exports share of GDP
Ores and metals
exports as share of GDP
Mineral production as share of GNP
Prod of gold, silver and
diamonds as share of GDP
Worst institutions
−0.548 −0.946 −1.127 −1.145
Average institutions
−0.378 0.425 0.304 0.279
Average + one s.d. institutions
−0.288 1.152 1.062 1.183
Best institutions
−0.228 1.629 1.560 1.776
Source: Boschini, et. al. (2003)
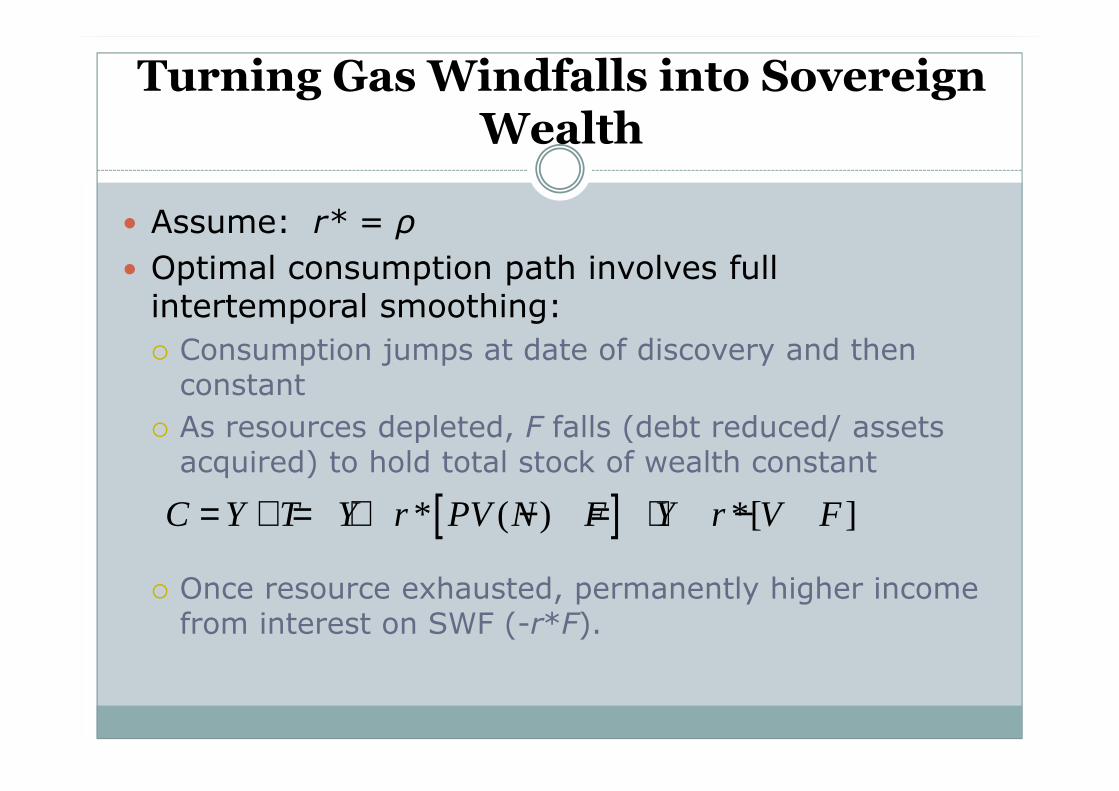
Turning Gas Windfalls into Sovereign Wealth
� Assume: r* = ρ
� Optimal consumption path involves full intertemporal smoothing:
� Consumption jumps at date of discovery and then constant
� As resources depleted, F falls (debt reduced/ assets acquired) to hold total stock of wealth constant
� Once resource exhausted, permanently higher income from interest on SWF (-r*F).
[ ]* ( ) *[ ]C Y T Y r PV N F Y r V F= + = + − = + −
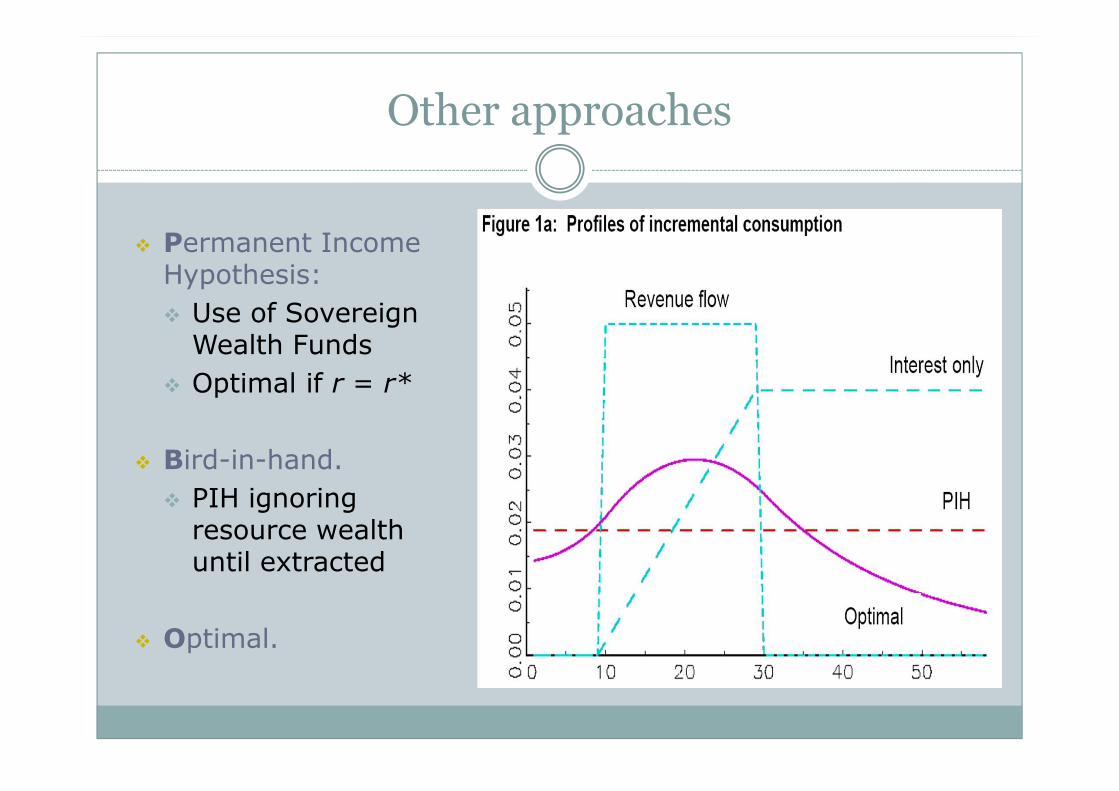
Other approaches
� Permanent Income Hypothesis:
� Use of Sovereign Wealth Funds
� Optimal if r = r*
� Bird-in-hand.
� PIH ignoring resource wealth until extracted
� Optimal.
24
Genuine saving
� Public and private saving at home and abroad, net of depreciation (GNP − C − δ K)
� Plus current spending on education to capture change in intangible human wealth
� Minus depletion of natural exhaustible and renewable resources
� Minus damage of stock pollutants (CO2 and particulate matter)
� Equals increase in nation’s wealth (Dasgupta and Mäler, 2000; Hamilton & Hartwick, 2005).
� Hartwick rule: genuine saving should be zero!
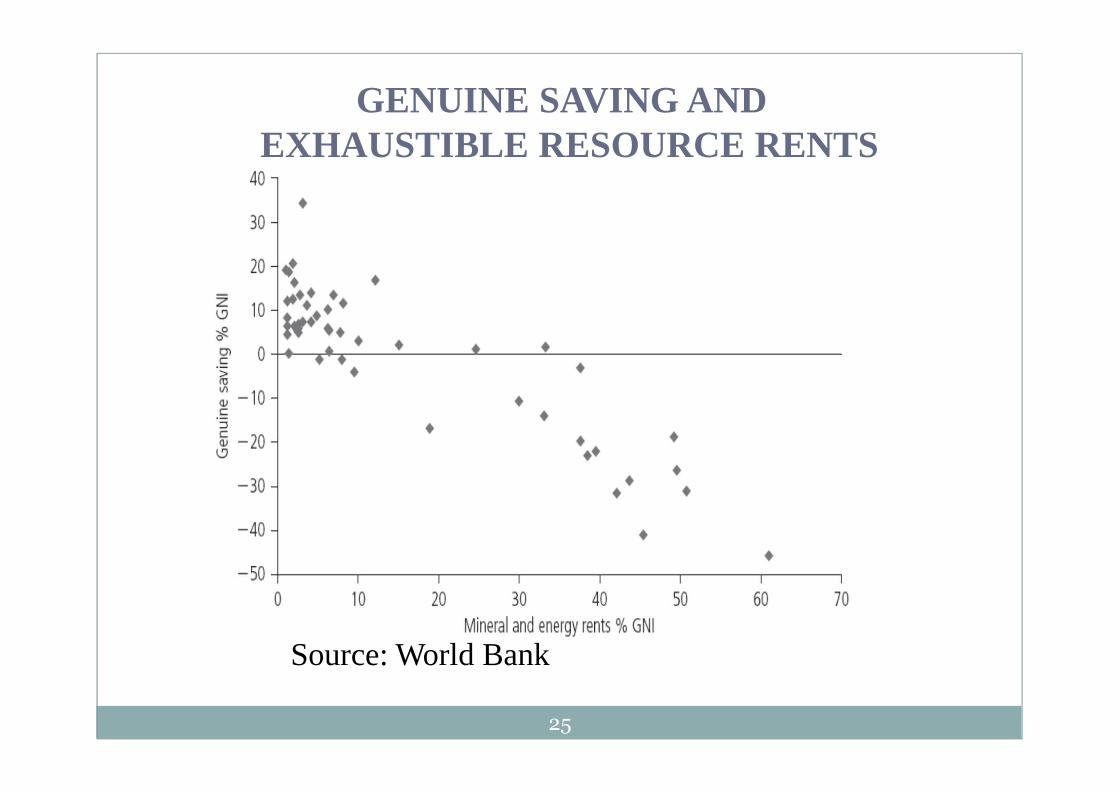
25
GENUINE SAVING AND EXHAUSTIBLE RESOURCE RENTS
Source: World Bank
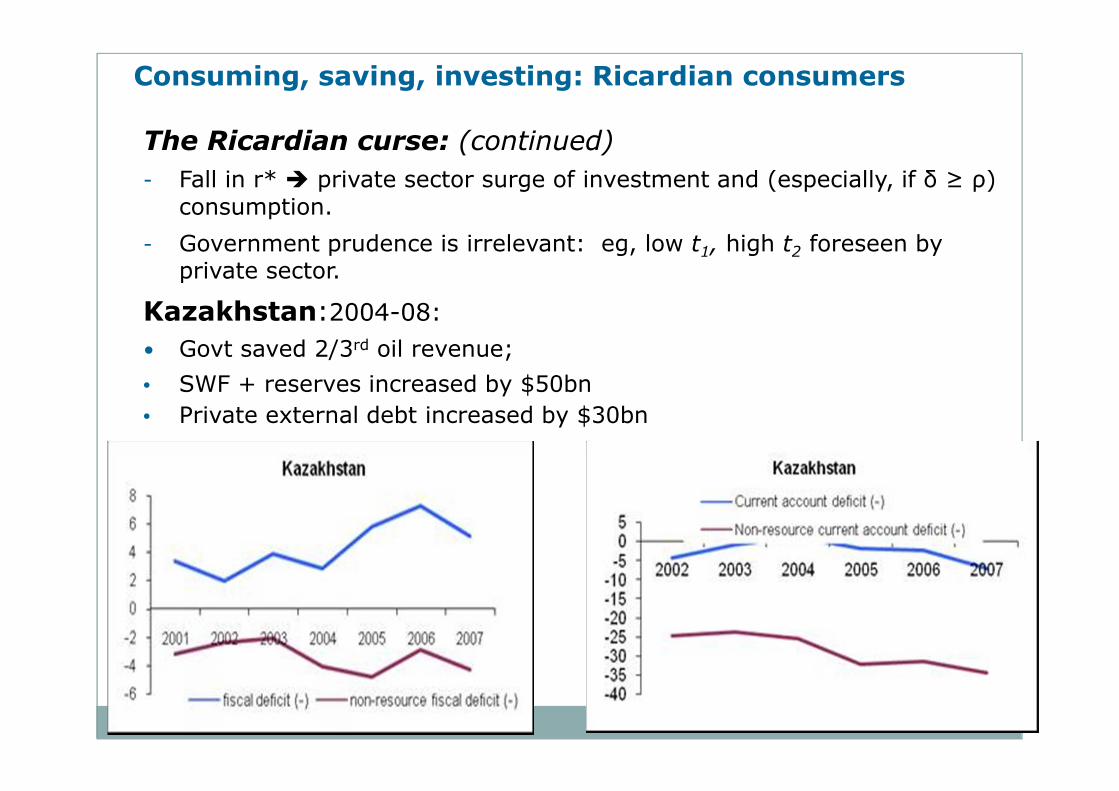
The Ricardian curse: (continued)
- Fall in r* � private sector surge of investment and (especially, if δ ≥ ρ) consumption.
- Government prudence is irrelevant: eg, low t1, high t2 foreseen by private sector.
Kazakhstan:2004-08:
• Govt saved 2/3rd oil revenue;
• SWF + reserves increased by $50bn
• Private external debt increased by $30bn
Consuming, saving, investing: Ricardian consumers
Political considerations
� Political considerations: with partisan preferences about public investment projects, incumbent will over-borrow and over-invest in its pet projects, especially if these are more illiquid than SWF and chance of being kicked out of office is large.
� Budget inertia and weak lobbying favouring projects that confer large benefits on small groups.
� Common-pool problems: voracious rent seeking.
� In failed states, better to leave oil under the ground.
28
Transparency is a must
� Highest standards of public and corporate accountability, PSR/CSR and transparency: publish what you earn from exports and publish what you do with the revenues. See Resource Charter.
� Exploitation companies should publish their payments to all governments and encourage mandatory disclosure mechanism.
� Make debt relief etc. contingent on transparency, free press and anti-corruption efforts – role IMF, World Bank and UNDP. Establish global information office.
� Western banks should be punished for allowing tainted money to be deposited.
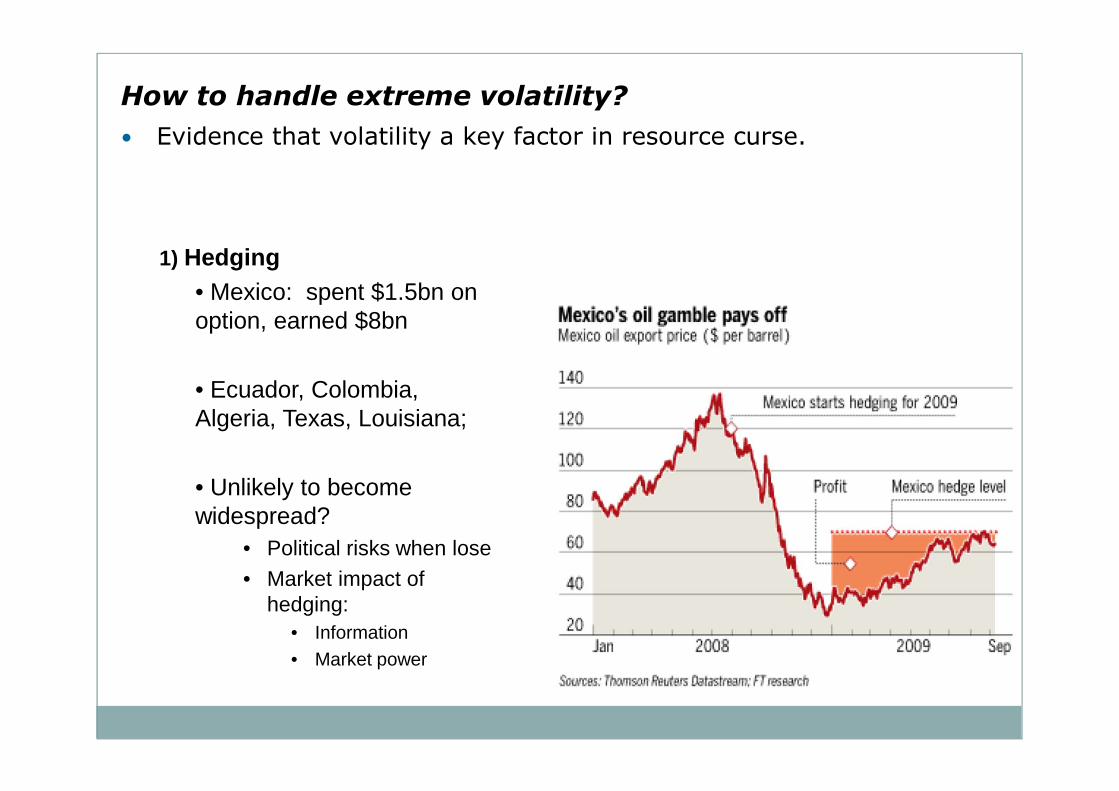
How to handle extreme volatility?
• Evidence that volatility a key factor in resource curse.
1) Hedging• Mexico: spent $1.5bn on option, earned $8bn
• Ecuador, Colombia, Algeria, Texas, Louisiana;
• Unlikely to become widespread?
• Political risks when lose• Market impact of
hedging:• Information• Market power
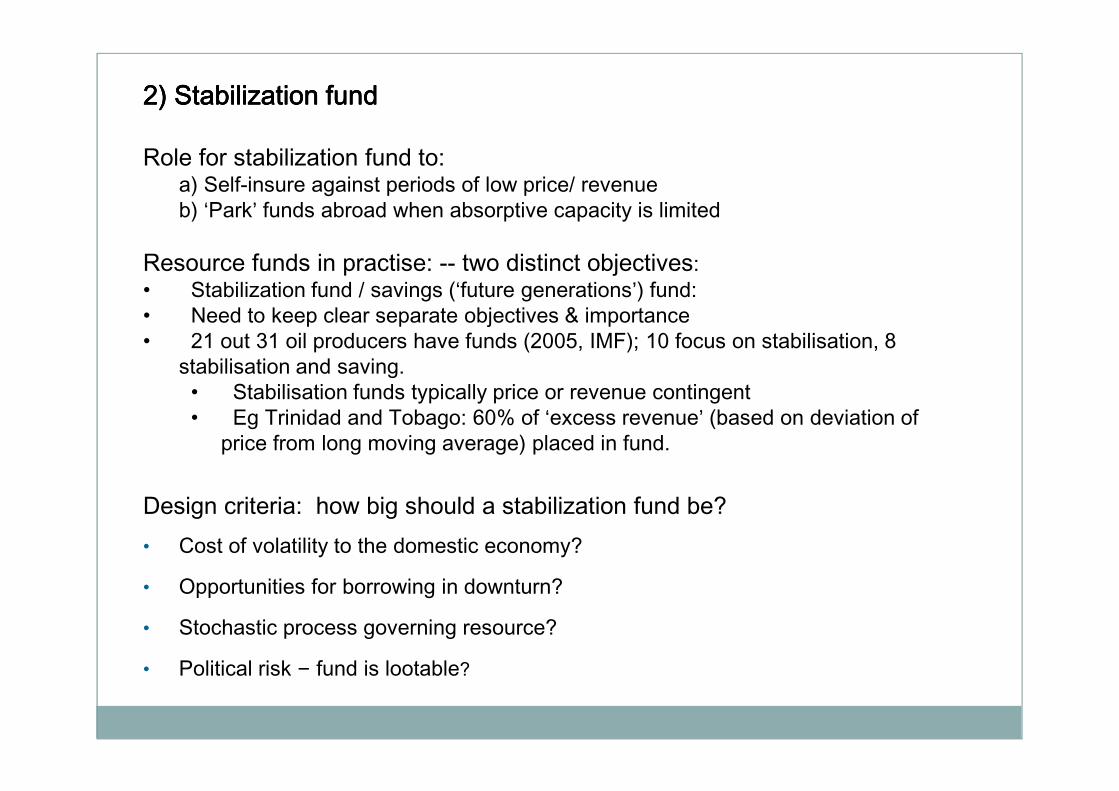
2) Stabilization fund2) Stabilization fund2) Stabilization fund2) Stabilization fund
Role for stabilization fund to:a) Self-insure against periods of low price/ revenue b) ‘Park’ funds abroad when absorptive capacity is limited
Resource funds in practise: -- two distinct objectives: • Stabilization fund / savings (‘future generations’) fund:• Need to keep clear separate objectives & importance• 21 out 31 oil producers have funds (2005, IMF); 10 focus on stabilisation, 8
stabilisation and saving.• Stabilisation funds typically price or revenue contingent• Eg Trinidad and Tobago: 60% of ‘excess revenue’ (based on deviation of
price from long moving average) placed in fund.
Design criteria: how big should a stabilization fund be?• Cost of volatility to the domestic economy?
• Opportunities for borrowing in downturn?
• Stochastic process governing resource?
• Political risk – fund is lootable?
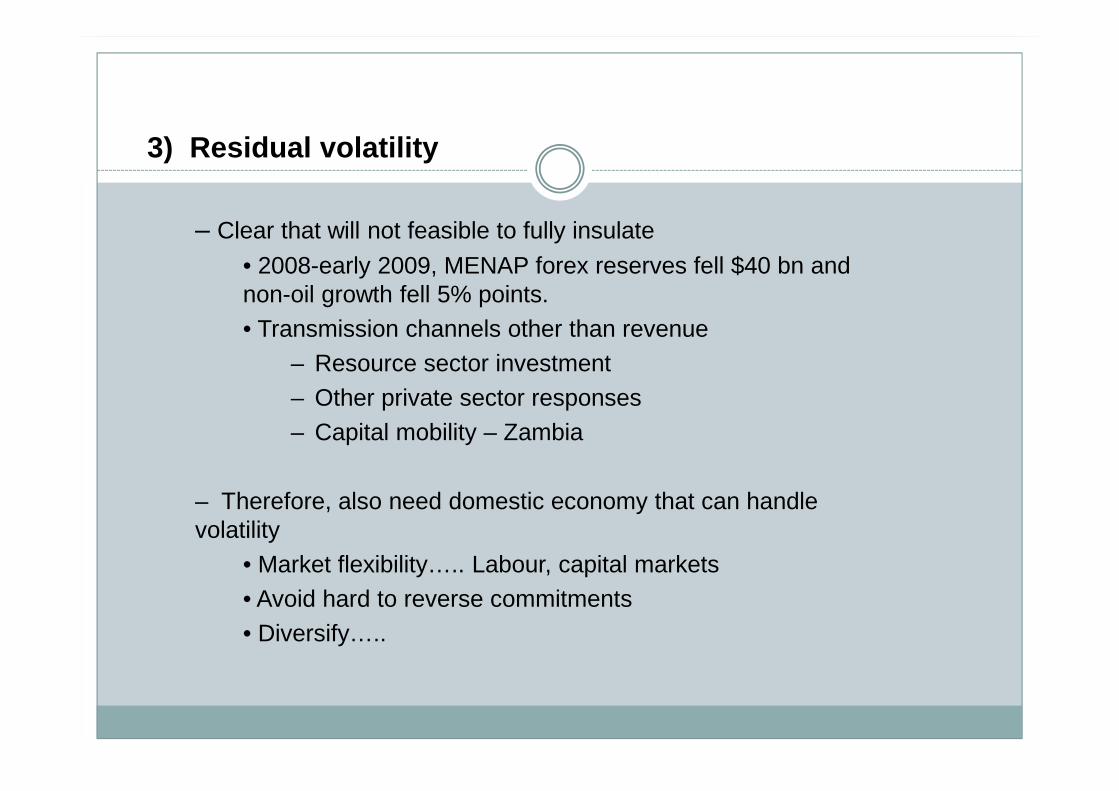
3) Residual volatility
– Clear that will not feasible to fully insulate
• 2008-early 2009, MENAP forex reserves fell $40 bn and non-oil growth fell 5% points.• Transmission channels other than revenue
– Resource sector investment– Other private sector responses– Capital mobility – Zambia
– Therefore, also need domestic economy that can handle volatility
• Market flexibility….. Labour, capital markets• Avoid hard to reverse commitments• Diversify…..