Embed Size (px)
Citation preview
Gas Processing Journal
Vol. 6, No. 1, 2018, pp. 1-20
http://gpj.ui.ac.ir
DOI: http://dx.doi.org/10.22108/gpj.2018.111048.1028
___________________________________________
*Corresponding Author.
Authors’ Email Address: 1 M. Jafari ([email protected]),
2 S. Ashtab ([email protected]),
3 A. Behroozsarand ([email protected]),
4 K. Ghasemzadeh ([email protected]),
5 D. A. Wood ([email protected])
ISSN (Online): 2345-4172, ISSN (Print): 2322-3251 © 2018 University of Isfahan. All rights reserved
Plant-wide Simulation of an Integrated Zero-Emission Process to
Convert Flare Gas to Gasoline
Mostafa Jafari 1, Sadaf Ashtab 2, Alireza Behroozsarand 3, Kamran Ghasemzadeh 4
and David A. Wood 5*
1,2,3,4 Faculty of Chemical Engineering, Urmia University of Technology, Urmia, Iran 5 DWA Energy Limited, Lincoln, LN5 9JP United Kingdom
Received: 2018-05-18 Revised: 2018-05-28 Accepted: 2018-06-09
Abstract: The Gas to Gasoline (GTG) process includes conversion of natural, flare, and
associated gas into synthetic fuels that can be compositionally upgraded and adjusted into
different useful hydrocarbon fuels including gasoline, liquid petroleum gas (LPG), and fuel
gas. Commonly, the GTG process involves three stages: 1) Synthesis gas (syngas) production
unit 2) Methanol production unit 3) Methanol to Gasoline production unit (MTG). In this
study, an integrated Flare Gas to Gasoline (FGTG) process for converting flare gas to gasoline,
LPG and fuel gas is simulated using the Aspen HYSYS v. 8.8 simulator. The steam methane
reforming (SMR) unit, the syngas to methanol unit, and the MTG unit are configured for
simulation as an integrated FGTG process. In order to reduce carbon dioxide gas emissions to
the atmosphere, a novel closed arrangement for the FGTG process (recycling configuration) is
described and simulated. The simulation results demonstrate that by recycling all gas
emissions, such as flare and off gas from the methanol and MTG units back into the process
cycle, gasoline and LPG productivity can be increased on average by about 53% and 10%,
respectively, compared to a base FGTG configuration that does not involve such recycling. The
integrated simulation is supported by sensitivity analysis based on FGTG plants of various
natural gas capacities (from 70,000 to 130,000 lb./hr.) as the adjustable (independent) variable
and gasoline, LPG, and fuel gas selectivity as the dependent variables. Results of the
simulation cases reveal that the total productivity of the integrated FGTG process could be
increased in terms of flare gas mass flow, with the selectivity of products remaining
approximately fixed for different plant capacities (i.e., at 75% for the gasoline product).
Moreover, the utilities and energy consumption of the FGTG process is compared for several
sensitivity cases. The results reveal that by increasing the capacity of the gas feed (natural gas
mass flow) the Energy Index (i.e., total utilities consumption to product flow rate) decreased
by about 8% and 47% in the base and recycling configurations, respectively. This finding
suggests that an FGTG plant becomes more energy efficient at in higher-capacity plants.
Keywords: Flare gas utilization; process simulation; membrane applications; energy index;
flare gas to gasoline (FGTG); energy and emissions efficiency
1. Introduction
Humans need energy to power our technology
and to broaden and improve quality of life
(Fawole, Cai, & MacKenzie, 2016). Natural gas
will continue over coming decades to provide
an essential component of the global primary
energy mix providing economic growth in
many developing and developed countries
(Tabak, Chitnis, McGihon, & Zhao, 2009).
Until now, there are primarily two
commercially viable methods for converting
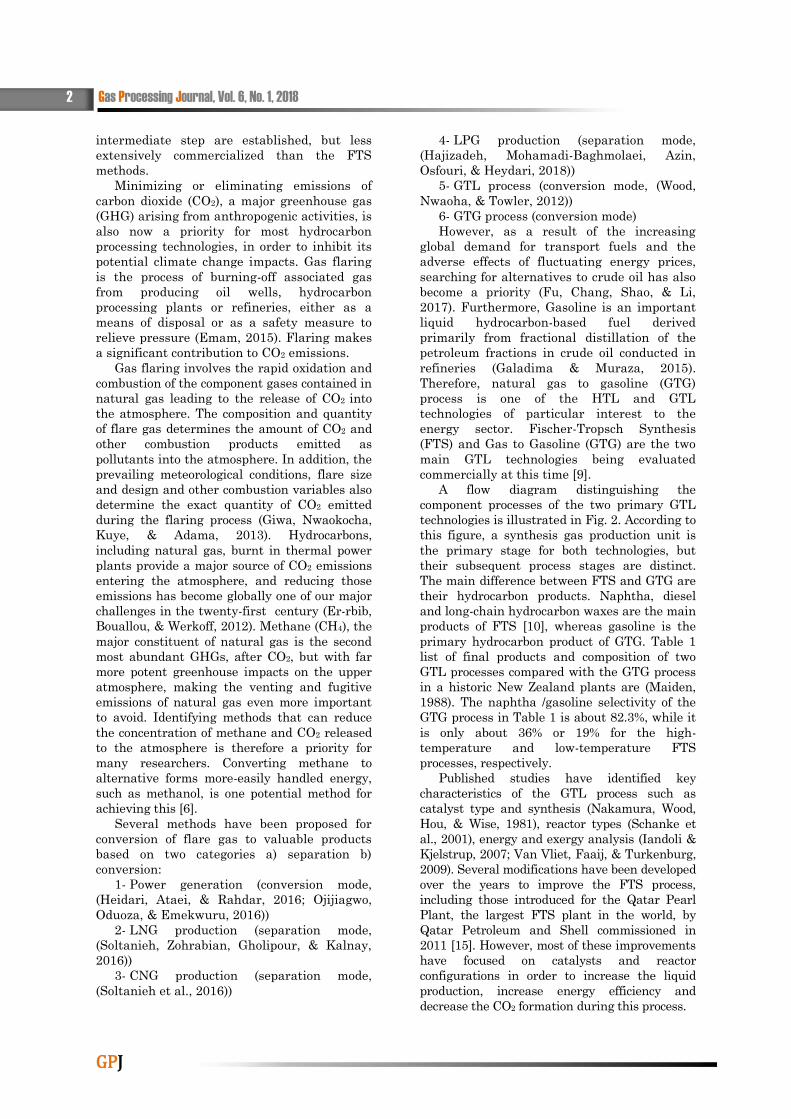
natural gas into liquid fuels (GTL) through
intermediate gasification processes (Fig. 1).
These are: 1) Fischer-Tropsch Synthesis (FTS),
discovered in Germany in the 1920’s using coal
as feedstock. FTS can produce a range of
valuable hydrocarbon liquids and waxes from
various hydrocarbon feedstock (e.g., coal,
natural gas or biomass) using different
catalysts and pressure-temperature condition.
2) Hydrocarbon conversion to gasoline (HTG)
processes with methanol production as an
2 Gas Processing Journal, Vol. 6, No. 1, 2018
GPJ
intermediate step are established, but less
extensively commercialized than the FTS
methods.
Minimizing or eliminating emissions of
carbon dioxide (CO2), a major greenhouse gas
(GHG) arising from anthropogenic activities, is
also now a priority for most hydrocarbon
processing technologies, in order to inhibit its
potential climate change impacts. Gas flaring
is the process of burning-off associated gas
from producing oil wells, hydrocarbon
processing plants or refineries, either as a
means of disposal or as a safety measure to
relieve pressure (Emam, 2015). Flaring makes
a significant contribution to CO2 emissions.
Gas flaring involves the rapid oxidation and
combustion of the component gases contained in
natural gas leading to the release of CO2 into
the atmosphere. The composition and quantity
of flare gas determines the amount of CO2 and
other combustion products emitted as
pollutants into the atmosphere. In addition, the
prevailing meteorological conditions, flare size
and design and other combustion variables also
determine the exact quantity of CO2 emitted
during the flaring process (Giwa, Nwaokocha,
Kuye, & Adama, 2013). Hydrocarbons,
including natural gas, burnt in thermal power
plants provide a major source of CO2 emissions
entering the atmosphere, and reducing those
emissions has become globally one of our major
challenges in the twenty-first century (Er-rbib,
Bouallou, & Werkoff, 2012). Methane (CH4), the
major constituent of natural gas is the second
most abundant GHGs, after CO2, but with far
more potent greenhouse impacts on the upper
atmosphere, making the venting and fugitive
emissions of natural gas even more important
to avoid. Identifying methods that can reduce
the concentration of methane and CO2 released
to the atmosphere is therefore a priority for
many researchers. Converting methane to
alternative forms more-easily handled energy,
such as methanol, is one potential method for
achieving this [6].
Several methods have been proposed for
conversion of flare gas to valuable products
based on two categories a) separation b)
conversion:
1- Power generation (conversion mode,
(Heidari, Ataei, & Rahdar, 2016; Ojijiagwo,
Oduoza, & Emekwuru, 2016))
2- LNG production (separation mode,
(Soltanieh, Zohrabian, Gholipour, & Kalnay,
2016))
3- CNG production (separation mode,
(Soltanieh et al., 2016))
4- LPG production (separation mode,
(Hajizadeh, Mohamadi-Baghmolaei, Azin,
Osfouri, & Heydari, 2018))
5- GTL process (conversion mode, (Wood,
Nwaoha, & Towler, 2012))
6- GTG process (conversion mode)
However, as a result of the increasing
global demand for transport fuels and the
adverse effects of fluctuating energy prices,
searching for alternatives to crude oil has also
become a priority (Fu, Chang, Shao, & Li,
2017). Furthermore, Gasoline is an important
liquid hydrocarbon-based fuel derived
primarily from fractional distillation of the
petroleum fractions in crude oil conducted in
refineries (Galadima & Muraza, 2015).
Therefore, natural gas to gasoline (GTG)
process is one of the HTL and GTL
technologies of particular interest to the
energy sector. Fischer-Tropsch Synthesis
(FTS) and Gas to Gasoline (GTG) are the two
main GTL technologies being evaluated
commercially at this time [9].
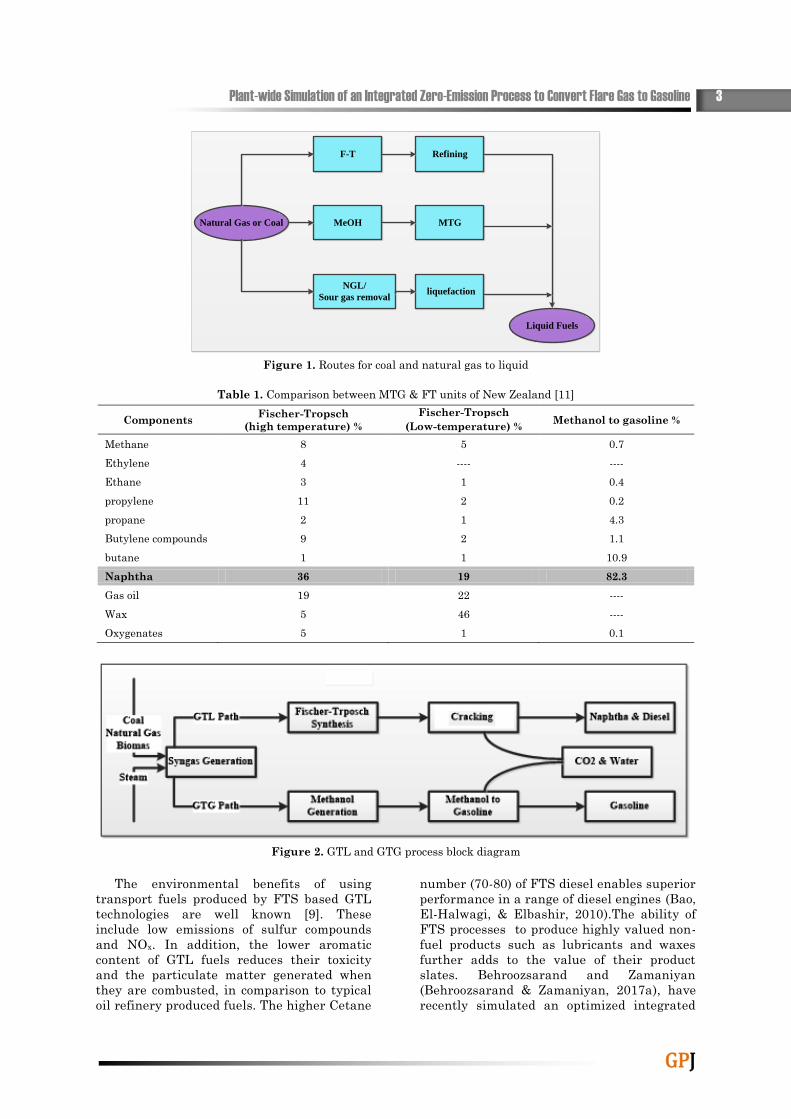
A flow diagram distinguishing the
component processes of the two primary GTL
technologies is illustrated in Fig. 2. According to
this figure, a synthesis gas production unit is
the primary stage for both technologies, but
their subsequent process stages are distinct.
The main difference between FTS and GTG are
their hydrocarbon products. Naphtha, diesel
and long-chain hydrocarbon waxes are the main
products of FTS [10], whereas gasoline is the
primary hydrocarbon product of GTG. Table 1
list of final products and composition of two
GTL processes compared with the GTG process
in a historic New Zealand plants are (Maiden,
1988). The naphtha /gasoline selectivity of the
GTG process in Table 1 is about 82.3%, while it
is only about 36% or 19% for the high-
temperature and low-temperature FTS
processes, respectively.
Published studies have identified key
characteristics of the GTL process such as
catalyst type and synthesis (Nakamura, Wood,
Hou, & Wise, 1981), reactor types (Schanke et
al., 2001), energy and exergy analysis (Iandoli &
Kjelstrup, 2007; Van Vliet, Faaij, & Turkenburg,
2009). Several modifications have been developed
over the years to improve the FTS process,
including those introduced for the Qatar Pearl
Plant, the largest FTS plant in the world, by
Qatar Petroleum and Shell commissioned in
2011 [15]. However, most of these improvements
have focused on catalysts and reactor
configurations in order to increase the liquid
production, increase energy efficiency and
decrease the CO2 formation during this process.
Plant-wide Simulation of an Integrated Zero-Emission Process to Convert Flare Gas to Gasoline 3
GPJ
F-T Refining
MeOH MTG
NGL/
Sour gas removal liquefaction
Natural Gas or Coal
Liquid Fuels
Figure 1. Routes for coal and natural gas to liquid
Table 1. Comparison between MTG & FT units of New Zealand [11]
Components Fischer-Tropsch
(high temperature) %
Fischer-Tropsch
(Low-temperature) % Methanol to gasoline %
Methane 8 5 0.7
Ethylene 4 ---- ----
Ethane 3 1 0.4
propylene 11 2 0.2
propane 2 1 4.3
Butylene compounds 9 2 1.1
butane 1 1 10.9
Naphtha 36 19 82.3
Gas oil 19 22 ----
Wax 5 46 ----
Oxygenates 5 1 0.1
Figure 2. GTL and GTG process block diagram
The environmental benefits of using
transport fuels produced by FTS based GTL
technologies are well known [9]. These
include low emissions of sulfur compounds
and NOx. In addition, the lower aromatic
content of GTL fuels reduces their toxicity
and the particulate matter generated when
they are combusted, in comparison to typical
oil refinery produced fuels. The higher Cetane
number (70-80) of FTS diesel enables superior
performance in a range of diesel engines (Bao,
El-Halwagi, & Elbashir, 2010).The ability of
FTS processes to produce highly valued non-
fuel products such as lubricants and waxes
further adds to the value of their product
slates. Behroozsarand and Zamaniyan
(Behroozsarand & Zamaniyan, 2017a), have
recently simulated an optimized integrated
4 Gas Processing Journal, Vol. 6, No. 1 2018
GPJ
GTL process for converting of flare gas to
valuable hydrocarbons such as gasoline and
diesel. This study builds upon that work.
It is clear from Fig.2 that there are
similarities between the early steps in the
FTS and GTG processes; both require
synthesis gas production. Moreover, the
methanol production process from synthesis
gas is a well-established commercial
technology with multiple technology
suppliers. Therefore, the key distinctive
production technology stage in the GTG
process is the methanol to gasoline (MTG)
stage. Three companies are the main patent
holders of the MTG process:
1) ExxonMobil, USA
2) Holder Topsoe, Denmark
3) Primus Green Energy (syngas to
gasoline STG+) for small-scale applications
In this study, an integrated FGTG process
for converting flare gas to gasoline, LPG and
fuel gas is simulated using the Aspen HYSYS
v. 8.8 simulator. The steam methane reforming
(SMR) unit, the syngas to methanol unit, and
the MTG unit are configured for simulation as
an integrated FGTG process. In order to
reduce carbon dioxide gas emissions to the
atmosphere, a novel closed arrangement for
the FGTG process (recycling configuration) is
described and simulated. Several researchers
have been reported in that Aspen HYSYS is
employed for simulation of different processes.
Ghorbani and et al. (Hamedi,
Shirmohammadi, Ghorbani, & Sheikhi, 2015)
used Aspen HYSYS software for Advanced
Exergy Evaluation of an Integrated Separation
Process with Optimized Refrigeration System.
Also, Ghorbani and et al. in other work
(Ghorbani, Hamedi, & Amidpour, 2016)
utilized this software for exergoeconomic
evaluation of an integrated nitrogen rejection
unit with LNG and NGL co-production
processes based on the MFC and absorption
refrigeration systems. Shariati Niasar and et
al. (Shariati Niasar et al., 2017) have been
used Aspen HYSYS and plus for simulation of
ammonia water cycle in proposing of
superstructure of cogeneration of power,
heating, cooling and liquid fuels using
gasification of feedstock with primary material
of coal for employing in LNG process.
2. Process Description of GTG
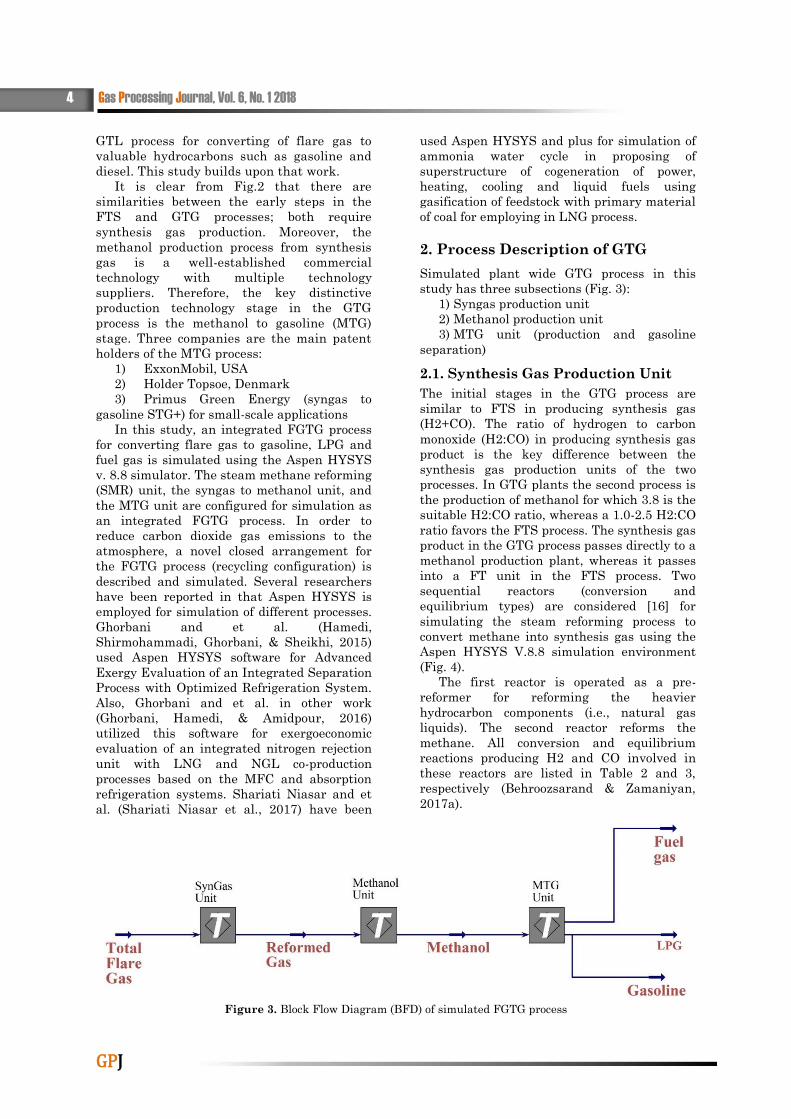
Simulated plant wide GTG process in this
study has three subsections (Fig. 3):
1) Syngas production unit
2) Methanol production unit
3) MTG unit (production and gasoline
separation)
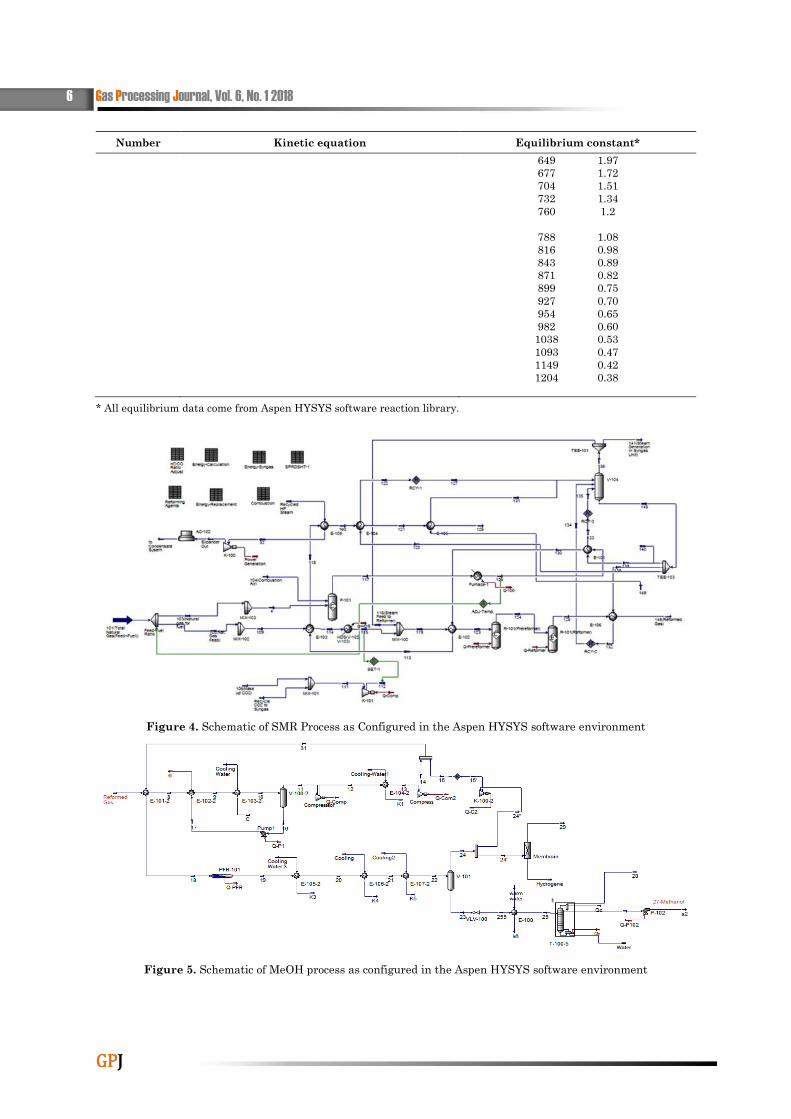
2.1. Synthesis Gas Production Unit
The initial stages in the GTG process are
similar to FTS in producing synthesis gas
(H2+CO). The ratio of hydrogen to carbon
monoxide (H2:CO) in producing synthesis gas
product is the key difference between the
synthesis gas production units of the two
processes. In GTG plants the second process is
the production of methanol for which 3.8 is the
suitable H2:CO ratio, whereas a 1.0-2.5 H2:CO
ratio favors the FTS process. The synthesis gas
product in the GTG process passes directly to a
methanol production plant, whereas it passes
into a FT unit in the FTS process. Two
sequential reactors (conversion and
equilibrium types) are considered [16] for
simulating the steam reforming process to
convert methane into synthesis gas using the
Aspen HYSYS V.8.8 simulation environment
(Fig. 4).
The first reactor is operated as a pre-
reformer for reforming the heavier
hydrocarbon components (i.e., natural gas
liquids). The second reactor reforms the
methane. All conversion and equilibrium
reactions producing H2 and CO involved in
these reactors are listed in Table 2 and 3,
respectively (Behroozsarand & Zamaniyan,
2017a).
Figure 3. Block Flow Diagram (BFD) of simulated FGTG process
Plant-wide Simulation of an Integrated Zero-Emission Process to Convert Flare Gas to Gasoline 5
GPJ
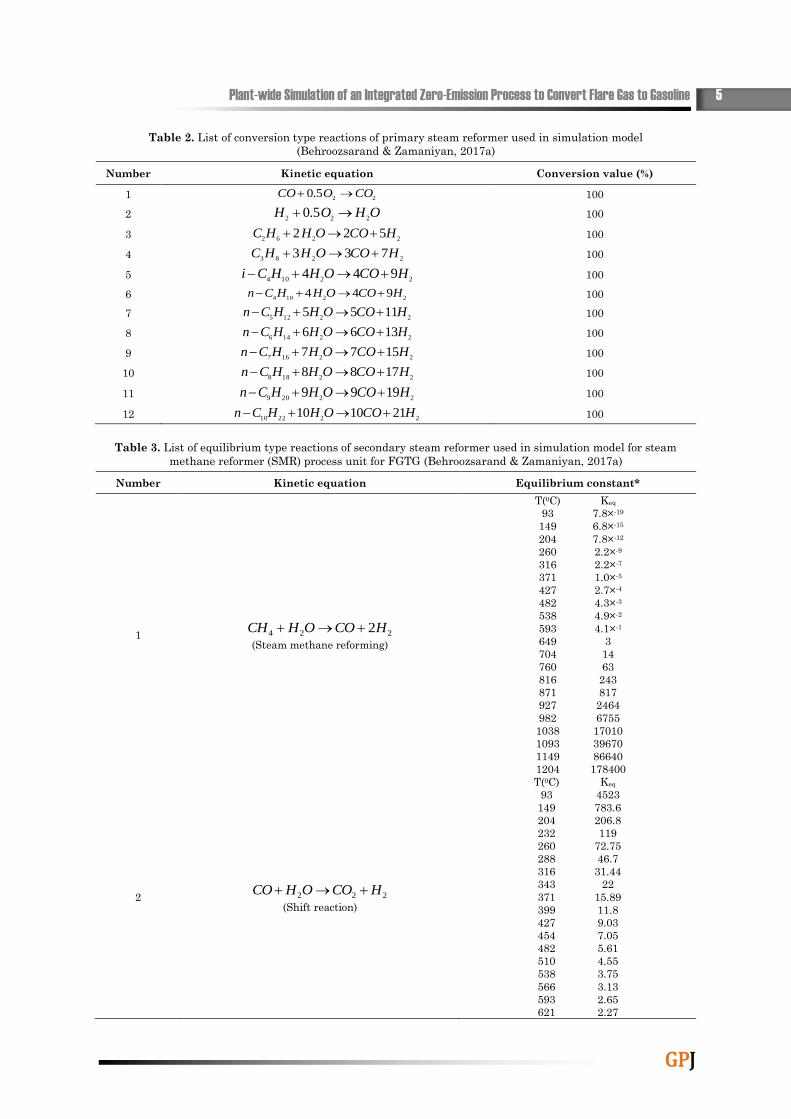
Table 2. List of conversion type reactions of primary steam reformer used in simulation model
(Behroozsarand & Zamaniyan, 2017a)
Number Kinetic equation Conversion value (%)
1 225.0 COOCO
100
2 OHOH222
5.0
100
3 2262522 HCOOHHC
100
4 2283733 HCOOHHC
100
5 22104944 HCOOHHCi
100
6 22104944 HCOOHHCn
100
7 221251155 HCOOHHCn
100
8 221461366 HCOOHHCn
100
9 221671577 HCOOHHCn
100
10 221881788 HCOOHHCn
100
11 222091999 HCOOHHCn
100
12 222210211010 HCOOHHCn
100
Table 3. List of equilibrium type reactions of secondary steam reformer used in simulation model for steam
methane reformer (SMR) process unit for FGTG (Behroozsarand & Zamaniyan, 2017a)
Number Kinetic equation Equilibrium constant*
1 224 2HCOOHCH
(Steam methane reforming)
T(0C) Keq
93 7.8×-19
149 6.8×-15
204 7.8×-12
260 2.2×-9
316 2.2×-7
371 1.0×-5
427 2.7×-4
482 4.3×-3
538 4.9×-2
593 4.1×-1
649 3
704 14
760 63
816 243
871 817
927 2464
982 6755
1038 17010
1093 39670
1149 86640
1204 178400
2 222 HCOOHCO
(Shift reaction)
T(0C) Keq
93 4523
149 783.6
204 206.8
232 119
260 72.75
288 46.7
316 31.44
343 22
371 15.89
399 11.8
427 9.03
454 7.05
482 5.61
510 4.55
538 3.75
566 3.13
593 2.65
621 2.27
6 Gas Processing Journal, Vol. 6, No. 1 2018
GPJ
Number Kinetic equation Equilibrium constant*
649 1.97
677 1.72
704 1.51
732 1.34
760 1.2
788 1.08
816 0.98
843 0.89
871 0.82
899 0.75
927 0.70
954 0.65
982 0.60
1038 0.53
1093 0.47
1149 0.42
1204 0.38
* All equilibrium data come from Aspen HYSYS software reaction library.
Figure 4. Schematic of SMR Process as Configured in the Aspen HYSYS software environment
Figure 5. Schematic of MeOH process as configured in the Aspen HYSYS software environment
Plant-wide Simulation of an Integrated Zero-Emission Process to Convert Flare Gas to Gasoline 7
GPJ
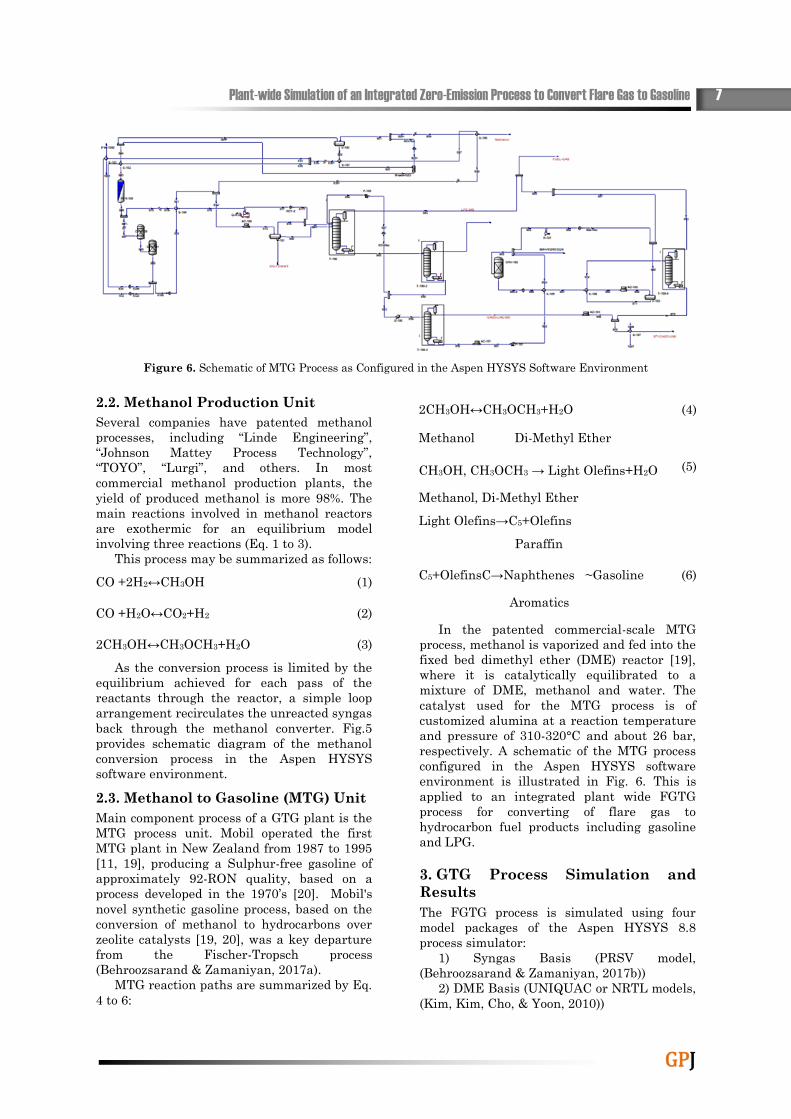
Figure 6. Schematic of MTG Process as Configured in the Aspen HYSYS Software Environment
2.2. Methanol Production Unit
Several companies have patented methanol
processes, including “Linde Engineering”,
“Johnson Mattey Process Technology”,
“TOYO”, “Lurgi”, and others. In most
commercial methanol production plants, the
yield of produced methanol is more 98%. The
main reactions involved in methanol reactors
are exothermic for an equilibrium model
involving three reactions (Eq. 1 to 3).
This process may be summarized as follows:
CO +2H2↔CH3OH (1)
CO +H2O↔CO2+H2 (2)
2CH3OH↔CH3OCH3+H2O (3)
As the conversion process is limited by the
equilibrium achieved for each pass of the
reactants through the reactor, a simple loop
arrangement recirculates the unreacted syngas
back through the methanol converter. Fig.5
provides schematic diagram of the methanol
conversion process in the Aspen HYSYS
software environment.
2.3. Methanol to Gasoline (MTG) Unit
Main component process of a GTG plant is the
MTG process unit. Mobil operated the first
MTG plant in New Zealand from 1987 to 1995
[11, 19], producing a Sulphur-free gasoline of
approximately 92-RON quality, based on a
process developed in the 1970’s [20]. Mobil's
novel synthetic gasoline process, based on the
conversion of methanol to hydrocarbons over
zeolite catalysts [19, 20], was a key departure
from the Fischer-Tropsch process
(Behroozsarand & Zamaniyan, 2017a).
MTG reaction paths are summarized by Eq.
4 to 6:
2CH3OH↔CH3OCH3+H2O (4)
Methanol Di-Methyl Ether
CH3OH, CH3OCH3 → Light Olefins+H2O (5)
Methanol, Di-Methyl Ether
Light Olefins→C5+Olefins
Paraffin
C5+OlefinsC→Naphthenes ~Gasoline (6)
Aromatics
In the patented commercial-scale MTG
process, methanol is vaporized and fed into the
fixed bed dimethyl ether (DME) reactor [19],
where it is catalytically equilibrated to a
mixture of DME, methanol and water. The
catalyst used for the MTG process is of
customized alumina at a reaction temperature
and pressure of 310-320°C and about 26 bar,
respectively. A schematic of the MTG process
configured in the Aspen HYSYS software
environment is illustrated in Fig. 6. This is
applied to an integrated plant wide FGTG
process for converting of flare gas to
hydrocarbon fuel products including gasoline
and LPG.
3. GTG Process Simulation and
Results
The FGTG process is simulated using four
model packages of the Aspen HYSYS 8.8
process simulator:
1) Syngas Basis (PRSV model,
(Behroozsarand & Zamaniyan, 2017b))
2) DME Basis (UNIQUAC or NRTL models,
(Kim, Kim, Cho, & Yoon, 2010))
8 Gas Processing Journal, Vol. 6, No. 1 2018
GPJ
3) Methanol Basis (PRSV, (Van-Dal &
Bouallou, 2013))
4) MTG Basis (Peng-Robinson, (Kim et al.,
2010))
Models 1, 2, 3, and 4 include of 104, 58, 9,
and 58 components, respectively. Figs. 3, 4, 5,
and 6 provide process flow diagrams of the
simulated FGTG process in Aspen HYSYS v.
8.8 software.
Fig. 4, illustrates how the primary flare gas
is separated into two flow streams:
a) Gas for steam methane reforming (SMR)
feed
b) Gas for fuel gas to the furnace burners.
The ratio a: b is about 64:36. This ratio
confirms that more than one-third of the flare
input gas is consumed as fuel for the furnace
burners in the SMR process. The H2/CO ratio
of 3.8 is the main specification of synthesis gas
(syngas) product. However, there are three
outlet streams from the SMR unit:
1) Reformed gas (syngas)
2) High pressure steam (HPS)
3) Separated sour water
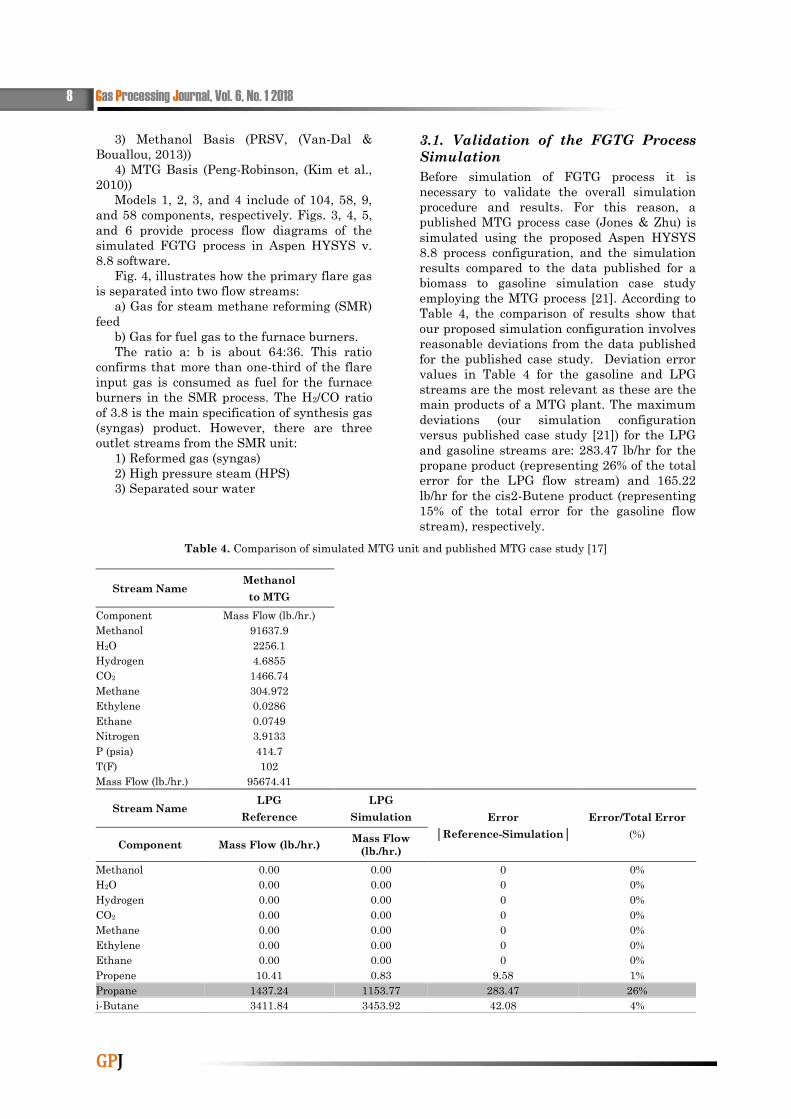
3.1. Validation of the FGTG Process
Simulation
Before simulation of FGTG process it is
necessary to validate the overall simulation
procedure and results. For this reason, a
published MTG process case (Jones & Zhu) is
simulated using the proposed Aspen HYSYS
8.8 process configuration, and the simulation
results compared to the data published for a
biomass to gasoline simulation case study
employing the MTG process [21]. According to
Table 4, the comparison of results show that
our proposed simulation configuration involves
reasonable deviations from the data published
for the published case study. Deviation error
values in Table 4 for the gasoline and LPG
streams are the most relevant as these are the
main products of a MTG plant. The maximum
deviations (our simulation configuration
versus published case study [21]) for the LPG
and gasoline streams are: 283.47 lb/hr for the
propane product (representing 26% of the total
error for the LPG flow stream) and 165.22
lb/hr for the cis2-Butene product (representing
15% of the total error for the gasoline flow
stream), respectively.
Table 4. Comparison of simulated MTG unit and published MTG case study [17]
Stream Name Methanol
to MTG
Component Mass Flow (lb./hr.)
Methanol 91637.9
H2O 2256.1
Hydrogen 4.6855
CO2 1466.74
Methane 304.972
Ethylene 0.0286
Ethane 0.0749
Nitrogen 3.9133
P (psia) 414.7
T(F) 102
Mass Flow (lb./hr.) 95674.41
Stream Name LPG
Reference
LPG
Simulation Error
│Reference-Simulation│
Error/Total Error
(%) Component Mass Flow (lb./hr.)
Mass Flow
(lb./hr.)
Methanol 0.00 0.00 0 0%
H2O 0.00 0.00 0 0%
Hydrogen 0.00 0.00 0 0%
CO2 0.00 0.00 0 0%
Methane 0.00 0.00 0 0%
Ethylene 0.00 0.00 0 0%
Ethane 0.00 0.00 0 0%
Propene 10.41 0.83 9.58 1%
Propane 1437.24 1153.77 283.47 26%
i-Butane 3411.84 3453.92 42.08 4%
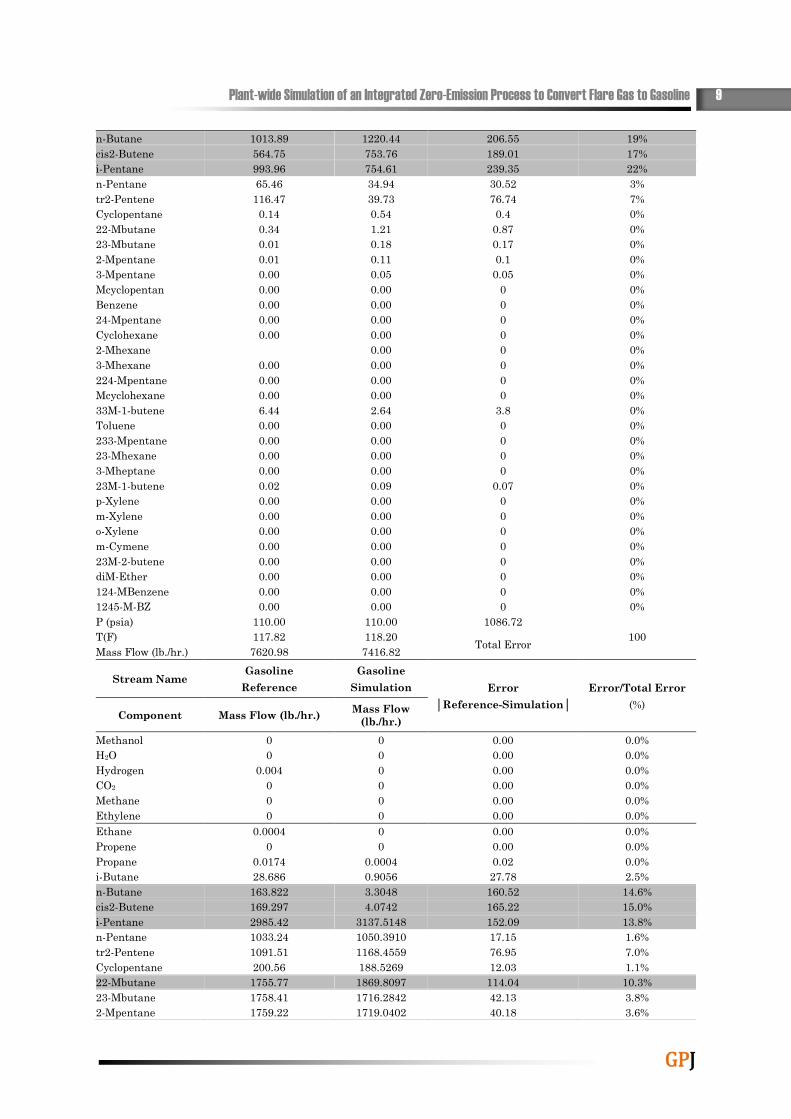
Plant-wide Simulation of an Integrated Zero-Emission Process to Convert Flare Gas to Gasoline 9
GPJ
n-Butane 1013.89 1220.44 206.55 19%
cis2-Butene 564.75 753.76 189.01 17%
i-Pentane 993.96 754.61 239.35 22%
n-Pentane 65.46 34.94 30.52 3%
tr2-Pentene 116.47 39.73 76.74 7%
Cyclopentane 0.14 0.54 0.4 0%
22-Mbutane 0.34 1.21 0.87 0%
23-Mbutane 0.01 0.18 0.17 0%
2-Mpentane 0.01 0.11 0.1 0%
3-Mpentane 0.00 0.05 0.05 0%
Mcyclopentan 0.00 0.00 0 0%
Benzene 0.00 0.00 0 0%
24-Mpentane 0.00 0.00 0 0%
Cyclohexane 0.00 0.00 0 0%
2-Mhexane 0.00 0 0%
3-Mhexane 0.00 0.00 0 0%
224-Mpentane 0.00 0.00 0 0%
Mcyclohexane 0.00 0.00 0 0%
33M-1-butene 6.44 2.64 3.8 0%
Toluene 0.00 0.00 0 0%
233-Mpentane 0.00 0.00 0 0%
23-Mhexane 0.00 0.00 0 0%
3-Mheptane 0.00 0.00 0 0%
23M-1-butene 0.02 0.09 0.07 0%
p-Xylene 0.00 0.00 0 0%
m-Xylene 0.00 0.00 0 0%
o-Xylene 0.00 0.00 0 0%
m-Cymene 0.00 0.00 0 0%
23M-2-butene 0.00 0.00 0 0%
diM-Ether 0.00 0.00 0 0%
124-MBenzene 0.00 0.00 0 0%
1245-M-BZ 0.00 0.00 0 0%
P (psia) 110.00 110.00 1086.72
100 T(F) 117.82 118.20 Total Error
Mass Flow (lb./hr.) 7620.98 7416.82
Stream Name Gasoline
Reference
Gasoline
Simulation Error
│Reference-Simulation│
Error/Total Error
(%) Component Mass Flow (lb./hr.)
Mass Flow
(lb./hr.)
Methanol 0 0 0.00 0.0%
H2O 0 0 0.00 0.0%
Hydrogen 0.004 0 0.00 0.0%
CO2 0 0 0.00 0.0%
Methane 0 0 0.00 0.0%
Ethylene 0 0 0.00 0.0%
Ethane 0.0004 0 0.00 0.0%
Propene 0 0 0.00 0.0%
Propane 0.0174 0.0004 0.02 0.0%
i-Butane 28.686 0.9056 27.78 2.5%
n-Butane 163.822 3.3048 160.52 14.6%
cis2-Butene 169.297 4.0742 165.22 15.0%
i-Pentane 2985.42 3137.5148 152.09 13.8%
n-Pentane 1033.24 1050.3910 17.15 1.6%
tr2-Pentene 1091.51 1168.4559 76.95 7.0%
Cyclopentane 200.56 188.5269 12.03 1.1%
22-Mbutane 1755.77 1869.8097 114.04 10.3%
23-Mbutane 1758.41 1716.2842 42.13 3.8%
2-Mpentane 1759.22 1719.0402 40.18 3.6%
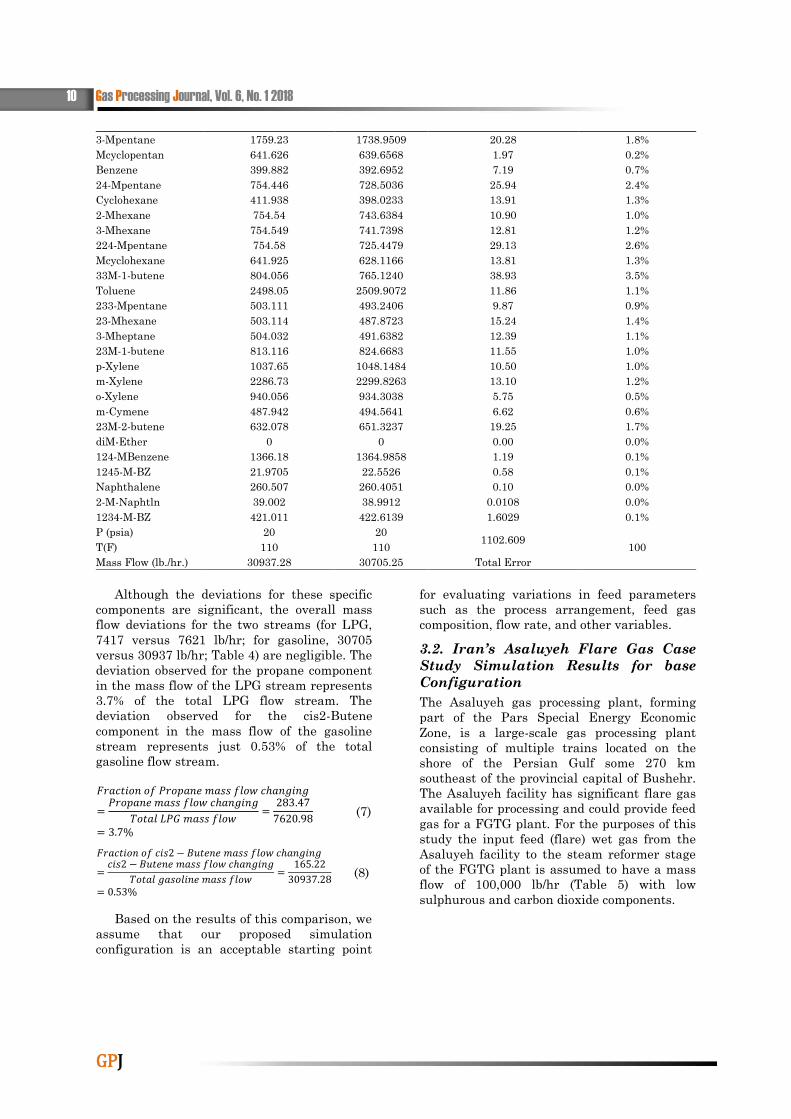
10 Gas Processing Journal, Vol. 6, No. 1 2018
GPJ
Although the deviations for these specific
components are significant, the overall mass
flow deviations for the two streams (for LPG,
7417 versus 7621 lb/hr; for gasoline, 30705
versus 30937 lb/hr; Table 4) are negligible. The
deviation observed for the propane component
in the mass flow of the LPG stream represents
3.7% of the total LPG flow stream. The
deviation observed for the cis2-Butene
component in the mass flow of the gasoline
stream represents just 0.53% of the total
gasoline flow stream.
(7)
(8)
Based on the results of this comparison, we
assume that our proposed simulation
configuration is an acceptable starting point
for evaluating variations in feed parameters
such as the process arrangement, feed gas
composition, flow rate, and other variables.
3.2. Iran’s Asaluyeh Flare Gas Case
Study Simulation Results for base
Configuration
The Asaluyeh gas processing plant, forming
part of the Pars Special Energy Economic
Zone, is a large-scale gas processing plant
consisting of multiple trains located on the
shore of the Persian Gulf some 270 km
southeast of the provincial capital of Bushehr.
The Asaluyeh facility has significant flare gas
available for processing and could provide feed
gas for a FGTG plant. For the purposes of this
study the input feed (flare) wet gas from the
Asaluyeh facility to the steam reformer stage
of the FGTG plant is assumed to have a mass
flow of 100,000 lb/hr (Table 5) with low
sulphurous and carbon dioxide components.
3-Mpentane 1759.23 1738.9509 20.28 1.8%
Mcyclopentan 641.626 639.6568 1.97 0.2%
Benzene 399.882 392.6952 7.19 0.7%
24-Mpentane 754.446 728.5036 25.94 2.4%
Cyclohexane 411.938 398.0233 13.91 1.3%
2-Mhexane 754.54 743.6384 10.90 1.0%
3-Mhexane 754.549 741.7398 12.81 1.2%
224-Mpentane 754.58 725.4479 29.13 2.6%
Mcyclohexane 641.925 628.1166 13.81 1.3%
33M-1-butene 804.056 765.1240 38.93 3.5%
Toluene 2498.05 2509.9072 11.86 1.1%
233-Mpentane 503.111 493.2406 9.87 0.9%
23-Mhexane 503.114 487.8723 15.24 1.4%
3-Mheptane 504.032 491.6382 12.39 1.1%
23M-1-butene 813.116 824.6683 11.55 1.0%
p-Xylene 1037.65 1048.1484 10.50 1.0%
m-Xylene 2286.73 2299.8263 13.10 1.2%
o-Xylene 940.056 934.3038 5.75 0.5%
m-Cymene 487.942 494.5641 6.62 0.6%
23M-2-butene 632.078 651.3237 19.25 1.7%
diM-Ether 0 0 0.00 0.0%
124-MBenzene 1366.18 1364.9858 1.19 0.1%
1245-M-BZ 21.9705 22.5526 0.58 0.1%
Naphthalene 260.507 260.4051 0.10 0.0%
2-M-Naphtln 39.002 38.9912 0.0108 0.0%
1234-M-BZ 421.011 422.6139 1.6029 0.1%
P (psia) 20 20 1102.609
100 T(F) 110 110
Mass Flow (lb./hr.) 30937.28 30705.25 Total Error
Plant-wide Simulation of an Integrated Zero-Emission Process to Convert Flare Gas to Gasoline 11
GPJ
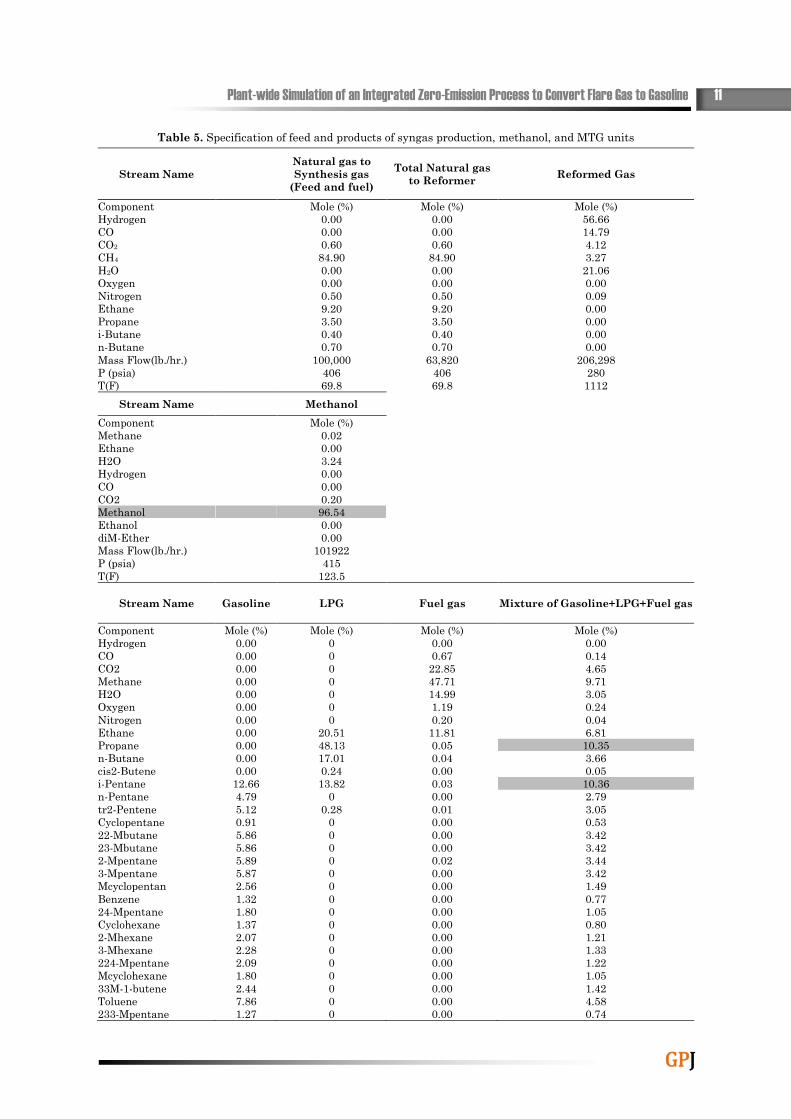
Table 5. Specification of feed and products of syngas production, methanol, and MTG units
Stream Name
Natural gas to
Synthesis gas
(Feed and fuel)
Total Natural gas
to Reformer Reformed Gas
Component Mole (%) Mole (%) Mole (%)
Hydrogen 0.00 0.00 56.66
CO 0.00 0.00 14.79
CO2 0.60 0.60 4.12
CH4 84.90 84.90 3.27
H2O 0.00 0.00 21.06
Oxygen 0.00 0.00 0.00
Nitrogen 0.50 0.50 0.09
Ethane 9.20 9.20 0.00
Propane 3.50 3.50 0.00
i-Butane 0.40 0.40 0.00
n-Butane 0.70 0.70 0.00
Mass Flow(lb./hr.) 100,000 63,820 206,298
P (psia) 406 406 280
T(F) 69.8 69.8 1112
Stream Name Methanol
Component Mole (%)
Methane 0.02
Ethane 0.00
H2O 3.24
Hydrogen 0.00
CO 0.00
CO2 0.20
Methanol 96.54
Ethanol 0.00
diM-Ether 0.00
Mass Flow(lb./hr.) 101922
P (psia) 415
T(F) 123.5
Stream Name Gasoline LPG Fuel gas Mixture of Gasoline+LPG+Fuel gas
Component Mole (%) Mole (%) Mole (%) Mole (%)
Hydrogen 0.00 0 0.00 0.00
CO 0.00 0 0.67 0.14
CO2 0.00 0 22.85 4.65
Methane 0.00 0 47.71 9.71
H2O 0.00 0 14.99 3.05
Oxygen 0.00 0 1.19 0.24
Nitrogen 0.00 0 0.20 0.04
Ethane 0.00 20.51 11.81 6.81
Propane 0.00 48.13 0.05 10.35
n-Butane 0.00 17.01 0.04 3.66
cis2-Butene 0.00 0.24 0.00 0.05
i-Pentane 12.66 13.82 0.03 10.36
n-Pentane 4.79 0 0.00 2.79
tr2-Pentene 5.12 0.28 0.01 3.05
Cyclopentane 0.91 0 0.00 0.53
22-Mbutane 5.86 0 0.00 3.42
23-Mbutane 5.86 0 0.00 3.42
2-Mpentane 5.89 0 0.02 3.44
3-Mpentane 5.87 0 0.00 3.42
Mcyclopentan 2.56 0 0.00 1.49
Benzene 1.32 0 0.00 0.77
24-Mpentane 1.80 0 0.00 1.05
Cyclohexane 1.37 0 0.00 0.80
2-Mhexane 2.07 0 0.00 1.21
3-Mhexane 2.28 0 0.00 1.33
224-Mpentane 2.09 0 0.00 1.22
Mcyclohexane 1.80 0 0.00 1.05
33M-1-butene 2.44 0 0.00 1.42
Toluene 7.86 0 0.00 4.58
233-Mpentane 1.27 0 0.00 0.74
12 Gas Processing Journal, Vol. 6, No. 1 2018
GPJ
23-Mhexane 1.32 0 0.00 0.77
3-Mheptane 1.32 0 0.00 0.77
23M-1-butene 2.05 0 0.00 1.20
p-Xylene 2.97 0 0.00 1.73
m-Xylene 6.53 0 0.00 3.81
o-Xylene 2.66 0 0.00 1.55
m-Cymene 1.15 0 0.00 0.67
23M-2-butene 3.00 0 0.00 1.75
124-MBenzene 3.52 0 0.00 2.05
Naphthalene 0.60 0 0.00 0.35
1234-M-BZ 0.96 0 0.00 0.56
Mass Flow(lb./hr.) 33357 8433 3845 63141
P (psia) 20 110 100 -
T(F) 112 124 6 -
As shown in Fig. 3, six streams distinct
streams require consideration for the overall
simulation of a GTG plant:
1) Feed gas stream (flare gas to synthesis
gas)
2) Reformed gas from the SMR process as
the syngas unit product
3) Methanol as methanol unit product
4) LPG as MTG unit product
5) Gasoline as MTG unit product
6) Fuel gas as MTG unit product
The main product of the syngas unit is
reformed gas and with mass flow of 206,298 lb.
/hr. (i.e. 63.82% of the feed gas mass flow). The
produced syngas from the SMR unit has
significant quantities of CO2 (about 4 mole %)
and water (about 21 mole %). Table 5 shows
mass balance for the feed gas and products for
the SMR syngas unit of the FGTG process.
Table 5 also indicates that the H2/CO in
reformed syngas is about 3.8, which is suitable
for use in the methanol plant, which, based on
equations 1 to 3, can produce methanol with
purity of 97%. The conversion of the carbon
monoxide component of the syngas in the
methanol unit is given by Eq. (9):
(9)
As the methanol mole fraction in the outlet
products of the MTG unit in the simulation is
zero, it can be concluded that the entire input
methanol to the MTG unit is converted into
final products (gasoline, LPG, and fuel gas in
the proportion 74%; 17%; 8%; Table 5). For
detailed evaluation of methanol conversion to
component-based products, mole fraction of
mixed- product output (Gasoline+LPG+Fuel
gas) is provided in Table 5. Results indicate
that propane and i-pentane have maximum
mole fractions among all the components of
mixed-product output. The mass base
conversion of methanol to these components is
about 7.21% as indicated by applying Eq. (10)
to the data from Table 5.
(10)
3.3. Novel Recycling Configuration of
FGTG Plant with Recycling of all
Emission Gases
In all stages of the FGTG process, two streams
are the main candidates for recycling and
reuse:
1- H2 rich off gas from methanol unit
2- CO2 and H2 rich off gas from MTG unit
Specification of these streams before and
after the membrane section are listed in Table
6.
The off-gas specifications reveal that, CH4,
H2 and CO2 have highest molar composition in
these two streams. On the other hand, the
main objective of the FGTG process is to
maximize gasoline productivity. So, producing
fuel gas for recycling to the syngas unit and
synthesis gas for recycling to the methanol
unit are both potentially attractive options for
maximizing methanol productivity and thereby
obtaining maximum gasoline productivity.
Synthesis gas is a mixture of H2 and CO in
varying proportions. In order to efficiently
produce methanol, the syngas H2:CO ratio
needs to be close to 3.8 when it enters the
methanol unit. Unfortunately, the CO content
of off gas streams is very low. Therefore, the
water-gas-shift (WGS) reaction (Eq. (11)) is
required to promote the conversion of CO2 to
CO.
CO2+H2↔CO+H2O Water-Gas-Shift (WGS)
(11)
Plant-wide Simulation of an Integrated Zero-Emission Process to Convert Flare Gas to Gasoline 13
GPJ
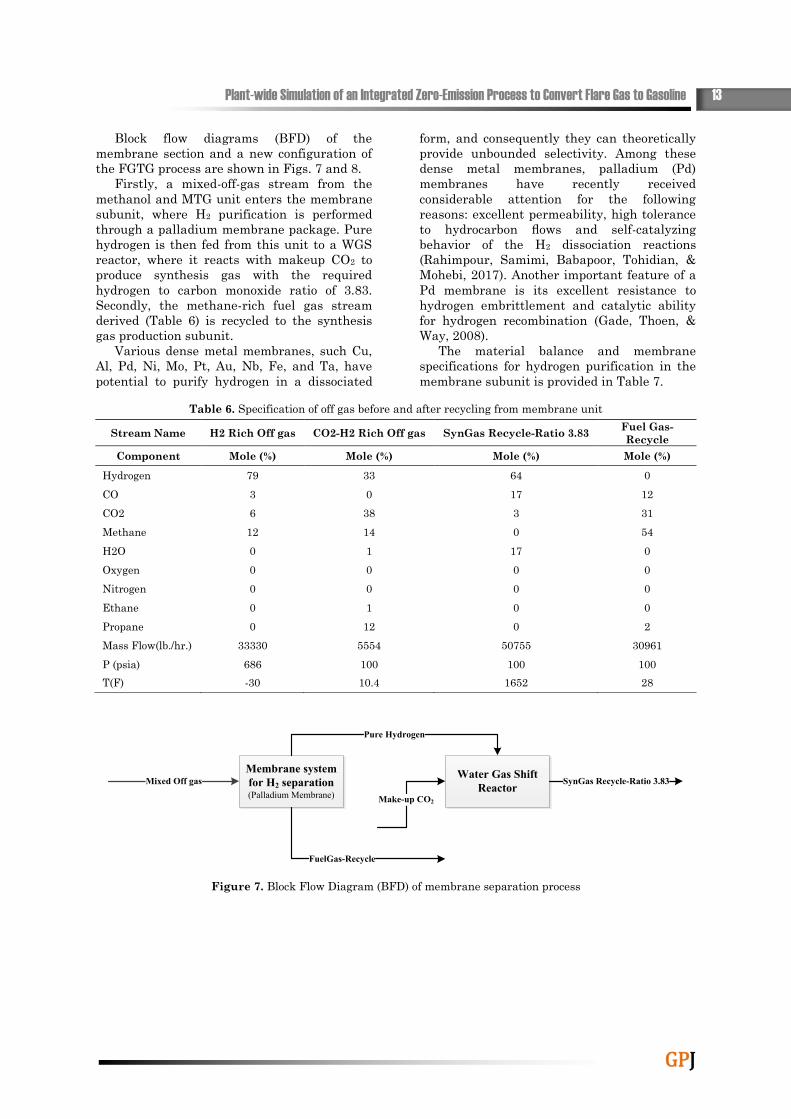
Block flow diagrams (BFD) of the
membrane section and a new configuration of
the FGTG process are shown in Figs. 7 and 8.
Firstly, a mixed-off-gas stream from the
methanol and MTG unit enters the membrane
subunit, where H2 purification is performed
through a palladium membrane package. Pure
hydrogen is then fed from this unit to a WGS
reactor, where it reacts with makeup CO2 to
produce synthesis gas with the required
hydrogen to carbon monoxide ratio of 3.83.
Secondly, the methane-rich fuel gas stream
derived (Table 6) is recycled to the synthesis
gas production subunit.
Various dense metal membranes, such Cu,
Al, Pd, Ni, Mo, Pt, Au, Nb, Fe, and Ta, have
potential to purify hydrogen in a dissociated
form, and consequently they can theoretically
provide unbounded selectivity. Among these
dense metal membranes, palladium (Pd)
membranes have recently received
considerable attention for the following
reasons: excellent permeability, high tolerance
to hydrocarbon flows and self-catalyzing
behavior of the H2 dissociation reactions
(Rahimpour, Samimi, Babapoor, Tohidian, &
Mohebi, 2017). Another important feature of a
Pd membrane is its excellent resistance to
hydrogen embrittlement and catalytic ability
for hydrogen recombination (Gade, Thoen, &
Way, 2008).
The material balance and membrane
specifications for hydrogen purification in the
membrane subunit is provided in Table 7.
Table 6. Specification of off gas before and after recycling from membrane unit
Stream Name H2 Rich Off gas CO2-H2 Rich Off gas SynGas Recycle-Ratio 3.83 Fuel Gas-
Recycle
Component Mole (%) Mole (%) Mole (%) Mole (%)
Hydrogen 79 33 64 0
CO 3 0 17 12
CO2 6 38 3 31
Methane 12 14 0 54
H2O 0 1 17 0
Oxygen 0 0 0 0
Nitrogen 0 0 0 0
Ethane 0 1 0 0
Propane 0 12 0 2
Mass Flow(lb./hr.) 33330 5554 50755 30961
P (psia) 686 100 100 100
T(F) -30 10.4 1652 28
Membrane system
for H2 separation(Palladium Membrane)
Mixed Off gasWater Gas Shift
Reactor
Pure Hydrogen
Make-up CO2
FuelGas-Recycle
SynGas Recycle-Ratio 3.83
Figure 7. Block Flow Diagram (BFD) of membrane separation process
14 Gas Processing Journal, Vol. 6, No. 1 2018
GPJ
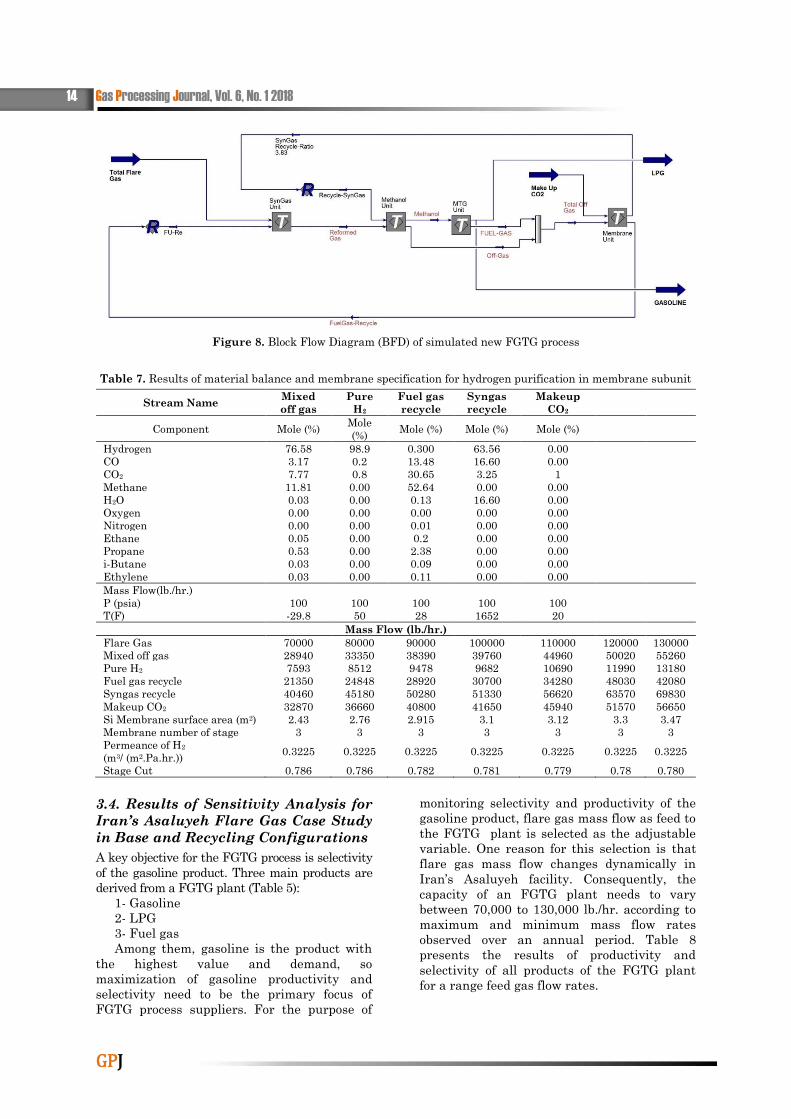
Figure 8. Block Flow Diagram (BFD) of simulated new FGTG process
Table 7. Results of material balance and membrane specification for hydrogen purification in membrane subunit
Stream Name Mixed
off gas
Pure
H2
Fuel gas
recycle
Syngas
recycle
Makeup
CO2
Component Mole (%) Mole
(%) Mole (%) Mole (%) Mole (%)
Hydrogen 76.58 98.9 0.300 63.56 0.00
CO 3.17 0.2 13.48 16.60 0.00
CO2 7.77 0.8 30.65 3.25 1
Methane 11.81 0.00 52.64 0.00 0.00
H2O 0.03 0.00 0.13 16.60 0.00
Oxygen 0.00 0.00 0.00 0.00 0.00
Nitrogen 0.00 0.00 0.01 0.00 0.00
Ethane 0.05 0.00 0.2 0.00 0.00
Propane 0.53 0.00 2.38 0.00 0.00
i-Butane 0.03 0.00 0.09 0.00 0.00
Ethylene 0.03 0.00 0.11 0.00 0.00
Mass Flow(lb./hr.)
P (psia) 100 100 100 100 100
T(F) -29.8 50 28 1652 20
Mass Flow (lb./hr.)
Flare Gas 70000 80000 90000 100000 110000 120000 130000
Mixed off gas 28940 33350 38390 39760 44960 50020 55260
Pure H2 7593 8512 9478 9682 10690 11990 13180
Fuel gas recycle 21350 24848 28920 30700 34280 48030 42080
Syngas recycle 40460 45180 50280 51330 56620 63570 69830
Makeup CO2 32870 36660 40800 41650 45940 51570 56650
Si Membrane surface area (m2) 2.43 2.76 2.915 3.1 3.12 3.3 3.47
Membrane number of stage 3 3 3 3 3 3 3
Permeance of H2
(m3/ (m2.Pa.hr.)) 0.3225 0.3225 0.3225 0.3225 0.3225 0.3225 0.3225
Stage Cut 0.786 0.786 0.782 0.781 0.779 0.78 0.780
3.4. Results of Sensitivity Analysis for
Iran’s Asaluyeh Flare Gas Case Study
in Base and Recycling Configurations
A key objective for the FGTG process is selectivity
of the gasoline product. Three main products are
derived from a FGTG plant (Table 5):
1- Gasoline
2- LPG
3- Fuel gas
Among them, gasoline is the product with
the highest value and demand, so
maximization of gasoline productivity and
selectivity need to be the primary focus of
FGTG process suppliers. For the purpose of
monitoring selectivity and productivity of the
gasoline product, flare gas mass flow as feed to
the FGTG plant is selected as the adjustable
variable. One reason for this selection is that
flare gas mass flow changes dynamically in
Iran’s Asaluyeh facility. Consequently, the
capacity of an FGTG plant needs to vary
between 70,000 to 130,000 lb./hr. according to
maximum and minimum mass flow rates
observed over an annual period. Table 8
presents the results of productivity and
selectivity of all products of the FGTG plant
for a range feed gas flow rates.
Plant-wide Simulation of an Integrated Zero-Emission Process to Convert Flare Gas to Gasoline 15
GPJ
Table 8. Results of productivity and selectivity of all Products
Base FGTG Plant Configuration-Mass Flow (lb./hr.)
Flare Gas 70000 80000 90000 100000 110000 120000 130000
Gasoline 24054 27323 30679 33890 35429 38670 41943
LPG 5540 6264 7142 7667 8024 8478 9108
Fuel Gas 2424 2950 3468 3839 4082 5139 5339
*Total Productivity 29594 33587 37821 41557 43453 47148 51051
Total Utilities [Btu/hr.] 1.36×10⁹ 1.45×10⁹ 1.60×10⁹ 1.79×10⁹ 1.90×10⁹ 2.01×10⁹ 2.15×10⁹
Energy Index in Product base (Btu/lb.) 4.60 4.32 4.23 4.31 4.37 4.26 4.21
Base FGTG Plant Configuration-Product Selectivity (%)
Gasoline 75 75 74 75 75 74 74
LPG 17 17 17 17 17 16 16
Fuel Gas 8 8 8 8 9 10 9
Recycling FGTG Plant Configuration-Mass Flow (lb./hr.)
Flare Gas 70000 80000 90000 100000 110000 120000 130000
Gasoline 37189 42860 47624 49571 54474 59143 64248
LPG 9211 9611 10644 11026 11925 12870 13915
Fuel Gas - - - - - - -
Total Productivity 46400 52471 58268 60597 66399 72013 78163
Total Utilities [Btu/hr.] 1.62×10⁹ 2.09×10⁹ 1.98×10⁹ 2.10×10⁹ 2.54×10⁹ 2.54×10⁹ 1.43×10⁹
Energy Index in Product base (Btu/lb.) 3.49 3.98 3.40 3.46 3.83 3.53 1.83
Recycling FGTG Plant Configuration-Product Selectivity (%)
Gasoline 82 82 82 82 82 82 82
LPG 18 18 18 18 18 18 18
Fuel Gas - - - - - - -
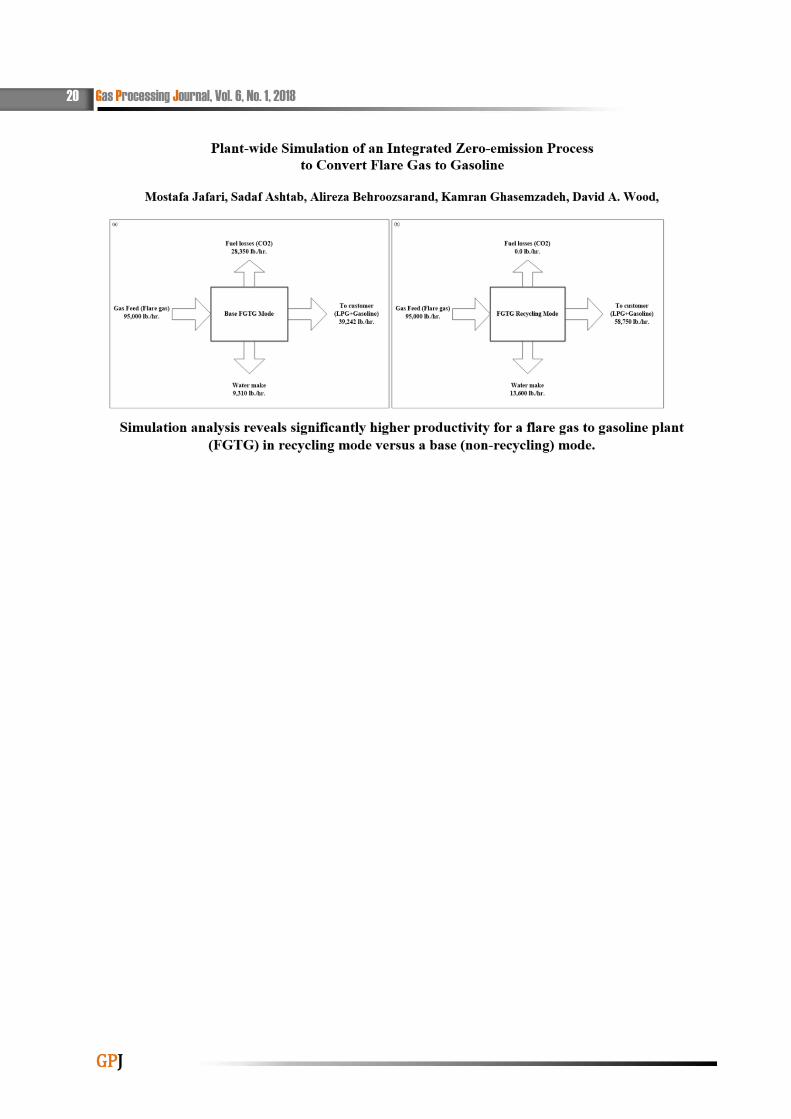
Productivity and selectivity comparison
Flare Gas Mass Flow (lb./hr.) 70000 80000 90000 100000 110000 120000 130000
**Productivity enhancement (%) 57 56 54 46 53 53 53
***Gasoline selectivity enhancement (%) 9 9 11 9 9 11 11
****Energy Index enhancement (%) 24 8 20 20 13 17 57
* Total productivity = Gasoline productivity + LPG productivity
** Productivity enhancement =100× (Productivity in Recycling FGTG Plant Configuration - Productivity in
Base FGTG Plant Configuration) / Productivity in Base FGTG Plant Configuration
*** Gasoline selectivity enhancement =100× (Selectivity in Recycling FGTG Plant Configuration - Selectivity
in Base FGTG Plant Configuration) / Selectivity in Base FGTG Plant Configuration
**** Energy Index enhancement =100× (Energy Index in Recycling FGTG Plant Configuration - Energy
Index in Base FGTG Plant Configuration)/ Energy Index in Base FGTG Plant Configuration
The gasoline selectivity remains
approximately constant (75%) in all capacities
of flare gas fed through the FGTG process in the
base configuration (Table 8). On the other hand,
productivity does not remain constant, but
increases, as the feed gas mass flow rate is
increased. Table 8 compares total productivity
for the base configuration and the novel
recycling configuration for the FGTG plant. It
reveals that total productivity and gasoline
selectivity are significantly increased when the
recycling configuration is used instead of the
base configuration. The results (Table 8) show
average 53% and 10% increases, respectively,
for total productivity and gasoline selectivity, as
the main outcomes of the process optimization
achieved by the recycling configuration.
In the bottom section, calculations have
been made on the economic benefits of
increasing the production of products. The base
price of the products is based on Platts price
referance. As the calculations show, the
16 Gas Processing Journal, Vol. 6, No. 1 2018
GPJ
increase in product production will result in a
53 percent increase in profits due to the reform
of the process arrangement from base FGTG to
recycling FGTG.
Total productivity = Gasoline
productivity + LPG productivity
Base FGTG: 43453 (lb./hr.) = 35429
(lb./hr.) + 8024 (lb./hr.)
Recycling FGTG: 66399 (lb./hr.) = 54474
(lb./hr.) + 11925 (lb./hr.)
LPG Density = 5.185 (lb./ft3)
Gasoline Density = 43.96 (lb./ft3)
Base cost of Gasoline = 93 $/bbl = 0.585
$/L = 585 $/m3 = 831 $/Ton = 0.377 $/lb.
Base cost of LPG = 576$/Ton = 0.262 $/lb.
Economiy calculation:
Base FGTG: Sale Income = 35429 (lb./hr.)
× 0.377 $/lb.+ 8024 (lb./hr.) × 0.262 $/lb. =
15459 $/hr.
Recycling FGTG: Sale Income = 54474
(lb./hr.) × 0.377 $/lb.+ 11925 (lb./hr.) × 0.262
$/lb. = 23661 $/hr.
Sale Income Enhancement (%) = (23661
$/hr. - 15459 $/hr.) / 15459 $/hr. = + 53%
Other crucial parameters for evaluating the
performance of process units, and in particular
the FGTG process, is energy and utilities
consumption. Table 9 lists the total utilities
and energy consumption for a range of feed gas
flow rate cases for the base configuration and
the novel recycling configuration for the FGTG
plant. The results indicate that increasing the
flare gas mass flow as feed streams has, as to
be expected, a direct effect on increasing the
energy consumption of the FGTG unit.
Minimum and maximum utilities consumption
for the base FGTG configuration vary following
a consistent trend withthe minimum and
maximum of flare gas flow rate. This
consistent trend is not seen in the proposed
recycling configuration for the FGTG plant
(Table 9).
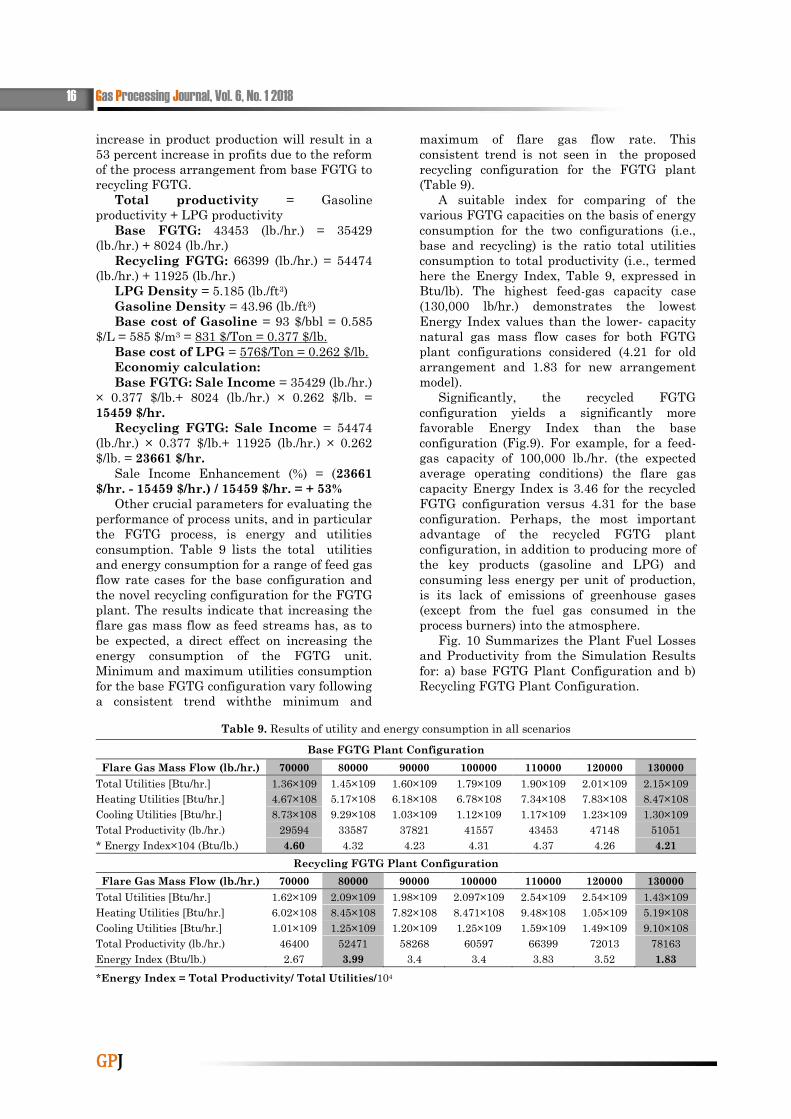
A suitable index for comparing of the
various FGTG capacities on the basis of energy
consumption for the two configurations (i.e.,
base and recycling) is the ratio total utilities
consumption to total productivity (i.e., termed
here the Energy Index, Table 9, expressed in
Btu/lb). The highest feed-gas capacity case
(130,000 lb/hr.) demonstrates the lowest
Energy Index values than the lower- capacity
natural gas mass flow cases for both FGTG
plant configurations considered (4.21 for old
arrangement and 1.83 for new arrangement
model).
Significantly, the recycled FGTG
configuration yields a significantly more
favorable Energy Index than the base
configuration (Fig.9). For example, for a feed-
gas capacity of 100,000 lb./hr. (the expected
average operating conditions) the flare gas
capacity Energy Index is 3.46 for the recycled
FGTG configuration versus 4.31 for the base
configuration. Perhaps, the most important
advantage of the recycled FGTG plant
configuration, in addition to producing more of
the key products (gasoline and LPG) and
consuming less energy per unit of production,
is its lack of emissions of greenhouse gases
(except from the fuel gas consumed in the
process burners) into the atmosphere.
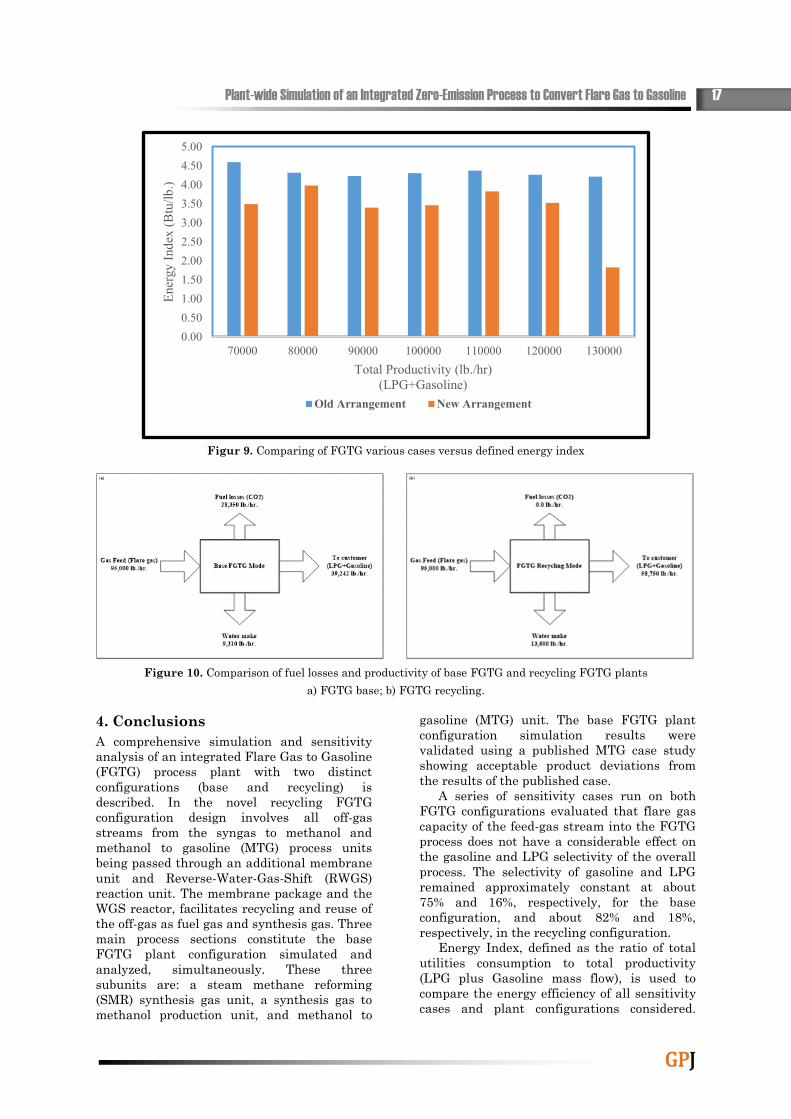
Fig. 10 Summarizes the Plant Fuel Losses
and Productivity from the Simulation Results
for: a) base FGTG Plant Configuration and b)
Recycling FGTG Plant Configuration.
Table 9. Results of utility and energy consumption in all scenarios
Base FGTG Plant Configuration
Flare Gas Mass Flow (lb./hr.) 70000 80000 90000 100000 110000 120000 130000
Total Utilities [Btu/hr.] 1.36×10⁹ 1.45×10⁹ 1.60×10⁹ 1.79×10⁹ 1.90×10⁹ 2.01×10⁹ 2.15×10⁹
Heating Utilities [Btu/hr.] 4.67×10⁸ 5.17×10⁸ 6.18×10⁸ 6.78×10⁸ 7.34×10⁸ 7.83×10⁸ 8.47×10⁸
Cooling Utilities [Btu/hr.] 8.73×10⁸ 9.29×10⁸ 1.03×10⁹ 1.12×10⁹ 1.17×10⁹ 1.23×10⁹ 1.30×10⁹
Total Productivity (lb./hr.) 29594 33587 37821 41557 43453 47148 51051
* Energy Index×104 (Btu/lb.) 4.60 4.32 4.23 4.31 4.37 4.26 4.21
Recycling FGTG Plant Configuration
Flare Gas Mass Flow (lb./hr.) 70000 80000 90000 100000 110000 120000 130000
Total Utilities [Btu/hr.] 1.62×10⁹ 2.09×10⁹ 1.98×10⁹ 2.097×10⁹ 2.54×10⁹ 2.54×10⁹ 1.43×10⁹
Heating Utilities [Btu/hr.] 6.02×10⁸ 8.45×10⁸ 7.82×10⁸ 8.471×10⁸ 9.48×10⁸ 1.05×10⁹ 5.19×10⁸
Cooling Utilities [Btu/hr.] 1.01×10⁹ 1.25×10⁹ 1.20×10⁹ 1.25×10⁹ 1.59×10⁹ 1.49×10⁹ 9.10×10⁸
Total Productivity (lb./hr.) 46400 52471 58268 60597 66399 72013 78163
Energy Index (Btu/lb.) 2.67 3.99 3.4 3.4 3.83 3.52 1.83
*Energy Index = Total Productivity/ Total Utilities/104
Plant-wide Simulation of an Integrated Zero-Emission Process to Convert Flare Gas to Gasoline 17
GPJ
Figur 9. Comparing of FGTG various cases versus defined energy index
Figure 10. Comparison of fuel losses and productivity of base FGTG and recycling FGTG plants
a) FGTG base; b) FGTG recycling.
4. Conclusions
A comprehensive simulation and sensitivity
analysis of an integrated Flare Gas to Gasoline
(FGTG) process plant with two distinct
configurations (base and recycling) is
described. In the novel recycling FGTG
configuration design involves all off-gas
streams from the syngas to methanol and
methanol to gasoline (MTG) process units
being passed through an additional membrane
unit and Reverse-Water-Gas-Shift (RWGS)
reaction unit. The membrane package and the
WGS reactor, facilitates recycling and reuse of
the off-gas as fuel gas and synthesis gas. Three
main process sections constitute the base
FGTG plant configuration simulated and
analyzed, simultaneously. These three
subunits are: a steam methane reforming
(SMR) synthesis gas unit, a synthesis gas to
methanol production unit, and methanol to
gasoline (MTG) unit. The base FGTG plant
configuration simulation results were
validated using a published MTG case study
showing acceptable product deviations from
the results of the published case.
A series of sensitivity cases run on both
FGTG configurations evaluated that flare gas
capacity of the feed-gas stream into the FGTG
process does not have a considerable effect on
the gasoline and LPG selectivity of the overall
process. The selectivity of gasoline and LPG
remained approximately constant at about
75% and 16%, respectively, for the base
configuration, and about 82% and 18%,
respectively, in the recycling configuration.
Energy Index, defined as the ratio of total
utilities consumption to total productivity
(LPG plus Gasoline mass flow), is used to
compare the energy efficiency of all sensitivity
cases and plant configurations considered.
0.00
0.50
1.00
1.50
2.00
2.50
3.00
3.50
4.00
4.50
5.00
70000 80000 90000 100000 110000 120000 130000
Ener
gy I
nd
ex (
Btu
/lb
.)
Total Productivity (lb./hr)
(LPG+Gasoline)
Old Arrangement New Arrangement
18 Gas Processing Journal, Vol. 6, No. 1, 2018
GPJ
Increasing the flare gas flow rate (from 70,000
to 130,000 lb./hr.) has the beneficial effect of
reducing the Energy Index (from 4.26 to 4.21
Btu/lb.) for the base FGTG plant configuration.
Although the Energy Index reduction trend is
not uniform with increased feed-gas capacities
for the recycling FGTG plant configuration
model, it is lower than for the base
configuration. The observed Energy Index
results demonstrate that the FGTG plants
with higher capacities are more energy
efficient and should therefore be more
profitable.
Briefly, with considering all the points the
results clearly show that the recycling
FT+GTG plant configuration is significantly
better in terms of gasoline and LPG
productivity (yielding an enhancement of
about 53%), product selectivity (yielding an
enhancement about 10%), and significant
reduction in greenhouse gas emissions,
compared to the base FGTG plant
configuration evaluated.
References
Bao, B., El-Halwagi, M. M., & Elbashir, N. O.
(2010). Simulation, integration, and
economic analysis of gas-to-liquid
processes. Fuel Processing Technology,
91(7), 703-713. doi:http://dx.doi.org/
10.1016/ j.fuproc. 2010.02.001
Behroozsarand, A., & Zamaniyan, A. (2017a).
Simulation and optimization of an
integrated GTL process. Journal of
Cleaner Production, 142, Part 4, 2315-
2327. doi:http://dx.doi.org/10.1016/j.
jclepro. 2016.11.045
Behroozsarand, A., & Zamaniyan, A. (2017b).
Simulation and optimization of an
integrated GTL process. Journal of
Cleaner Production, 142, 2315-2327.
doi:https://doi.org/10.1016/j.jclepro.2016.
11.045
Emam, E. A. (2015). GAS FLARING IN
INDUSTRY: AN OVERVIEW. Petroleum
& Coal, 57(5), 532-555.
Er-rbib, H., Bouallou, C., & Werkoff, F. (2012).
Production of Synthetic Gasoline and
Diesel Fuel from Dry Reforming of
Methane. Energy Procedia, 29, 156-165.
doi:http://dx.doi.org/10.1016/j.egypro.
2012. 09.020
Fawole, O. G., Cai, X. M., & MacKenzie, A. R.
(2016). Gas flaring and resultant air
pollution: A review focusing on black
carbon. Environmental Pollution, 216,
182-197. doi:http://dx.doi.org/10.1016/
j.envpol.2016.05.075
Fu, T., Chang, J., Shao, J., & Li, Z. (2017).
Fabrication of a nano-sized ZSM-5
zeolite with intercrystalline mesopores
for conversion of methanol to gasoline.
Journal of Energy Chemistry, 26(1), 139-
146. doi:https://doi.org/10.1016/j.jechem.
2016.09.011
Gade, S. K., Thoen, P. M., & Way, J. D. (2008).
Unsupported palladium alloy foil
membranes fabricated by electroless
plating. Journal of Membrane Science,
316(1), 112-118. doi:https://doi.org/10.
1016/j.memsci.2007.08.022
Galadima, A., & Muraza, O. (2015). From
synthesis gas production to methanol
synthesis and potential upgrade to
gasoline range hydrocarbons: A review.
Journal of Natural Gas Science and
Engineering, 25, 303-316.
doi:https://doi.org/10.1016/j.jngse. 2015.
05.012
Ghorbani, B., Hamedi, M.-H., & Amidpour, M.
(2016). Exergoeconomic Evaluation of an
Integrated Nitrogen Rejection Unit with
LNG and NGL Co-Production Processes
Based on the MFC and Absorbtion
Refrigeration Systems. Gas Processing,
4(1), 1-28. doi:10.22108/gpj.2016.20410
Giwa, S. O., Nwaokocha, C. N., Kuye, S. I., &
Adama, K. O. (2013). Gas flaring
attendant impacts of criteria and
particulate pollutants: A case of Niger
Delta region of Nigeria. Journal of King
Saud University - Engineering Sciences.
doi:https://doi.org/10.1016/j.jksues.2017.
04.003
Hajizadeh, A., Mohamadi-Baghmolaei, M., Azin,
R., Osfouri, S., & Heydari, I. (2018).
Technical and economic evaluation of
flare gas recovery in a giant gas refinery.
Chemical Engineering Research and
Design, 131, 506-519. doi:https://doi.org/
10.1016/ j.cherd.2017.11.026
Hamedi, M.-H., Shirmohammadi, R., Ghorbani,
B., & Sheikhi, S. (2015). Advanced
Exergy Evaluation of an Integrated
Separation Process with Optimized
Refrigeration System. Gas Processing,
3(1), 1-10. doi:10.22108/gpj.2015.20181
Heidari, M., Ataei, A., & Rahdar, M. H. (2016).
Development and analysis of two novel
methods for power generation from flare
gas. Applied Thermal Engineering, 104,
687-696. doi:https://doi.org/10.1016/j.
applthermaleng.2016.05.099
Plant-wide Simulation of an Integrated Zero-Emission Process to Convert Flare Gas to Gasoline 19
GPJ
Iandoli, C. L., & Kjelstrup, S. (2007). Exergy
analysis of a GTL process based on low-
temperature slurry F− T reactor
technology with a cobalt catalyst. Energy
& fuels, 21(4), 2317-2324.
Jones, S., & Zhu, Y. (2009). Techno-economic
analysis for the conversion of
lignocellulosic biomass to gasoline via
the methanol-to-gasoline (MTG) process.
Retrieved from
Kim, I. H., Kim, S., Cho, W., & Yoon, E. S. (2010).
Simulation of commercial dimethyl ether
production plant. In S. Pierucci & G. B.
Ferraris (Eds.), Computer Aided
Chemical Engineering (Vol. 28, pp. 799-
804): Elsevier.
Maiden, C. J. (1988). The New Zealand Gas-to-
Gasoline Project. Studies in Surface
Science and Catalysis, 36, 1-16.
Munson, C. L., O'Rear, D. J., & Chinn, D. (2004).
Contacting unreacted syngas with water
to remove carbon dioxide, reducing
amount of carbon dioxide released into
environment. In: Google Patents.
Nakamura, M., Wood, B. J., Hou, P. Y., & Wise,
H. (1981). Fischer-Tropsch Synthesis
with Iron-Cobalt Alloy Catalysts. Studies
in Surface Science and Catalysis, 7, 432-
446. doi:http://dx.doi.org/10.1016/S0167-
2991(09)60289-5
Ojijiagwo, E., Oduoza, C. F., & Emekwuru, N.
(2016). Economics of gas to wire
technology applied in gas flare
management. Engineering Science and
Technology, an International Journal,
19(4), 2109-2118. doi:https://doi.org/
10.1016/j.jestch.2016.09.012
Rahimpour, M. R., Samimi, F., Babapoor, A.,
Tohidian, T., & Mohebi, S. (2017).
Palladium membranes applications in
reaction systems for hydrogen separation
and purification: A review. Chemical
Engineering and Processing: Process
Intensification, 121(Supplement C), 24-
49. doi:https://doi.org/10.1016/j.cep. 2017.
07.021
Schanke, D., Lian, P., Eri, S., Rytter, E., Sannæs,
B. H., & Kinnari, K. J. (2001).
Optimisation of Fischer-Tropsch Reactor
Design and Operation in GTL Plants.
Studies in Surface Science and Catalysis,
136, 239-244. doi:http://dx.doi.org/10.
1016/S0167-2991(01)80310-4
Shariati Niasar, M., Amidpour, M., Ghorbani, B.,
Rahimi, M.-J., Mehrpooya, M., &
Hamedi, M.-H. (2017). Superstructure of
Cogeneration of Power, Heating, Cooling
and Liquid Fuels Using Gasification of
Feedstock with Primary Material of Coal
for Employing in LNG Process. Gas
Processing, 5(1), 1-23. doi:10.22108/gpj.
2017. 100034.1000
Soltanieh, M., Zohrabian, A., Gholipour, M. J., &
Kalnay, E. (2016). A review of global gas
flaring and venting and impact on the
environment: Case study of Iran.
International Journal of Greenhouse Gas
Control, 49, 488-509. doi:https://doi.org/
10.1016/ j.ijggc.2016.02.010
Tabak, S., Chitnis, G., McGihon, R., & Zhao, X.
(2009). Production of clean gasoline from
coal:Exxon Mobil Methanol to gasoline
(MTG) technology.
Van-Dal, É. S., & Bouallou, C. (2013). Design and
simulation of a methanol production
plant from CO2 hydrogenation. Journal
of Cleaner Production, 57, 38-45.
doi:https://doi.org/10.1016/j.jclepro.2013.
06.008
Van Vliet, O. P., Faaij, A. P., & Turkenburg, W.
C. (2009). Fischer–Tropsch diesel
production in a well-to-wheel
perspective: a carbon, energy flow and
cost analysis. Energy Conversion and
Management, 50(4), 855-876.
Wood, D. A., Nwaoha, C., & Towler, B. F. (2012).
Gas-to-liquids (GTL): A review of an
industry offering several routes for
monetizing natural gas. Journal of
Natural Gas Science and Engineering, 9,
196-208. doi:https://doi.org/10.1016
j.jngse.2012.07.001
20 Gas Processing Journal, Vol. 6, No. 1, 2018
GPJ